Centerville, CA
Centerville Map
Centerville Overview
2,204
TOTAL POPULATION
1,067
MALE POPULATION
1,137
FEMALE POPULATION
93.84
MALES / 100 FEMALES
106.56
FEMALES / 100 MALES
48.9
MEDIAN AGE
3.2
AVG FAMILY SIZE
2.8
AVG HOUSEHOLD SIZE
$55,197
PER CAPITA INCOME
$137,109
AVG FAMILY INCOME
$109,432
AVG HOUSEHOLD INCOME
24.6%
WAGE / INCOME GAP [ % ]
75.4¢/ $1
WAGE / INCOME GAP [ $ ]
0.48
INEQUALITY / GINI INDEX
872
LABOR FORCE [ PEOPLE ]
50.6%
PERCENT IN LABOR FORCE
3.0%
UNEMPLOYMENT RATE
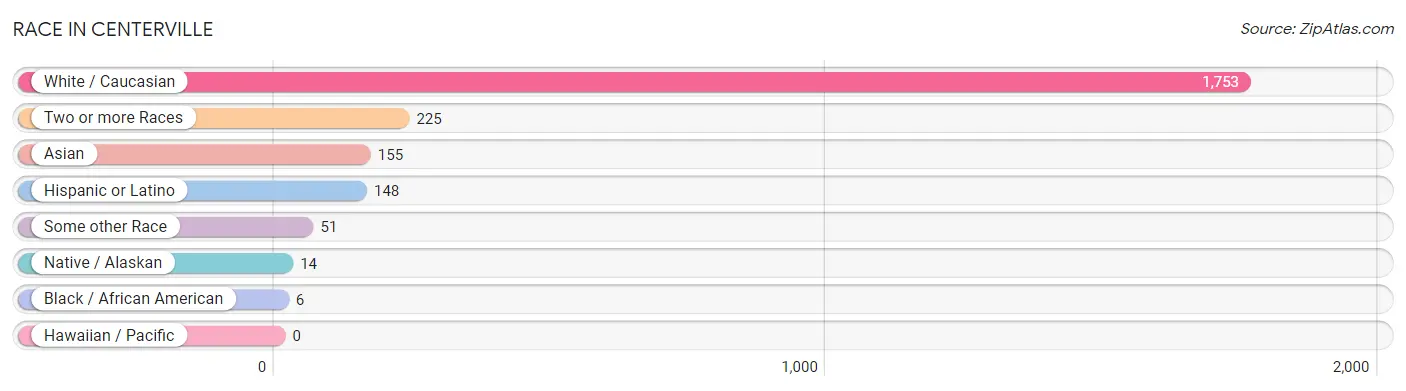
Race in Centerville
The most populous races in Centerville are White / Caucasian (1,753 | 79.5%), Two or more Races (225 | 10.2%), and Asian (155 | 7.0%).
| Race | # Population | % Population |
| Asian | 155 | 7.0% |
| Black / African American | 6 | 0.3% |
| Hawaiian / Pacific | 0 | 0.0% |
| Hispanic or Latino | 148 | 6.7% |
| Native / Alaskan | 14 | 0.6% |
| White / Caucasian | 1,753 | 79.5% |
| Two or more Races | 225 | 10.2% |
| Some other Race | 51 | 2.3% |
| Total | 2,204 | 100.0% |
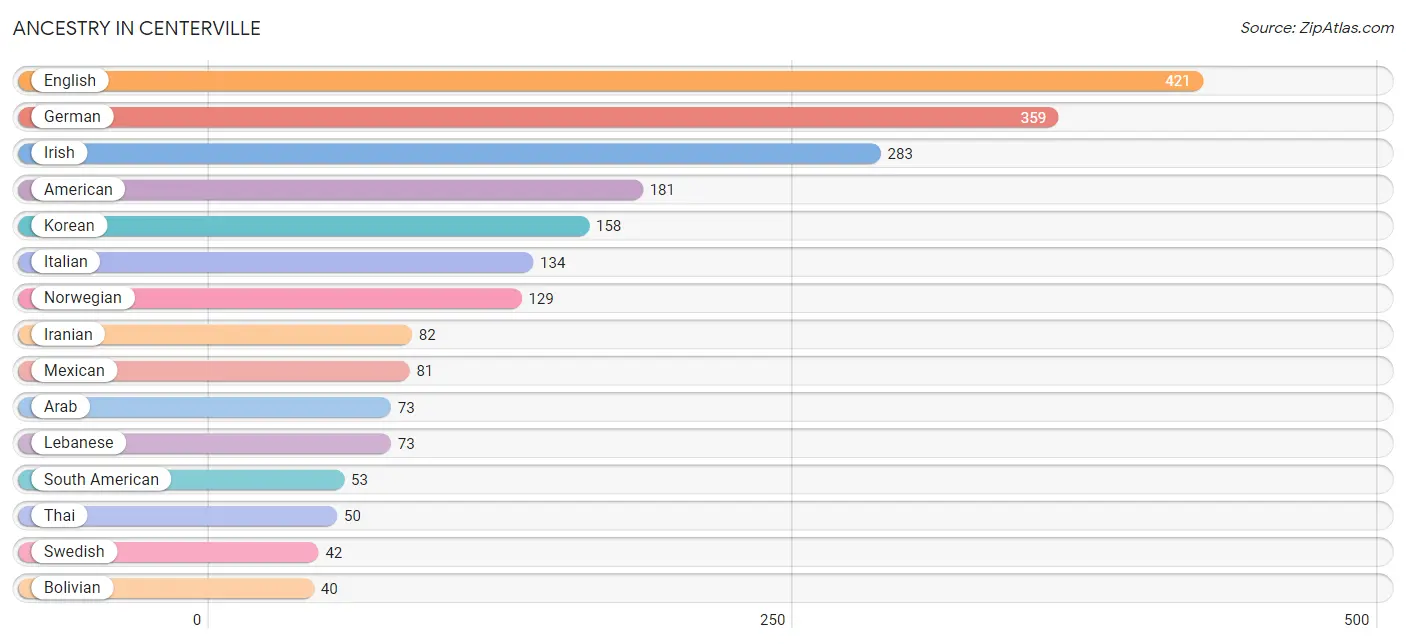
Ancestry in Centerville
The most populous ancestries reported in Centerville are English (421 | 19.1%), German (359 | 16.3%), Irish (283 | 12.8%), American (181 | 8.2%), and Korean (158 | 7.2%), together accounting for 63.6% of all Centerville residents.
| Ancestry | # Population | % Population |
| American | 181 | 8.2% |
| Arab | 73 | 3.3% |
| Austrian | 30 | 1.4% |
| Bhutanese | 8 | 0.4% |
| Bolivian | 40 | 1.8% |
| British | 14 | 0.6% |
| Canadian | 12 | 0.5% |
| Cherokee | 3 | 0.1% |
| Chippewa | 3 | 0.1% |
| Croatian | 4 | 0.2% |
| Czech | 19 | 0.9% |
| Danish | 31 | 1.4% |
| Dutch | 26 | 1.2% |
| English | 421 | 19.1% |
| European | 17 | 0.8% |
| Finnish | 6 | 0.3% |
| French | 15 | 0.7% |
| French Canadian | 4 | 0.2% |
| German | 359 | 16.3% |
| Greek | 9 | 0.4% |
| Hungarian | 16 | 0.7% |
| Indian (Asian) | 25 | 1.1% |
| Iranian | 82 | 3.7% |
| Irish | 283 | 12.8% |
| Italian | 134 | 6.1% |
| Korean | 158 | 7.2% |
| Lebanese | 73 | 3.3% |
| Mexican | 81 | 3.7% |
| Northern European | 6 | 0.3% |
| Norwegian | 129 | 5.9% |
| Peruvian | 13 | 0.6% |
| Polish | 16 | 0.7% |
| Puerto Rican | 14 | 0.6% |
| Russian | 35 | 1.6% |
| Scandinavian | 5 | 0.2% |
| Scotch-Irish | 22 | 1.0% |
| Scottish | 18 | 0.8% |
| Senegalese | 32 | 1.5% |
| South American | 53 | 2.4% |
| South American Indian | 3 | 0.1% |
| Subsaharan African | 32 | 1.5% |
| Swedish | 42 | 1.9% |
| Thai | 50 | 2.3% |
| Welsh | 5 | 0.2% | View All 44 Rows |
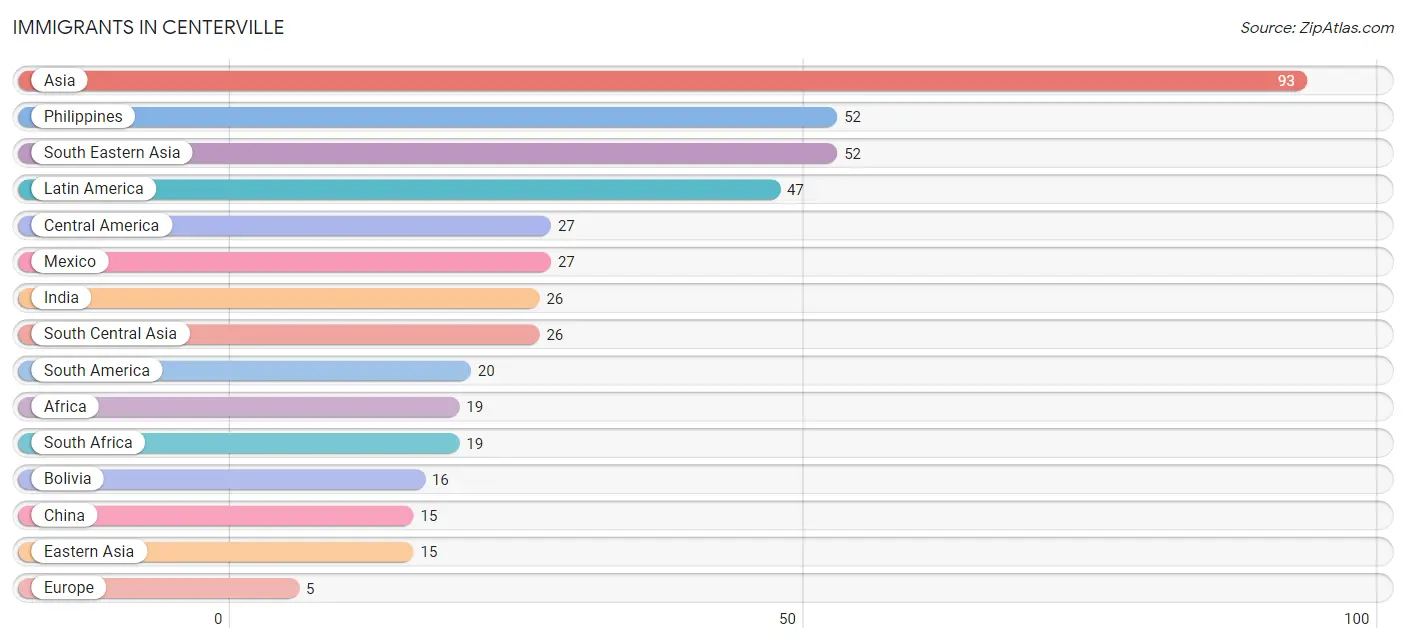
Immigrants in Centerville
The most numerous immigrant groups reported in Centerville came from Asia (93 | 4.2%), Philippines (52 | 2.4%), South Eastern Asia (52 | 2.4%), Latin America (47 | 2.1%), and Central America (27 | 1.2%), together accounting for 12.3% of all Centerville residents.
| Immigration Origin | # Population | % Population |
| Africa | 19 | 0.9% |
| Asia | 93 | 4.2% |
| Bolivia | 16 | 0.7% |
| Central America | 27 | 1.2% |
| China | 15 | 0.7% |
| Eastern Asia | 15 | 0.7% |
| Europe | 5 | 0.2% |
| Greece | 5 | 0.2% |
| India | 26 | 1.2% |
| Latin America | 47 | 2.1% |
| Mexico | 27 | 1.2% |
| Peru | 4 | 0.2% |
| Philippines | 52 | 2.4% |
| South Africa | 19 | 0.9% |
| South America | 20 | 0.9% |
| South Central Asia | 26 | 1.2% |
| South Eastern Asia | 52 | 2.4% |
| Southern Europe | 5 | 0.2% | View All 18 Rows |
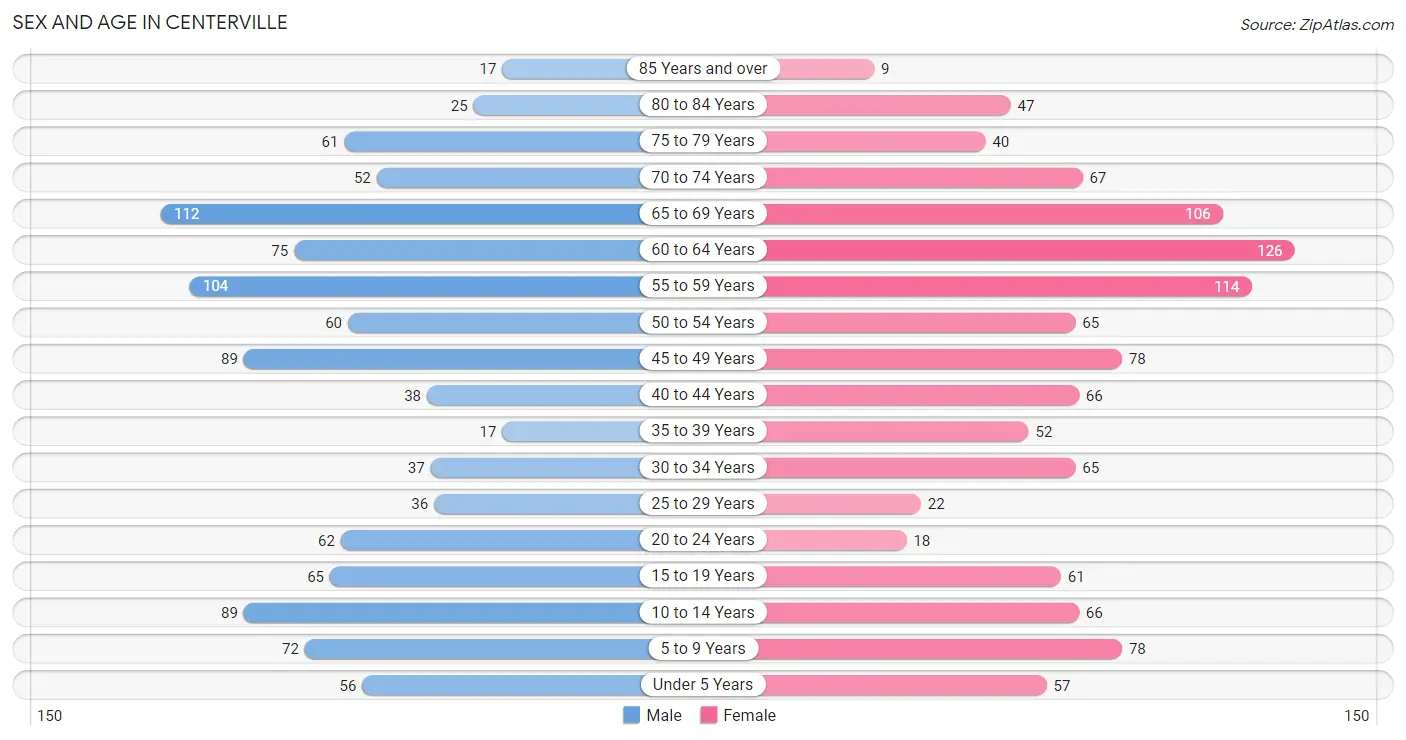
Sex and Age in Centerville
Sex and Age in Centerville
The most populous age groups in Centerville are 65 to 69 Years (112 | 10.5%) for men and 60 to 64 Years (126 | 11.1%) for women.
| Age Bracket | Male | Female |
| Under 5 Years | 56 (5.2%) | 57 (5.0%) |
| 5 to 9 Years | 72 (6.8%) | 78 (6.9%) |
| 10 to 14 Years | 89 (8.3%) | 66 (5.8%) |
| 15 to 19 Years | 65 (6.1%) | 61 (5.4%) |
| 20 to 24 Years | 62 (5.8%) | 18 (1.6%) |
| 25 to 29 Years | 36 (3.4%) | 22 (1.9%) |
| 30 to 34 Years | 37 (3.5%) | 65 (5.7%) |
| 35 to 39 Years | 17 (1.6%) | 52 (4.6%) |
| 40 to 44 Years | 38 (3.6%) | 66 (5.8%) |
| 45 to 49 Years | 89 (8.3%) | 78 (6.9%) |
| 50 to 54 Years | 60 (5.6%) | 65 (5.7%) |
| 55 to 59 Years | 104 (9.8%) | 114 (10.0%) |
| 60 to 64 Years | 75 (7.0%) | 126 (11.1%) |
| 65 to 69 Years | 112 (10.5%) | 106 (9.3%) |
| 70 to 74 Years | 52 (4.9%) | 67 (5.9%) |
| 75 to 79 Years | 61 (5.7%) | 40 (3.5%) |
| 80 to 84 Years | 25 (2.3%) | 47 (4.1%) |
| 85 Years and over | 17 (1.6%) | 9 (0.8%) |
| Total | 1,067 (100.0%) | 1,137 (100.0%) |
Families and Households in Centerville
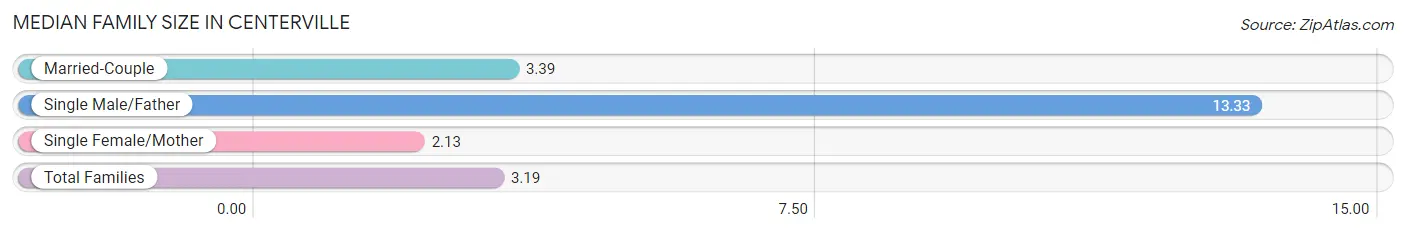
Median Family Size in Centerville
The median family size in Centerville is 3.19 persons per family, with single male/father families (3 | 0.5%) accounting for the largest median family size of 13.33 persons per family. On the other hand, single female/mother families (115 | 19.5%) represent the smallest median family size with 2.13 persons per family.
| Family Type | # Families | Family Size |
| Married-Couple | 471 (80.0%) | 3.39 |
| Single Male/Father | 3 (0.5%) | 13.33 |
| Single Female/Mother | 115 (19.5%) | 2.13 |
| Total Families | 589 (100.0%) | 3.19 |
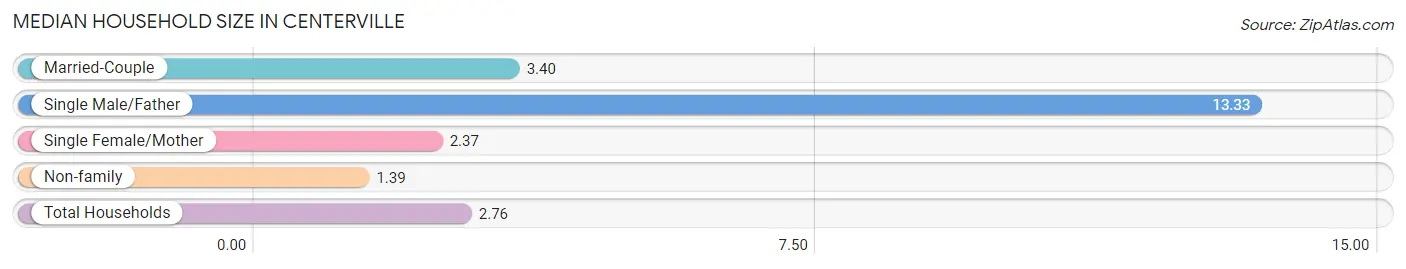
Median Household Size in Centerville
The median household size in Centerville is 2.76 persons per household, with single male/father households (3 | 0.4%) accounting for the largest median household size of 13.33 persons per household. non-family households (210 | 26.3%) represent the smallest median household size with 1.39 persons per household.
| Household Type | # Households | Household Size |
| Married-Couple | 471 (59.0%) | 3.40 |
| Single Male/Father | 3 (0.4%) | 13.33 |
| Single Female/Mother | 115 (14.4%) | 2.37 |
| Non-family | 210 (26.3%) | 1.39 |
| Total Households | 799 (100.0%) | 2.76 |
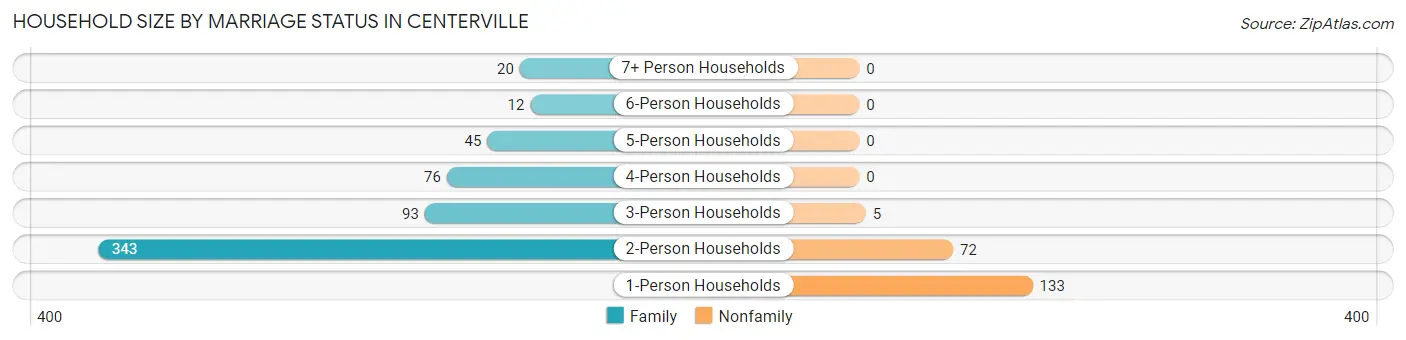
Household Size by Marriage Status in Centerville
Out of a total of 799 households in Centerville, 589 (73.7%) are family households, while 210 (26.3%) are nonfamily households. The most numerous type of family households are 2-person households, comprising 343, and the most common type of nonfamily households are 1-person households, comprising 133.
| Household Size | Family Households | Nonfamily Households |
| 1-Person Households | - | 133 (16.7%) |
| 2-Person Households | 343 (42.9%) | 72 (9.0%) |
| 3-Person Households | 93 (11.6%) | 5 (0.6%) |
| 4-Person Households | 76 (9.5%) | 0 (0.0%) |
| 5-Person Households | 45 (5.6%) | 0 (0.0%) |
| 6-Person Households | 12 (1.5%) | 0 (0.0%) |
| 7+ Person Households | 20 (2.5%) | 0 (0.0%) |
| Total | 589 (73.7%) | 210 (26.3%) |
Female Fertility in Centerville
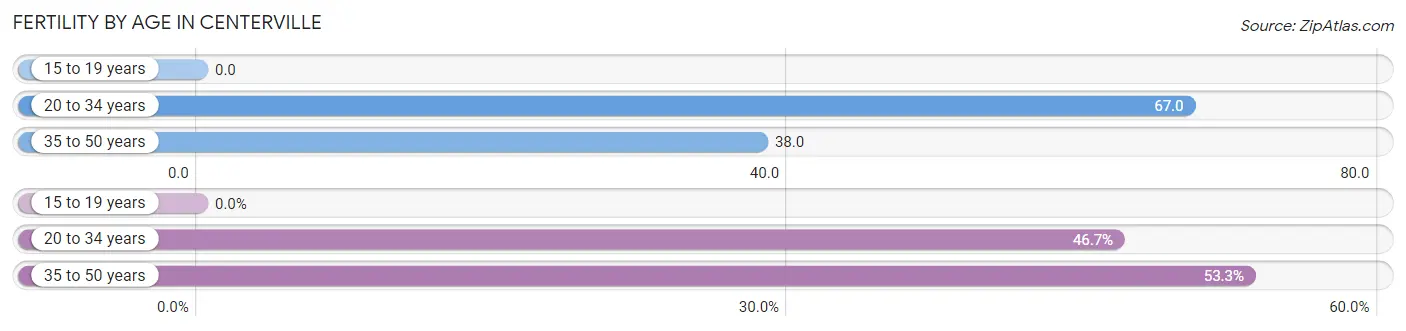
Fertility by Age in Centerville
Average fertility rate in Centerville is 40.0 births per 1,000 women. Women in the age bracket of 20 to 34 years have the highest fertility rate with 67.0 births per 1,000 women. Women in the age bracket of 35 to 50 years acount for 53.3% of all women with births.
| Age Bracket | Women with Births | Births / 1,000 Women |
| 15 to 19 years | 0 (0.0%) | 0.0 |
| 20 to 34 years | 7 (46.7%) | 67.0 |
| 35 to 50 years | 8 (53.3%) | 38.0 |
| Total | 15 (100.0%) | 40.0 |
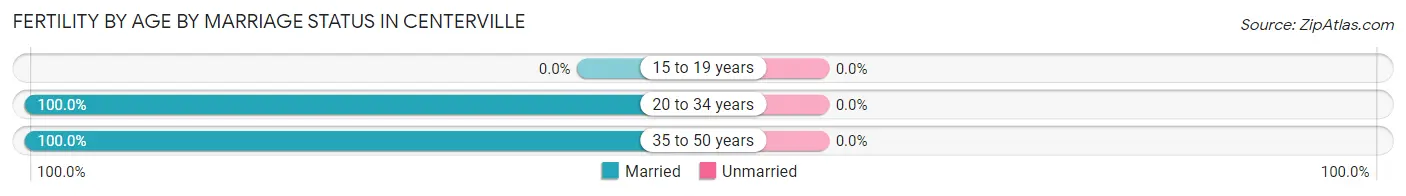
Fertility by Age by Marriage Status in Centerville
| Age Bracket | Married | Unmarried |
| 15 to 19 years | 0 (0.0%) | 0 (0.0%) |
| 20 to 34 years | 7 (100.0%) | 0 (0.0%) |
| 35 to 50 years | 8 (100.0%) | 0 (0.0%) |
| Total | 15 (100.0%) | 0 (0.0%) |
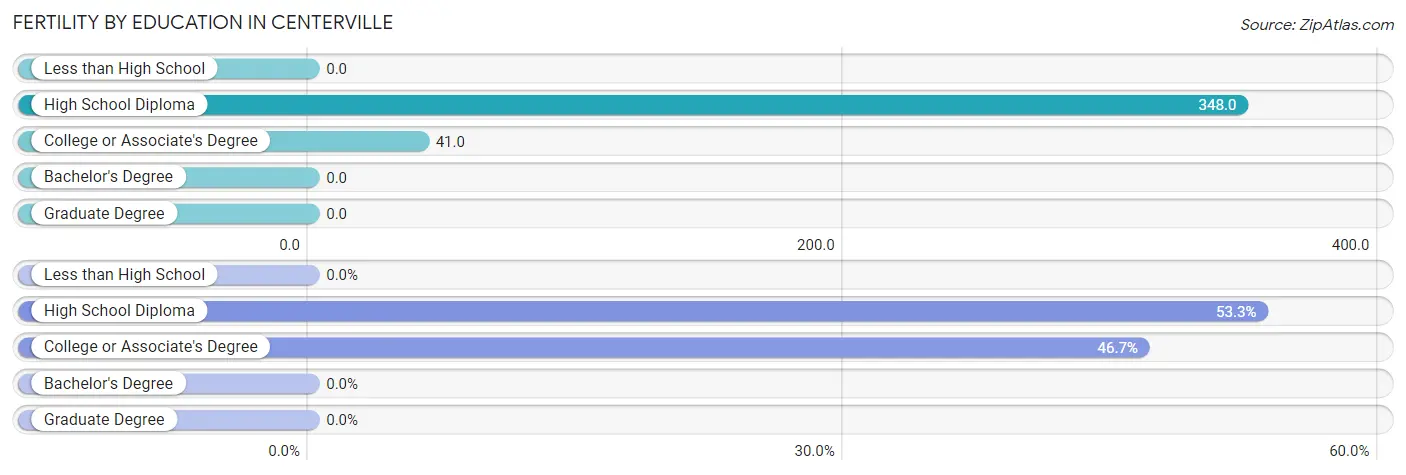
Fertility by Education in Centerville
| Educational Attainment | Women with Births | Births / 1,000 Women |
| Less than High School | 0 (0.0%) | 0.0 |
| High School Diploma | 8 (53.3%) | 348.0 |
| College or Associate's Degree | 7 (46.7%) | 41.0 |
| Bachelor's Degree | 0 (0.0%) | 0.0 |
| Graduate Degree | 0 (0.0%) | 0.0 |
| Total | 15 (100.0%) | 40.0 |
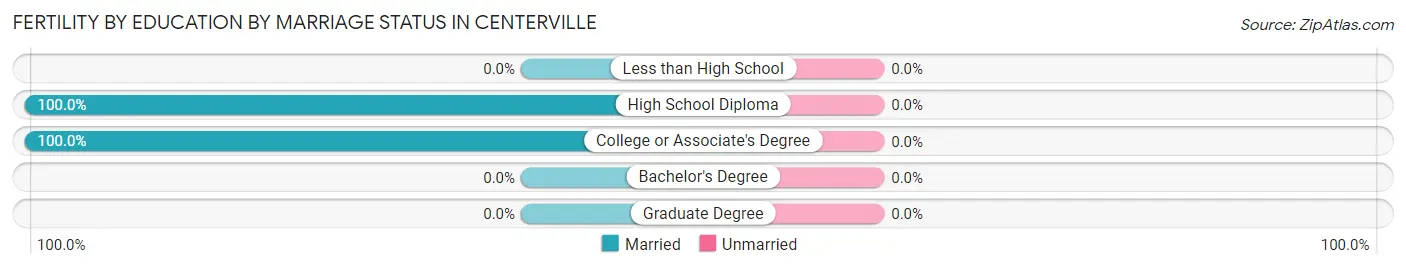
Fertility by Education by Marriage Status in Centerville
| Educational Attainment | Married | Unmarried |
| Less than High School | 0 (0.0%) | 0 (0.0%) |
| High School Diploma | 8 (100.0%) | 0 (0.0%) |
| College or Associate's Degree | 7 (100.0%) | 0 (0.0%) |
| Bachelor's Degree | 0 (0.0%) | 0 (0.0%) |
| Graduate Degree | 0 (0.0%) | 0 (0.0%) |
| Total | 15 (100.0%) | 0 (0.0%) |
Income in Centerville
Income Overview in Centerville
Per Capita Income in Centerville is $55,197, while median incomes of families and households are $137,109 and $109,432 respectively.
| Characteristic | Number | Measure |
| Per Capita Income | 2,204 | $55,197 |
| Median Family Income | 589 | $137,109 |
| Mean Family Income | 589 | $175,326 |
| Median Household Income | 799 | $109,432 |
| Mean Household Income | 799 | $150,898 |
| Income Deficit | 589 | $0 |
| Wage / Income Gap (%) | 2,204 | 24.56% |
| Wage / Income Gap ($) | 2,204 | 75.44¢ per $1 |
| Gini / Inequality Index | 2,204 | 0.48 |
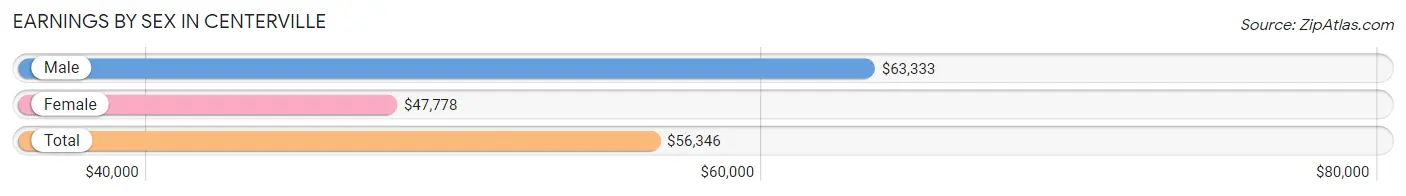
Earnings by Sex in Centerville
Average Earnings in Centerville are $56,346, $63,333 for men and $47,778 for women, a difference of 24.6%.
| Sex | Number | Average Earnings |
| Male | 512 (54.3%) | $63,333 |
| Female | 430 (45.7%) | $47,778 |
| Total | 942 (100.0%) | $56,346 |
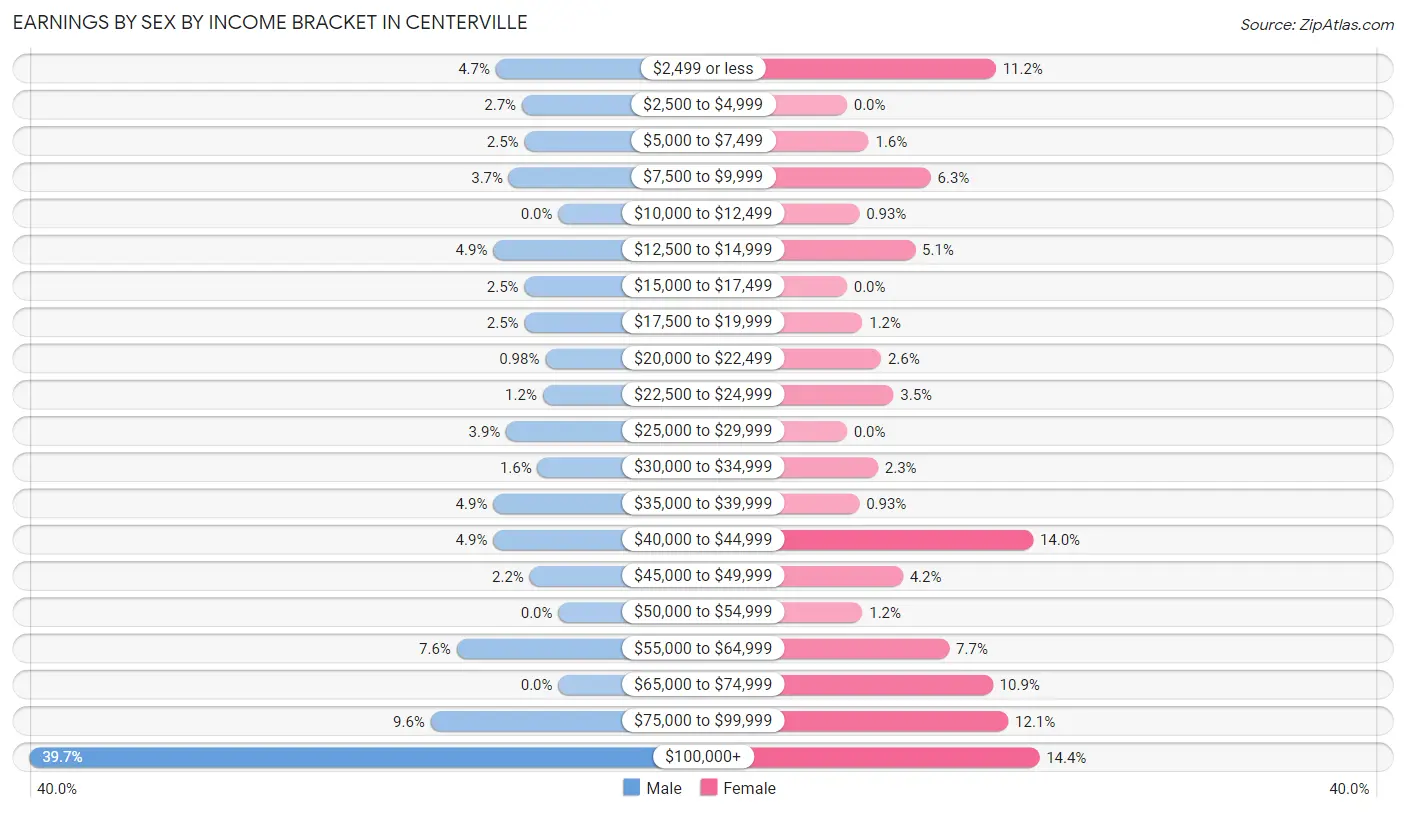
Earnings by Sex by Income Bracket in Centerville
The most common earnings brackets in Centerville are $100,000+ for men (203 | 39.7%) and $100,000+ for women (62 | 14.4%).
| Income | Male | Female |
| $2,499 or less | 24 (4.7%) | 48 (11.2%) |
| $2,500 to $4,999 | 14 (2.7%) | 0 (0.0%) |
| $5,000 to $7,499 | 13 (2.5%) | 7 (1.6%) |
| $7,500 to $9,999 | 19 (3.7%) | 27 (6.3%) |
| $10,000 to $12,499 | 0 (0.0%) | 4 (0.9%) |
| $12,500 to $14,999 | 25 (4.9%) | 22 (5.1%) |
| $15,000 to $17,499 | 13 (2.5%) | 0 (0.0%) |
| $17,500 to $19,999 | 13 (2.5%) | 5 (1.2%) |
| $20,000 to $22,499 | 5 (1.0%) | 11 (2.6%) |
| $22,500 to $24,999 | 6 (1.2%) | 15 (3.5%) |
| $25,000 to $29,999 | 20 (3.9%) | 0 (0.0%) |
| $30,000 to $34,999 | 8 (1.6%) | 10 (2.3%) |
| $35,000 to $39,999 | 25 (4.9%) | 4 (0.9%) |
| $40,000 to $44,999 | 25 (4.9%) | 60 (14.0%) |
| $45,000 to $49,999 | 11 (2.1%) | 18 (4.2%) |
| $50,000 to $54,999 | 0 (0.0%) | 5 (1.2%) |
| $55,000 to $64,999 | 39 (7.6%) | 33 (7.7%) |
| $65,000 to $74,999 | 0 (0.0%) | 47 (10.9%) |
| $75,000 to $99,999 | 49 (9.6%) | 52 (12.1%) |
| $100,000+ | 203 (39.7%) | 62 (14.4%) |
| Total | 512 (100.0%) | 430 (100.0%) |
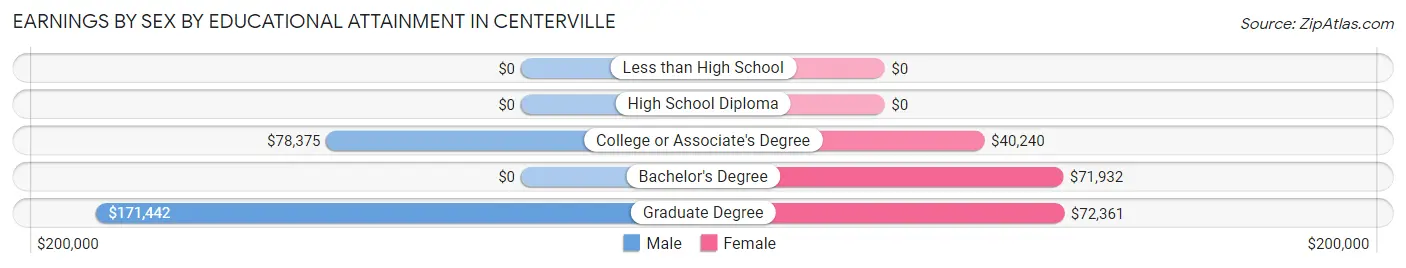
Earnings by Sex by Educational Attainment in Centerville
Average earnings in Centerville are $87,202 for men and $49,028 for women, a difference of 43.8%. Men with an educational attainment of graduate degree enjoy the highest average annual earnings of $171,442, while those with college or associate's degree education earn the least with $78,375. Women with an educational attainment of graduate degree earn the most with the average annual earnings of $72,361, while those with college or associate's degree education have the smallest earnings of $40,240.
| Educational Attainment | Male Income | Female Income |
| Less than High School | - | - |
| High School Diploma | - | - |
| College or Associate's Degree | $78,375 | $40,240 |
| Bachelor's Degree | - | - |
| Graduate Degree | $171,442 | $72,361 |
| Total | $87,202 | $49,028 |
Family Income in Centerville
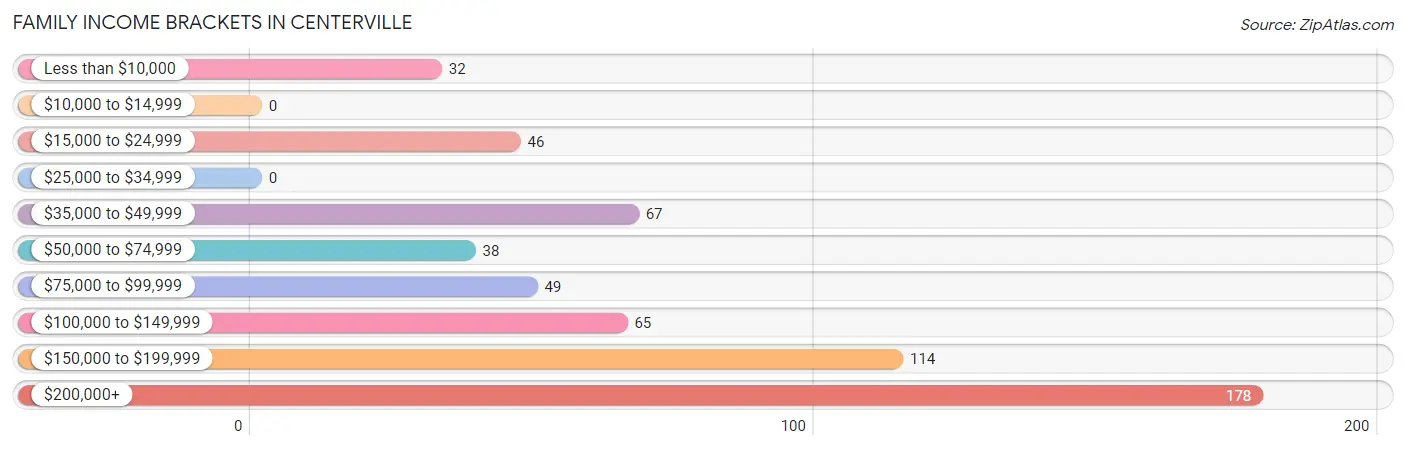
Family Income Brackets in Centerville
According to the Centerville family income data, there are 178 families falling into the $200,000+ income range, which is the most common income bracket and makes up 30.2% of all families.
| Income Bracket | # Families | % Families |
| Less than $10,000 | 32 | 5.4% |
| $10,000 to $14,999 | 0 | 0.0% |
| $15,000 to $24,999 | 46 | 7.8% |
| $25,000 to $34,999 | 0 | 0.0% |
| $35,000 to $49,999 | 67 | 11.4% |
| $50,000 to $74,999 | 38 | 6.5% |
| $75,000 to $99,999 | 49 | 8.3% |
| $100,000 to $149,999 | 65 | 11.0% |
| $150,000 to $199,999 | 114 | 19.4% |
| $200,000+ | 178 | 30.2% |
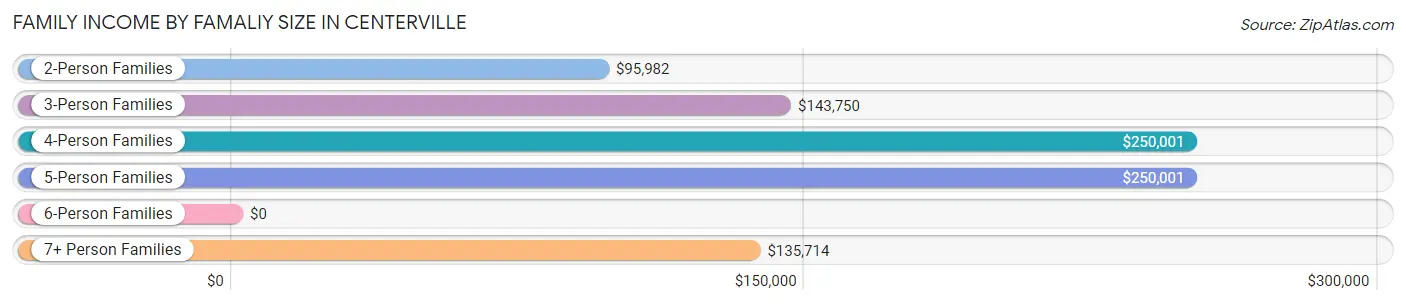
Family Income by Famaliy Size in Centerville
4-person families (63 | 10.7%) account for the highest median family income in Centerville with $250,001 per family, while 4-person families (63 | 10.7%) have the highest median income of $62,500 per family member.
| Income Bracket | # Families | Median Income |
| 2-Person Families | 359 (61.0%) | $95,982 |
| 3-Person Families | 90 (15.3%) | $143,750 |
| 4-Person Families | 63 (10.7%) | $250,001 |
| 5-Person Families | 45 (7.6%) | $250,001 |
| 6-Person Families | 12 (2.0%) | $0 |
| 7+ Person Families | 20 (3.4%) | $135,714 |
| Total | 589 (100.0%) | $137,109 |
Family Income by Number of Earners in Centerville
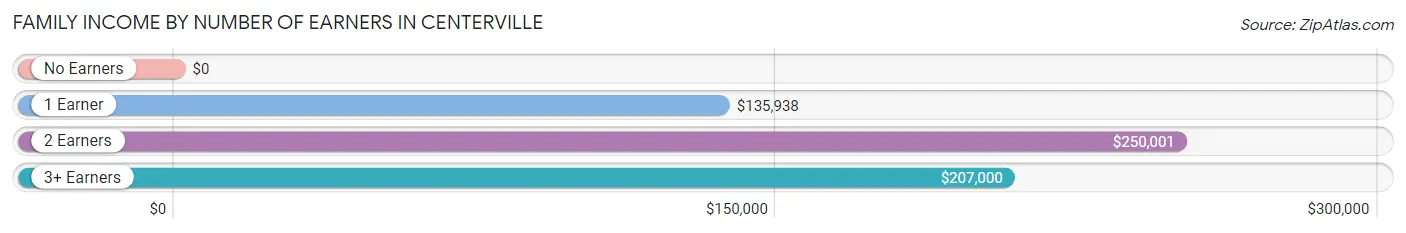
| Number of Earners | # Families | Median Income |
| No Earners | 154 (26.2%) | $0 |
| 1 Earner | 211 (35.8%) | $135,938 |
| 2 Earners | 166 (28.2%) | $250,001 |
| 3+ Earners | 58 (9.9%) | $207,000 |
| Total | 589 (100.0%) | $137,109 |
Household Income in Centerville
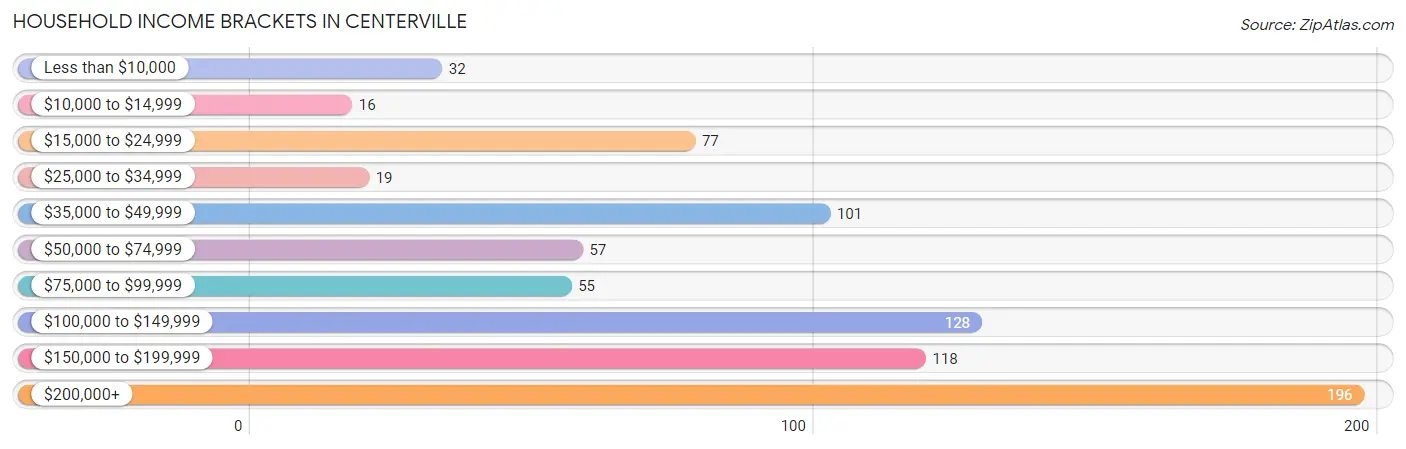
Household Income Brackets in Centerville
With 196 households falling in the category, the $200,000+ income range is the most frequent in Centerville, accounting for 24.5% of all households. In contrast, only 16 households (2.0%) fall into the $10,000 to $14,999 income bracket, making it the least populous group.
| Income Bracket | # Households | % Households |
| Less than $10,000 | 32 | 4.0% |
| $10,000 to $14,999 | 16 | 2.0% |
| $15,000 to $24,999 | 77 | 9.6% |
| $25,000 to $34,999 | 19 | 2.4% |
| $35,000 to $49,999 | 101 | 12.6% |
| $50,000 to $74,999 | 57 | 7.1% |
| $75,000 to $99,999 | 55 | 6.9% |
| $100,000 to $149,999 | 128 | 16.0% |
| $150,000 to $199,999 | 118 | 14.8% |
| $200,000+ | 196 | 24.5% |
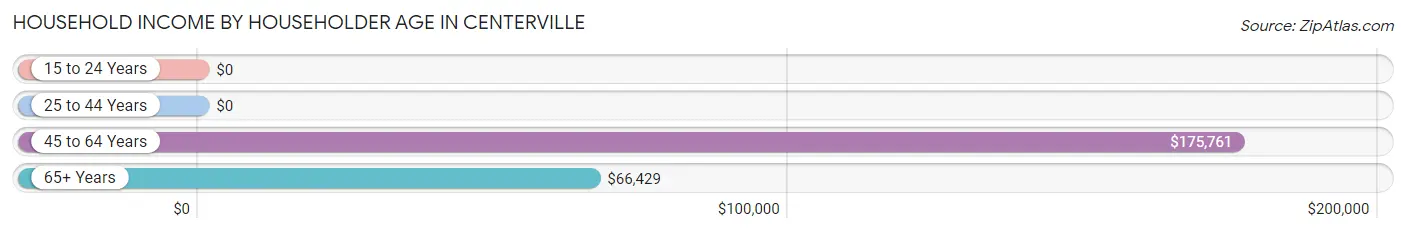
Household Income by Householder Age in Centerville
The median household income in Centerville is $109,432, with the highest median household income of $175,761 found in the 45 to 64 years age bracket for the primary householder. A total of 364 households (45.6%) fall into this category.
| Income Bracket | # Households | Median Income |
| 15 to 24 Years | 0 (0.0%) | $0 |
| 25 to 44 Years | 137 (17.2%) | $0 |
| 45 to 64 Years | 364 (45.6%) | $175,761 |
| 65+ Years | 298 (37.3%) | $66,429 |
| Total | 799 (100.0%) | $109,432 |
Poverty in Centerville
Income Below Poverty by Sex and Age in Centerville
With 7.1% poverty level for males and 8.6% for females among the residents of Centerville, 6 to 11 year old males and 16 and 17 year old females are the most vulnerable to poverty, with 33 males (28.0%) and 5 females (100.0%) in their respective age groups living below the poverty level.
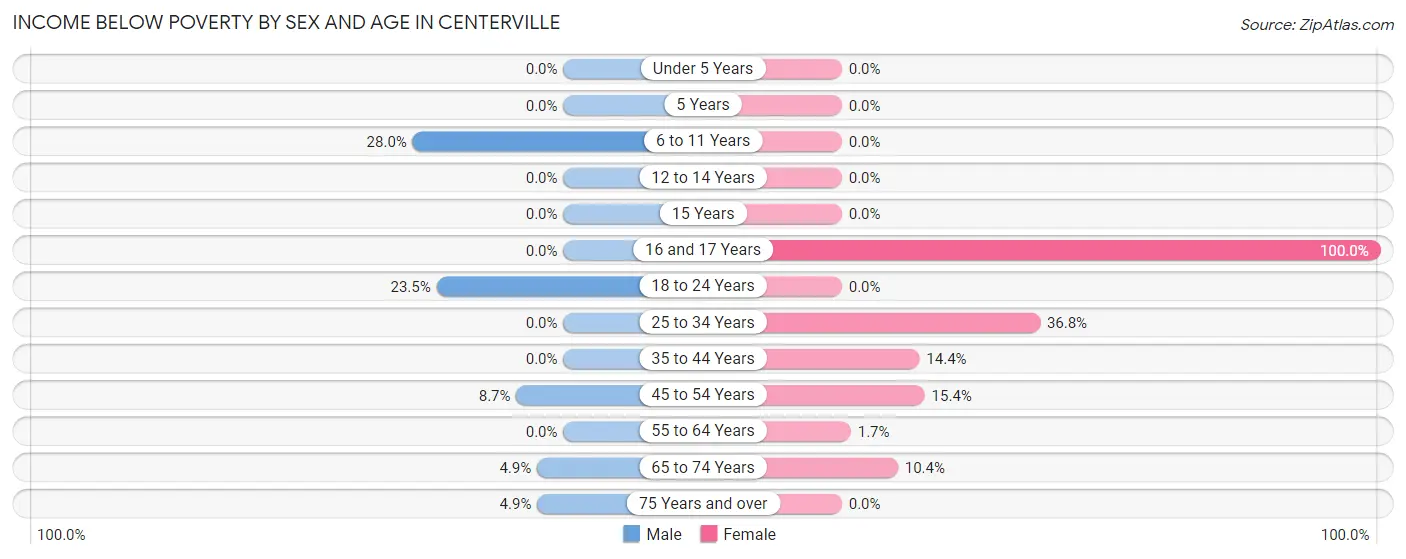
| Age Bracket | Male | Female |
| Under 5 Years | 0 (0.0%) | 0 (0.0%) |
| 5 Years | 0 (0.0%) | 0 (0.0%) |
| 6 to 11 Years | 33 (28.0%) | 0 (0.0%) |
| 12 to 14 Years | 0 (0.0%) | 0 (0.0%) |
| 15 Years | 0 (0.0%) | 0 (0.0%) |
| 16 and 17 Years | 0 (0.0%) | 5 (100.0%) |
| 18 to 24 Years | 16 (23.5%) | 0 (0.0%) |
| 25 to 34 Years | 0 (0.0%) | 32 (36.8%) |
| 35 to 44 Years | 0 (0.0%) | 17 (14.4%) |
| 45 to 54 Years | 13 (8.7%) | 22 (15.4%) |
| 55 to 64 Years | 0 (0.0%) | 4 (1.7%) |
| 65 to 74 Years | 8 (4.9%) | 18 (10.4%) |
| 75 Years and over | 5 (4.9%) | 0 (0.0%) |
| Total | 75 (7.1%) | 98 (8.6%) |
Income Above Poverty by Sex and Age in Centerville
According to the poverty statistics in Centerville, males aged under 5 years and females aged under 5 years are the age groups that are most secure financially, with 100.0% of males and 100.0% of females in these age groups living above the poverty line.
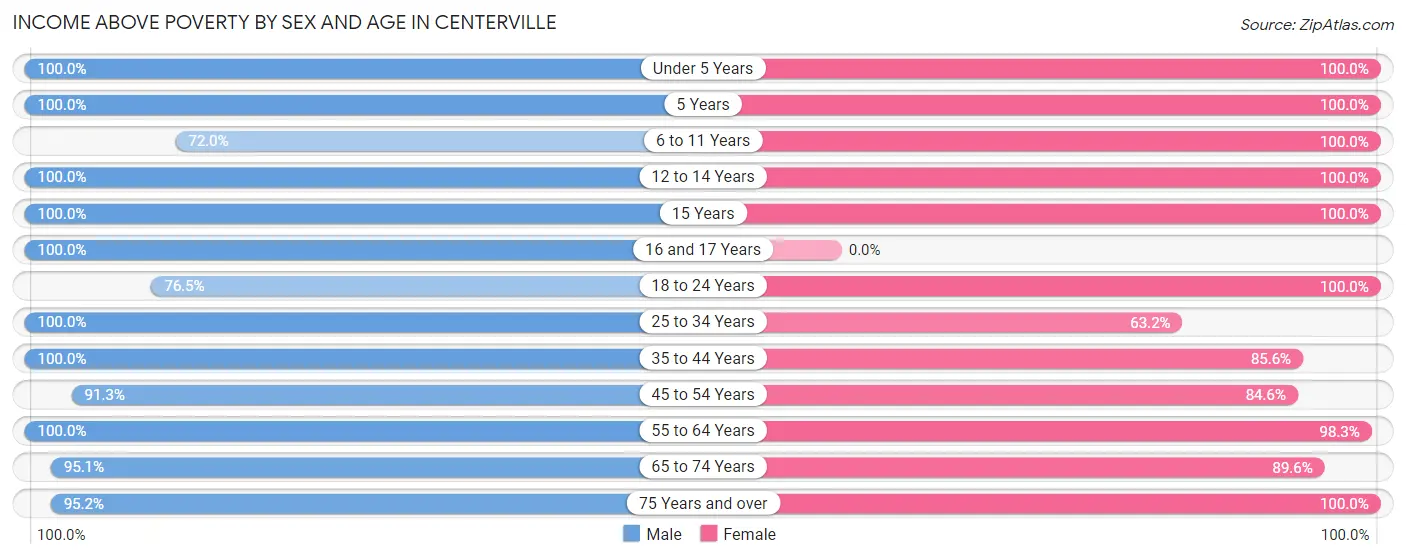
| Age Bracket | Male | Female |
| Under 5 Years | 43 (100.0%) | 57 (100.0%) |
| 5 Years | 14 (100.0%) | 22 (100.0%) |
| 6 to 11 Years | 85 (72.0%) | 70 (100.0%) |
| 12 to 14 Years | 29 (100.0%) | 52 (100.0%) |
| 15 Years | 30 (100.0%) | 32 (100.0%) |
| 16 and 17 Years | 29 (100.0%) | 0 (0.0%) |
| 18 to 24 Years | 52 (76.5%) | 42 (100.0%) |
| 25 to 34 Years | 73 (100.0%) | 55 (63.2%) |
| 35 to 44 Years | 55 (100.0%) | 101 (85.6%) |
| 45 to 54 Years | 136 (91.3%) | 121 (84.6%) |
| 55 to 64 Years | 179 (100.0%) | 236 (98.3%) |
| 65 to 74 Years | 156 (95.1%) | 155 (89.6%) |
| 75 Years and over | 98 (95.2%) | 96 (100.0%) |
| Total | 979 (92.9%) | 1,039 (91.4%) |
Income Below Poverty Among Married-Couple Families in Centerville
The poverty statistics for married-couple families in Centerville show that 2.8% or 13 of the total 471 families live below the poverty line. Families with no children have the highest poverty rate of 4.3%, comprising of 13 families. On the other hand, families with 1 or 2 children have the lowest poverty rate of 0.0%, which includes 0 families.
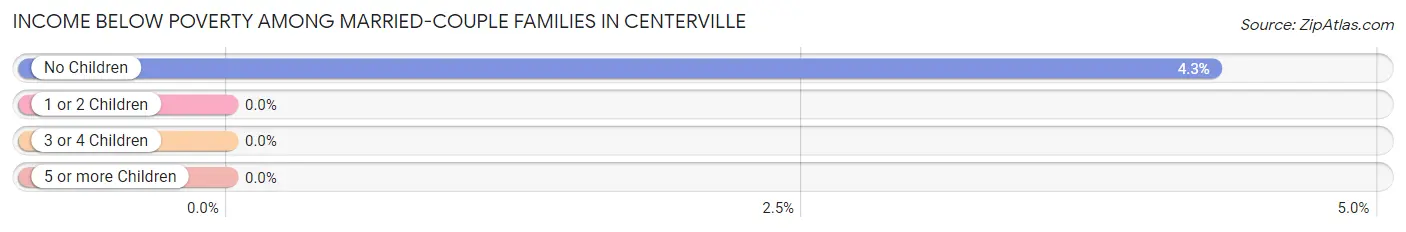
| Children | Above Poverty | Below Poverty |
| No Children | 291 (95.7%) | 13 (4.3%) |
| 1 or 2 Children | 128 (100.0%) | 0 (0.0%) |
| 3 or 4 Children | 31 (100.0%) | 0 (0.0%) |
| 5 or more Children | 8 (100.0%) | 0 (0.0%) |
| Total | 458 (97.2%) | 13 (2.8%) |
Income Below Poverty Among Single-Parent Households in Centerville
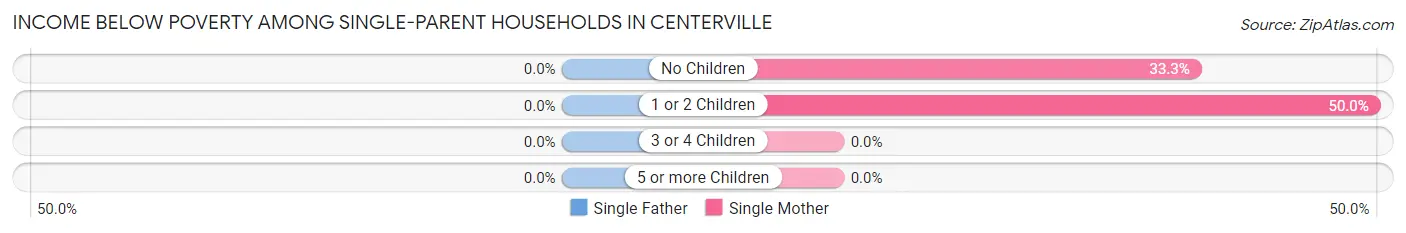
| Children | Single Father | Single Mother |
| No Children | 0 (0.0%) | 15 (33.3%) |
| 1 or 2 Children | 0 (0.0%) | 35 (50.0%) |
| 3 or 4 Children | 0 (0.0%) | 0 (0.0%) |
| 5 or more Children | 0 (0.0%) | 0 (0.0%) |
| Total | 0 (0.0%) | 50 (43.5%) |
Income Below Poverty Among Married-Couple vs Single-Parent Households in Centerville
The poverty data for Centerville shows that 13 of the married-couple family households (2.8%) and 50 of the single-parent households (42.4%) are living below the poverty level. Within the married-couple family households, those with no children have the highest poverty rate, with 13 households (4.3%) falling below the poverty line. Among the single-parent households, those with 1 or 2 children have the highest poverty rate, with 35 household (50.0%) living below poverty.
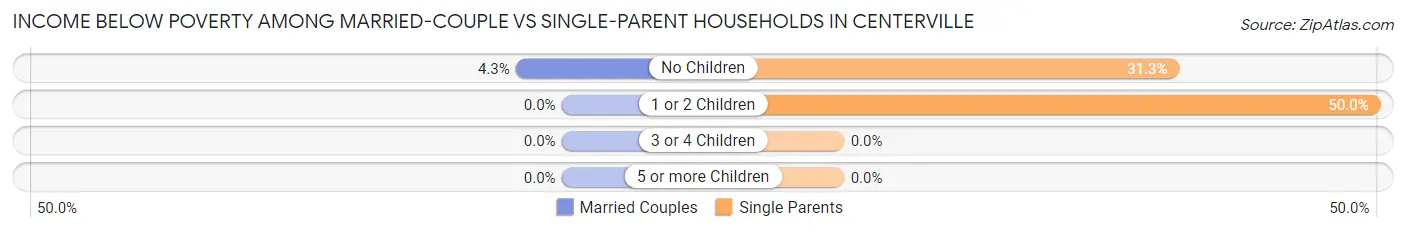
| Children | Married-Couple Families | Single-Parent Households |
| No Children | 13 (4.3%) | 15 (31.2%) |
| 1 or 2 Children | 0 (0.0%) | 35 (50.0%) |
| 3 or 4 Children | 0 (0.0%) | 0 (0.0%) |
| 5 or more Children | 0 (0.0%) | 0 (0.0%) |
| Total | 13 (2.8%) | 50 (42.4%) |
Employment Characteristics in Centerville
Employment by Class of Employer in Centerville
Among the 807 employed individuals in Centerville, private company employees (412 | 51.0%), local government employees (155 | 19.2%), and self-employed (incorporated) (101 | 12.5%) make up the most common classes of employment.
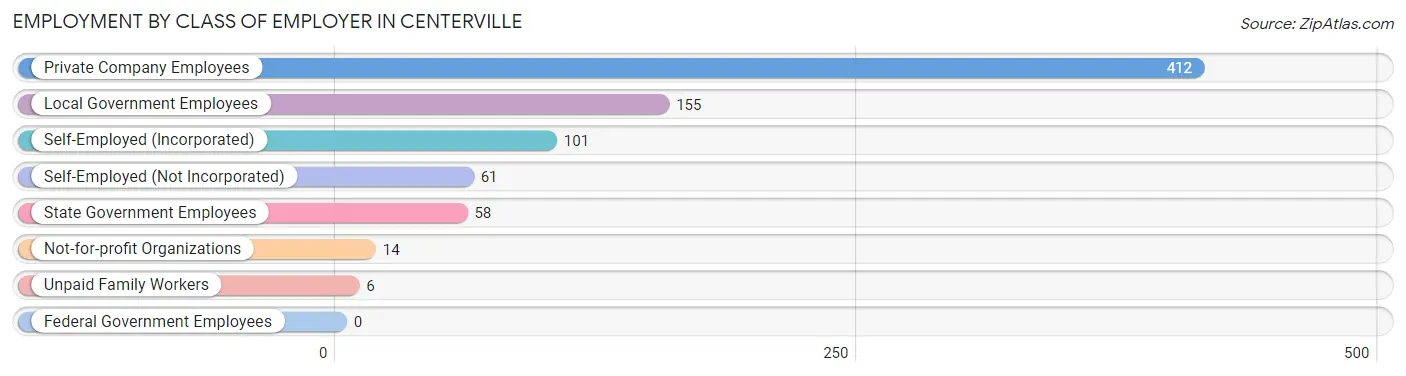
| Employer Class | # Employees | % Employees |
| Private Company Employees | 412 | 51.0% |
| Self-Employed (Incorporated) | 101 | 12.5% |
| Self-Employed (Not Incorporated) | 61 | 7.6% |
| Not-for-profit Organizations | 14 | 1.7% |
| Local Government Employees | 155 | 19.2% |
| State Government Employees | 58 | 7.2% |
| Federal Government Employees | 0 | 0.0% |
| Unpaid Family Workers | 6 | 0.7% |
| Total | 807 | 100.0% |
Employment Status by Age in Centerville
According to the labor force statistics for Centerville, out of the total population over 16 years of age (1,724), 50.6% or 872 individuals are in the labor force, with 3.0% or 26 of them unemployed. The age group with the highest labor force participation rate is 55 to 59 years, with 81.2% or 177 individuals in the labor force. Within the labor force, the 30 to 34 years age range has the highest percentage of unemployed individuals, with 18.8% or 9 of them being unemployed.
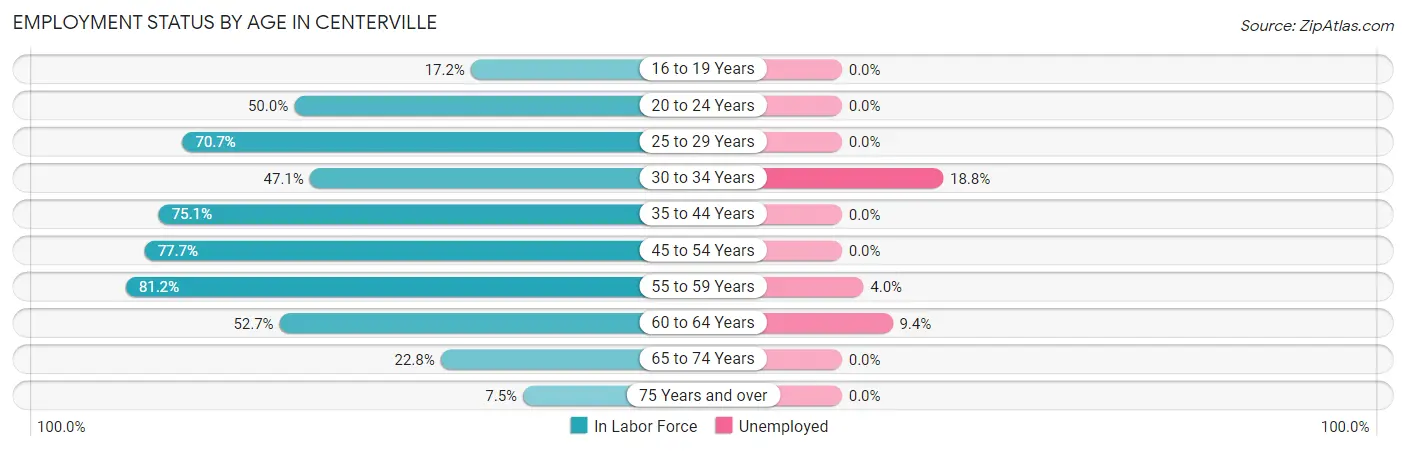
| Age Bracket | In Labor Force | Unemployed |
| 16 to 19 Years | 11 (17.2%) | 0 (0.0%) |
| 20 to 24 Years | 40 (50.0%) | 0 (0.0%) |
| 25 to 29 Years | 41 (70.7%) | 0 (0.0%) |
| 30 to 34 Years | 48 (47.1%) | 9 (18.8%) |
| 35 to 44 Years | 130 (75.1%) | 0 (0.0%) |
| 45 to 54 Years | 227 (77.7%) | 0 (0.0%) |
| 55 to 59 Years | 177 (81.2%) | 7 (4.0%) |
| 60 to 64 Years | 106 (52.7%) | 10 (9.4%) |
| 65 to 74 Years | 77 (22.8%) | 0 (0.0%) |
| 75 Years and over | 15 (7.5%) | 0 (0.0%) |
| Total | 872 (50.6%) | 26 (3.0%) |
Employment Status by Educational Attainment in Centerville
According to labor force statistics for Centerville, 69.8% of individuals (729) out of the total population between 25 and 64 years of age (1,044) are in the labor force, with 3.6% or 26 of them being unemployed. The group with the highest labor force participation rate are those with the educational attainment of bachelor's degree or higher, with 83.4% or 331 individuals in the labor force. Within the labor force, individuals with bachelor's degree or higher education have the highest percentage of unemployment, with 4.8% or 16 of them being unemployed.
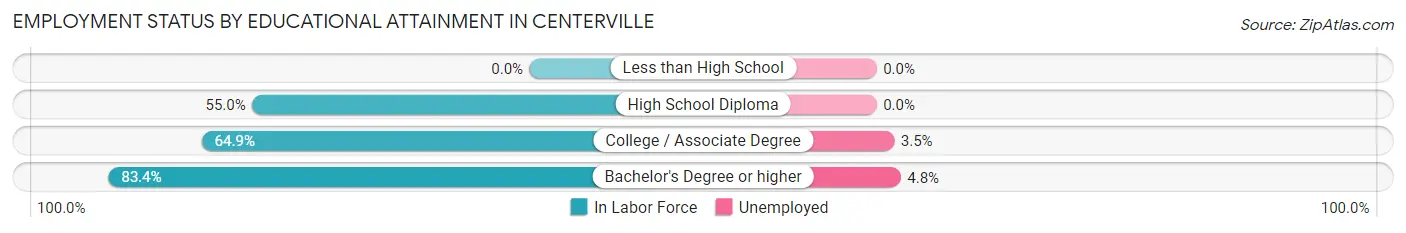
| Educational Attainment | In Labor Force | Unemployed |
| Less than High School | 0 (0.0%) | 0 (0.0%) |
| High School Diploma | 110 (55.0%) | 0 (0.0%) |
| College / Associate Degree | 288 (64.9%) | 16 (3.5%) |
| Bachelor's Degree or higher | 331 (83.4%) | 19 (4.8%) |
| Total | 729 (69.8%) | 38 (3.6%) |
Employment Occupations by Sex in Centerville
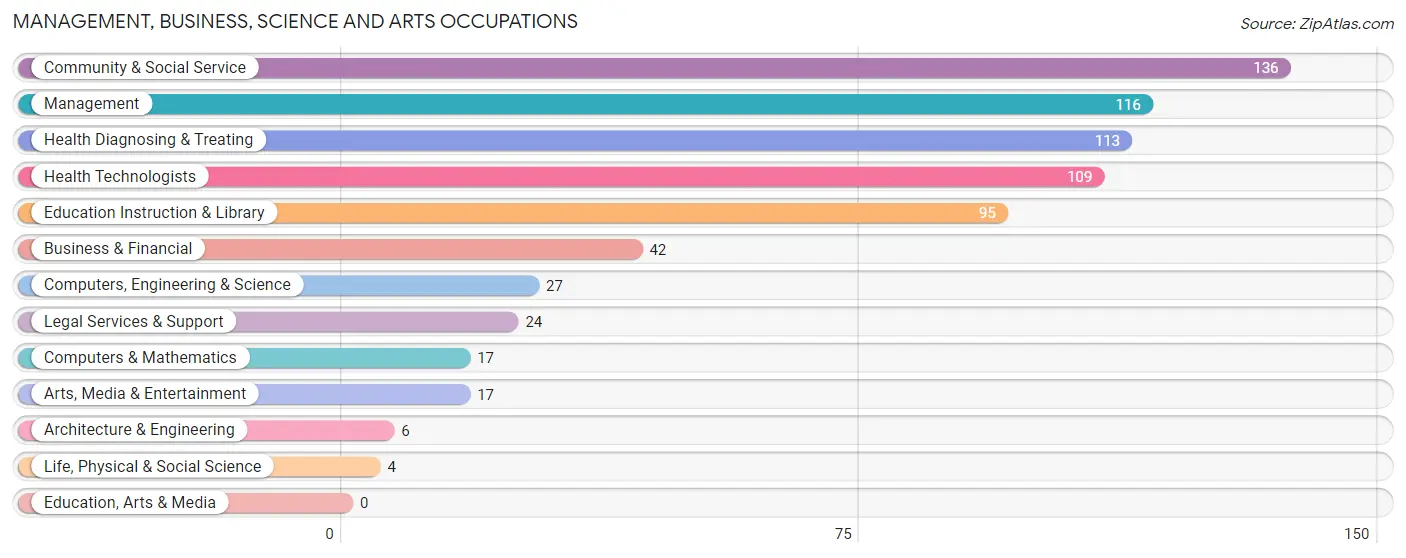
Management, Business, Science and Arts Occupations
The most common Management, Business, Science and Arts occupations in Centerville are Community & Social Service (136 | 16.1%), Management (116 | 13.7%), Health Diagnosing & Treating (113 | 13.4%), Health Technologists (109 | 12.9%), and Education Instruction & Library (95 | 11.2%).
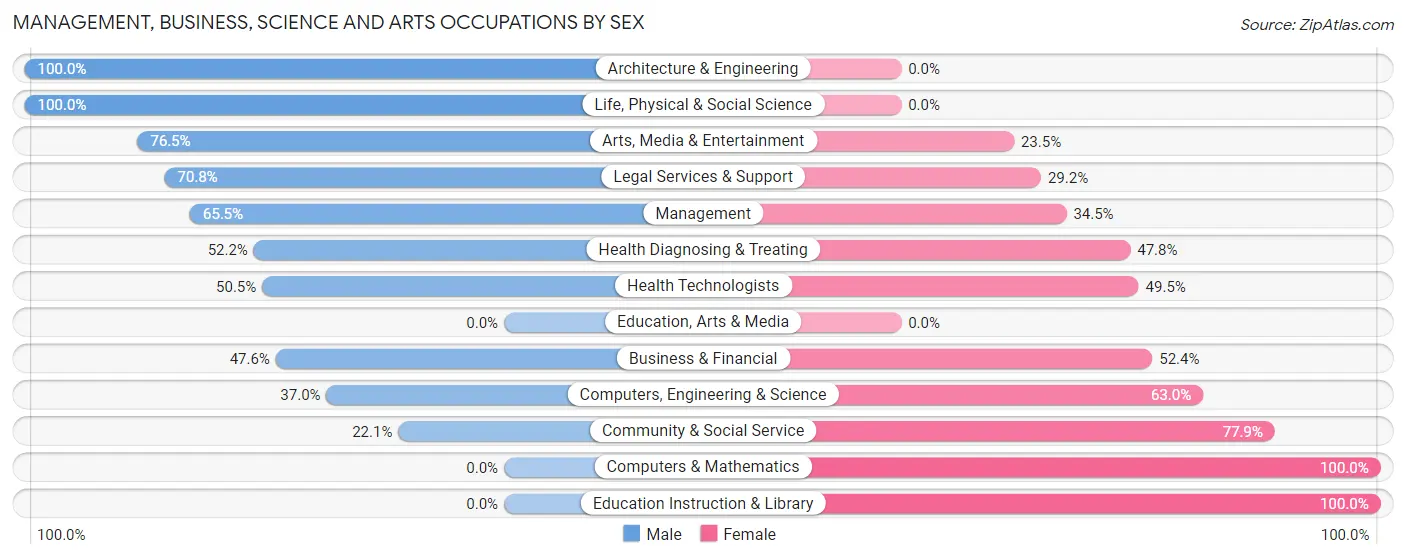
Management, Business, Science and Arts Occupations by Sex
Within the Management, Business, Science and Arts occupations in Centerville, the most male-oriented occupations are Architecture & Engineering (100.0%), Life, Physical & Social Science (100.0%), and Arts, Media & Entertainment (76.5%), while the most female-oriented occupations are Computers & Mathematics (100.0%), Education Instruction & Library (100.0%), and Community & Social Service (77.9%).
| Occupation | Male | Female |
| Management | 76 (65.5%) | 40 (34.5%) |
| Business & Financial | 20 (47.6%) | 22 (52.4%) |
| Computers, Engineering & Science | 10 (37.0%) | 17 (63.0%) |
| Computers & Mathematics | 0 (0.0%) | 17 (100.0%) |
| Architecture & Engineering | 6 (100.0%) | 0 (0.0%) |
| Life, Physical & Social Science | 4 (100.0%) | 0 (0.0%) |
| Community & Social Service | 30 (22.1%) | 106 (77.9%) |
| Education, Arts & Media | 0 (0.0%) | 0 (0.0%) |
| Legal Services & Support | 17 (70.8%) | 7 (29.2%) |
| Education Instruction & Library | 0 (0.0%) | 95 (100.0%) |
| Arts, Media & Entertainment | 13 (76.5%) | 4 (23.5%) |
| Health Diagnosing & Treating | 59 (52.2%) | 54 (47.8%) |
| Health Technologists | 55 (50.5%) | 54 (49.5%) |
| Total (Category) | 195 (44.9%) | 239 (55.1%) |
| Total (Overall) | 429 (50.7%) | 417 (49.3%) |
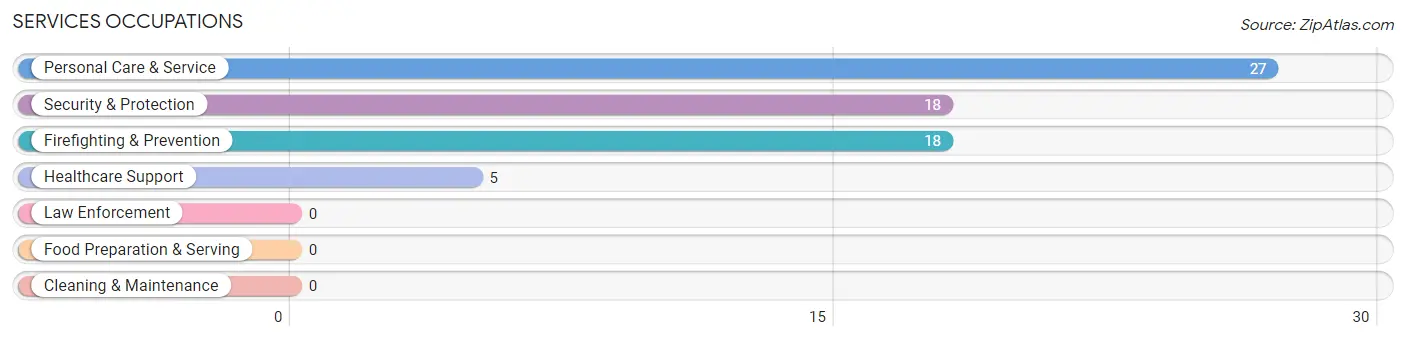
Services Occupations
The most common Services occupations in Centerville are Personal Care & Service (27 | 3.2%), Security & Protection (18 | 2.1%), Firefighting & Prevention (18 | 2.1%), and Healthcare Support (5 | 0.6%).
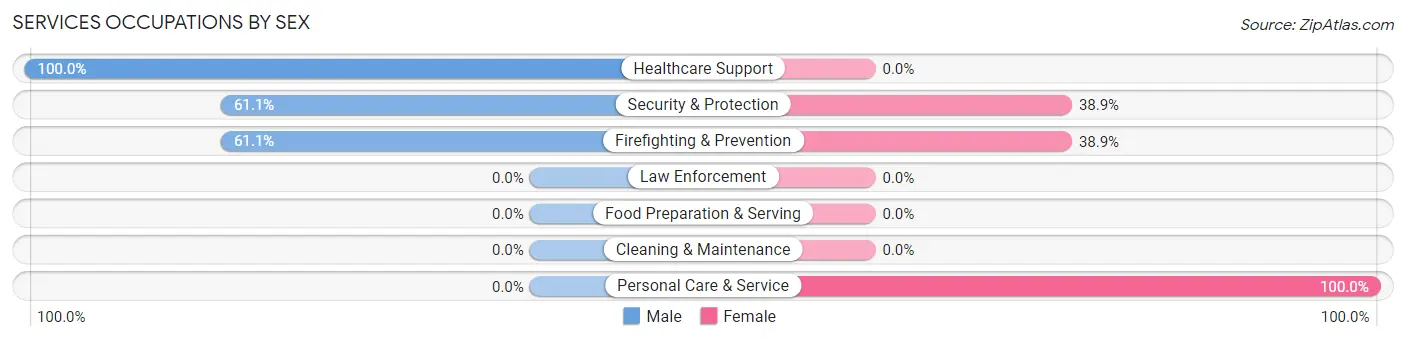
Services Occupations by Sex
Within the Services occupations in Centerville, the most male-oriented occupations are Healthcare Support (100.0%), Security & Protection (61.1%), and Firefighting & Prevention (61.1%), while the most female-oriented occupations are Personal Care & Service (100.0%), Security & Protection (38.9%), and Firefighting & Prevention (38.9%).
| Occupation | Male | Female |
| Healthcare Support | 5 (100.0%) | 0 (0.0%) |
| Security & Protection | 11 (61.1%) | 7 (38.9%) |
| Firefighting & Prevention | 11 (61.1%) | 7 (38.9%) |
| Law Enforcement | 0 (0.0%) | 0 (0.0%) |
| Food Preparation & Serving | 0 (0.0%) | 0 (0.0%) |
| Cleaning & Maintenance | 0 (0.0%) | 0 (0.0%) |
| Personal Care & Service | 0 (0.0%) | 27 (100.0%) |
| Total (Category) | 16 (32.0%) | 34 (68.0%) |
| Total (Overall) | 429 (50.7%) | 417 (49.3%) |
Sales and Office Occupations
The most common Sales and Office occupations in Centerville are Office & Administration (123 | 14.5%), and Sales & Related (76 | 9.0%).

Sales and Office Occupations by Sex

| Occupation | Male | Female |
| Sales & Related | 37 (48.7%) | 39 (51.3%) |
| Office & Administration | 21 (17.1%) | 102 (82.9%) |
| Total (Category) | 58 (29.1%) | 141 (70.9%) |
| Total (Overall) | 429 (50.7%) | 417 (49.3%) |
Natural Resources, Construction and Maintenance Occupations
The most common Natural Resources, Construction and Maintenance occupations in Centerville are Construction & Extraction (11 | 1.3%), Installation, Maintenance & Repair (8 | 0.9%), and Farming, Fishing & Forestry (4 | 0.5%).

Natural Resources, Construction and Maintenance Occupations by Sex

| Occupation | Male | Female |
| Farming, Fishing & Forestry | 4 (100.0%) | 0 (0.0%) |
| Construction & Extraction | 11 (100.0%) | 0 (0.0%) |
| Installation, Maintenance & Repair | 8 (100.0%) | 0 (0.0%) |
| Total (Category) | 23 (100.0%) | 0 (0.0%) |
| Total (Overall) | 429 (50.7%) | 417 (49.3%) |
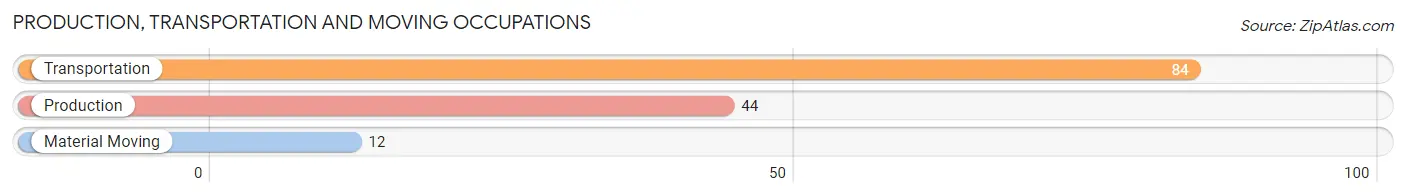
Production, Transportation and Moving Occupations
The most common Production, Transportation and Moving occupations in Centerville are Transportation (84 | 9.9%), Production (44 | 5.2%), and Material Moving (12 | 1.4%).
Production, Transportation and Moving Occupations by Sex

| Occupation | Male | Female |
| Production | 41 (93.2%) | 3 (6.8%) |
| Transportation | 84 (100.0%) | 0 (0.0%) |
| Material Moving | 12 (100.0%) | 0 (0.0%) |
| Total (Category) | 137 (97.9%) | 3 (2.1%) |
| Total (Overall) | 429 (50.7%) | 417 (49.3%) |
Employment Industries by Sex in Centerville
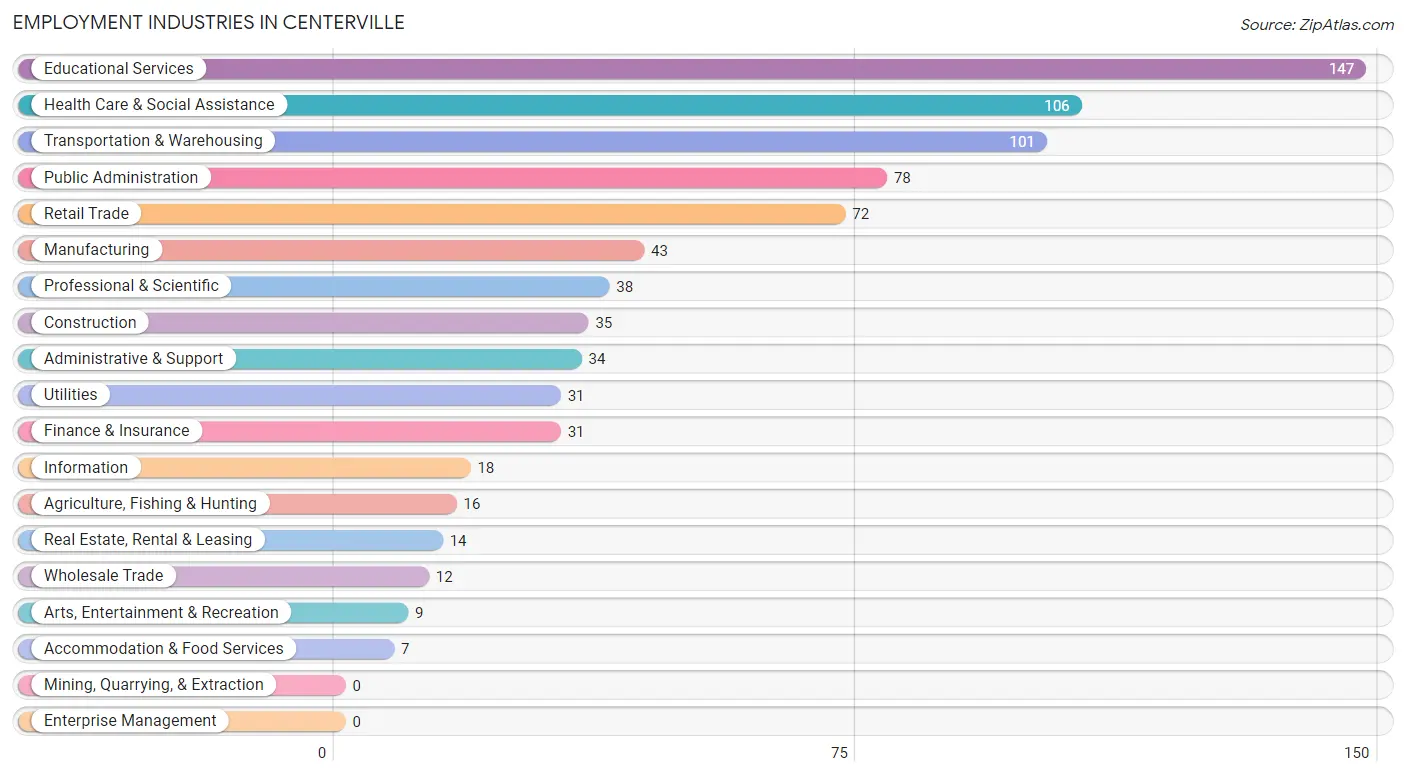
Employment Industries in Centerville
The major employment industries in Centerville include Educational Services (147 | 17.4%), Health Care & Social Assistance (106 | 12.5%), Transportation & Warehousing (101 | 11.9%), Public Administration (78 | 9.2%), and Retail Trade (72 | 8.5%).
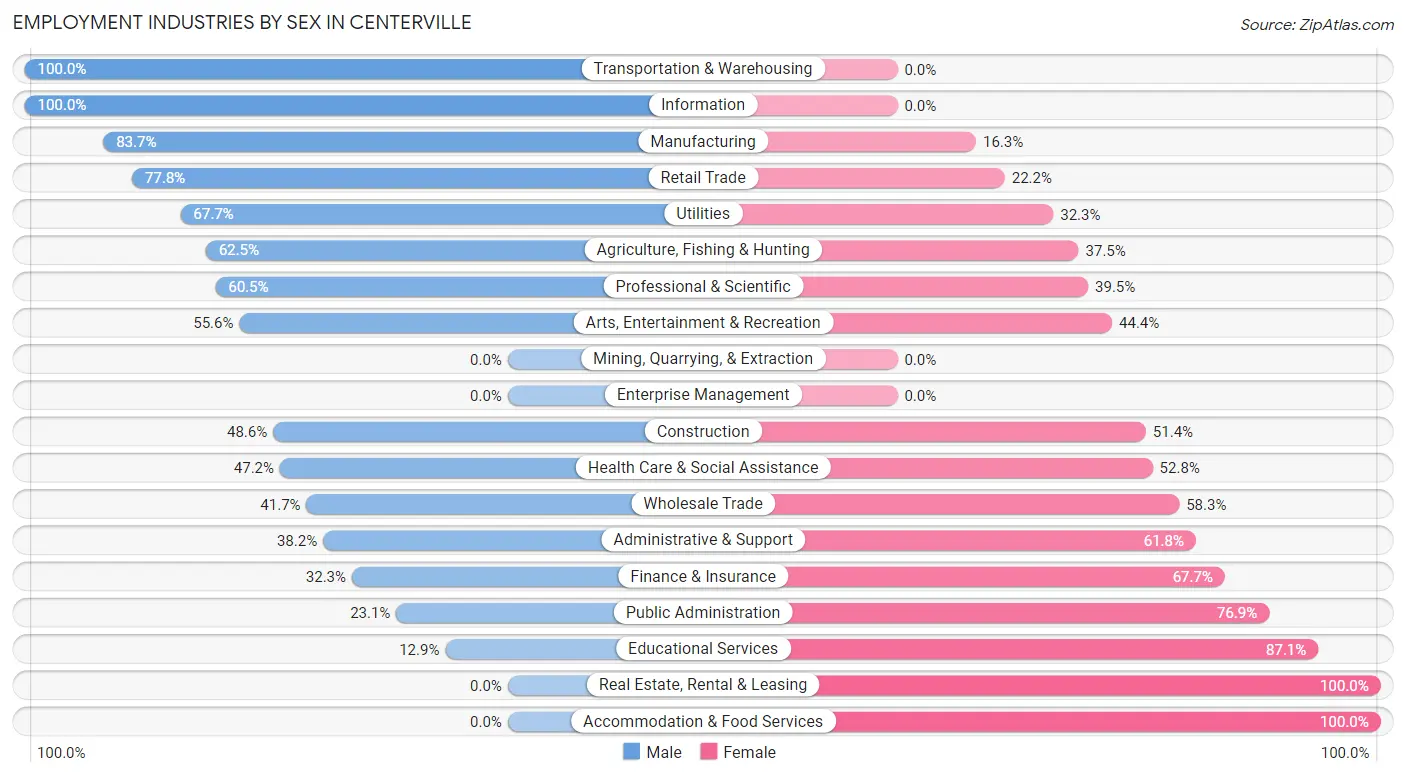
Employment Industries by Sex in Centerville
The Centerville industries that see more men than women are Transportation & Warehousing (100.0%), Information (100.0%), and Manufacturing (83.7%), whereas the industries that tend to have a higher number of women are Real Estate, Rental & Leasing (100.0%), Accommodation & Food Services (100.0%), and Educational Services (87.1%).
| Industry | Male | Female |
| Agriculture, Fishing & Hunting | 10 (62.5%) | 6 (37.5%) |
| Mining, Quarrying, & Extraction | 0 (0.0%) | 0 (0.0%) |
| Construction | 17 (48.6%) | 18 (51.4%) |
| Manufacturing | 36 (83.7%) | 7 (16.3%) |
| Wholesale Trade | 5 (41.7%) | 7 (58.3%) |
| Retail Trade | 56 (77.8%) | 16 (22.2%) |
| Transportation & Warehousing | 101 (100.0%) | 0 (0.0%) |
| Utilities | 21 (67.7%) | 10 (32.3%) |
| Information | 18 (100.0%) | 0 (0.0%) |
| Finance & Insurance | 10 (32.3%) | 21 (67.7%) |
| Real Estate, Rental & Leasing | 0 (0.0%) | 14 (100.0%) |
| Professional & Scientific | 23 (60.5%) | 15 (39.5%) |
| Enterprise Management | 0 (0.0%) | 0 (0.0%) |
| Administrative & Support | 13 (38.2%) | 21 (61.8%) |
| Educational Services | 19 (12.9%) | 128 (87.1%) |
| Health Care & Social Assistance | 50 (47.2%) | 56 (52.8%) |
| Arts, Entertainment & Recreation | 5 (55.6%) | 4 (44.4%) |
| Accommodation & Food Services | 0 (0.0%) | 7 (100.0%) |
| Public Administration | 18 (23.1%) | 60 (76.9%) |
| Total | 429 (50.7%) | 417 (49.3%) |
Education in Centerville
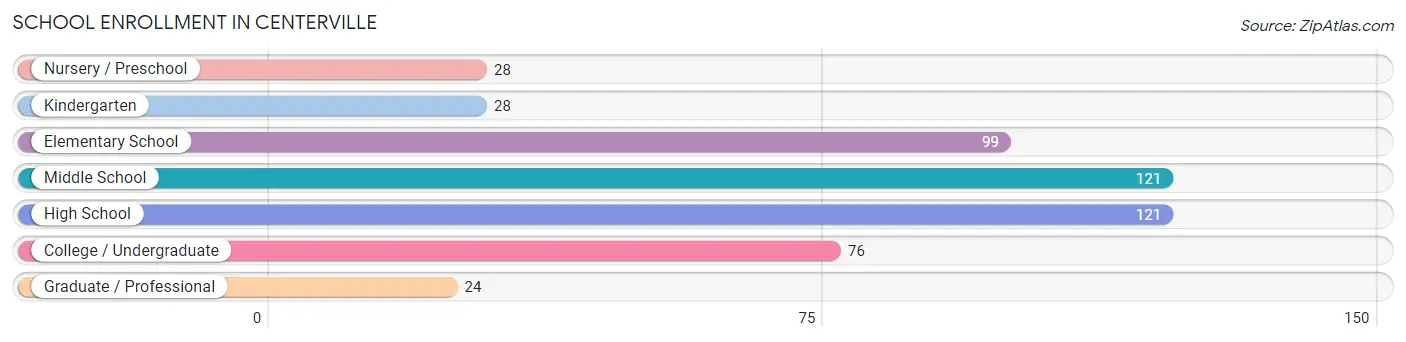
School Enrollment in Centerville
The most common levels of schooling among the 497 students in Centerville are middle school (121 | 24.3%), high school (121 | 24.3%), and elementary school (99 | 19.9%).
| School Level | # Students | % Students |
| Nursery / Preschool | 28 | 5.6% |
| Kindergarten | 28 | 5.6% |
| Elementary School | 99 | 19.9% |
| Middle School | 121 | 24.3% |
| High School | 121 | 24.3% |
| College / Undergraduate | 76 | 15.3% |
| Graduate / Professional | 24 | 4.8% |
| Total | 497 | 100.0% |
School Enrollment by Age by Funding Source in Centerville
Out of a total of 497 students who are enrolled in schools in Centerville, 133 (26.8%) attend a private institution, while the remaining 364 (73.2%) are enrolled in public schools. The age group of 18 to 19 year olds has the highest likelihood of being enrolled in private schools, with 10 (62.5% in the age bracket) enrolled. Conversely, the age group of 3 to 4 year olds has the lowest likelihood of being enrolled in a private school, with 5 (100.0% in the age bracket) attending a public institution.
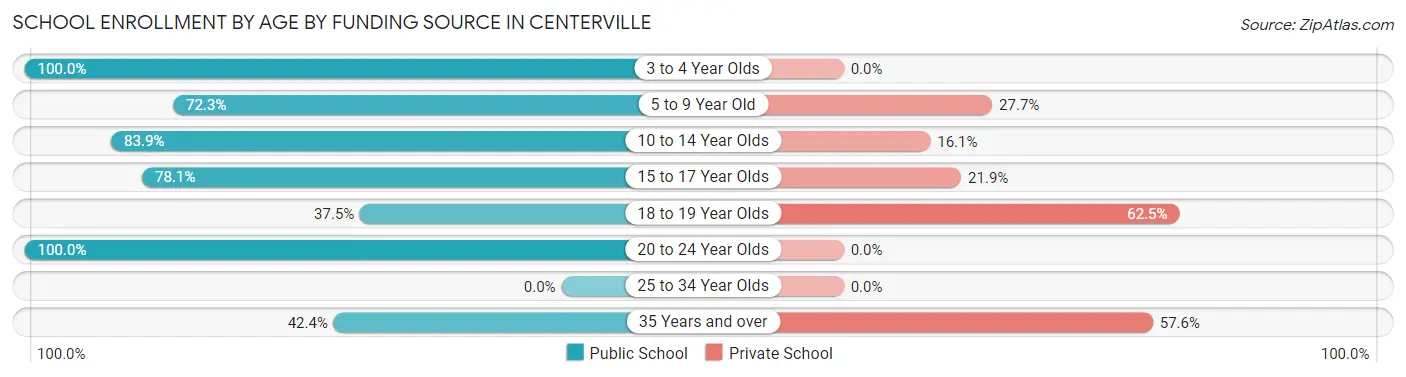
| Age Bracket | Public School | Private School |
| 3 to 4 Year Olds | 5 (100.0%) | 0 (0.0%) |
| 5 to 9 Year Old | 102 (72.3%) | 39 (27.7%) |
| 10 to 14 Year Olds | 130 (83.9%) | 25 (16.1%) |
| 15 to 17 Year Olds | 75 (78.1%) | 21 (21.9%) |
| 18 to 19 Year Olds | 6 (37.5%) | 10 (62.5%) |
| 20 to 24 Year Olds | 18 (100.0%) | 0 (0.0%) |
| 25 to 34 Year Olds | 0 (0.0%) | 0 (0.0%) |
| 35 Years and over | 28 (42.4%) | 38 (57.6%) |
| Total | 364 (73.2%) | 133 (26.8%) |
Educational Attainment by Field of Study in Centerville
Bio, nature & agricultural (101 | 16.0%), science & technology (85 | 13.5%), business (70 | 11.1%), psychology (68 | 10.8%), and social sciences (62 | 9.8%) are the most common fields of study among 631 individuals in Centerville who have obtained a bachelor's degree or higher.
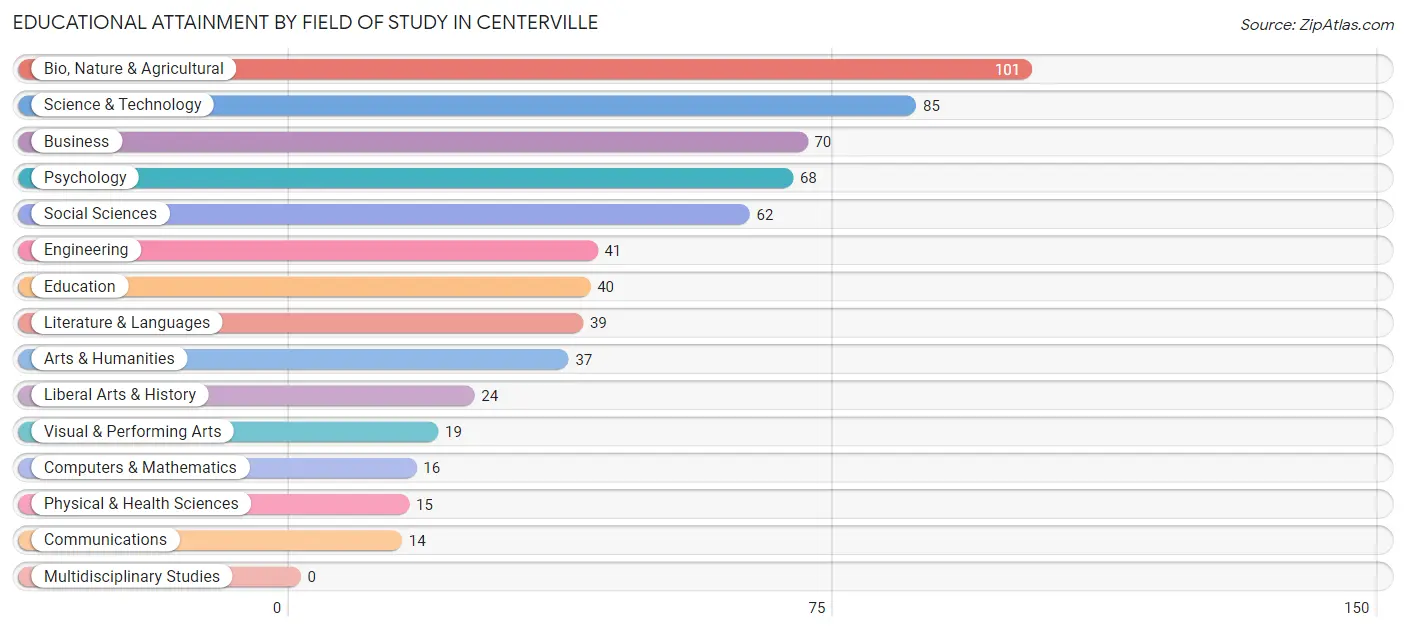
| Field of Study | # Graduates | % Graduates |
| Computers & Mathematics | 16 | 2.5% |
| Bio, Nature & Agricultural | 101 | 16.0% |
| Physical & Health Sciences | 15 | 2.4% |
| Psychology | 68 | 10.8% |
| Social Sciences | 62 | 9.8% |
| Engineering | 41 | 6.5% |
| Multidisciplinary Studies | 0 | 0.0% |
| Science & Technology | 85 | 13.5% |
| Business | 70 | 11.1% |
| Education | 40 | 6.3% |
| Literature & Languages | 39 | 6.2% |
| Liberal Arts & History | 24 | 3.8% |
| Visual & Performing Arts | 19 | 3.0% |
| Communications | 14 | 2.2% |
| Arts & Humanities | 37 | 5.9% |
| Total | 631 | 100.0% |
Transportation & Commute in Centerville
Vehicle Availability by Sex in Centerville
The most prevalent vehicle ownership categories in Centerville are males with 3 vehicles (156, accounting for 36.4%) and females with 3 vehicles (143, making up 41.3%).
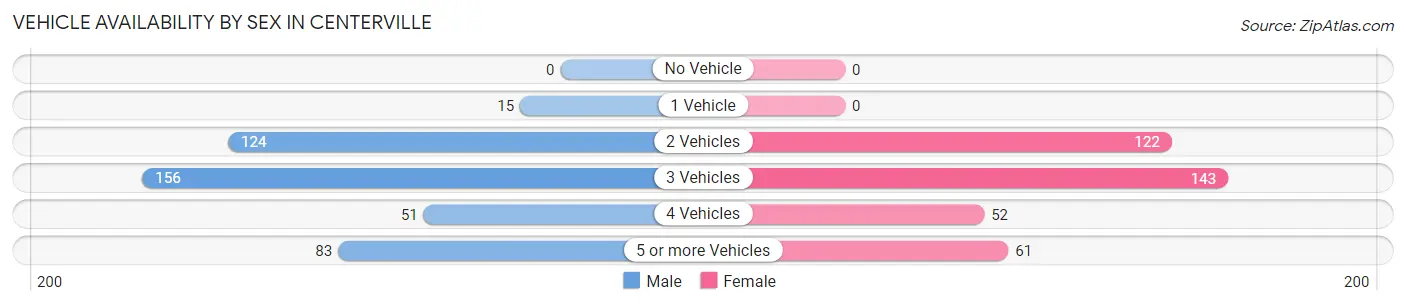
| Vehicles Available | Male | Female |
| No Vehicle | 0 (0.0%) | 0 (0.0%) |
| 1 Vehicle | 15 (3.5%) | 0 (0.0%) |
| 2 Vehicles | 124 (28.9%) | 122 (32.3%) |
| 3 Vehicles | 156 (36.4%) | 143 (37.8%) |
| 4 Vehicles | 51 (11.9%) | 52 (13.8%) |
| 5 or more Vehicles | 83 (19.4%) | 61 (16.1%) |
| Total | 429 (100.0%) | 378 (100.0%) |
Commute Time in Centerville
The most frequently occuring commute durations in Centerville are 15 to 19 minutes (198 commuters, 27.2%), 10 to 14 minutes (167 commuters, 22.9%), and 20 to 24 minutes (136 commuters, 18.7%).
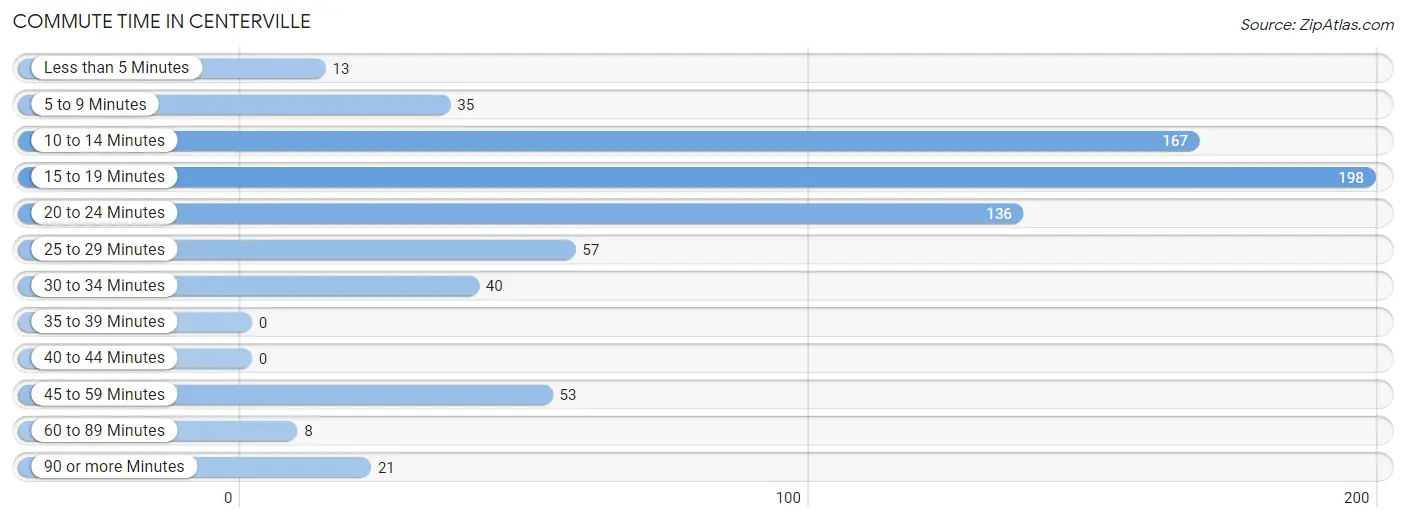
| Commute Time | # Commuters | % Commuters |
| Less than 5 Minutes | 13 | 1.8% |
| 5 to 9 Minutes | 35 | 4.8% |
| 10 to 14 Minutes | 167 | 22.9% |
| 15 to 19 Minutes | 198 | 27.2% |
| 20 to 24 Minutes | 136 | 18.7% |
| 25 to 29 Minutes | 57 | 7.8% |
| 30 to 34 Minutes | 40 | 5.5% |
| 35 to 39 Minutes | 0 | 0.0% |
| 40 to 44 Minutes | 0 | 0.0% |
| 45 to 59 Minutes | 53 | 7.3% |
| 60 to 89 Minutes | 8 | 1.1% |
| 90 or more Minutes | 21 | 2.9% |
Commute Time by Sex in Centerville
The most common commute times in Centerville are 10 to 14 minutes (116 commuters, 30.2%) for males and 15 to 19 minutes (100 commuters, 29.1%) for females.
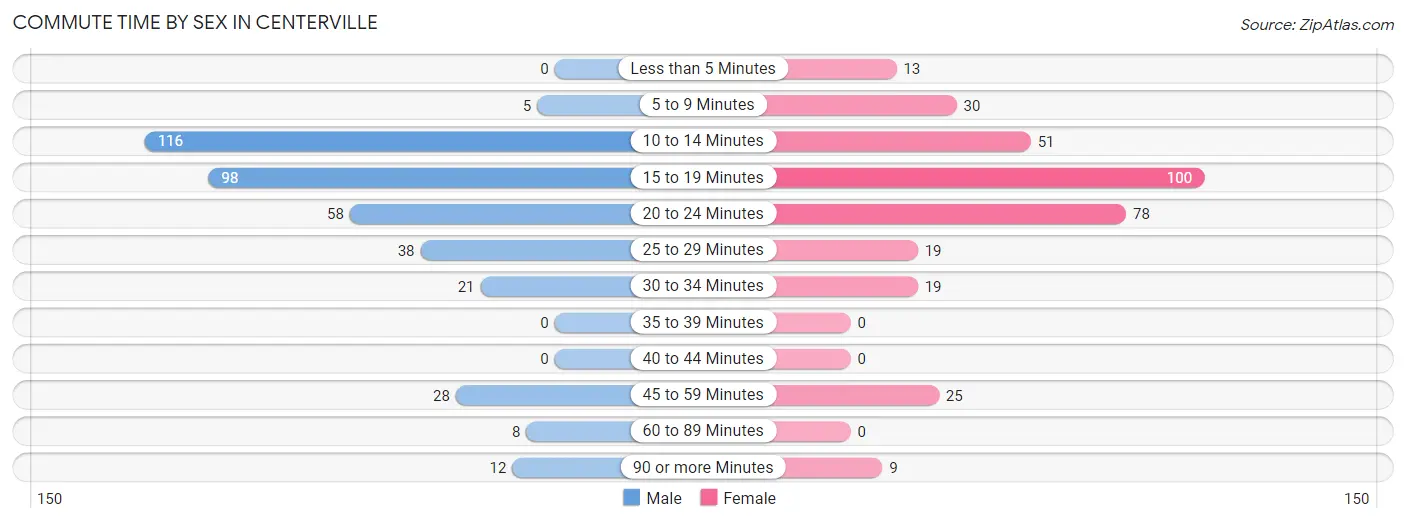
| Commute Time | Male | Female |
| Less than 5 Minutes | 0 (0.0%) | 13 (3.8%) |
| 5 to 9 Minutes | 5 (1.3%) | 30 (8.7%) |
| 10 to 14 Minutes | 116 (30.2%) | 51 (14.8%) |
| 15 to 19 Minutes | 98 (25.5%) | 100 (29.1%) |
| 20 to 24 Minutes | 58 (15.1%) | 78 (22.7%) |
| 25 to 29 Minutes | 38 (9.9%) | 19 (5.5%) |
| 30 to 34 Minutes | 21 (5.5%) | 19 (5.5%) |
| 35 to 39 Minutes | 0 (0.0%) | 0 (0.0%) |
| 40 to 44 Minutes | 0 (0.0%) | 0 (0.0%) |
| 45 to 59 Minutes | 28 (7.3%) | 25 (7.3%) |
| 60 to 89 Minutes | 8 (2.1%) | 0 (0.0%) |
| 90 or more Minutes | 12 (3.1%) | 9 (2.6%) |
Time of Departure to Work by Sex in Centerville
The most frequent times of departure to work in Centerville are 6:30 AM to 6:59 AM (72, 18.8%) for males and 7:30 AM to 7:59 AM (92, 26.7%) for females.
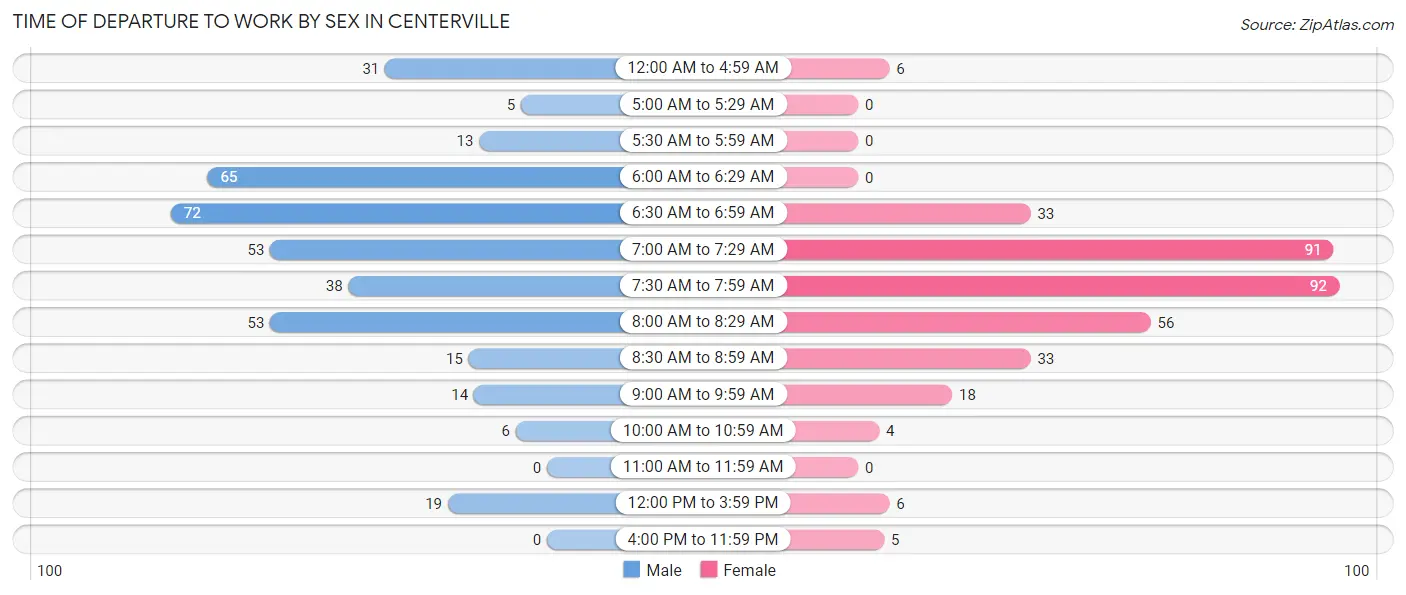
| Time of Departure | Male | Female |
| 12:00 AM to 4:59 AM | 31 (8.1%) | 6 (1.7%) |
| 5:00 AM to 5:29 AM | 5 (1.3%) | 0 (0.0%) |
| 5:30 AM to 5:59 AM | 13 (3.4%) | 0 (0.0%) |
| 6:00 AM to 6:29 AM | 65 (16.9%) | 0 (0.0%) |
| 6:30 AM to 6:59 AM | 72 (18.8%) | 33 (9.6%) |
| 7:00 AM to 7:29 AM | 53 (13.8%) | 91 (26.5%) |
| 7:30 AM to 7:59 AM | 38 (9.9%) | 92 (26.7%) |
| 8:00 AM to 8:29 AM | 53 (13.8%) | 56 (16.3%) |
| 8:30 AM to 8:59 AM | 15 (3.9%) | 33 (9.6%) |
| 9:00 AM to 9:59 AM | 14 (3.6%) | 18 (5.2%) |
| 10:00 AM to 10:59 AM | 6 (1.6%) | 4 (1.2%) |
| 11:00 AM to 11:59 AM | 0 (0.0%) | 0 (0.0%) |
| 12:00 PM to 3:59 PM | 19 (5.0%) | 6 (1.7%) |
| 4:00 PM to 11:59 PM | 0 (0.0%) | 5 (1.5%) |
| Total | 384 (100.0%) | 344 (100.0%) |
Housing Occupancy in Centerville
Occupancy by Ownership in Centerville
Of the total 799 dwellings in Centerville, owner-occupied units account for 755 (94.5%), while renter-occupied units make up 44 (5.5%).
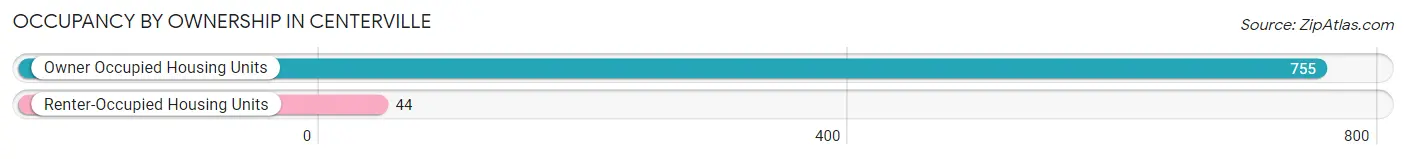
| Occupancy | # Housing Units | % Housing Units |
| Owner Occupied Housing Units | 755 | 94.5% |
| Renter-Occupied Housing Units | 44 | 5.5% |
| Total Occupied Housing Units | 799 | 100.0% |
Occupancy by Household Size in Centerville
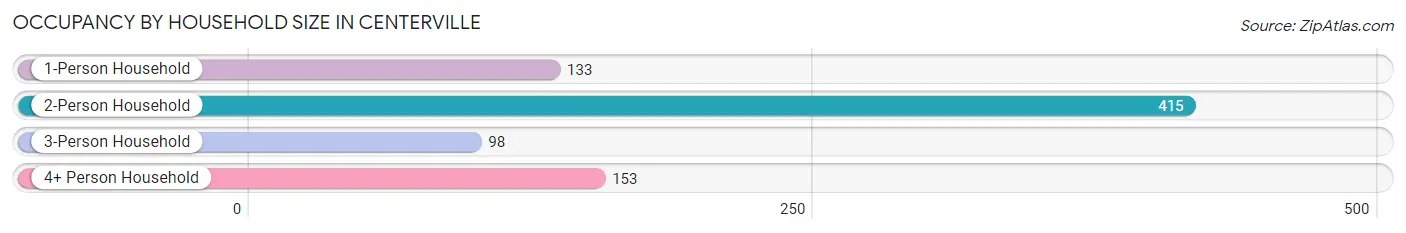
| Household Size | # Housing Units | % Housing Units |
| 1-Person Household | 133 | 16.7% |
| 2-Person Household | 415 | 51.9% |
| 3-Person Household | 98 | 12.3% |
| 4+ Person Household | 153 | 19.2% |
| Total Housing Units | 799 | 100.0% |
Occupancy by Ownership by Household Size in Centerville
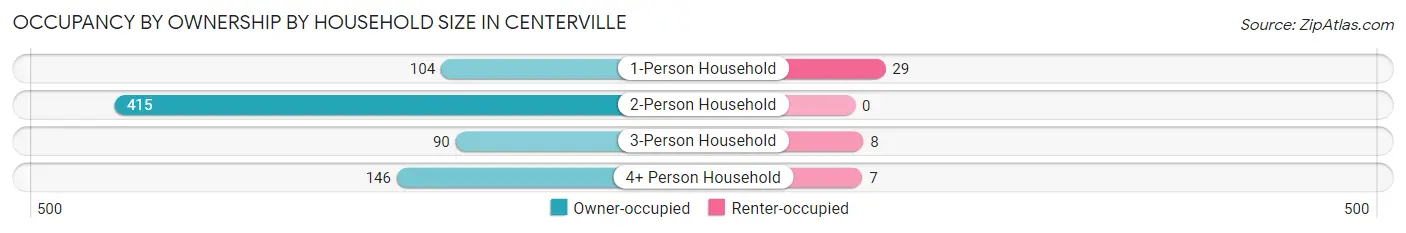
| Household Size | Owner-occupied | Renter-occupied |
| 1-Person Household | 104 (78.2%) | 29 (21.8%) |
| 2-Person Household | 415 (100.0%) | 0 (0.0%) |
| 3-Person Household | 90 (91.8%) | 8 (8.2%) |
| 4+ Person Household | 146 (95.4%) | 7 (4.6%) |
| Total Housing Units | 755 (94.5%) | 44 (5.5%) |
Occupancy by Educational Attainment in Centerville
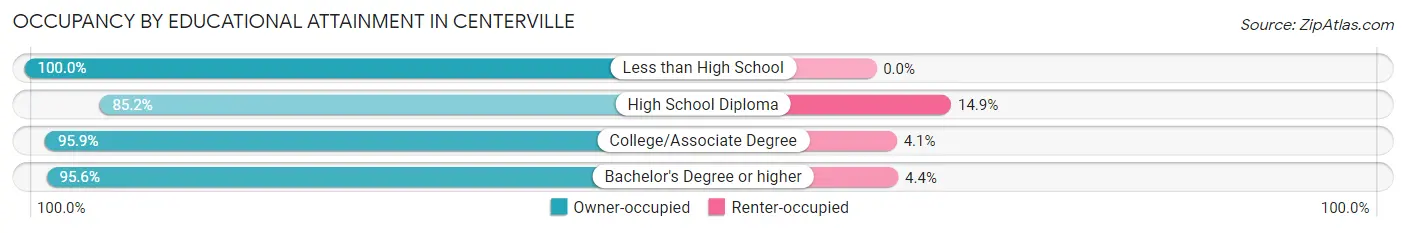
| Household Size | Owner-occupied | Renter-occupied |
| Less than High School | 7 (100.0%) | 0 (0.0%) |
| High School Diploma | 86 (85.2%) | 15 (14.8%) |
| College/Associate Degree | 377 (95.9%) | 16 (4.1%) |
| Bachelor's Degree or higher | 285 (95.6%) | 13 (4.4%) |
Occupancy by Age of Householder in Centerville
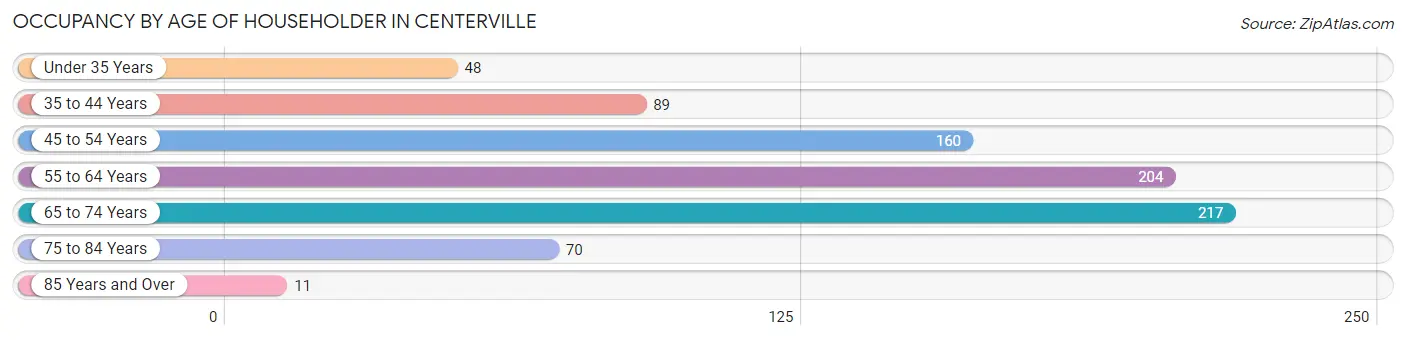
| Age Bracket | # Households | % Households |
| Under 35 Years | 48 | 6.0% |
| 35 to 44 Years | 89 | 11.1% |
| 45 to 54 Years | 160 | 20.0% |
| 55 to 64 Years | 204 | 25.5% |
| 65 to 74 Years | 217 | 27.2% |
| 75 to 84 Years | 70 | 8.8% |
| 85 Years and Over | 11 | 1.4% |
| Total | 799 | 100.0% |
Housing Finances in Centerville
Median Income by Occupancy in Centerville
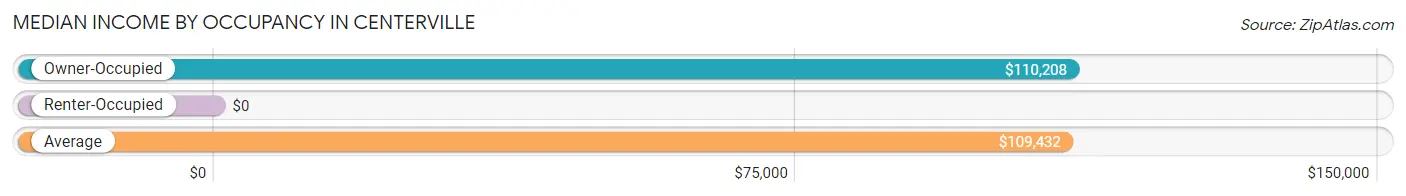
| Occupancy Type | # Households | Median Income |
| Owner-Occupied | 755 (94.5%) | $110,208 |
| Renter-Occupied | 44 (5.5%) | $0 |
| Average | 799 (100.0%) | $109,432 |
Occupancy by Householder Income Bracket in Centerville
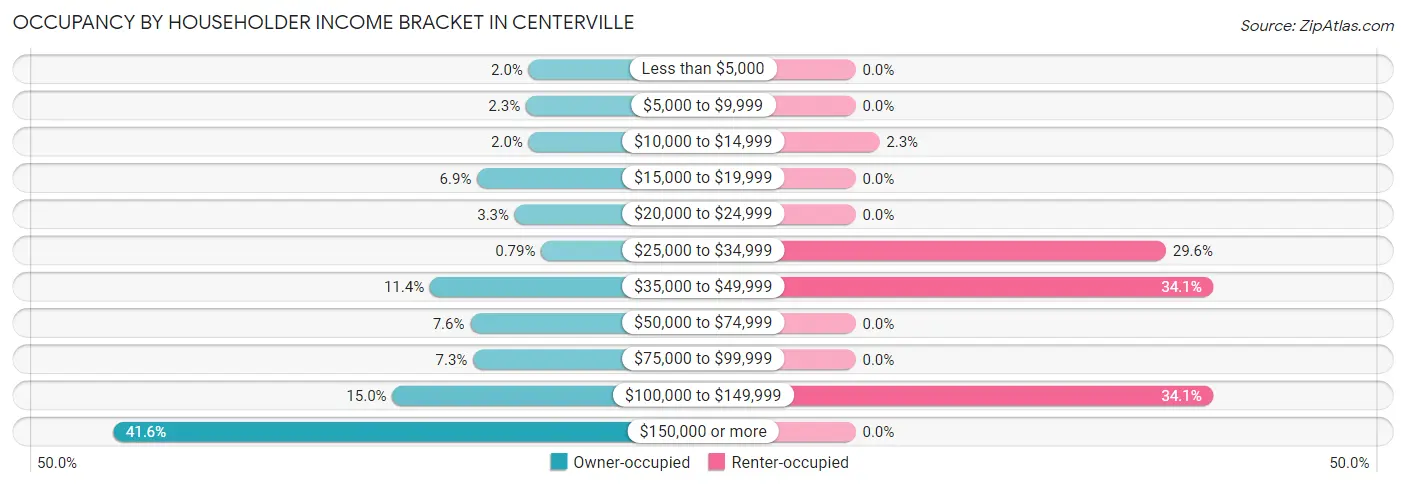
| Income Bracket | Owner-occupied | Renter-occupied |
| Less than $5,000 | 15 (2.0%) | 0 (0.0%) |
| $5,000 to $9,999 | 17 (2.2%) | 0 (0.0%) |
| $10,000 to $14,999 | 15 (2.0%) | 1 (2.3%) |
| $15,000 to $19,999 | 52 (6.9%) | 0 (0.0%) |
| $20,000 to $24,999 | 25 (3.3%) | 0 (0.0%) |
| $25,000 to $34,999 | 6 (0.8%) | 13 (29.5%) |
| $35,000 to $49,999 | 86 (11.4%) | 15 (34.1%) |
| $50,000 to $74,999 | 57 (7.5%) | 0 (0.0%) |
| $75,000 to $99,999 | 55 (7.3%) | 0 (0.0%) |
| $100,000 to $149,999 | 113 (15.0%) | 15 (34.1%) |
| $150,000 or more | 314 (41.6%) | 0 (0.0%) |
| Total | 755 (100.0%) | 44 (100.0%) |
Monthly Housing Cost Tiers in Centerville
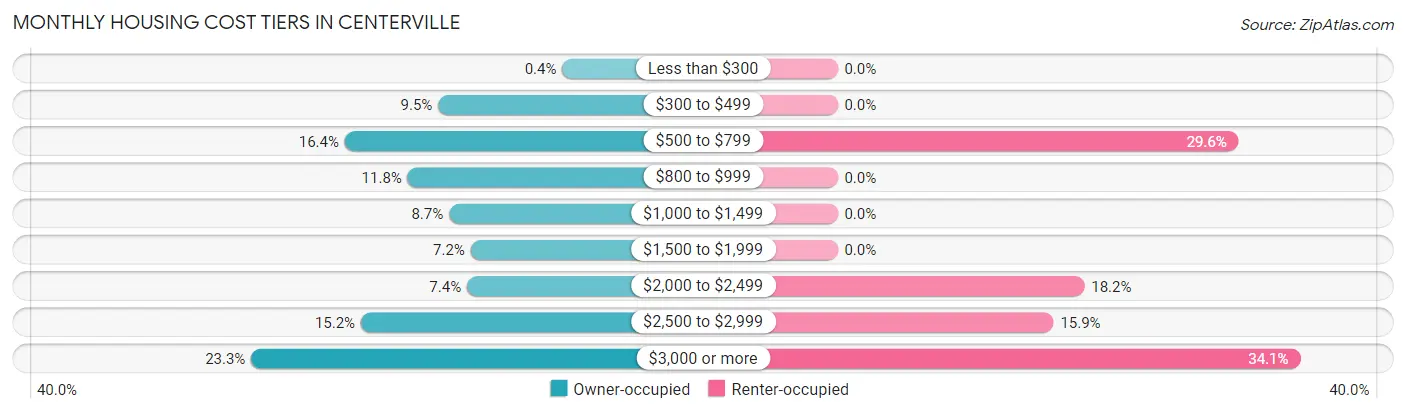
| Monthly Cost | Owner-occupied | Renter-occupied |
| Less than $300 | 3 (0.4%) | 0 (0.0%) |
| $300 to $499 | 72 (9.5%) | 0 (0.0%) |
| $500 to $799 | 124 (16.4%) | 13 (29.5%) |
| $800 to $999 | 89 (11.8%) | 0 (0.0%) |
| $1,000 to $1,499 | 66 (8.7%) | 0 (0.0%) |
| $1,500 to $1,999 | 54 (7.1%) | 0 (0.0%) |
| $2,000 to $2,499 | 56 (7.4%) | 8 (18.2%) |
| $2,500 to $2,999 | 115 (15.2%) | 7 (15.9%) |
| $3,000 or more | 176 (23.3%) | 15 (34.1%) |
| Total | 755 (100.0%) | 44 (100.0%) |
Physical Housing Characteristics in Centerville
Housing Structures in Centerville
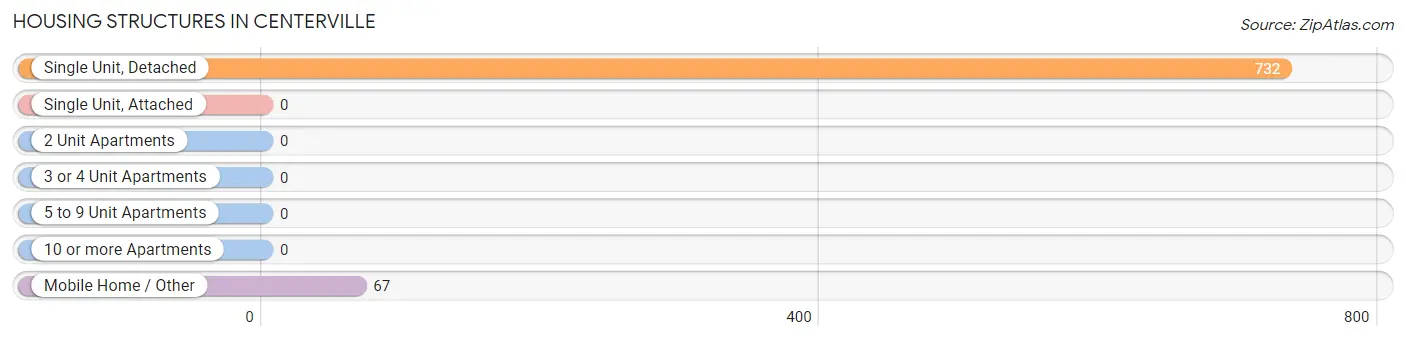
| Structure Type | # Housing Units | % Housing Units |
| Single Unit, Detached | 732 | 91.6% |
| Single Unit, Attached | 0 | 0.0% |
| 2 Unit Apartments | 0 | 0.0% |
| 3 or 4 Unit Apartments | 0 | 0.0% |
| 5 to 9 Unit Apartments | 0 | 0.0% |
| 10 or more Apartments | 0 | 0.0% |
| Mobile Home / Other | 67 | 8.4% |
| Total | 799 | 100.0% |
Housing Structures by Occupancy in Centerville
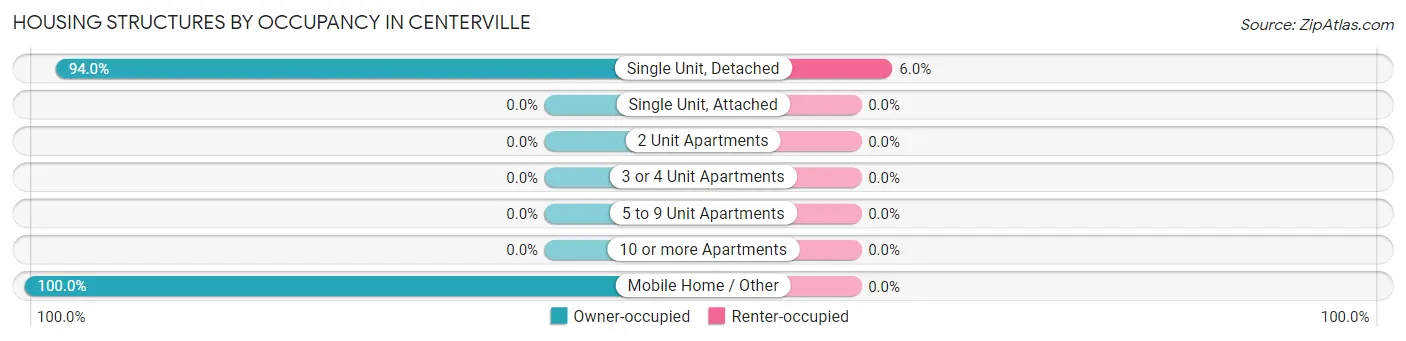
| Structure Type | Owner-occupied | Renter-occupied |
| Single Unit, Detached | 688 (94.0%) | 44 (6.0%) |
| Single Unit, Attached | 0 (0.0%) | 0 (0.0%) |
| 2 Unit Apartments | 0 (0.0%) | 0 (0.0%) |
| 3 or 4 Unit Apartments | 0 (0.0%) | 0 (0.0%) |
| 5 to 9 Unit Apartments | 0 (0.0%) | 0 (0.0%) |
| 10 or more Apartments | 0 (0.0%) | 0 (0.0%) |
| Mobile Home / Other | 67 (100.0%) | 0 (0.0%) |
| Total | 755 (94.5%) | 44 (5.5%) |
Housing Structures by Number of Rooms in Centerville
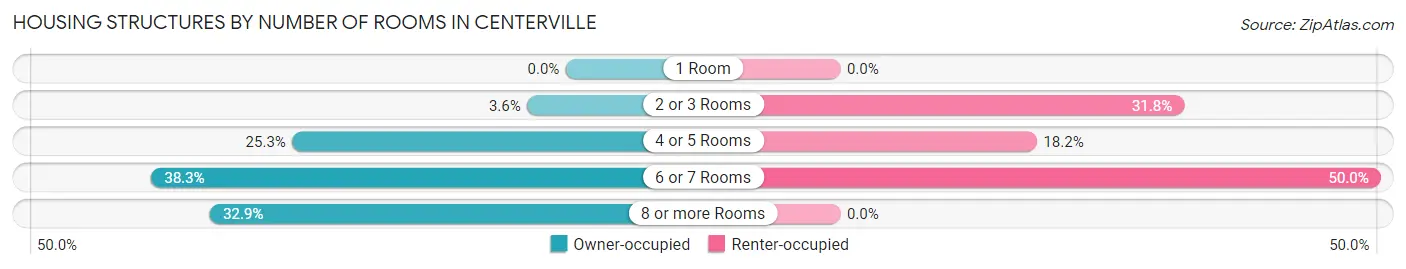
| Number of Rooms | Owner-occupied | Renter-occupied |
| 1 Room | 0 (0.0%) | 0 (0.0%) |
| 2 or 3 Rooms | 27 (3.6%) | 14 (31.8%) |
| 4 or 5 Rooms | 191 (25.3%) | 8 (18.2%) |
| 6 or 7 Rooms | 289 (38.3%) | 22 (50.0%) |
| 8 or more Rooms | 248 (32.9%) | 0 (0.0%) |
| Total | 755 (100.0%) | 44 (100.0%) |
Housing Structure by Heating Type in Centerville
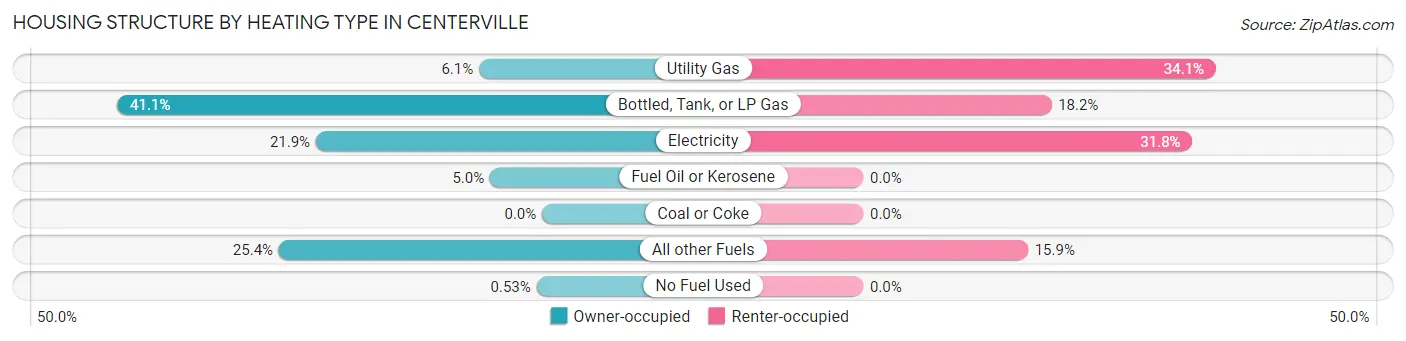
| Heating Type | Owner-occupied | Renter-occupied |
| Utility Gas | 46 (6.1%) | 15 (34.1%) |
| Bottled, Tank, or LP Gas | 310 (41.1%) | 8 (18.2%) |
| Electricity | 165 (21.8%) | 14 (31.8%) |
| Fuel Oil or Kerosene | 38 (5.0%) | 0 (0.0%) |
| Coal or Coke | 0 (0.0%) | 0 (0.0%) |
| All other Fuels | 192 (25.4%) | 7 (15.9%) |
| No Fuel Used | 4 (0.5%) | 0 (0.0%) |
| Total | 755 (100.0%) | 44 (100.0%) |
Household Vehicle Usage in Centerville
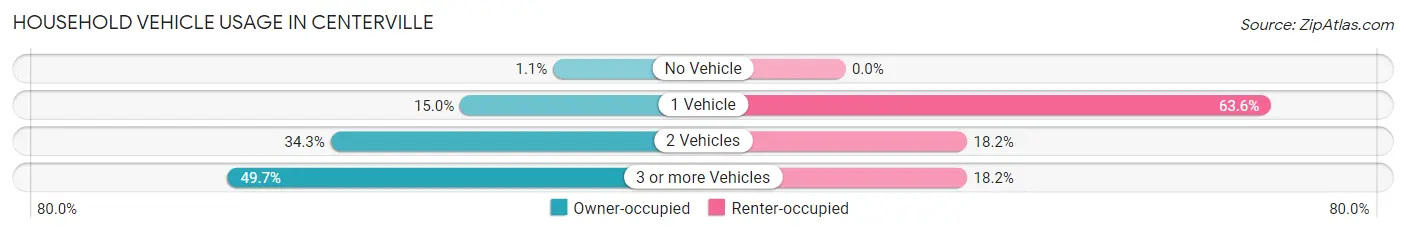
| Vehicles per Household | Owner-occupied | Renter-occupied |
| No Vehicle | 8 (1.1%) | 0 (0.0%) |
| 1 Vehicle | 113 (15.0%) | 28 (63.6%) |
| 2 Vehicles | 259 (34.3%) | 8 (18.2%) |
| 3 or more Vehicles | 375 (49.7%) | 8 (18.2%) |
| Total | 755 (100.0%) | 44 (100.0%) |
Real Estate & Mortgages in Centerville
Real Estate and Mortgage Overview in Centerville
| Characteristic | Without Mortgage | With Mortgage |
| Housing Units | 348 | 407 |
| Median Property Value | $426,000 | $589,600 |
| Median Household Income | $68,846 | $237 |
| Monthly Housing Costs | $742 | $176 |
| Real Estate Taxes | $2,171 | $0 |
Property Value by Mortgage Status in Centerville
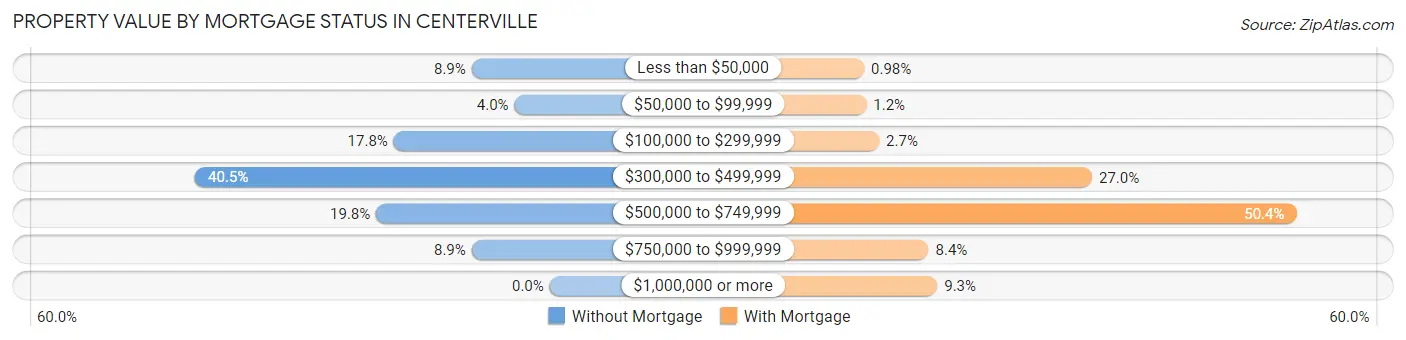
| Property Value | Without Mortgage | With Mortgage |
| Less than $50,000 | 31 (8.9%) | 4 (1.0%) |
| $50,000 to $99,999 | 14 (4.0%) | 5 (1.2%) |
| $100,000 to $299,999 | 62 (17.8%) | 11 (2.7%) |
| $300,000 to $499,999 | 141 (40.5%) | 110 (27.0%) |
| $500,000 to $749,999 | 69 (19.8%) | 205 (50.4%) |
| $750,000 to $999,999 | 31 (8.9%) | 34 (8.4%) |
| $1,000,000 or more | 0 (0.0%) | 38 (9.3%) |
| Total | 348 (100.0%) | 407 (100.0%) |
Household Income by Mortgage Status in Centerville
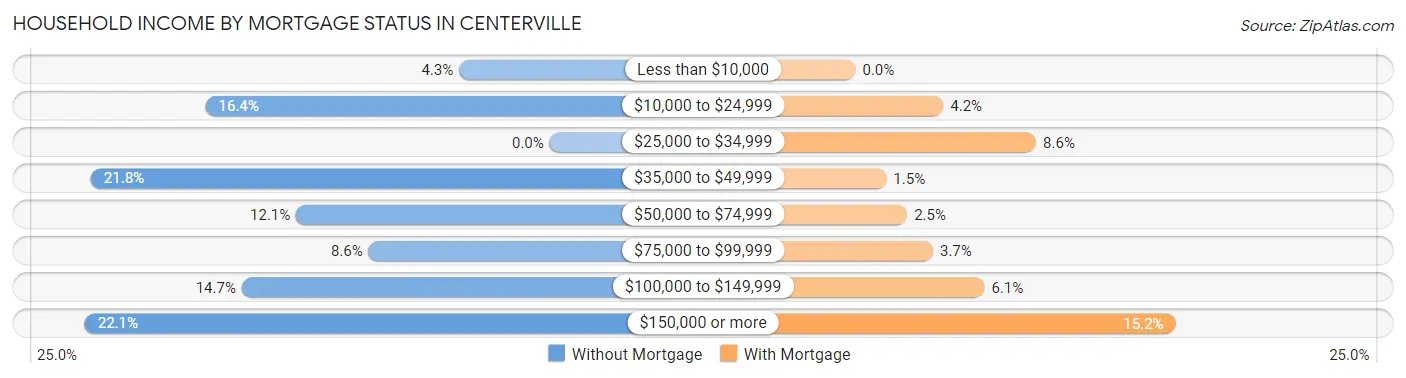
| Household Income | Without Mortgage | With Mortgage |
| Less than $10,000 | 15 (4.3%) | 0 (0.0%) |
| $10,000 to $24,999 | 57 (16.4%) | 17 (4.2%) |
| $25,000 to $34,999 | 0 (0.0%) | 35 (8.6%) |
| $35,000 to $49,999 | 76 (21.8%) | 6 (1.5%) |
| $50,000 to $74,999 | 42 (12.1%) | 10 (2.5%) |
| $75,000 to $99,999 | 30 (8.6%) | 15 (3.7%) |
| $100,000 to $149,999 | 51 (14.7%) | 25 (6.1%) |
| $150,000 or more | 77 (22.1%) | 62 (15.2%) |
| Total | 348 (100.0%) | 407 (100.0%) |
Property Value to Household Income Ratio in Centerville
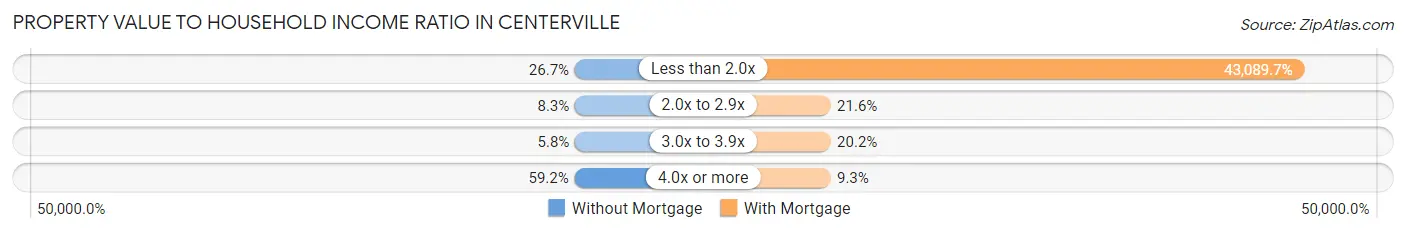
| Value-to-Income Ratio | Without Mortgage | With Mortgage |
| Less than 2.0x | 93 (26.7%) | 175,375 (43,089.7%) |
| 2.0x to 2.9x | 29 (8.3%) | 88 (21.6%) |
| 3.0x to 3.9x | 20 (5.8%) | 82 (20.2%) |
| 4.0x or more | 206 (59.2%) | 38 (9.3%) |
| Total | 348 (100.0%) | 407 (100.0%) |
Real Estate Taxes by Mortgage Status in Centerville

| Property Taxes | Without Mortgage | With Mortgage |
| Less than $800 | 13 (3.7%) | 0 (0.0%) |
| $800 to $1,499 | 55 (15.8%) | 4 (1.0%) |
| $800 to $1,499 | 254 (73.0%) | 16 (3.9%) |
| Total | 348 (100.0%) | 407 (100.0%) |
Health & Disability in Centerville
Health Insurance Coverage by Age in Centerville
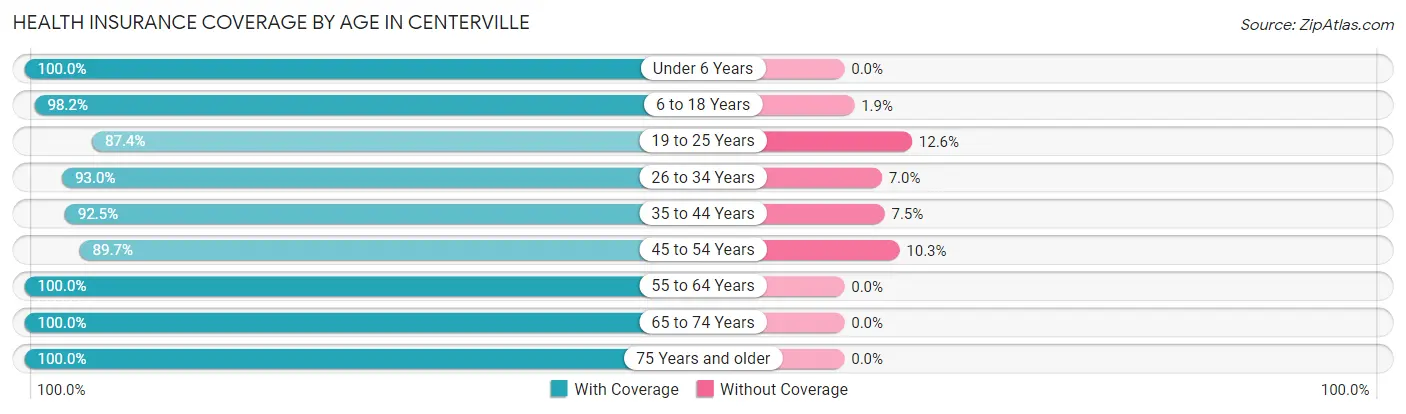
| Age Bracket | With Coverage | Without Coverage |
| Under 6 Years | 149 (100.0%) | 0 (0.0%) |
| 6 to 18 Years | 372 (98.2%) | 7 (1.8%) |
| 19 to 25 Years | 111 (87.4%) | 16 (12.6%) |
| 26 to 34 Years | 120 (93.0%) | 9 (7.0%) |
| 35 to 44 Years | 160 (92.5%) | 13 (7.5%) |
| 45 to 54 Years | 262 (89.7%) | 30 (10.3%) |
| 55 to 64 Years | 419 (100.0%) | 0 (0.0%) |
| 65 to 74 Years | 337 (100.0%) | 0 (0.0%) |
| 75 Years and older | 199 (100.0%) | 0 (0.0%) |
| Total | 2,129 (96.6%) | 75 (3.4%) |
Health Insurance Coverage by Citizenship Status in Centerville

| Citizenship Status | With Coverage | Without Coverage |
| Native Born | 149 (100.0%) | 0 (0.0%) |
| Foreign Born, Citizen | 372 (98.2%) | 7 (1.8%) |
| Foreign Born, not a Citizen | 111 (87.4%) | 16 (12.6%) |
Health Insurance Coverage by Household Income in Centerville
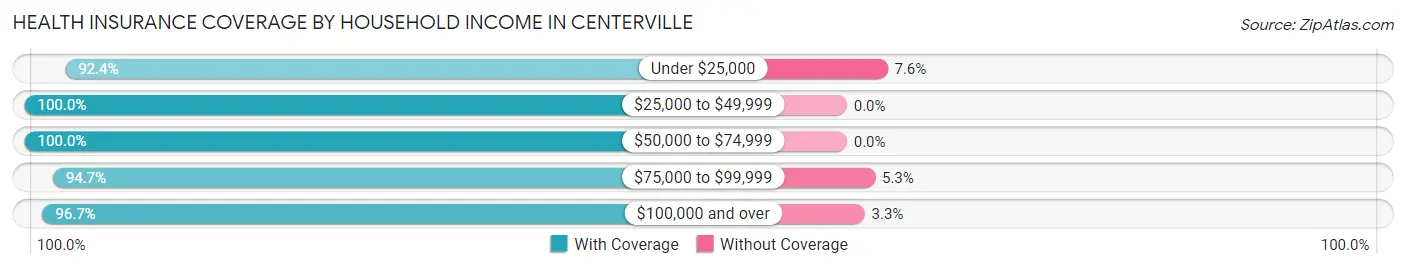
| Household Income | With Coverage | Without Coverage |
| Under $25,000 | 194 (92.4%) | 16 (7.6%) |
| $25,000 to $49,999 | 207 (100.0%) | 0 (0.0%) |
| $50,000 to $74,999 | 120 (100.0%) | 0 (0.0%) |
| $75,000 to $99,999 | 161 (94.7%) | 9 (5.3%) |
| $100,000 and over | 1,447 (96.7%) | 50 (3.3%) |
Public vs Private Health Insurance Coverage by Age in Centerville
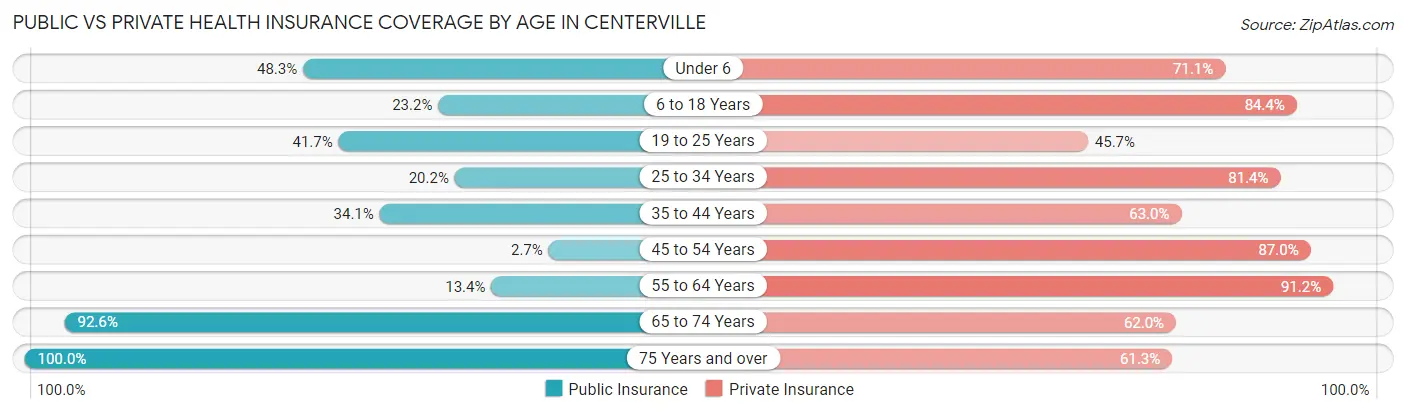
| Age Bracket | Public Insurance | Private Insurance |
| Under 6 | 72 (48.3%) | 106 (71.1%) |
| 6 to 18 Years | 88 (23.2%) | 320 (84.4%) |
| 19 to 25 Years | 53 (41.7%) | 58 (45.7%) |
| 25 to 34 Years | 26 (20.2%) | 105 (81.4%) |
| 35 to 44 Years | 59 (34.1%) | 109 (63.0%) |
| 45 to 54 Years | 8 (2.7%) | 254 (87.0%) |
| 55 to 64 Years | 56 (13.4%) | 382 (91.2%) |
| 65 to 74 Years | 312 (92.6%) | 209 (62.0%) |
| 75 Years and over | 199 (100.0%) | 122 (61.3%) |
| Total | 873 (39.6%) | 1,665 (75.5%) |
Disability Status by Sex by Age in Centerville
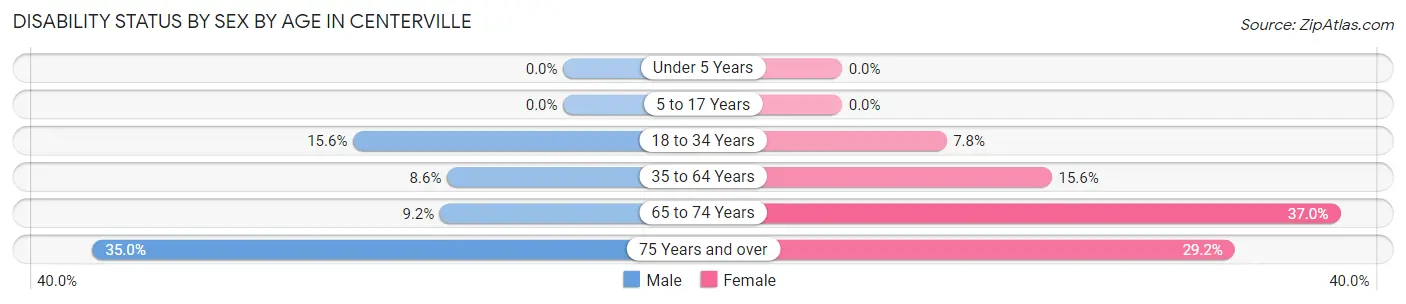
| Age Bracket | Male | Female |
| Under 5 Years | 0 (0.0%) | 0 (0.0%) |
| 5 to 17 Years | 0 (0.0%) | 0 (0.0%) |
| 18 to 34 Years | 22 (15.6%) | 10 (7.7%) |
| 35 to 64 Years | 33 (8.6%) | 78 (15.6%) |
| 65 to 74 Years | 15 (9.1%) | 64 (37.0%) |
| 75 Years and over | 36 (34.9%) | 28 (29.2%) |
Disability Class by Sex by Age in Centerville
Disability Class: Hearing Difficulty
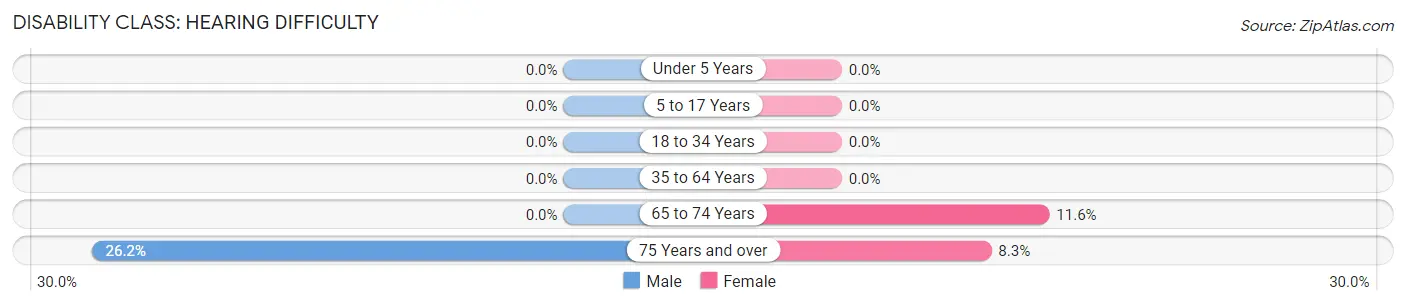
| Age Bracket | Male | Female |
| Under 5 Years | 0 (0.0%) | 0 (0.0%) |
| 5 to 17 Years | 0 (0.0%) | 0 (0.0%) |
| 18 to 34 Years | 0 (0.0%) | 0 (0.0%) |
| 35 to 64 Years | 0 (0.0%) | 0 (0.0%) |
| 65 to 74 Years | 0 (0.0%) | 20 (11.6%) |
| 75 Years and over | 27 (26.2%) | 8 (8.3%) |
Disability Class: Vision Difficulty
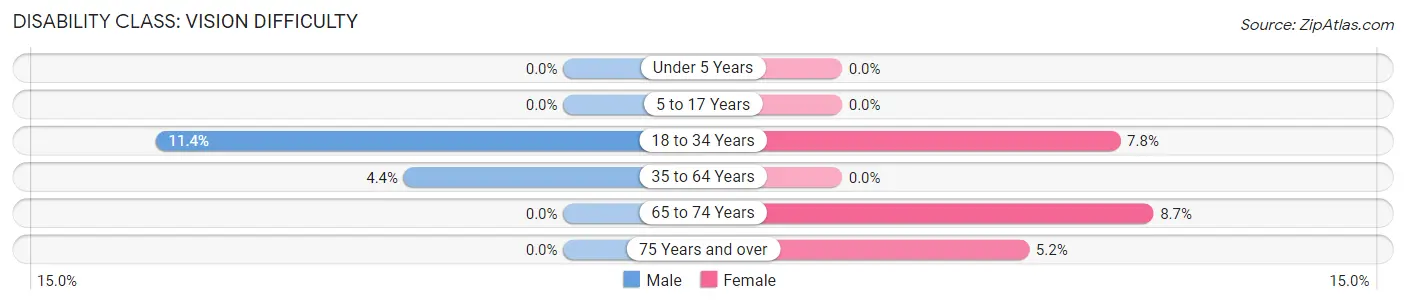
| Age Bracket | Male | Female |
| Under 5 Years | 0 (0.0%) | 0 (0.0%) |
| 5 to 17 Years | 0 (0.0%) | 0 (0.0%) |
| 18 to 34 Years | 16 (11.4%) | 10 (7.7%) |
| 35 to 64 Years | 17 (4.4%) | 0 (0.0%) |
| 65 to 74 Years | 0 (0.0%) | 15 (8.7%) |
| 75 Years and over | 0 (0.0%) | 5 (5.2%) |
Disability Class: Cognitive Difficulty
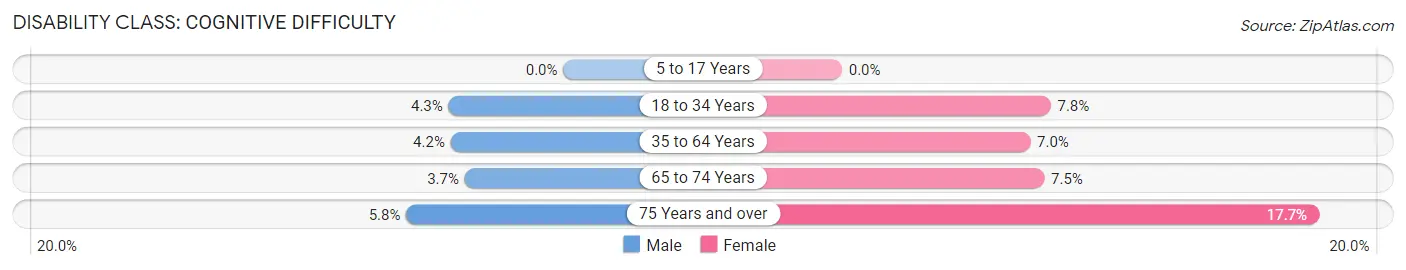
| Age Bracket | Male | Female |
| 5 to 17 Years | 0 (0.0%) | 0 (0.0%) |
| 18 to 34 Years | 6 (4.3%) | 10 (7.7%) |
| 35 to 64 Years | 16 (4.2%) | 35 (7.0%) |
| 65 to 74 Years | 6 (3.7%) | 13 (7.5%) |
| 75 Years and over | 6 (5.8%) | 17 (17.7%) |
Disability Class: Ambulatory Difficulty
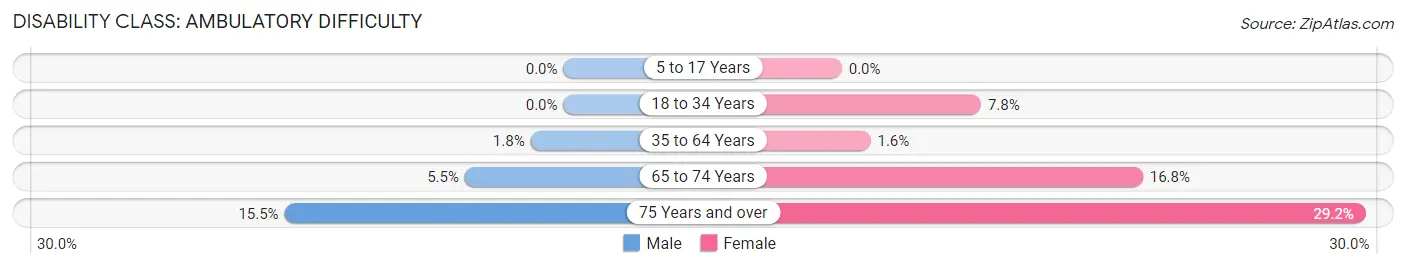
| Age Bracket | Male | Female |
| 5 to 17 Years | 0 (0.0%) | 0 (0.0%) |
| 18 to 34 Years | 0 (0.0%) | 10 (7.7%) |
| 35 to 64 Years | 7 (1.8%) | 8 (1.6%) |
| 65 to 74 Years | 9 (5.5%) | 29 (16.8%) |
| 75 Years and over | 16 (15.5%) | 28 (29.2%) |
Disability Class: Self-Care Difficulty
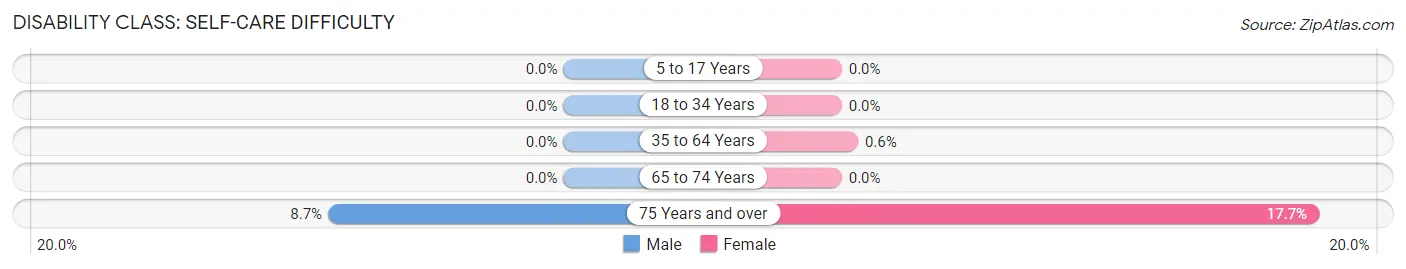
| Age Bracket | Male | Female |
| 5 to 17 Years | 0 (0.0%) | 0 (0.0%) |
| 18 to 34 Years | 0 (0.0%) | 0 (0.0%) |
| 35 to 64 Years | 0 (0.0%) | 3 (0.6%) |
| 65 to 74 Years | 0 (0.0%) | 0 (0.0%) |
| 75 Years and over | 9 (8.7%) | 17 (17.7%) |
Technology Access in Centerville
Computing Device Access in Centerville
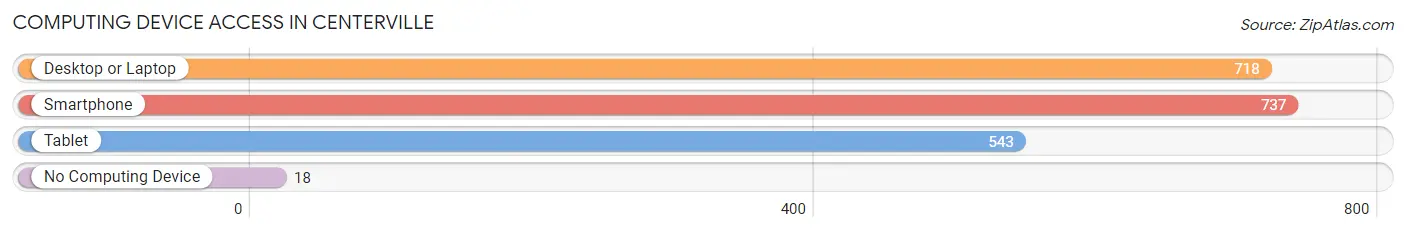
| Device Type | # Households | % Households |
| Desktop or Laptop | 718 | 89.9% |
| Smartphone | 737 | 92.2% |
| Tablet | 543 | 68.0% |
| No Computing Device | 18 | 2.2% |
| Total | 799 | 100.0% |
Internet Access in Centerville
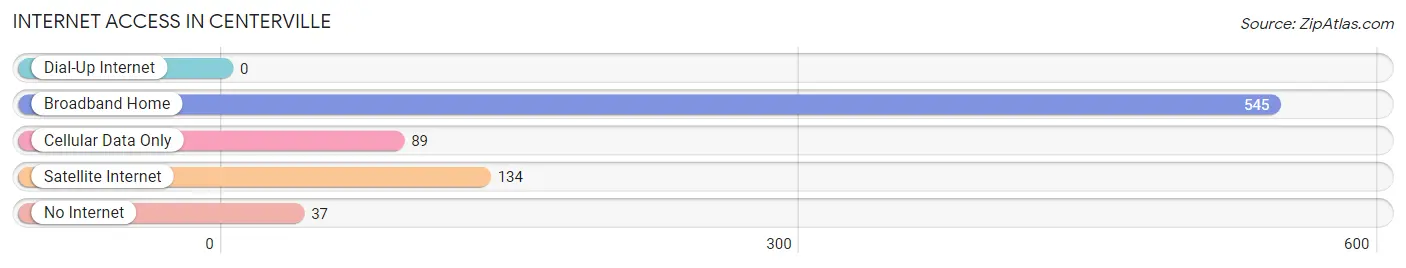
| Internet Type | # Households | % Households |
| Dial-Up Internet | 0 | 0.0% |
| Broadband Home | 545 | 68.2% |
| Cellular Data Only | 89 | 11.1% |
| Satellite Internet | 134 | 16.8% |
| No Internet | 37 | 4.6% |
| Total | 799 | 100.0% |
Centerville Summary
Centerville is a small unincorporated community located in the foothills of the Sierra Nevada Mountains in El Dorado County, California. It is situated in the Sierra Nevada foothills, approximately 25 miles east of Placerville and 40 miles northeast of Sacramento. The population of Centerville was estimated to be around 1,000 in 2020.
History
Centerville was founded in 1849 by a group of miners who were searching for gold in the area. The town was originally called “Centerville” because it was located at the center of the mining district. The town quickly grew and by 1851, it had a population of over 500 people.
In 1852, the town was renamed “Diamond Springs” after the nearby Diamond Springs Hotel. The hotel was a popular destination for travelers and miners, and it was the first hotel in the area.
In 1854, the town was renamed again to “Centerville” after the nearby Centerville Creek. The creek was named after the town’s founder, John Centerville.
In the late 1800s, Centerville was a bustling town with a population of over 1,000 people. It had several stores, a post office, a school, and a hotel. The town was also home to several churches, including the Centerville Methodist Church, which was founded in 1854.
In the early 1900s, the town began to decline as the gold rush ended and the population decreased. By the 1950s, the population had dropped to around 500 people.
Geography
Centerville is located in the Sierra Nevada foothills, approximately 25 miles east of Placerville and 40 miles northeast of Sacramento. The town is situated at an elevation of 2,400 feet and is surrounded by rolling hills and oak trees.
The climate in Centerville is mild and dry, with hot summers and cold winters. The average temperature in the summer is around 80 degrees Fahrenheit, and the average temperature in the winter is around 40 degrees Fahrenheit.
Economy
The economy of Centerville is largely based on tourism and agriculture. The town is home to several wineries, and it is a popular destination for wine tasting and outdoor activities.
The town is also home to several small businesses, including restaurants, shops, and art galleries. The town is also home to several bed and breakfasts, which attract visitors from all over the world.
Demographics
The population of Centerville was estimated to be around 1,000 in 2020. The town is predominantly white, with a small Hispanic population. The median household income in Centerville is around $50,000, and the median home value is around $400,000.
The town is served by the El Dorado County School District, which includes several elementary schools, a middle school, and a high school. The town is also home to several private schools, including the Centerville Christian Academy.
Conclusion
Centerville is a small unincorporated community located in the foothills of the Sierra Nevada Mountains in El Dorado County, California. It was founded in 1849 by a group of miners who were searching for gold in the area. The town has a population of around 1,000 people and is largely based on tourism and agriculture. The town is predominantly white, with a small Hispanic population, and the median household income is around $50,000. Centerville is served by the El Dorado County School District and is home to several wineries, restaurants, shops, and art galleries.
Common Questions
What is the Total Population of Centerville?
Total Population of Centerville is 2,204.
What is the Total Male Population of Centerville?
Total Male Population of Centerville is 1,067.
What is the Total Female Population of Centerville?
Total Female Population of Centerville is 1,137.
What is the Ratio of Males per 100 Females in Centerville?
There are 93.84 Males per 100 Females in Centerville.
What is the Ratio of Females per 100 Males in Centerville?
There are 106.56 Females per 100 Males in Centerville.
What is the Median Population Age in Centerville?
Median Population Age in Centerville is 48.9 Years.
What is the Average Family Size in Centerville
Average Family Size in Centerville is 3.2 People.
What is the Average Household Size in Centerville
Average Household Size in Centerville is 2.8 People.
What is Per Capita Income in Centerville?
Per Capita income in Centerville is $55,197.
What is the Median Family Income in Centerville?
Median Family Income in Centerville is $137,109.
What is the Median Household income in Centerville?
Median Household Income in Centerville is $109,432.
What is Income or Wage Gap in Centerville?
Income or Wage Gap in Centerville is 24.6%.
Women in Centerville earn 75.4 cents for every dollar earned by a man.
What is Inequality or Gini Index in Centerville?
Inequality or Gini Index in Centerville is 0.48.
How Large is the Labor Force in Centerville?
There are 872 People in the Labor Forcein in Centerville.
What is the Percentage of People in the Labor Force in Centerville?
50.6% of People are in the Labor Force in Centerville.
What is the Unemployment Rate in Centerville?
Unemployment Rate in Centerville is 3.0%.