Canyon Lake, CA
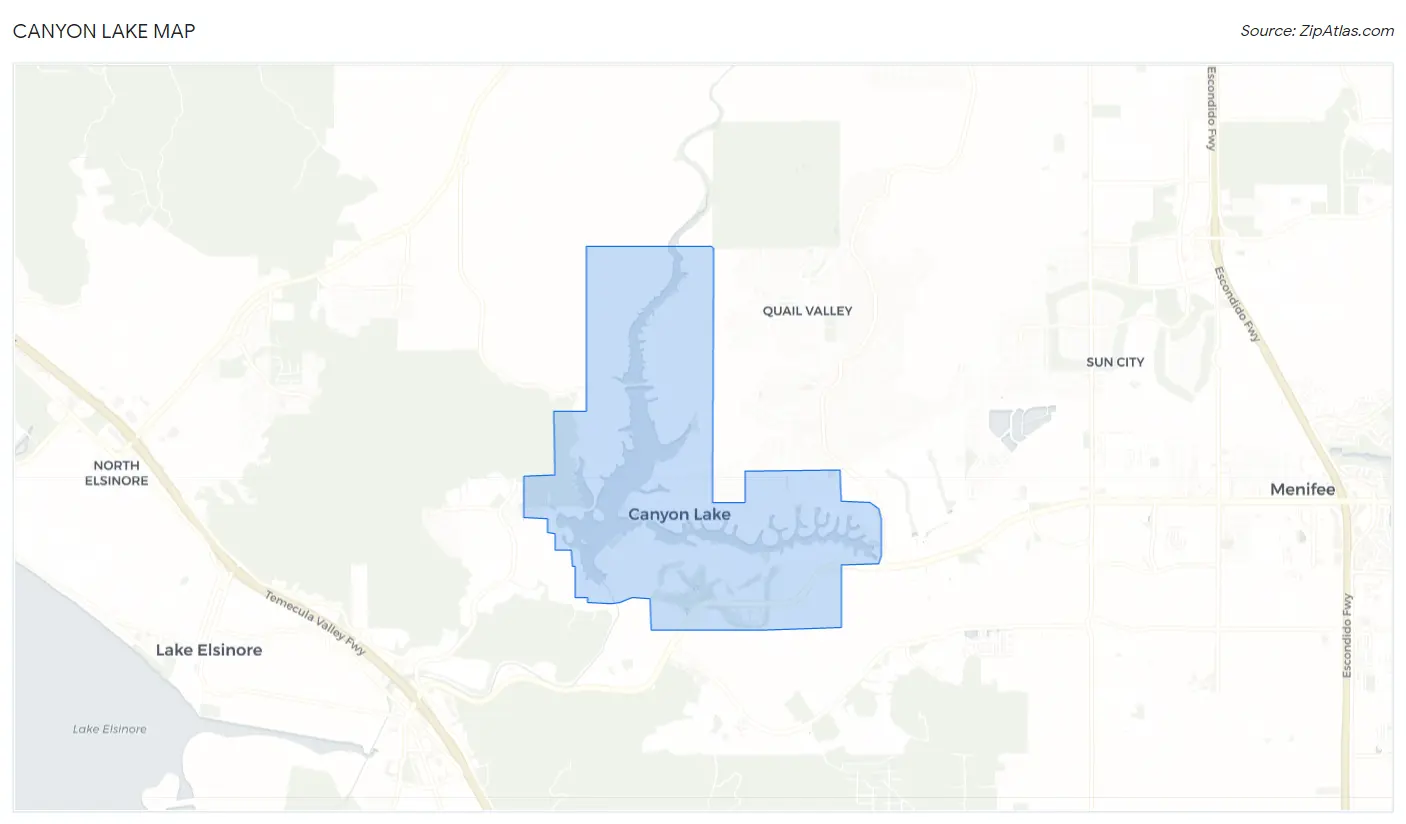
Canyon Lake Map
Canyon Lake Overview
11,108
TOTAL POPULATION
5,460
MALE POPULATION
5,648
FEMALE POPULATION
96.67
MALES / 100 FEMALES
103.44
FEMALES / 100 MALES
45.0
MEDIAN AGE
3.1
AVG FAMILY SIZE
2.7
AVG HOUSEHOLD SIZE
$58,583
PER CAPITA INCOME
$132,275
AVG FAMILY INCOME
$120,938
AVG HOUSEHOLD INCOME
35.8%
WAGE / INCOME GAP [ % ]
64.2¢/ $1
WAGE / INCOME GAP [ $ ]
0.46
INEQUALITY / GINI INDEX
5,279
LABOR FORCE [ PEOPLE ]
59.2%
PERCENT IN LABOR FORCE
3.7%
UNEMPLOYMENT RATE
Canyon Lake Area Codes
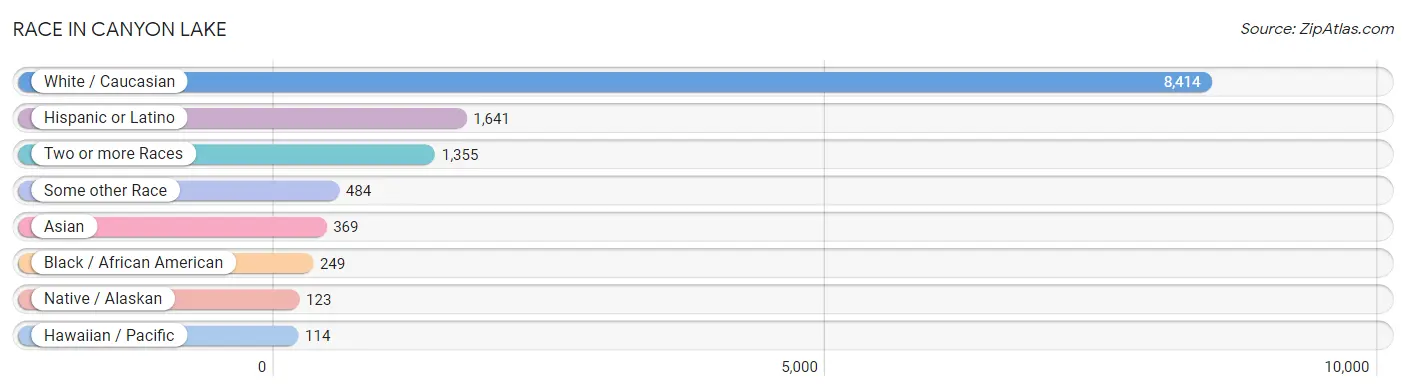
Race in Canyon Lake
The most populous races in Canyon Lake are White / Caucasian (8,414 | 75.7%), Hispanic or Latino (1,641 | 14.8%), and Two or more Races (1,355 | 12.2%).
| Race | # Population | % Population |
| Asian | 369 | 3.3% |
| Black / African American | 249 | 2.2% |
| Hawaiian / Pacific | 114 | 1.0% |
| Hispanic or Latino | 1,641 | 14.8% |
| Native / Alaskan | 123 | 1.1% |
| White / Caucasian | 8,414 | 75.7% |
| Two or more Races | 1,355 | 12.2% |
| Some other Race | 484 | 4.4% |
| Total | 11,108 | 100.0% |
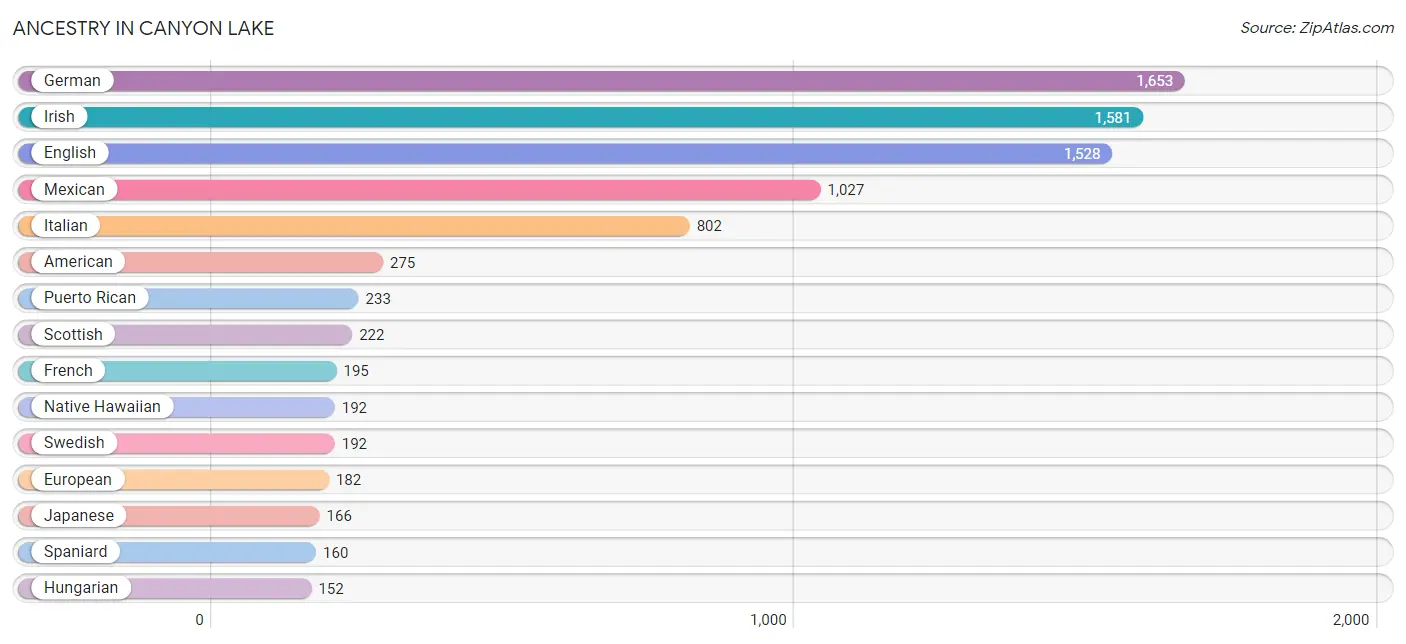
Ancestry in Canyon Lake
The most populous ancestries reported in Canyon Lake are German (1,653 | 14.9%), Irish (1,581 | 14.2%), English (1,528 | 13.8%), Mexican (1,027 | 9.2%), and Italian (802 | 7.2%), together accounting for 59.3% of all Canyon Lake residents.
| Ancestry | # Population | % Population |
| American | 275 | 2.5% |
| Arab | 40 | 0.4% |
| Armenian | 18 | 0.2% |
| Austrian | 63 | 0.6% |
| Basque | 20 | 0.2% |
| Belgian | 10 | 0.1% |
| Bhutanese | 117 | 1.1% |
| Brazilian | 55 | 0.5% |
| British | 118 | 1.1% |
| Burmese | 128 | 1.1% |
| Canadian | 32 | 0.3% |
| Central American | 49 | 0.4% |
| Cherokee | 121 | 1.1% |
| Chippewa | 17 | 0.2% |
| Comanche | 1 | 0.0% |
| Croatian | 18 | 0.2% |
| Cuban | 41 | 0.4% |
| Czech | 12 | 0.1% |
| Danish | 52 | 0.5% |
| Dutch | 109 | 1.0% |
| Eastern European | 8 | 0.1% |
| English | 1,528 | 13.8% |
| European | 182 | 1.6% |
| French | 195 | 1.8% |
| French Canadian | 33 | 0.3% |
| German | 1,653 | 14.9% |
| Greek | 38 | 0.3% |
| Guamanian / Chamorro | 114 | 1.0% |
| Hungarian | 152 | 1.4% |
| Indian (Asian) | 49 | 0.4% |
| Irish | 1,581 | 14.2% |
| Italian | 802 | 7.2% |
| Japanese | 166 | 1.5% |
| Korean | 121 | 1.1% |
| Laotian | 10 | 0.1% |
| Latvian | 11 | 0.1% |
| Lebanese | 40 | 0.4% |
| Lithuanian | 15 | 0.1% |
| Malaysian | 54 | 0.5% |
| Mexican | 1,027 | 9.2% |
| Native Hawaiian | 192 | 1.7% |
| Nicaraguan | 9 | 0.1% |
| Northern European | 94 | 0.9% |
| Norwegian | 126 | 1.1% |
| Polish | 97 | 0.9% |
| Portuguese | 83 | 0.7% |
| Puerto Rican | 233 | 2.1% |
| Russian | 78 | 0.7% |
| Salvadoran | 10 | 0.1% |
| Scandinavian | 47 | 0.4% |
| Scotch-Irish | 126 | 1.1% |
| Scottish | 222 | 2.0% |
| Slovak | 27 | 0.2% |
| Spaniard | 160 | 1.4% |
| Spanish | 13 | 0.1% |
| Swedish | 192 | 1.7% |
| Swiss | 9 | 0.1% |
| Thai | 32 | 0.3% |
| Welsh | 54 | 0.5% |
| Yugoslavian | 34 | 0.3% | View All 60 Rows |
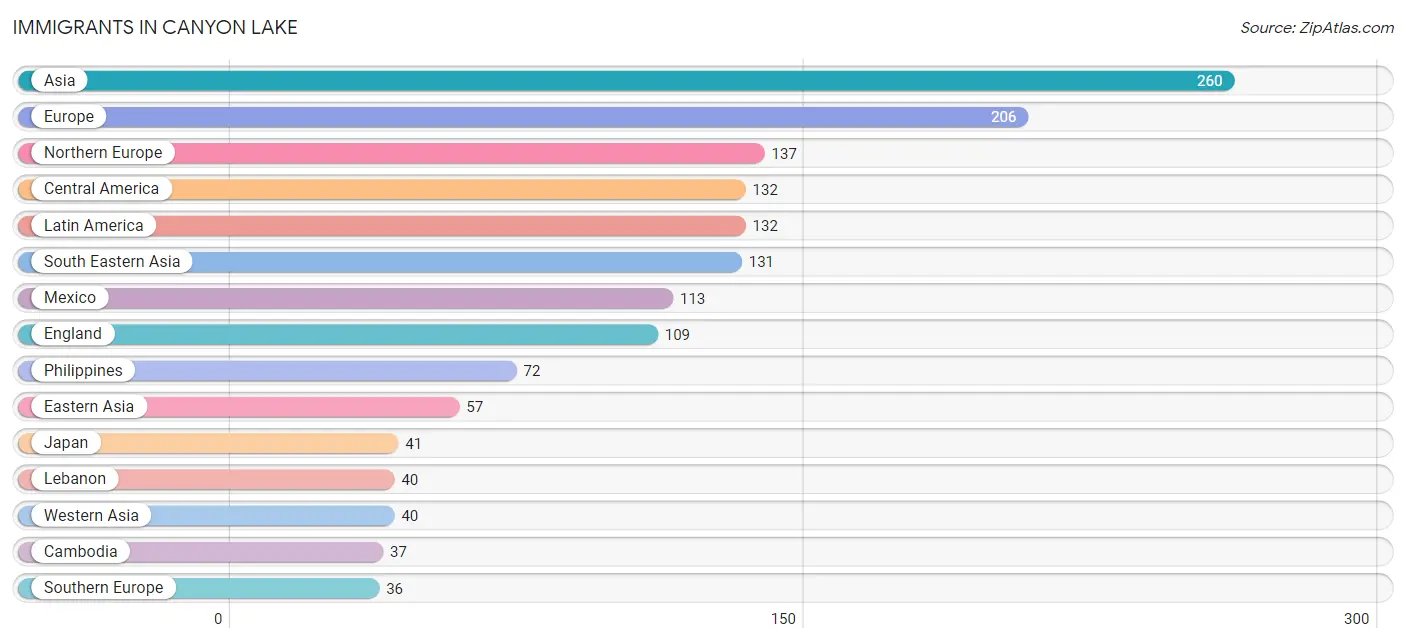
Immigrants in Canyon Lake
The most numerous immigrant groups reported in Canyon Lake came from Asia (260 | 2.3%), Europe (206 | 1.8%), Northern Europe (137 | 1.2%), Central America (132 | 1.2%), and Latin America (132 | 1.2%), together accounting for 7.8% of all Canyon Lake residents.
| Immigration Origin | # Population | % Population |
| Africa | 9 | 0.1% |
| Asia | 260 | 2.3% |
| Cambodia | 37 | 0.3% |
| Canada | 22 | 0.2% |
| Central America | 132 | 1.2% |
| China | 16 | 0.1% |
| Eastern Asia | 57 | 0.5% |
| Eastern Europe | 33 | 0.3% |
| Egypt | 9 | 0.1% |
| El Salvador | 10 | 0.1% |
| England | 109 | 1.0% |
| Europe | 206 | 1.8% |
| Hungary | 20 | 0.2% |
| India | 32 | 0.3% |
| Indonesia | 10 | 0.1% |
| Japan | 41 | 0.4% |
| Laos | 12 | 0.1% |
| Latin America | 132 | 1.2% |
| Lebanon | 40 | 0.4% |
| Mexico | 113 | 1.0% |
| Nicaragua | 9 | 0.1% |
| Northern Africa | 9 | 0.1% |
| Northern Europe | 137 | 1.2% |
| Philippines | 72 | 0.6% |
| Poland | 13 | 0.1% |
| South Central Asia | 32 | 0.3% |
| South Eastern Asia | 131 | 1.2% |
| Southern Europe | 36 | 0.3% |
| Spain | 36 | 0.3% |
| Sweden | 28 | 0.3% |
| Western Asia | 40 | 0.4% | View All 31 Rows |
Sex and Age in Canyon Lake
Sex and Age in Canyon Lake
The most populous age groups in Canyon Lake are 55 to 59 Years (496 | 9.1%) for men and 50 to 54 Years (576 | 10.2%) for women.
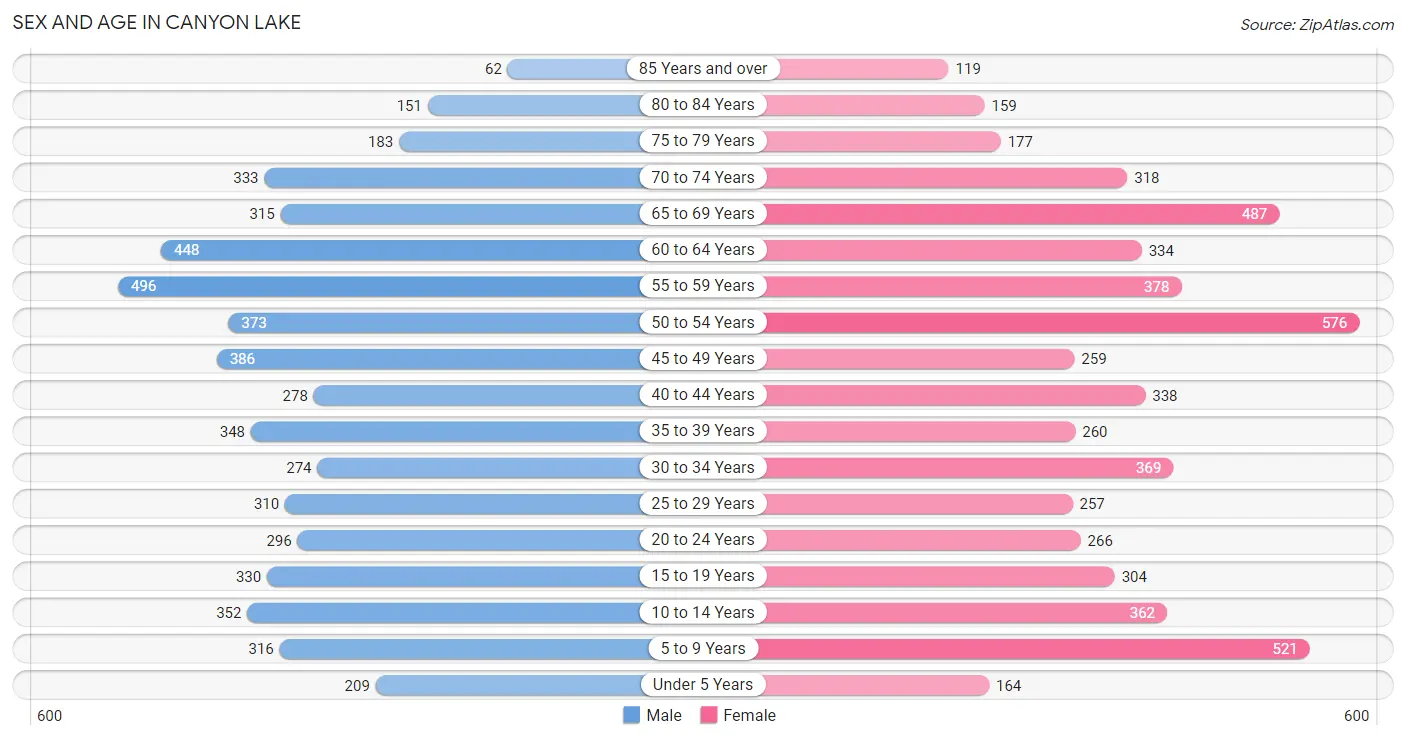
| Age Bracket | Male | Female |
| Under 5 Years | 209 (3.8%) | 164 (2.9%) |
| 5 to 9 Years | 316 (5.8%) | 521 (9.2%) |
| 10 to 14 Years | 352 (6.5%) | 362 (6.4%) |
| 15 to 19 Years | 330 (6.0%) | 304 (5.4%) |
| 20 to 24 Years | 296 (5.4%) | 266 (4.7%) |
| 25 to 29 Years | 310 (5.7%) | 257 (4.5%) |
| 30 to 34 Years | 274 (5.0%) | 369 (6.5%) |
| 35 to 39 Years | 348 (6.4%) | 260 (4.6%) |
| 40 to 44 Years | 278 (5.1%) | 338 (6.0%) |
| 45 to 49 Years | 386 (7.1%) | 259 (4.6%) |
| 50 to 54 Years | 373 (6.8%) | 576 (10.2%) |
| 55 to 59 Years | 496 (9.1%) | 378 (6.7%) |
| 60 to 64 Years | 448 (8.2%) | 334 (5.9%) |
| 65 to 69 Years | 315 (5.8%) | 487 (8.6%) |
| 70 to 74 Years | 333 (6.1%) | 318 (5.6%) |
| 75 to 79 Years | 183 (3.4%) | 177 (3.1%) |
| 80 to 84 Years | 151 (2.8%) | 159 (2.8%) |
| 85 Years and over | 62 (1.1%) | 119 (2.1%) |
| Total | 5,460 (100.0%) | 5,648 (100.0%) |
Families and Households in Canyon Lake
Median Family Size in Canyon Lake
The median family size in Canyon Lake is 3.07 persons per family, with married-couple families (2,472 | 81.8%) accounting for the largest median family size of 3.1 persons per family. On the other hand, single male/father families (167 | 5.5%) represent the smallest median family size with 2.65 persons per family.
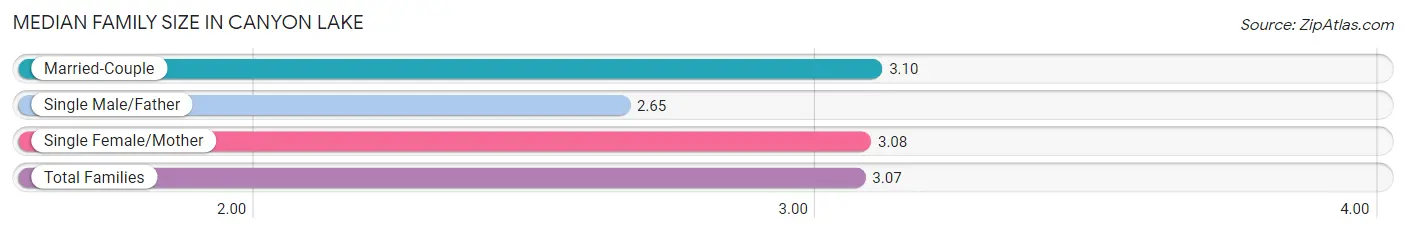
| Family Type | # Families | Family Size |
| Married-Couple | 2,472 (81.8%) | 3.10 |
| Single Male/Father | 167 (5.5%) | 2.65 |
| Single Female/Mother | 382 (12.6%) | 3.08 |
| Total Families | 3,021 (100.0%) | 3.07 |
Median Household Size in Canyon Lake
The median household size in Canyon Lake is 2.68 persons per household, with single female/mother households (382 | 9.2%) accounting for the largest median household size of 3.38 persons per household. non-family households (1,112 | 26.9%) represent the smallest median household size with 1.39 persons per household.
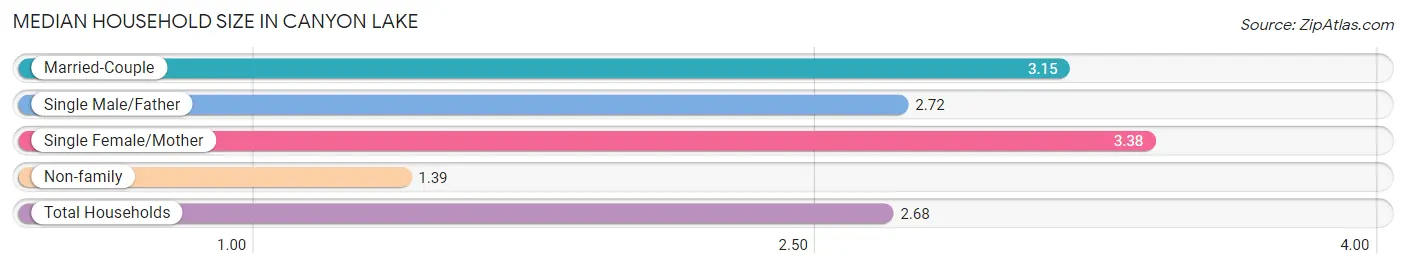
| Household Type | # Households | Household Size |
| Married-Couple | 2,472 (59.8%) | 3.15 |
| Single Male/Father | 167 (4.0%) | 2.72 |
| Single Female/Mother | 382 (9.2%) | 3.38 |
| Non-family | 1,112 (26.9%) | 1.39 |
| Total Households | 4,133 (100.0%) | 2.68 |
Household Size by Marriage Status in Canyon Lake
Out of a total of 4,133 households in Canyon Lake, 3,021 (73.1%) are family households, while 1,112 (26.9%) are nonfamily households. The most numerous type of family households are 2-person households, comprising 1,493, and the most common type of nonfamily households are 1-person households, comprising 805.
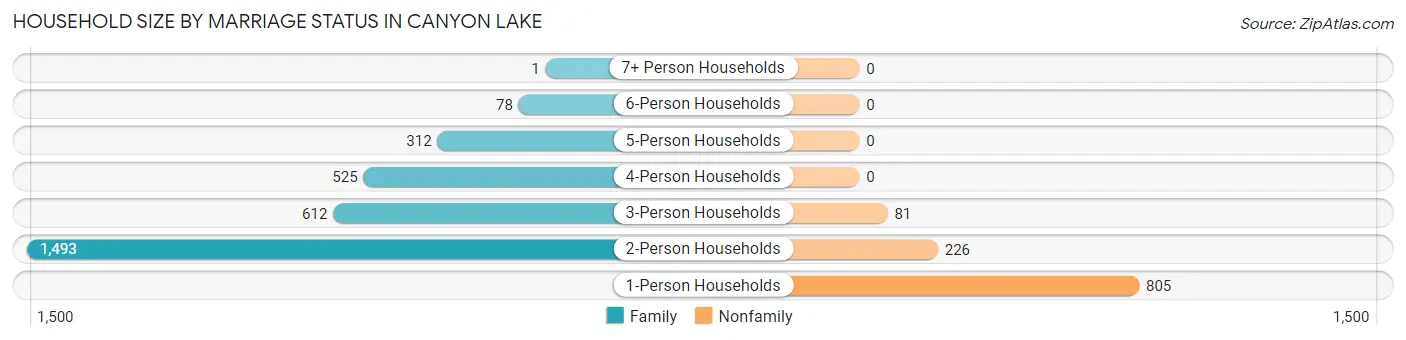
| Household Size | Family Households | Nonfamily Households |
| 1-Person Households | - | 805 (19.5%) |
| 2-Person Households | 1,493 (36.1%) | 226 (5.5%) |
| 3-Person Households | 612 (14.8%) | 81 (2.0%) |
| 4-Person Households | 525 (12.7%) | 0 (0.0%) |
| 5-Person Households | 312 (7.5%) | 0 (0.0%) |
| 6-Person Households | 78 (1.9%) | 0 (0.0%) |
| 7+ Person Households | 1 (0.0%) | 0 (0.0%) |
| Total | 3,021 (73.1%) | 1,112 (26.9%) |
Female Fertility in Canyon Lake
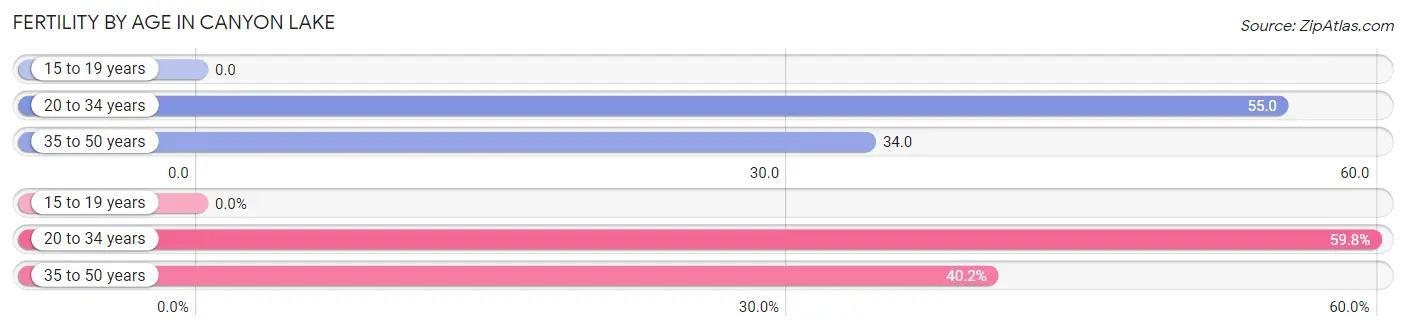
Fertility by Age in Canyon Lake
Average fertility rate in Canyon Lake is 38.0 births per 1,000 women. Women in the age bracket of 20 to 34 years have the highest fertility rate with 55.0 births per 1,000 women. Women in the age bracket of 20 to 34 years acount for 59.8% of all women with births.
| Age Bracket | Women with Births | Births / 1,000 Women |
| 15 to 19 years | 0 (0.0%) | 0.0 |
| 20 to 34 years | 49 (59.8%) | 55.0 |
| 35 to 50 years | 33 (40.2%) | 34.0 |
| Total | 82 (100.0%) | 38.0 |
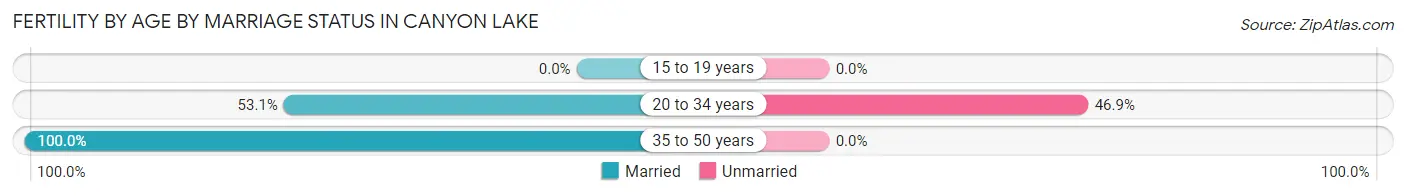
Fertility by Age by Marriage Status in Canyon Lake
72.0% of women with births (82) in Canyon Lake are married. The highest percentage of unmarried women with births falls into 20 to 34 years age bracket with 46.9% of them unmarried at the time of birth, while the lowest percentage of unmarried women with births belong to 35 to 50 years age bracket with 0.0% of them unmarried.
| Age Bracket | Married | Unmarried |
| 15 to 19 years | 0 (0.0%) | 0 (0.0%) |
| 20 to 34 years | 26 (53.1%) | 23 (46.9%) |
| 35 to 50 years | 33 (100.0%) | 0 (0.0%) |
| Total | 59 (72.0%) | 23 (28.1%) |
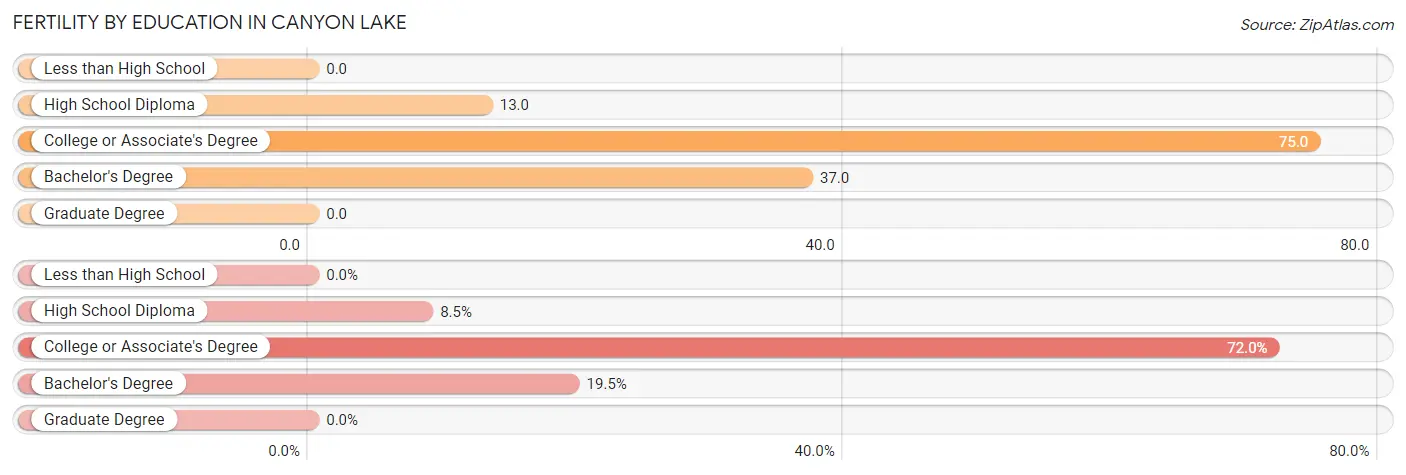
Fertility by Education in Canyon Lake
| Educational Attainment | Women with Births | Births / 1,000 Women |
| Less than High School | 0 (0.0%) | 0.0 |
| High School Diploma | 7 (8.5%) | 13.0 |
| College or Associate's Degree | 59 (72.0%) | 75.0 |
| Bachelor's Degree | 16 (19.5%) | 37.0 |
| Graduate Degree | 0 (0.0%) | 0.0 |
| Total | 82 (100.0%) | 38.0 |
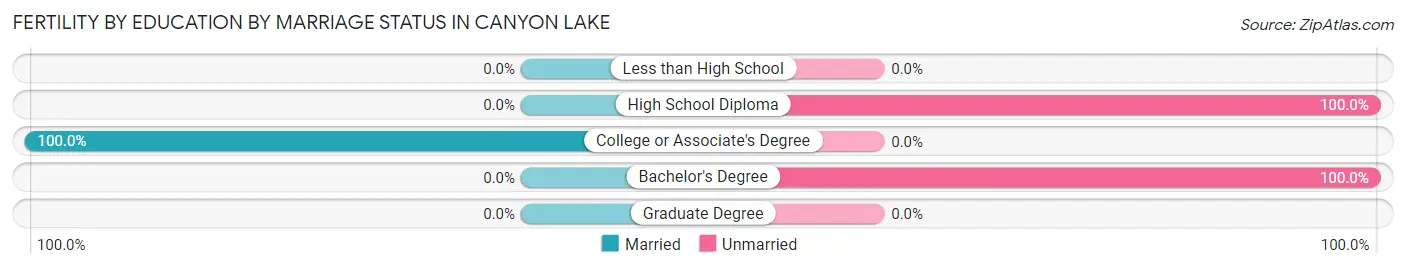
Fertility by Education by Marriage Status in Canyon Lake
28.1% of women with births in Canyon Lake are unmarried. Women with the educational attainment of college or associate's degree are most likely to be married with 100.0% of them married at childbirth, while women with the educational attainment of high school diploma are least likely to be married with 100.0% of them unmarried at childbirth.
| Educational Attainment | Married | Unmarried |
| Less than High School | 0 (0.0%) | 0 (0.0%) |
| High School Diploma | 0 (0.0%) | 7 (100.0%) |
| College or Associate's Degree | 59 (100.0%) | 0 (0.0%) |
| Bachelor's Degree | 0 (0.0%) | 16 (100.0%) |
| Graduate Degree | 0 (0.0%) | 0 (0.0%) |
| Total | 59 (72.0%) | 23 (28.1%) |
Income in Canyon Lake
Income Overview in Canyon Lake
Per Capita Income in Canyon Lake is $58,583, while median incomes of families and households are $132,275 and $120,938 respectively.
| Characteristic | Number | Measure |
| Per Capita Income | 11,108 | $58,583 |
| Median Family Income | 3,021 | $132,275 |
| Mean Family Income | 3,021 | $174,842 |
| Median Household Income | 4,133 | $120,938 |
| Mean Household Income | 4,133 | $153,415 |
| Income Deficit | 3,021 | $0 |
| Wage / Income Gap (%) | 11,108 | 35.81% |
| Wage / Income Gap ($) | 11,108 | 64.19¢ per $1 |
| Gini / Inequality Index | 11,108 | 0.46 |
Earnings by Sex in Canyon Lake
Average Earnings in Canyon Lake are $52,083, $71,604 for men and $45,965 for women, a difference of 35.8%.
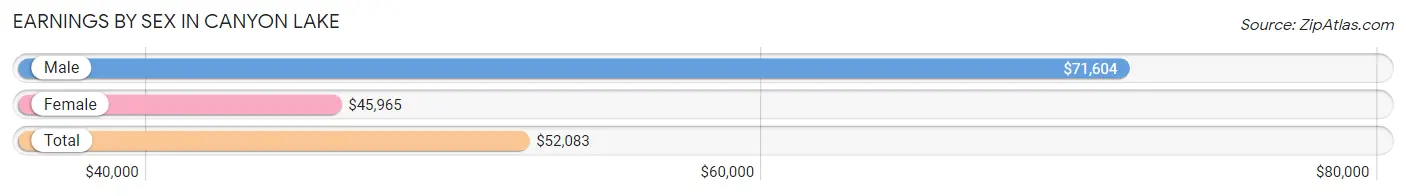
| Sex | Number | Average Earnings |
| Male | 3,190 (56.4%) | $71,604 |
| Female | 2,466 (43.6%) | $45,965 |
| Total | 5,656 (100.0%) | $52,083 |
Earnings by Sex by Income Bracket in Canyon Lake
The most common earnings brackets in Canyon Lake are $100,000+ for men (1,150 | 36.0%) and $100,000+ for women (461 | 18.7%).
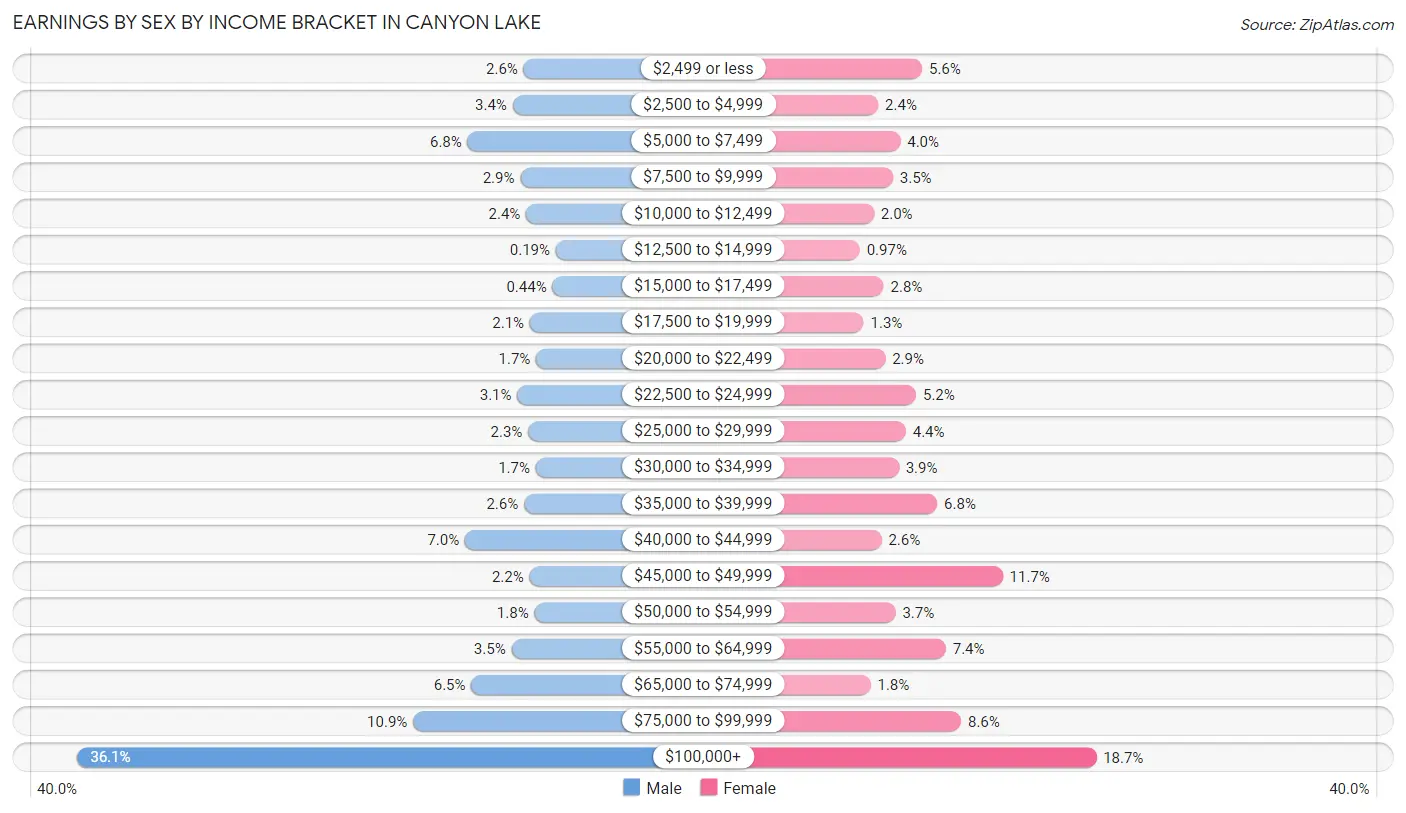
| Income | Male | Female |
| $2,499 or less | 83 (2.6%) | 139 (5.6%) |
| $2,500 to $4,999 | 109 (3.4%) | 58 (2.4%) |
| $5,000 to $7,499 | 217 (6.8%) | 99 (4.0%) |
| $7,500 to $9,999 | 91 (2.9%) | 85 (3.5%) |
| $10,000 to $12,499 | 77 (2.4%) | 50 (2.0%) |
| $12,500 to $14,999 | 6 (0.2%) | 24 (1.0%) |
| $15,000 to $17,499 | 14 (0.4%) | 68 (2.8%) |
| $17,500 to $19,999 | 68 (2.1%) | 31 (1.3%) |
| $20,000 to $22,499 | 53 (1.7%) | 71 (2.9%) |
| $22,500 to $24,999 | 98 (3.1%) | 128 (5.2%) |
| $25,000 to $29,999 | 72 (2.3%) | 109 (4.4%) |
| $30,000 to $34,999 | 54 (1.7%) | 96 (3.9%) |
| $35,000 to $39,999 | 82 (2.6%) | 167 (6.8%) |
| $40,000 to $44,999 | 223 (7.0%) | 64 (2.6%) |
| $45,000 to $49,999 | 69 (2.2%) | 288 (11.7%) |
| $50,000 to $54,999 | 57 (1.8%) | 90 (3.6%) |
| $55,000 to $64,999 | 112 (3.5%) | 183 (7.4%) |
| $65,000 to $74,999 | 208 (6.5%) | 44 (1.8%) |
| $75,000 to $99,999 | 347 (10.9%) | 211 (8.6%) |
| $100,000+ | 1,150 (36.0%) | 461 (18.7%) |
| Total | 3,190 (100.0%) | 2,466 (100.0%) |
Earnings by Sex by Educational Attainment in Canyon Lake
Average earnings in Canyon Lake are $83,806 for men and $47,881 for women, a difference of 42.9%. Men with an educational attainment of high school diploma enjoy the highest average annual earnings of $93,893, while those with less than high school education earn the least with $41,222. Women with an educational attainment of graduate degree earn the most with the average annual earnings of $106,512, while those with high school diploma education have the smallest earnings of $26,964.
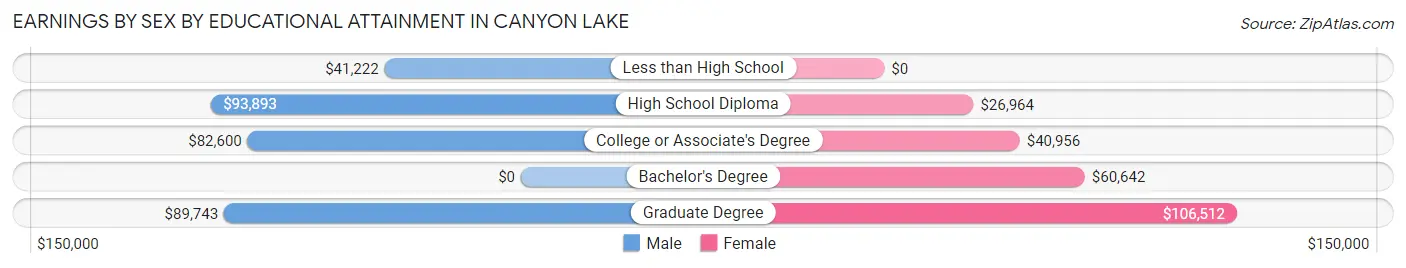
| Educational Attainment | Male Income | Female Income |
| Less than High School | $41,222 | $0 |
| High School Diploma | $93,893 | $26,964 |
| College or Associate's Degree | $82,600 | $40,956 |
| Bachelor's Degree | - | - |
| Graduate Degree | $89,743 | $106,512 |
| Total | $83,806 | $47,881 |
Family Income in Canyon Lake
Family Income Brackets in Canyon Lake
According to the Canyon Lake family income data, there are 674 families falling into the $200,000+ income range, which is the most common income bracket and makes up 22.3% of all families.
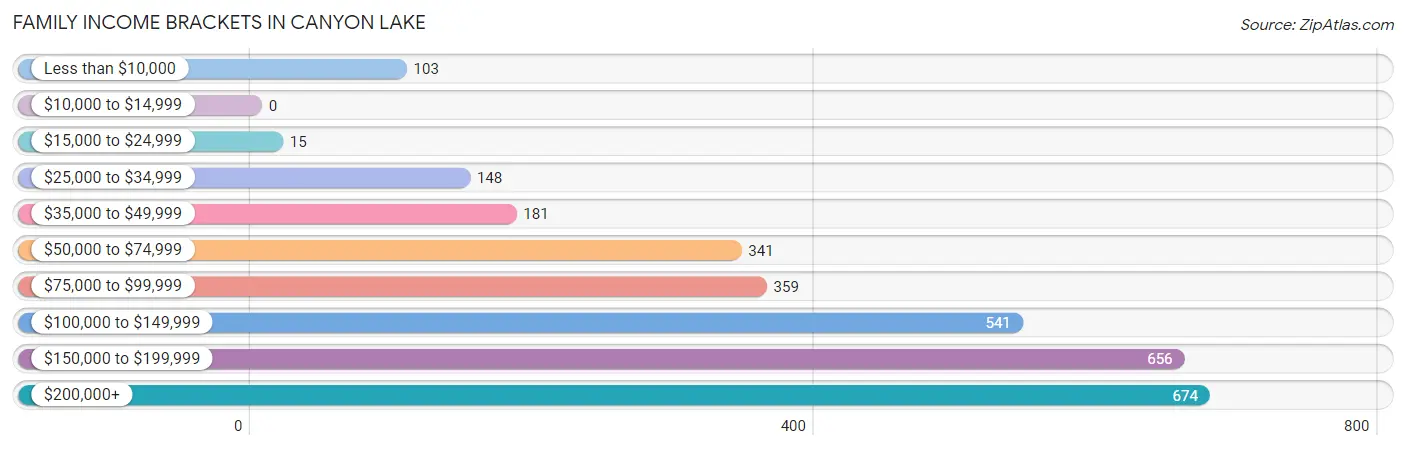
| Income Bracket | # Families | % Families |
| Less than $10,000 | 103 | 3.4% |
| $10,000 to $14,999 | 0 | 0.0% |
| $15,000 to $24,999 | 15 | 0.5% |
| $25,000 to $34,999 | 148 | 4.9% |
| $35,000 to $49,999 | 181 | 6.0% |
| $50,000 to $74,999 | 341 | 11.3% |
| $75,000 to $99,999 | 359 | 11.9% |
| $100,000 to $149,999 | 541 | 17.9% |
| $150,000 to $199,999 | 656 | 21.7% |
| $200,000+ | 674 | 22.3% |
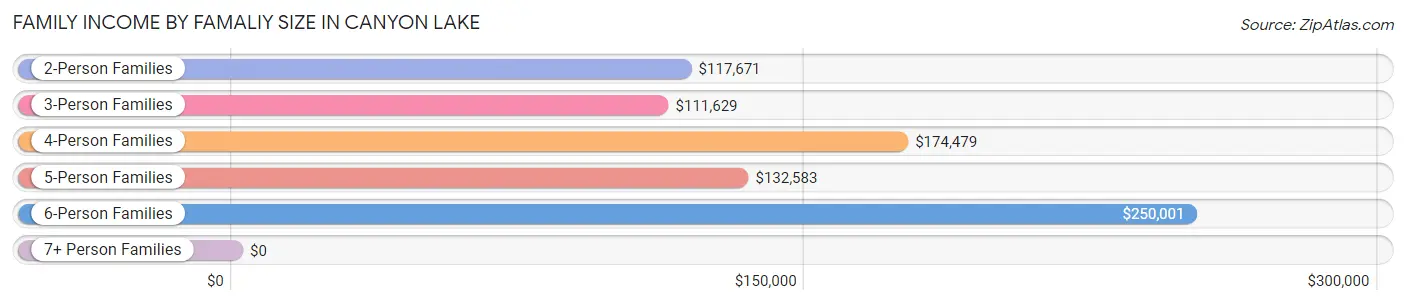
Family Income by Famaliy Size in Canyon Lake
6-person families (59 | 1.9%) account for the highest median family income in Canyon Lake with $250,001 per family, while 2-person families (1,530 | 50.6%) have the highest median income of $58,836 per family member.
| Income Bracket | # Families | Median Income |
| 2-Person Families | 1,530 (50.6%) | $117,671 |
| 3-Person Families | 645 (21.3%) | $111,629 |
| 4-Person Families | 521 (17.2%) | $174,479 |
| 5-Person Families | 265 (8.8%) | $132,583 |
| 6-Person Families | 59 (1.9%) | $250,001 |
| 7+ Person Families | 1 (0.0%) | $0 |
| Total | 3,021 (100.0%) | $132,275 |
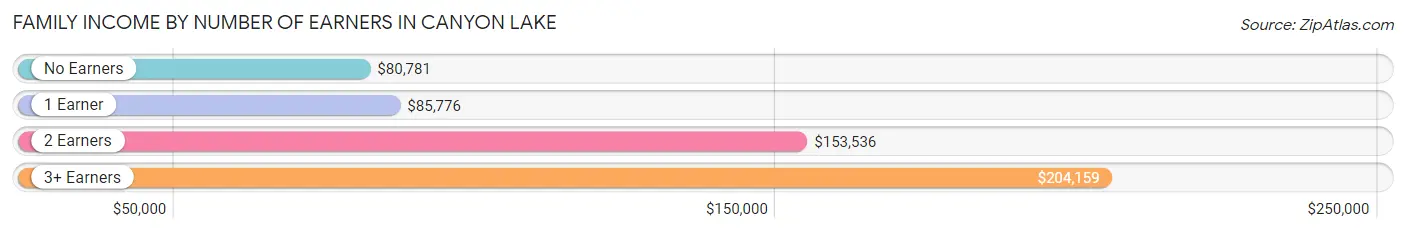
Family Income by Number of Earners in Canyon Lake
The median family income in Canyon Lake is $132,275, with families comprising 3+ earners (225) having the highest median family income of $204,159, while families with no earners (569) have the lowest median family income of $80,781, accounting for 7.4% and 18.8% of families, respectively.
| Number of Earners | # Families | Median Income |
| No Earners | 569 (18.8%) | $80,781 |
| 1 Earner | 902 (29.9%) | $85,776 |
| 2 Earners | 1,325 (43.9%) | $153,536 |
| 3+ Earners | 225 (7.4%) | $204,159 |
| Total | 3,021 (100.0%) | $132,275 |
Household Income in Canyon Lake
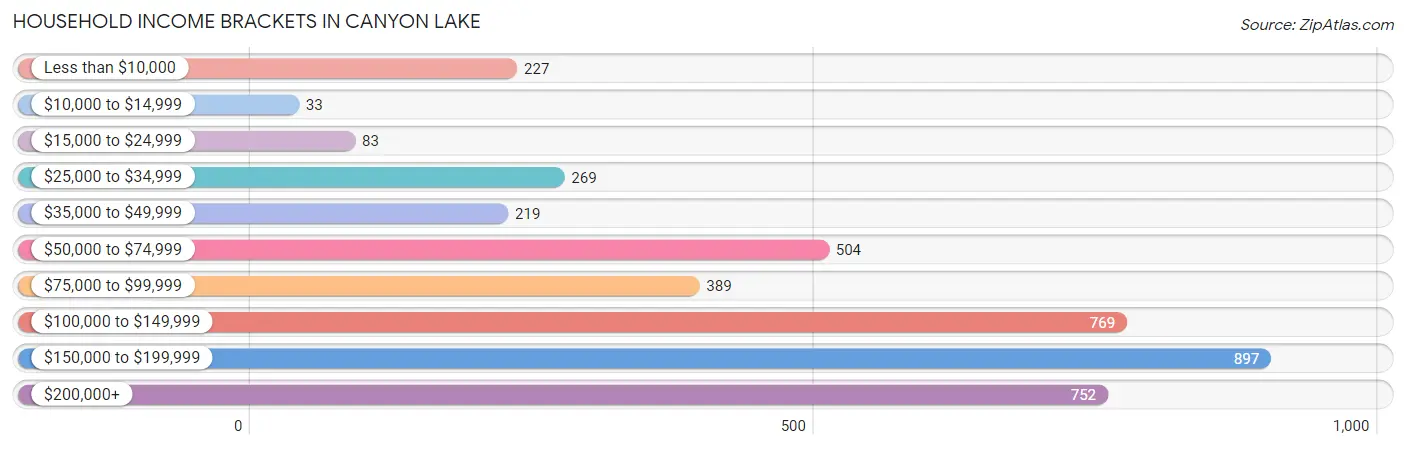
Household Income Brackets in Canyon Lake
With 897 households falling in the category, the $150,000 to $199,999 income range is the most frequent in Canyon Lake, accounting for 21.7% of all households. In contrast, only 33 households (0.8%) fall into the $10,000 to $14,999 income bracket, making it the least populous group.
| Income Bracket | # Households | % Households |
| Less than $10,000 | 227 | 5.5% |
| $10,000 to $14,999 | 33 | 0.8% |
| $15,000 to $24,999 | 83 | 2.0% |
| $25,000 to $34,999 | 269 | 6.5% |
| $35,000 to $49,999 | 219 | 5.3% |
| $50,000 to $74,999 | 504 | 12.2% |
| $75,000 to $99,999 | 389 | 9.4% |
| $100,000 to $149,999 | 769 | 18.6% |
| $150,000 to $199,999 | 897 | 21.7% |
| $200,000+ | 752 | 18.2% |
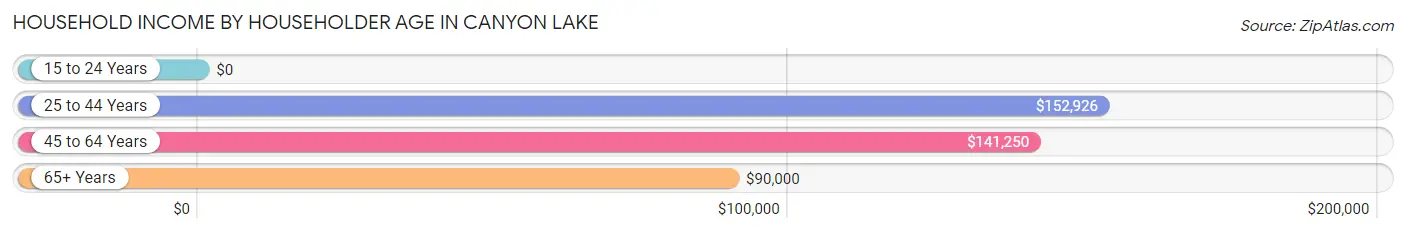
Household Income by Householder Age in Canyon Lake
The median household income in Canyon Lake is $120,938, with the highest median household income of $152,926 found in the 25 to 44 years age bracket for the primary householder. A total of 862 households (20.9%) fall into this category. Meanwhile, the 15 to 24 years age bracket for the primary householder has the lowest median household income of $0, with 37 households (0.9%) in this group.
| Income Bracket | # Households | Median Income |
| 15 to 24 Years | 37 (0.9%) | $0 |
| 25 to 44 Years | 862 (20.9%) | $152,926 |
| 45 to 64 Years | 1,762 (42.6%) | $141,250 |
| 65+ Years | 1,472 (35.6%) | $90,000 |
| Total | 4,133 (100.0%) | $120,938 |
Poverty in Canyon Lake
Income Below Poverty by Sex and Age in Canyon Lake
With 6.3% poverty level for males and 11.7% for females among the residents of Canyon Lake, 16 and 17 year old males and 18 to 24 year old females are the most vulnerable to poverty, with 53 males (34.2%) and 173 females (51.6%) in their respective age groups living below the poverty level.
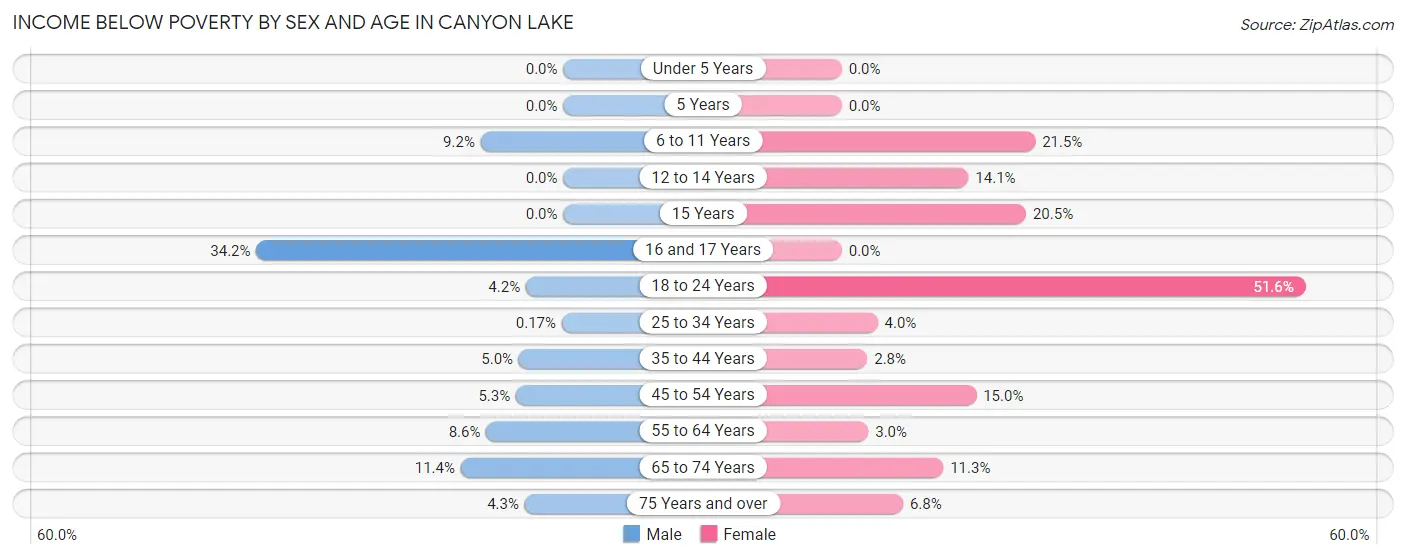
| Age Bracket | Male | Female |
| Under 5 Years | 0 (0.0%) | 0 (0.0%) |
| 5 Years | 0 (0.0%) | 0 (0.0%) |
| 6 to 11 Years | 32 (9.2%) | 112 (21.5%) |
| 12 to 14 Years | 0 (0.0%) | 33 (14.1%) |
| 15 Years | 0 (0.0%) | 32 (20.5%) |
| 16 and 17 Years | 53 (34.2%) | 0 (0.0%) |
| 18 to 24 Years | 15 (4.2%) | 173 (51.6%) |
| 25 to 34 Years | 1 (0.2%) | 25 (4.0%) |
| 35 to 44 Years | 31 (5.0%) | 17 (2.8%) |
| 45 to 54 Years | 40 (5.3%) | 125 (15.0%) |
| 55 to 64 Years | 81 (8.6%) | 21 (2.9%) |
| 65 to 74 Years | 74 (11.4%) | 91 (11.3%) |
| 75 Years and over | 17 (4.3%) | 31 (6.8%) |
| Total | 344 (6.3%) | 660 (11.7%) |
Income Above Poverty by Sex and Age in Canyon Lake
According to the poverty statistics in Canyon Lake, males aged under 5 years and females aged under 5 years are the age groups that are most secure financially, with 100.0% of males and 100.0% of females in these age groups living above the poverty line.
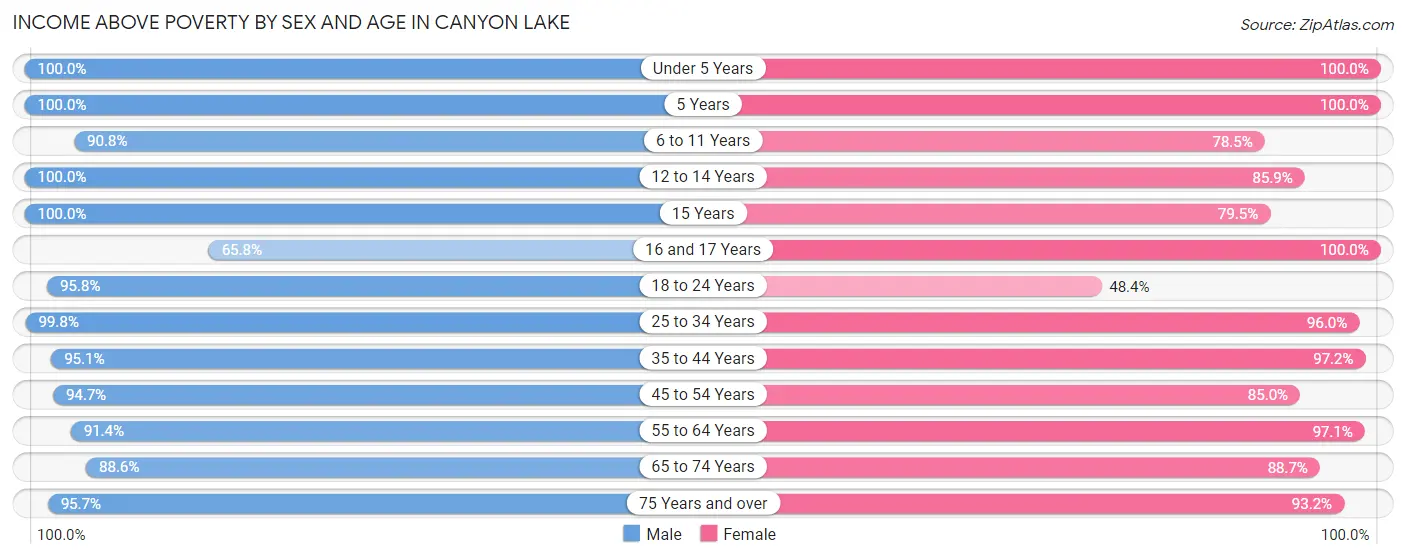
| Age Bracket | Male | Female |
| Under 5 Years | 209 (100.0%) | 164 (100.0%) |
| 5 Years | 84 (100.0%) | 129 (100.0%) |
| 6 to 11 Years | 316 (90.8%) | 408 (78.5%) |
| 12 to 14 Years | 236 (100.0%) | 201 (85.9%) |
| 15 Years | 110 (100.0%) | 124 (79.5%) |
| 16 and 17 Years | 102 (65.8%) | 79 (100.0%) |
| 18 to 24 Years | 346 (95.8%) | 162 (48.4%) |
| 25 to 34 Years | 583 (99.8%) | 601 (96.0%) |
| 35 to 44 Years | 595 (95.1%) | 581 (97.2%) |
| 45 to 54 Years | 719 (94.7%) | 710 (85.0%) |
| 55 to 64 Years | 863 (91.4%) | 691 (97.1%) |
| 65 to 74 Years | 574 (88.6%) | 714 (88.7%) |
| 75 Years and over | 379 (95.7%) | 424 (93.2%) |
| Total | 5,116 (93.7%) | 4,988 (88.3%) |
Income Below Poverty Among Married-Couple Families in Canyon Lake
The poverty statistics for married-couple families in Canyon Lake show that 1.0% or 25 of the total 2,472 families live below the poverty line. Families with no children have the highest poverty rate of 1.1%, comprising of 17 families. On the other hand, families with 3 or 4 children have the lowest poverty rate of 0.0%, which includes 0 families.
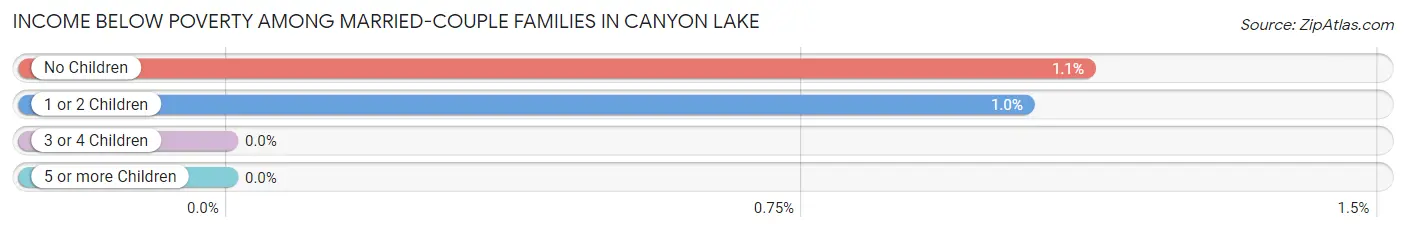
| Children | Above Poverty | Below Poverty |
| No Children | 1,497 (98.9%) | 17 (1.1%) |
| 1 or 2 Children | 764 (99.0%) | 8 (1.0%) |
| 3 or 4 Children | 186 (100.0%) | 0 (0.0%) |
| 5 or more Children | 0 (0.0%) | 0 (0.0%) |
| Total | 2,447 (99.0%) | 25 (1.0%) |
Income Below Poverty Among Single-Parent Households in Canyon Lake
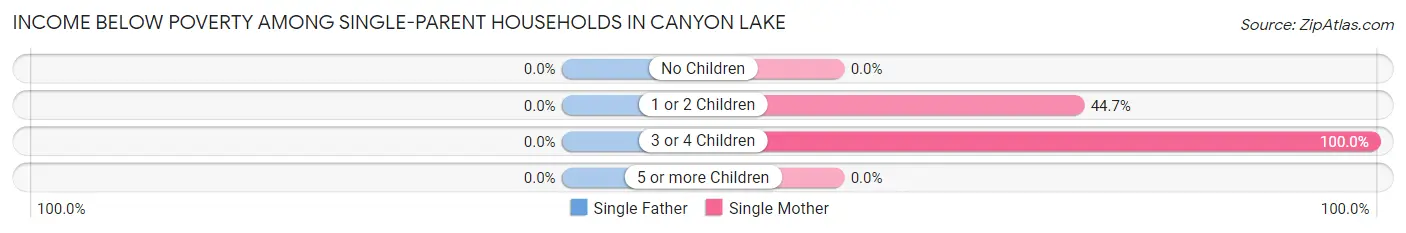
| Children | Single Father | Single Mother |
| No Children | 0 (0.0%) | 0 (0.0%) |
| 1 or 2 Children | 0 (0.0%) | 93 (44.7%) |
| 3 or 4 Children | 0 (0.0%) | 32 (100.0%) |
| 5 or more Children | 0 (0.0%) | 0 (0.0%) |
| Total | 0 (0.0%) | 125 (32.7%) |
Income Below Poverty Among Married-Couple vs Single-Parent Households in Canyon Lake
The poverty data for Canyon Lake shows that 25 of the married-couple family households (1.0%) and 125 of the single-parent households (22.8%) are living below the poverty level. Within the married-couple family households, those with no children have the highest poverty rate, with 17 households (1.1%) falling below the poverty line. Among the single-parent households, those with 3 or 4 children have the highest poverty rate, with 32 household (47.8%) living below poverty.
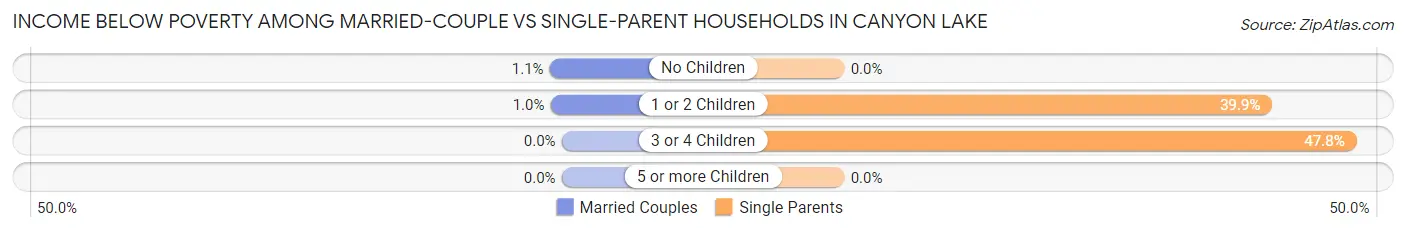
| Children | Married-Couple Families | Single-Parent Households |
| No Children | 17 (1.1%) | 0 (0.0%) |
| 1 or 2 Children | 8 (1.0%) | 93 (39.9%) |
| 3 or 4 Children | 0 (0.0%) | 32 (47.8%) |
| 5 or more Children | 0 (0.0%) | 0 (0.0%) |
| Total | 25 (1.0%) | 125 (22.8%) |
Employment Characteristics in Canyon Lake
Employment by Class of Employer in Canyon Lake
Among the 4,988 employed individuals in Canyon Lake, private company employees (3,329 | 66.7%), local government employees (533 | 10.7%), and self-employed (not incorporated) (414 | 8.3%) make up the most common classes of employment.
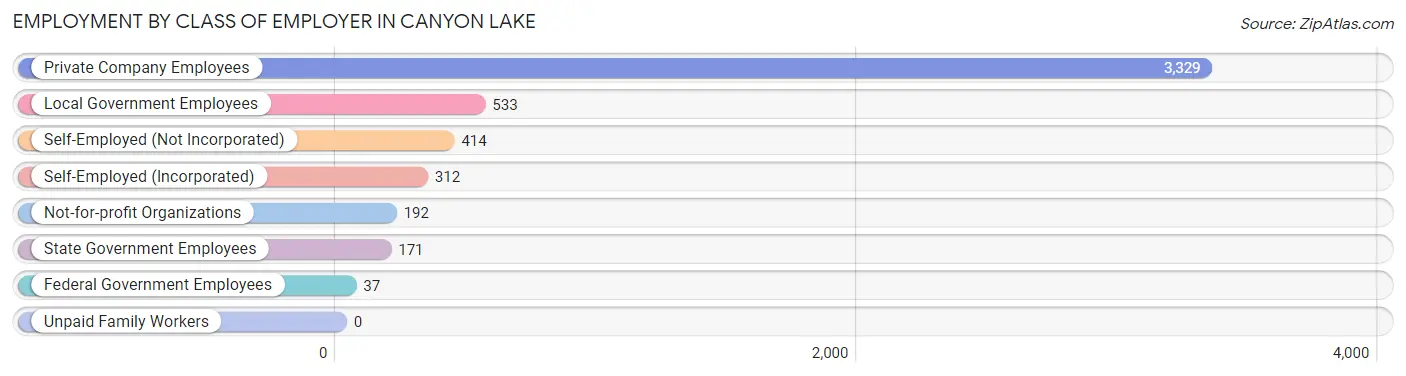
| Employer Class | # Employees | % Employees |
| Private Company Employees | 3,329 | 66.7% |
| Self-Employed (Incorporated) | 312 | 6.3% |
| Self-Employed (Not Incorporated) | 414 | 8.3% |
| Not-for-profit Organizations | 192 | 3.8% |
| Local Government Employees | 533 | 10.7% |
| State Government Employees | 171 | 3.4% |
| Federal Government Employees | 37 | 0.7% |
| Unpaid Family Workers | 0 | 0.0% |
| Total | 4,988 | 100.0% |
Employment Status by Age in Canyon Lake
According to the labor force statistics for Canyon Lake, out of the total population over 16 years of age (8,918), 59.2% or 5,279 individuals are in the labor force, with 3.7% or 195 of them unemployed. The age group with the highest labor force participation rate is 30 to 34 years, with 85.8% or 552 individuals in the labor force. Within the labor force, the 16 to 19 years age range has the highest percentage of unemployed individuals, with 20.8% or 27 of them being unemployed.
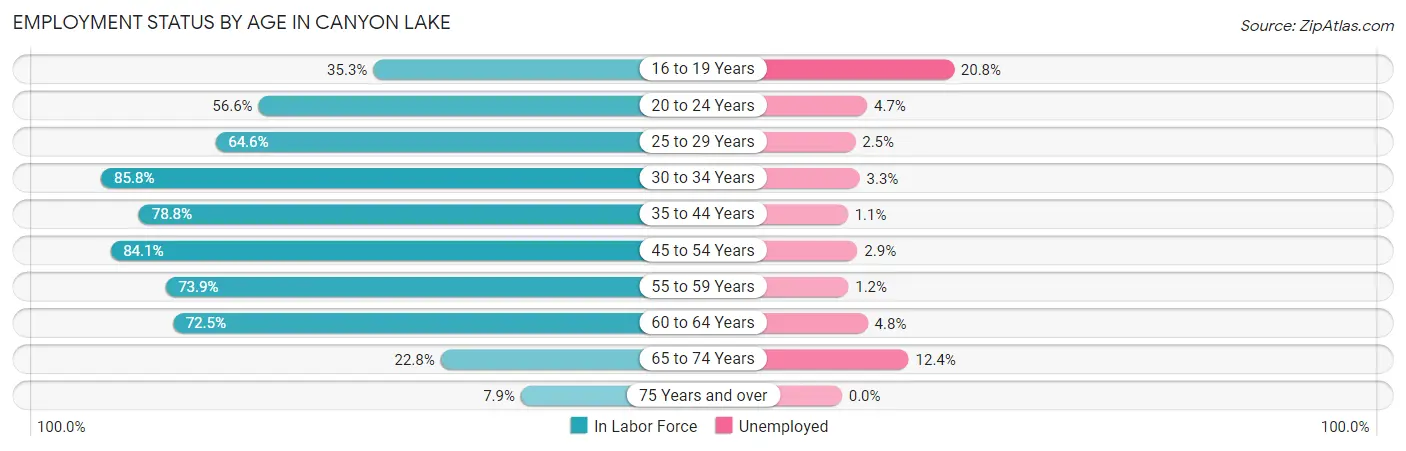
| Age Bracket | In Labor Force | Unemployed |
| 16 to 19 Years | 130 (35.3%) | 27 (20.8%) |
| 20 to 24 Years | 318 (56.6%) | 15 (4.7%) |
| 25 to 29 Years | 366 (64.6%) | 9 (2.5%) |
| 30 to 34 Years | 552 (85.8%) | 18 (3.3%) |
| 35 to 44 Years | 965 (78.8%) | 11 (1.1%) |
| 45 to 54 Years | 1,341 (84.1%) | 39 (2.9%) |
| 55 to 59 Years | 646 (73.9%) | 8 (1.2%) |
| 60 to 64 Years | 567 (72.5%) | 27 (4.8%) |
| 65 to 74 Years | 331 (22.8%) | 41 (12.4%) |
| 75 Years and over | 67 (7.9%) | 0 (0.0%) |
| Total | 5,279 (59.2%) | 195 (3.7%) |
Employment Status by Educational Attainment in Canyon Lake
According to labor force statistics for Canyon Lake, 78.0% of individuals (4,434) out of the total population between 25 and 64 years of age (5,684) are in the labor force, with 2.5% or 111 of them being unemployed. The group with the highest labor force participation rate are those with the educational attainment of bachelor's degree or higher, with 85.9% or 1,307 individuals in the labor force. Within the labor force, individuals with less than high school education have the highest percentage of unemployment, with 15.9% or 24 of them being unemployed.
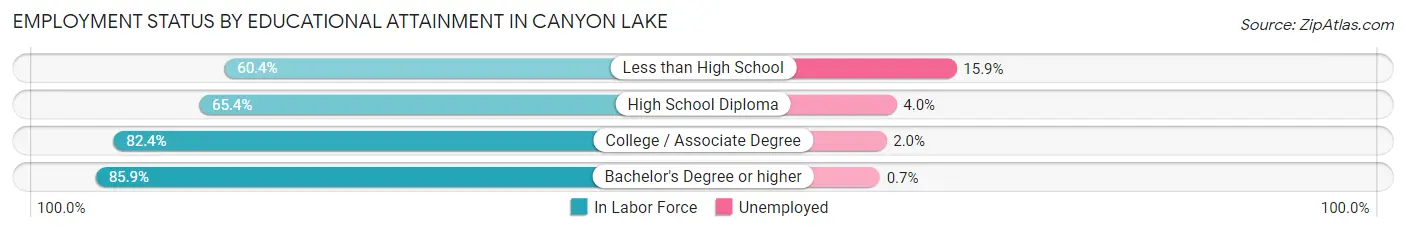
| Educational Attainment | In Labor Force | Unemployed |
| Less than High School | 151 (60.4%) | 40 (15.9%) |
| High School Diploma | 941 (65.4%) | 58 (4.0%) |
| College / Associate Degree | 2,038 (82.4%) | 49 (2.0%) |
| Bachelor's Degree or higher | 1,307 (85.9%) | 11 (0.7%) |
| Total | 4,434 (78.0%) | 142 (2.5%) |
Employment Occupations by Sex in Canyon Lake
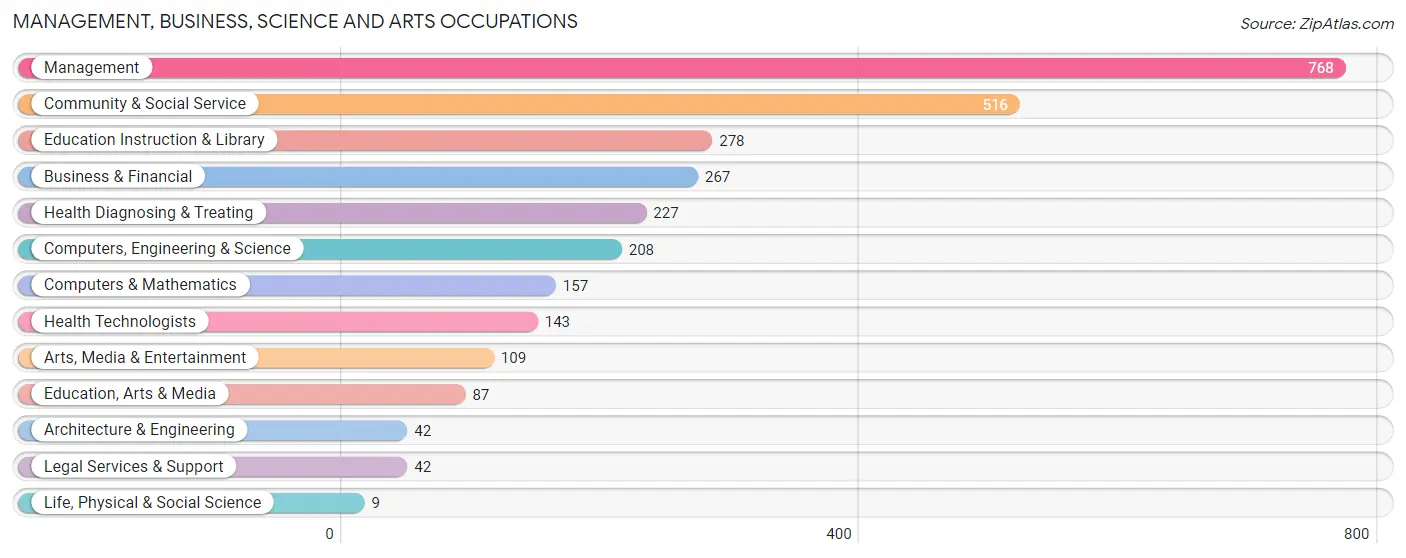
Management, Business, Science and Arts Occupations
The most common Management, Business, Science and Arts occupations in Canyon Lake are Management (768 | 15.1%), Community & Social Service (516 | 10.1%), Education Instruction & Library (278 | 5.5%), Business & Financial (267 | 5.2%), and Health Diagnosing & Treating (227 | 4.5%).
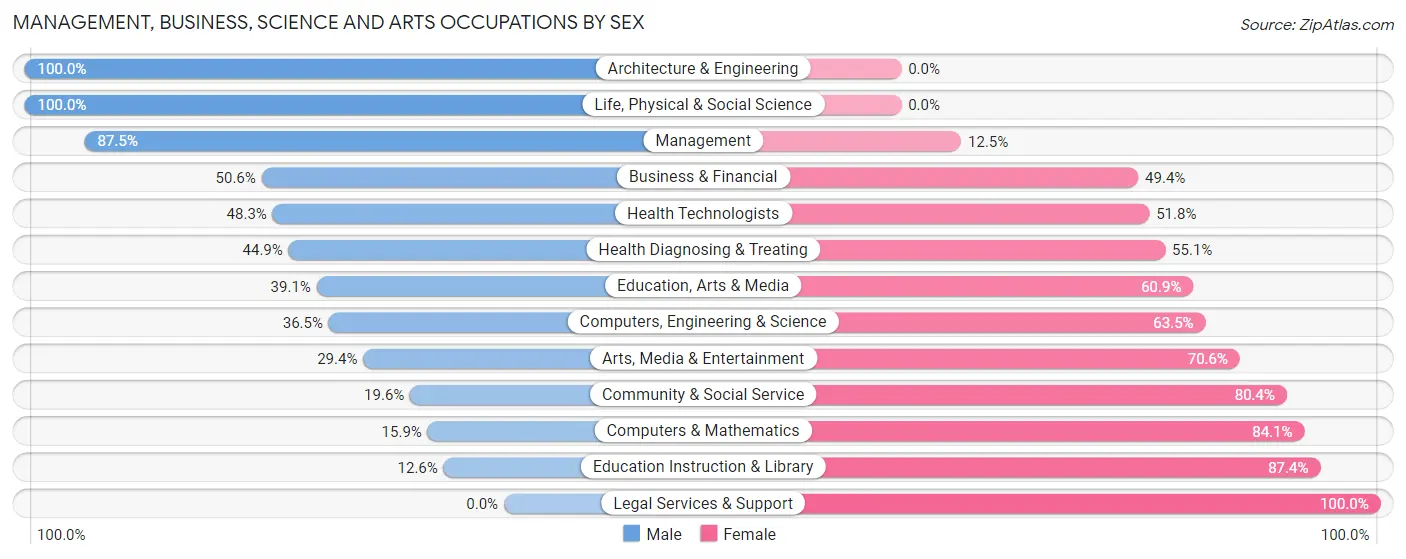
Management, Business, Science and Arts Occupations by Sex
Within the Management, Business, Science and Arts occupations in Canyon Lake, the most male-oriented occupations are Architecture & Engineering (100.0%), Life, Physical & Social Science (100.0%), and Management (87.5%), while the most female-oriented occupations are Legal Services & Support (100.0%), Education Instruction & Library (87.4%), and Computers & Mathematics (84.1%).
| Occupation | Male | Female |
| Management | 672 (87.5%) | 96 (12.5%) |
| Business & Financial | 135 (50.6%) | 132 (49.4%) |
| Computers, Engineering & Science | 76 (36.5%) | 132 (63.5%) |
| Computers & Mathematics | 25 (15.9%) | 132 (84.1%) |
| Architecture & Engineering | 42 (100.0%) | 0 (0.0%) |
| Life, Physical & Social Science | 9 (100.0%) | 0 (0.0%) |
| Community & Social Service | 101 (19.6%) | 415 (80.4%) |
| Education, Arts & Media | 34 (39.1%) | 53 (60.9%) |
| Legal Services & Support | 0 (0.0%) | 42 (100.0%) |
| Education Instruction & Library | 35 (12.6%) | 243 (87.4%) |
| Arts, Media & Entertainment | 32 (29.4%) | 77 (70.6%) |
| Health Diagnosing & Treating | 102 (44.9%) | 125 (55.1%) |
| Health Technologists | 69 (48.2%) | 74 (51.7%) |
| Total (Category) | 1,086 (54.7%) | 900 (45.3%) |
| Total (Overall) | 2,913 (57.3%) | 2,174 (42.7%) |
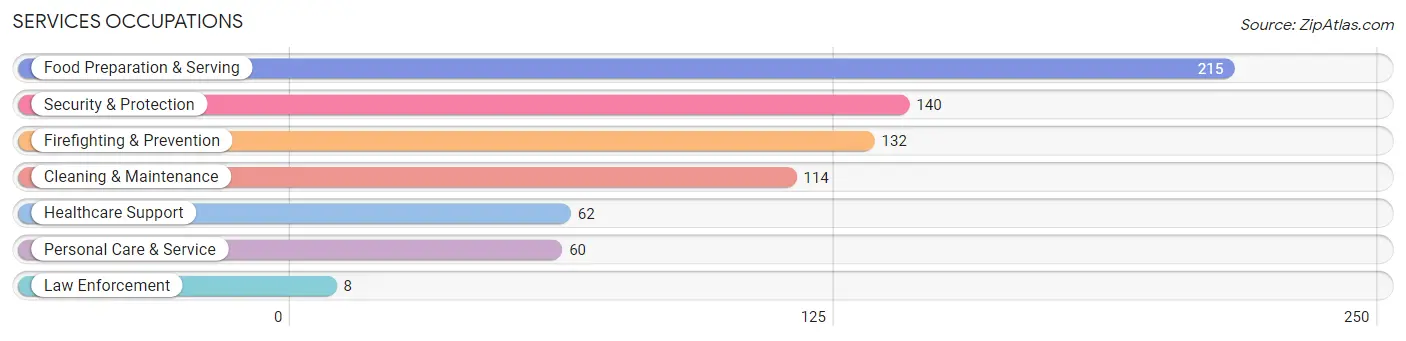
Services Occupations
The most common Services occupations in Canyon Lake are Food Preparation & Serving (215 | 4.2%), Security & Protection (140 | 2.8%), Firefighting & Prevention (132 | 2.6%), Cleaning & Maintenance (114 | 2.2%), and Healthcare Support (62 | 1.2%).
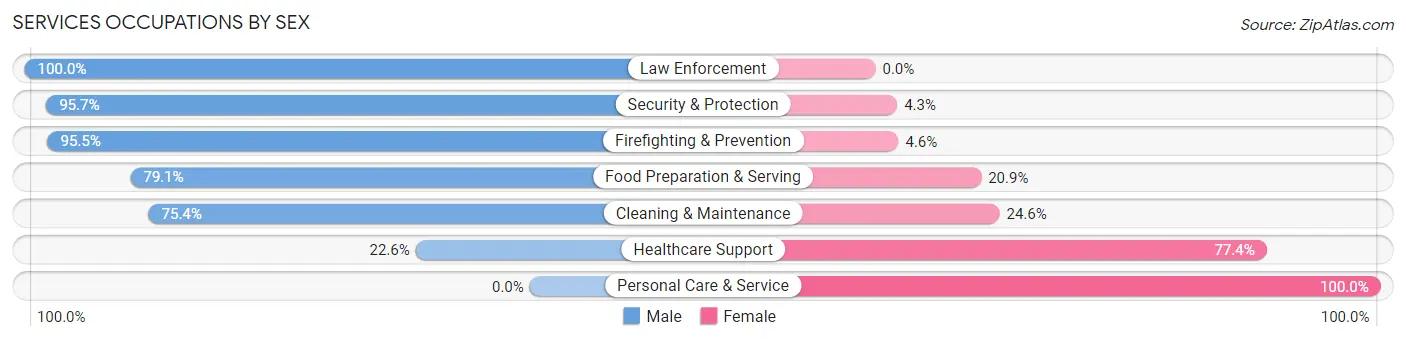
Services Occupations by Sex
Within the Services occupations in Canyon Lake, the most male-oriented occupations are Law Enforcement (100.0%), Security & Protection (95.7%), and Firefighting & Prevention (95.5%), while the most female-oriented occupations are Personal Care & Service (100.0%), Healthcare Support (77.4%), and Cleaning & Maintenance (24.6%).
| Occupation | Male | Female |
| Healthcare Support | 14 (22.6%) | 48 (77.4%) |
| Security & Protection | 134 (95.7%) | 6 (4.3%) |
| Firefighting & Prevention | 126 (95.5%) | 6 (4.5%) |
| Law Enforcement | 8 (100.0%) | 0 (0.0%) |
| Food Preparation & Serving | 170 (79.1%) | 45 (20.9%) |
| Cleaning & Maintenance | 86 (75.4%) | 28 (24.6%) |
| Personal Care & Service | 0 (0.0%) | 60 (100.0%) |
| Total (Category) | 404 (68.4%) | 187 (31.6%) |
| Total (Overall) | 2,913 (57.3%) | 2,174 (42.7%) |
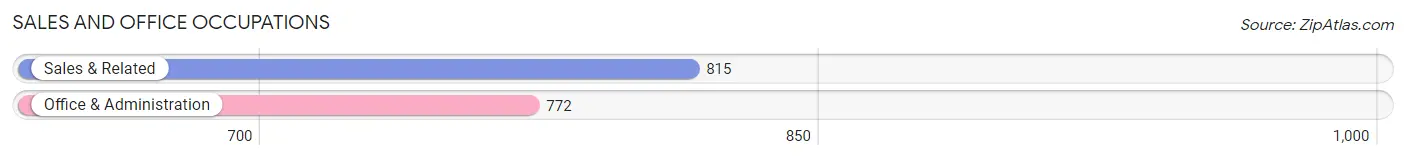
Sales and Office Occupations
The most common Sales and Office occupations in Canyon Lake are Sales & Related (815 | 16.0%), and Office & Administration (772 | 15.2%).
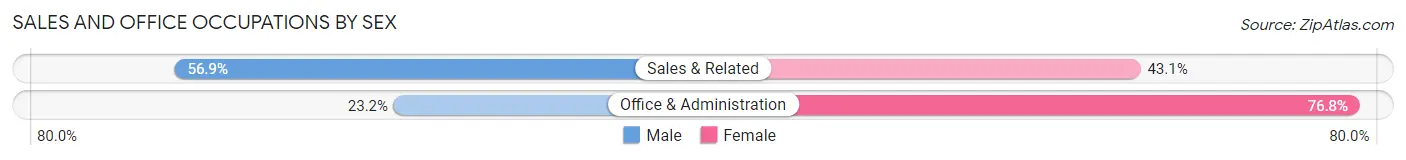
Sales and Office Occupations by Sex
| Occupation | Male | Female |
| Sales & Related | 464 (56.9%) | 351 (43.1%) |
| Office & Administration | 179 (23.2%) | 593 (76.8%) |
| Total (Category) | 643 (40.5%) | 944 (59.5%) |
| Total (Overall) | 2,913 (57.3%) | 2,174 (42.7%) |
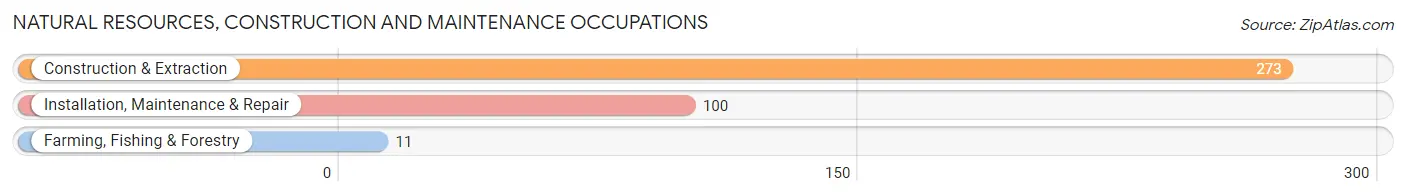
Natural Resources, Construction and Maintenance Occupations
The most common Natural Resources, Construction and Maintenance occupations in Canyon Lake are Construction & Extraction (273 | 5.4%), Installation, Maintenance & Repair (100 | 2.0%), and Farming, Fishing & Forestry (11 | 0.2%).
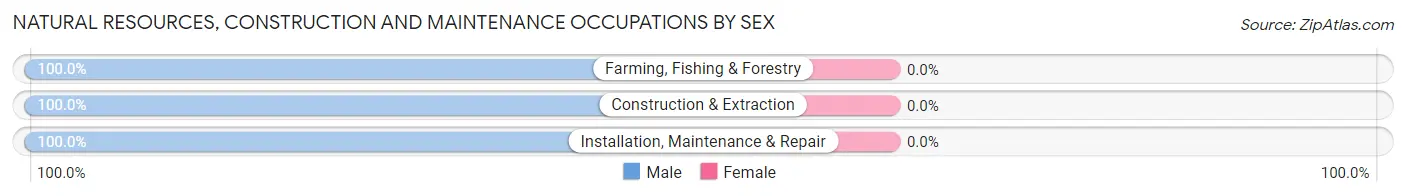
Natural Resources, Construction and Maintenance Occupations by Sex
| Occupation | Male | Female |
| Farming, Fishing & Forestry | 11 (100.0%) | 0 (0.0%) |
| Construction & Extraction | 273 (100.0%) | 0 (0.0%) |
| Installation, Maintenance & Repair | 100 (100.0%) | 0 (0.0%) |
| Total (Category) | 384 (100.0%) | 0 (0.0%) |
| Total (Overall) | 2,913 (57.3%) | 2,174 (42.7%) |
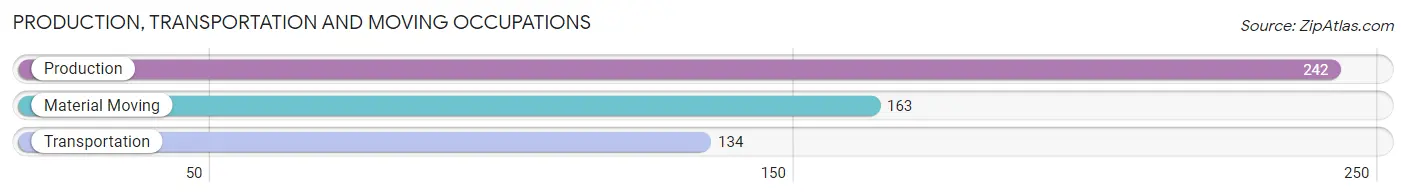
Production, Transportation and Moving Occupations
The most common Production, Transportation and Moving occupations in Canyon Lake are Production (242 | 4.8%), Material Moving (163 | 3.2%), and Transportation (134 | 2.6%).
Production, Transportation and Moving Occupations by Sex
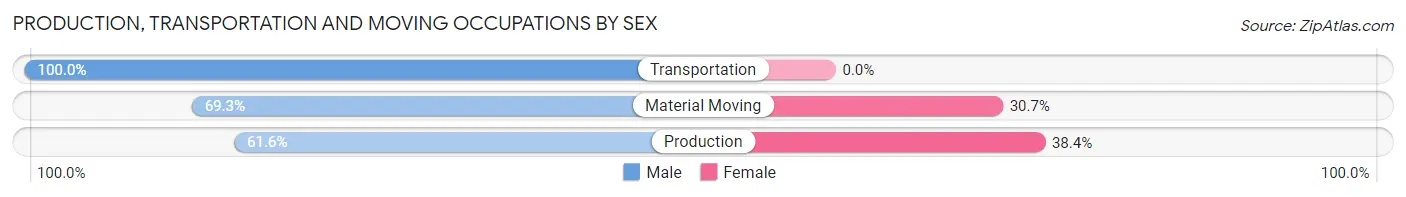
| Occupation | Male | Female |
| Production | 149 (61.6%) | 93 (38.4%) |
| Transportation | 134 (100.0%) | 0 (0.0%) |
| Material Moving | 113 (69.3%) | 50 (30.7%) |
| Total (Category) | 396 (73.5%) | 143 (26.5%) |
| Total (Overall) | 2,913 (57.3%) | 2,174 (42.7%) |
Employment Industries by Sex in Canyon Lake
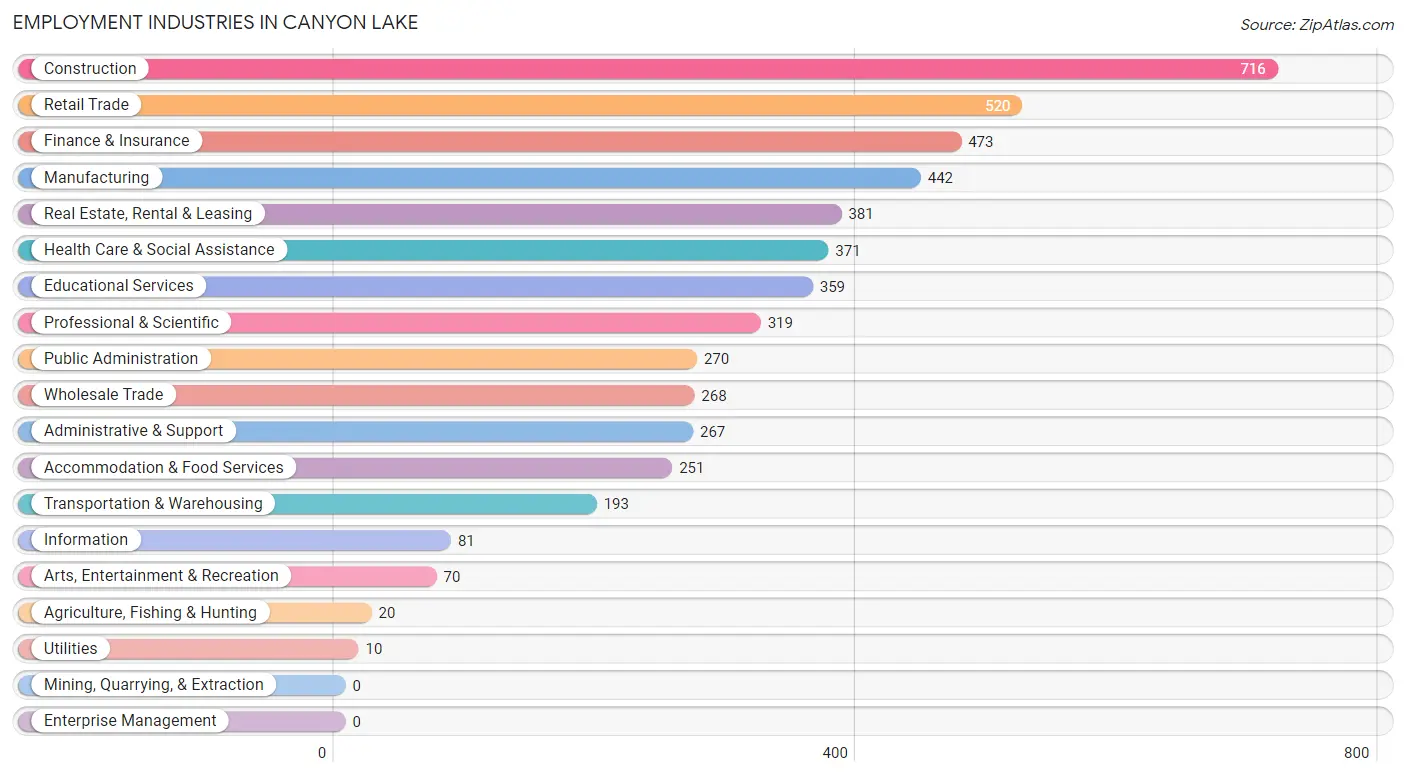
Employment Industries in Canyon Lake
The major employment industries in Canyon Lake include Construction (716 | 14.1%), Retail Trade (520 | 10.2%), Finance & Insurance (473 | 9.3%), Manufacturing (442 | 8.7%), and Real Estate, Rental & Leasing (381 | 7.5%).
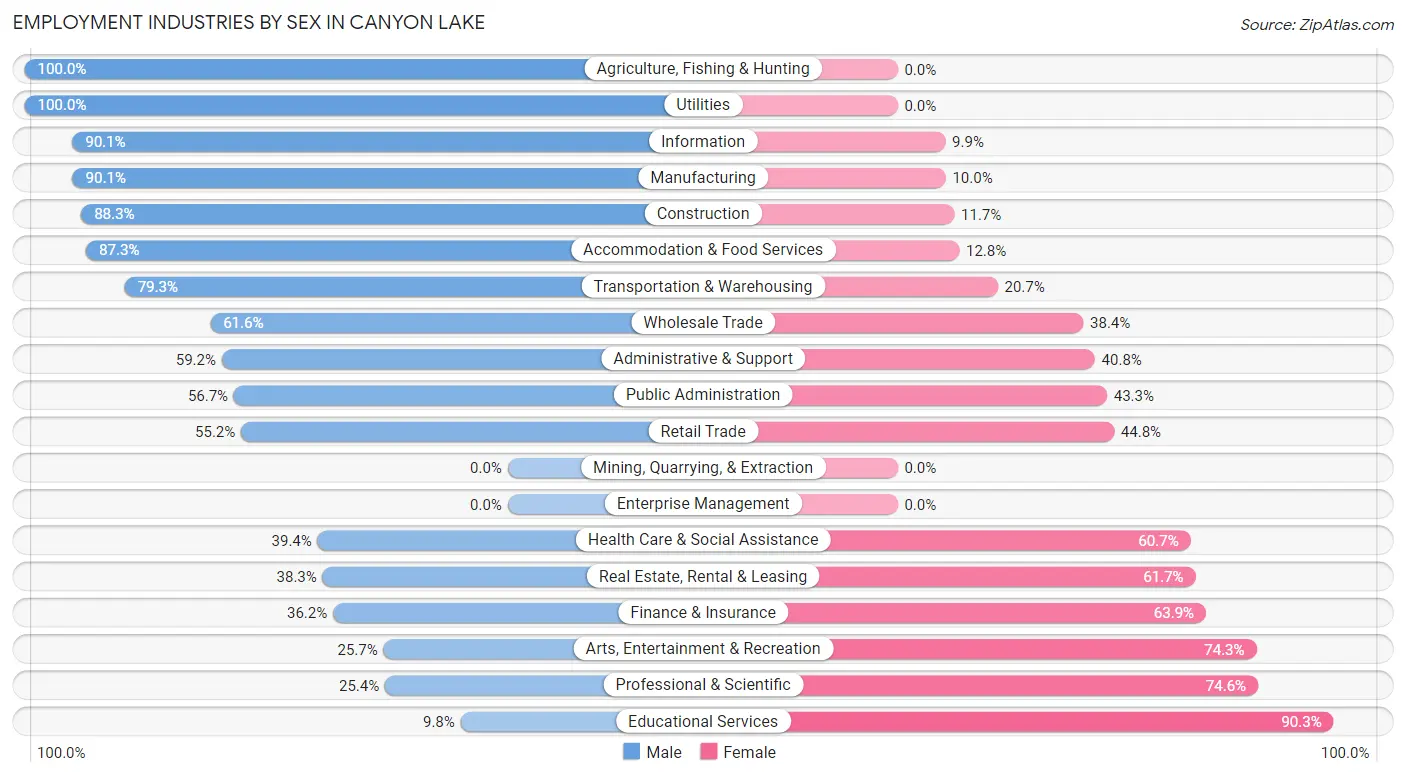
Employment Industries by Sex in Canyon Lake
The Canyon Lake industries that see more men than women are Agriculture, Fishing & Hunting (100.0%), Utilities (100.0%), and Information (90.1%), whereas the industries that tend to have a higher number of women are Educational Services (90.2%), Professional & Scientific (74.6%), and Arts, Entertainment & Recreation (74.3%).
| Industry | Male | Female |
| Agriculture, Fishing & Hunting | 20 (100.0%) | 0 (0.0%) |
| Mining, Quarrying, & Extraction | 0 (0.0%) | 0 (0.0%) |
| Construction | 632 (88.3%) | 84 (11.7%) |
| Manufacturing | 398 (90.0%) | 44 (10.0%) |
| Wholesale Trade | 165 (61.6%) | 103 (38.4%) |
| Retail Trade | 287 (55.2%) | 233 (44.8%) |
| Transportation & Warehousing | 153 (79.3%) | 40 (20.7%) |
| Utilities | 10 (100.0%) | 0 (0.0%) |
| Information | 73 (90.1%) | 8 (9.9%) |
| Finance & Insurance | 171 (36.1%) | 302 (63.8%) |
| Real Estate, Rental & Leasing | 146 (38.3%) | 235 (61.7%) |
| Professional & Scientific | 81 (25.4%) | 238 (74.6%) |
| Enterprise Management | 0 (0.0%) | 0 (0.0%) |
| Administrative & Support | 158 (59.2%) | 109 (40.8%) |
| Educational Services | 35 (9.8%) | 324 (90.2%) |
| Health Care & Social Assistance | 146 (39.4%) | 225 (60.7%) |
| Arts, Entertainment & Recreation | 18 (25.7%) | 52 (74.3%) |
| Accommodation & Food Services | 219 (87.3%) | 32 (12.8%) |
| Public Administration | 153 (56.7%) | 117 (43.3%) |
| Total | 2,913 (57.3%) | 2,174 (42.7%) |
Education in Canyon Lake
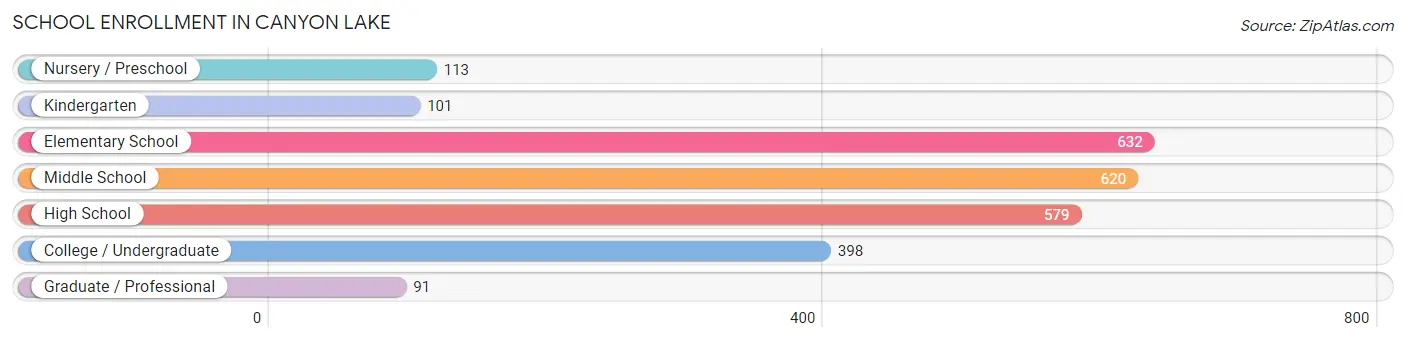
School Enrollment in Canyon Lake
The most common levels of schooling among the 2,534 students in Canyon Lake are elementary school (632 | 24.9%), middle school (620 | 24.5%), and high school (579 | 22.9%).
| School Level | # Students | % Students |
| Nursery / Preschool | 113 | 4.5% |
| Kindergarten | 101 | 4.0% |
| Elementary School | 632 | 24.9% |
| Middle School | 620 | 24.5% |
| High School | 579 | 22.9% |
| College / Undergraduate | 398 | 15.7% |
| Graduate / Professional | 91 | 3.6% |
| Total | 2,534 | 100.0% |
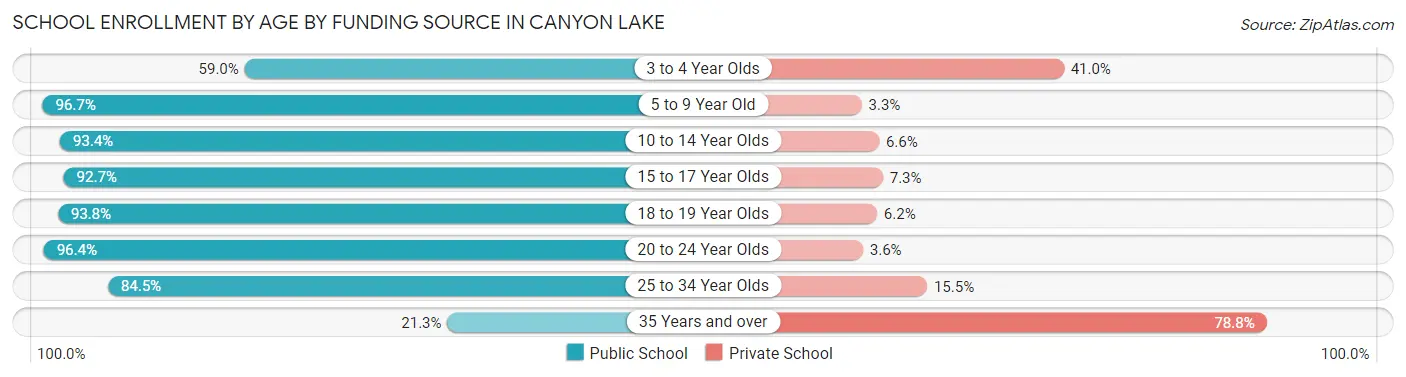
School Enrollment by Age by Funding Source in Canyon Lake
Out of a total of 2,534 students who are enrolled in schools in Canyon Lake, 294 (11.6%) attend a private institution, while the remaining 2,240 (88.4%) are enrolled in public schools. The age group of 35 years and over has the highest likelihood of being enrolled in private schools, with 126 (78.7% in the age bracket) enrolled. Conversely, the age group of 5 to 9 year old has the lowest likelihood of being enrolled in a private school, with 695 (96.7% in the age bracket) attending a public institution.
| Age Bracket | Public School | Private School |
| 3 to 4 Year Olds | 36 (59.0%) | 25 (41.0%) |
| 5 to 9 Year Old | 695 (96.7%) | 24 (3.3%) |
| 10 to 14 Year Olds | 667 (93.4%) | 47 (6.6%) |
| 15 to 17 Year Olds | 446 (92.7%) | 35 (7.3%) |
| 18 to 19 Year Olds | 106 (93.8%) | 7 (6.2%) |
| 20 to 24 Year Olds | 108 (96.4%) | 4 (3.6%) |
| 25 to 34 Year Olds | 147 (84.5%) | 27 (15.5%) |
| 35 Years and over | 34 (21.2%) | 126 (78.7%) |
| Total | 2,240 (88.4%) | 294 (11.6%) |
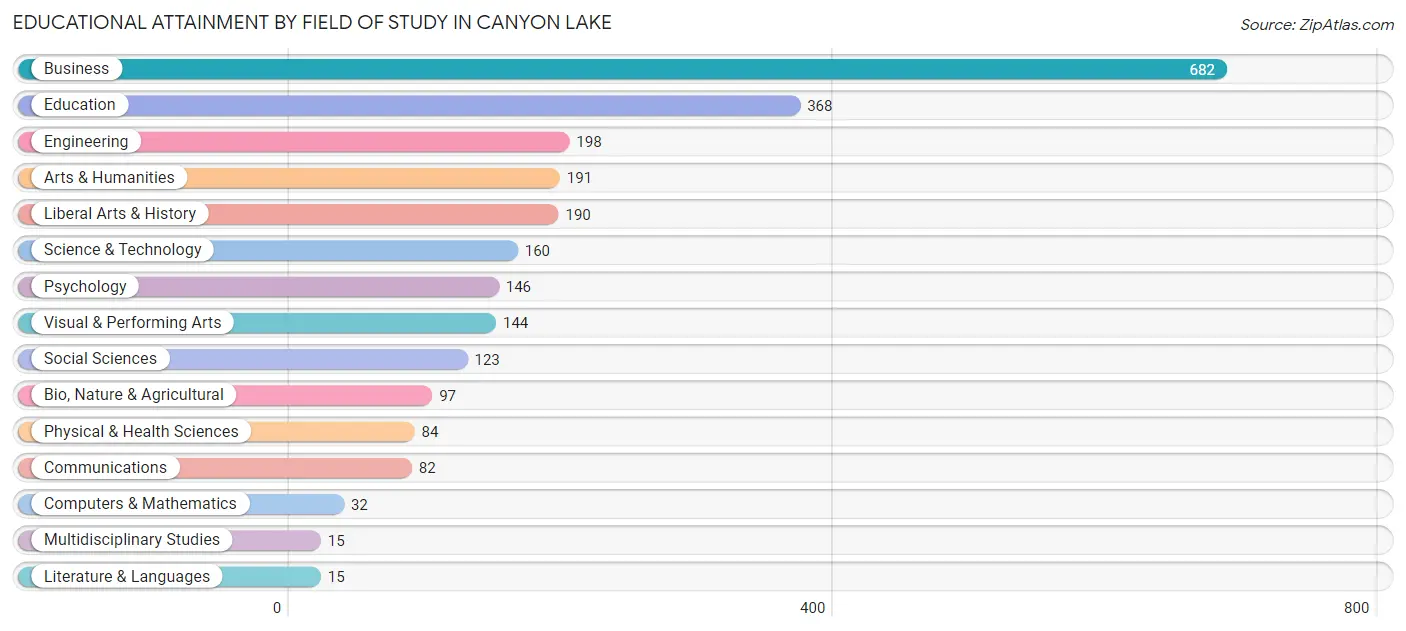
Educational Attainment by Field of Study in Canyon Lake
Business (682 | 27.0%), education (368 | 14.6%), engineering (198 | 7.8%), arts & humanities (191 | 7.6%), and liberal arts & history (190 | 7.5%) are the most common fields of study among 2,527 individuals in Canyon Lake who have obtained a bachelor's degree or higher.
| Field of Study | # Graduates | % Graduates |
| Computers & Mathematics | 32 | 1.3% |
| Bio, Nature & Agricultural | 97 | 3.8% |
| Physical & Health Sciences | 84 | 3.3% |
| Psychology | 146 | 5.8% |
| Social Sciences | 123 | 4.9% |
| Engineering | 198 | 7.8% |
| Multidisciplinary Studies | 15 | 0.6% |
| Science & Technology | 160 | 6.3% |
| Business | 682 | 27.0% |
| Education | 368 | 14.6% |
| Literature & Languages | 15 | 0.6% |
| Liberal Arts & History | 190 | 7.5% |
| Visual & Performing Arts | 144 | 5.7% |
| Communications | 82 | 3.2% |
| Arts & Humanities | 191 | 7.6% |
| Total | 2,527 | 100.0% |
Transportation & Commute in Canyon Lake
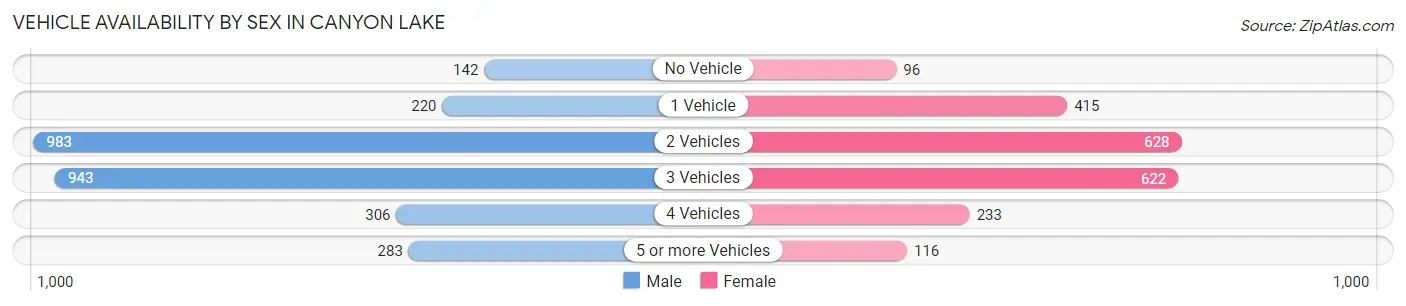
Vehicle Availability by Sex in Canyon Lake
The most prevalent vehicle ownership categories in Canyon Lake are males with 2 vehicles (983, accounting for 34.2%) and females with 2 vehicles (628, making up 46.6%).
| Vehicles Available | Male | Female |
| No Vehicle | 142 (4.9%) | 96 (4.5%) |
| 1 Vehicle | 220 (7.6%) | 415 (19.7%) |
| 2 Vehicles | 983 (34.2%) | 628 (29.8%) |
| 3 Vehicles | 943 (32.8%) | 622 (29.5%) |
| 4 Vehicles | 306 (10.6%) | 233 (11.0%) |
| 5 or more Vehicles | 283 (9.8%) | 116 (5.5%) |
| Total | 2,877 (100.0%) | 2,110 (100.0%) |
Commute Time in Canyon Lake
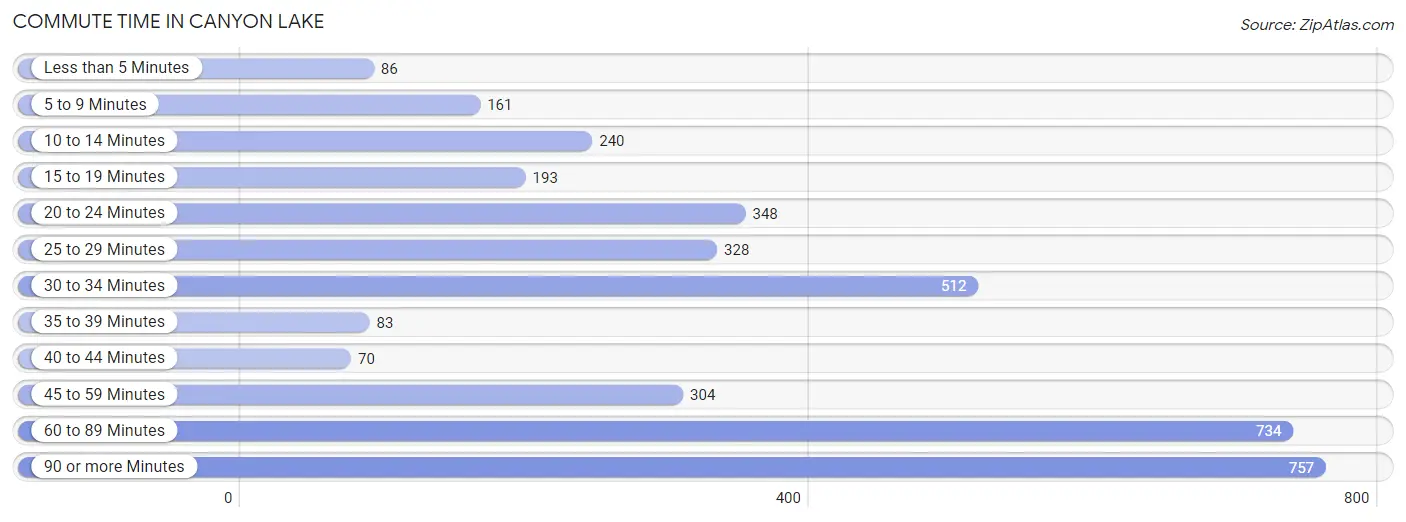
The most frequently occuring commute durations in Canyon Lake are 90 or more minutes (757 commuters, 19.8%), 60 to 89 minutes (734 commuters, 19.2%), and 30 to 34 minutes (512 commuters, 13.4%).
| Commute Time | # Commuters | % Commuters |
| Less than 5 Minutes | 86 | 2.2% |
| 5 to 9 Minutes | 161 | 4.2% |
| 10 to 14 Minutes | 240 | 6.3% |
| 15 to 19 Minutes | 193 | 5.1% |
| 20 to 24 Minutes | 348 | 9.1% |
| 25 to 29 Minutes | 328 | 8.6% |
| 30 to 34 Minutes | 512 | 13.4% |
| 35 to 39 Minutes | 83 | 2.2% |
| 40 to 44 Minutes | 70 | 1.8% |
| 45 to 59 Minutes | 304 | 8.0% |
| 60 to 89 Minutes | 734 | 19.2% |
| 90 or more Minutes | 757 | 19.8% |
Commute Time by Sex in Canyon Lake
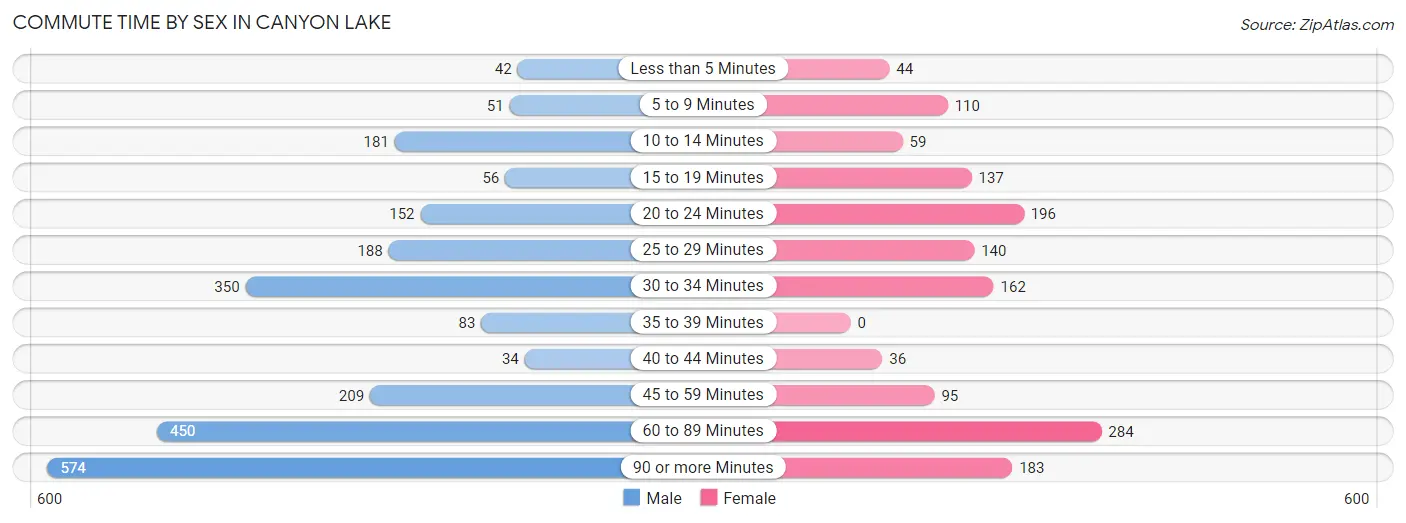
The most common commute times in Canyon Lake are 90 or more minutes (574 commuters, 24.2%) for males and 60 to 89 minutes (284 commuters, 19.6%) for females.
| Commute Time | Male | Female |
| Less than 5 Minutes | 42 (1.8%) | 44 (3.0%) |
| 5 to 9 Minutes | 51 (2.1%) | 110 (7.6%) |
| 10 to 14 Minutes | 181 (7.6%) | 59 (4.1%) |
| 15 to 19 Minutes | 56 (2.4%) | 137 (9.5%) |
| 20 to 24 Minutes | 152 (6.4%) | 196 (13.6%) |
| 25 to 29 Minutes | 188 (7.9%) | 140 (9.7%) |
| 30 to 34 Minutes | 350 (14.8%) | 162 (11.2%) |
| 35 to 39 Minutes | 83 (3.5%) | 0 (0.0%) |
| 40 to 44 Minutes | 34 (1.4%) | 36 (2.5%) |
| 45 to 59 Minutes | 209 (8.8%) | 95 (6.6%) |
| 60 to 89 Minutes | 450 (19.0%) | 284 (19.6%) |
| 90 or more Minutes | 574 (24.2%) | 183 (12.7%) |
Time of Departure to Work by Sex in Canyon Lake
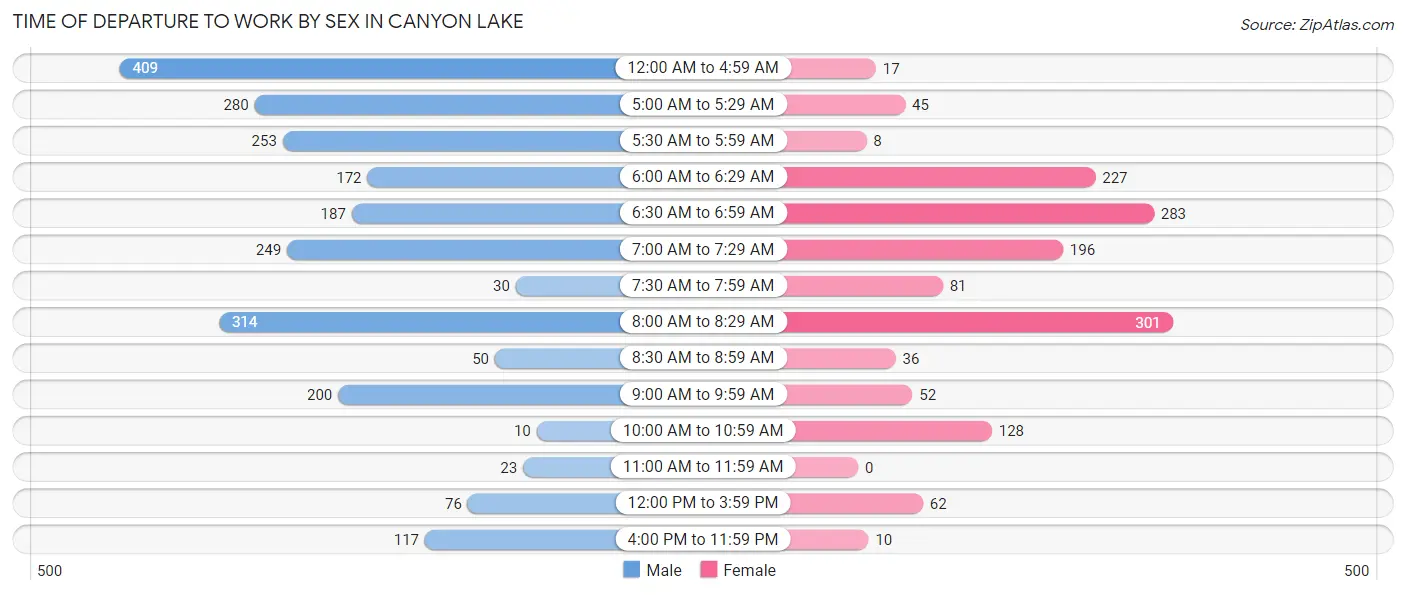
The most frequent times of departure to work in Canyon Lake are 12:00 AM to 4:59 AM (409, 17.3%) for males and 8:00 AM to 8:29 AM (301, 20.8%) for females.
| Time of Departure | Male | Female |
| 12:00 AM to 4:59 AM | 409 (17.3%) | 17 (1.2%) |
| 5:00 AM to 5:29 AM | 280 (11.8%) | 45 (3.1%) |
| 5:30 AM to 5:59 AM | 253 (10.7%) | 8 (0.5%) |
| 6:00 AM to 6:29 AM | 172 (7.3%) | 227 (15.7%) |
| 6:30 AM to 6:59 AM | 187 (7.9%) | 283 (19.6%) |
| 7:00 AM to 7:29 AM | 249 (10.5%) | 196 (13.6%) |
| 7:30 AM to 7:59 AM | 30 (1.3%) | 81 (5.6%) |
| 8:00 AM to 8:29 AM | 314 (13.3%) | 301 (20.8%) |
| 8:30 AM to 8:59 AM | 50 (2.1%) | 36 (2.5%) |
| 9:00 AM to 9:59 AM | 200 (8.4%) | 52 (3.6%) |
| 10:00 AM to 10:59 AM | 10 (0.4%) | 128 (8.8%) |
| 11:00 AM to 11:59 AM | 23 (1.0%) | 0 (0.0%) |
| 12:00 PM to 3:59 PM | 76 (3.2%) | 62 (4.3%) |
| 4:00 PM to 11:59 PM | 117 (4.9%) | 10 (0.7%) |
| Total | 2,370 (100.0%) | 1,446 (100.0%) |
Housing Occupancy in Canyon Lake
Occupancy by Ownership in Canyon Lake
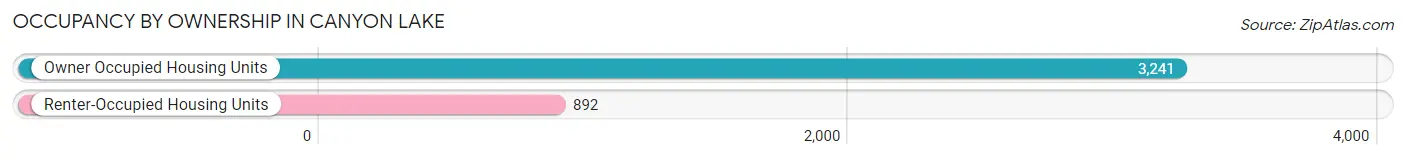
Of the total 4,133 dwellings in Canyon Lake, owner-occupied units account for 3,241 (78.4%), while renter-occupied units make up 892 (21.6%).
| Occupancy | # Housing Units | % Housing Units |
| Owner Occupied Housing Units | 3,241 | 78.4% |
| Renter-Occupied Housing Units | 892 | 21.6% |
| Total Occupied Housing Units | 4,133 | 100.0% |
Occupancy by Household Size in Canyon Lake
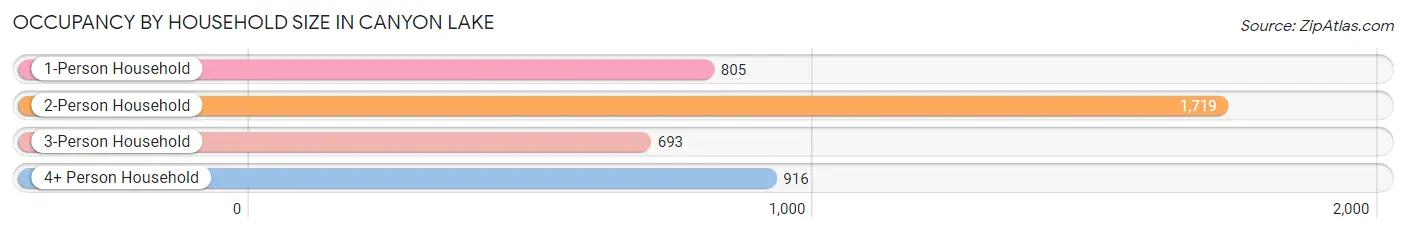
| Household Size | # Housing Units | % Housing Units |
| 1-Person Household | 805 | 19.5% |
| 2-Person Household | 1,719 | 41.6% |
| 3-Person Household | 693 | 16.8% |
| 4+ Person Household | 916 | 22.2% |
| Total Housing Units | 4,133 | 100.0% |
Occupancy by Ownership by Household Size in Canyon Lake
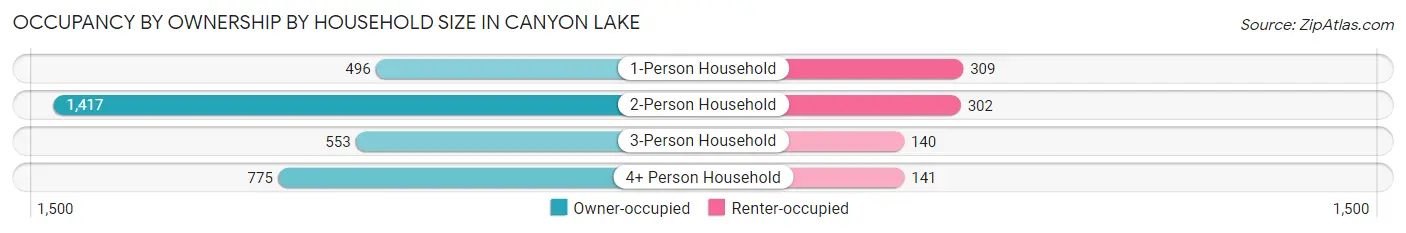
| Household Size | Owner-occupied | Renter-occupied |
| 1-Person Household | 496 (61.6%) | 309 (38.4%) |
| 2-Person Household | 1,417 (82.4%) | 302 (17.6%) |
| 3-Person Household | 553 (79.8%) | 140 (20.2%) |
| 4+ Person Household | 775 (84.6%) | 141 (15.4%) |
| Total Housing Units | 3,241 (78.4%) | 892 (21.6%) |
Occupancy by Educational Attainment in Canyon Lake
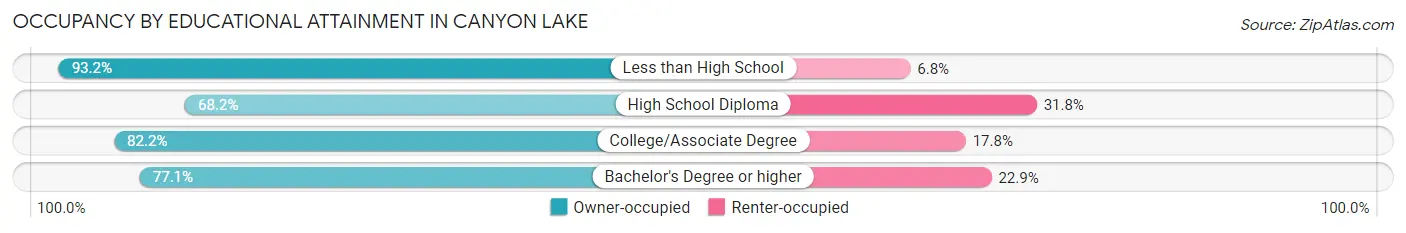
| Household Size | Owner-occupied | Renter-occupied |
| Less than High School | 124 (93.2%) | 9 (6.8%) |
| High School Diploma | 484 (68.2%) | 226 (31.8%) |
| College/Associate Degree | 1,533 (82.2%) | 331 (17.8%) |
| Bachelor's Degree or higher | 1,100 (77.1%) | 326 (22.9%) |
Occupancy by Age of Householder in Canyon Lake
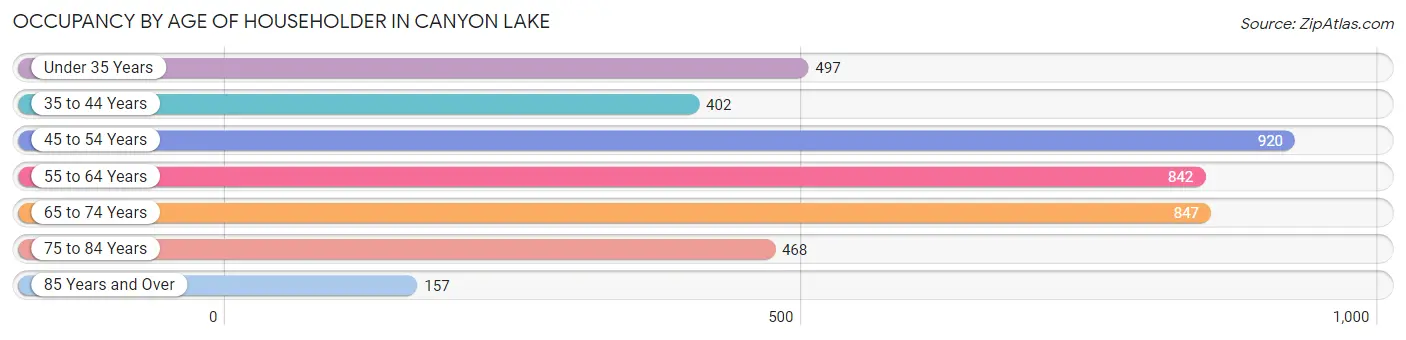
| Age Bracket | # Households | % Households |
| Under 35 Years | 497 | 12.0% |
| 35 to 44 Years | 402 | 9.7% |
| 45 to 54 Years | 920 | 22.3% |
| 55 to 64 Years | 842 | 20.4% |
| 65 to 74 Years | 847 | 20.5% |
| 75 to 84 Years | 468 | 11.3% |
| 85 Years and Over | 157 | 3.8% |
| Total | 4,133 | 100.0% |
Housing Finances in Canyon Lake
Median Income by Occupancy in Canyon Lake
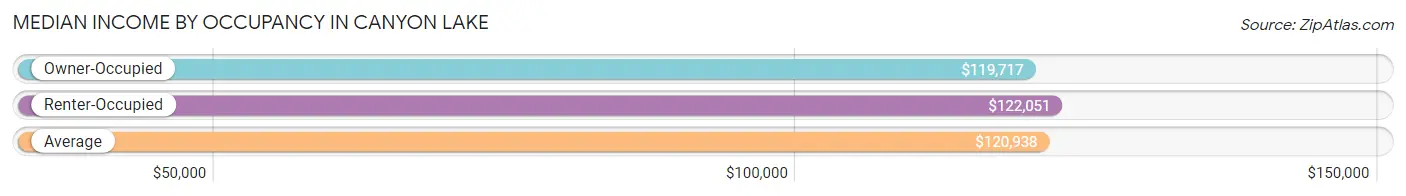
| Occupancy Type | # Households | Median Income |
| Owner-Occupied | 3,241 (78.4%) | $119,717 |
| Renter-Occupied | 892 (21.6%) | $122,051 |
| Average | 4,133 (100.0%) | $120,938 |
Occupancy by Householder Income Bracket in Canyon Lake
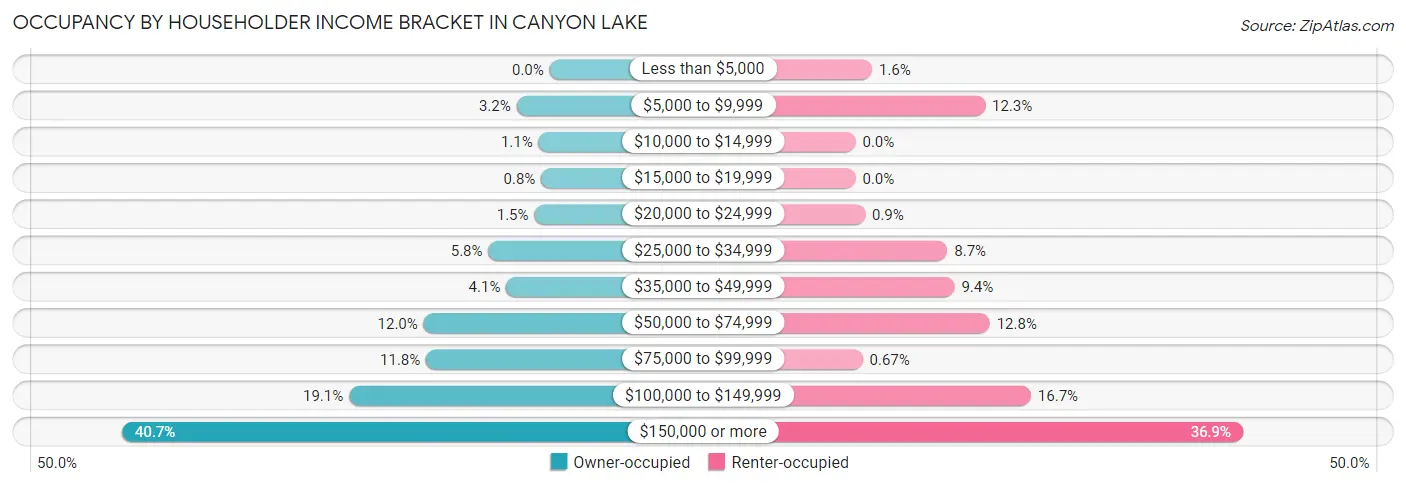
| Income Bracket | Owner-occupied | Renter-occupied |
| Less than $5,000 | 0 (0.0%) | 14 (1.6%) |
| $5,000 to $9,999 | 102 (3.2%) | 110 (12.3%) |
| $10,000 to $14,999 | 34 (1.1%) | 0 (0.0%) |
| $15,000 to $19,999 | 26 (0.8%) | 0 (0.0%) |
| $20,000 to $24,999 | 47 (1.5%) | 8 (0.9%) |
| $25,000 to $34,999 | 189 (5.8%) | 78 (8.7%) |
| $35,000 to $49,999 | 134 (4.1%) | 84 (9.4%) |
| $50,000 to $74,999 | 389 (12.0%) | 114 (12.8%) |
| $75,000 to $99,999 | 381 (11.8%) | 6 (0.7%) |
| $100,000 to $149,999 | 619 (19.1%) | 149 (16.7%) |
| $150,000 or more | 1,320 (40.7%) | 329 (36.9%) |
| Total | 3,241 (100.0%) | 892 (100.0%) |
Monthly Housing Cost Tiers in Canyon Lake
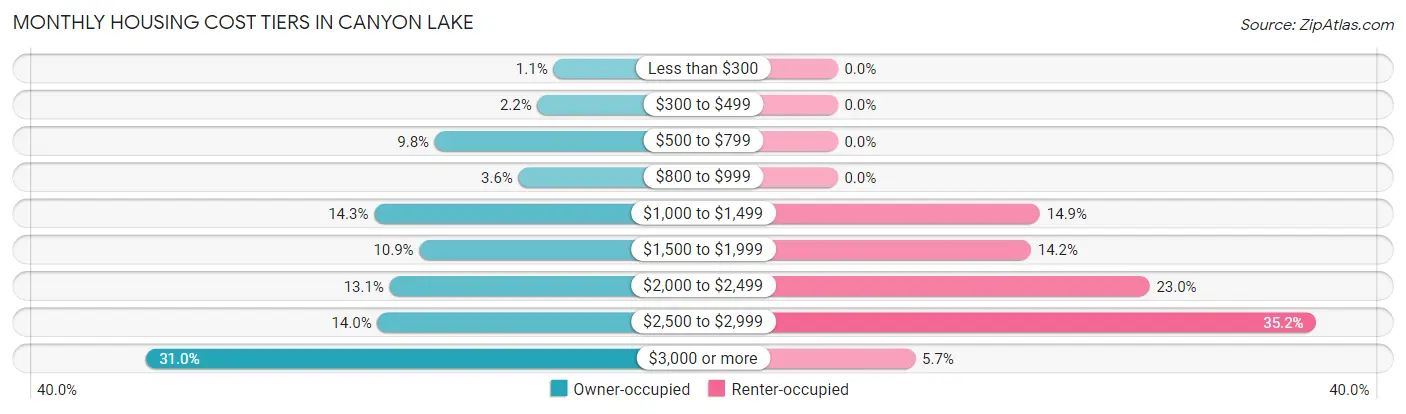
| Monthly Cost | Owner-occupied | Renter-occupied |
| Less than $300 | 34 (1.1%) | 0 (0.0%) |
| $300 to $499 | 72 (2.2%) | 0 (0.0%) |
| $500 to $799 | 317 (9.8%) | 0 (0.0%) |
| $800 to $999 | 117 (3.6%) | 0 (0.0%) |
| $1,000 to $1,499 | 462 (14.2%) | 133 (14.9%) |
| $1,500 to $1,999 | 354 (10.9%) | 127 (14.2%) |
| $2,000 to $2,499 | 425 (13.1%) | 205 (23.0%) |
| $2,500 to $2,999 | 454 (14.0%) | 314 (35.2%) |
| $3,000 or more | 1,006 (31.0%) | 51 (5.7%) |
| Total | 3,241 (100.0%) | 892 (100.0%) |
Physical Housing Characteristics in Canyon Lake
Housing Structures in Canyon Lake
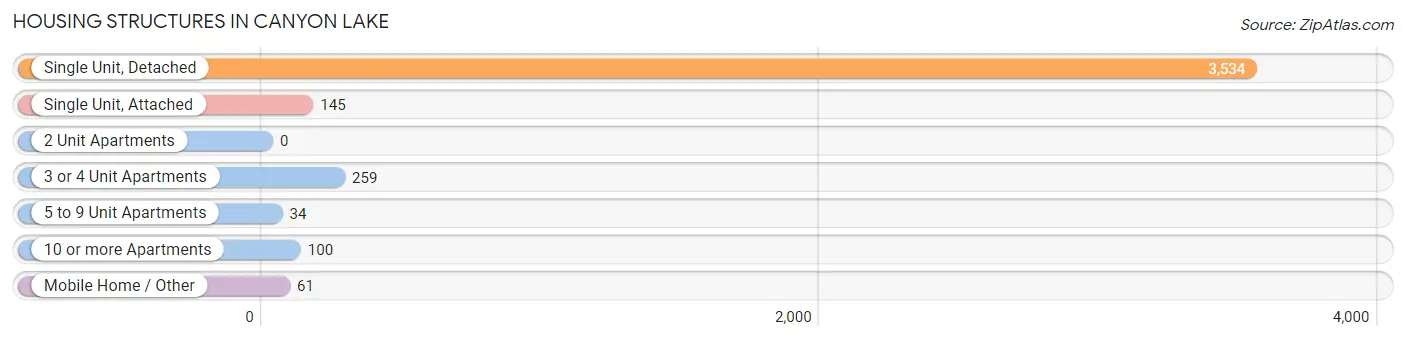
| Structure Type | # Housing Units | % Housing Units |
| Single Unit, Detached | 3,534 | 85.5% |
| Single Unit, Attached | 145 | 3.5% |
| 2 Unit Apartments | 0 | 0.0% |
| 3 or 4 Unit Apartments | 259 | 6.3% |
| 5 to 9 Unit Apartments | 34 | 0.8% |
| 10 or more Apartments | 100 | 2.4% |
| Mobile Home / Other | 61 | 1.5% |
| Total | 4,133 | 100.0% |
Housing Structures by Occupancy in Canyon Lake
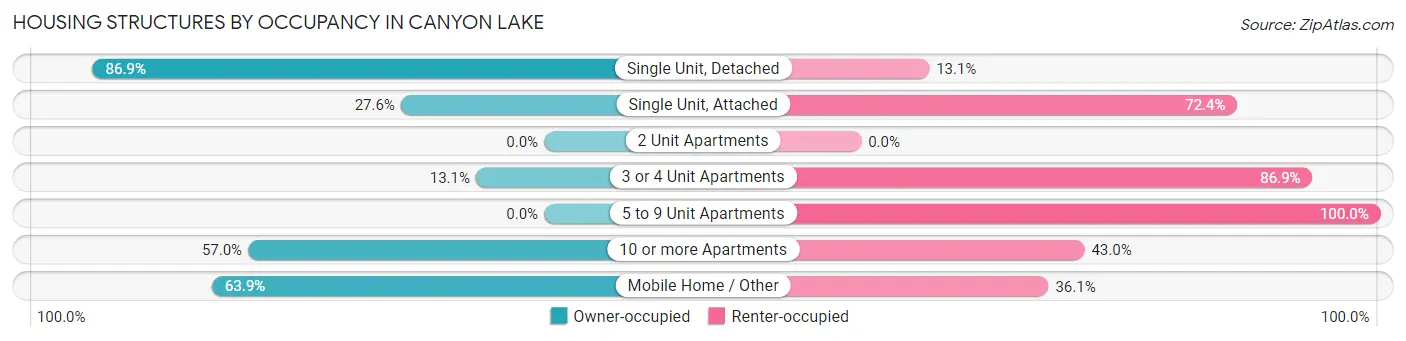
| Structure Type | Owner-occupied | Renter-occupied |
| Single Unit, Detached | 3,071 (86.9%) | 463 (13.1%) |
| Single Unit, Attached | 40 (27.6%) | 105 (72.4%) |
| 2 Unit Apartments | 0 (0.0%) | 0 (0.0%) |
| 3 or 4 Unit Apartments | 34 (13.1%) | 225 (86.9%) |
| 5 to 9 Unit Apartments | 0 (0.0%) | 34 (100.0%) |
| 10 or more Apartments | 57 (57.0%) | 43 (43.0%) |
| Mobile Home / Other | 39 (63.9%) | 22 (36.1%) |
| Total | 3,241 (78.4%) | 892 (21.6%) |
Housing Structures by Number of Rooms in Canyon Lake
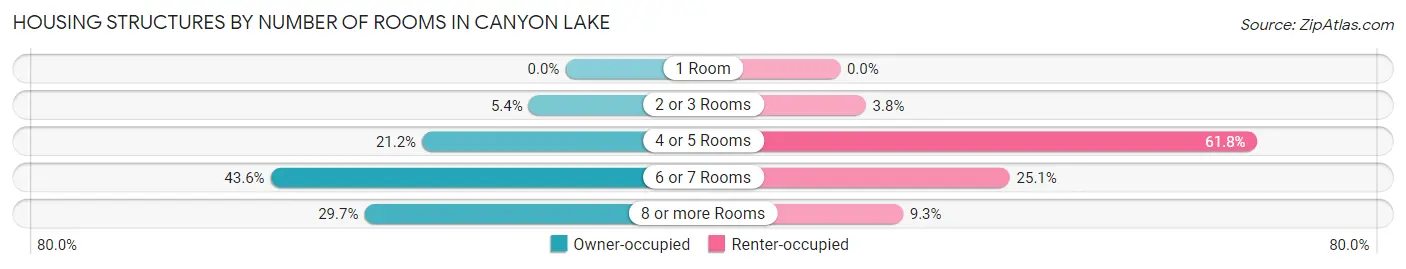
| Number of Rooms | Owner-occupied | Renter-occupied |
| 1 Room | 0 (0.0%) | 0 (0.0%) |
| 2 or 3 Rooms | 176 (5.4%) | 34 (3.8%) |
| 4 or 5 Rooms | 687 (21.2%) | 551 (61.8%) |
| 6 or 7 Rooms | 1,414 (43.6%) | 224 (25.1%) |
| 8 or more Rooms | 964 (29.7%) | 83 (9.3%) |
| Total | 3,241 (100.0%) | 892 (100.0%) |
Housing Structure by Heating Type in Canyon Lake
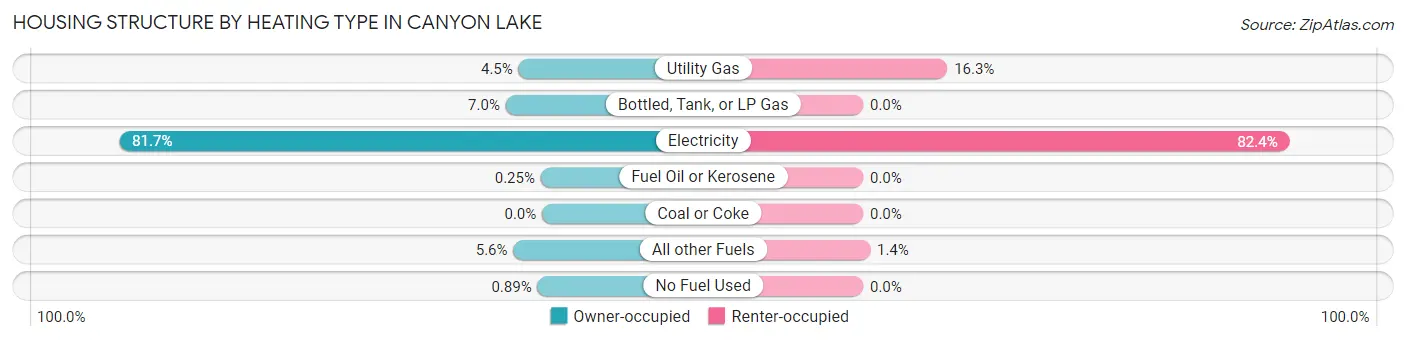
| Heating Type | Owner-occupied | Renter-occupied |
| Utility Gas | 147 (4.5%) | 145 (16.3%) |
| Bottled, Tank, or LP Gas | 228 (7.0%) | 0 (0.0%) |
| Electricity | 2,649 (81.7%) | 735 (82.4%) |
| Fuel Oil or Kerosene | 8 (0.3%) | 0 (0.0%) |
| Coal or Coke | 0 (0.0%) | 0 (0.0%) |
| All other Fuels | 180 (5.6%) | 12 (1.3%) |
| No Fuel Used | 29 (0.9%) | 0 (0.0%) |
| Total | 3,241 (100.0%) | 892 (100.0%) |
Household Vehicle Usage in Canyon Lake

| Vehicles per Household | Owner-occupied | Renter-occupied |
| No Vehicle | 62 (1.9%) | 40 (4.5%) |
| 1 Vehicle | 543 (16.8%) | 456 (51.1%) |
| 2 Vehicles | 1,417 (43.7%) | 178 (20.0%) |
| 3 or more Vehicles | 1,219 (37.6%) | 218 (24.4%) |
| Total | 3,241 (100.0%) | 892 (100.0%) |
Real Estate & Mortgages in Canyon Lake
Real Estate and Mortgage Overview in Canyon Lake
| Characteristic | Without Mortgage | With Mortgage |
| Housing Units | 1,021 | 2,220 |
| Median Property Value | $615,900 | $595,000 |
| Median Household Income | $81,450 | $1,075 |
| Monthly Housing Costs | $950 | $1,006 |
| Real Estate Taxes | $4,890 | $22 |
Property Value by Mortgage Status in Canyon Lake
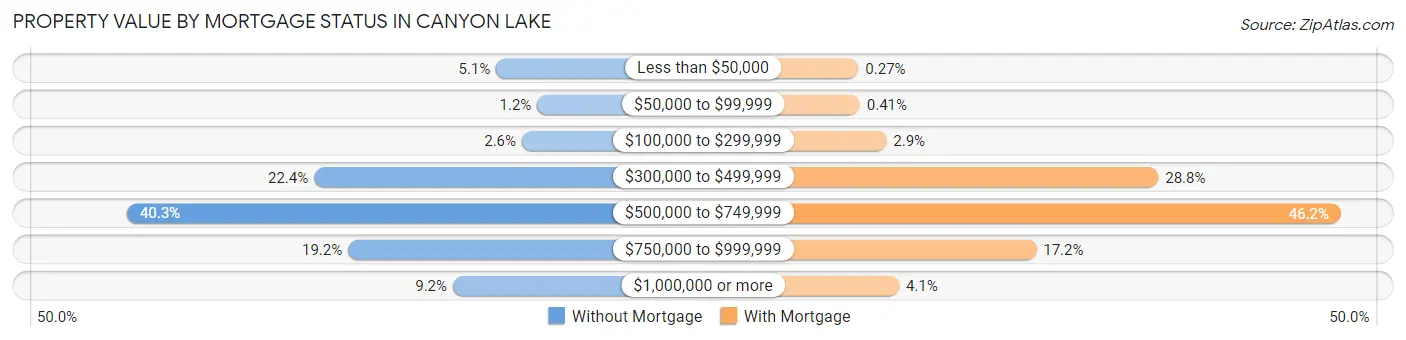
| Property Value | Without Mortgage | With Mortgage |
| Less than $50,000 | 52 (5.1%) | 6 (0.3%) |
| $50,000 to $99,999 | 12 (1.2%) | 9 (0.4%) |
| $100,000 to $299,999 | 27 (2.6%) | 65 (2.9%) |
| $300,000 to $499,999 | 229 (22.4%) | 640 (28.8%) |
| $500,000 to $749,999 | 411 (40.3%) | 1,026 (46.2%) |
| $750,000 to $999,999 | 196 (19.2%) | 382 (17.2%) |
| $1,000,000 or more | 94 (9.2%) | 92 (4.1%) |
| Total | 1,021 (100.0%) | 2,220 (100.0%) |
Household Income by Mortgage Status in Canyon Lake
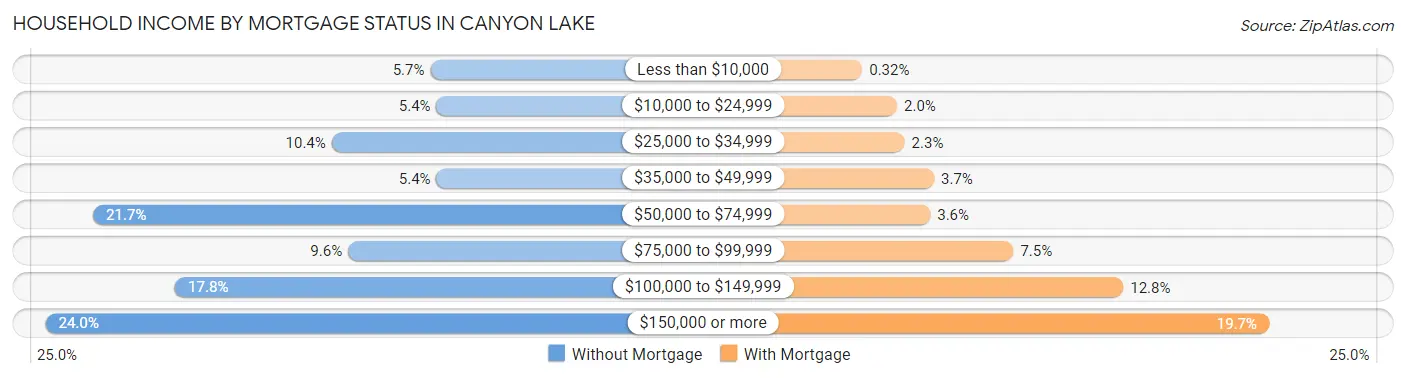
| Household Income | Without Mortgage | With Mortgage |
| Less than $10,000 | 58 (5.7%) | 7 (0.3%) |
| $10,000 to $24,999 | 55 (5.4%) | 44 (2.0%) |
| $25,000 to $34,999 | 106 (10.4%) | 52 (2.3%) |
| $35,000 to $49,999 | 55 (5.4%) | 83 (3.7%) |
| $50,000 to $74,999 | 222 (21.7%) | 79 (3.6%) |
| $75,000 to $99,999 | 98 (9.6%) | 167 (7.5%) |
| $100,000 to $149,999 | 182 (17.8%) | 283 (12.8%) |
| $150,000 or more | 245 (24.0%) | 437 (19.7%) |
| Total | 1,021 (100.0%) | 2,220 (100.0%) |
Property Value to Household Income Ratio in Canyon Lake
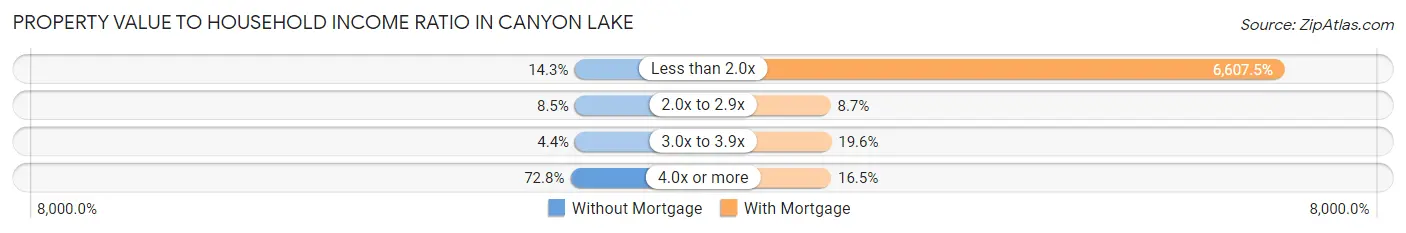
| Value-to-Income Ratio | Without Mortgage | With Mortgage |
| Less than 2.0x | 146 (14.3%) | 146,687 (6,607.5%) |
| 2.0x to 2.9x | 87 (8.5%) | 193 (8.7%) |
| 3.0x to 3.9x | 45 (4.4%) | 434 (19.6%) |
| 4.0x or more | 743 (72.8%) | 367 (16.5%) |
| Total | 1,021 (100.0%) | 2,220 (100.0%) |
Real Estate Taxes by Mortgage Status in Canyon Lake
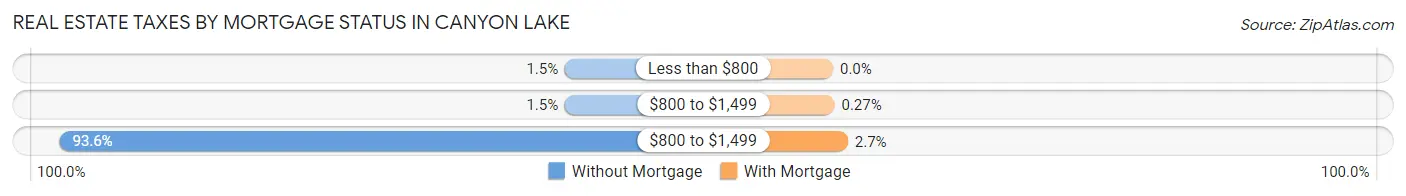
| Property Taxes | Without Mortgage | With Mortgage |
| Less than $800 | 15 (1.5%) | 0 (0.0%) |
| $800 to $1,499 | 15 (1.5%) | 6 (0.3%) |
| $800 to $1,499 | 956 (93.6%) | 60 (2.7%) |
| Total | 1,021 (100.0%) | 2,220 (100.0%) |
Health & Disability in Canyon Lake
Health Insurance Coverage by Age in Canyon Lake
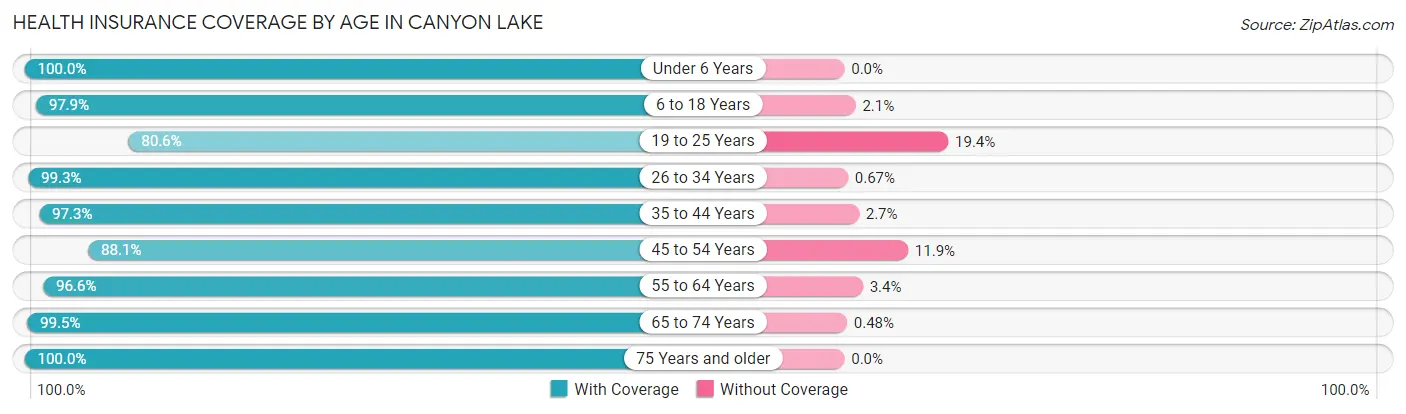
| Age Bracket | With Coverage | Without Coverage |
| Under 6 Years | 586 (100.0%) | 0 (0.0%) |
| 6 to 18 Years | 1,923 (97.9%) | 41 (2.1%) |
| 19 to 25 Years | 479 (80.6%) | 115 (19.4%) |
| 26 to 34 Years | 1,178 (99.3%) | 8 (0.7%) |
| 35 to 44 Years | 1,191 (97.3%) | 33 (2.7%) |
| 45 to 54 Years | 1,405 (88.1%) | 189 (11.9%) |
| 55 to 64 Years | 1,599 (96.6%) | 57 (3.4%) |
| 65 to 74 Years | 1,446 (99.5%) | 7 (0.5%) |
| 75 Years and older | 851 (100.0%) | 0 (0.0%) |
| Total | 10,658 (96.0%) | 450 (4.1%) |
Health Insurance Coverage by Citizenship Status in Canyon Lake
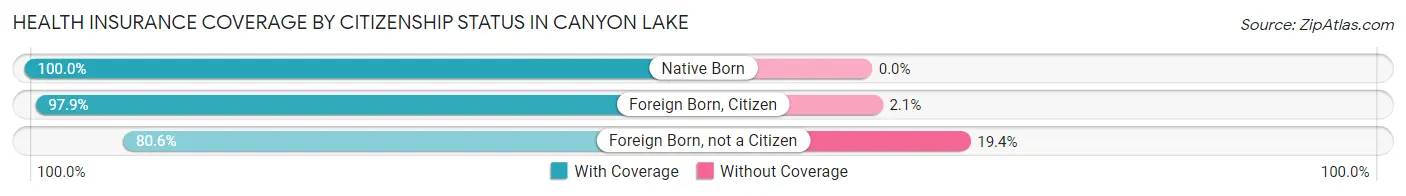
| Citizenship Status | With Coverage | Without Coverage |
| Native Born | 586 (100.0%) | 0 (0.0%) |
| Foreign Born, Citizen | 1,923 (97.9%) | 41 (2.1%) |
| Foreign Born, not a Citizen | 479 (80.6%) | 115 (19.4%) |
Health Insurance Coverage by Household Income in Canyon Lake
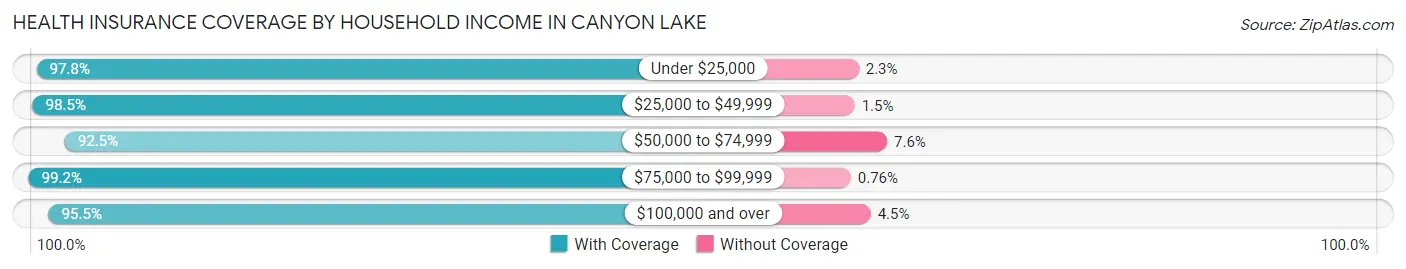
| Household Income | With Coverage | Without Coverage |
| Under $25,000 | 477 (97.8%) | 11 (2.2%) |
| $25,000 to $49,999 | 1,127 (98.5%) | 17 (1.5%) |
| $50,000 to $74,999 | 1,126 (92.4%) | 92 (7.5%) |
| $75,000 to $99,999 | 1,042 (99.2%) | 8 (0.8%) |
| $100,000 and over | 6,866 (95.5%) | 322 (4.5%) |
Public vs Private Health Insurance Coverage by Age in Canyon Lake
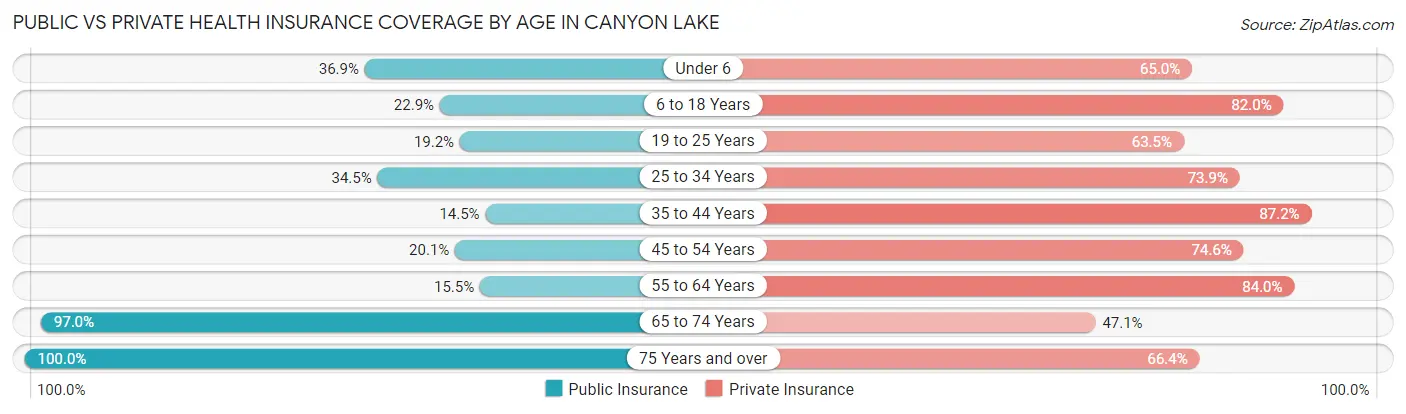
| Age Bracket | Public Insurance | Private Insurance |
| Under 6 | 216 (36.9%) | 381 (65.0%) |
| 6 to 18 Years | 450 (22.9%) | 1,610 (82.0%) |
| 19 to 25 Years | 114 (19.2%) | 377 (63.5%) |
| 25 to 34 Years | 409 (34.5%) | 876 (73.9%) |
| 35 to 44 Years | 177 (14.5%) | 1,067 (87.2%) |
| 45 to 54 Years | 320 (20.1%) | 1,189 (74.6%) |
| 55 to 64 Years | 256 (15.5%) | 1,391 (84.0%) |
| 65 to 74 Years | 1,409 (97.0%) | 684 (47.1%) |
| 75 Years and over | 851 (100.0%) | 565 (66.4%) |
| Total | 4,202 (37.8%) | 8,140 (73.3%) |
Disability Status by Sex by Age in Canyon Lake
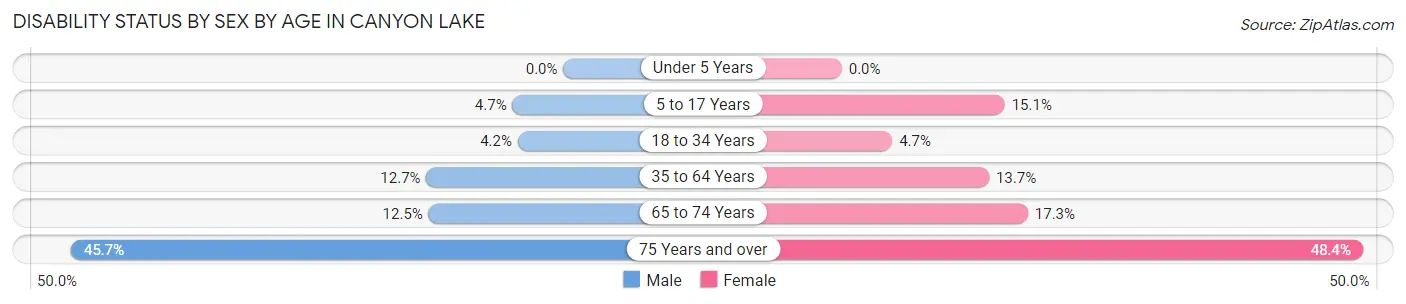
| Age Bracket | Male | Female |
| Under 5 Years | 0 (0.0%) | 0 (0.0%) |
| 5 to 17 Years | 44 (4.7%) | 169 (15.1%) |
| 18 to 34 Years | 40 (4.2%) | 45 (4.7%) |
| 35 to 64 Years | 296 (12.7%) | 293 (13.7%) |
| 65 to 74 Years | 81 (12.5%) | 139 (17.3%) |
| 75 Years and over | 181 (45.7%) | 220 (48.3%) |
Disability Class by Sex by Age in Canyon Lake
Disability Class: Hearing Difficulty
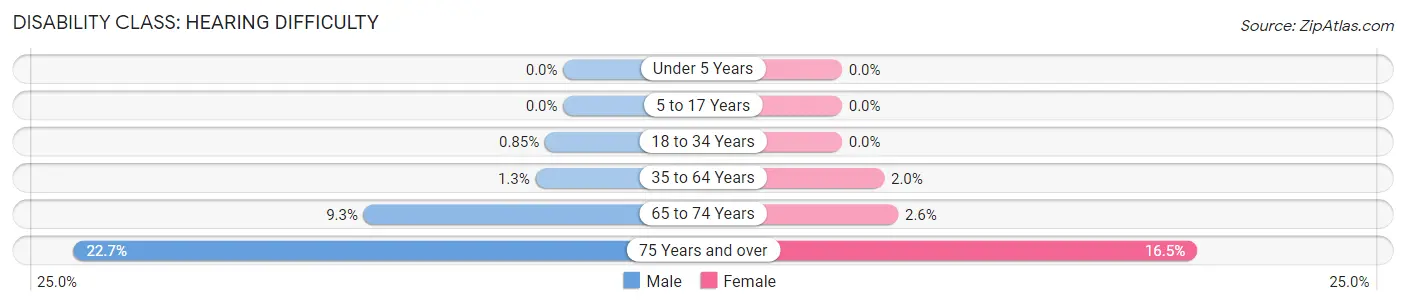
| Age Bracket | Male | Female |
| Under 5 Years | 0 (0.0%) | 0 (0.0%) |
| 5 to 17 Years | 0 (0.0%) | 0 (0.0%) |
| 18 to 34 Years | 8 (0.9%) | 0 (0.0%) |
| 35 to 64 Years | 30 (1.3%) | 42 (2.0%) |
| 65 to 74 Years | 60 (9.3%) | 21 (2.6%) |
| 75 Years and over | 90 (22.7%) | 75 (16.5%) |
Disability Class: Vision Difficulty
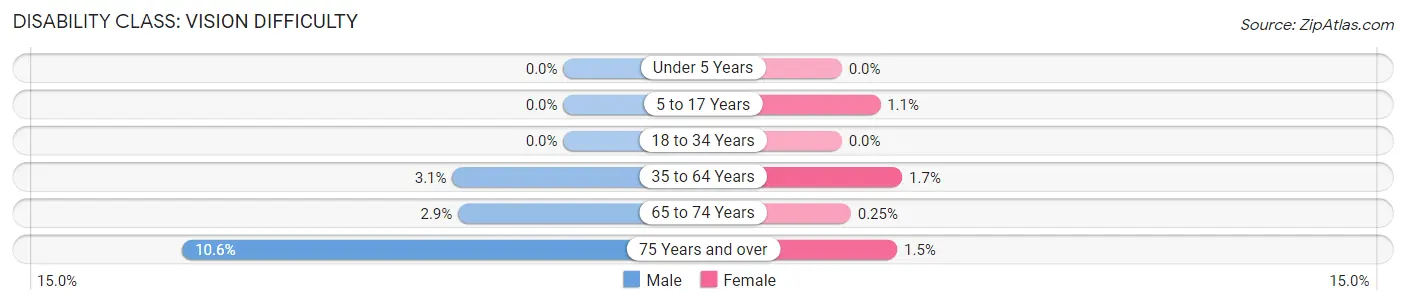
| Age Bracket | Male | Female |
| Under 5 Years | 0 (0.0%) | 0 (0.0%) |
| 5 to 17 Years | 0 (0.0%) | 12 (1.1%) |
| 18 to 34 Years | 0 (0.0%) | 0 (0.0%) |
| 35 to 64 Years | 72 (3.1%) | 36 (1.7%) |
| 65 to 74 Years | 19 (2.9%) | 2 (0.3%) |
| 75 Years and over | 42 (10.6%) | 7 (1.5%) |
Disability Class: Cognitive Difficulty
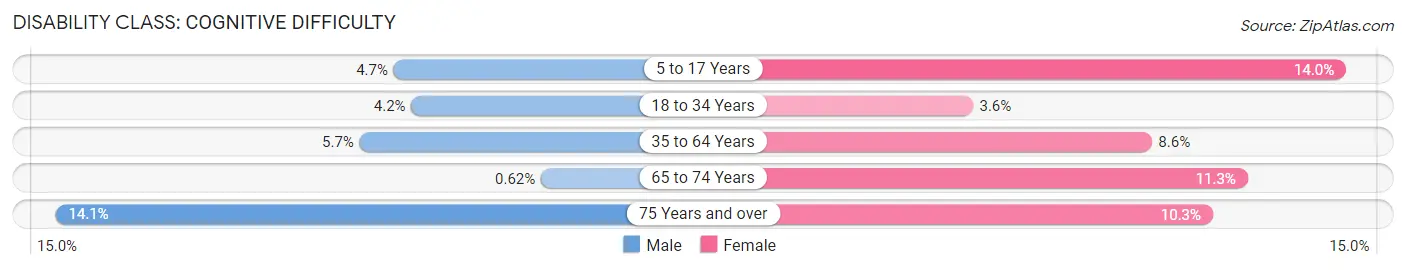
| Age Bracket | Male | Female |
| 5 to 17 Years | 44 (4.7%) | 157 (14.0%) |
| 18 to 34 Years | 40 (4.2%) | 35 (3.6%) |
| 35 to 64 Years | 132 (5.7%) | 185 (8.6%) |
| 65 to 74 Years | 4 (0.6%) | 91 (11.3%) |
| 75 Years and over | 56 (14.1%) | 47 (10.3%) |
Disability Class: Ambulatory Difficulty
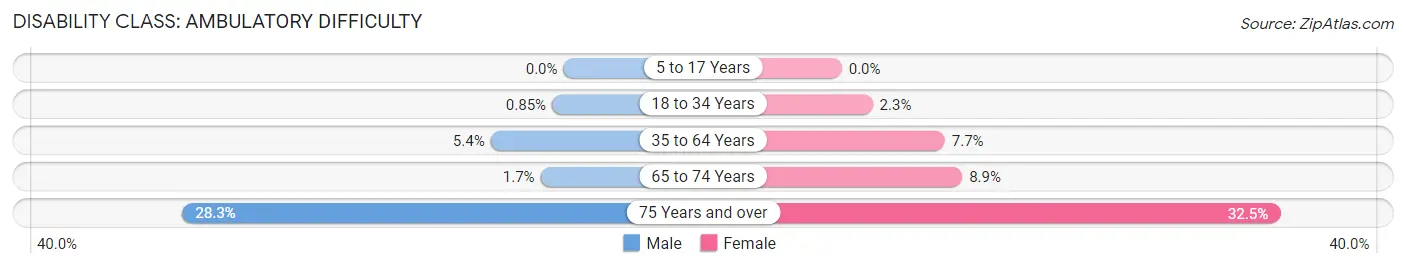
| Age Bracket | Male | Female |
| 5 to 17 Years | 0 (0.0%) | 0 (0.0%) |
| 18 to 34 Years | 8 (0.9%) | 22 (2.3%) |
| 35 to 64 Years | 126 (5.4%) | 164 (7.6%) |
| 65 to 74 Years | 11 (1.7%) | 72 (8.9%) |
| 75 Years and over | 112 (28.3%) | 148 (32.5%) |
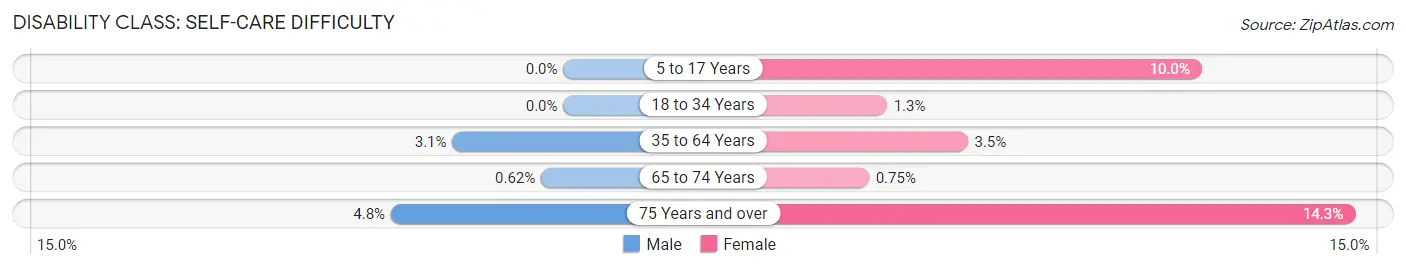
Disability Class: Self-Care Difficulty
| Age Bracket | Male | Female |
| 5 to 17 Years | 0 (0.0%) | 112 (10.0%) |
| 18 to 34 Years | 0 (0.0%) | 12 (1.3%) |
| 35 to 64 Years | 72 (3.1%) | 75 (3.5%) |
| 65 to 74 Years | 4 (0.6%) | 6 (0.7%) |
| 75 Years and over | 19 (4.8%) | 65 (14.3%) |
Technology Access in Canyon Lake
Computing Device Access in Canyon Lake
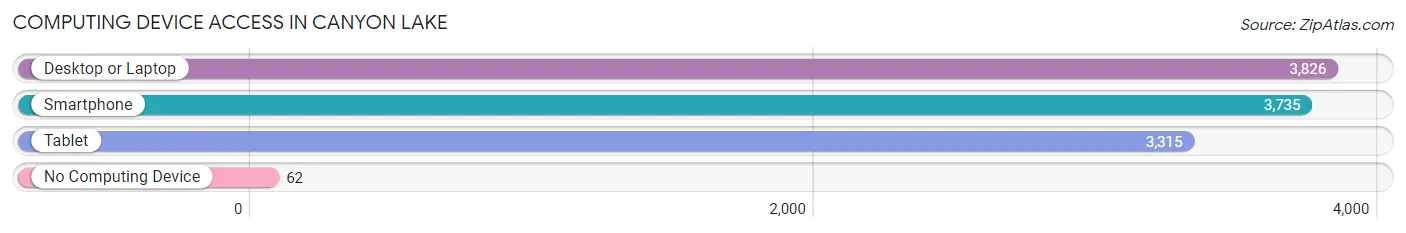
| Device Type | # Households | % Households |
| Desktop or Laptop | 3,826 | 92.6% |
| Smartphone | 3,735 | 90.4% |
| Tablet | 3,315 | 80.2% |
| No Computing Device | 62 | 1.5% |
| Total | 4,133 | 100.0% |
Internet Access in Canyon Lake
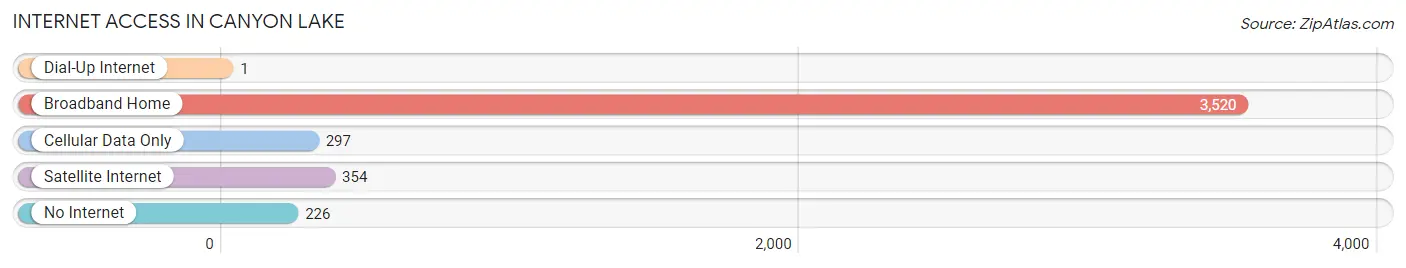
| Internet Type | # Households | % Households |
| Dial-Up Internet | 1 | 0.0% |
| Broadband Home | 3,520 | 85.2% |
| Cellular Data Only | 297 | 7.2% |
| Satellite Internet | 354 | 8.6% |
| No Internet | 226 | 5.5% |
| Total | 4,133 | 100.0% |
Canyon Lake Summary
Canyon Lake is a city located in Riverside County, California, United States. It is situated in the foothills of the Santa Ana Mountains, about 25 miles (40 km) east of Riverside, and about 30 miles (48 km) northeast of San Diego. The city is part of the Inland Empire metropolitan area and is located in the Temescal Valley. As of the 2010 census, the city had a population of 10,561.
History
Canyon Lake was originally inhabited by the Serrano Indians, who were the first people to settle in the area. The Serrano Indians were a peaceful tribe who lived off the land and were known for their basket weaving and pottery. The area was first explored by Spanish missionaries in the late 1700s.
In the early 1900s, the area was developed as a resort community. The first homes were built in the 1920s and 1930s. The city was incorporated in 1990 and has since grown to become a popular destination for outdoor recreation.
Geography
Canyon Lake is located in the foothills of the Santa Ana Mountains, about 25 miles (40 km) east of Riverside and about 30 miles (48 km) northeast of San Diego. The city is part of the Inland Empire metropolitan area and is located in the Temescal Valley. The city is situated at an elevation of 1,200 feet (366 m) above sea level.
The city covers an area of 8.3 square miles (21.5 km2), of which 8.2 square miles (21.3 km2) is land and 0.1 square miles (0.2 km2) is water. The city is surrounded by the Cleveland National Forest and is home to several lakes, including Canyon Lake, Lake Elsinore, and Lake Skinner.
Economy
Canyon Lake has a diverse economy that is largely driven by tourism. The city is home to several resorts, golf courses, and other recreational facilities that attract visitors from all over the world. The city also has a thriving retail sector, with several shopping centers and restaurants.
The city is also home to several manufacturing and technology companies, including a large medical device manufacturer. The city is also home to a number of small businesses, including a winery, a brewery, and a distillery.
Demographics
As of the 2010 census, the city had a population of 10,561. The racial makeup of the city was 79.2% White, 0.7% African American, 0.7% Native American, 1.2% Asian, 0.1% Pacific Islander, 15.2% from other races, and 3.0% from two or more races. Hispanic or Latino of any race were 28.2% of the population.
The median income for a household in the city was $63,945, and the median income for a family was $71,945. The per capita income for the city was $30,945. About 6.2% of families and 8.2% of the population were below the poverty line, including 11.2% of those under age 18 and 4.2% of those age 65 or over.
Canyon Lake is a growing city with a diverse economy and a vibrant culture. The city is home to several recreational facilities, shopping centers, and businesses that attract visitors from all over the world. The city is also home to a number of small businesses, including a winery, a brewery, and a distillery. The city has a diverse population and a median income that is higher than the national average.
Common Questions
What is the Total Population of Canyon Lake?
Total Population of Canyon Lake is 11,108.
What is the Total Male Population of Canyon Lake?
Total Male Population of Canyon Lake is 5,460.
What is the Total Female Population of Canyon Lake?
Total Female Population of Canyon Lake is 5,648.
What is the Ratio of Males per 100 Females in Canyon Lake?
There are 96.67 Males per 100 Females in Canyon Lake.
What is the Ratio of Females per 100 Males in Canyon Lake?
There are 103.44 Females per 100 Males in Canyon Lake.
What is the Median Population Age in Canyon Lake?
Median Population Age in Canyon Lake is 45.0 Years.
What is the Average Family Size in Canyon Lake
Average Family Size in Canyon Lake is 3.1 People.
What is the Average Household Size in Canyon Lake
Average Household Size in Canyon Lake is 2.7 People.
What is Per Capita Income in Canyon Lake?
Per Capita income in Canyon Lake is $58,583.
What is the Median Family Income in Canyon Lake?
Median Family Income in Canyon Lake is $132,275.
What is the Median Household income in Canyon Lake?
Median Household Income in Canyon Lake is $120,938.
What is Income or Wage Gap in Canyon Lake?
Income or Wage Gap in Canyon Lake is 35.8%.
Women in Canyon Lake earn 64.2 cents for every dollar earned by a man.
What is Inequality or Gini Index in Canyon Lake?
Inequality or Gini Index in Canyon Lake is 0.46.
How Large is the Labor Force in Canyon Lake?
There are 5,279 People in the Labor Forcein in Canyon Lake.
What is the Percentage of People in the Labor Force in Canyon Lake?
59.2% of People are in the Labor Force in Canyon Lake.
What is the Unemployment Rate in Canyon Lake?
Unemployment Rate in Canyon Lake is 3.7%.