Shasta County, CA
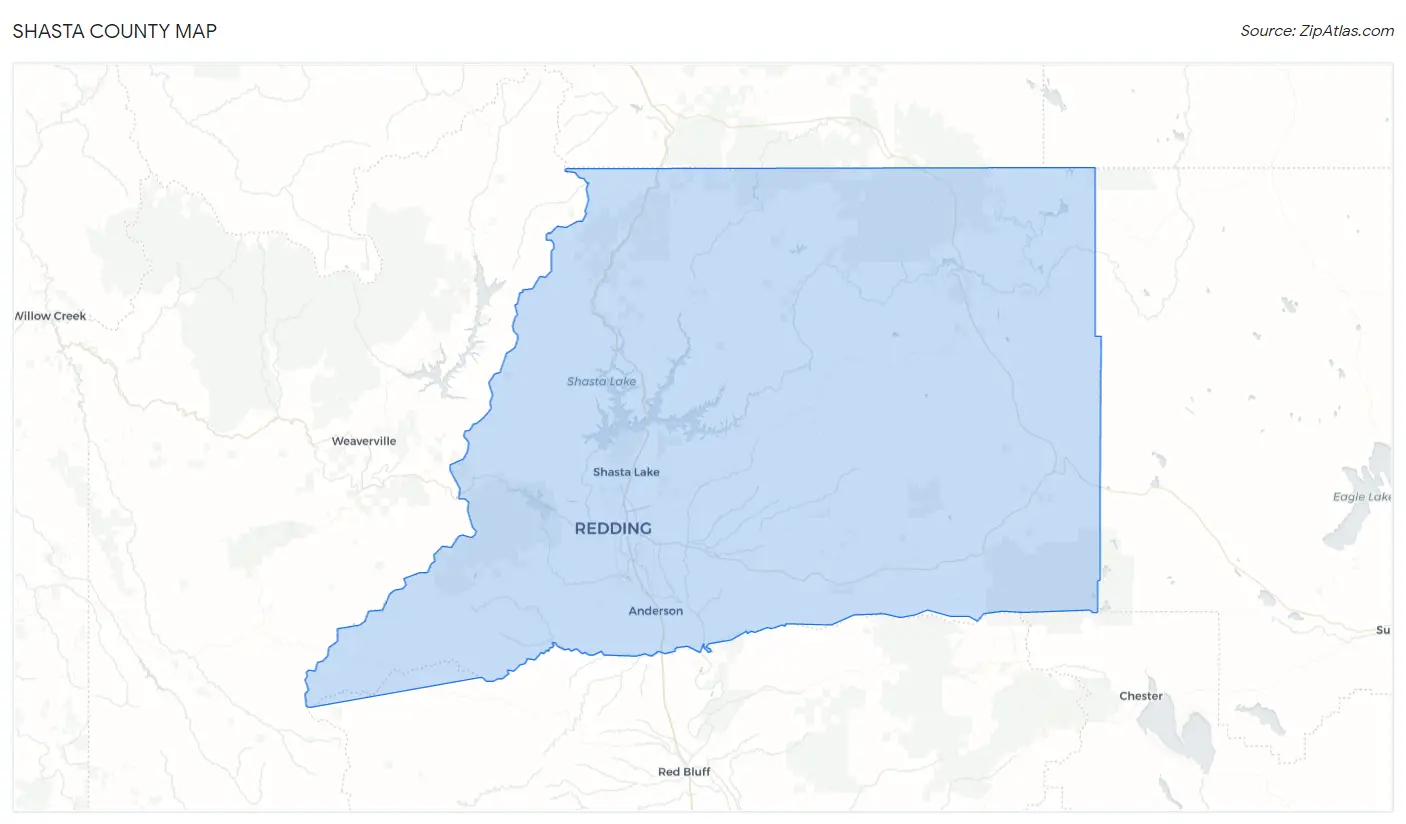
Shasta County Map
Shasta County Overview
181,852
TOTAL POPULATION
89,879
MALE POPULATION
91,973
FEMALE POPULATION
97.72
MALES / 100 FEMALES
102.33
FEMALES / 100 MALES
41.7
MEDIAN AGE
3.0
AVG FAMILY SIZE
2.5
AVG HOUSEHOLD SIZE
$36,458
PER CAPITA INCOME
$85,284
AVG FAMILY INCOME
$68,347
AVG HOUSEHOLD INCOME
30.2%
WAGE / INCOME GAP [ % ]
69.8¢/ $1
WAGE / INCOME GAP [ $ ]
$10,494
FAMILY INCOME DEFICIT
0.46
INEQUALITY / GINI INDEX
81,695
LABOR FORCE [ PEOPLE ]
55.6%
PERCENT IN LABOR FORCE
6.6%
UNEMPLOYMENT RATE
Shasta County Area Codes
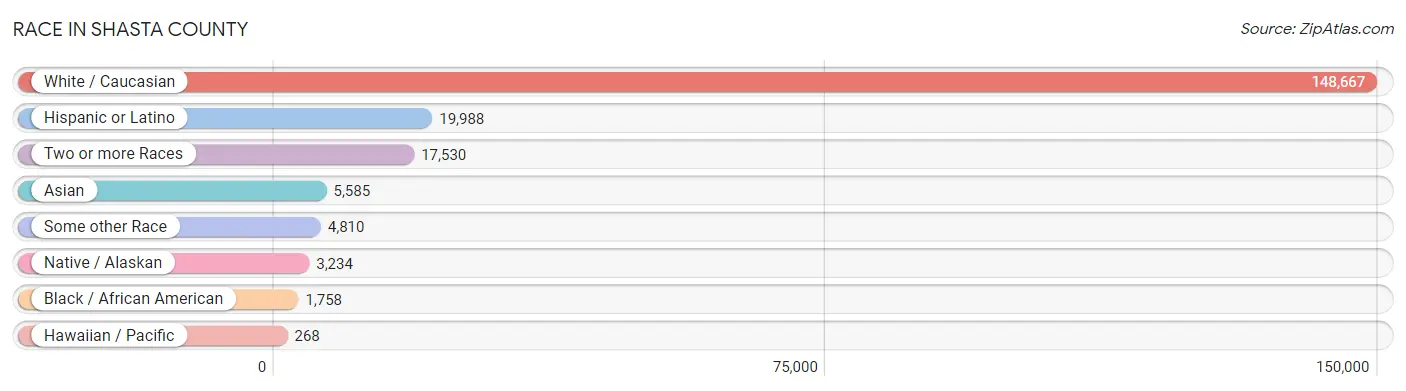
Race in Shasta County
The most populous races in Shasta County are White / Caucasian (148,667 | 81.8%), Hispanic or Latino (19,988 | 11.0%), and Two or more Races (17,530 | 9.6%).
| Race | # Population | % Population |
| Asian | 5,585 | 3.1% |
| Black / African American | 1,758 | 1.0% |
| Hawaiian / Pacific | 268 | 0.2% |
| Hispanic or Latino | 19,988 | 11.0% |
| Native / Alaskan | 3,234 | 1.8% |
| White / Caucasian | 148,667 | 81.8% |
| Two or more Races | 17,530 | 9.6% |
| Some other Race | 4,810 | 2.6% |
| Total | 181,852 | 100.0% |
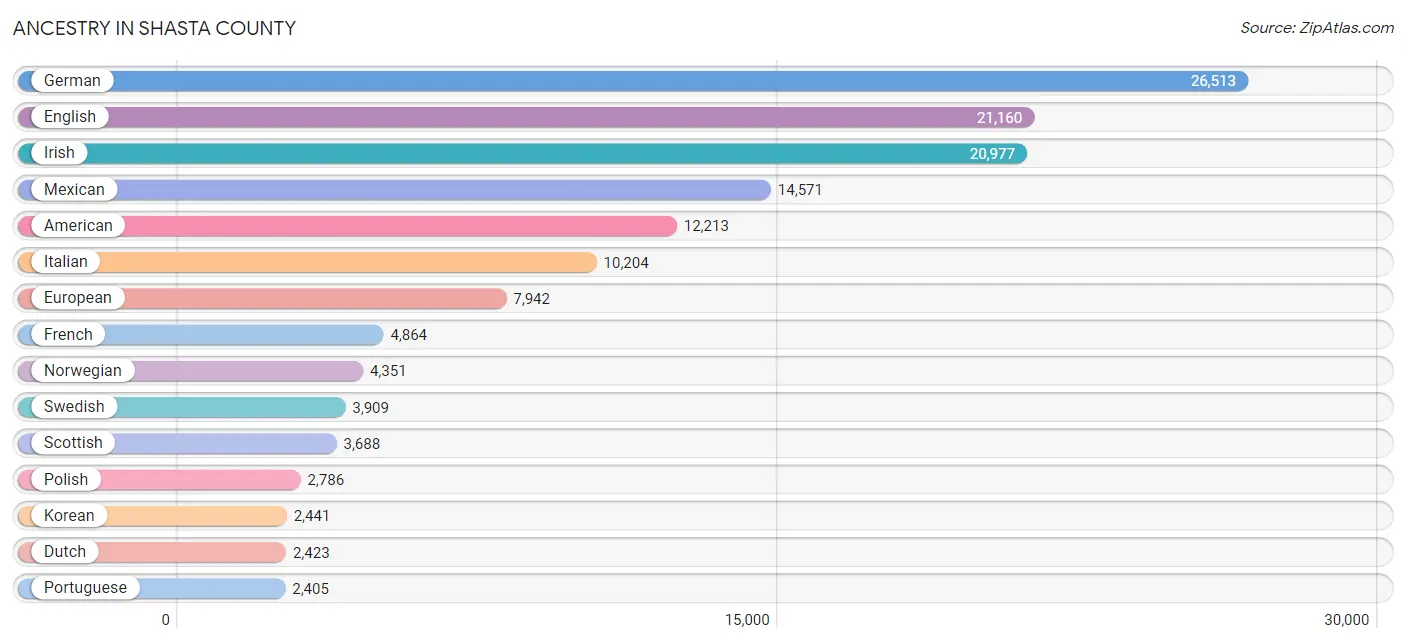
Ancestry in Shasta County
The most populous ancestries reported in Shasta County are German (26,513 | 14.6%), English (21,160 | 11.6%), Irish (20,977 | 11.5%), Mexican (14,571 | 8.0%), and American (12,213 | 6.7%), together accounting for 52.5% of all Shasta County residents.
| Ancestry | # Population | % Population |
| Afghan | 6 | 0.0% |
| African | 32 | 0.0% |
| Alaska Native | 8 | 0.0% |
| Alaskan Athabascan | 67 | 0.0% |
| Albanian | 14 | 0.0% |
| Aleut | 6 | 0.0% |
| American | 12,213 | 6.7% |
| Apache | 282 | 0.2% |
| Arab | 608 | 0.3% |
| Argentinean | 31 | 0.0% |
| Armenian | 139 | 0.1% |
| Assyrian / Chaldean / Syriac | 116 | 0.1% |
| Australian | 68 | 0.0% |
| Austrian | 293 | 0.2% |
| Bangladeshi | 291 | 0.2% |
| Basque | 178 | 0.1% |
| Belgian | 98 | 0.1% |
| Belizean | 2 | 0.0% |
| Bhutanese | 540 | 0.3% |
| Blackfeet | 351 | 0.2% |
| Bolivian | 46 | 0.0% |
| Brazilian | 191 | 0.1% |
| British | 1,488 | 0.8% |
| British West Indian | 5 | 0.0% |
| Bulgarian | 17 | 0.0% |
| Burmese | 599 | 0.3% |
| Canadian | 602 | 0.3% |
| Carpatho Rusyn | 21 | 0.0% |
| Celtic | 71 | 0.0% |
| Central American | 1,079 | 0.6% |
| Central American Indian | 205 | 0.1% |
| Cherokee | 1,282 | 0.7% |
| Cheyenne | 8 | 0.0% |
| Chickasaw | 159 | 0.1% |
| Chilean | 39 | 0.0% |
| Chippewa | 103 | 0.1% |
| Choctaw | 567 | 0.3% |
| Colombian | 158 | 0.1% |
| Colville | 14 | 0.0% |
| Comanche | 25 | 0.0% |
| Costa Rican | 139 | 0.1% |
| Cree | 16 | 0.0% |
| Creek | 31 | 0.0% |
| Croatian | 151 | 0.1% |
| Cuban | 160 | 0.1% |
| Czech | 618 | 0.3% |
| Czechoslovakian | 271 | 0.2% |
| Danish | 1,523 | 0.8% |
| Delaware | 3 | 0.0% |
| Dominican | 7 | 0.0% |
| Dutch | 2,423 | 1.3% |
| Dutch West Indian | 22 | 0.0% |
| Eastern European | 608 | 0.3% |
| Ecuadorian | 5 | 0.0% |
| English | 21,160 | 11.6% |
| Estonian | 42 | 0.0% |
| Ethiopian | 16 | 0.0% |
| European | 7,942 | 4.4% |
| Filipino | 108 | 0.1% |
| Finnish | 423 | 0.2% |
| French | 4,864 | 2.7% |
| French Canadian | 795 | 0.4% |
| German | 26,513 | 14.6% |
| Greek | 725 | 0.4% |
| Guamanian / Chamorro | 207 | 0.1% |
| Guatemalan | 159 | 0.1% |
| Haitian | 10 | 0.0% |
| Honduran | 23 | 0.0% |
| Hungarian | 316 | 0.2% |
| Icelander | 60 | 0.0% |
| Indian (Asian) | 1,049 | 0.6% |
| Indonesian | 36 | 0.0% |
| Inupiat | 55 | 0.0% |
| Iranian | 285 | 0.2% |
| Iraqi | 57 | 0.0% |
| Irish | 20,977 | 11.5% |
| Iroquois | 35 | 0.0% |
| Italian | 10,204 | 5.6% |
| Jamaican | 43 | 0.0% |
| Japanese | 12 | 0.0% |
| Korean | 2,441 | 1.3% |
| Laotian | 21 | 0.0% |
| Latvian | 83 | 0.1% |
| Lebanese | 199 | 0.1% |
| Liberian | 8 | 0.0% |
| Lithuanian | 121 | 0.1% |
| Lumbee | 7 | 0.0% |
| Luxembourger | 16 | 0.0% |
| Malaysian | 741 | 0.4% |
| Maltese | 49 | 0.0% |
| Marshallese | 41 | 0.0% |
| Mexican | 14,571 | 8.0% |
| Mexican American Indian | 170 | 0.1% |
| Moroccan | 38 | 0.0% |
| Native Hawaiian | 506 | 0.3% |
| Navajo | 176 | 0.1% |
| Nepalese | 810 | 0.4% |
| New Zealander | 17 | 0.0% |
| Nicaraguan | 331 | 0.2% |
| Northern European | 714 | 0.4% |
| Norwegian | 4,351 | 2.4% |
| Osage | 24 | 0.0% |
| Paiute | 51 | 0.0% |
| Pakistani | 205 | 0.1% |
| Palestinian | 3 | 0.0% |
| Panamanian | 252 | 0.1% |
| Paraguayan | 9 | 0.0% |
| Pennsylvania German | 75 | 0.0% |
| Peruvian | 129 | 0.1% |
| Polish | 2,786 | 1.5% |
| Portuguese | 2,405 | 1.3% |
| Potawatomi | 45 | 0.0% |
| Pueblo | 26 | 0.0% |
| Puerto Rican | 729 | 0.4% |
| Romanian | 131 | 0.1% |
| Russian | 1,014 | 0.6% |
| Salvadoran | 175 | 0.1% |
| Samoan | 76 | 0.0% |
| Scandinavian | 1,011 | 0.6% |
| Scotch-Irish | 1,628 | 0.9% |
| Scottish | 3,688 | 2.0% |
| Seminole | 19 | 0.0% |
| Senegalese | 32 | 0.0% |
| Serbian | 25 | 0.0% |
| Shoshone | 124 | 0.1% |
| Sioux | 204 | 0.1% |
| Slavic | 43 | 0.0% |
| Slovak | 79 | 0.0% |
| South African | 166 | 0.1% |
| South American | 431 | 0.2% |
| South American Indian | 12 | 0.0% |
| Spaniard | 1,380 | 0.8% |
| Spanish | 753 | 0.4% |
| Spanish American Indian | 9 | 0.0% |
| Sri Lankan | 535 | 0.3% |
| Subsaharan African | 290 | 0.2% |
| Swedish | 3,909 | 2.1% |
| Swiss | 906 | 0.5% |
| Syrian | 160 | 0.1% |
| Thai | 786 | 0.4% |
| Tlingit-Haida | 10 | 0.0% |
| Tongan | 19 | 0.0% |
| Turkish | 20 | 0.0% |
| Ukrainian | 465 | 0.3% |
| Venezuelan | 14 | 0.0% |
| Welsh | 1,404 | 0.8% |
| West Indian | 21 | 0.0% |
| Yakama | 26 | 0.0% |
| Yaqui | 8 | 0.0% |
| Yugoslavian | 88 | 0.1% | View All 150 Rows |
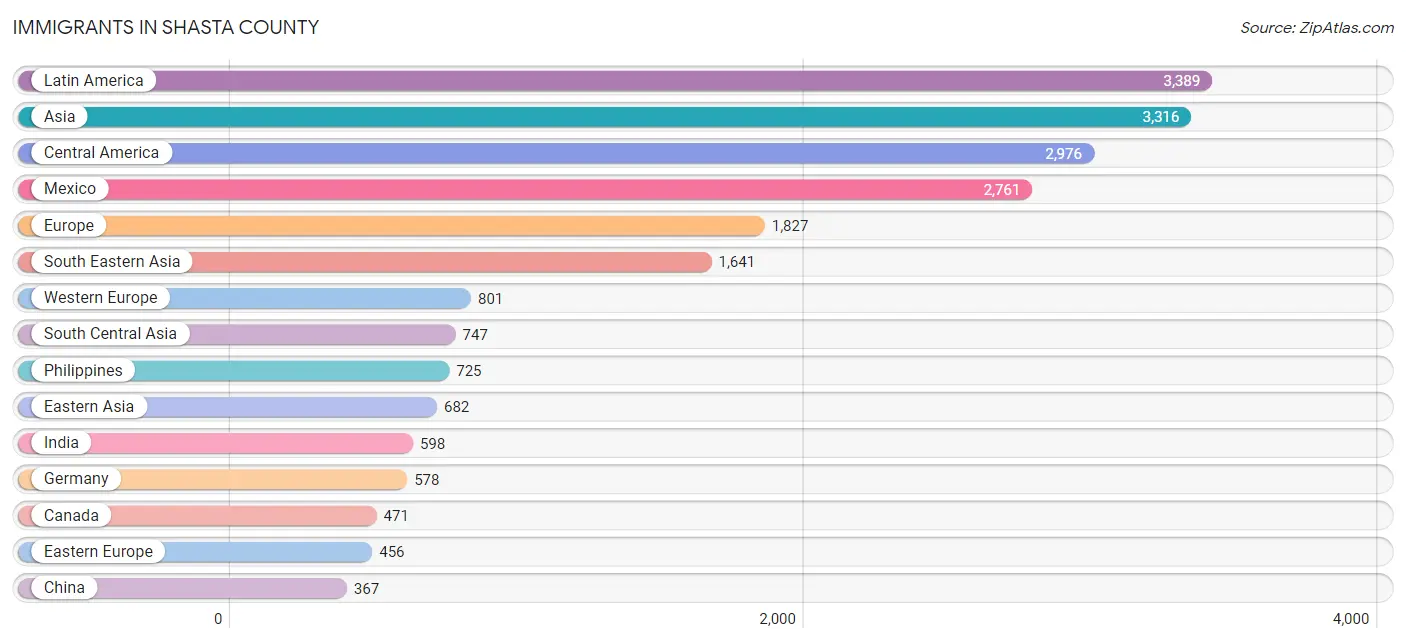
Immigrants in Shasta County
The most numerous immigrant groups reported in Shasta County came from Latin America (3,389 | 1.9%), Asia (3,316 | 1.8%), Central America (2,976 | 1.6%), Mexico (2,761 | 1.5%), and Europe (1,827 | 1.0%), together accounting for 7.8% of all Shasta County residents.
| Immigration Origin | # Population | % Population |
| Africa | 317 | 0.2% |
| Albania | 14 | 0.0% |
| Argentina | 8 | 0.0% |
| Asia | 3,316 | 1.8% |
| Australia | 37 | 0.0% |
| Austria | 21 | 0.0% |
| Azores | 10 | 0.0% |
| Belarus | 16 | 0.0% |
| Bolivia | 16 | 0.0% |
| Brazil | 85 | 0.1% |
| Cambodia | 7 | 0.0% |
| Canada | 471 | 0.3% |
| Caribbean | 97 | 0.1% |
| Central America | 2,976 | 1.6% |
| Chile | 39 | 0.0% |
| China | 367 | 0.2% |
| Colombia | 45 | 0.0% |
| Cuba | 49 | 0.0% |
| Czechoslovakia | 118 | 0.1% |
| Denmark | 19 | 0.0% |
| Eastern Africa | 63 | 0.0% |
| Eastern Asia | 682 | 0.4% |
| Eastern Europe | 456 | 0.3% |
| Ecuador | 44 | 0.0% |
| Egypt | 10 | 0.0% |
| El Salvador | 88 | 0.1% |
| England | 197 | 0.1% |
| Europe | 1,827 | 1.0% |
| France | 25 | 0.0% |
| Germany | 578 | 0.3% |
| Greece | 55 | 0.0% |
| Grenada | 7 | 0.0% |
| Guatemala | 47 | 0.0% |
| Haiti | 36 | 0.0% |
| Honduras | 27 | 0.0% |
| Hong Kong | 20 | 0.0% |
| Hungary | 9 | 0.0% |
| India | 598 | 0.3% |
| Indonesia | 8 | 0.0% |
| Iran | 95 | 0.1% |
| Iraq | 30 | 0.0% |
| Ireland | 46 | 0.0% |
| Italy | 49 | 0.0% |
| Japan | 95 | 0.1% |
| Korea | 220 | 0.1% |
| Laos | 283 | 0.2% |
| Latin America | 3,389 | 1.9% |
| Latvia | 59 | 0.0% |
| Lebanon | 64 | 0.0% |
| Liberia | 8 | 0.0% |
| Malaysia | 15 | 0.0% |
| Mexico | 2,761 | 1.5% |
| Micronesia | 55 | 0.0% |
| Middle Africa | 2 | 0.0% |
| Moldova | 4 | 0.0% |
| Morocco | 25 | 0.0% |
| Nepal | 41 | 0.0% |
| Netherlands | 58 | 0.0% |
| Nicaragua | 28 | 0.0% |
| Northern Africa | 51 | 0.0% |
| Northern Europe | 361 | 0.2% |
| Oceania | 92 | 0.1% |
| Pakistan | 10 | 0.0% |
| Panama | 15 | 0.0% |
| Peru | 45 | 0.0% |
| Philippines | 725 | 0.4% |
| Poland | 18 | 0.0% |
| Portugal | 10 | 0.0% |
| Romania | 11 | 0.0% |
| Russia | 69 | 0.0% |
| Scotland | 22 | 0.0% |
| Singapore | 9 | 0.0% |
| South Africa | 193 | 0.1% |
| South America | 316 | 0.2% |
| South Central Asia | 747 | 0.4% |
| South Eastern Asia | 1,641 | 0.9% |
| Southern Europe | 209 | 0.1% |
| Spain | 95 | 0.1% |
| Sweden | 10 | 0.0% |
| Switzerland | 83 | 0.1% |
| Syria | 139 | 0.1% |
| Taiwan | 170 | 0.1% |
| Thailand | 329 | 0.2% |
| Turkey | 13 | 0.0% |
| Ukraine | 117 | 0.1% |
| Uzbekistan | 3 | 0.0% |
| Venezuela | 14 | 0.0% |
| Vietnam | 245 | 0.1% |
| Western Africa | 8 | 0.0% |
| Western Asia | 246 | 0.1% |
| Western Europe | 801 | 0.4% |
| Zaire | 2 | 0.0% |
| Zimbabwe | 35 | 0.0% | View All 93 Rows |
Sex and Age in Shasta County
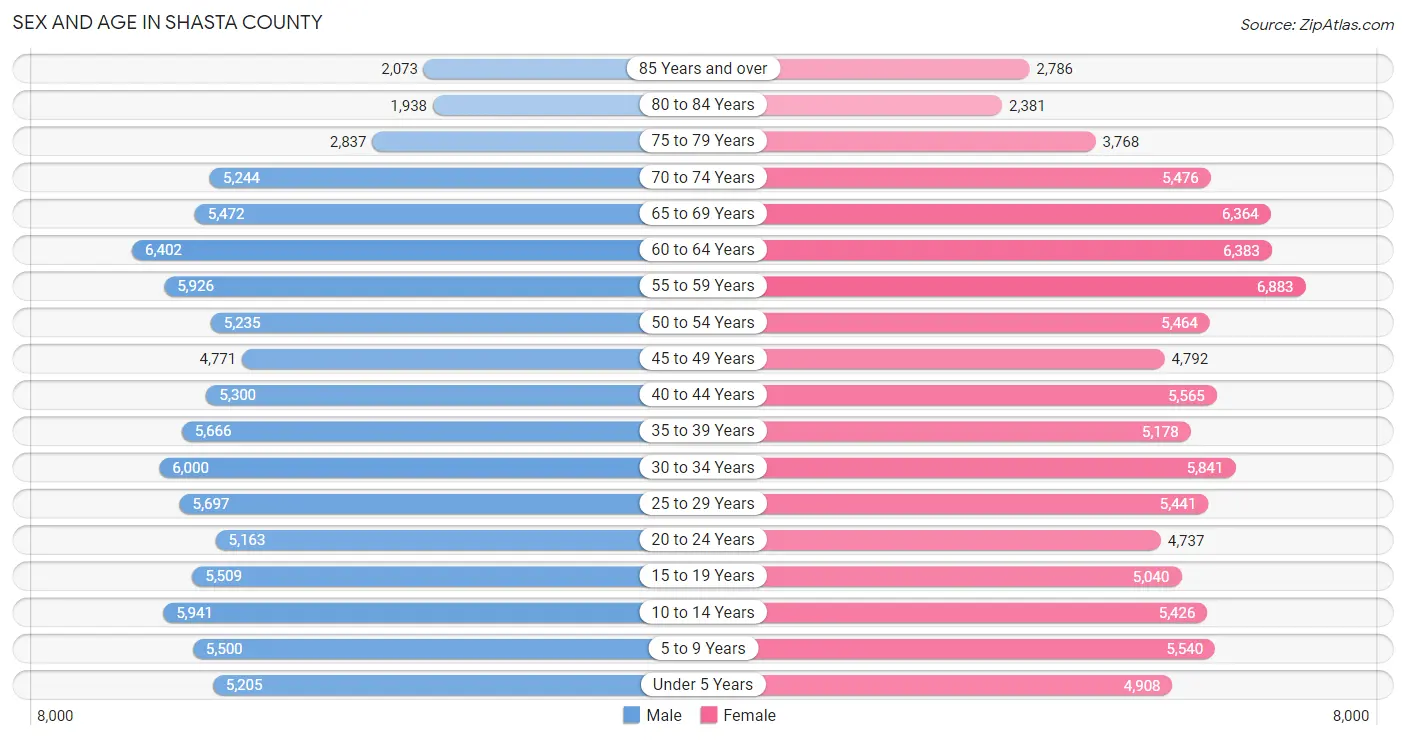
Sex and Age in Shasta County
The most populous age groups in Shasta County are 60 to 64 Years (6,402 | 7.1%) for men and 55 to 59 Years (6,883 | 7.5%) for women.
| Age Bracket | Male | Female |
| Under 5 Years | 5,205 (5.8%) | 4,908 (5.3%) |
| 5 to 9 Years | 5,500 (6.1%) | 5,540 (6.0%) |
| 10 to 14 Years | 5,941 (6.6%) | 5,426 (5.9%) |
| 15 to 19 Years | 5,509 (6.1%) | 5,040 (5.5%) |
| 20 to 24 Years | 5,163 (5.7%) | 4,737 (5.1%) |
| 25 to 29 Years | 5,697 (6.3%) | 5,441 (5.9%) |
| 30 to 34 Years | 6,000 (6.7%) | 5,841 (6.4%) |
| 35 to 39 Years | 5,666 (6.3%) | 5,178 (5.6%) |
| 40 to 44 Years | 5,300 (5.9%) | 5,565 (6.0%) |
| 45 to 49 Years | 4,771 (5.3%) | 4,792 (5.2%) |
| 50 to 54 Years | 5,235 (5.8%) | 5,464 (5.9%) |
| 55 to 59 Years | 5,926 (6.6%) | 6,883 (7.5%) |
| 60 to 64 Years | 6,402 (7.1%) | 6,383 (6.9%) |
| 65 to 69 Years | 5,472 (6.1%) | 6,364 (6.9%) |
| 70 to 74 Years | 5,244 (5.8%) | 5,476 (5.9%) |
| 75 to 79 Years | 2,837 (3.2%) | 3,768 (4.1%) |
| 80 to 84 Years | 1,938 (2.2%) | 2,381 (2.6%) |
| 85 Years and over | 2,073 (2.3%) | 2,786 (3.0%) |
| Total | 89,879 (100.0%) | 91,973 (100.0%) |
Families and Households in Shasta County
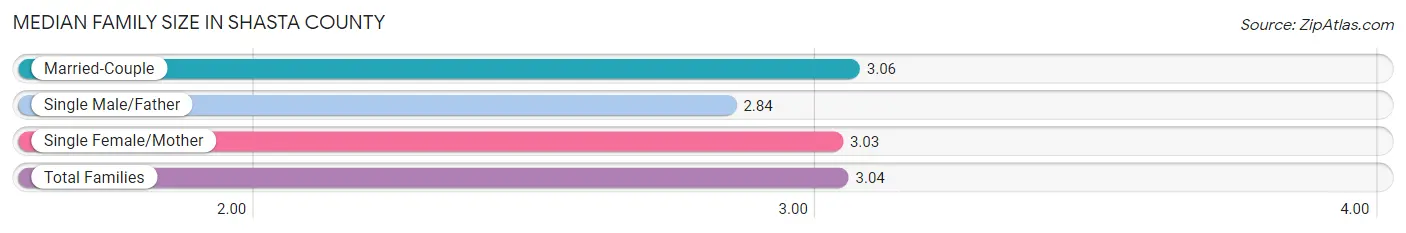
Median Family Size in Shasta County
The median family size in Shasta County is 3.04 persons per family, with married-couple families (33,680 | 73.9%) accounting for the largest median family size of 3.06 persons per family. On the other hand, single male/father families (3,939 | 8.6%) represent the smallest median family size with 2.84 persons per family.
| Family Type | # Families | Family Size |
| Married-Couple | 33,680 (73.9%) | 3.06 |
| Single Male/Father | 3,939 (8.6%) | 2.84 |
| Single Female/Mother | 7,940 (17.4%) | 3.03 |
| Total Families | 45,559 (100.0%) | 3.04 |
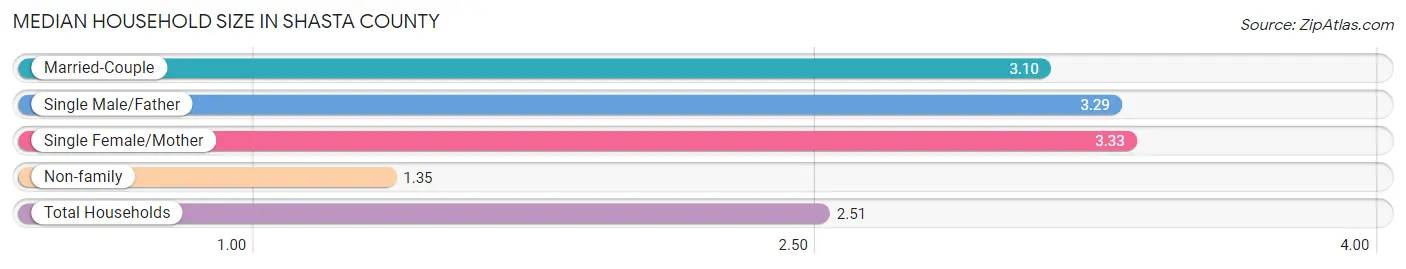
Median Household Size in Shasta County
The median household size in Shasta County is 2.51 persons per household, with single female/mother households (7,940 | 11.2%) accounting for the largest median household size of 3.33 persons per household. non-family households (25,548 | 35.9%) represent the smallest median household size with 1.35 persons per household.
| Household Type | # Households | Household Size |
| Married-Couple | 33,680 (47.4%) | 3.10 |
| Single Male/Father | 3,939 (5.5%) | 3.29 |
| Single Female/Mother | 7,940 (11.2%) | 3.33 |
| Non-family | 25,548 (35.9%) | 1.35 |
| Total Households | 71,107 (100.0%) | 2.51 |
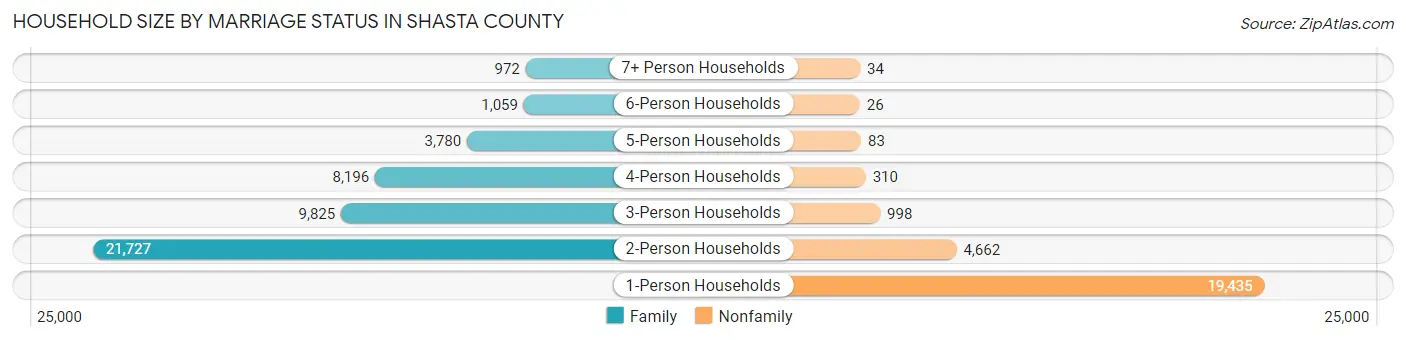
Household Size by Marriage Status in Shasta County
Out of a total of 71,107 households in Shasta County, 45,559 (64.1%) are family households, while 25,548 (35.9%) are nonfamily households. The most numerous type of family households are 2-person households, comprising 21,727, and the most common type of nonfamily households are 1-person households, comprising 19,435.
| Household Size | Family Households | Nonfamily Households |
| 1-Person Households | - | 19,435 (27.3%) |
| 2-Person Households | 21,727 (30.6%) | 4,662 (6.6%) |
| 3-Person Households | 9,825 (13.8%) | 998 (1.4%) |
| 4-Person Households | 8,196 (11.5%) | 310 (0.4%) |
| 5-Person Households | 3,780 (5.3%) | 83 (0.1%) |
| 6-Person Households | 1,059 (1.5%) | 26 (0.0%) |
| 7+ Person Households | 972 (1.4%) | 34 (0.1%) |
| Total | 45,559 (64.1%) | 25,548 (35.9%) |
Female Fertility in Shasta County
Fertility by Age in Shasta County
Average fertility rate in Shasta County is 44.0 births per 1,000 women. Women in the age bracket of 20 to 34 years have the highest fertility rate with 78.0 births per 1,000 women. Women in the age bracket of 20 to 34 years acount for 76.1% of all women with births.
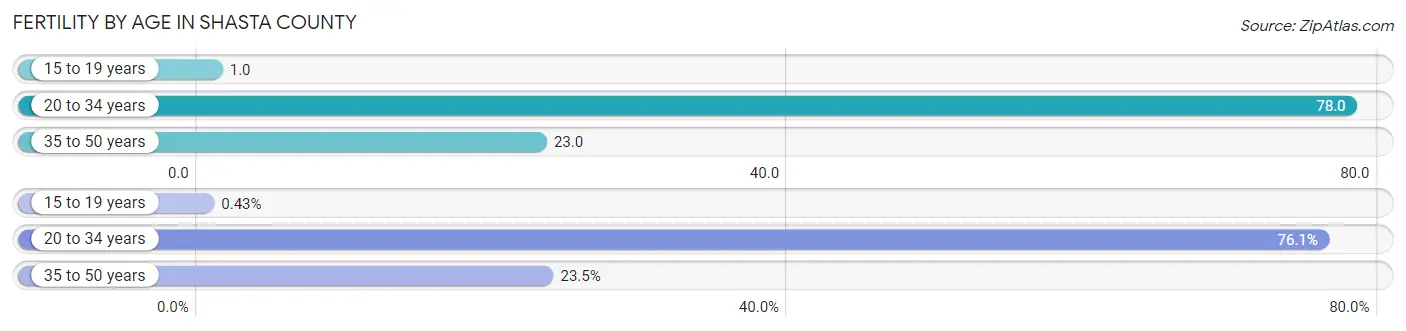
| Age Bracket | Women with Births | Births / 1,000 Women |
| 15 to 19 years | 7 (0.4%) | 1.0 |
| 20 to 34 years | 1,253 (76.1%) | 78.0 |
| 35 to 50 years | 386 (23.4%) | 23.0 |
| Total | 1,646 (100.0%) | 44.0 |
Fertility by Age by Marriage Status in Shasta County
56.9% of women with births (1,646) in Shasta County are married. The highest percentage of unmarried women with births falls into 15 to 19 years age bracket with 100.0% of them unmarried at the time of birth, while the lowest percentage of unmarried women with births belong to 35 to 50 years age bracket with 40.2% of them unmarried.
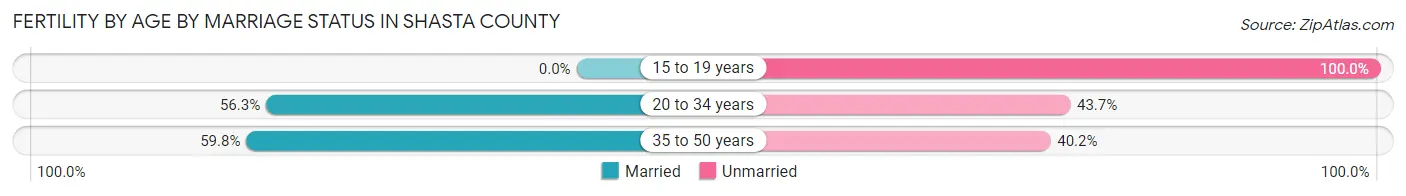
| Age Bracket | Married | Unmarried |
| 15 to 19 years | 0 (0.0%) | 7 (100.0%) |
| 20 to 34 years | 705 (56.3%) | 548 (43.7%) |
| 35 to 50 years | 231 (59.8%) | 155 (40.2%) |
| Total | 937 (56.9%) | 709 (43.1%) |
Fertility by Education in Shasta County
Average fertility rate in Shasta County is 44.0 births per 1,000 women. Women with the education attainment of high school diploma have the highest fertility rate of 68.0 births per 1,000 women, while women with the education attainment of graduate degree have the lowest fertility at 14.0 births per 1,000 women. Women with the education attainment of college or associate's degree represent 37.0% of all women with births.
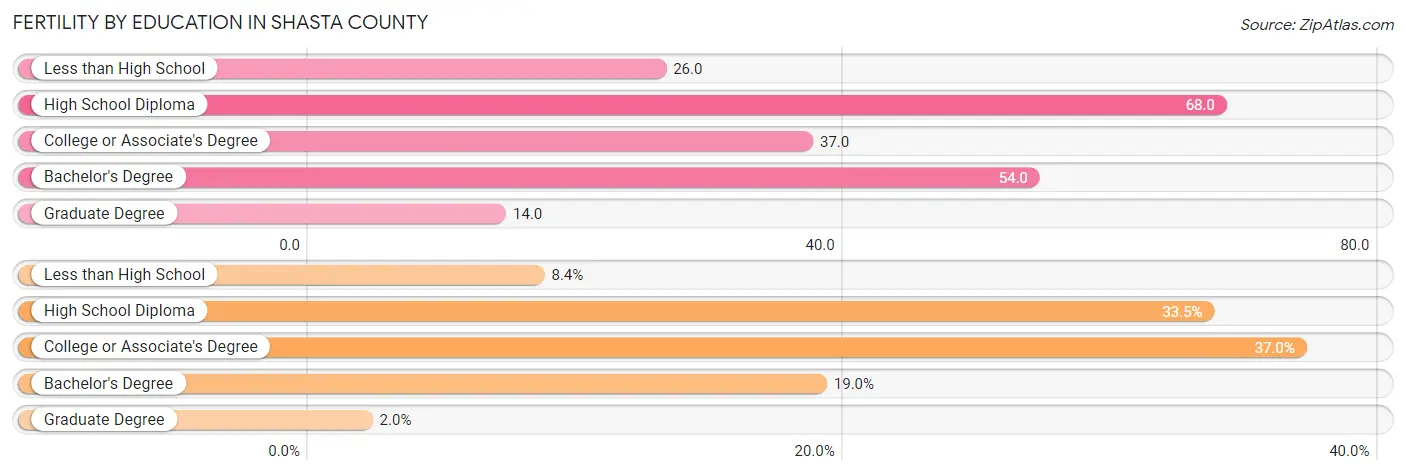
| Educational Attainment | Women with Births | Births / 1,000 Women |
| Less than High School | 139 (8.4%) | 26.0 |
| High School Diploma | 552 (33.5%) | 68.0 |
| College or Associate's Degree | 609 (37.0%) | 37.0 |
| Bachelor's Degree | 313 (19.0%) | 54.0 |
| Graduate Degree | 33 (2.0%) | 14.0 |
| Total | 1,646 (100.0%) | 44.0 |
Fertility by Education by Marriage Status in Shasta County
43.1% of women with births in Shasta County are unmarried. Women with the educational attainment of graduate degree are most likely to be married with 100.0% of them married at childbirth, while women with the educational attainment of less than high school are least likely to be married with 71.2% of them unmarried at childbirth.
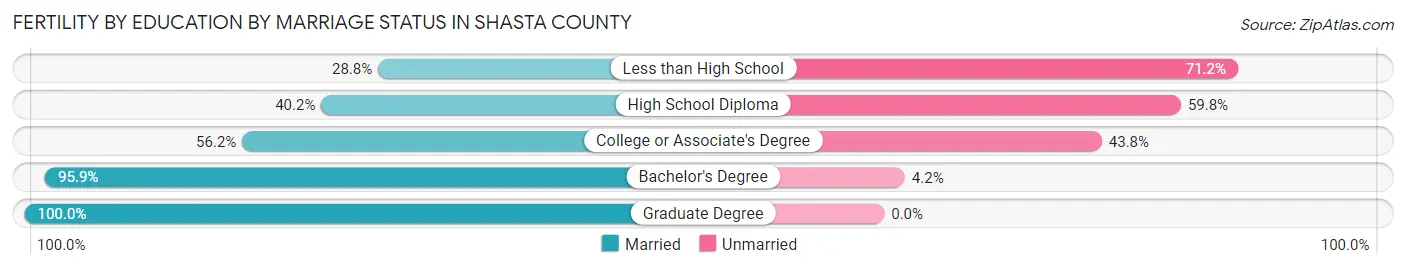
| Educational Attainment | Married | Unmarried |
| Less than High School | 40 (28.8%) | 99 (71.2%) |
| High School Diploma | 222 (40.2%) | 330 (59.8%) |
| College or Associate's Degree | 342 (56.2%) | 267 (43.8%) |
| Bachelor's Degree | 300 (95.9%) | 13 (4.2%) |
| Graduate Degree | 33 (100.0%) | 0 (0.0%) |
| Total | 937 (56.9%) | 709 (43.1%) |
Income in Shasta County
Income Overview in Shasta County
Per Capita Income in Shasta County is $36,458, while median incomes of families and households are $85,284 and $68,347 respectively.
| Characteristic | Number | Measure |
| Per Capita Income | 181,852 | $36,458 |
| Median Family Income | 45,559 | $85,284 |
| Mean Family Income | 45,559 | $107,564 |
| Median Household Income | 71,107 | $68,347 |
| Mean Household Income | 71,107 | $91,289 |
| Income Deficit | 45,559 | $10,494 |
| Wage / Income Gap (%) | 181,852 | 30.19% |
| Wage / Income Gap ($) | 181,852 | 69.81¢ per $1 |
| Gini / Inequality Index | 181,852 | 0.46 |
Earnings by Sex in Shasta County
Average Earnings in Shasta County are $38,355, $46,027 for men and $32,131 for women, a difference of 30.2%.
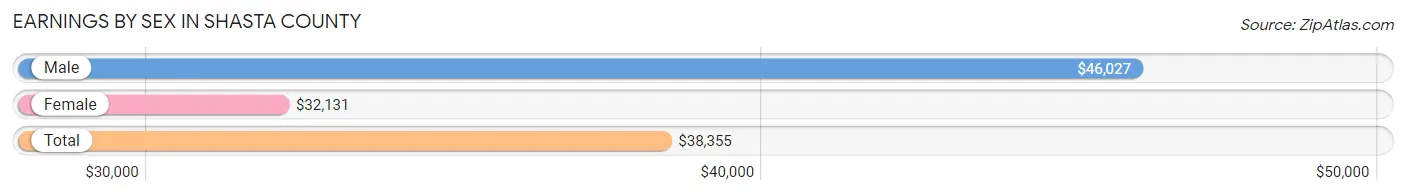
| Sex | Number | Average Earnings |
| Male | 44,032 (52.0%) | $46,027 |
| Female | 40,686 (48.0%) | $32,131 |
| Total | 84,718 (100.0%) | $38,355 |
Earnings by Sex by Income Bracket in Shasta County
The most common earnings brackets in Shasta County are $100,000+ for men (7,473 | 17.0%) and $100,000+ for women (3,543 | 8.7%).
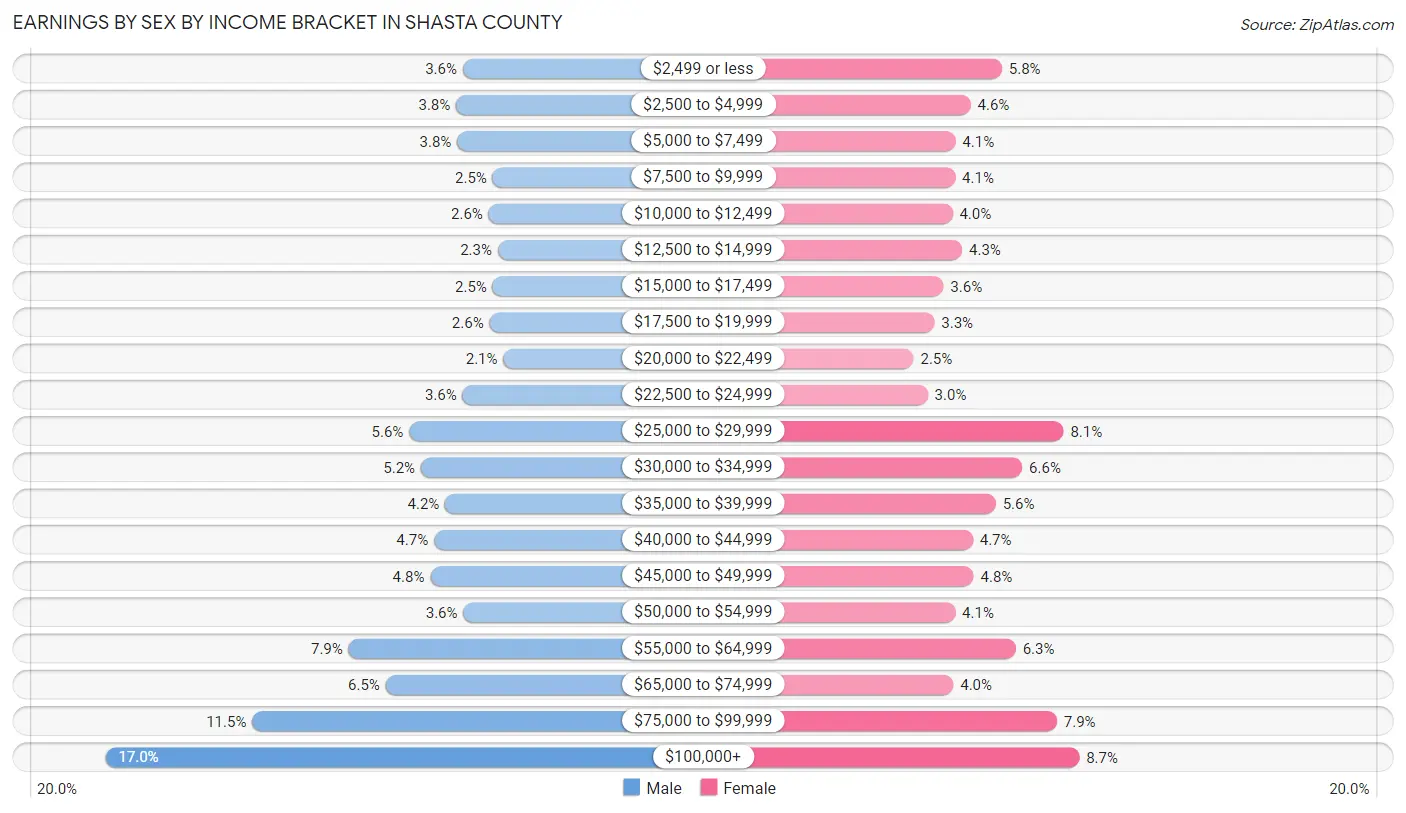
| Income | Male | Female |
| $2,499 or less | 1,576 (3.6%) | 2,365 (5.8%) |
| $2,500 to $4,999 | 1,685 (3.8%) | 1,889 (4.6%) |
| $5,000 to $7,499 | 1,670 (3.8%) | 1,655 (4.1%) |
| $7,500 to $9,999 | 1,082 (2.5%) | 1,652 (4.1%) |
| $10,000 to $12,499 | 1,151 (2.6%) | 1,611 (4.0%) |
| $12,500 to $14,999 | 1,001 (2.3%) | 1,759 (4.3%) |
| $15,000 to $17,499 | 1,082 (2.5%) | 1,474 (3.6%) |
| $17,500 to $19,999 | 1,136 (2.6%) | 1,334 (3.3%) |
| $20,000 to $22,499 | 906 (2.1%) | 1,018 (2.5%) |
| $22,500 to $24,999 | 1,582 (3.6%) | 1,233 (3.0%) |
| $25,000 to $29,999 | 2,460 (5.6%) | 3,303 (8.1%) |
| $30,000 to $34,999 | 2,268 (5.1%) | 2,674 (6.6%) |
| $35,000 to $39,999 | 1,865 (4.2%) | 2,271 (5.6%) |
| $40,000 to $44,999 | 2,051 (4.7%) | 1,919 (4.7%) |
| $45,000 to $49,999 | 2,114 (4.8%) | 1,931 (4.8%) |
| $50,000 to $54,999 | 1,567 (3.6%) | 1,653 (4.1%) |
| $55,000 to $64,999 | 3,462 (7.9%) | 2,574 (6.3%) |
| $65,000 to $74,999 | 2,851 (6.5%) | 1,625 (4.0%) |
| $75,000 to $99,999 | 5,050 (11.5%) | 3,203 (7.9%) |
| $100,000+ | 7,473 (17.0%) | 3,543 (8.7%) |
| Total | 44,032 (100.0%) | 40,686 (100.0%) |
Earnings by Sex by Educational Attainment in Shasta County
Average earnings in Shasta County are $52,513 for men and $36,876 for women, a difference of 29.8%. Men with an educational attainment of graduate degree enjoy the highest average annual earnings of $86,383, while those with less than high school education earn the least with $37,056. Women with an educational attainment of graduate degree earn the most with the average annual earnings of $76,118, while those with less than high school education have the smallest earnings of $17,153.
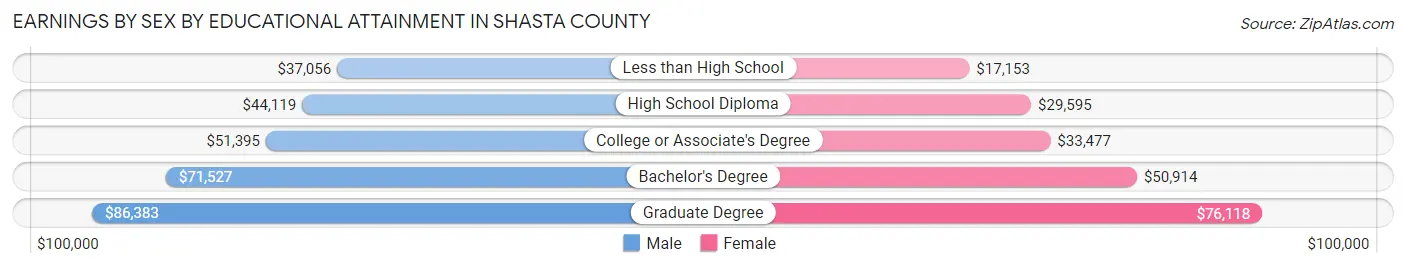
| Educational Attainment | Male Income | Female Income |
| Less than High School | $37,056 | $17,153 |
| High School Diploma | $44,119 | $29,595 |
| College or Associate's Degree | $51,395 | $33,477 |
| Bachelor's Degree | $71,527 | $50,914 |
| Graduate Degree | $86,383 | $76,118 |
| Total | $52,513 | $36,876 |
Family Income in Shasta County
Family Income Brackets in Shasta County
According to the Shasta County family income data, there are 9,021 families falling into the $100,000 to $149,999 income range, which is the most common income bracket and makes up 19.8% of all families. Conversely, the $10,000 to $14,999 income bracket is the least frequent group with only 775 families (1.7%) belonging to this category.
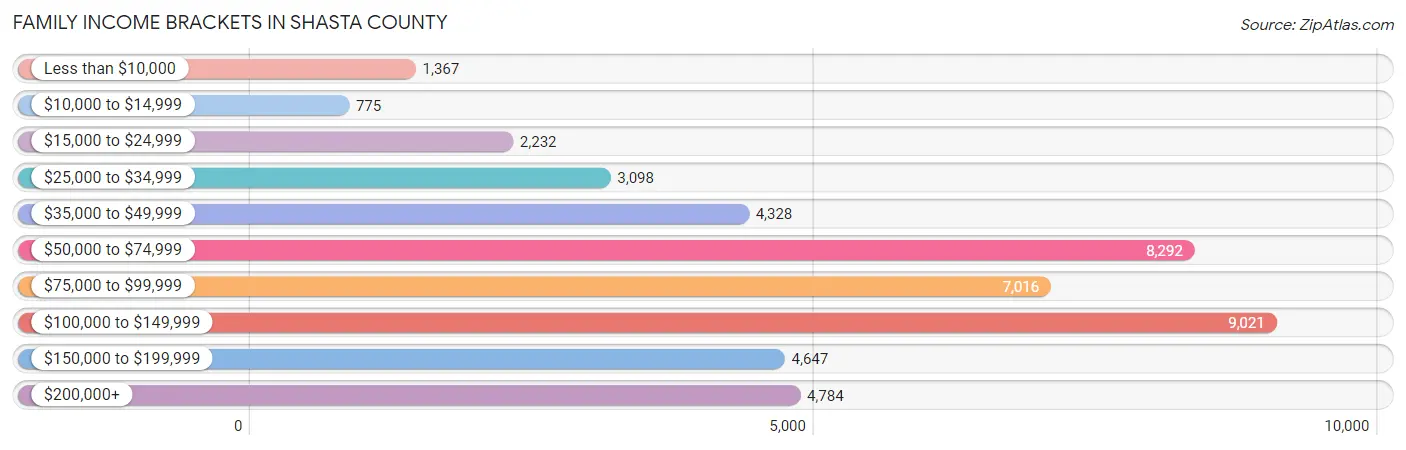
| Income Bracket | # Families | % Families |
| Less than $10,000 | 1,367 | 3.0% |
| $10,000 to $14,999 | 775 | 1.7% |
| $15,000 to $24,999 | 2,232 | 4.9% |
| $25,000 to $34,999 | 3,098 | 6.8% |
| $35,000 to $49,999 | 4,328 | 9.5% |
| $50,000 to $74,999 | 8,292 | 18.2% |
| $75,000 to $99,999 | 7,016 | 15.4% |
| $100,000 to $149,999 | 9,021 | 19.8% |
| $150,000 to $199,999 | 4,647 | 10.2% |
| $200,000+ | 4,784 | 10.5% |
Family Income by Famaliy Size in Shasta County
7+ person families (855 | 1.9%) account for the highest median family income in Shasta County with $113,520 per family, while 2-person families (23,468 | 51.5%) have the highest median income of $37,426 per family member.
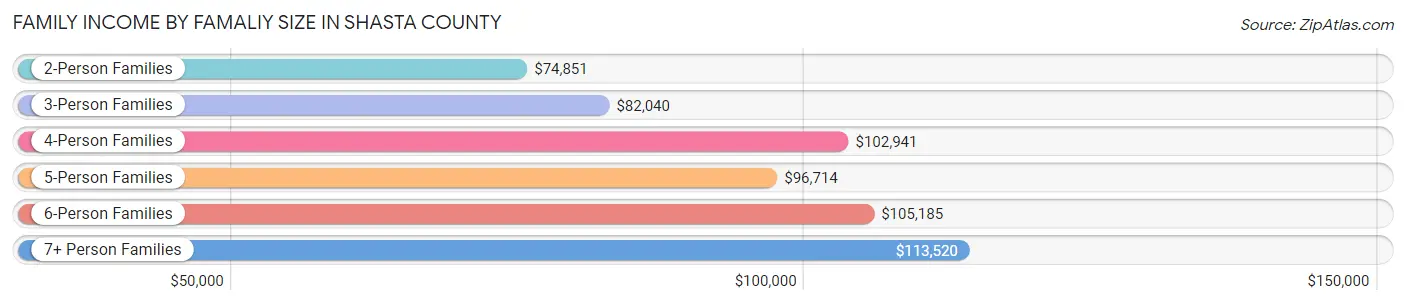
| Income Bracket | # Families | Median Income |
| 2-Person Families | 23,468 (51.5%) | $74,851 |
| 3-Person Families | 9,936 (21.8%) | $82,040 |
| 4-Person Families | 7,243 (15.9%) | $102,941 |
| 5-Person Families | 3,129 (6.9%) | $96,714 |
| 6-Person Families | 928 (2.0%) | $105,185 |
| 7+ Person Families | 855 (1.9%) | $113,520 |
| Total | 45,559 (100.0%) | $85,284 |
Family Income by Number of Earners in Shasta County
The median family income in Shasta County is $85,284, with families comprising 3+ earners (3,723) having the highest median family income of $144,227, while families with no earners (9,922) have the lowest median family income of $52,165, accounting for 8.2% and 21.8% of families, respectively.
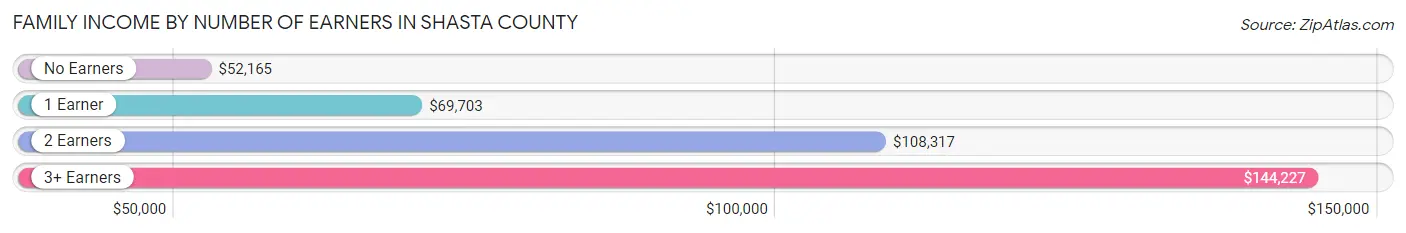
| Number of Earners | # Families | Median Income |
| No Earners | 9,922 (21.8%) | $52,165 |
| 1 Earner | 15,185 (33.3%) | $69,703 |
| 2 Earners | 16,729 (36.7%) | $108,317 |
| 3+ Earners | 3,723 (8.2%) | $144,227 |
| Total | 45,559 (100.0%) | $85,284 |
Household Income in Shasta County
Household Income Brackets in Shasta County
With 12,088 households falling in the category, the $50,000 to $74,999 income range is the most frequent in Shasta County, accounting for 17.0% of all households. In contrast, only 3,058 households (4.3%) fall into the $10,000 to $14,999 income bracket, making it the least populous group.
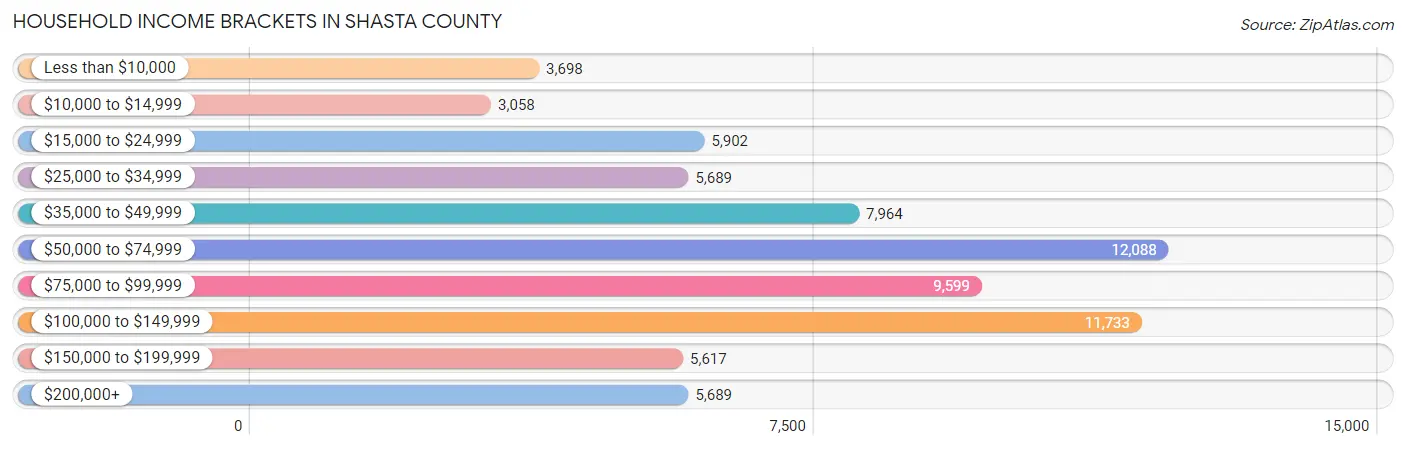
| Income Bracket | # Households | % Households |
| Less than $10,000 | 3,698 | 5.2% |
| $10,000 to $14,999 | 3,058 | 4.3% |
| $15,000 to $24,999 | 5,902 | 8.3% |
| $25,000 to $34,999 | 5,689 | 8.0% |
| $35,000 to $49,999 | 7,964 | 11.2% |
| $50,000 to $74,999 | 12,088 | 17.0% |
| $75,000 to $99,999 | 9,599 | 13.5% |
| $100,000 to $149,999 | 11,733 | 16.5% |
| $150,000 to $199,999 | 5,617 | 7.9% |
| $200,000+ | 5,689 | 8.0% |
Household Income by Householder Age in Shasta County
The median household income in Shasta County is $68,347, with the highest median household income of $82,545 found in the 25 to 44 years age bracket for the primary householder. A total of 20,259 households (28.5%) fall into this category. Meanwhile, the 65+ years age bracket for the primary householder has the lowest median household income of $52,146, with 23,798 households (33.5%) in this group.
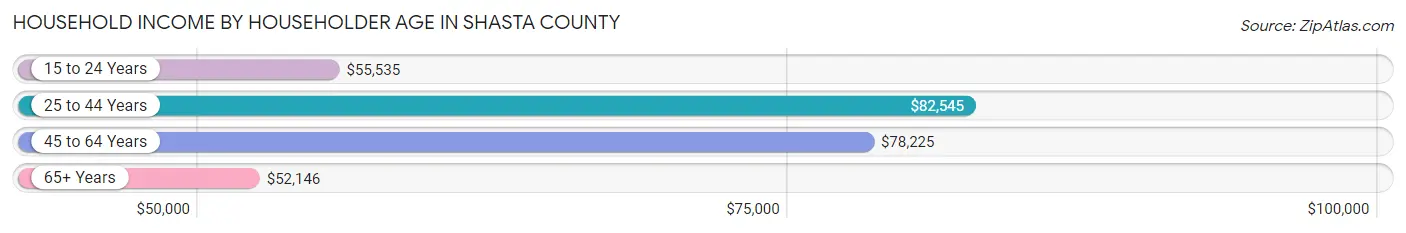
| Income Bracket | # Households | Median Income |
| 15 to 24 Years | 2,307 (3.2%) | $55,535 |
| 25 to 44 Years | 20,259 (28.5%) | $82,545 |
| 45 to 64 Years | 24,743 (34.8%) | $78,225 |
| 65+ Years | 23,798 (33.5%) | $52,146 |
| Total | 71,107 (100.0%) | $68,347 |
Poverty in Shasta County
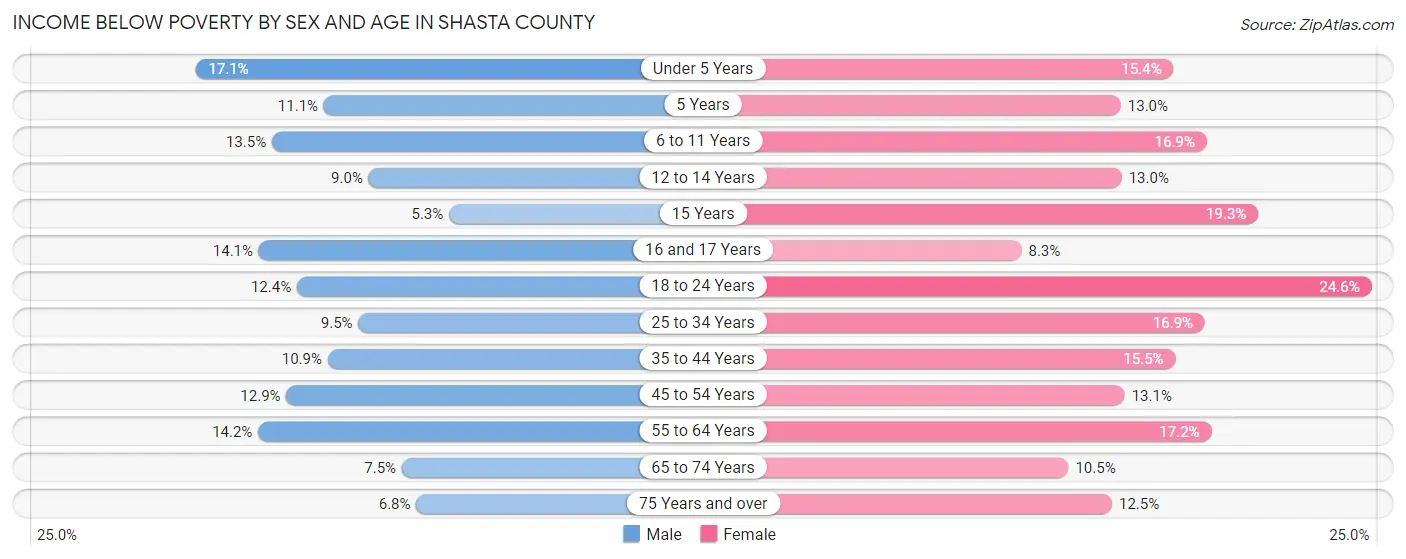
Income Below Poverty by Sex and Age in Shasta County
With 11.3% poverty level for males and 15.2% for females among the residents of Shasta County, under 5 year old males and 18 to 24 year old females are the most vulnerable to poverty, with 851 males (17.1%) and 1,578 females (24.6%) in their respective age groups living below the poverty level.
| Age Bracket | Male | Female |
| Under 5 Years | 851 (17.1%) | 702 (15.4%) |
| 5 Years | 122 (11.1%) | 165 (13.0%) |
| 6 to 11 Years | 880 (13.5%) | 1,054 (16.9%) |
| 12 to 14 Years | 328 (9.0%) | 408 (13.0%) |
| 15 Years | 56 (5.3%) | 255 (19.3%) |
| 16 and 17 Years | 330 (14.1%) | 158 (8.3%) |
| 18 to 24 Years | 848 (12.4%) | 1,578 (24.6%) |
| 25 to 34 Years | 1,089 (9.5%) | 1,898 (16.9%) |
| 35 to 44 Years | 1,177 (10.9%) | 1,659 (15.5%) |
| 45 to 54 Years | 1,280 (12.9%) | 1,345 (13.1%) |
| 55 to 64 Years | 1,742 (14.2%) | 2,269 (17.2%) |
| 65 to 74 Years | 802 (7.5%) | 1,235 (10.5%) |
| 75 Years and over | 447 (6.8%) | 1,075 (12.5%) |
| Total | 9,952 (11.3%) | 13,801 (15.2%) |
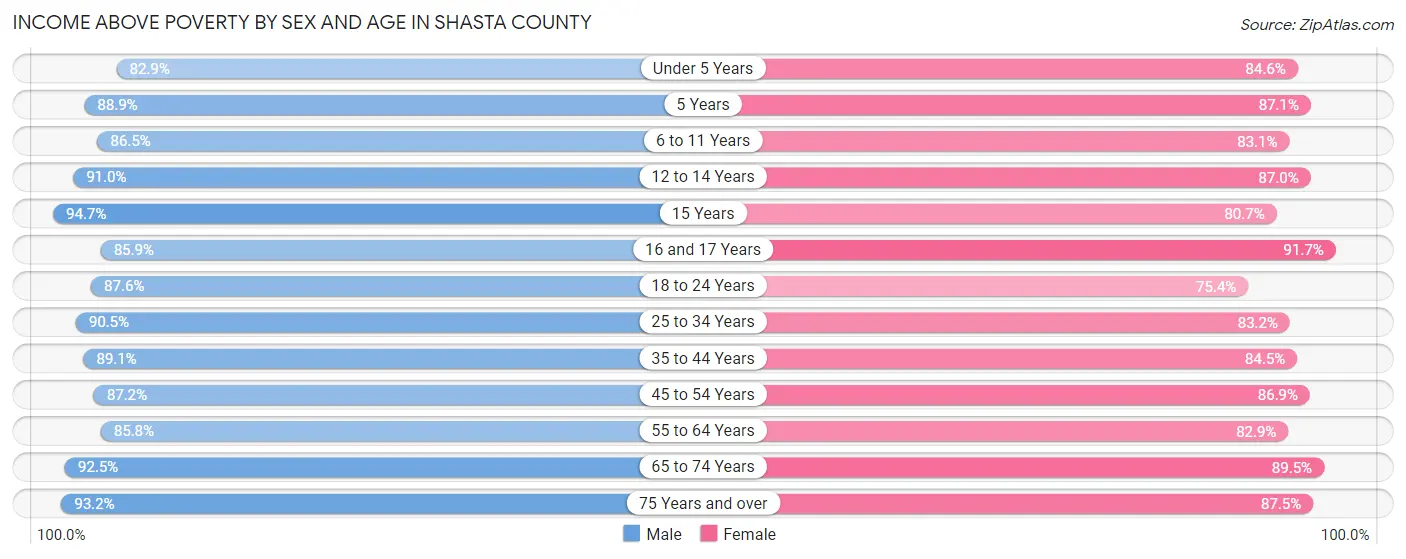
Income Above Poverty by Sex and Age in Shasta County
According to the poverty statistics in Shasta County, males aged 15 years and females aged 16 and 17 years are the age groups that are most secure financially, with 94.7% of males and 91.7% of females in these age groups living above the poverty line.
| Age Bracket | Male | Female |
| Under 5 Years | 4,133 (82.9%) | 3,860 (84.6%) |
| 5 Years | 976 (88.9%) | 1,109 (87.1%) |
| 6 to 11 Years | 5,627 (86.5%) | 5,167 (83.1%) |
| 12 to 14 Years | 3,303 (91.0%) | 2,733 (87.0%) |
| 15 Years | 1,001 (94.7%) | 1,065 (80.7%) |
| 16 and 17 Years | 2,005 (85.9%) | 1,737 (91.7%) |
| 18 to 24 Years | 6,011 (87.6%) | 4,843 (75.4%) |
| 25 to 34 Years | 10,364 (90.5%) | 9,363 (83.2%) |
| 35 to 44 Years | 9,594 (89.1%) | 9,060 (84.5%) |
| 45 to 54 Years | 8,678 (87.2%) | 8,901 (86.9%) |
| 55 to 64 Years | 10,563 (85.8%) | 10,963 (82.9%) |
| 65 to 74 Years | 9,900 (92.5%) | 10,502 (89.5%) |
| 75 Years and over | 6,109 (93.2%) | 7,500 (87.5%) |
| Total | 78,264 (88.7%) | 76,803 (84.8%) |
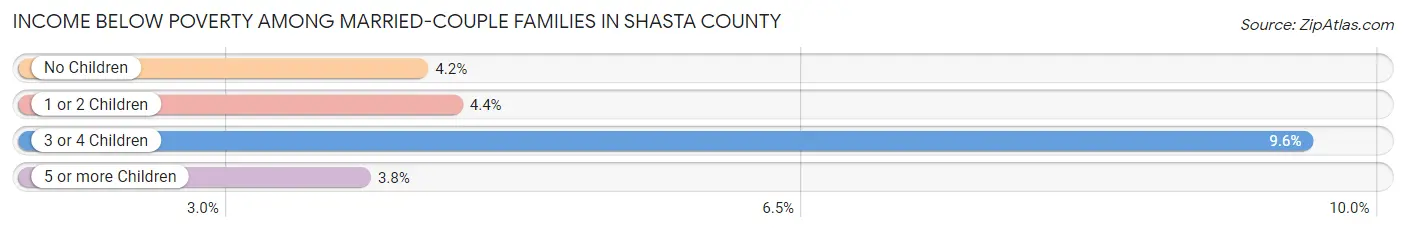
Income Below Poverty Among Married-Couple Families in Shasta County
The poverty statistics for married-couple families in Shasta County show that 4.6% or 1,557 of the total 33,680 families live below the poverty line. Families with 3 or 4 children have the highest poverty rate of 9.6%, comprising of 243 families. On the other hand, families with 5 or more children have the lowest poverty rate of 3.8%, which includes 14 families.
| Children | Above Poverty | Below Poverty |
| No Children | 20,875 (95.8%) | 907 (4.2%) |
| 1 or 2 Children | 8,593 (95.6%) | 393 (4.4%) |
| 3 or 4 Children | 2,302 (90.4%) | 243 (9.6%) |
| 5 or more Children | 353 (96.2%) | 14 (3.8%) |
| Total | 32,123 (95.4%) | 1,557 (4.6%) |
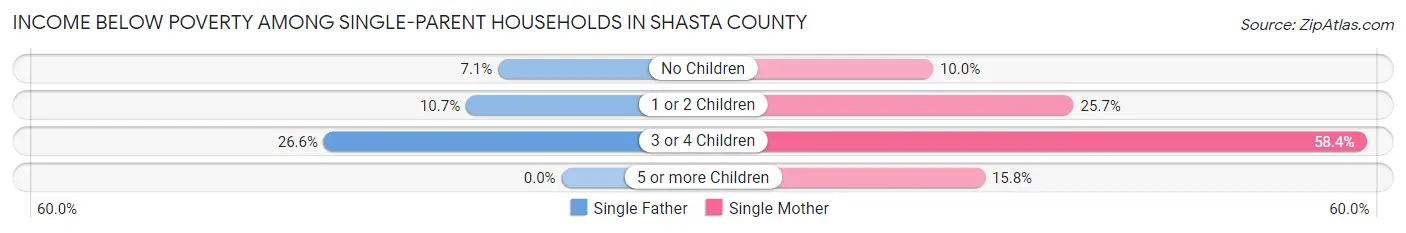
Income Below Poverty Among Single-Parent Households in Shasta County
According to the poverty data in Shasta County, 10.9% or 428 single-father households and 21.8% or 1,729 single-mother households are living below the poverty line. Among single-father households, those with 3 or 4 children have the highest poverty rate, with 102 households (26.6%) experiencing poverty. Likewise, among single-mother households, those with 3 or 4 children have the highest poverty rate, with 365 households (58.4%) falling below the poverty line.
| Children | Single Father | Single Mother |
| No Children | 97 (7.1%) | 324 (10.0%) |
| 1 or 2 Children | 229 (10.7%) | 1,031 (25.7%) |
| 3 or 4 Children | 102 (26.6%) | 365 (58.4%) |
| 5 or more Children | 0 (0.0%) | 9 (15.8%) |
| Total | 428 (10.9%) | 1,729 (21.8%) |
Income Below Poverty Among Married-Couple vs Single-Parent Households in Shasta County
The poverty data for Shasta County shows that 1,557 of the married-couple family households (4.6%) and 2,157 of the single-parent households (18.2%) are living below the poverty level. Within the married-couple family households, those with 3 or 4 children have the highest poverty rate, with 243 households (9.6%) falling below the poverty line. Among the single-parent households, those with 3 or 4 children have the highest poverty rate, with 467 household (46.3%) living below poverty.
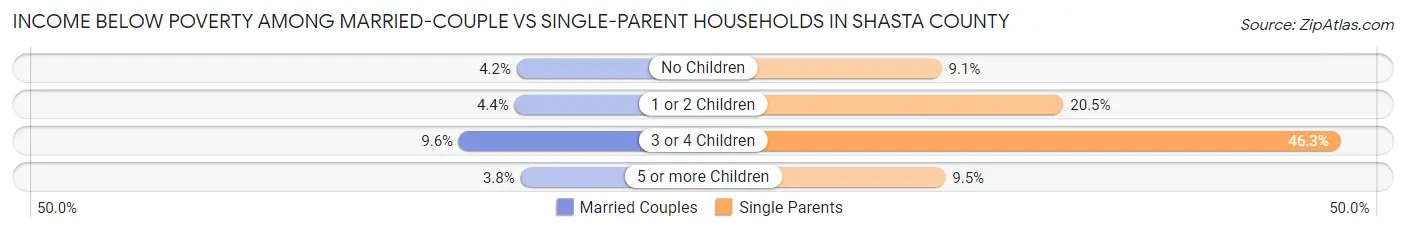
| Children | Married-Couple Families | Single-Parent Households |
| No Children | 907 (4.2%) | 421 (9.1%) |
| 1 or 2 Children | 393 (4.4%) | 1,260 (20.5%) |
| 3 or 4 Children | 243 (9.6%) | 467 (46.3%) |
| 5 or more Children | 14 (3.8%) | 9 (9.5%) |
| Total | 1,557 (4.6%) | 2,157 (18.2%) |
Employment Characteristics in Shasta County
Employment by Class of Employer in Shasta County
Among the 74,304 employed individuals in Shasta County, private company employees (45,308 | 61.0%), local government employees (7,602 | 10.2%), and self-employed (not incorporated) (6,286 | 8.5%) make up the most common classes of employment.
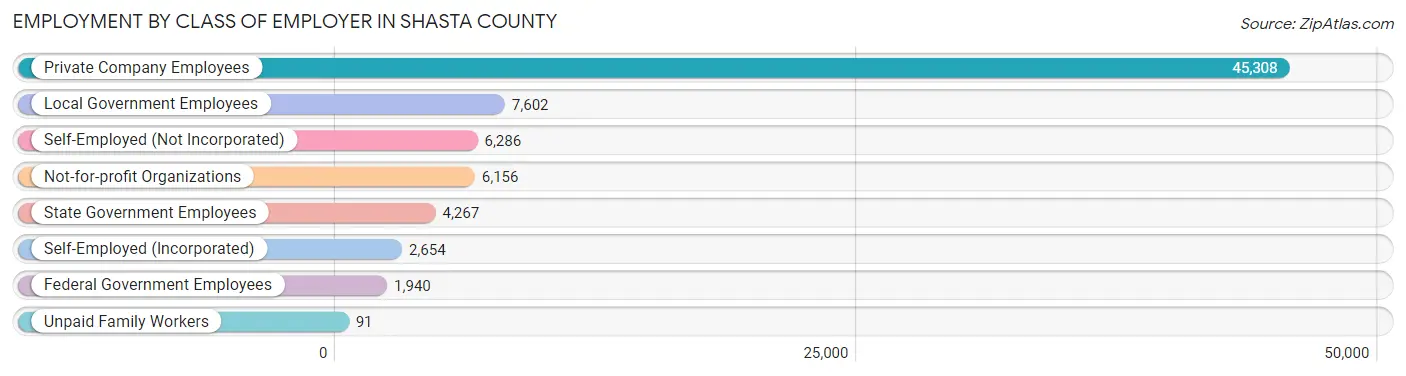
| Employer Class | # Employees | % Employees |
| Private Company Employees | 45,308 | 61.0% |
| Self-Employed (Incorporated) | 2,654 | 3.6% |
| Self-Employed (Not Incorporated) | 6,286 | 8.5% |
| Not-for-profit Organizations | 6,156 | 8.3% |
| Local Government Employees | 7,602 | 10.2% |
| State Government Employees | 4,267 | 5.7% |
| Federal Government Employees | 1,940 | 2.6% |
| Unpaid Family Workers | 91 | 0.1% |
| Total | 74,304 | 100.0% |
Employment Status by Age in Shasta County
According to the labor force statistics for Shasta County, out of the total population over 16 years of age (146,933), 55.6% or 81,695 individuals are in the labor force, with 6.6% or 5,392 of them unemployed. The age group with the highest labor force participation rate is 30 to 34 years, with 80.2% or 9,496 individuals in the labor force. Within the labor force, the 16 to 19 years age range has the highest percentage of unemployed individuals, with 22.2% or 708 of them being unemployed.
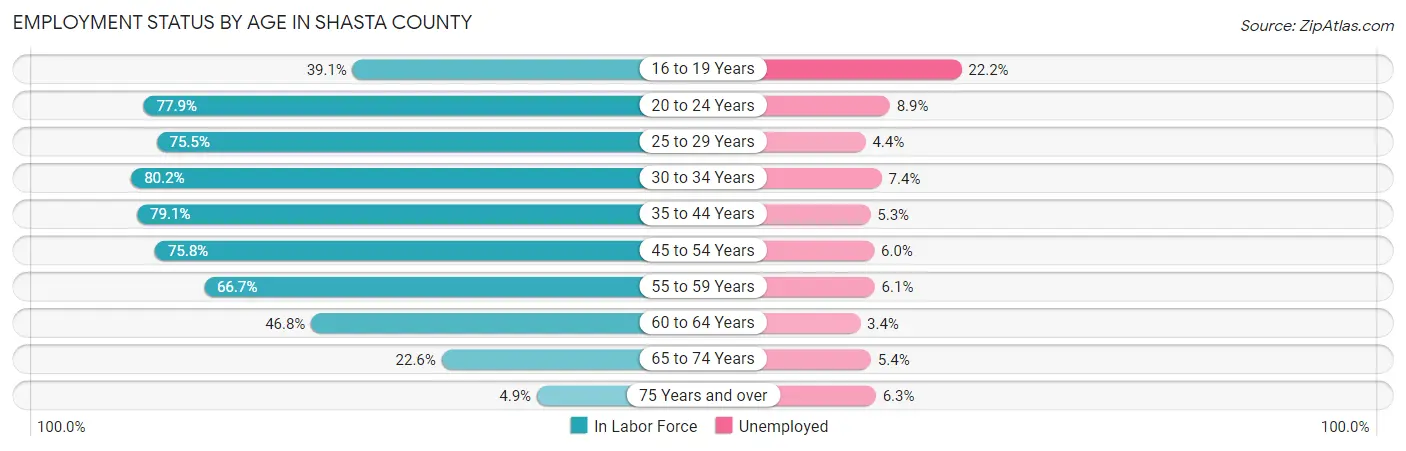
| Age Bracket | In Labor Force | Unemployed |
| 16 to 19 Years | 3,187 (39.1%) | 708 (22.2%) |
| 20 to 24 Years | 7,712 (77.9%) | 686 (8.9%) |
| 25 to 29 Years | 8,409 (75.5%) | 370 (4.4%) |
| 30 to 34 Years | 9,496 (80.2%) | 703 (7.4%) |
| 35 to 44 Years | 17,172 (79.1%) | 910 (5.3%) |
| 45 to 54 Years | 15,359 (75.8%) | 922 (6.0%) |
| 55 to 59 Years | 8,544 (66.7%) | 521 (6.1%) |
| 60 to 64 Years | 5,983 (46.8%) | 203 (3.4%) |
| 65 to 74 Years | 5,098 (22.6%) | 275 (5.4%) |
| 75 Years and over | 773 (4.9%) | 49 (6.3%) |
| Total | 81,695 (55.6%) | 5,392 (6.6%) |
Employment Status by Educational Attainment in Shasta County
According to labor force statistics for Shasta County, 71.8% of individuals (65,011) out of the total population between 25 and 64 years of age (90,544) are in the labor force, with 5.6% or 3,641 of them being unemployed. The group with the highest labor force participation rate are those with the educational attainment of bachelor's degree or higher, with 80.4% or 16,745 individuals in the labor force. Within the labor force, individuals with less than high school education have the highest percentage of unemployment, with 11.5% or 445 of them being unemployed.
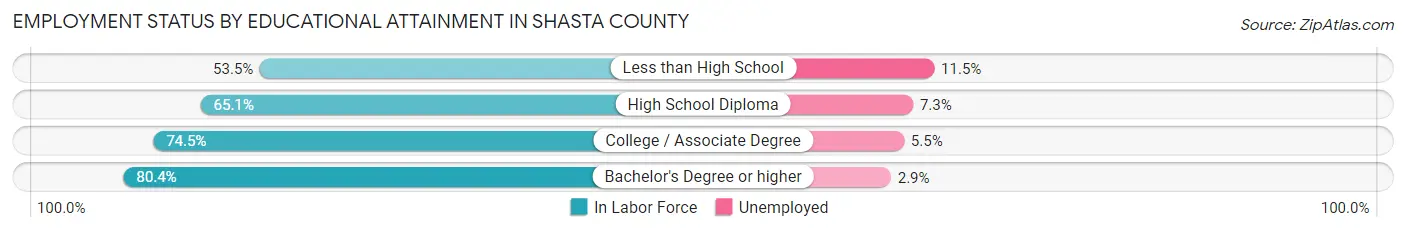
| Educational Attainment | In Labor Force | Unemployed |
| Less than High School | 3,873 (53.5%) | 832 (11.5%) |
| High School Diploma | 15,075 (65.1%) | 1,690 (7.3%) |
| College / Associate Degree | 29,294 (74.5%) | 2,163 (5.5%) |
| Bachelor's Degree or higher | 16,745 (80.4%) | 604 (2.9%) |
| Total | 65,011 (71.8%) | 5,070 (5.6%) |
Employment Occupations by Sex in Shasta County
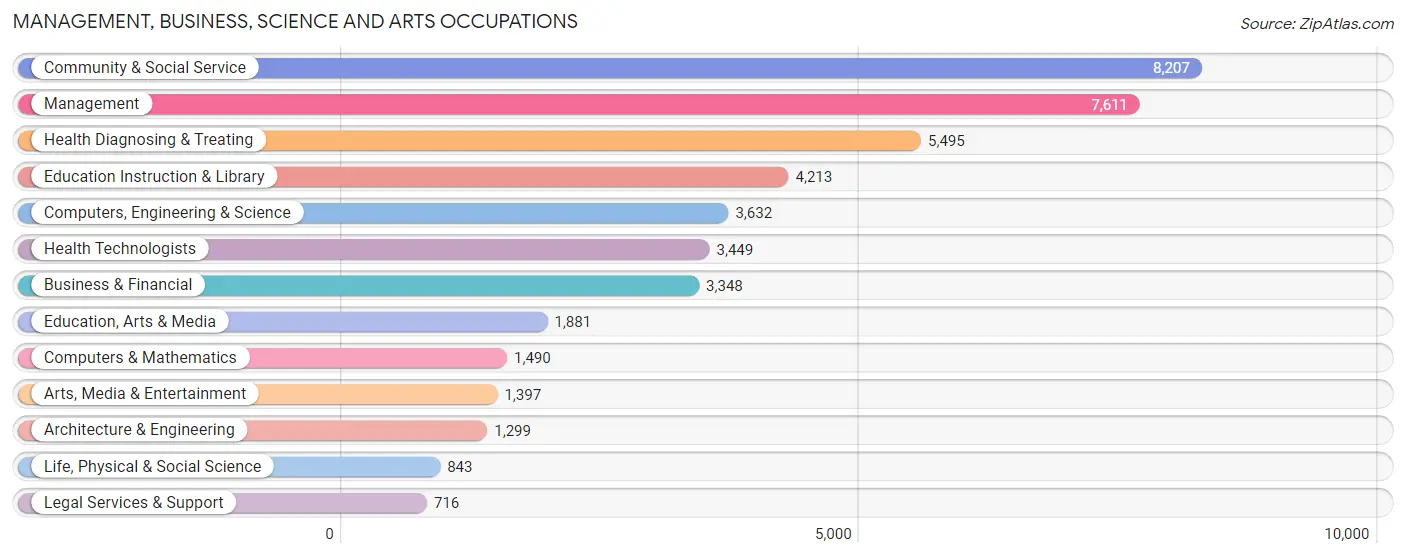
Management, Business, Science and Arts Occupations
The most common Management, Business, Science and Arts occupations in Shasta County are Community & Social Service (8,207 | 10.7%), Management (7,611 | 10.0%), Health Diagnosing & Treating (5,495 | 7.2%), Education Instruction & Library (4,213 | 5.5%), and Computers, Engineering & Science (3,632 | 4.8%).
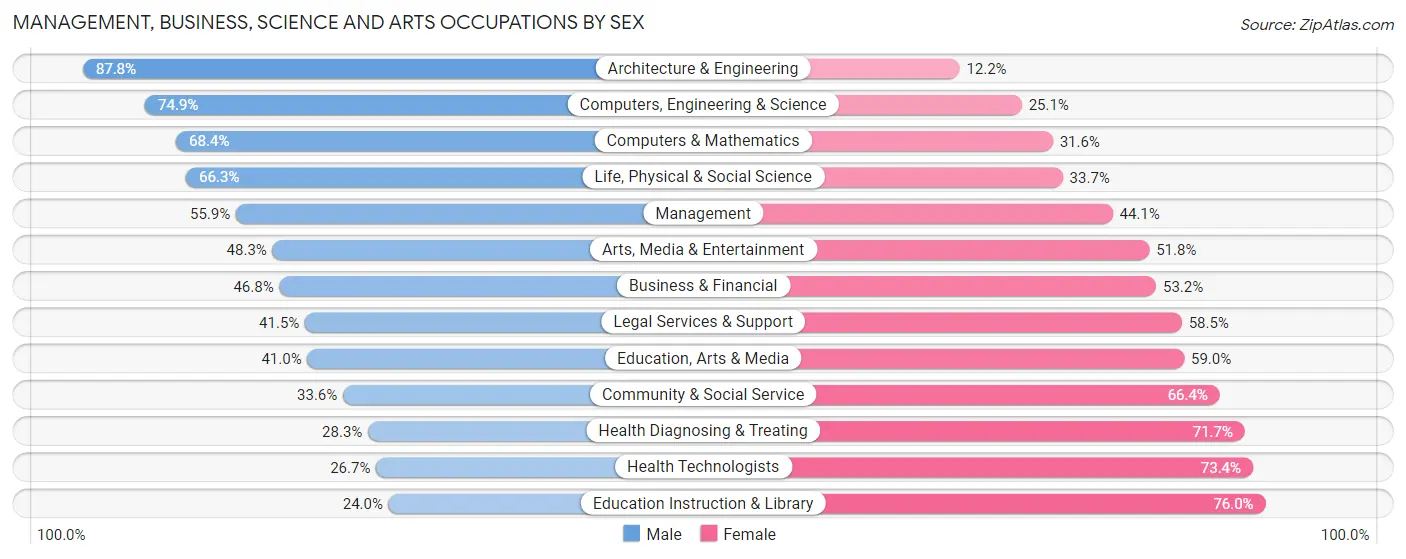
Management, Business, Science and Arts Occupations by Sex
Within the Management, Business, Science and Arts occupations in Shasta County, the most male-oriented occupations are Architecture & Engineering (87.8%), Computers, Engineering & Science (74.9%), and Computers & Mathematics (68.4%), while the most female-oriented occupations are Education Instruction & Library (76.0%), Health Technologists (73.4%), and Health Diagnosing & Treating (71.7%).
| Occupation | Male | Female |
| Management | 4,254 (55.9%) | 3,357 (44.1%) |
| Business & Financial | 1,568 (46.8%) | 1,780 (53.2%) |
| Computers, Engineering & Science | 2,719 (74.9%) | 913 (25.1%) |
| Computers & Mathematics | 1,019 (68.4%) | 471 (31.6%) |
| Architecture & Engineering | 1,141 (87.8%) | 158 (12.2%) |
| Life, Physical & Social Science | 559 (66.3%) | 284 (33.7%) |
| Community & Social Service | 2,754 (33.6%) | 5,453 (66.4%) |
| Education, Arts & Media | 771 (41.0%) | 1,110 (59.0%) |
| Legal Services & Support | 297 (41.5%) | 419 (58.5%) |
| Education Instruction & Library | 1,012 (24.0%) | 3,201 (76.0%) |
| Arts, Media & Entertainment | 674 (48.2%) | 723 (51.7%) |
| Health Diagnosing & Treating | 1,557 (28.3%) | 3,938 (71.7%) |
| Health Technologists | 919 (26.7%) | 2,530 (73.4%) |
| Total (Category) | 12,852 (45.4%) | 15,441 (54.6%) |
| Total (Overall) | 39,652 (52.0%) | 36,662 (48.0%) |
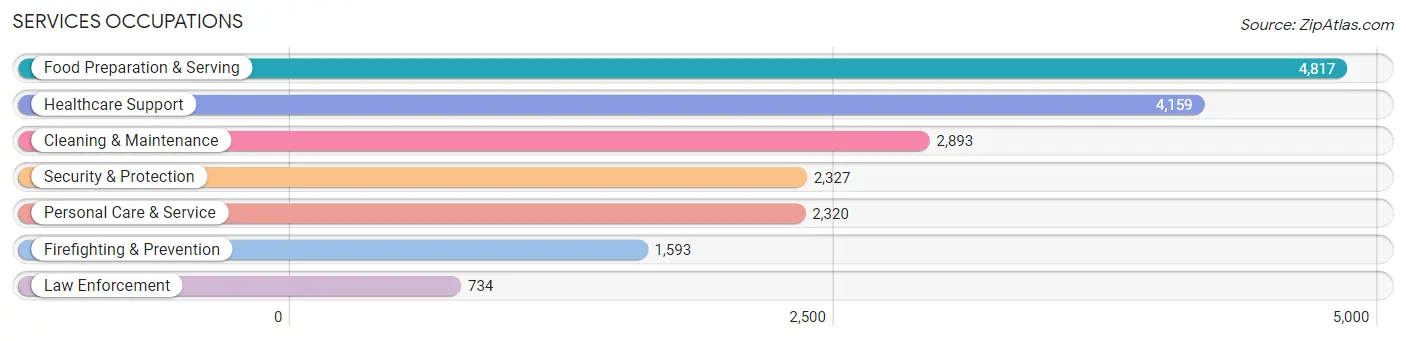
Services Occupations
The most common Services occupations in Shasta County are Food Preparation & Serving (4,817 | 6.3%), Healthcare Support (4,159 | 5.4%), Cleaning & Maintenance (2,893 | 3.8%), Security & Protection (2,327 | 3.0%), and Personal Care & Service (2,320 | 3.0%).
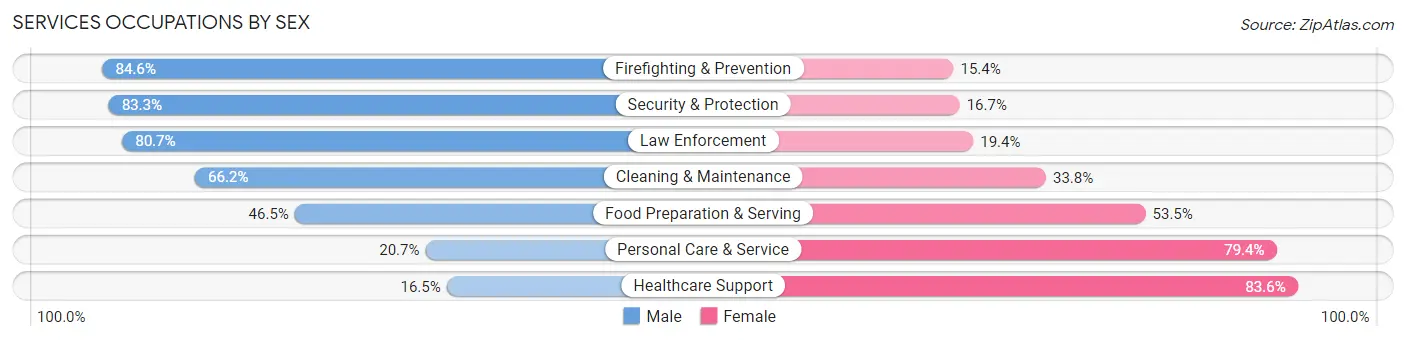
Services Occupations by Sex
Within the Services occupations in Shasta County, the most male-oriented occupations are Firefighting & Prevention (84.6%), Security & Protection (83.3%), and Law Enforcement (80.6%), while the most female-oriented occupations are Healthcare Support (83.6%), Personal Care & Service (79.3%), and Food Preparation & Serving (53.5%).
| Occupation | Male | Female |
| Healthcare Support | 684 (16.5%) | 3,475 (83.6%) |
| Security & Protection | 1,939 (83.3%) | 388 (16.7%) |
| Firefighting & Prevention | 1,347 (84.6%) | 246 (15.4%) |
| Law Enforcement | 592 (80.6%) | 142 (19.4%) |
| Food Preparation & Serving | 2,241 (46.5%) | 2,576 (53.5%) |
| Cleaning & Maintenance | 1,916 (66.2%) | 977 (33.8%) |
| Personal Care & Service | 479 (20.6%) | 1,841 (79.3%) |
| Total (Category) | 7,259 (44.0%) | 9,257 (56.0%) |
| Total (Overall) | 39,652 (52.0%) | 36,662 (48.0%) |
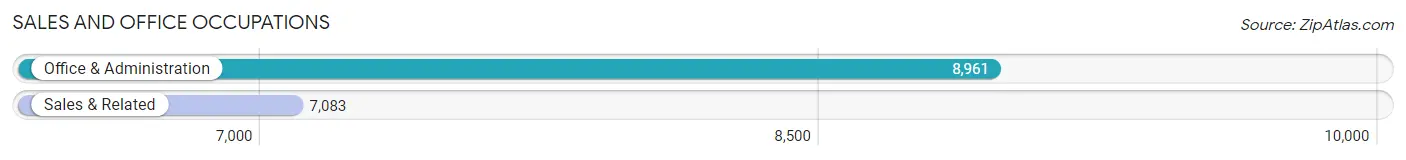
Sales and Office Occupations
The most common Sales and Office occupations in Shasta County are Office & Administration (8,961 | 11.7%), and Sales & Related (7,083 | 9.3%).
Sales and Office Occupations by Sex
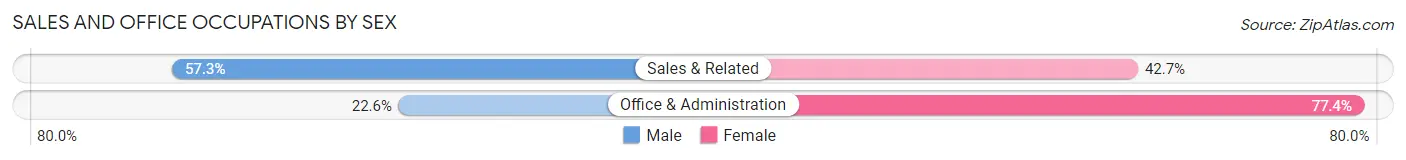
| Occupation | Male | Female |
| Sales & Related | 4,060 (57.3%) | 3,023 (42.7%) |
| Office & Administration | 2,023 (22.6%) | 6,938 (77.4%) |
| Total (Category) | 6,083 (37.9%) | 9,961 (62.1%) |
| Total (Overall) | 39,652 (52.0%) | 36,662 (48.0%) |
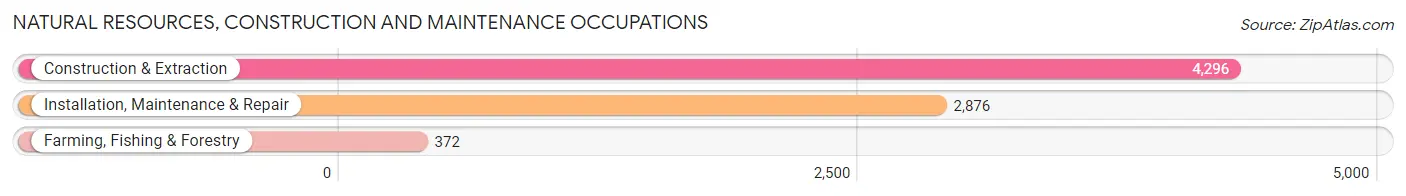
Natural Resources, Construction and Maintenance Occupations
The most common Natural Resources, Construction and Maintenance occupations in Shasta County are Construction & Extraction (4,296 | 5.6%), Installation, Maintenance & Repair (2,876 | 3.8%), and Farming, Fishing & Forestry (372 | 0.5%).
Natural Resources, Construction and Maintenance Occupations by Sex
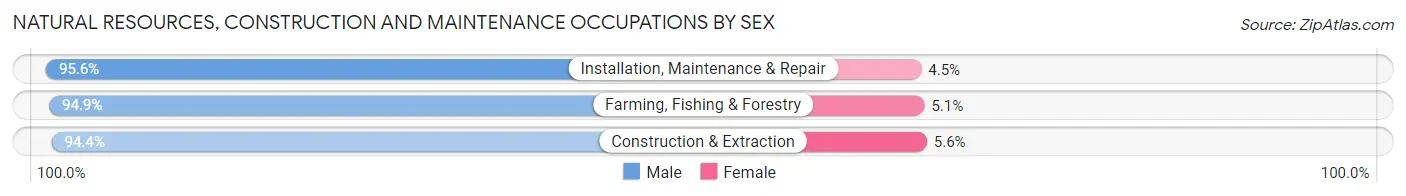
| Occupation | Male | Female |
| Farming, Fishing & Forestry | 353 (94.9%) | 19 (5.1%) |
| Construction & Extraction | 4,055 (94.4%) | 241 (5.6%) |
| Installation, Maintenance & Repair | 2,748 (95.6%) | 128 (4.4%) |
| Total (Category) | 7,156 (94.9%) | 388 (5.1%) |
| Total (Overall) | 39,652 (52.0%) | 36,662 (48.0%) |
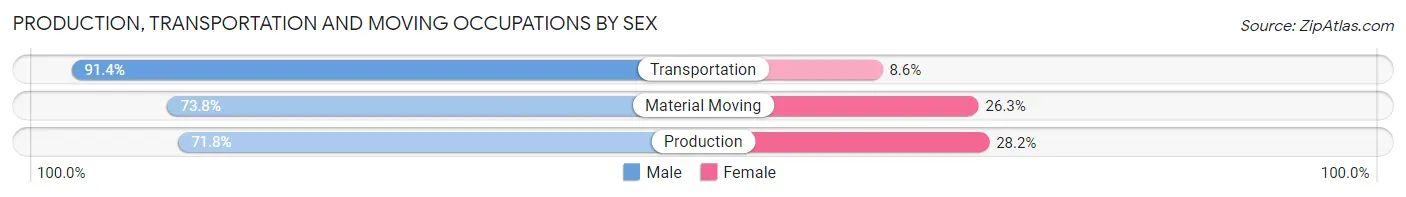
Production, Transportation and Moving Occupations
The most common Production, Transportation and Moving occupations in Shasta County are Transportation (2,937 | 3.8%), Production (2,824 | 3.7%), and Material Moving (2,156 | 2.8%).

Production, Transportation and Moving Occupations by Sex
| Occupation | Male | Female |
| Production | 2,028 (71.8%) | 796 (28.2%) |
| Transportation | 2,684 (91.4%) | 253 (8.6%) |
| Material Moving | 1,590 (73.8%) | 566 (26.3%) |
| Total (Category) | 6,302 (79.6%) | 1,615 (20.4%) |
| Total (Overall) | 39,652 (52.0%) | 36,662 (48.0%) |
Employment Industries by Sex in Shasta County
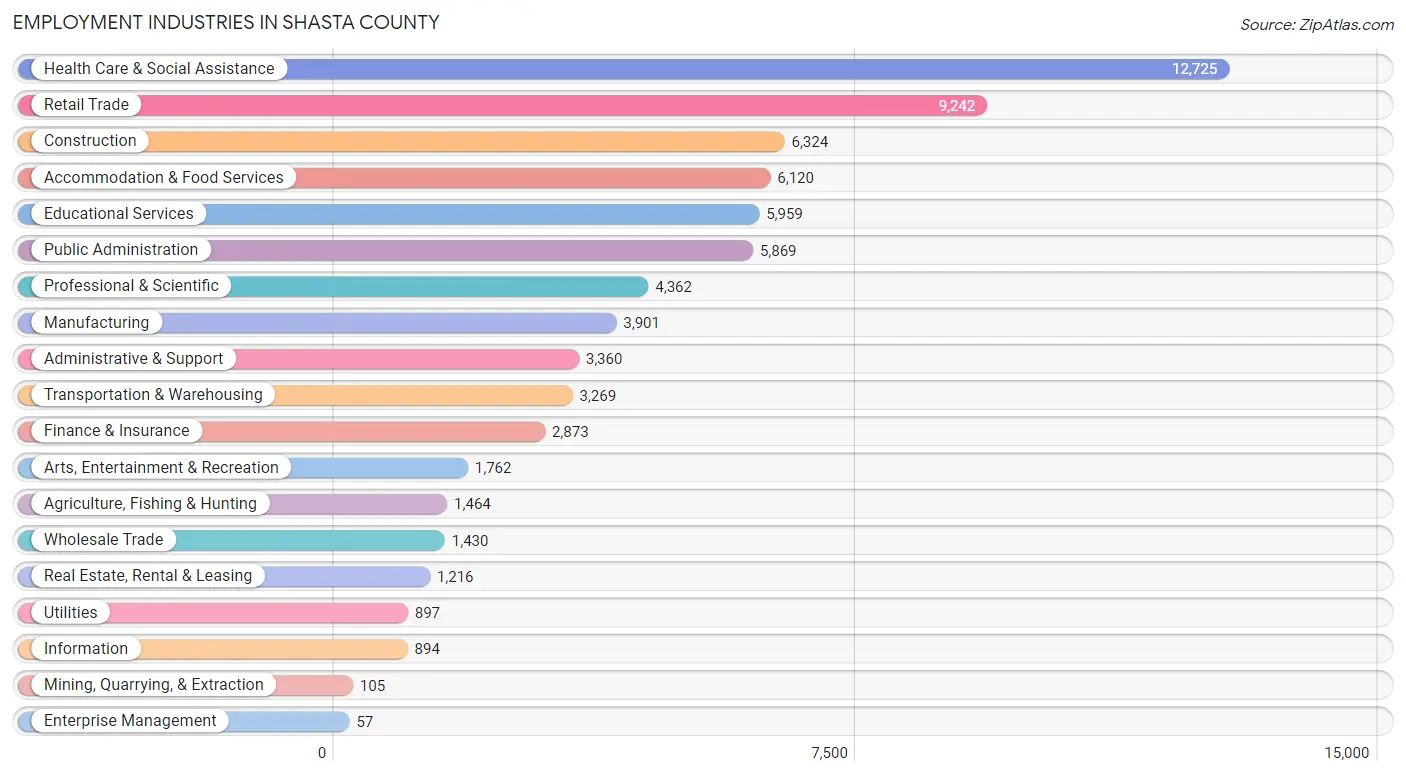
Employment Industries in Shasta County
The major employment industries in Shasta County include Health Care & Social Assistance (12,725 | 16.7%), Retail Trade (9,242 | 12.1%), Construction (6,324 | 8.3%), Accommodation & Food Services (6,120 | 8.0%), and Educational Services (5,959 | 7.8%).
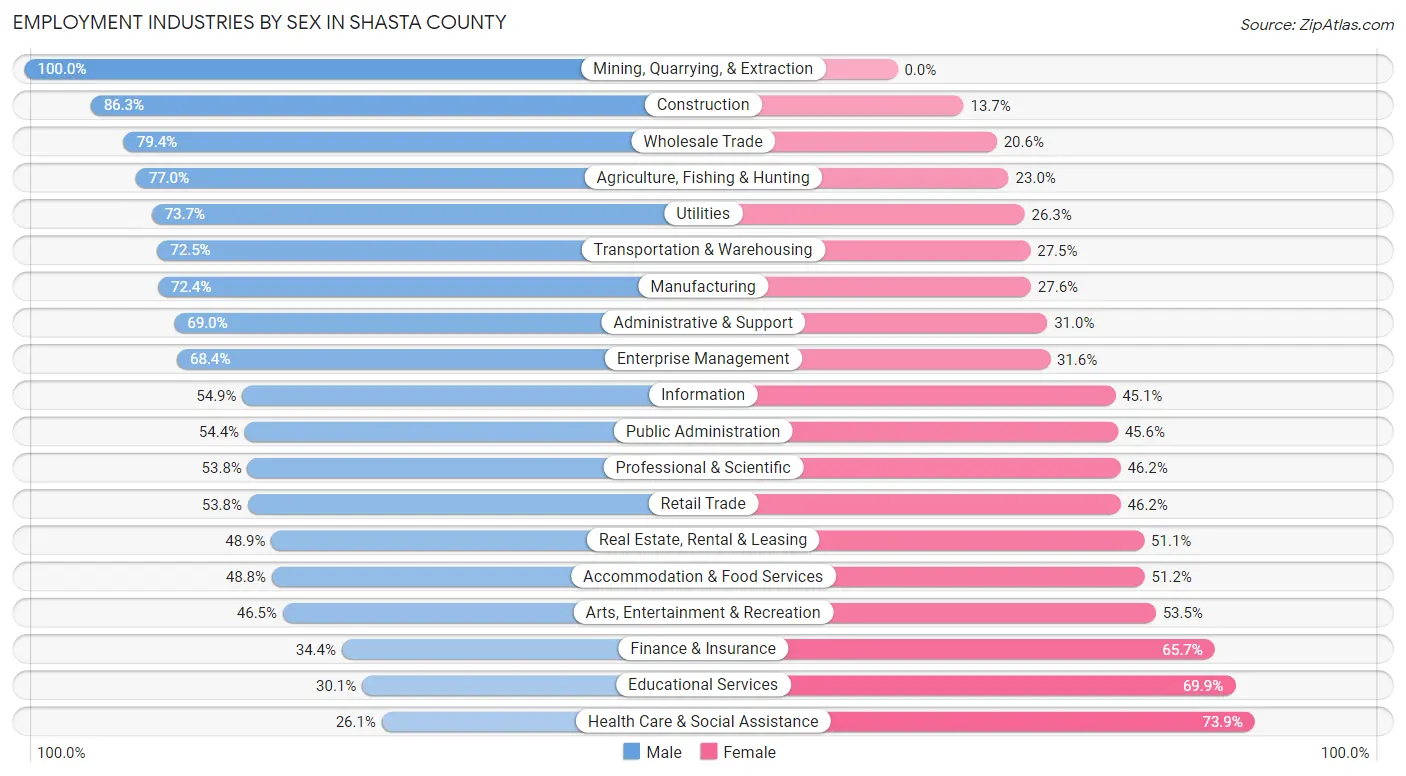
Employment Industries by Sex in Shasta County
The Shasta County industries that see more men than women are Mining, Quarrying, & Extraction (100.0%), Construction (86.3%), and Wholesale Trade (79.4%), whereas the industries that tend to have a higher number of women are Health Care & Social Assistance (73.9%), Educational Services (69.9%), and Finance & Insurance (65.6%).
| Industry | Male | Female |
| Agriculture, Fishing & Hunting | 1,127 (77.0%) | 337 (23.0%) |
| Mining, Quarrying, & Extraction | 105 (100.0%) | 0 (0.0%) |
| Construction | 5,458 (86.3%) | 866 (13.7%) |
| Manufacturing | 2,823 (72.4%) | 1,078 (27.6%) |
| Wholesale Trade | 1,136 (79.4%) | 294 (20.6%) |
| Retail Trade | 4,972 (53.8%) | 4,270 (46.2%) |
| Transportation & Warehousing | 2,370 (72.5%) | 899 (27.5%) |
| Utilities | 661 (73.7%) | 236 (26.3%) |
| Information | 491 (54.9%) | 403 (45.1%) |
| Finance & Insurance | 987 (34.4%) | 1,886 (65.6%) |
| Real Estate, Rental & Leasing | 595 (48.9%) | 621 (51.1%) |
| Professional & Scientific | 2,348 (53.8%) | 2,014 (46.2%) |
| Enterprise Management | 39 (68.4%) | 18 (31.6%) |
| Administrative & Support | 2,318 (69.0%) | 1,042 (31.0%) |
| Educational Services | 1,796 (30.1%) | 4,163 (69.9%) |
| Health Care & Social Assistance | 3,320 (26.1%) | 9,405 (73.9%) |
| Arts, Entertainment & Recreation | 820 (46.5%) | 942 (53.5%) |
| Accommodation & Food Services | 2,988 (48.8%) | 3,132 (51.2%) |
| Public Administration | 3,193 (54.4%) | 2,676 (45.6%) |
| Total | 39,652 (52.0%) | 36,662 (48.0%) |
Education in Shasta County
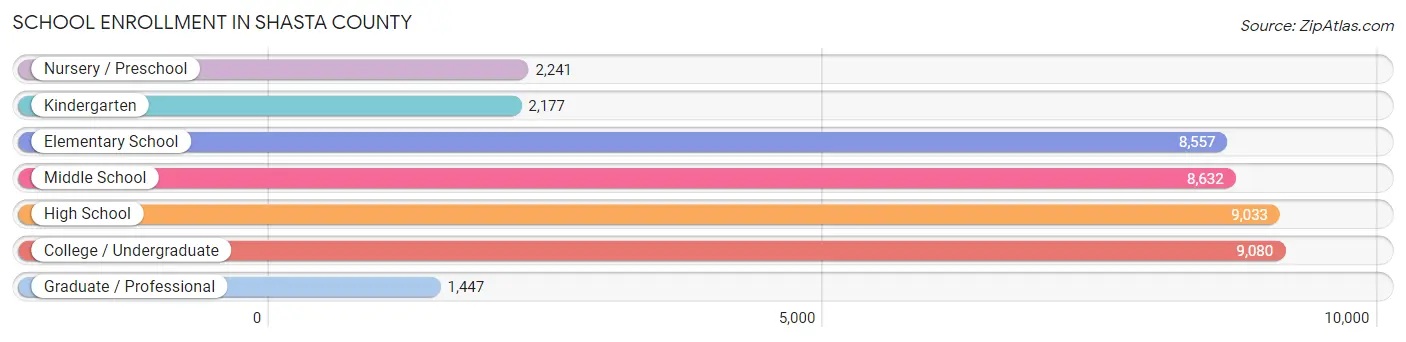
School Enrollment in Shasta County
The most common levels of schooling among the 41,167 students in Shasta County are college / undergraduate (9,080 | 22.1%), high school (9,033 | 21.9%), and middle school (8,632 | 21.0%).
| School Level | # Students | % Students |
| Nursery / Preschool | 2,241 | 5.4% |
| Kindergarten | 2,177 | 5.3% |
| Elementary School | 8,557 | 20.8% |
| Middle School | 8,632 | 21.0% |
| High School | 9,033 | 21.9% |
| College / Undergraduate | 9,080 | 22.1% |
| Graduate / Professional | 1,447 | 3.5% |
| Total | 41,167 | 100.0% |
School Enrollment by Age by Funding Source in Shasta County
Out of a total of 41,167 students who are enrolled in schools in Shasta County, 6,957 (16.9%) attend a private institution, while the remaining 34,210 (83.1%) are enrolled in public schools. The age group of 35 years and over has the highest likelihood of being enrolled in private schools, with 741 (28.9% in the age bracket) enrolled. Conversely, the age group of 15 to 17 year olds has the lowest likelihood of being enrolled in a private school, with 5,872 (91.2% in the age bracket) attending a public institution.
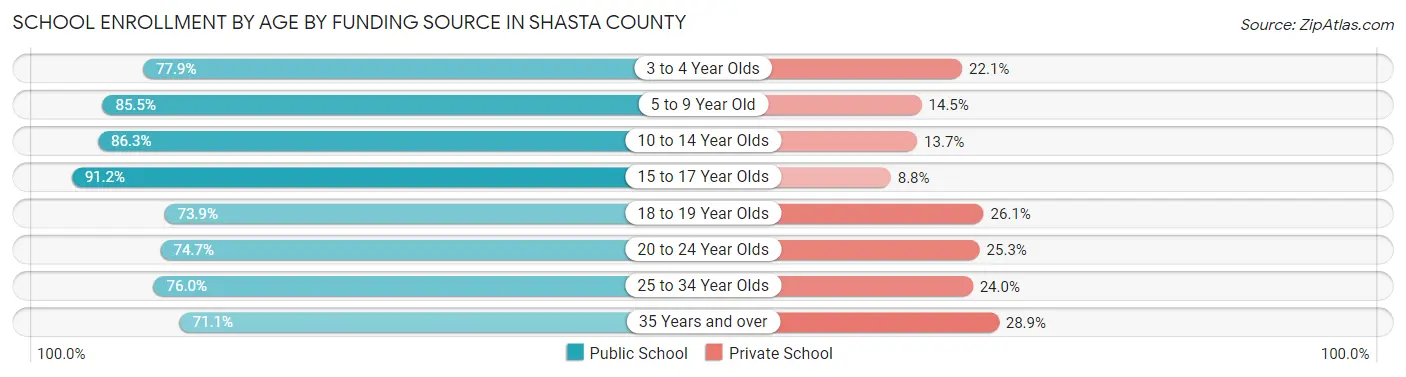
| Age Bracket | Public School | Private School |
| 3 to 4 Year Olds | 1,292 (77.9%) | 366 (22.1%) |
| 5 to 9 Year Old | 8,907 (85.5%) | 1,513 (14.5%) |
| 10 to 14 Year Olds | 9,527 (86.3%) | 1,511 (13.7%) |
| 15 to 17 Year Olds | 5,872 (91.2%) | 565 (8.8%) |
| 18 to 19 Year Olds | 1,934 (73.9%) | 682 (26.1%) |
| 20 to 24 Year Olds | 2,636 (74.7%) | 894 (25.3%) |
| 25 to 34 Year Olds | 2,205 (76.0%) | 698 (24.0%) |
| 35 Years and over | 1,824 (71.1%) | 741 (28.9%) |
| Total | 34,210 (83.1%) | 6,957 (16.9%) |
Educational Attainment by Field of Study in Shasta County
Business (4,429 | 14.1%), science & technology (3,726 | 11.9%), bio, nature & agricultural (2,963 | 9.4%), education (2,866 | 9.1%), and liberal arts & history (2,838 | 9.0%) are the most common fields of study among 31,382 individuals in Shasta County who have obtained a bachelor's degree or higher.
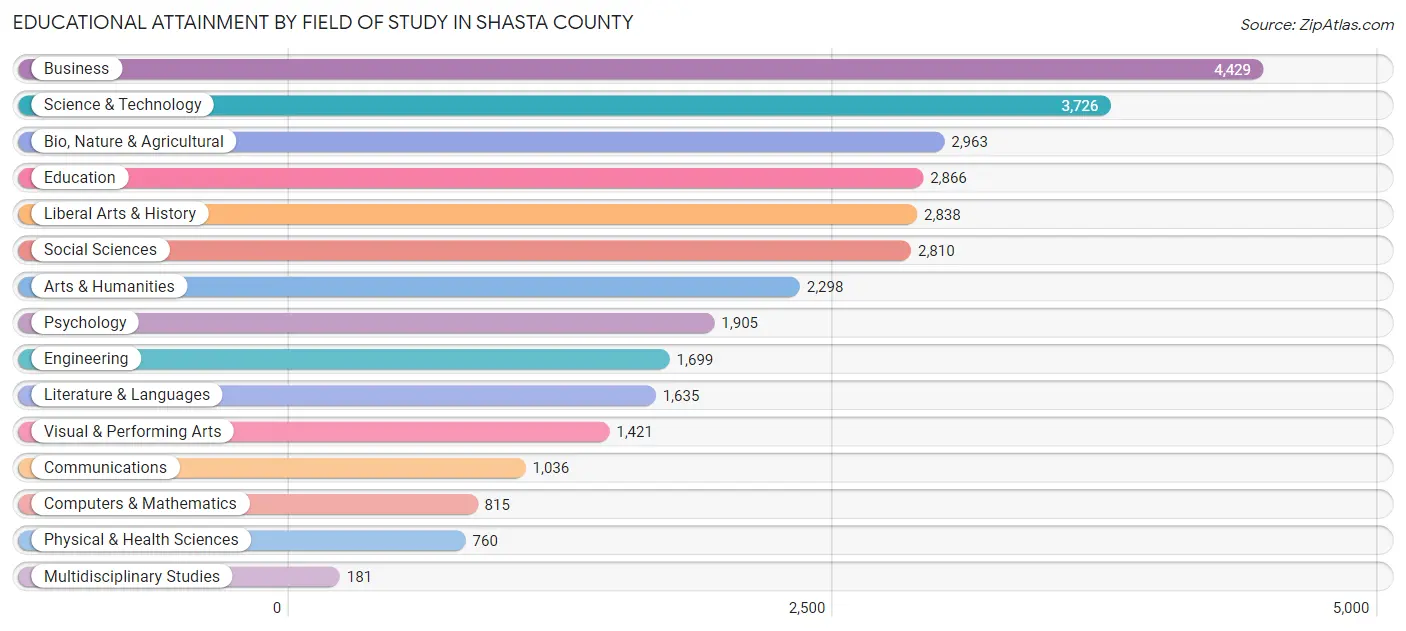
| Field of Study | # Graduates | % Graduates |
| Computers & Mathematics | 815 | 2.6% |
| Bio, Nature & Agricultural | 2,963 | 9.4% |
| Physical & Health Sciences | 760 | 2.4% |
| Psychology | 1,905 | 6.1% |
| Social Sciences | 2,810 | 8.9% |
| Engineering | 1,699 | 5.4% |
| Multidisciplinary Studies | 181 | 0.6% |
| Science & Technology | 3,726 | 11.9% |
| Business | 4,429 | 14.1% |
| Education | 2,866 | 9.1% |
| Literature & Languages | 1,635 | 5.2% |
| Liberal Arts & History | 2,838 | 9.0% |
| Visual & Performing Arts | 1,421 | 4.5% |
| Communications | 1,036 | 3.3% |
| Arts & Humanities | 2,298 | 7.3% |
| Total | 31,382 | 100.0% |
Transportation & Commute in Shasta County
Vehicle Availability by Sex in Shasta County
The most prevalent vehicle ownership categories in Shasta County are males with 2 vehicles (15,108, accounting for 39.4%) and females with 2 vehicles (13,592, making up 42.6%).
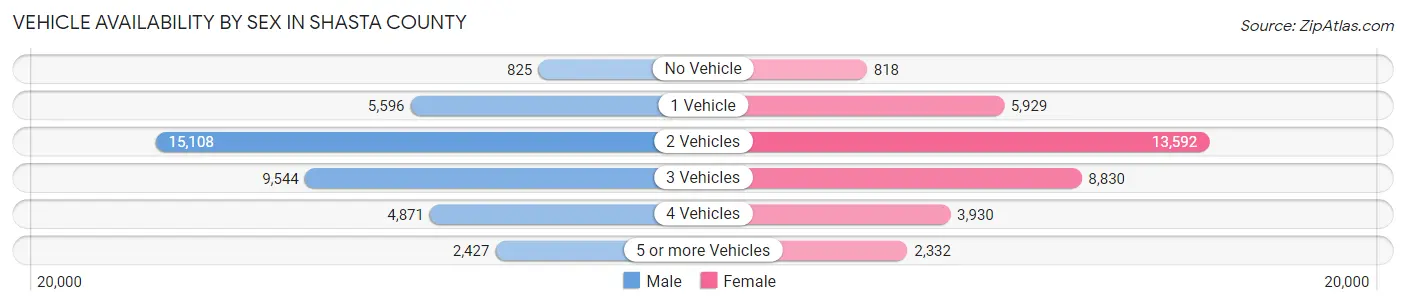
| Vehicles Available | Male | Female |
| No Vehicle | 825 (2.1%) | 818 (2.3%) |
| 1 Vehicle | 5,596 (14.6%) | 5,929 (16.7%) |
| 2 Vehicles | 15,108 (39.4%) | 13,592 (38.4%) |
| 3 Vehicles | 9,544 (24.9%) | 8,830 (24.9%) |
| 4 Vehicles | 4,871 (12.7%) | 3,930 (11.1%) |
| 5 or more Vehicles | 2,427 (6.3%) | 2,332 (6.6%) |
| Total | 38,371 (100.0%) | 35,431 (100.0%) |
Commute Time in Shasta County
The most frequently occuring commute durations in Shasta County are 15 to 19 minutes (15,565 commuters, 22.6%), 10 to 14 minutes (15,334 commuters, 22.3%), and 5 to 9 minutes (10,103 commuters, 14.7%).
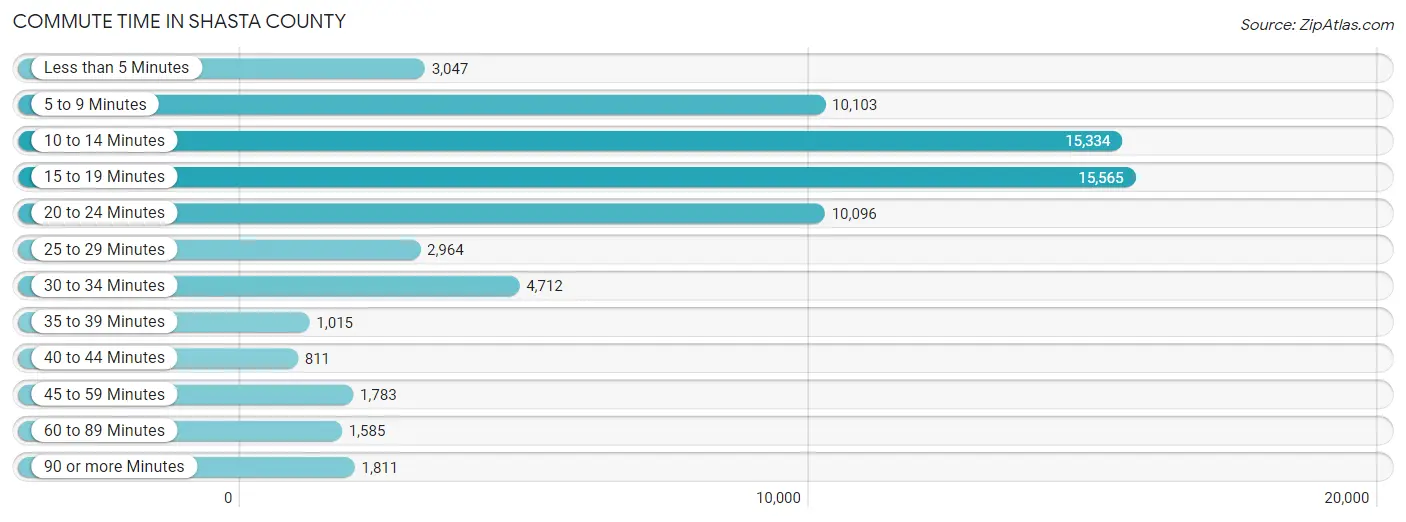
| Commute Time | # Commuters | % Commuters |
| Less than 5 Minutes | 3,047 | 4.4% |
| 5 to 9 Minutes | 10,103 | 14.7% |
| 10 to 14 Minutes | 15,334 | 22.3% |
| 15 to 19 Minutes | 15,565 | 22.6% |
| 20 to 24 Minutes | 10,096 | 14.7% |
| 25 to 29 Minutes | 2,964 | 4.3% |
| 30 to 34 Minutes | 4,712 | 6.9% |
| 35 to 39 Minutes | 1,015 | 1.5% |
| 40 to 44 Minutes | 811 | 1.2% |
| 45 to 59 Minutes | 1,783 | 2.6% |
| 60 to 89 Minutes | 1,585 | 2.3% |
| 90 or more Minutes | 1,811 | 2.6% |
Commute Time by Sex in Shasta County
The most common commute times in Shasta County are 15 to 19 minutes (8,110 commuters, 22.4%) for males and 15 to 19 minutes (7,455 commuters, 22.9%) for females.
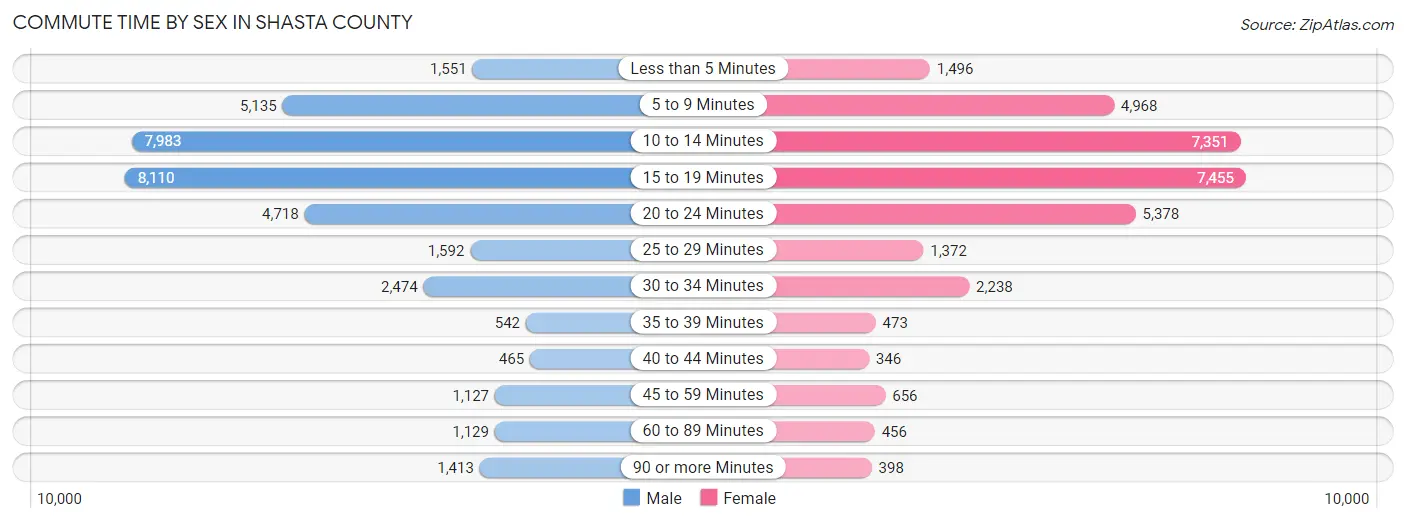
| Commute Time | Male | Female |
| Less than 5 Minutes | 1,551 (4.3%) | 1,496 (4.6%) |
| 5 to 9 Minutes | 5,135 (14.2%) | 4,968 (15.2%) |
| 10 to 14 Minutes | 7,983 (22.0%) | 7,351 (22.6%) |
| 15 to 19 Minutes | 8,110 (22.4%) | 7,455 (22.9%) |
| 20 to 24 Minutes | 4,718 (13.0%) | 5,378 (16.5%) |
| 25 to 29 Minutes | 1,592 (4.4%) | 1,372 (4.2%) |
| 30 to 34 Minutes | 2,474 (6.8%) | 2,238 (6.9%) |
| 35 to 39 Minutes | 542 (1.5%) | 473 (1.5%) |
| 40 to 44 Minutes | 465 (1.3%) | 346 (1.1%) |
| 45 to 59 Minutes | 1,127 (3.1%) | 656 (2.0%) |
| 60 to 89 Minutes | 1,129 (3.1%) | 456 (1.4%) |
| 90 or more Minutes | 1,413 (3.9%) | 398 (1.2%) |
Time of Departure to Work by Sex in Shasta County
The most frequent times of departure to work in Shasta County are 7:30 AM to 7:59 AM (5,037, 13.9%) for males and 7:30 AM to 7:59 AM (7,392, 22.7%) for females.
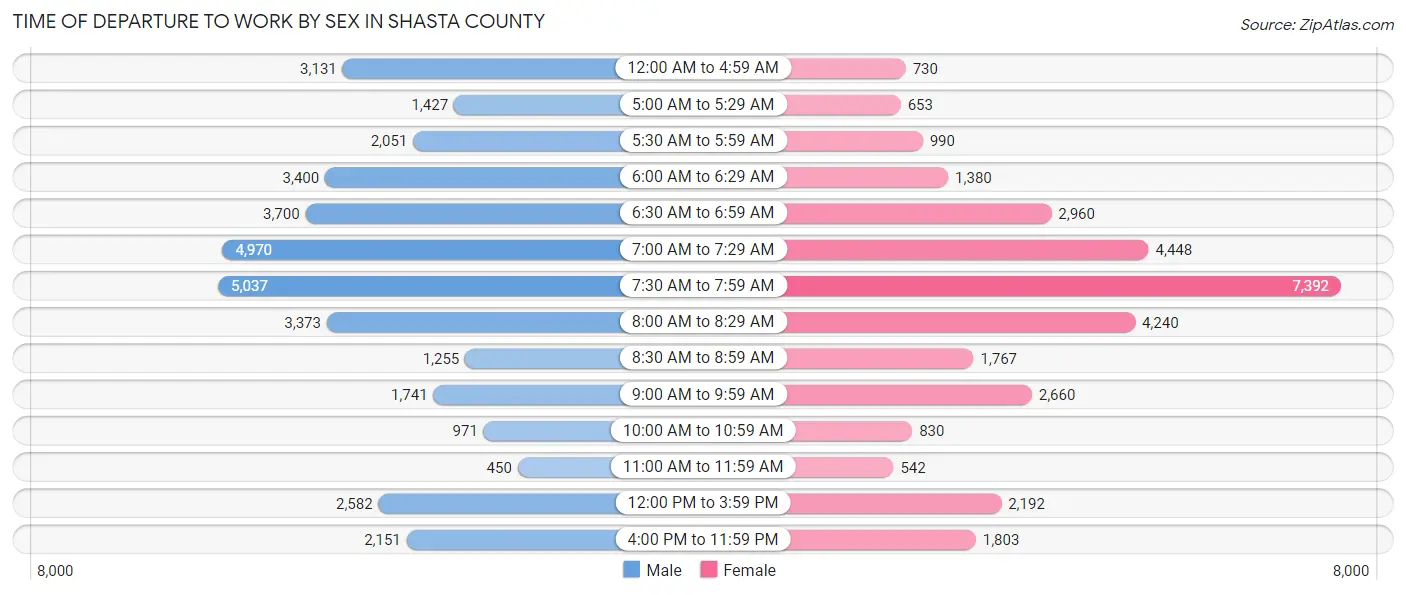
| Time of Departure | Male | Female |
| 12:00 AM to 4:59 AM | 3,131 (8.6%) | 730 (2.2%) |
| 5:00 AM to 5:29 AM | 1,427 (3.9%) | 653 (2.0%) |
| 5:30 AM to 5:59 AM | 2,051 (5.7%) | 990 (3.0%) |
| 6:00 AM to 6:29 AM | 3,400 (9.4%) | 1,380 (4.2%) |
| 6:30 AM to 6:59 AM | 3,700 (10.2%) | 2,960 (9.1%) |
| 7:00 AM to 7:29 AM | 4,970 (13.7%) | 4,448 (13.7%) |
| 7:30 AM to 7:59 AM | 5,037 (13.9%) | 7,392 (22.7%) |
| 8:00 AM to 8:29 AM | 3,373 (9.3%) | 4,240 (13.0%) |
| 8:30 AM to 8:59 AM | 1,255 (3.5%) | 1,767 (5.4%) |
| 9:00 AM to 9:59 AM | 1,741 (4.8%) | 2,660 (8.2%) |
| 10:00 AM to 10:59 AM | 971 (2.7%) | 830 (2.5%) |
| 11:00 AM to 11:59 AM | 450 (1.2%) | 542 (1.7%) |
| 12:00 PM to 3:59 PM | 2,582 (7.1%) | 2,192 (6.7%) |
| 4:00 PM to 11:59 PM | 2,151 (5.9%) | 1,803 (5.5%) |
| Total | 36,239 (100.0%) | 32,587 (100.0%) |
Housing Occupancy in Shasta County
Occupancy by Ownership in Shasta County
Of the total 71,107 dwellings in Shasta County, owner-occupied units account for 46,257 (65.0%), while renter-occupied units make up 24,850 (34.9%).
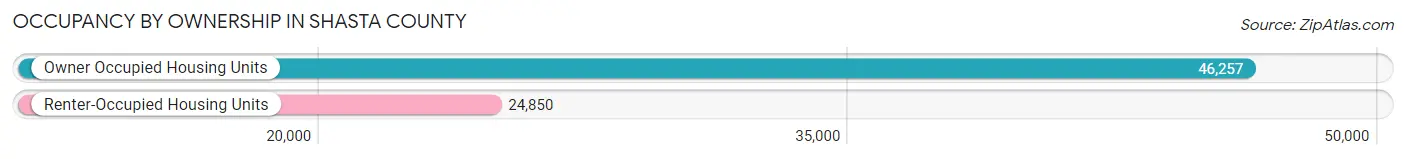
| Occupancy | # Housing Units | % Housing Units |
| Owner Occupied Housing Units | 46,257 | 65.0% |
| Renter-Occupied Housing Units | 24,850 | 34.9% |
| Total Occupied Housing Units | 71,107 | 100.0% |
Occupancy by Household Size in Shasta County
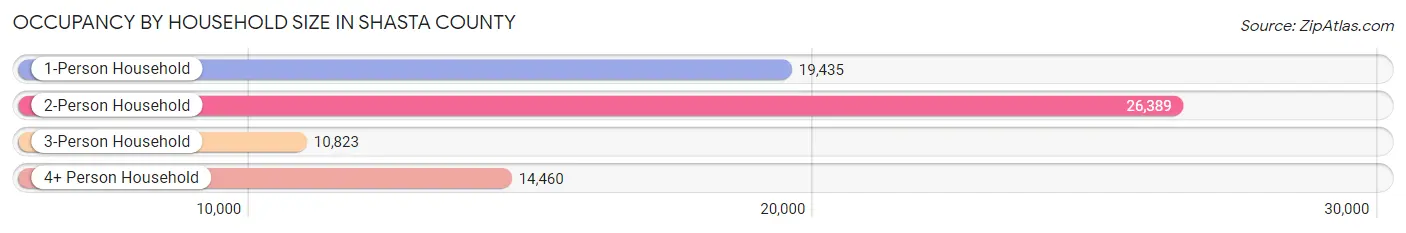
| Household Size | # Housing Units | % Housing Units |
| 1-Person Household | 19,435 | 27.3% |
| 2-Person Household | 26,389 | 37.1% |
| 3-Person Household | 10,823 | 15.2% |
| 4+ Person Household | 14,460 | 20.3% |
| Total Housing Units | 71,107 | 100.0% |
Occupancy by Ownership by Household Size in Shasta County
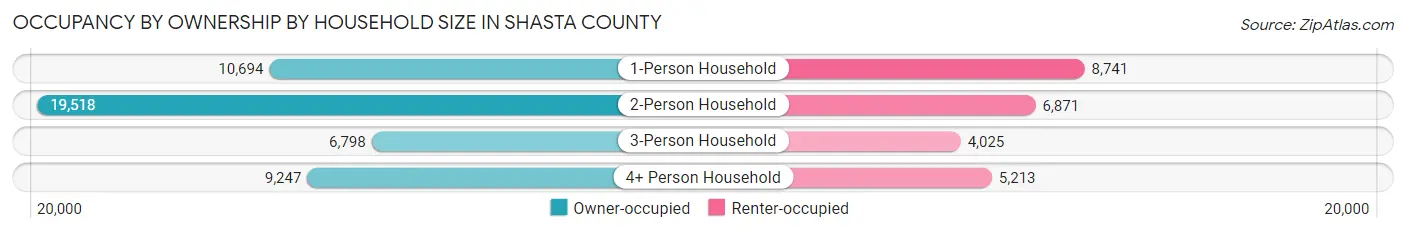
| Household Size | Owner-occupied | Renter-occupied |
| 1-Person Household | 10,694 (55.0%) | 8,741 (45.0%) |
| 2-Person Household | 19,518 (74.0%) | 6,871 (26.0%) |
| 3-Person Household | 6,798 (62.8%) | 4,025 (37.2%) |
| 4+ Person Household | 9,247 (63.9%) | 5,213 (36.0%) |
| Total Housing Units | 46,257 (65.0%) | 24,850 (34.9%) |
Occupancy by Educational Attainment in Shasta County
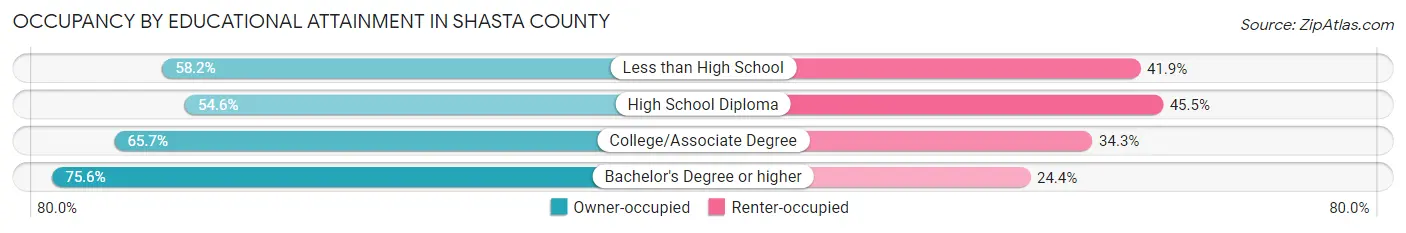
| Household Size | Owner-occupied | Renter-occupied |
| Less than High School | 2,751 (58.2%) | 1,980 (41.8%) |
| High School Diploma | 8,721 (54.5%) | 7,267 (45.5%) |
| College/Associate Degree | 22,071 (65.7%) | 11,500 (34.3%) |
| Bachelor's Degree or higher | 12,714 (75.6%) | 4,103 (24.4%) |
Occupancy by Age of Householder in Shasta County
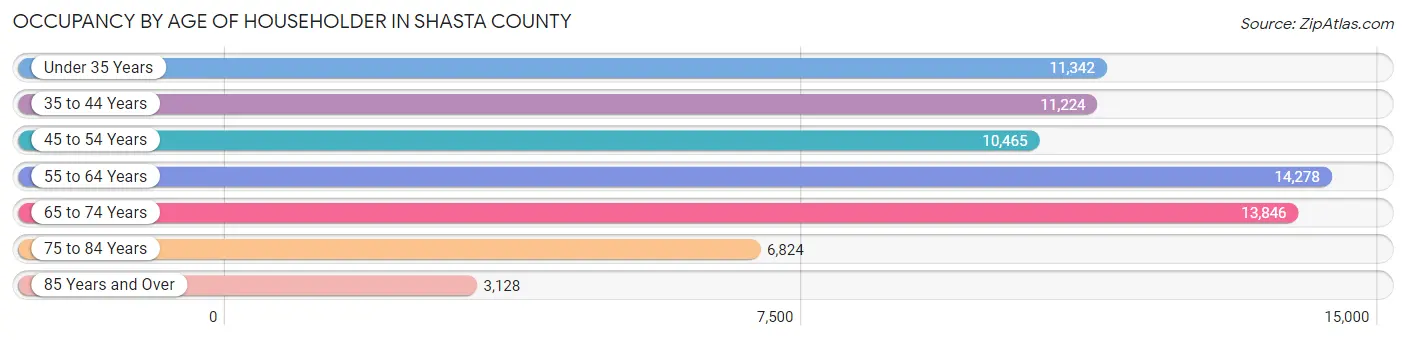
| Age Bracket | # Households | % Households |
| Under 35 Years | 11,342 | 16.0% |
| 35 to 44 Years | 11,224 | 15.8% |
| 45 to 54 Years | 10,465 | 14.7% |
| 55 to 64 Years | 14,278 | 20.1% |
| 65 to 74 Years | 13,846 | 19.5% |
| 75 to 84 Years | 6,824 | 9.6% |
| 85 Years and Over | 3,128 | 4.4% |
| Total | 71,107 | 100.0% |
Housing Finances in Shasta County
Median Income by Occupancy in Shasta County
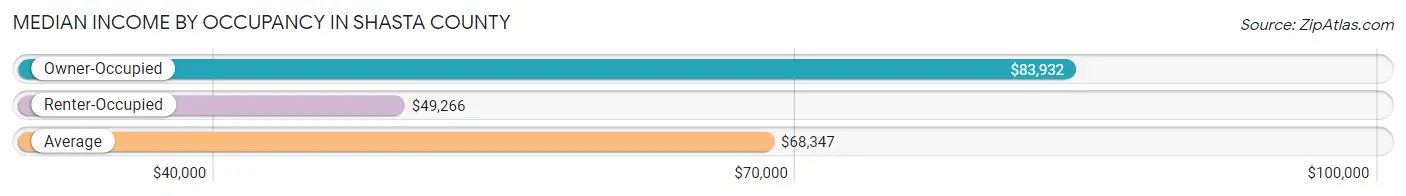
| Occupancy Type | # Households | Median Income |
| Owner-Occupied | 46,257 (65.0%) | $83,932 |
| Renter-Occupied | 24,850 (34.9%) | $49,266 |
| Average | 71,107 (100.0%) | $68,347 |
Occupancy by Householder Income Bracket in Shasta County
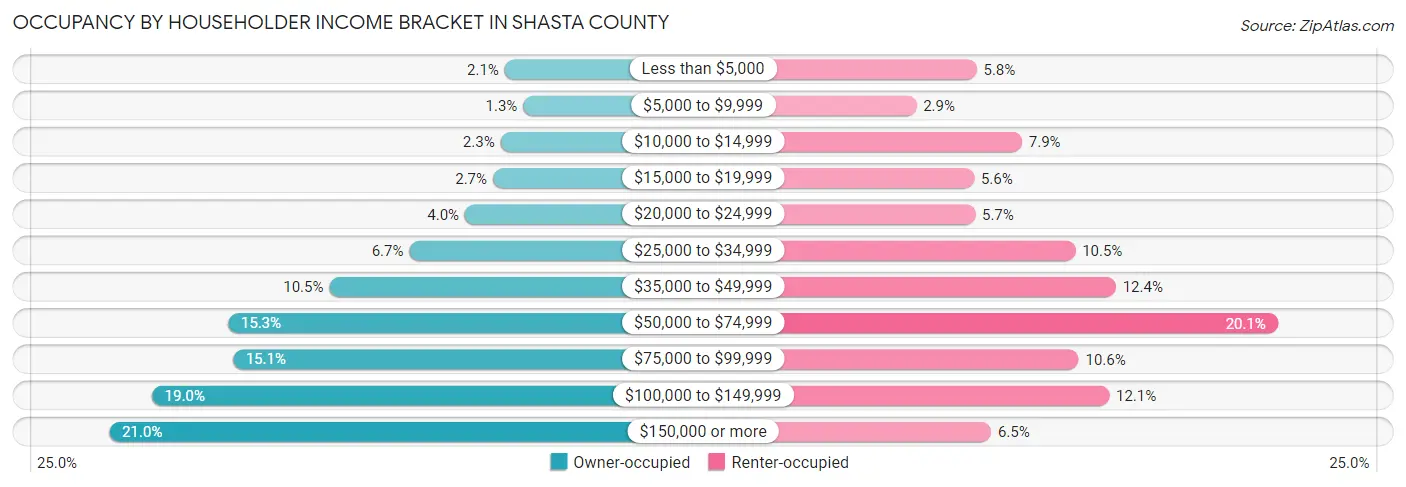
| Income Bracket | Owner-occupied | Renter-occupied |
| Less than $5,000 | 992 (2.1%) | 1,432 (5.8%) |
| $5,000 to $9,999 | 584 (1.3%) | 717 (2.9%) |
| $10,000 to $14,999 | 1,084 (2.3%) | 1,969 (7.9%) |
| $15,000 to $19,999 | 1,247 (2.7%) | 1,401 (5.6%) |
| $20,000 to $24,999 | 1,866 (4.0%) | 1,414 (5.7%) |
| $25,000 to $34,999 | 3,092 (6.7%) | 2,599 (10.5%) |
| $35,000 to $49,999 | 4,851 (10.5%) | 3,080 (12.4%) |
| $50,000 to $74,999 | 7,088 (15.3%) | 4,995 (20.1%) |
| $75,000 to $99,999 | 6,981 (15.1%) | 2,640 (10.6%) |
| $100,000 to $149,999 | 8,768 (19.0%) | 2,999 (12.1%) |
| $150,000 or more | 9,704 (21.0%) | 1,604 (6.5%) |
| Total | 46,257 (100.0%) | 24,850 (100.0%) |
Monthly Housing Cost Tiers in Shasta County
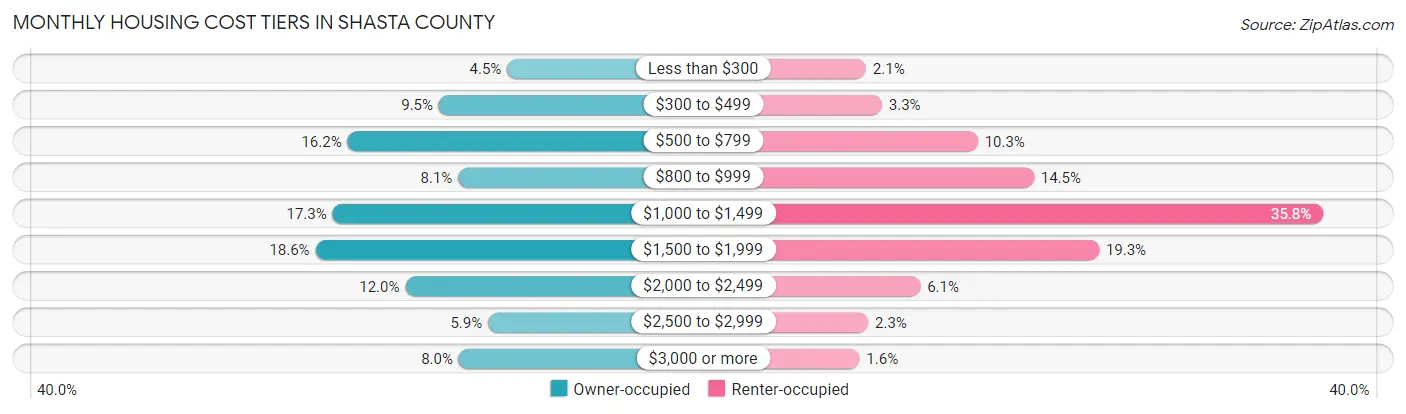
| Monthly Cost | Owner-occupied | Renter-occupied |
| Less than $300 | 2,063 (4.5%) | 521 (2.1%) |
| $300 to $499 | 4,391 (9.5%) | 812 (3.3%) |
| $500 to $799 | 7,505 (16.2%) | 2,568 (10.3%) |
| $800 to $999 | 3,735 (8.1%) | 3,593 (14.5%) |
| $1,000 to $1,499 | 8,014 (17.3%) | 8,886 (35.8%) |
| $1,500 to $1,999 | 8,594 (18.6%) | 4,786 (19.3%) |
| $2,000 to $2,499 | 5,532 (12.0%) | 1,516 (6.1%) |
| $2,500 to $2,999 | 2,713 (5.9%) | 562 (2.3%) |
| $3,000 or more | 3,710 (8.0%) | 403 (1.6%) |
| Total | 46,257 (100.0%) | 24,850 (100.0%) |
Physical Housing Characteristics in Shasta County
Housing Structures in Shasta County
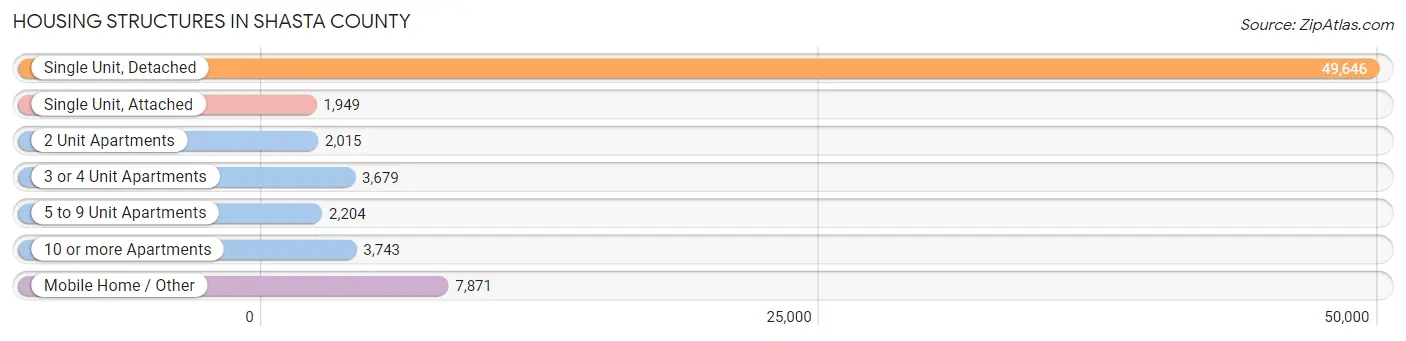
| Structure Type | # Housing Units | % Housing Units |
| Single Unit, Detached | 49,646 | 69.8% |
| Single Unit, Attached | 1,949 | 2.7% |
| 2 Unit Apartments | 2,015 | 2.8% |
| 3 or 4 Unit Apartments | 3,679 | 5.2% |
| 5 to 9 Unit Apartments | 2,204 | 3.1% |
| 10 or more Apartments | 3,743 | 5.3% |
| Mobile Home / Other | 7,871 | 11.1% |
| Total | 71,107 | 100.0% |
Housing Structures by Occupancy in Shasta County
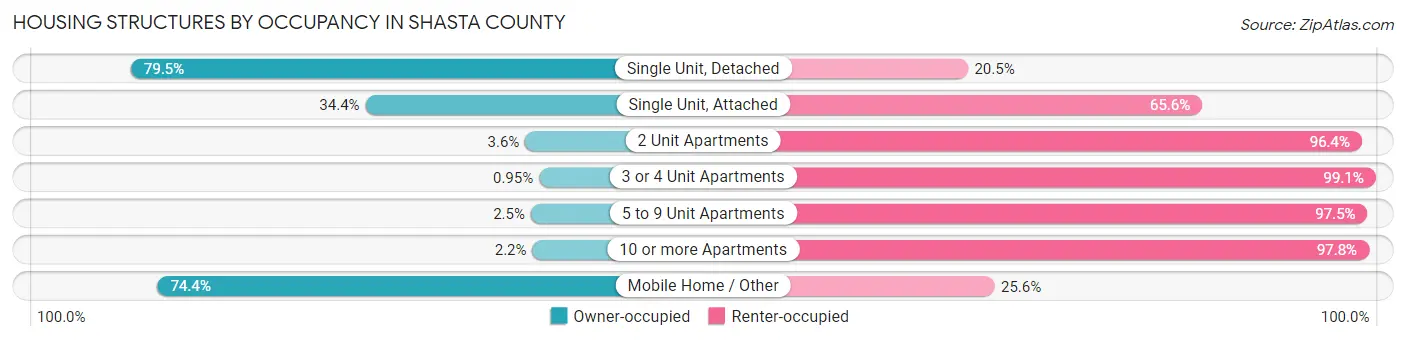
| Structure Type | Owner-occupied | Renter-occupied |
| Single Unit, Detached | 39,482 (79.5%) | 10,164 (20.5%) |
| Single Unit, Attached | 670 (34.4%) | 1,279 (65.6%) |
| 2 Unit Apartments | 73 (3.6%) | 1,942 (96.4%) |
| 3 or 4 Unit Apartments | 35 (0.9%) | 3,644 (99.1%) |
| 5 to 9 Unit Apartments | 56 (2.5%) | 2,148 (97.5%) |
| 10 or more Apartments | 84 (2.2%) | 3,659 (97.8%) |
| Mobile Home / Other | 5,857 (74.4%) | 2,014 (25.6%) |
| Total | 46,257 (65.0%) | 24,850 (34.9%) |
Housing Structures by Number of Rooms in Shasta County
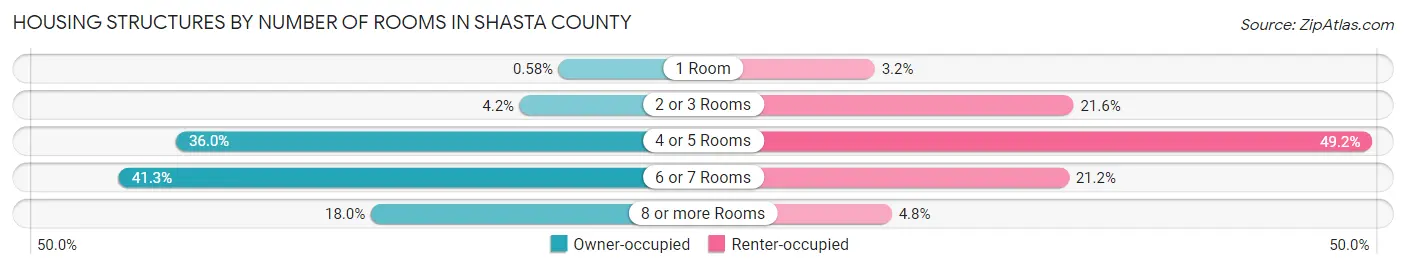
| Number of Rooms | Owner-occupied | Renter-occupied |
| 1 Room | 266 (0.6%) | 800 (3.2%) |
| 2 or 3 Rooms | 1,936 (4.2%) | 5,367 (21.6%) |
| 4 or 5 Rooms | 16,653 (36.0%) | 12,234 (49.2%) |
| 6 or 7 Rooms | 19,096 (41.3%) | 5,259 (21.2%) |
| 8 or more Rooms | 8,306 (18.0%) | 1,190 (4.8%) |
| Total | 46,257 (100.0%) | 24,850 (100.0%) |
Housing Structure by Heating Type in Shasta County
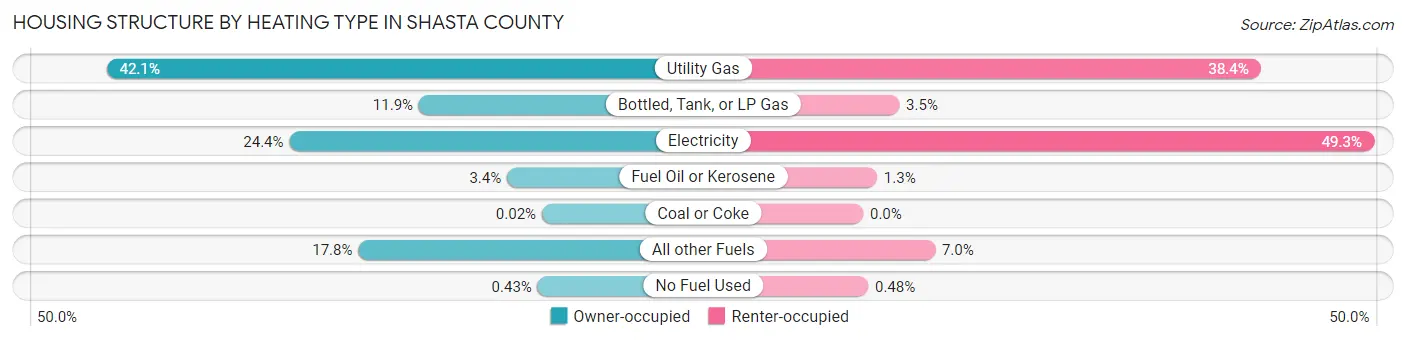
| Heating Type | Owner-occupied | Renter-occupied |
| Utility Gas | 19,466 (42.1%) | 9,543 (38.4%) |
| Bottled, Tank, or LP Gas | 5,505 (11.9%) | 867 (3.5%) |
| Electricity | 11,295 (24.4%) | 12,260 (49.3%) |
| Fuel Oil or Kerosene | 1,569 (3.4%) | 334 (1.3%) |
| Coal or Coke | 9 (0.0%) | 0 (0.0%) |
| All other Fuels | 8,216 (17.8%) | 1,727 (7.0%) |
| No Fuel Used | 197 (0.4%) | 119 (0.5%) |
| Total | 46,257 (100.0%) | 24,850 (100.0%) |
Household Vehicle Usage in Shasta County
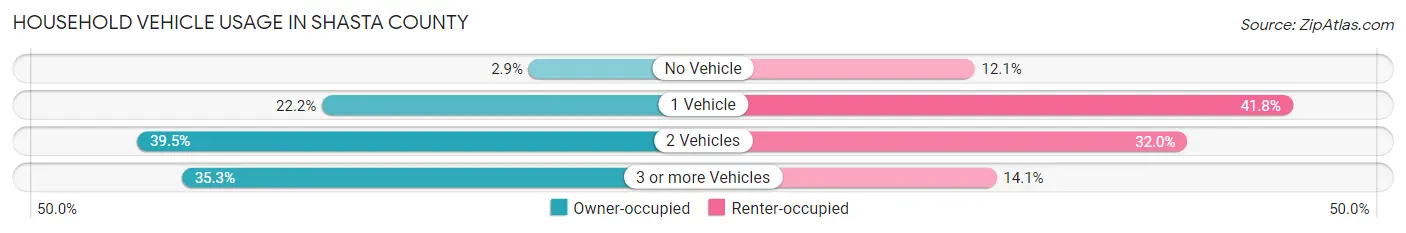
| Vehicles per Household | Owner-occupied | Renter-occupied |
| No Vehicle | 1,354 (2.9%) | 3,006 (12.1%) |
| 1 Vehicle | 10,284 (22.2%) | 10,387 (41.8%) |
| 2 Vehicles | 18,275 (39.5%) | 7,942 (32.0%) |
| 3 or more Vehicles | 16,344 (35.3%) | 3,515 (14.1%) |
| Total | 46,257 (100.0%) | 24,850 (100.0%) |
Real Estate & Mortgages in Shasta County
Real Estate and Mortgage Overview in Shasta County
| Characteristic | Without Mortgage | With Mortgage |
| Housing Units | 17,835 | 28,422 |
| Median Property Value | $277,800 | $347,900 |
| Median Household Income | $55,835 | $7,404 |
| Monthly Housing Costs | $610 | $3,655 |
| Real Estate Taxes | $1,826 | $590 |
Property Value by Mortgage Status in Shasta County
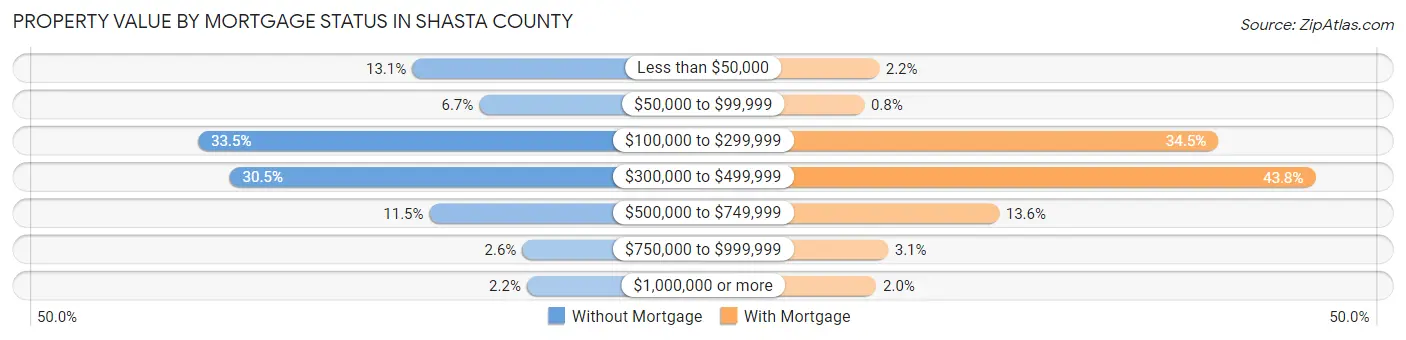
| Property Value | Without Mortgage | With Mortgage |
| Less than $50,000 | 2,337 (13.1%) | 629 (2.2%) |
| $50,000 to $99,999 | 1,196 (6.7%) | 227 (0.8%) |
| $100,000 to $299,999 | 5,972 (33.5%) | 9,814 (34.5%) |
| $300,000 to $499,999 | 5,435 (30.5%) | 12,447 (43.8%) |
| $500,000 to $749,999 | 2,042 (11.5%) | 3,876 (13.6%) |
| $750,000 to $999,999 | 465 (2.6%) | 873 (3.1%) |
| $1,000,000 or more | 388 (2.2%) | 556 (2.0%) |
| Total | 17,835 (100.0%) | 28,422 (100.0%) |
Household Income by Mortgage Status in Shasta County
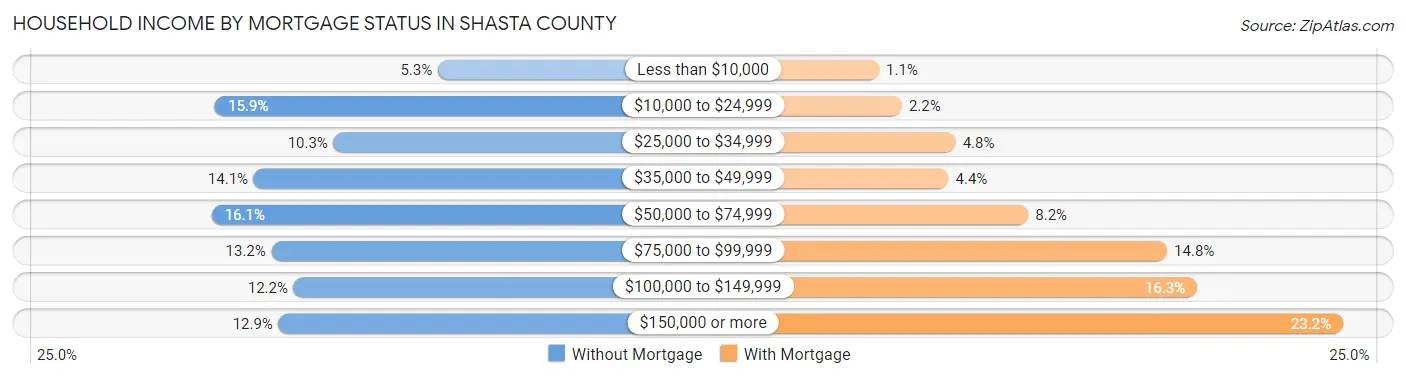
| Household Income | Without Mortgage | With Mortgage |
| Less than $10,000 | 947 (5.3%) | 319 (1.1%) |
| $10,000 to $24,999 | 2,842 (15.9%) | 629 (2.2%) |
| $25,000 to $34,999 | 1,833 (10.3%) | 1,355 (4.8%) |
| $35,000 to $49,999 | 2,511 (14.1%) | 1,259 (4.4%) |
| $50,000 to $74,999 | 2,869 (16.1%) | 2,340 (8.2%) |
| $75,000 to $99,999 | 2,361 (13.2%) | 4,219 (14.8%) |
| $100,000 to $149,999 | 2,172 (12.2%) | 4,620 (16.3%) |
| $150,000 or more | 2,300 (12.9%) | 6,596 (23.2%) |
| Total | 17,835 (100.0%) | 28,422 (100.0%) |
Property Value to Household Income Ratio in Shasta County
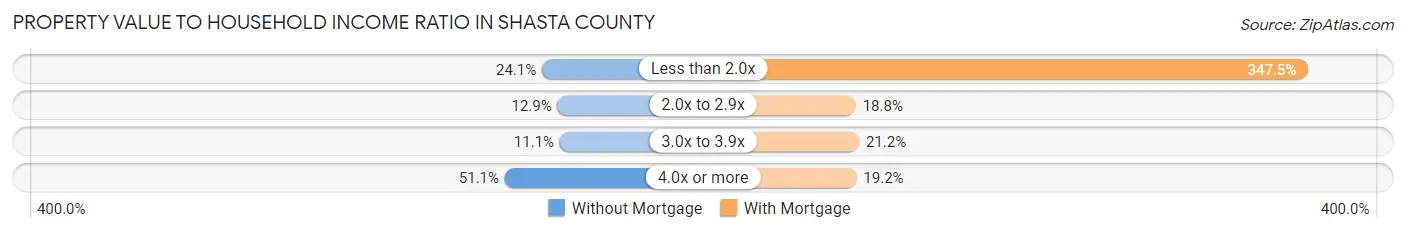
| Value-to-Income Ratio | Without Mortgage | With Mortgage |
| Less than 2.0x | 4,298 (24.1%) | 98,768 (347.5%) |
| 2.0x to 2.9x | 2,294 (12.9%) | 5,336 (18.8%) |
| 3.0x to 3.9x | 1,982 (11.1%) | 6,014 (21.2%) |
| 4.0x or more | 9,113 (51.1%) | 5,468 (19.2%) |
| Total | 17,835 (100.0%) | 28,422 (100.0%) |
Real Estate Taxes by Mortgage Status in Shasta County
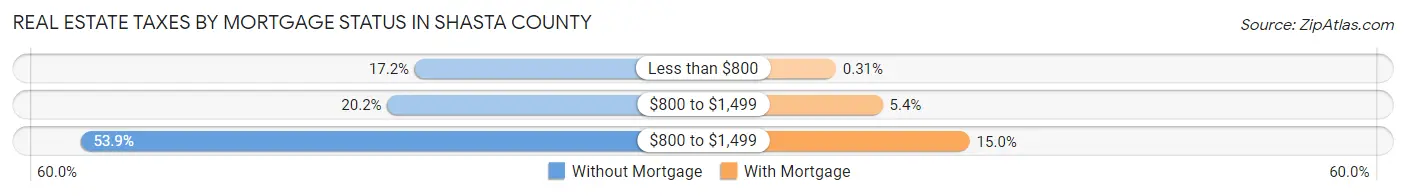
| Property Taxes | Without Mortgage | With Mortgage |
| Less than $800 | 3,071 (17.2%) | 88 (0.3%) |
| $800 to $1,499 | 3,609 (20.2%) | 1,542 (5.4%) |
| $800 to $1,499 | 9,608 (53.9%) | 4,256 (15.0%) |
| Total | 17,835 (100.0%) | 28,422 (100.0%) |
Health & Disability in Shasta County
Health Insurance Coverage by Age in Shasta County
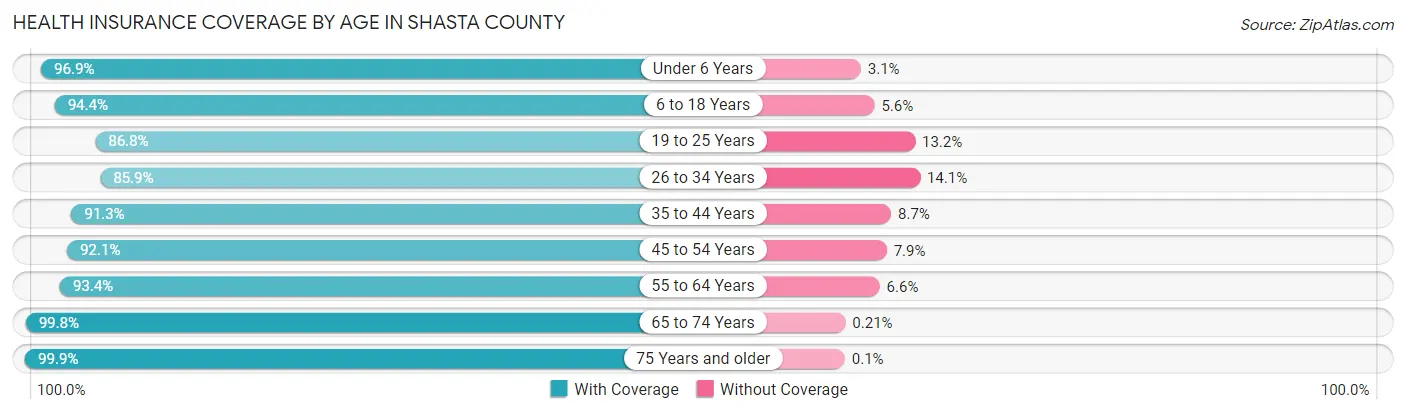
| Age Bracket | With Coverage | Without Coverage |
| Under 6 Years | 12,142 (96.9%) | 387 (3.1%) |
| 6 to 18 Years | 27,211 (94.4%) | 1,620 (5.6%) |
| 19 to 25 Years | 11,862 (86.8%) | 1,803 (13.2%) |
| 26 to 34 Years | 17,567 (85.9%) | 2,885 (14.1%) |
| 35 to 44 Years | 19,616 (91.3%) | 1,874 (8.7%) |
| 45 to 54 Years | 18,594 (92.1%) | 1,597 (7.9%) |
| 55 to 64 Years | 23,856 (93.4%) | 1,683 (6.6%) |
| 65 to 74 Years | 22,392 (99.8%) | 47 (0.2%) |
| 75 Years and older | 15,116 (99.9%) | 15 (0.1%) |
| Total | 168,356 (93.4%) | 11,911 (6.6%) |
Health Insurance Coverage by Citizenship Status in Shasta County
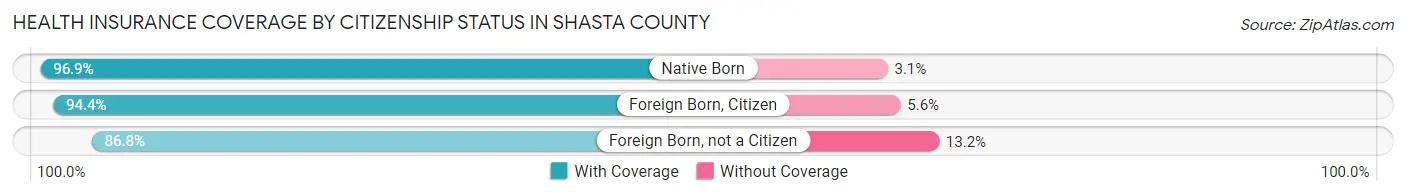
| Citizenship Status | With Coverage | Without Coverage |
| Native Born | 12,142 (96.9%) | 387 (3.1%) |
| Foreign Born, Citizen | 27,211 (94.4%) | 1,620 (5.6%) |
| Foreign Born, not a Citizen | 11,862 (86.8%) | 1,803 (13.2%) |
Health Insurance Coverage by Household Income in Shasta County
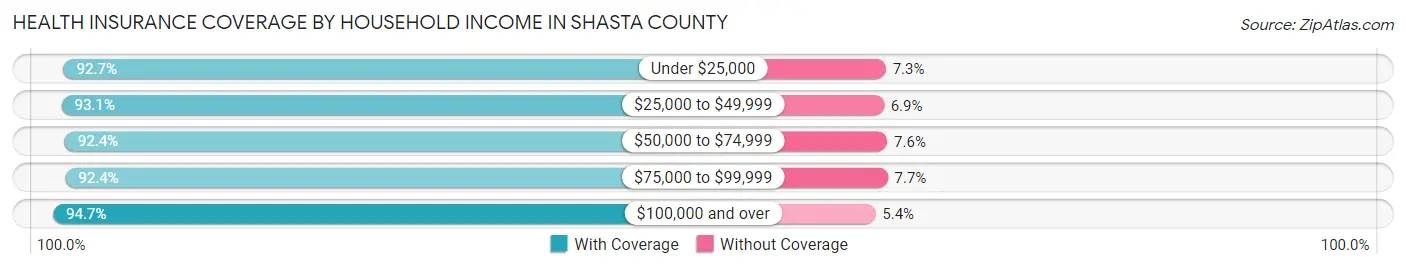
| Household Income | With Coverage | Without Coverage |
| Under $25,000 | 19,169 (92.7%) | 1,509 (7.3%) |
| $25,000 to $49,999 | 25,850 (93.1%) | 1,923 (6.9%) |
| $50,000 to $74,999 | 27,738 (92.4%) | 2,267 (7.6%) |
| $75,000 to $99,999 | 25,193 (92.3%) | 2,086 (7.6%) |
| $100,000 and over | 68,646 (94.7%) | 3,882 (5.3%) |
Public vs Private Health Insurance Coverage by Age in Shasta County
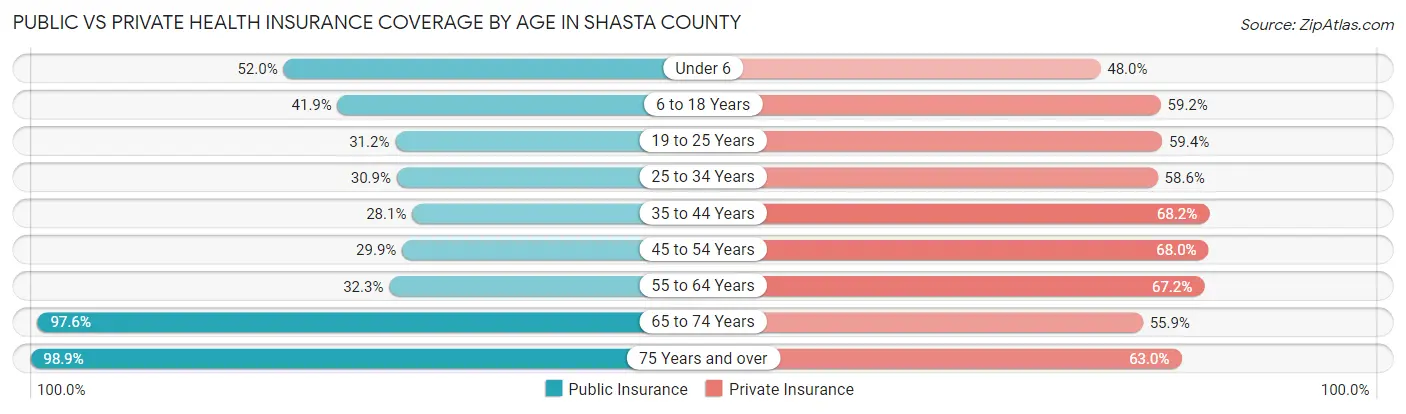
| Age Bracket | Public Insurance | Private Insurance |
| Under 6 | 6,509 (51.9%) | 6,012 (48.0%) |
| 6 to 18 Years | 12,079 (41.9%) | 17,062 (59.2%) |
| 19 to 25 Years | 4,263 (31.2%) | 8,121 (59.4%) |
| 25 to 34 Years | 6,324 (30.9%) | 11,990 (58.6%) |
| 35 to 44 Years | 6,029 (28.1%) | 14,650 (68.2%) |
| 45 to 54 Years | 6,042 (29.9%) | 13,737 (68.0%) |
| 55 to 64 Years | 8,255 (32.3%) | 17,169 (67.2%) |
| 65 to 74 Years | 21,901 (97.6%) | 12,532 (55.8%) |
| 75 Years and over | 14,968 (98.9%) | 9,532 (63.0%) |
| Total | 86,370 (47.9%) | 110,805 (61.5%) |
Disability Status by Sex by Age in Shasta County
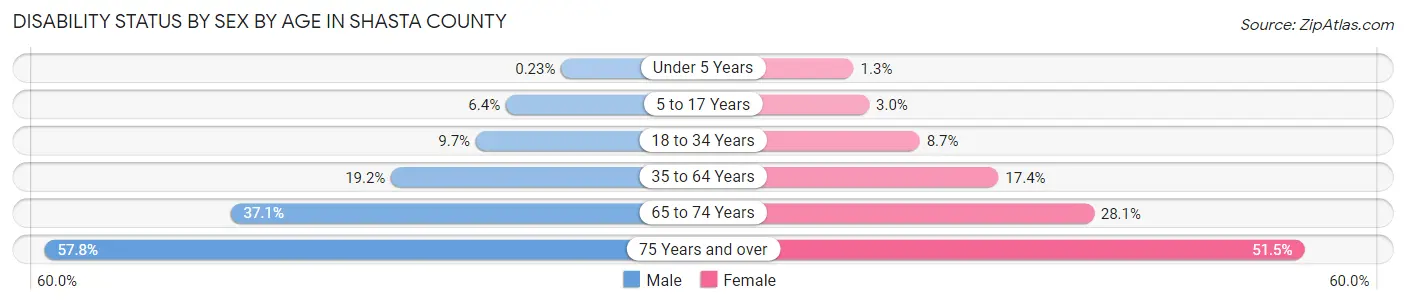
| Age Bracket | Male | Female |
| Under 5 Years | 12 (0.2%) | 65 (1.3%) |
| 5 to 17 Years | 947 (6.4%) | 431 (3.0%) |
| 18 to 34 Years | 1,810 (9.7%) | 1,544 (8.7%) |
| 35 to 64 Years | 6,330 (19.2%) | 5,963 (17.4%) |
| 65 to 74 Years | 3,966 (37.1%) | 3,293 (28.1%) |
| 75 Years and over | 3,787 (57.8%) | 4,416 (51.5%) |
Disability Class by Sex by Age in Shasta County
Disability Class: Hearing Difficulty
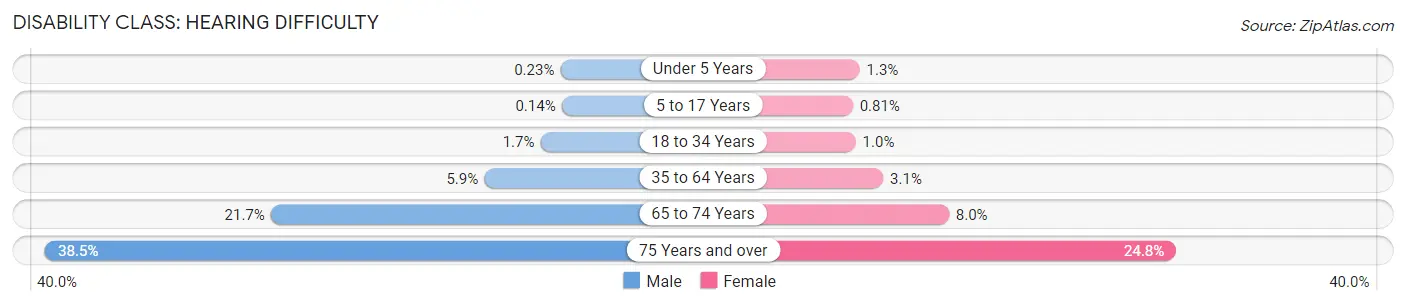
| Age Bracket | Male | Female |
| Under 5 Years | 12 (0.2%) | 65 (1.3%) |
| 5 to 17 Years | 21 (0.1%) | 115 (0.8%) |
| 18 to 34 Years | 317 (1.7%) | 183 (1.0%) |
| 35 to 64 Years | 1,944 (5.9%) | 1,051 (3.1%) |
| 65 to 74 Years | 2,326 (21.7%) | 933 (8.0%) |
| 75 Years and over | 2,523 (38.5%) | 2,128 (24.8%) |
Disability Class: Vision Difficulty
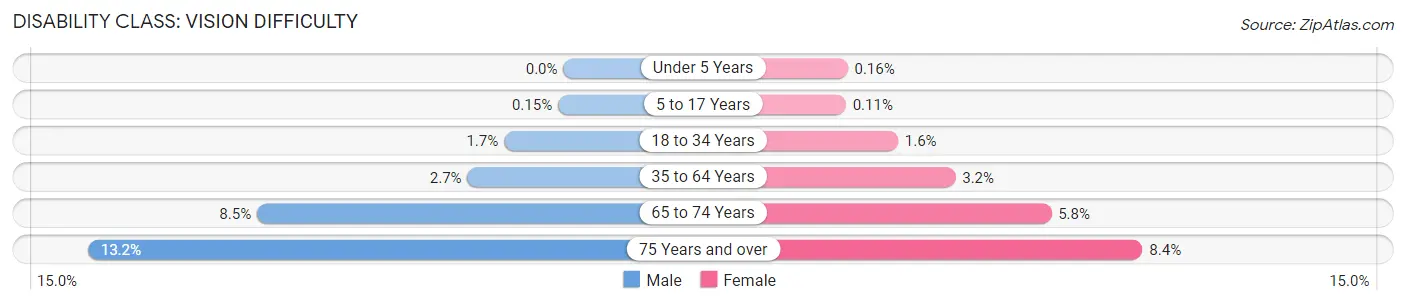
| Age Bracket | Male | Female |
| Under 5 Years | 0 (0.0%) | 8 (0.2%) |
| 5 to 17 Years | 22 (0.2%) | 16 (0.1%) |
| 18 to 34 Years | 307 (1.7%) | 277 (1.6%) |
| 35 to 64 Years | 881 (2.7%) | 1,080 (3.2%) |
| 65 to 74 Years | 913 (8.5%) | 684 (5.8%) |
| 75 Years and over | 868 (13.2%) | 718 (8.4%) |
Disability Class: Cognitive Difficulty
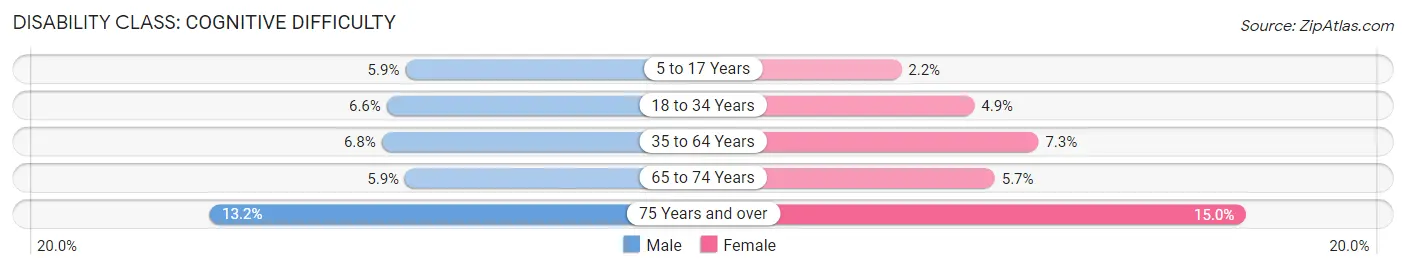
| Age Bracket | Male | Female |
| 5 to 17 Years | 871 (5.9%) | 314 (2.2%) |
| 18 to 34 Years | 1,219 (6.6%) | 875 (4.9%) |
| 35 to 64 Years | 2,228 (6.8%) | 2,498 (7.3%) |
| 65 to 74 Years | 629 (5.9%) | 667 (5.7%) |
| 75 Years and over | 862 (13.2%) | 1,287 (15.0%) |
Disability Class: Ambulatory Difficulty
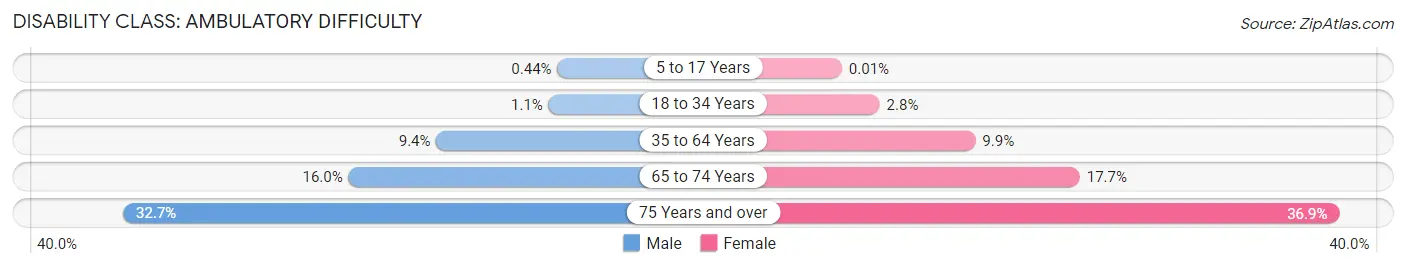
| Age Bracket | Male | Female |
| 5 to 17 Years | 65 (0.4%) | 2 (0.0%) |
| 18 to 34 Years | 203 (1.1%) | 499 (2.8%) |
| 35 to 64 Years | 3,114 (9.4%) | 3,394 (9.9%) |
| 65 to 74 Years | 1,707 (16.0%) | 2,074 (17.7%) |
| 75 Years and over | 2,144 (32.7%) | 3,167 (36.9%) |
Disability Class: Self-Care Difficulty
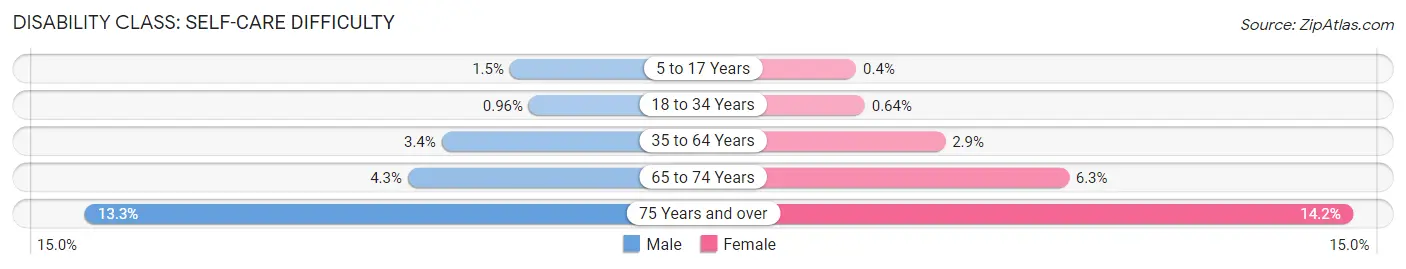
| Age Bracket | Male | Female |
| 5 to 17 Years | 221 (1.5%) | 57 (0.4%) |
| 18 to 34 Years | 179 (1.0%) | 113 (0.6%) |
| 35 to 64 Years | 1,118 (3.4%) | 984 (2.9%) |
| 65 to 74 Years | 463 (4.3%) | 742 (6.3%) |
| 75 Years and over | 873 (13.3%) | 1,219 (14.2%) |
Technology Access in Shasta County
Computing Device Access in Shasta County
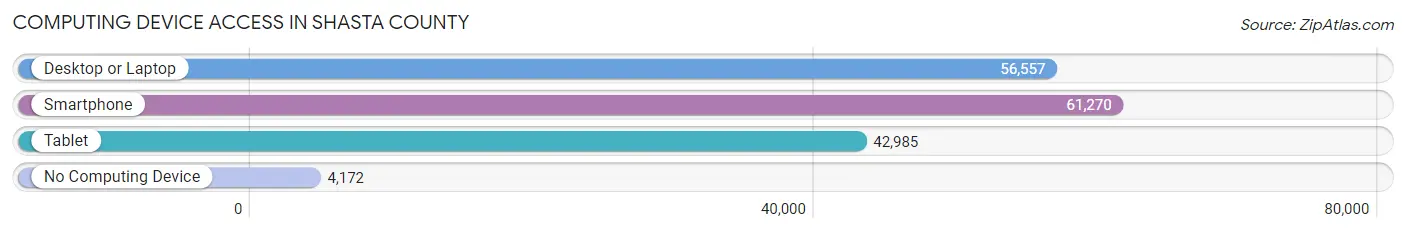
| Device Type | # Households | % Households |
| Desktop or Laptop | 56,557 | 79.5% |
| Smartphone | 61,270 | 86.2% |
| Tablet | 42,985 | 60.5% |
| No Computing Device | 4,172 | 5.9% |
| Total | 71,107 | 100.0% |
Internet Access in Shasta County
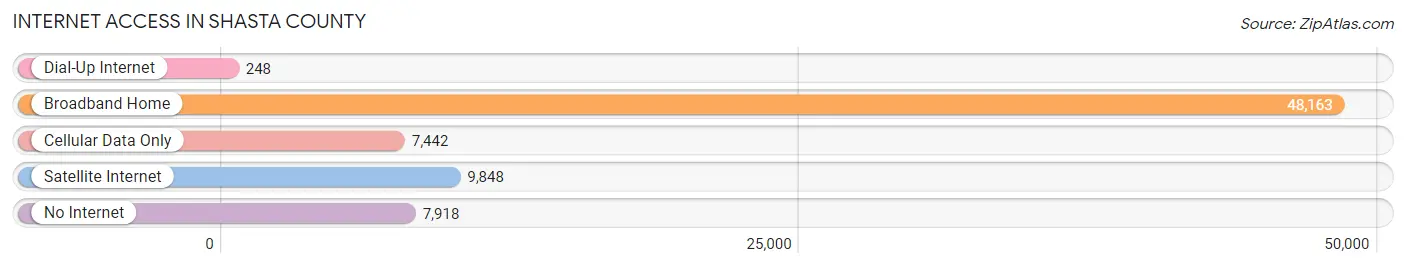
| Internet Type | # Households | % Households |
| Dial-Up Internet | 248 | 0.4% |
| Broadband Home | 48,163 | 67.7% |
| Cellular Data Only | 7,442 | 10.5% |
| Satellite Internet | 9,848 | 13.9% |
| No Internet | 7,918 | 11.1% |
| Total | 71,107 | 100.0% |
Shasta County Summary
Shasta County is located in the northern part of California, and is bordered by Siskiyou, Tehama, Trinity, and Butte counties. It is the fifth largest county in the state, with an area of 3,847 square miles. The county seat is Redding, and the largest city is Redding. The population of Shasta County was 177,223 in 2019.
History
The area that is now Shasta County was originally inhabited by the Wintu and Achomawi Native American tribes. The first Europeans to explore the area were Spanish explorers in the late 1700s. In 1848, the area became part of the United States with the signing of the Treaty of Guadalupe Hidalgo.
In 1850, Shasta County was established as one of the original counties of California. The county was named after Mount Shasta, a prominent mountain in the area. The county seat was initially located in Shasta, but was moved to Redding in 1874.
Geography
Shasta County is located in the northern part of California, and is bordered by Siskiyou, Tehama, Trinity, and Butte counties. It is the fifth largest county in the state, with an area of 3,847 square miles. The county is divided into two distinct regions: the Cascade Range and the Sacramento Valley. The Cascade Range is located in the northern part of the county and is home to Mount Shasta, the second highest peak in the state. The Sacramento Valley is located in the southern part of the county and is home to the Sacramento River.
The climate of Shasta County is generally mild, with hot summers and cool winters. The average annual temperature is around 55 degrees Fahrenheit. The county receives an average of 20 inches of precipitation per year.
Economy
The economy of Shasta County is largely based on agriculture, forestry, and tourism. The county is home to a number of agricultural products, including cattle, sheep, hay, and grains. The forestry industry is also important to the county, with timber being harvested from the forests of the Cascade Range.
Tourism is also an important part of the economy, with visitors coming to the area to enjoy the natural beauty of the mountains and rivers. The county is home to a number of popular attractions, including Shasta Lake, Lassen Volcanic National Park, and the Sundial Bridge.
Demographics
As of 2019, the population of Shasta County was 177,223. The population is predominantly white (83.3%), with smaller percentages of Hispanic (7.7%), Asian (3.2%), and African American (2.2%) residents. The median household income in the county is $50,845, and the median home value is $239,400. The unemployment rate is 4.2%.
Shasta County is home to a number of higher education institutions, including Simpson University, Shasta College, and the University of California, Davis. The county is also home to a number of hospitals, including Mercy Medical Center, Shasta Regional Medical Center, and Redding Medical Center.
Common Questions
What is the Total Population of Shasta County?
Total Population of Shasta County is 181,852.
What is the Total Male Population of Shasta County?
Total Male Population of Shasta County is 89,879.
What is the Total Female Population of Shasta County?
Total Female Population of Shasta County is 91,973.
What is the Ratio of Males per 100 Females in Shasta County?
There are 97.72 Males per 100 Females in Shasta County.
What is the Ratio of Females per 100 Males in Shasta County?
There are 102.33 Females per 100 Males in Shasta County.
What is the Median Population Age in Shasta County?
Median Population Age in Shasta County is 41.7 Years.
What is the Average Family Size in Shasta County
Average Family Size in Shasta County is 3.0 People.
What is the Average Household Size in Shasta County
Average Household Size in Shasta County is 2.5 People.
What is Per Capita Income in Shasta County?
Per Capita income in Shasta County is $36,458.
What is the Median Family Income in Shasta County?
Median Family Income in Shasta County is $85,284.
What is the Median Household income in Shasta County?
Median Household Income in Shasta County is $68,347.
What is Income or Wage Gap in Shasta County?
Income or Wage Gap in Shasta County is 30.2%.
Women in Shasta County earn 69.8 cents for every dollar earned by a man.
What is Family Income Deficit in Shasta County?
Family Income Deficit in Shasta County is $10,494.
Families that are below poverty line in Shasta County earn $10,494 less on average than the poverty threshold level.
What is Inequality or Gini Index in Shasta County?
Inequality or Gini Index in Shasta County is 0.46.
How Large is the Labor Force in Shasta County?
There are 81,695 People in the Labor Forcein in Shasta County.
What is the Percentage of People in the Labor Force in Shasta County?
55.6% of People are in the Labor Force in Shasta County.
What is the Unemployment Rate in Shasta County?
Unemployment Rate in Shasta County is 6.6%.