Marin County, CA
Marin County Map
Marin County Overview
260,485
TOTAL POPULATION
127,983
MALE POPULATION
132,502
FEMALE POPULATION
96.59
MALES / 100 FEMALES
103.53
FEMALES / 100 MALES
47.4
MEDIAN AGE
3.0
AVG FAMILY SIZE
2.5
AVG HOUSEHOLD SIZE
$87,300
PER CAPITA INCOME
$185,883
AVG FAMILY INCOME
$142,019
AVG HOUSEHOLD INCOME
33.4%
WAGE / INCOME GAP [ % ]
66.6¢/ $1
WAGE / INCOME GAP [ $ ]
$11,561
FAMILY INCOME DEFICIT
0.52
INEQUALITY / GINI INDEX
137,061
LABOR FORCE [ PEOPLE ]
63.3%
PERCENT IN LABOR FORCE
5.8%
UNEMPLOYMENT RATE
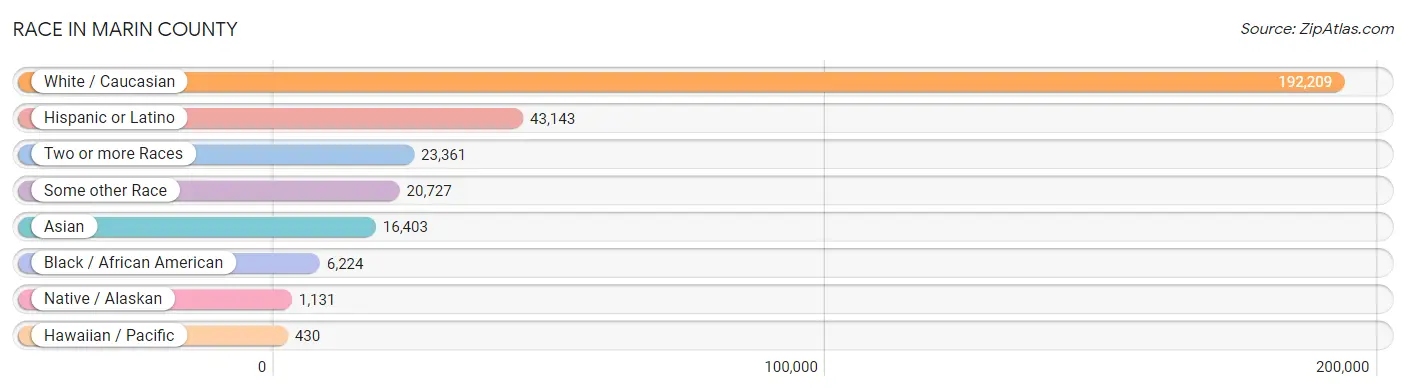
Race in Marin County
The most populous races in Marin County are White / Caucasian (192,209 | 73.8%), Hispanic or Latino (43,143 | 16.6%), and Two or more Races (23,361 | 9.0%).
| Race | # Population | % Population |
| Asian | 16,403 | 6.3% |
| Black / African American | 6,224 | 2.4% |
| Hawaiian / Pacific | 430 | 0.2% |
| Hispanic or Latino | 43,143 | 16.6% |
| Native / Alaskan | 1,131 | 0.4% |
| White / Caucasian | 192,209 | 73.8% |
| Two or more Races | 23,361 | 9.0% |
| Some other Race | 20,727 | 8.0% |
| Total | 260,485 | 100.0% |
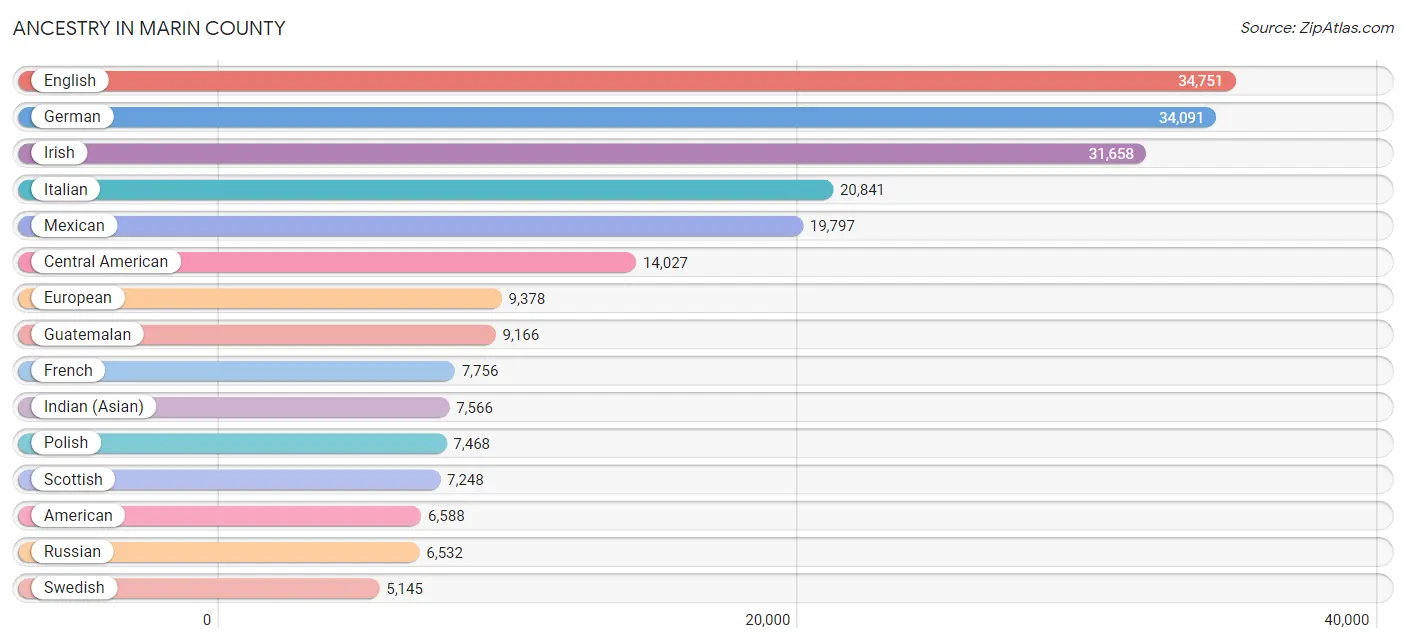
Ancestry in Marin County
The most populous ancestries reported in Marin County are English (34,751 | 13.3%), German (34,091 | 13.1%), Irish (31,658 | 12.1%), Italian (20,841 | 8.0%), and Mexican (19,797 | 7.6%), together accounting for 54.2% of all Marin County residents.
| Ancestry | # Population | % Population |
| Afghan | 20 | 0.0% |
| African | 599 | 0.2% |
| Alaska Native | 4 | 0.0% |
| Albanian | 89 | 0.0% |
| Alsatian | 48 | 0.0% |
| American | 6,588 | 2.5% |
| Apache | 182 | 0.1% |
| Arab | 2,338 | 0.9% |
| Argentinean | 338 | 0.1% |
| Armenian | 403 | 0.2% |
| Assyrian / Chaldean / Syriac | 112 | 0.0% |
| Australian | 468 | 0.2% |
| Austrian | 1,554 | 0.6% |
| Bangladeshi | 11 | 0.0% |
| Basque | 244 | 0.1% |
| Belgian | 486 | 0.2% |
| Belizean | 50 | 0.0% |
| Bermudan | 35 | 0.0% |
| Bhutanese | 3,766 | 1.5% |
| Blackfeet | 211 | 0.1% |
| Bolivian | 118 | 0.1% |
| Brazilian | 1,280 | 0.5% |
| British | 3,807 | 1.5% |
| Bulgarian | 167 | 0.1% |
| Burmese | 2,043 | 0.8% |
| Cambodian | 72 | 0.0% |
| Canadian | 1,117 | 0.4% |
| Celtic | 71 | 0.0% |
| Central American | 14,027 | 5.4% |
| Central American Indian | 459 | 0.2% |
| Cherokee | 789 | 0.3% |
| Cheyenne | 15 | 0.0% |
| Chickasaw | 9 | 0.0% |
| Chilean | 318 | 0.1% |
| Chinese | 99 | 0.0% |
| Chippewa | 152 | 0.1% |
| Choctaw | 62 | 0.0% |
| Colombian | 452 | 0.2% |
| Comanche | 55 | 0.0% |
| Costa Rican | 225 | 0.1% |
| Cree | 15 | 0.0% |
| Creek | 5 | 0.0% |
| Croatian | 902 | 0.4% |
| Cuban | 417 | 0.2% |
| Czech | 1,167 | 0.4% |
| Czechoslovakian | 353 | 0.1% |
| Danish | 2,158 | 0.8% |
| Delaware | 36 | 0.0% |
| Dominican | 320 | 0.1% |
| Dutch | 3,204 | 1.2% |
| Eastern European | 2,690 | 1.0% |
| Ecuadorian | 581 | 0.2% |
| Egyptian | 351 | 0.1% |
| English | 34,751 | 13.3% |
| Estonian | 74 | 0.0% |
| Ethiopian | 44 | 0.0% |
| European | 9,378 | 3.6% |
| Fijian | 14 | 0.0% |
| Filipino | 236 | 0.1% |
| Finnish | 768 | 0.3% |
| French | 7,756 | 3.0% |
| French American Indian | 7 | 0.0% |
| French Canadian | 1,266 | 0.5% |
| German | 34,091 | 13.1% |
| Ghanaian | 11 | 0.0% |
| Greek | 2,151 | 0.8% |
| Guamanian / Chamorro | 207 | 0.1% |
| Guatemalan | 9,166 | 3.5% |
| Guyanese | 27 | 0.0% |
| Haitian | 39 | 0.0% |
| Honduran | 222 | 0.1% |
| Hungarian | 1,401 | 0.5% |
| Icelander | 41 | 0.0% |
| Indian (Asian) | 7,566 | 2.9% |
| Indonesian | 51 | 0.0% |
| Inupiat | 9 | 0.0% |
| Iranian | 1,667 | 0.6% |
| Iraqi | 27 | 0.0% |
| Irish | 31,658 | 12.1% |
| Iroquois | 36 | 0.0% |
| Israeli | 78 | 0.0% |
| Italian | 20,841 | 8.0% |
| Jamaican | 196 | 0.1% |
| Japanese | 488 | 0.2% |
| Jordanian | 135 | 0.1% |
| Kenyan | 136 | 0.1% |
| Korean | 3,784 | 1.5% |
| Laotian | 76 | 0.0% |
| Latvian | 192 | 0.1% |
| Lebanese | 810 | 0.3% |
| Lithuanian | 1,520 | 0.6% |
| Luxembourger | 49 | 0.0% |
| Macedonian | 42 | 0.0% |
| Malaysian | 43 | 0.0% |
| Maltese | 119 | 0.1% |
| Mexican | 19,797 | 7.6% |
| Mexican American Indian | 513 | 0.2% |
| Mongolian | 57 | 0.0% |
| Moroccan | 25 | 0.0% |
| Native Hawaiian | 532 | 0.2% |
| Navajo | 125 | 0.1% |
| New Zealander | 14 | 0.0% |
| Nicaraguan | 1,276 | 0.5% |
| Nigerian | 812 | 0.3% |
| Northern European | 2,815 | 1.1% |
| Norwegian | 4,316 | 1.7% |
| Okinawan | 10 | 0.0% |
| Osage | 29 | 0.0% |
| Paiute | 8 | 0.0% |
| Pakistani | 688 | 0.3% |
| Palestinian | 210 | 0.1% |
| Panamanian | 123 | 0.1% |
| Pennsylvania German | 42 | 0.0% |
| Peruvian | 1,417 | 0.5% |
| Polish | 7,468 | 2.9% |
| Portuguese | 2,212 | 0.9% |
| Potawatomi | 157 | 0.1% |
| Pueblo | 23 | 0.0% |
| Puerto Rican | 936 | 0.4% |
| Puget Sound Salish | 6 | 0.0% |
| Romanian | 510 | 0.2% |
| Russian | 6,532 | 2.5% |
| Salvadoran | 3,005 | 1.1% |
| Samoan | 27 | 0.0% |
| Scandinavian | 881 | 0.3% |
| Scotch-Irish | 2,662 | 1.0% |
| Scottish | 7,248 | 2.8% |
| Senegalese | 10 | 0.0% |
| Serbian | 167 | 0.1% |
| Sioux | 22 | 0.0% |
| Slavic | 74 | 0.0% |
| Slovak | 299 | 0.1% |
| Slovene | 221 | 0.1% |
| South African | 364 | 0.1% |
| South American | 3,331 | 1.3% |
| South American Indian | 44 | 0.0% |
| Soviet Union | 26 | 0.0% |
| Spaniard | 1,267 | 0.5% |
| Spanish | 785 | 0.3% |
| Spanish American | 11 | 0.0% |
| Sri Lankan | 1,873 | 0.7% |
| Subsaharan African | 2,018 | 0.8% |
| Sudanese | 2 | 0.0% |
| Swedish | 5,145 | 2.0% |
| Swiss | 1,912 | 0.7% |
| Syrian | 261 | 0.1% |
| Thai | 2,936 | 1.1% |
| Tlingit-Haida | 15 | 0.0% |
| Tohono O'Odham | 8 | 0.0% |
| Tongan | 10 | 0.0% |
| Trinidadian and Tobagonian | 54 | 0.0% |
| Turkish | 351 | 0.1% |
| Ugandan | 40 | 0.0% |
| Ukrainian | 2,006 | 0.8% |
| Uruguayan | 15 | 0.0% |
| Venezuelan | 79 | 0.0% |
| Welsh | 1,687 | 0.6% |
| West Indian | 28 | 0.0% |
| Yaqui | 13 | 0.0% |
| Yugoslavian | 98 | 0.0% |
| Yuman | 1 | 0.0% | View All 161 Rows |
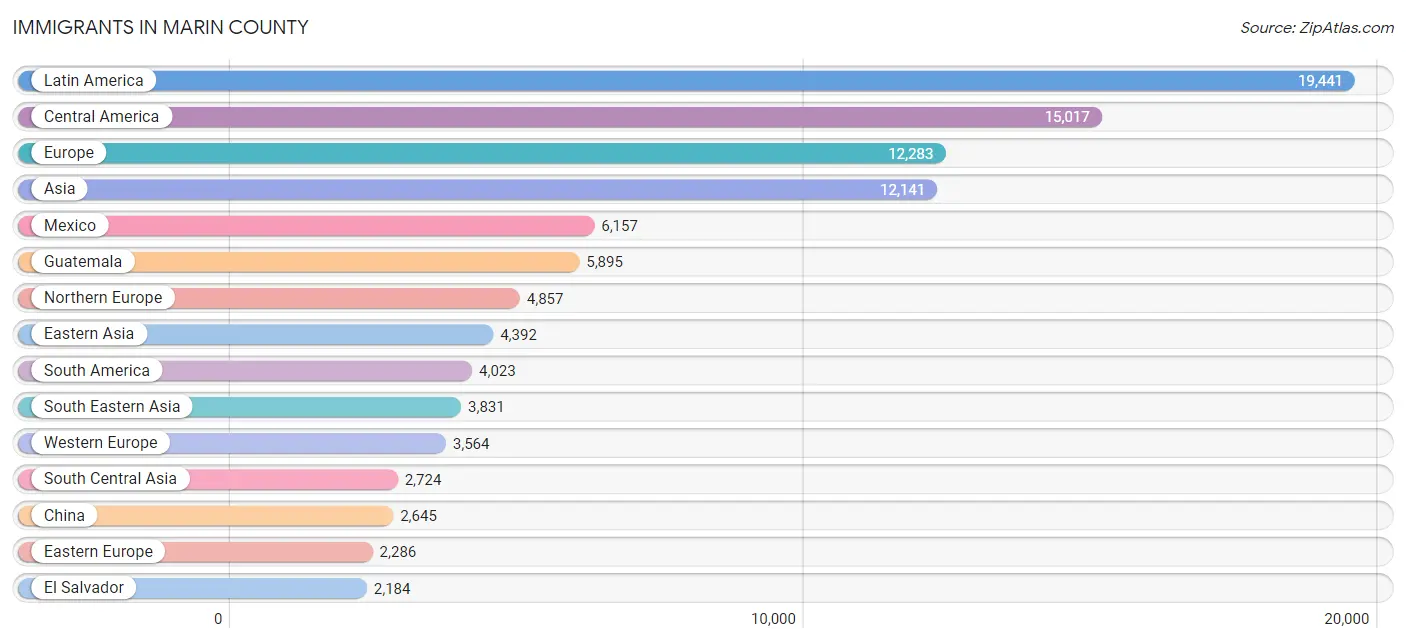
Immigrants in Marin County
The most numerous immigrant groups reported in Marin County came from Latin America (19,441 | 7.5%), Central America (15,017 | 5.8%), Europe (12,283 | 4.7%), Asia (12,141 | 4.7%), and Mexico (6,157 | 2.4%), together accounting for 25.0% of all Marin County residents.
| Immigration Origin | # Population | % Population |
| Africa | 1,587 | 0.6% |
| Argentina | 447 | 0.2% |
| Armenia | 23 | 0.0% |
| Asia | 12,141 | 4.7% |
| Australia | 306 | 0.1% |
| Austria | 210 | 0.1% |
| Azores | 217 | 0.1% |
| Bangladesh | 15 | 0.0% |
| Belarus | 48 | 0.0% |
| Belgium | 103 | 0.0% |
| Belize | 36 | 0.0% |
| Bolivia | 87 | 0.0% |
| Bosnia and Herzegovina | 27 | 0.0% |
| Brazil | 1,642 | 0.6% |
| Bulgaria | 93 | 0.0% |
| Cambodia | 169 | 0.1% |
| Cameroon | 28 | 0.0% |
| Canada | 2,142 | 0.8% |
| Caribbean | 401 | 0.2% |
| Central America | 15,017 | 5.8% |
| Chile | 160 | 0.1% |
| China | 2,645 | 1.0% |
| Colombia | 239 | 0.1% |
| Costa Rica | 17 | 0.0% |
| Croatia | 25 | 0.0% |
| Cuba | 170 | 0.1% |
| Czechoslovakia | 60 | 0.0% |
| Denmark | 104 | 0.0% |
| Dominican Republic | 101 | 0.0% |
| Eastern Africa | 208 | 0.1% |
| Eastern Asia | 4,392 | 1.7% |
| Eastern Europe | 2,286 | 0.9% |
| Ecuador | 67 | 0.0% |
| Egypt | 187 | 0.1% |
| El Salvador | 2,184 | 0.8% |
| England | 1,497 | 0.6% |
| Ethiopia | 11 | 0.0% |
| Europe | 12,283 | 4.7% |
| Fiji | 261 | 0.1% |
| France | 1,032 | 0.4% |
| Germany | 1,519 | 0.6% |
| Greece | 153 | 0.1% |
| Guatemala | 5,895 | 2.3% |
| Guyana | 27 | 0.0% |
| Haiti | 57 | 0.0% |
| Honduras | 159 | 0.1% |
| Hong Kong | 375 | 0.1% |
| Hungary | 92 | 0.0% |
| India | 1,289 | 0.5% |
| Indonesia | 50 | 0.0% |
| Iran | 1,108 | 0.4% |
| Iraq | 36 | 0.0% |
| Ireland | 669 | 0.3% |
| Israel | 284 | 0.1% |
| Italy | 672 | 0.3% |
| Jamaica | 48 | 0.0% |
| Japan | 676 | 0.3% |
| Jordan | 69 | 0.0% |
| Kazakhstan | 11 | 0.0% |
| Kenya | 130 | 0.1% |
| Korea | 999 | 0.4% |
| Kuwait | 53 | 0.0% |
| Laos | 3 | 0.0% |
| Latin America | 19,441 | 7.5% |
| Latvia | 29 | 0.0% |
| Lebanon | 278 | 0.1% |
| Liberia | 117 | 0.0% |
| Malaysia | 154 | 0.1% |
| Mexico | 6,157 | 2.4% |
| Middle Africa | 49 | 0.0% |
| Moldova | 10 | 0.0% |
| Morocco | 23 | 0.0% |
| Netherlands | 466 | 0.2% |
| Nicaragua | 549 | 0.2% |
| Nigeria | 107 | 0.0% |
| North Macedonia | 15 | 0.0% |
| Northern Africa | 386 | 0.2% |
| Northern Europe | 4,857 | 1.9% |
| Norway | 72 | 0.0% |
| Oceania | 801 | 0.3% |
| Pakistan | 140 | 0.1% |
| Panama | 20 | 0.0% |
| Peru | 1,088 | 0.4% |
| Philippines | 1,563 | 0.6% |
| Poland | 283 | 0.1% |
| Portugal | 294 | 0.1% |
| Romania | 173 | 0.1% |
| Russia | 574 | 0.2% |
| Scotland | 240 | 0.1% |
| Serbia | 95 | 0.0% |
| Sierra Leone | 30 | 0.0% |
| Singapore | 58 | 0.0% |
| South Africa | 663 | 0.3% |
| South America | 4,023 | 1.5% |
| South Central Asia | 2,724 | 1.1% |
| South Eastern Asia | 3,831 | 1.5% |
| Southern Europe | 1,576 | 0.6% |
| Spain | 457 | 0.2% |
| Sri Lanka | 151 | 0.1% |
| Sudan | 24 | 0.0% |
| Sweden | 267 | 0.1% |
| Switzerland | 234 | 0.1% |
| Syria | 64 | 0.0% |
| Taiwan | 201 | 0.1% |
| Thailand | 467 | 0.2% |
| Trinidad and Tobago | 25 | 0.0% |
| Turkey | 221 | 0.1% |
| Uganda | 31 | 0.0% |
| Ukraine | 520 | 0.2% |
| Uruguay | 70 | 0.0% |
| Uzbekistan | 10 | 0.0% |
| Venezuela | 111 | 0.0% |
| Vietnam | 1,341 | 0.5% |
| Western Africa | 254 | 0.1% |
| Western Asia | 1,194 | 0.5% |
| Western Europe | 3,564 | 1.4% |
| Zaire | 15 | 0.0% | View All 117 Rows |
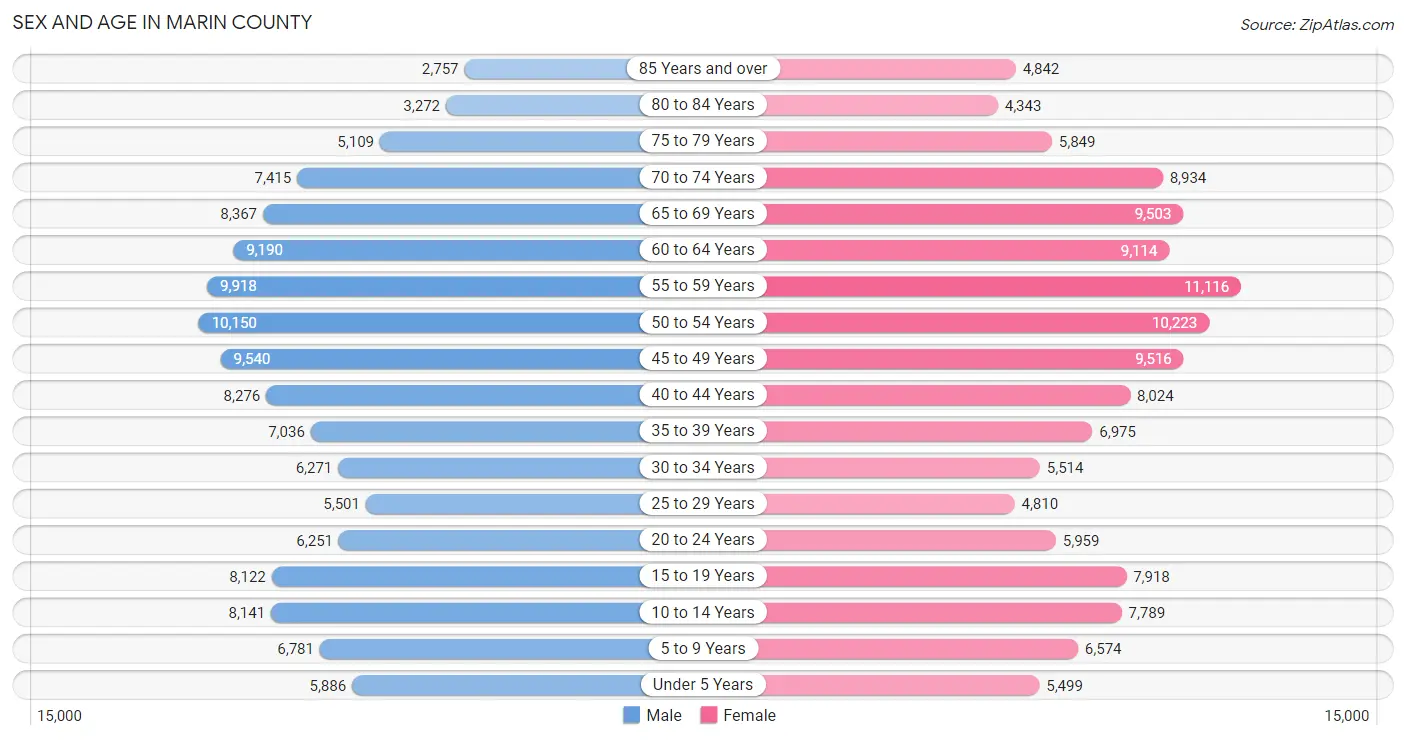
Sex and Age in Marin County
Sex and Age in Marin County
The most populous age groups in Marin County are 50 to 54 Years (10,150 | 7.9%) for men and 55 to 59 Years (11,116 | 8.4%) for women.
| Age Bracket | Male | Female |
| Under 5 Years | 5,886 (4.6%) | 5,499 (4.2%) |
| 5 to 9 Years | 6,781 (5.3%) | 6,574 (5.0%) |
| 10 to 14 Years | 8,141 (6.4%) | 7,789 (5.9%) |
| 15 to 19 Years | 8,122 (6.4%) | 7,918 (6.0%) |
| 20 to 24 Years | 6,251 (4.9%) | 5,959 (4.5%) |
| 25 to 29 Years | 5,501 (4.3%) | 4,810 (3.6%) |
| 30 to 34 Years | 6,271 (4.9%) | 5,514 (4.2%) |
| 35 to 39 Years | 7,036 (5.5%) | 6,975 (5.3%) |
| 40 to 44 Years | 8,276 (6.5%) | 8,024 (6.1%) |
| 45 to 49 Years | 9,540 (7.4%) | 9,516 (7.2%) |
| 50 to 54 Years | 10,150 (7.9%) | 10,223 (7.7%) |
| 55 to 59 Years | 9,918 (7.7%) | 11,116 (8.4%) |
| 60 to 64 Years | 9,190 (7.2%) | 9,114 (6.9%) |
| 65 to 69 Years | 8,367 (6.5%) | 9,503 (7.2%) |
| 70 to 74 Years | 7,415 (5.8%) | 8,934 (6.7%) |
| 75 to 79 Years | 5,109 (4.0%) | 5,849 (4.4%) |
| 80 to 84 Years | 3,272 (2.6%) | 4,343 (3.3%) |
| 85 Years and over | 2,757 (2.1%) | 4,842 (3.6%) |
| Total | 127,983 (100.0%) | 132,502 (100.0%) |
Families and Households in Marin County
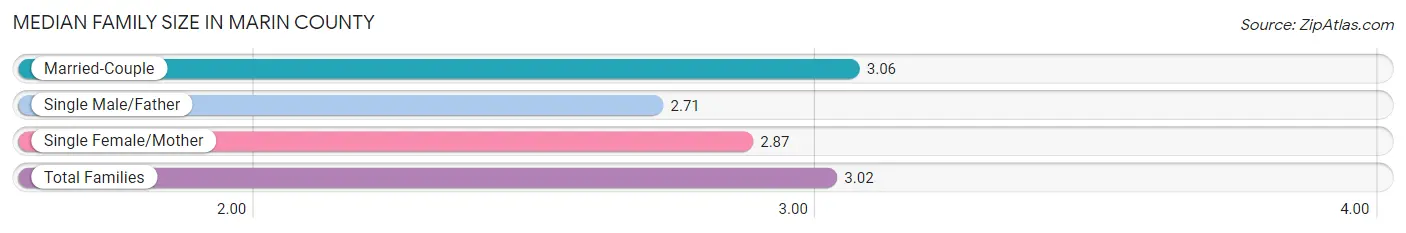
Median Family Size in Marin County
The median family size in Marin County is 3.02 persons per family, with married-couple families (53,549 | 81.3%) accounting for the largest median family size of 3.06 persons per family. On the other hand, single male/father families (3,740 | 5.7%) represent the smallest median family size with 2.71 persons per family.
| Family Type | # Families | Family Size |
| Married-Couple | 53,549 (81.3%) | 3.06 |
| Single Male/Father | 3,740 (5.7%) | 2.71 |
| Single Female/Mother | 8,554 (13.0%) | 2.87 |
| Total Families | 65,843 (100.0%) | 3.02 |
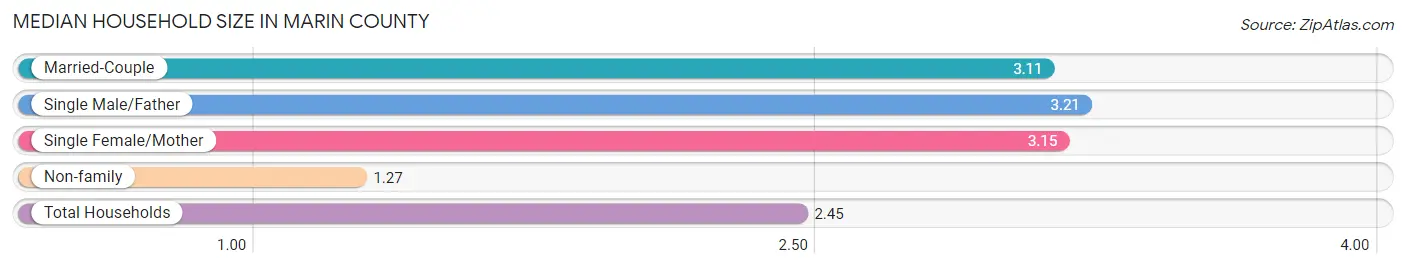
Median Household Size in Marin County
The median household size in Marin County is 2.45 persons per household, with single male/father households (3,740 | 3.6%) accounting for the largest median household size of 3.21 persons per household. non-family households (37,866 | 36.5%) represent the smallest median household size with 1.27 persons per household.
| Household Type | # Households | Household Size |
| Married-Couple | 53,549 (51.6%) | 3.11 |
| Single Male/Father | 3,740 (3.6%) | 3.21 |
| Single Female/Mother | 8,554 (8.3%) | 3.15 |
| Non-family | 37,866 (36.5%) | 1.27 |
| Total Households | 103,709 (100.0%) | 2.45 |
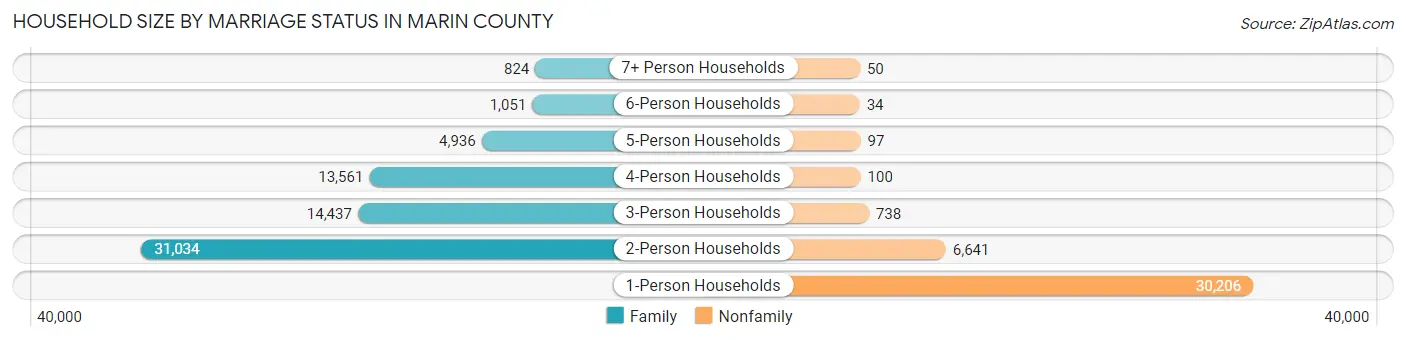
Household Size by Marriage Status in Marin County
Out of a total of 103,709 households in Marin County, 65,843 (63.5%) are family households, while 37,866 (36.5%) are nonfamily households. The most numerous type of family households are 2-person households, comprising 31,034, and the most common type of nonfamily households are 1-person households, comprising 30,206.
| Household Size | Family Households | Nonfamily Households |
| 1-Person Households | - | 30,206 (29.1%) |
| 2-Person Households | 31,034 (29.9%) | 6,641 (6.4%) |
| 3-Person Households | 14,437 (13.9%) | 738 (0.7%) |
| 4-Person Households | 13,561 (13.1%) | 100 (0.1%) |
| 5-Person Households | 4,936 (4.8%) | 97 (0.1%) |
| 6-Person Households | 1,051 (1.0%) | 34 (0.0%) |
| 7+ Person Households | 824 (0.8%) | 50 (0.1%) |
| Total | 65,843 (63.5%) | 37,866 (36.5%) |
Female Fertility in Marin County
Fertility by Age in Marin County
Average fertility rate in Marin County is 48.0 births per 1,000 women. Women in the age bracket of 20 to 34 years have the highest fertility rate with 64.0 births per 1,000 women. Women in the age bracket of 35 to 50 years acount for 57.6% of all women with births.
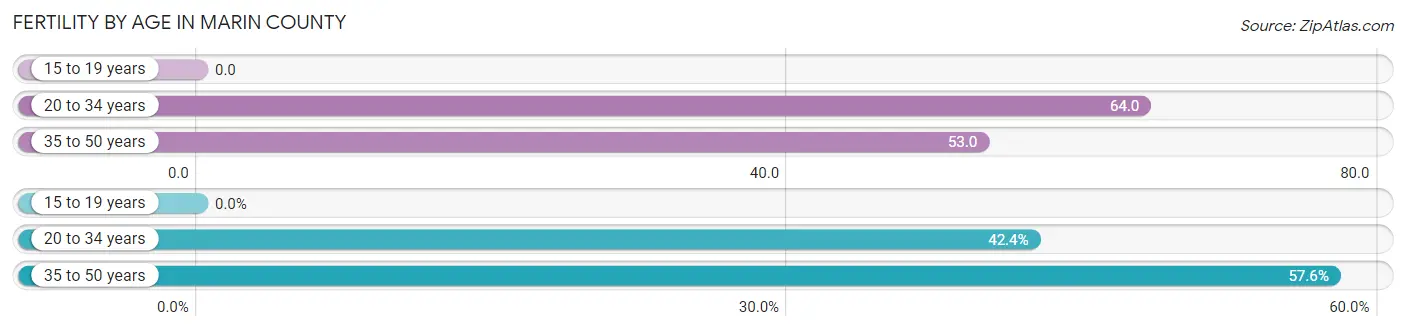
| Age Bracket | Women with Births | Births / 1,000 Women |
| 15 to 19 years | 0 (0.0%) | 0.0 |
| 20 to 34 years | 1,042 (42.4%) | 64.0 |
| 35 to 50 years | 1,418 (57.6%) | 53.0 |
| Total | 2,460 (100.0%) | 48.0 |
Fertility by Age by Marriage Status in Marin County
81.0% of women with births (2,460) in Marin County are married. The highest percentage of unmarried women with births falls into 35 to 50 years age bracket with 21.4% of them unmarried at the time of birth, while the lowest percentage of unmarried women with births belong to 20 to 34 years age bracket with 15.6% of them unmarried.
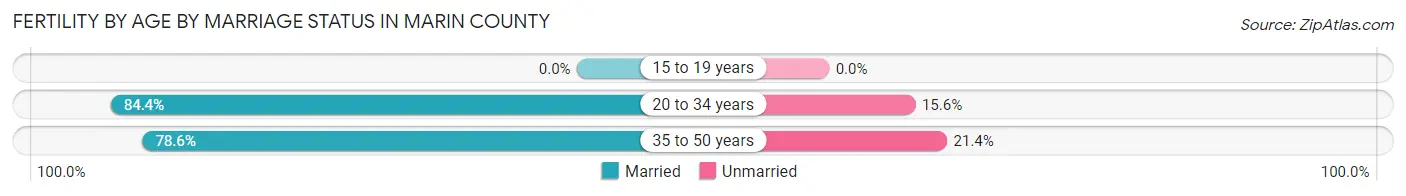
| Age Bracket | Married | Unmarried |
| 15 to 19 years | 0 (0.0%) | 0 (0.0%) |
| 20 to 34 years | 879 (84.4%) | 163 (15.6%) |
| 35 to 50 years | 1,115 (78.6%) | 303 (21.4%) |
| Total | 1,993 (81.0%) | 467 (19.0%) |
Fertility by Education in Marin County
Average fertility rate in Marin County is 48.0 births per 1,000 women. Women with the education attainment of graduate degree have the highest fertility rate of 72.0 births per 1,000 women, while women with the education attainment of less than high school have the lowest fertility at 7.0 births per 1,000 women. Women with the education attainment of bachelor's degree represent 40.5% of all women with births.
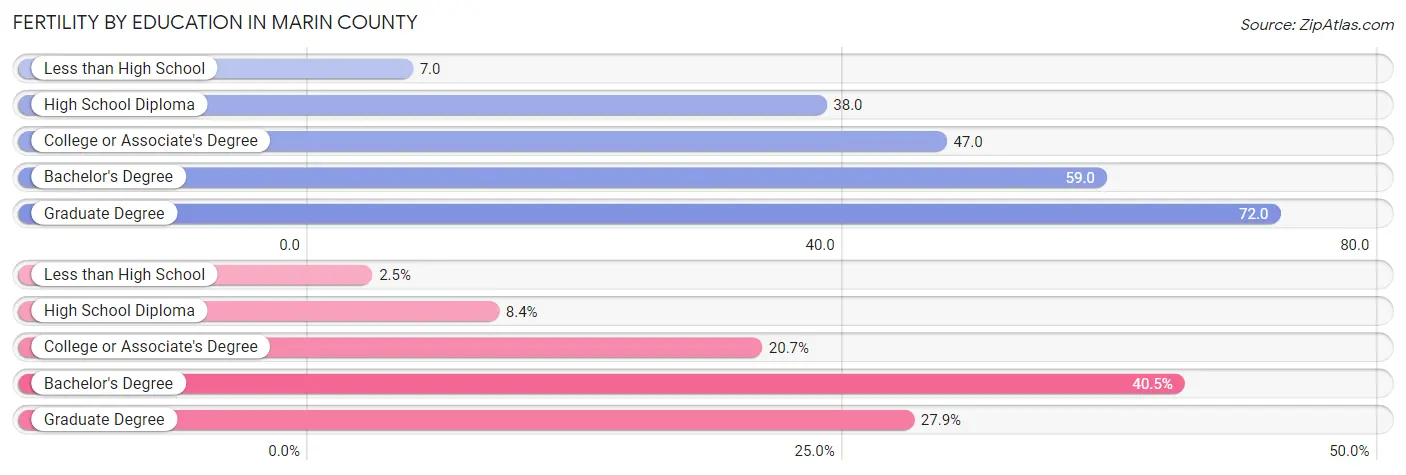
| Educational Attainment | Women with Births | Births / 1,000 Women |
| Less than High School | 61 (2.5%) | 7.0 |
| High School Diploma | 207 (8.4%) | 38.0 |
| College or Associate's Degree | 510 (20.7%) | 47.0 |
| Bachelor's Degree | 997 (40.5%) | 59.0 |
| Graduate Degree | 685 (27.9%) | 72.0 |
| Total | 2,460 (100.0%) | 48.0 |
Fertility by Education by Marriage Status in Marin County
19.0% of women with births in Marin County are unmarried. Women with the educational attainment of less than high school are most likely to be married with 98.4% of them married at childbirth, while women with the educational attainment of high school diploma are least likely to be married with 49.3% of them unmarried at childbirth.
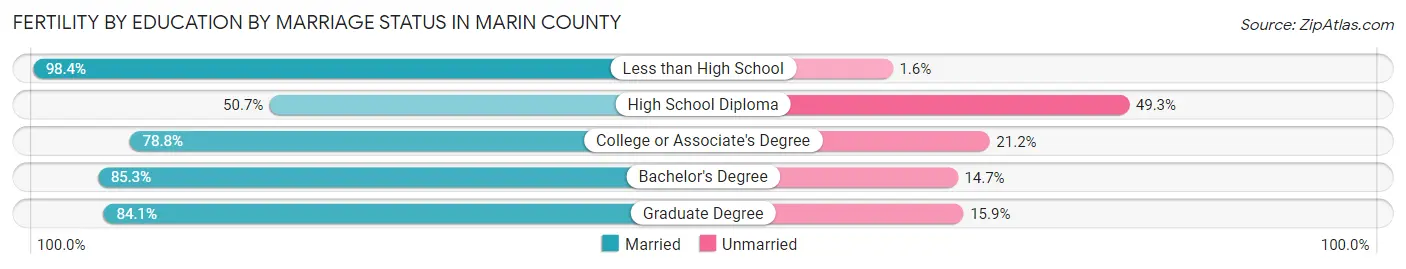
| Educational Attainment | Married | Unmarried |
| Less than High School | 60 (98.4%) | 1 (1.6%) |
| High School Diploma | 105 (50.7%) | 102 (49.3%) |
| College or Associate's Degree | 402 (78.8%) | 108 (21.2%) |
| Bachelor's Degree | 850 (85.3%) | 147 (14.7%) |
| Graduate Degree | 576 (84.1%) | 109 (15.9%) |
| Total | 1,993 (81.0%) | 467 (19.0%) |
Income in Marin County
Income Overview in Marin County
Per Capita Income in Marin County is $87,300, while median incomes of families and households are $185,883 and $142,019 respectively.
| Characteristic | Number | Measure |
| Per Capita Income | 260,485 | $87,300 |
| Median Family Income | 65,843 | $185,883 |
| Mean Family Income | 65,843 | $268,099 |
| Median Household Income | 103,709 | $142,019 |
| Mean Household Income | 103,709 | $215,832 |
| Income Deficit | 65,843 | $11,561 |
| Wage / Income Gap (%) | 260,485 | 33.36% |
| Wage / Income Gap ($) | 260,485 | 66.64¢ per $1 |
| Gini / Inequality Index | 260,485 | 0.52 |
Earnings by Sex in Marin County
Average Earnings in Marin County are $68,079, $81,474 for men and $54,296 for women, a difference of 33.4%.
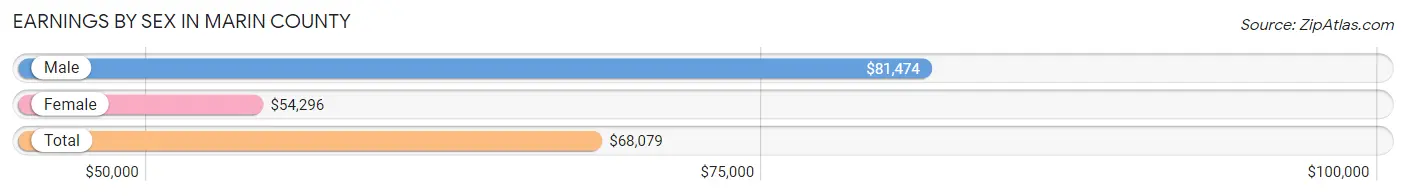
| Sex | Number | Average Earnings |
| Male | 75,959 (52.8%) | $81,474 |
| Female | 67,988 (47.2%) | $54,296 |
| Total | 143,947 (100.0%) | $68,079 |
Earnings by Sex by Income Bracket in Marin County
The most common earnings brackets in Marin County are $100,000+ for men (33,018 | 43.5%) and $100,000+ for women (20,213 | 29.7%).
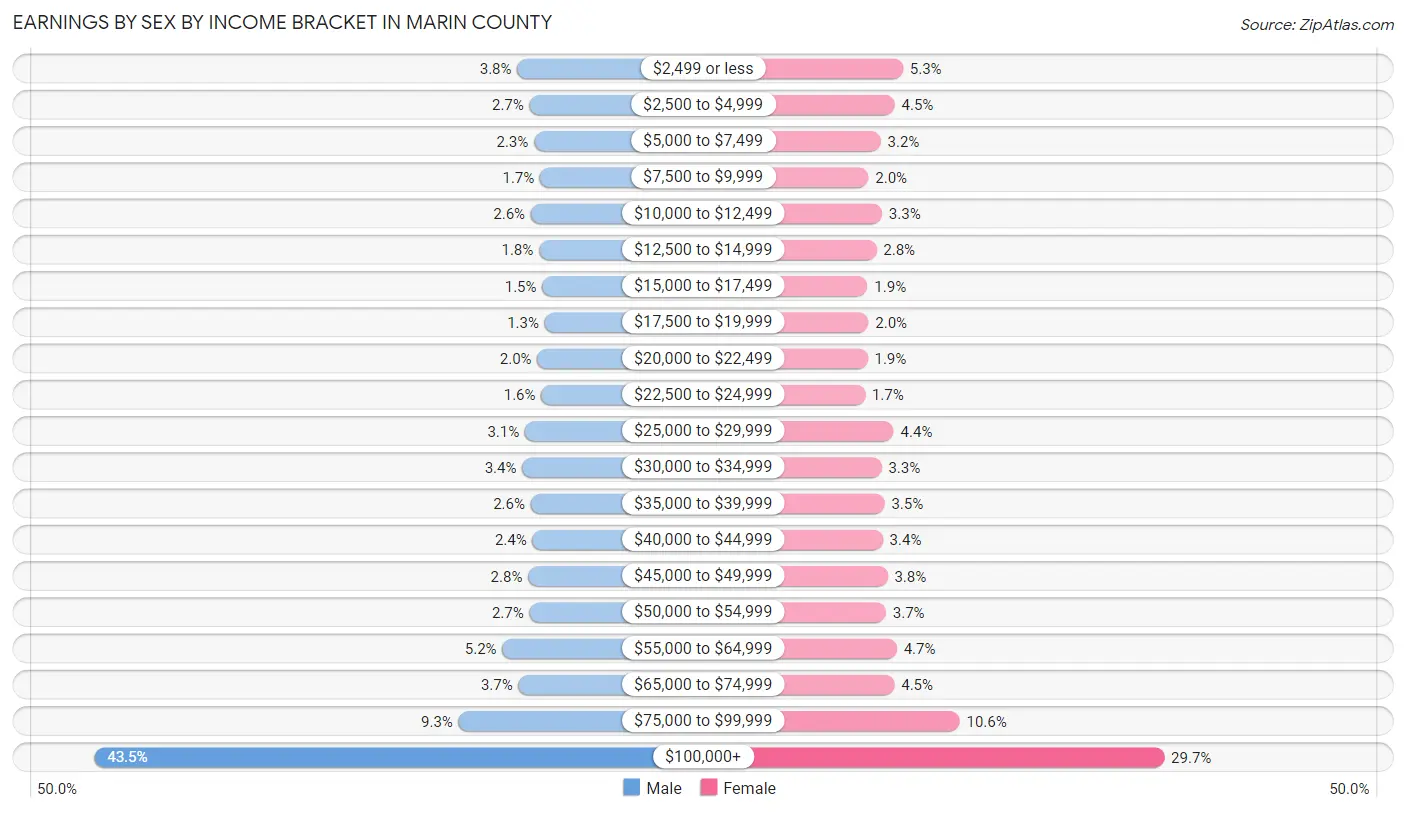
| Income | Male | Female |
| $2,499 or less | 2,919 (3.8%) | 3,572 (5.2%) |
| $2,500 to $4,999 | 2,047 (2.7%) | 3,047 (4.5%) |
| $5,000 to $7,499 | 1,726 (2.3%) | 2,154 (3.2%) |
| $7,500 to $9,999 | 1,299 (1.7%) | 1,373 (2.0%) |
| $10,000 to $12,499 | 1,952 (2.6%) | 2,239 (3.3%) |
| $12,500 to $14,999 | 1,370 (1.8%) | 1,885 (2.8%) |
| $15,000 to $17,499 | 1,136 (1.5%) | 1,314 (1.9%) |
| $17,500 to $19,999 | 961 (1.3%) | 1,376 (2.0%) |
| $20,000 to $22,499 | 1,485 (2.0%) | 1,316 (1.9%) |
| $22,500 to $24,999 | 1,208 (1.6%) | 1,154 (1.7%) |
| $25,000 to $29,999 | 2,371 (3.1%) | 2,988 (4.4%) |
| $30,000 to $34,999 | 2,568 (3.4%) | 2,212 (3.3%) |
| $35,000 to $39,999 | 1,961 (2.6%) | 2,398 (3.5%) |
| $40,000 to $44,999 | 1,835 (2.4%) | 2,287 (3.4%) |
| $45,000 to $49,999 | 2,145 (2.8%) | 2,589 (3.8%) |
| $50,000 to $54,999 | 2,053 (2.7%) | 2,487 (3.7%) |
| $55,000 to $64,999 | 3,977 (5.2%) | 3,181 (4.7%) |
| $65,000 to $74,999 | 2,836 (3.7%) | 3,025 (4.4%) |
| $75,000 to $99,999 | 7,092 (9.3%) | 7,178 (10.6%) |
| $100,000+ | 33,018 (43.5%) | 20,213 (29.7%) |
| Total | 75,959 (100.0%) | 67,988 (100.0%) |
Earnings by Sex by Educational Attainment in Marin County
Average earnings in Marin County are $94,541 for men and $65,260 for women, a difference of 31.0%. Men with an educational attainment of graduate degree enjoy the highest average annual earnings of $165,379, while those with less than high school education earn the least with $34,651. Women with an educational attainment of graduate degree earn the most with the average annual earnings of $101,287, while those with less than high school education have the smallest earnings of $23,036.
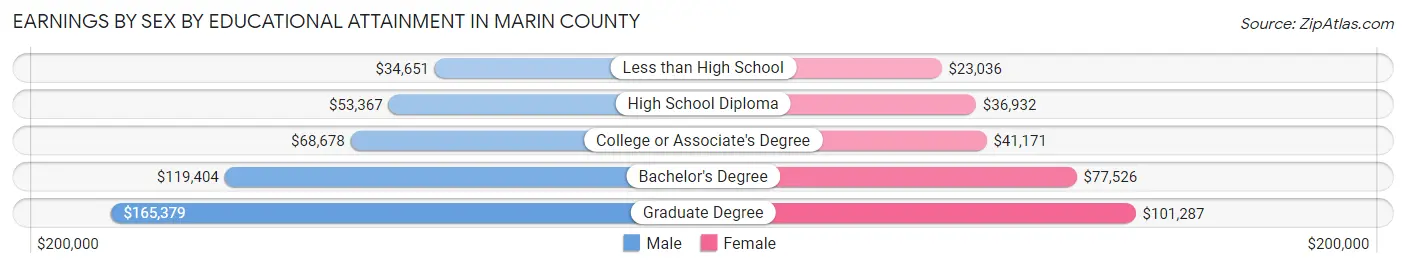
| Educational Attainment | Male Income | Female Income |
| Less than High School | $34,651 | $23,036 |
| High School Diploma | $53,367 | $36,932 |
| College or Associate's Degree | $68,678 | $41,171 |
| Bachelor's Degree | $119,404 | $77,526 |
| Graduate Degree | $165,379 | $101,287 |
| Total | $94,541 | $65,260 |
Family Income in Marin County
Family Income Brackets in Marin County
According to the Marin County family income data, there are 30,815 families falling into the $200,000+ income range, which is the most common income bracket and makes up 46.8% of all families. Conversely, the $10,000 to $14,999 income bracket is the least frequent group with only 527 families (0.8%) belonging to this category.
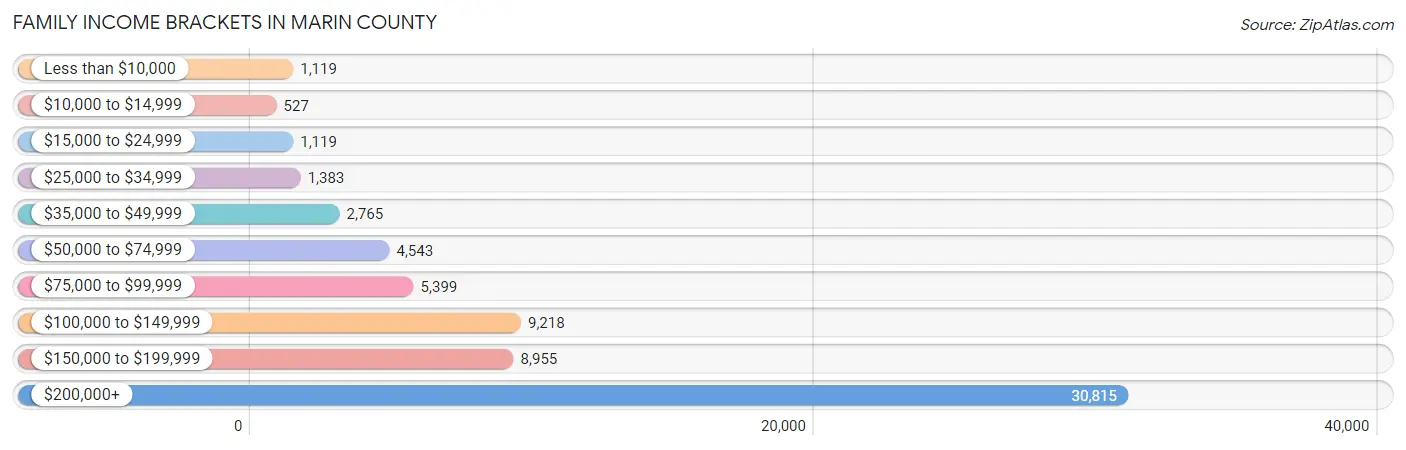
| Income Bracket | # Families | % Families |
| Less than $10,000 | 1,119 | 1.7% |
| $10,000 to $14,999 | 527 | 0.8% |
| $15,000 to $24,999 | 1,119 | 1.7% |
| $25,000 to $34,999 | 1,383 | 2.1% |
| $35,000 to $49,999 | 2,765 | 4.2% |
| $50,000 to $74,999 | 4,543 | 6.9% |
| $75,000 to $99,999 | 5,399 | 8.2% |
| $100,000 to $149,999 | 9,218 | 14.0% |
| $150,000 to $199,999 | 8,955 | 13.6% |
| $200,000+ | 30,815 | 46.8% |
Family Income by Famaliy Size in Marin County
4-person families (13,277 | 20.2%) account for the highest median family income in Marin County with $250,001 per family, while 2-person families (33,224 | 50.5%) have the highest median income of $79,380 per family member.
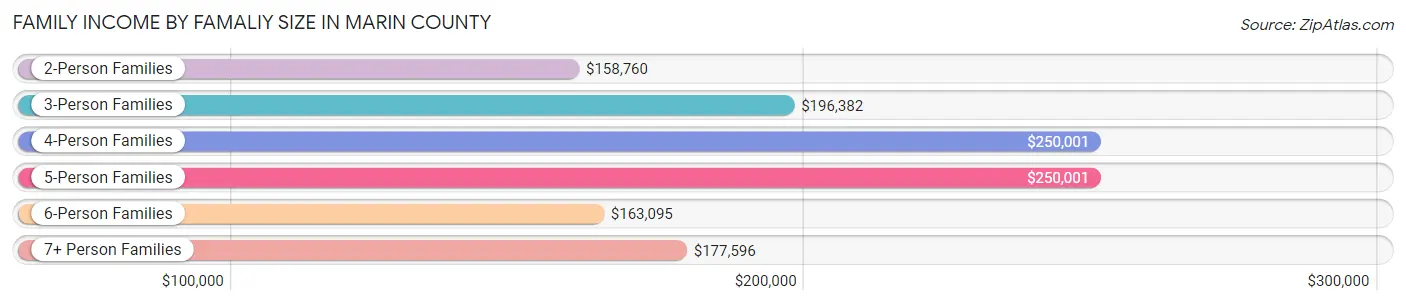
| Income Bracket | # Families | Median Income |
| 2-Person Families | 33,224 (50.5%) | $158,760 |
| 3-Person Families | 13,788 (20.9%) | $196,382 |
| 4-Person Families | 13,277 (20.2%) | $250,001 |
| 5-Person Families | 4,161 (6.3%) | $250,001 |
| 6-Person Families | 764 (1.2%) | $163,095 |
| 7+ Person Families | 629 (1.0%) | $177,596 |
| Total | 65,843 (100.0%) | $185,883 |
Family Income by Number of Earners in Marin County
The median family income in Marin County is $185,883, with families comprising 2 earners (30,182) having the highest median family income of $236,250, while families with no earners (8,853) have the lowest median family income of $108,365, accounting for 45.8% and 13.5% of families, respectively.
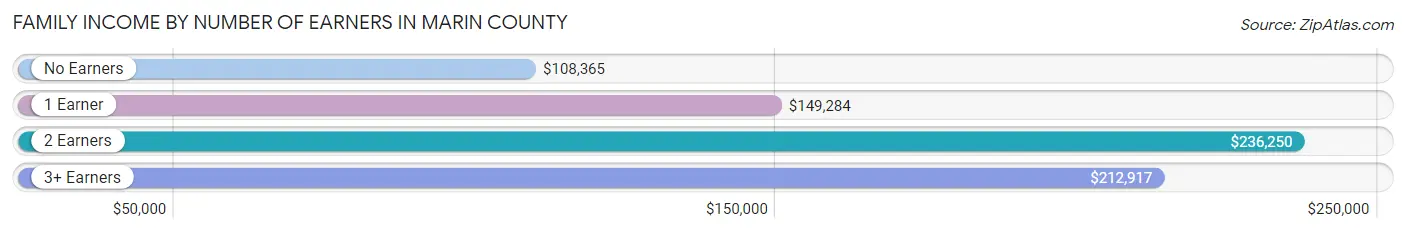
| Number of Earners | # Families | Median Income |
| No Earners | 8,853 (13.5%) | $108,365 |
| 1 Earner | 19,759 (30.0%) | $149,284 |
| 2 Earners | 30,182 (45.8%) | $236,250 |
| 3+ Earners | 7,049 (10.7%) | $212,917 |
| Total | 65,843 (100.0%) | $185,883 |
Household Income in Marin County
Household Income Brackets in Marin County
With 37,439 households falling in the category, the $200,000+ income range is the most frequent in Marin County, accounting for 36.1% of all households. In contrast, only 1,970 households (1.9%) fall into the $10,000 to $14,999 income bracket, making it the least populous group.
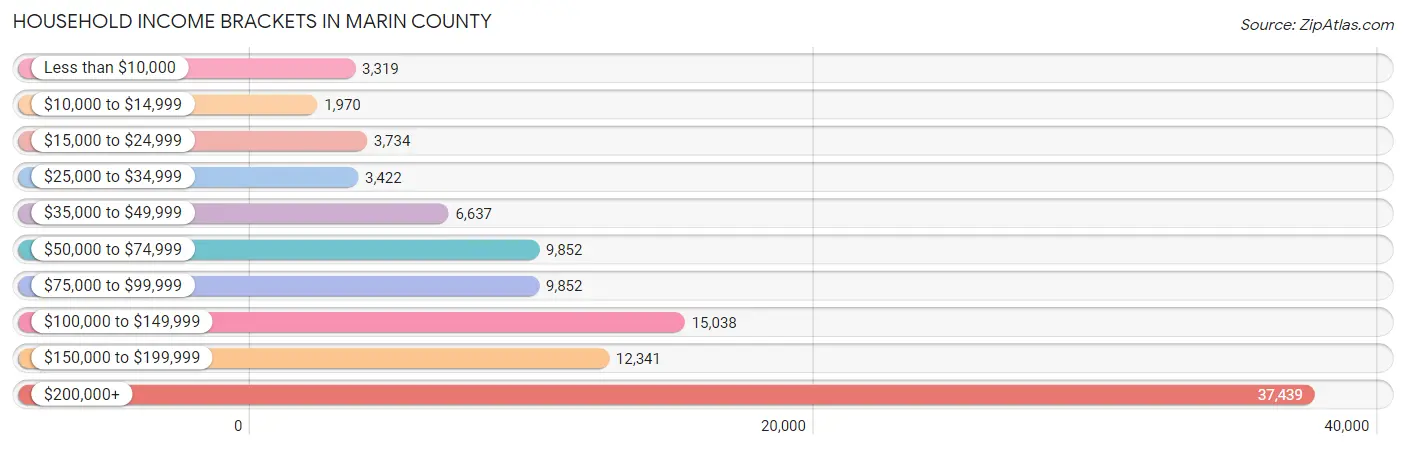
| Income Bracket | # Households | % Households |
| Less than $10,000 | 3,319 | 3.2% |
| $10,000 to $14,999 | 1,970 | 1.9% |
| $15,000 to $24,999 | 3,734 | 3.6% |
| $25,000 to $34,999 | 3,422 | 3.3% |
| $35,000 to $49,999 | 6,637 | 6.4% |
| $50,000 to $74,999 | 9,852 | 9.5% |
| $75,000 to $99,999 | 9,852 | 9.5% |
| $100,000 to $149,999 | 15,038 | 14.5% |
| $150,000 to $199,999 | 12,341 | 11.9% |
| $200,000+ | 37,439 | 36.1% |
Household Income by Householder Age in Marin County
The median household income in Marin County is $142,019, with the highest median household income of $177,098 found in the 45 to 64 years age bracket for the primary householder. A total of 43,502 households (41.9%) fall into this category. Meanwhile, the 15 to 24 years age bracket for the primary householder has the lowest median household income of $62,790, with 1,000 households (1.0%) in this group.
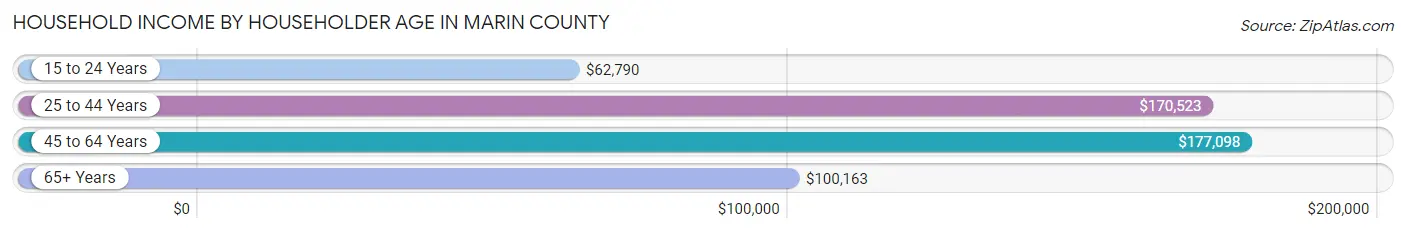
| Income Bracket | # Households | Median Income |
| 15 to 24 Years | 1,000 (1.0%) | $62,790 |
| 25 to 44 Years | 21,496 (20.7%) | $170,523 |
| 45 to 64 Years | 43,502 (41.9%) | $177,098 |
| 65+ Years | 37,711 (36.4%) | $100,163 |
| Total | 103,709 (100.0%) | $142,019 |
Poverty in Marin County
Income Below Poverty by Sex and Age in Marin County
With 6.7% poverty level for males and 7.2% for females among the residents of Marin County, 5 year old males and 18 to 24 year old females are the most vulnerable to poverty, with 183 males (15.5%) and 1,066 females (12.9%) in their respective age groups living below the poverty level.
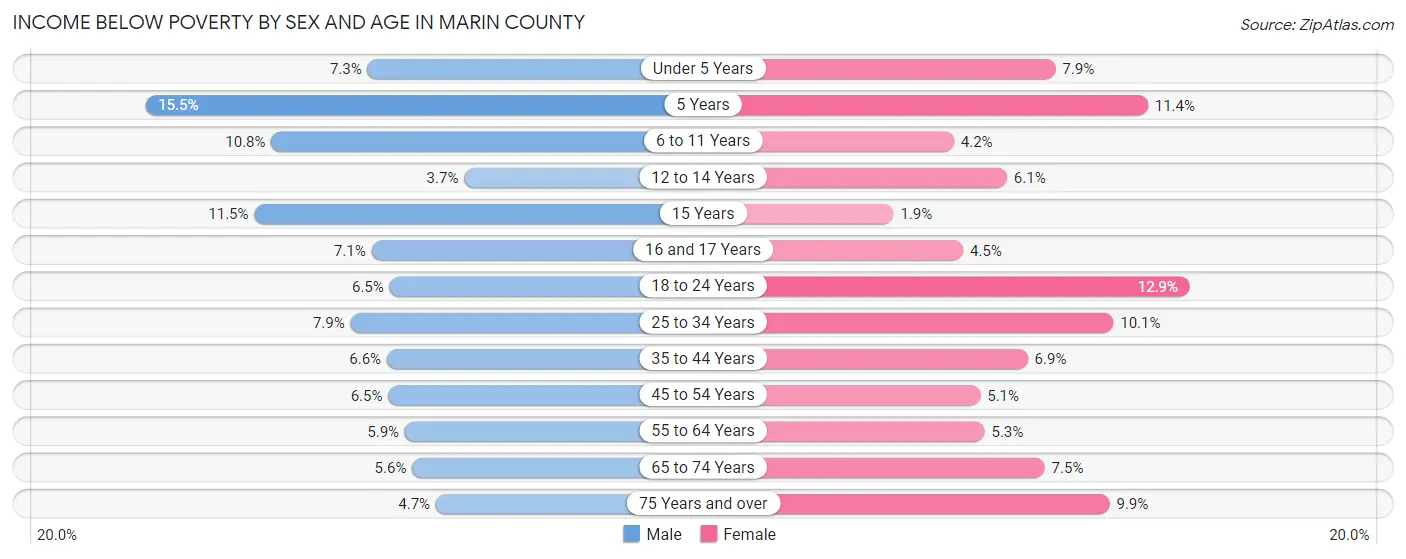
| Age Bracket | Male | Female |
| Under 5 Years | 420 (7.3%) | 432 (7.9%) |
| 5 Years | 183 (15.5%) | 178 (11.4%) |
| 6 to 11 Years | 951 (10.8%) | 316 (4.2%) |
| 12 to 14 Years | 171 (3.7%) | 312 (6.1%) |
| 15 Years | 197 (11.5%) | 30 (1.9%) |
| 16 and 17 Years | 246 (7.1%) | 157 (4.5%) |
| 18 to 24 Years | 553 (6.5%) | 1,066 (12.9%) |
| 25 to 34 Years | 889 (7.9%) | 1,041 (10.1%) |
| 35 to 44 Years | 976 (6.6%) | 1,034 (6.9%) |
| 45 to 54 Years | 1,254 (6.5%) | 1,015 (5.1%) |
| 55 to 64 Years | 1,095 (5.9%) | 1,071 (5.3%) |
| 65 to 74 Years | 868 (5.6%) | 1,378 (7.5%) |
| 75 Years and over | 514 (4.7%) | 1,462 (9.9%) |
| Total | 8,317 (6.7%) | 9,492 (7.2%) |
Income Above Poverty by Sex and Age in Marin County
According to the poverty statistics in Marin County, males aged 12 to 14 years and females aged 15 years are the age groups that are most secure financially, with 96.3% of males and 98.1% of females in these age groups living above the poverty line.
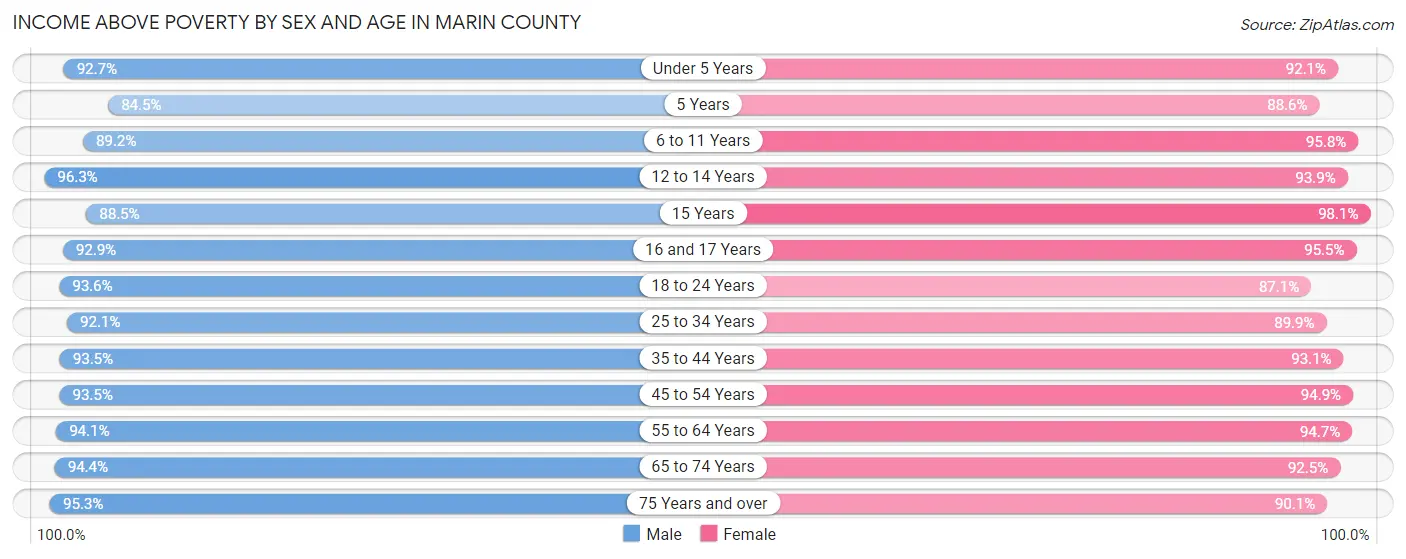
| Age Bracket | Male | Female |
| Under 5 Years | 5,358 (92.7%) | 5,019 (92.1%) |
| 5 Years | 996 (84.5%) | 1,389 (88.6%) |
| 6 to 11 Years | 7,822 (89.2%) | 7,284 (95.8%) |
| 12 to 14 Years | 4,474 (96.3%) | 4,774 (93.9%) |
| 15 Years | 1,520 (88.5%) | 1,535 (98.1%) |
| 16 and 17 Years | 3,207 (92.9%) | 3,334 (95.5%) |
| 18 to 24 Years | 8,025 (93.5%) | 7,187 (87.1%) |
| 25 to 34 Years | 10,371 (92.1%) | 9,282 (89.9%) |
| 35 to 44 Years | 13,932 (93.4%) | 13,952 (93.1%) |
| 45 to 54 Years | 18,041 (93.5%) | 18,721 (94.9%) |
| 55 to 64 Years | 17,540 (94.1%) | 19,118 (94.7%) |
| 65 to 74 Years | 14,607 (94.4%) | 16,912 (92.5%) |
| 75 Years and over | 10,345 (95.3%) | 13,239 (90.1%) |
| Total | 116,238 (93.3%) | 121,746 (92.8%) |
Income Below Poverty Among Married-Couple Families in Marin County
The poverty statistics for married-couple families in Marin County show that 1.9% or 1,030 of the total 53,549 families live below the poverty line. Families with 3 or 4 children have the highest poverty rate of 4.8%, comprising of 140 families. On the other hand, families with 5 or more children have the lowest poverty rate of 0.0%, which includes 0 families.
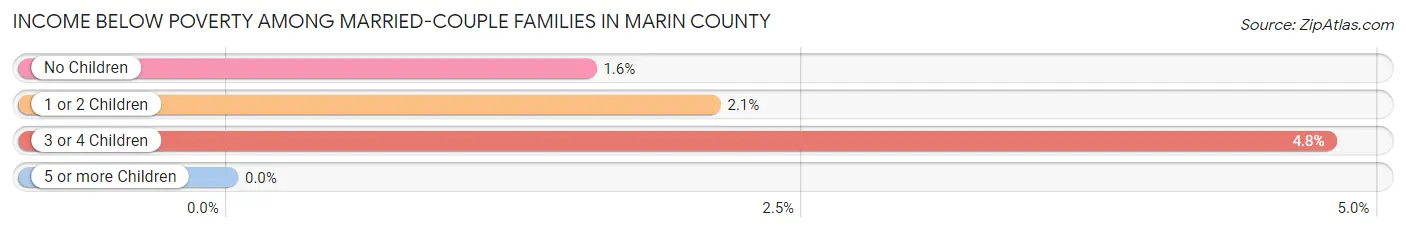
| Children | Above Poverty | Below Poverty |
| No Children | 31,179 (98.4%) | 494 (1.6%) |
| 1 or 2 Children | 18,464 (97.9%) | 396 (2.1%) |
| 3 or 4 Children | 2,788 (95.2%) | 140 (4.8%) |
| 5 or more Children | 88 (100.0%) | 0 (0.0%) |
| Total | 52,519 (98.1%) | 1,030 (1.9%) |
Income Below Poverty Among Single-Parent Households in Marin County
According to the poverty data in Marin County, 7.6% or 283 single-father households and 14.1% or 1,209 single-mother households are living below the poverty line. Among single-father households, those with 5 or more children have the highest poverty rate, with 13 households (100.0%) experiencing poverty. Likewise, among single-mother households, those with 5 or more children have the highest poverty rate, with 1 households (100.0%) falling below the poverty line.
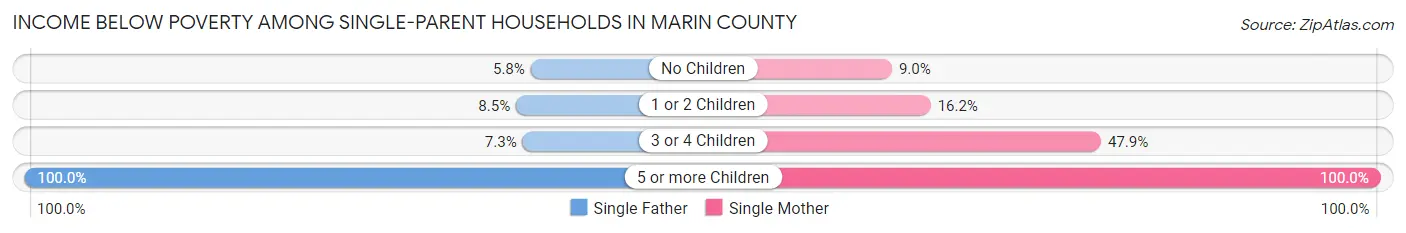
| Children | Single Father | Single Mother |
| No Children | 92 (5.8%) | 357 (9.0%) |
| 1 or 2 Children | 165 (8.5%) | 688 (16.2%) |
| 3 or 4 Children | 13 (7.3%) | 163 (47.9%) |
| 5 or more Children | 13 (100.0%) | 1 (100.0%) |
| Total | 283 (7.6%) | 1,209 (14.1%) |
Income Below Poverty Among Married-Couple vs Single-Parent Households in Marin County
The poverty data for Marin County shows that 1,030 of the married-couple family households (1.9%) and 1,492 of the single-parent households (12.1%) are living below the poverty level. Within the married-couple family households, those with 3 or 4 children have the highest poverty rate, with 140 households (4.8%) falling below the poverty line. Among the single-parent households, those with 5 or more children have the highest poverty rate, with 14 household (100.0%) living below poverty.
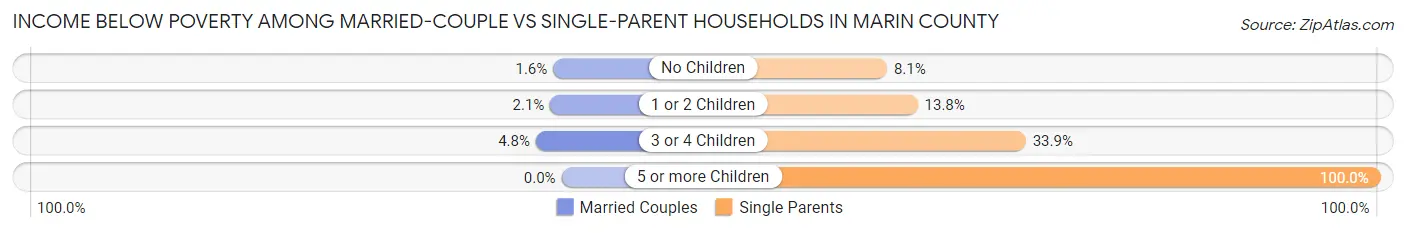
| Children | Married-Couple Families | Single-Parent Households |
| No Children | 494 (1.6%) | 449 (8.1%) |
| 1 or 2 Children | 396 (2.1%) | 853 (13.8%) |
| 3 or 4 Children | 140 (4.8%) | 176 (33.9%) |
| 5 or more Children | 0 (0.0%) | 14 (100.0%) |
| Total | 1,030 (1.9%) | 1,492 (12.1%) |
Employment Characteristics in Marin County
Employment by Class of Employer in Marin County
Among the 126,445 employed individuals in Marin County, private company employees (75,244 | 59.5%), self-employed (not incorporated) (17,216 | 13.6%), and not-for-profit organizations (10,916 | 8.6%) make up the most common classes of employment.
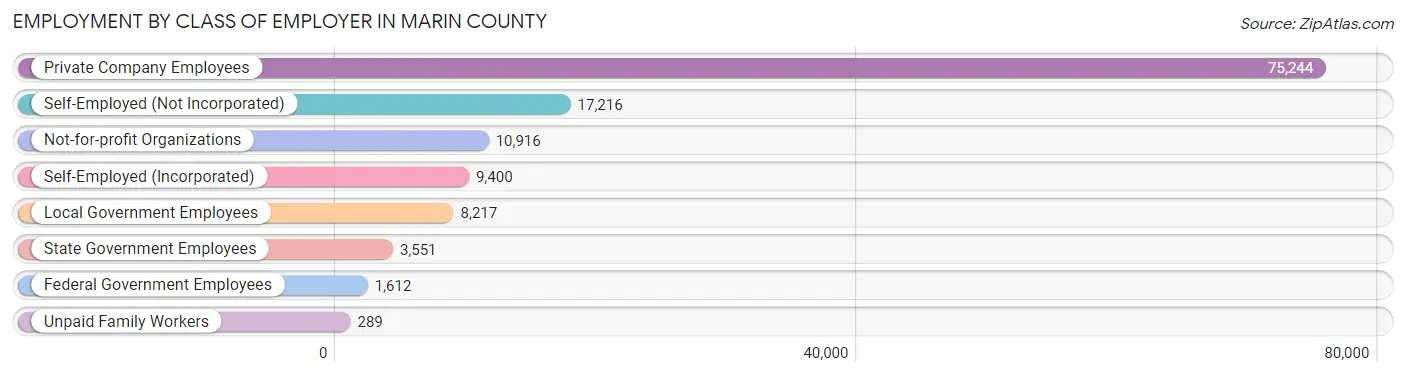
| Employer Class | # Employees | % Employees |
| Private Company Employees | 75,244 | 59.5% |
| Self-Employed (Incorporated) | 9,400 | 7.4% |
| Self-Employed (Not Incorporated) | 17,216 | 13.6% |
| Not-for-profit Organizations | 10,916 | 8.6% |
| Local Government Employees | 8,217 | 6.5% |
| State Government Employees | 3,551 | 2.8% |
| Federal Government Employees | 1,612 | 1.3% |
| Unpaid Family Workers | 289 | 0.2% |
| Total | 126,445 | 100.0% |
Employment Status by Age in Marin County
According to the labor force statistics for Marin County, out of the total population over 16 years of age (216,526), 63.3% or 137,061 individuals are in the labor force, with 5.8% or 7,950 of them unemployed. The age group with the highest labor force participation rate is 35 to 44 years, with 86.3% or 26,158 individuals in the labor force. Within the labor force, the 16 to 19 years age range has the highest percentage of unemployed individuals, with 16.4% or 592 of them being unemployed.
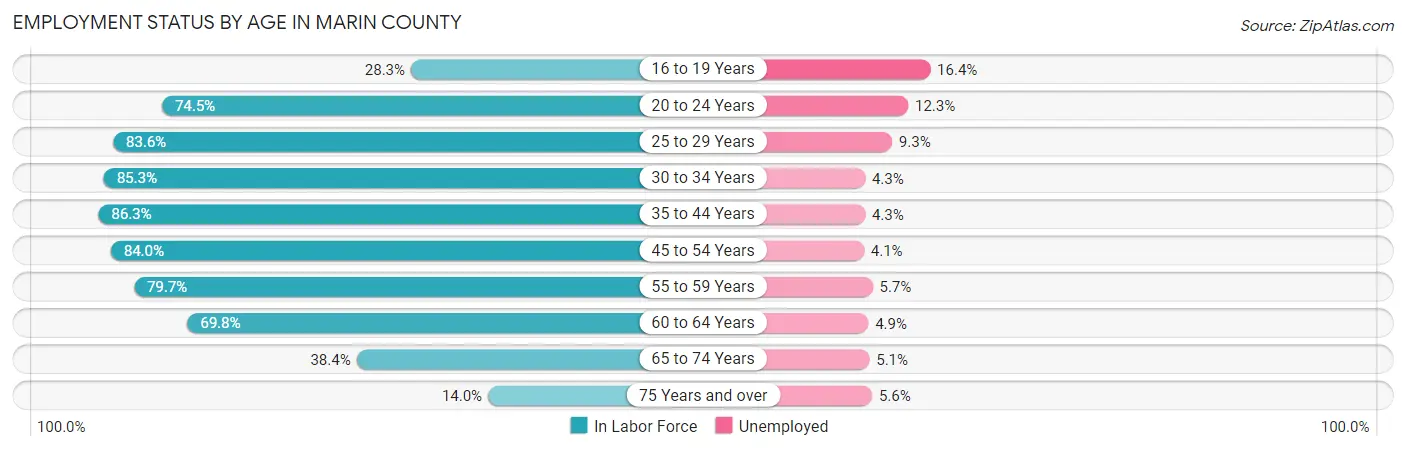
| Age Bracket | In Labor Force | Unemployed |
| 16 to 19 Years | 3,609 (28.3%) | 592 (16.4%) |
| 20 to 24 Years | 9,096 (74.5%) | 1,119 (12.3%) |
| 25 to 29 Years | 8,620 (83.6%) | 802 (9.3%) |
| 30 to 34 Years | 10,053 (85.3%) | 432 (4.3%) |
| 35 to 44 Years | 26,158 (86.3%) | 1,125 (4.3%) |
| 45 to 54 Years | 33,120 (84.0%) | 1,358 (4.1%) |
| 55 to 59 Years | 16,764 (79.7%) | 956 (5.7%) |
| 60 to 64 Years | 12,776 (69.8%) | 626 (4.9%) |
| 65 to 74 Years | 13,140 (38.4%) | 670 (5.1%) |
| 75 Years and over | 3,664 (14.0%) | 205 (5.6%) |
| Total | 137,061 (63.3%) | 7,950 (5.8%) |
Employment Status by Educational Attainment in Marin County
According to labor force statistics for Marin County, 81.9% of individuals (107,432) out of the total population between 25 and 64 years of age (131,174) are in the labor force, with 4.9% or 5,264 of them being unemployed. The group with the highest labor force participation rate are those with the educational attainment of bachelor's degree or higher, with 85.7% or 69,510 individuals in the labor force. Within the labor force, individuals with college / associate degree education have the highest percentage of unemployment, with 8.0% or 1,676 of them being unemployed.
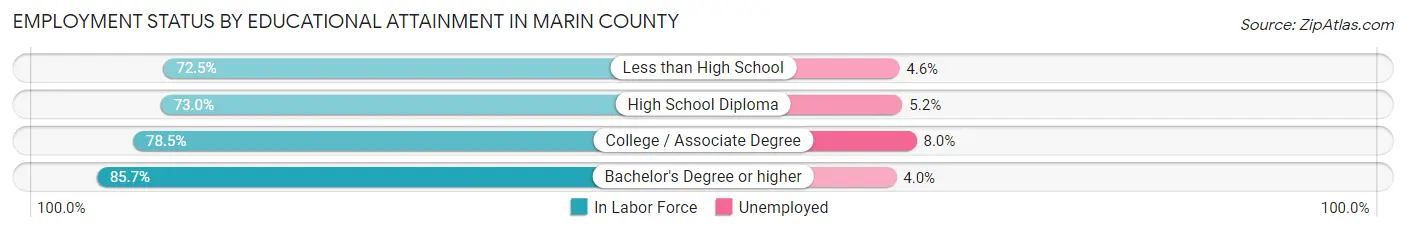
| Educational Attainment | In Labor Force | Unemployed |
| Less than High School | 7,323 (72.5%) | 465 (4.6%) |
| High School Diploma | 9,691 (73.0%) | 690 (5.2%) |
| College / Associate Degree | 20,952 (78.5%) | 2,135 (8.0%) |
| Bachelor's Degree or higher | 69,510 (85.7%) | 3,244 (4.0%) |
| Total | 107,432 (81.9%) | 6,428 (4.9%) |
Employment Occupations by Sex in Marin County
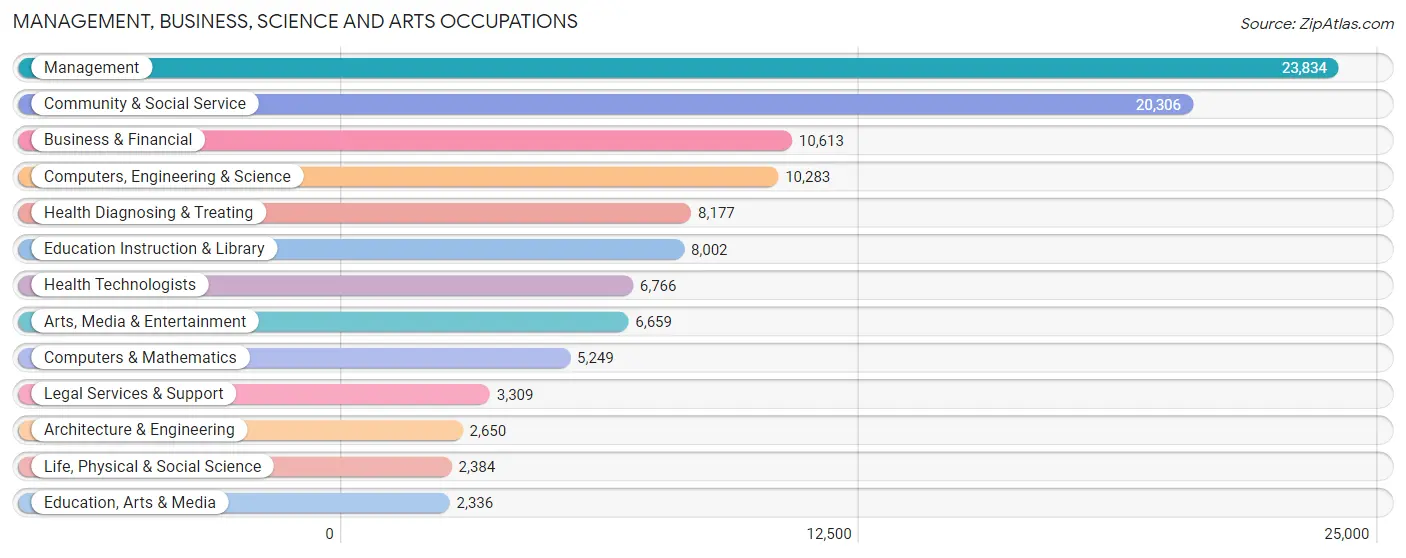
Management, Business, Science and Arts Occupations
The most common Management, Business, Science and Arts occupations in Marin County are Management (23,834 | 18.5%), Community & Social Service (20,306 | 15.8%), Business & Financial (10,613 | 8.2%), Computers, Engineering & Science (10,283 | 8.0%), and Health Diagnosing & Treating (8,177 | 6.3%).
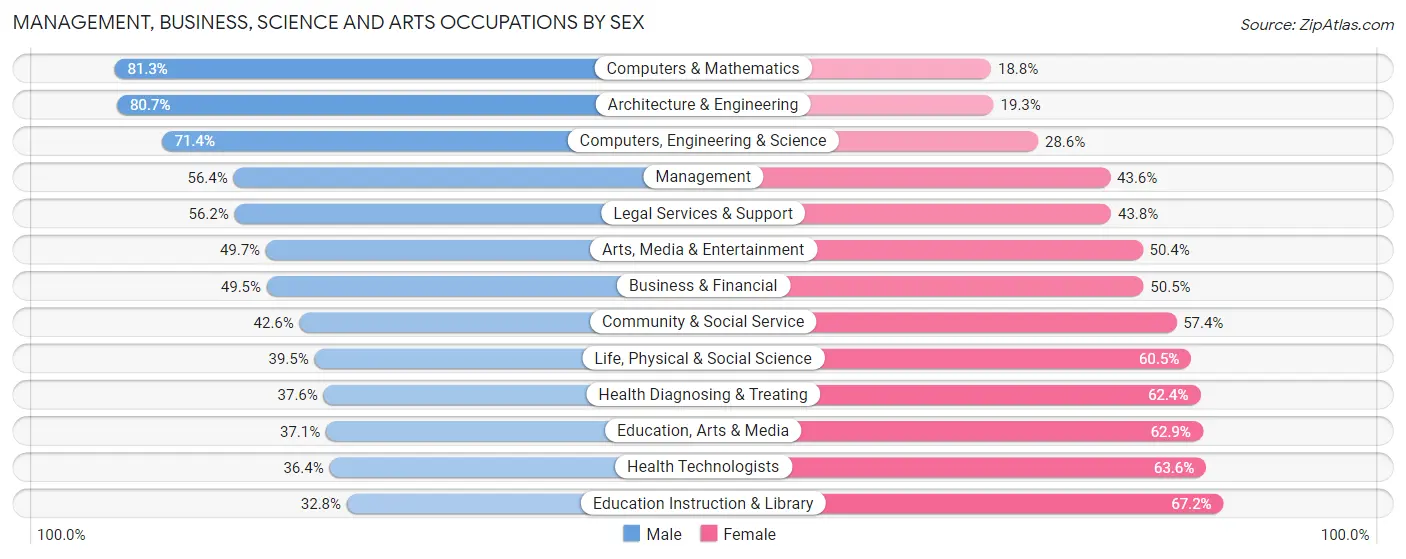
Management, Business, Science and Arts Occupations by Sex
Within the Management, Business, Science and Arts occupations in Marin County, the most male-oriented occupations are Computers & Mathematics (81.2%), Architecture & Engineering (80.7%), and Computers, Engineering & Science (71.4%), while the most female-oriented occupations are Education Instruction & Library (67.2%), Health Technologists (63.6%), and Education, Arts & Media (62.9%).
| Occupation | Male | Female |
| Management | 13,444 (56.4%) | 10,390 (43.6%) |
| Business & Financial | 5,250 (49.5%) | 5,363 (50.5%) |
| Computers, Engineering & Science | 7,346 (71.4%) | 2,937 (28.6%) |
| Computers & Mathematics | 4,265 (81.2%) | 984 (18.8%) |
| Architecture & Engineering | 2,139 (80.7%) | 511 (19.3%) |
| Life, Physical & Social Science | 942 (39.5%) | 1,442 (60.5%) |
| Community & Social Service | 8,656 (42.6%) | 11,650 (57.4%) |
| Education, Arts & Media | 867 (37.1%) | 1,469 (62.9%) |
| Legal Services & Support | 1,860 (56.2%) | 1,449 (43.8%) |
| Education Instruction & Library | 2,623 (32.8%) | 5,379 (67.2%) |
| Arts, Media & Entertainment | 3,306 (49.6%) | 3,353 (50.3%) |
| Health Diagnosing & Treating | 3,076 (37.6%) | 5,101 (62.4%) |
| Health Technologists | 2,463 (36.4%) | 4,303 (63.6%) |
| Total (Category) | 37,772 (51.6%) | 35,441 (48.4%) |
| Total (Overall) | 67,616 (52.4%) | 61,300 (47.5%) |
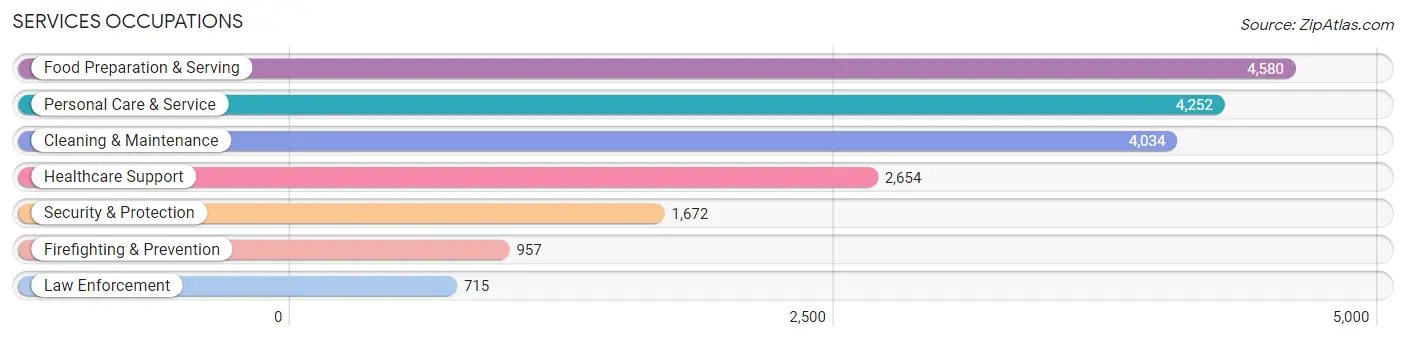
Services Occupations
The most common Services occupations in Marin County are Food Preparation & Serving (4,580 | 3.5%), Personal Care & Service (4,252 | 3.3%), Cleaning & Maintenance (4,034 | 3.1%), Healthcare Support (2,654 | 2.1%), and Security & Protection (1,672 | 1.3%).
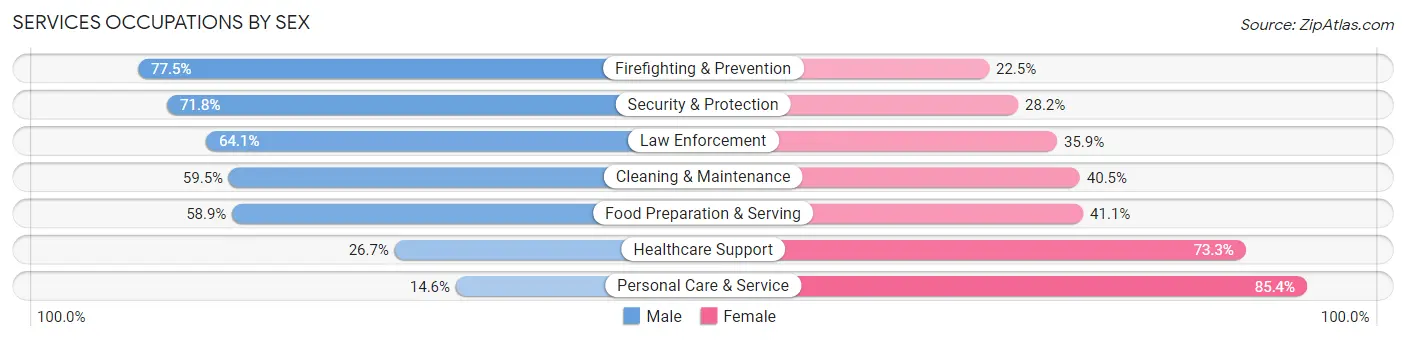
Services Occupations by Sex
Within the Services occupations in Marin County, the most male-oriented occupations are Firefighting & Prevention (77.5%), Security & Protection (71.8%), and Law Enforcement (64.1%), while the most female-oriented occupations are Personal Care & Service (85.4%), Healthcare Support (73.3%), and Food Preparation & Serving (41.1%).
| Occupation | Male | Female |
| Healthcare Support | 709 (26.7%) | 1,945 (73.3%) |
| Security & Protection | 1,200 (71.8%) | 472 (28.2%) |
| Firefighting & Prevention | 742 (77.5%) | 215 (22.5%) |
| Law Enforcement | 458 (64.1%) | 257 (35.9%) |
| Food Preparation & Serving | 2,697 (58.9%) | 1,883 (41.1%) |
| Cleaning & Maintenance | 2,402 (59.5%) | 1,632 (40.5%) |
| Personal Care & Service | 621 (14.6%) | 3,631 (85.4%) |
| Total (Category) | 7,629 (44.4%) | 9,563 (55.6%) |
| Total (Overall) | 67,616 (52.4%) | 61,300 (47.5%) |
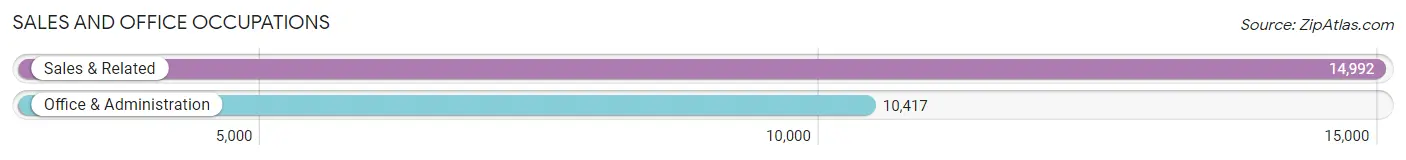
Sales and Office Occupations
The most common Sales and Office occupations in Marin County are Sales & Related (14,992 | 11.6%), and Office & Administration (10,417 | 8.1%).
Sales and Office Occupations by Sex
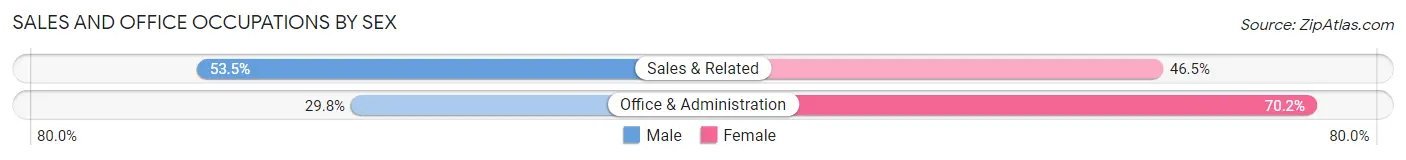
| Occupation | Male | Female |
| Sales & Related | 8,021 (53.5%) | 6,971 (46.5%) |
| Office & Administration | 3,104 (29.8%) | 7,313 (70.2%) |
| Total (Category) | 11,125 (43.8%) | 14,284 (56.2%) |
| Total (Overall) | 67,616 (52.4%) | 61,300 (47.5%) |
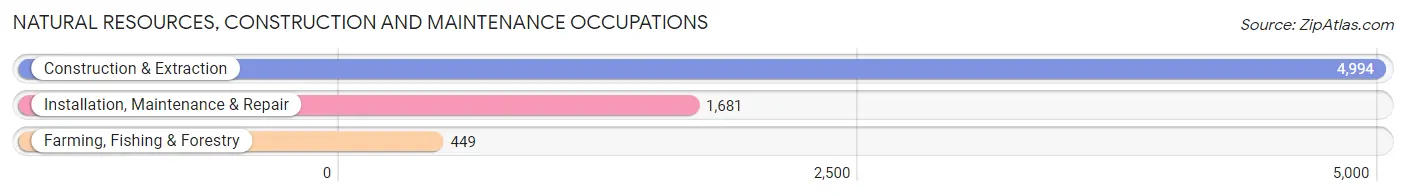
Natural Resources, Construction and Maintenance Occupations
The most common Natural Resources, Construction and Maintenance occupations in Marin County are Construction & Extraction (4,994 | 3.9%), Installation, Maintenance & Repair (1,681 | 1.3%), and Farming, Fishing & Forestry (449 | 0.4%).
Natural Resources, Construction and Maintenance Occupations by Sex
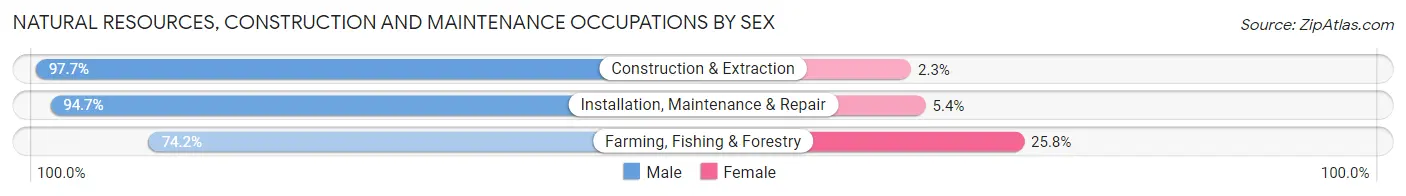
| Occupation | Male | Female |
| Farming, Fishing & Forestry | 333 (74.2%) | 116 (25.8%) |
| Construction & Extraction | 4,878 (97.7%) | 116 (2.3%) |
| Installation, Maintenance & Repair | 1,591 (94.7%) | 90 (5.3%) |
| Total (Category) | 6,802 (95.5%) | 322 (4.5%) |
| Total (Overall) | 67,616 (52.4%) | 61,300 (47.5%) |
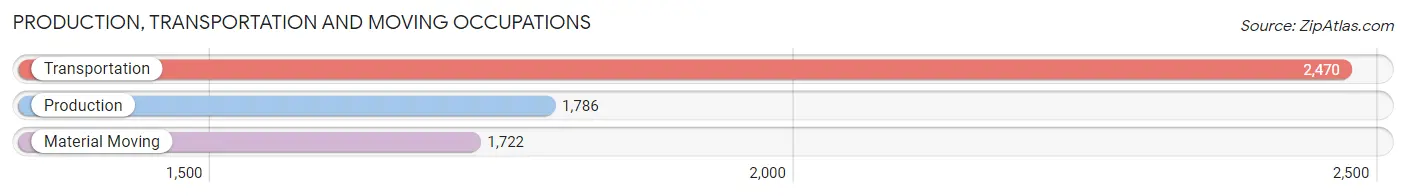
Production, Transportation and Moving Occupations
The most common Production, Transportation and Moving occupations in Marin County are Transportation (2,470 | 1.9%), Production (1,786 | 1.4%), and Material Moving (1,722 | 1.3%).
Production, Transportation and Moving Occupations by Sex
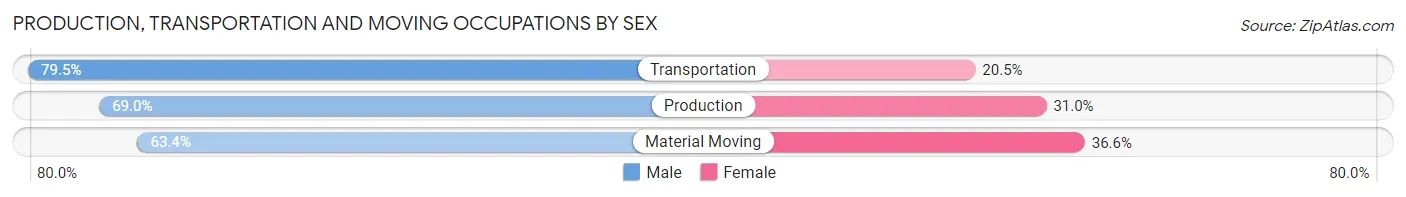
| Occupation | Male | Female |
| Production | 1,233 (69.0%) | 553 (31.0%) |
| Transportation | 1,963 (79.5%) | 507 (20.5%) |
| Material Moving | 1,092 (63.4%) | 630 (36.6%) |
| Total (Category) | 4,288 (71.7%) | 1,690 (28.3%) |
| Total (Overall) | 67,616 (52.4%) | 61,300 (47.5%) |
Employment Industries by Sex in Marin County
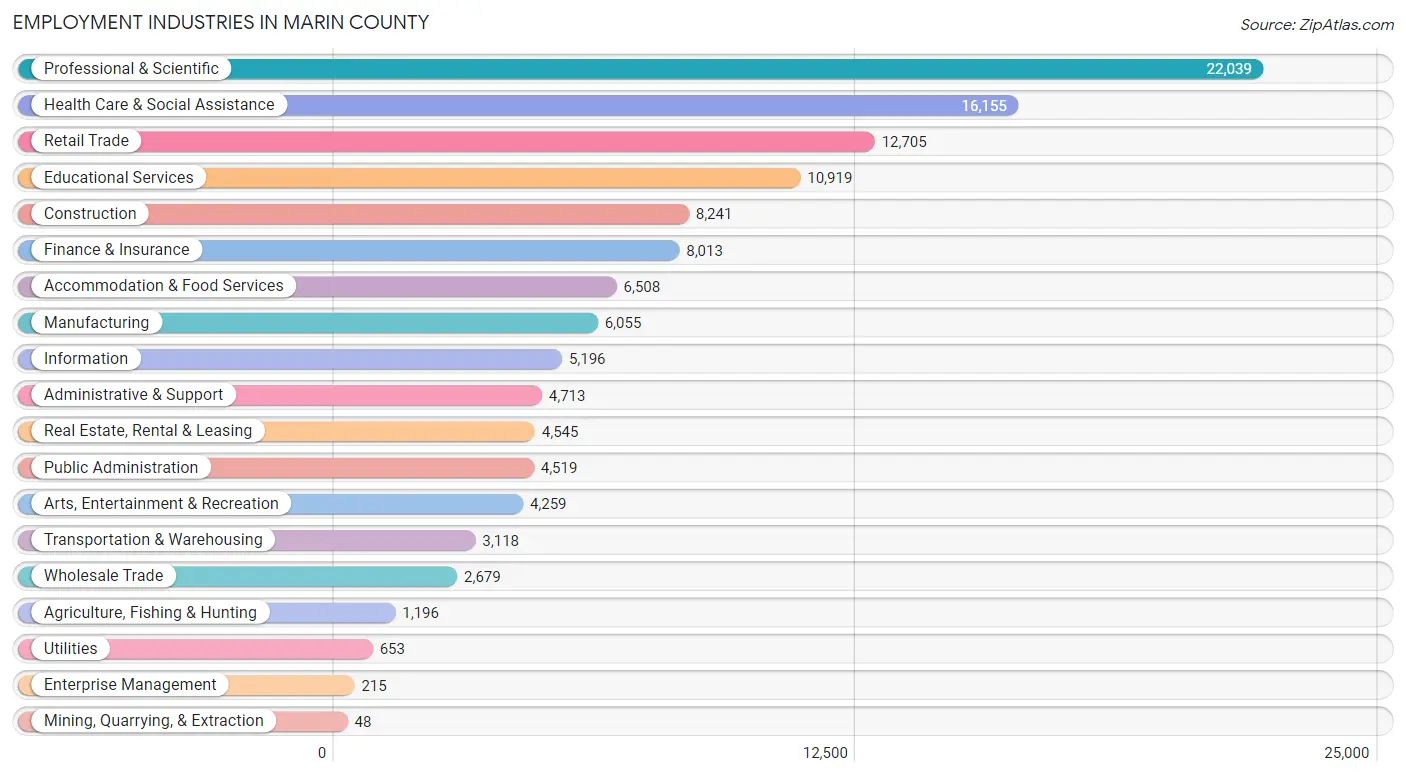
Employment Industries in Marin County
The major employment industries in Marin County include Professional & Scientific (22,039 | 17.1%), Health Care & Social Assistance (16,155 | 12.5%), Retail Trade (12,705 | 9.9%), Educational Services (10,919 | 8.5%), and Construction (8,241 | 6.4%).
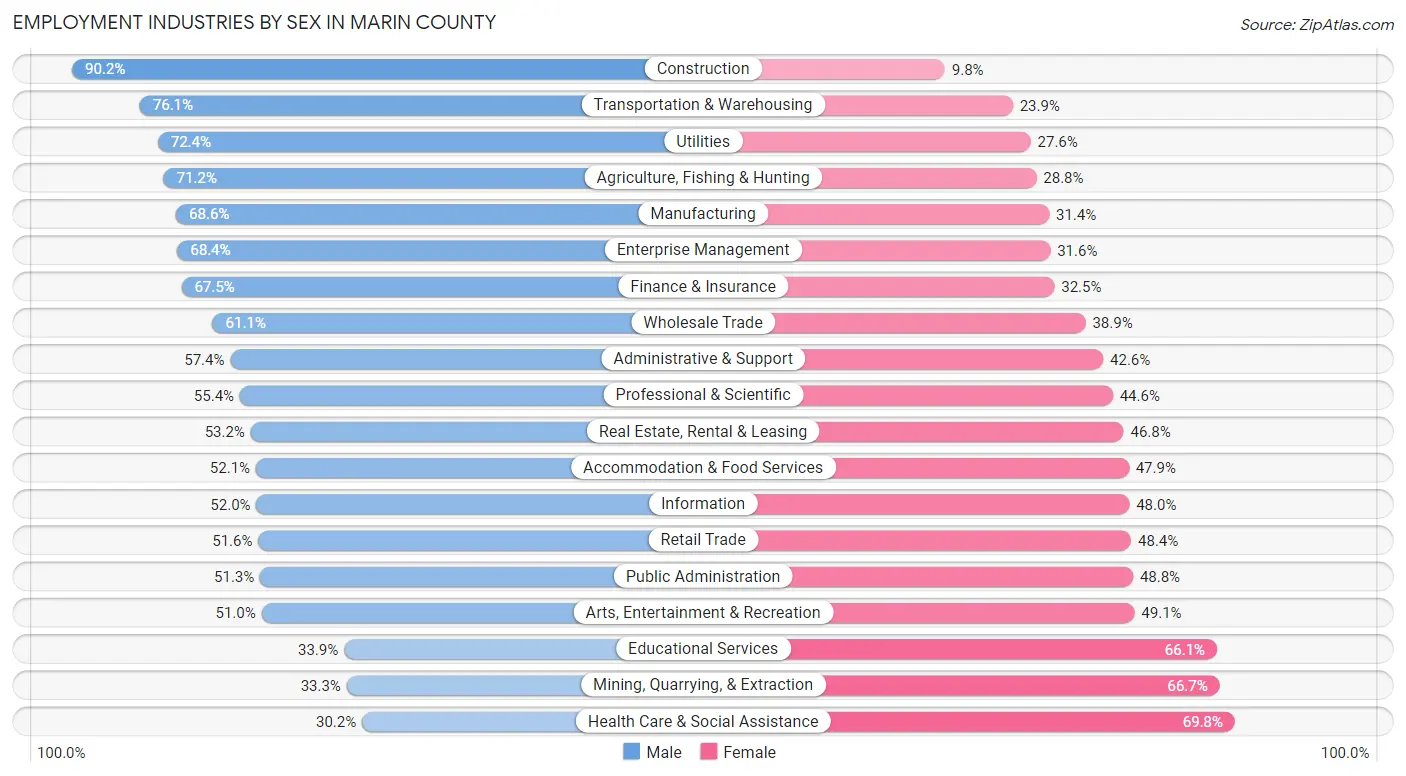
Employment Industries by Sex in Marin County
The Marin County industries that see more men than women are Construction (90.2%), Transportation & Warehousing (76.1%), and Utilities (72.4%), whereas the industries that tend to have a higher number of women are Health Care & Social Assistance (69.8%), Mining, Quarrying, & Extraction (66.7%), and Educational Services (66.1%).
| Industry | Male | Female |
| Agriculture, Fishing & Hunting | 852 (71.2%) | 344 (28.8%) |
| Mining, Quarrying, & Extraction | 16 (33.3%) | 32 (66.7%) |
| Construction | 7,432 (90.2%) | 809 (9.8%) |
| Manufacturing | 4,155 (68.6%) | 1,900 (31.4%) |
| Wholesale Trade | 1,636 (61.1%) | 1,043 (38.9%) |
| Retail Trade | 6,559 (51.6%) | 6,146 (48.4%) |
| Transportation & Warehousing | 2,374 (76.1%) | 744 (23.9%) |
| Utilities | 473 (72.4%) | 180 (27.6%) |
| Information | 2,703 (52.0%) | 2,493 (48.0%) |
| Finance & Insurance | 5,411 (67.5%) | 2,602 (32.5%) |
| Real Estate, Rental & Leasing | 2,418 (53.2%) | 2,127 (46.8%) |
| Professional & Scientific | 12,216 (55.4%) | 9,823 (44.6%) |
| Enterprise Management | 147 (68.4%) | 68 (31.6%) |
| Administrative & Support | 2,706 (57.4%) | 2,007 (42.6%) |
| Educational Services | 3,699 (33.9%) | 7,220 (66.1%) |
| Health Care & Social Assistance | 4,872 (30.2%) | 11,283 (69.8%) |
| Arts, Entertainment & Recreation | 2,170 (50.9%) | 2,089 (49.0%) |
| Accommodation & Food Services | 3,392 (52.1%) | 3,116 (47.9%) |
| Public Administration | 2,316 (51.2%) | 2,203 (48.7%) |
| Total | 67,616 (52.4%) | 61,300 (47.5%) |
Education in Marin County
School Enrollment in Marin County
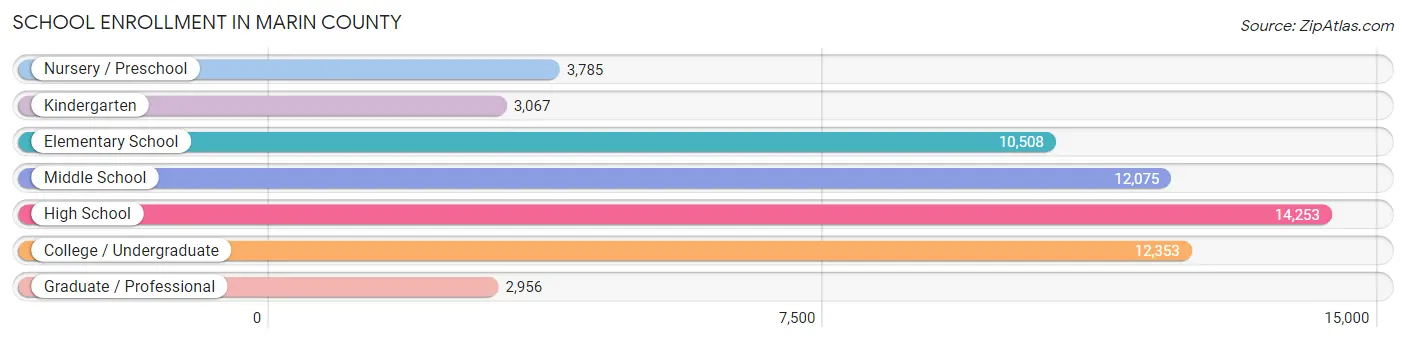
The most common levels of schooling among the 58,997 students in Marin County are high school (14,253 | 24.2%), college / undergraduate (12,353 | 20.9%), and middle school (12,075 | 20.5%).
| School Level | # Students | % Students |
| Nursery / Preschool | 3,785 | 6.4% |
| Kindergarten | 3,067 | 5.2% |
| Elementary School | 10,508 | 17.8% |
| Middle School | 12,075 | 20.5% |
| High School | 14,253 | 24.2% |
| College / Undergraduate | 12,353 | 20.9% |
| Graduate / Professional | 2,956 | 5.0% |
| Total | 58,997 | 100.0% |
School Enrollment by Age by Funding Source in Marin County
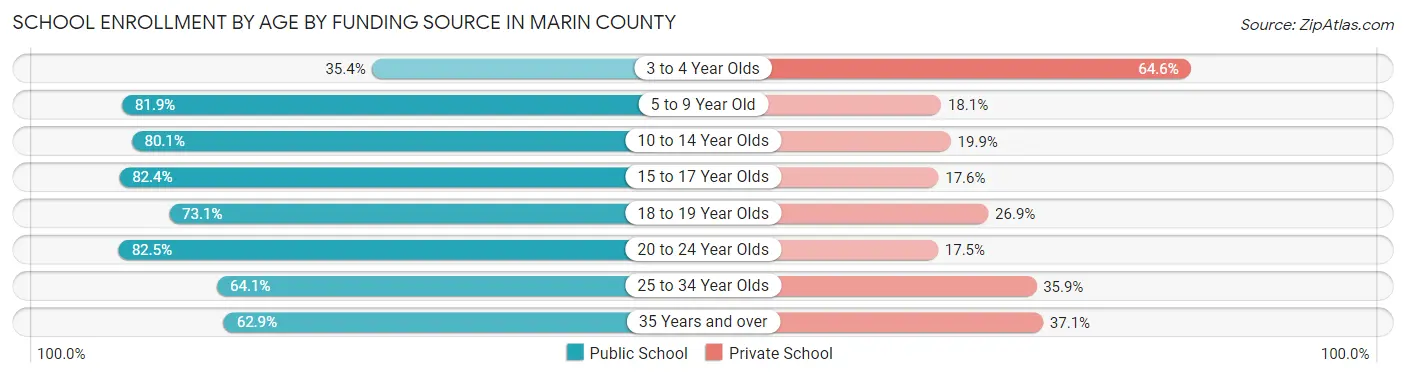
Out of a total of 58,997 students who are enrolled in schools in Marin County, 13,864 (23.5%) attend a private institution, while the remaining 45,133 (76.5%) are enrolled in public schools. The age group of 3 to 4 year olds has the highest likelihood of being enrolled in private schools, with 1,875 (64.6% in the age bracket) enrolled. Conversely, the age group of 20 to 24 year olds has the lowest likelihood of being enrolled in a private school, with 5,185 (82.5% in the age bracket) attending a public institution.
| Age Bracket | Public School | Private School |
| 3 to 4 Year Olds | 1,027 (35.4%) | 1,875 (64.6%) |
| 5 to 9 Year Old | 10,559 (81.9%) | 2,338 (18.1%) |
| 10 to 14 Year Olds | 12,440 (80.1%) | 3,096 (19.9%) |
| 15 to 17 Year Olds | 8,320 (82.4%) | 1,781 (17.6%) |
| 18 to 19 Year Olds | 3,506 (73.1%) | 1,291 (26.9%) |
| 20 to 24 Year Olds | 5,185 (82.5%) | 1,103 (17.5%) |
| 25 to 34 Year Olds | 1,506 (64.1%) | 842 (35.9%) |
| 35 Years and over | 2,596 (62.9%) | 1,532 (37.1%) |
| Total | 45,133 (76.5%) | 13,864 (23.5%) |
Educational Attainment by Field of Study in Marin County
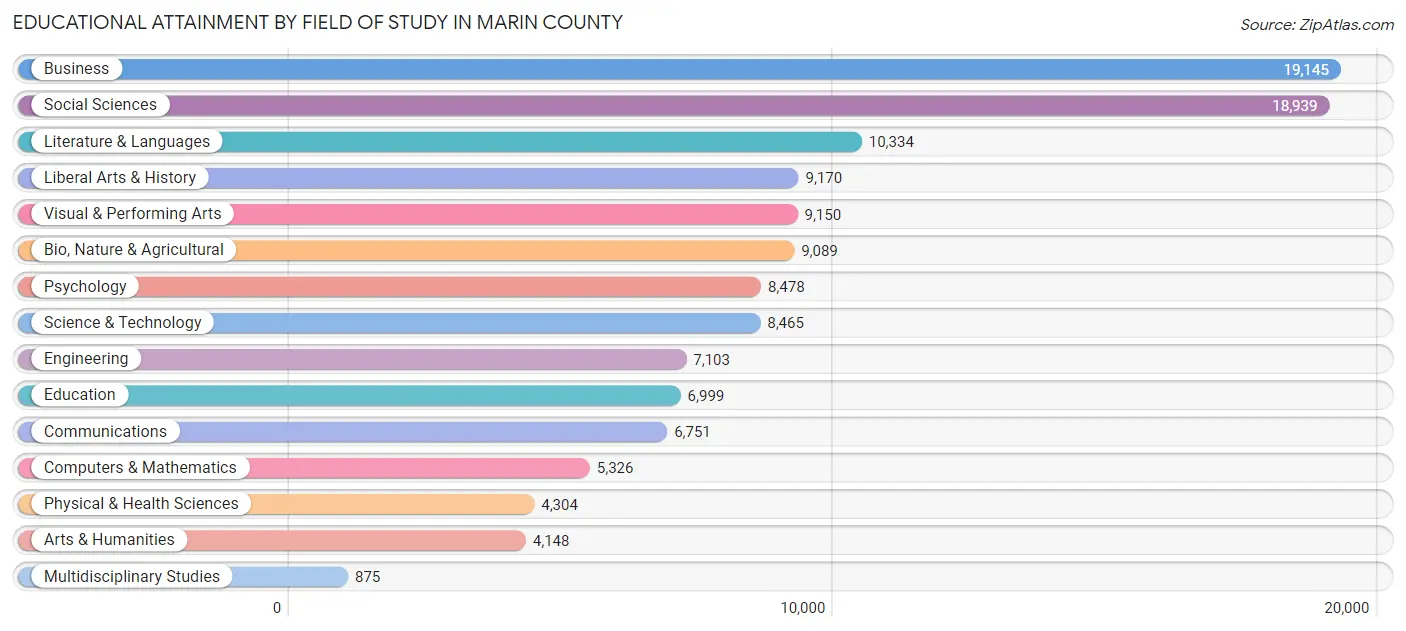
Business (19,145 | 14.9%), social sciences (18,939 | 14.8%), literature & languages (10,334 | 8.1%), liberal arts & history (9,170 | 7.1%), and visual & performing arts (9,150 | 7.1%) are the most common fields of study among 128,276 individuals in Marin County who have obtained a bachelor's degree or higher.
| Field of Study | # Graduates | % Graduates |
| Computers & Mathematics | 5,326 | 4.2% |
| Bio, Nature & Agricultural | 9,089 | 7.1% |
| Physical & Health Sciences | 4,304 | 3.4% |
| Psychology | 8,478 | 6.6% |
| Social Sciences | 18,939 | 14.8% |
| Engineering | 7,103 | 5.5% |
| Multidisciplinary Studies | 875 | 0.7% |
| Science & Technology | 8,465 | 6.6% |
| Business | 19,145 | 14.9% |
| Education | 6,999 | 5.5% |
| Literature & Languages | 10,334 | 8.1% |
| Liberal Arts & History | 9,170 | 7.1% |
| Visual & Performing Arts | 9,150 | 7.1% |
| Communications | 6,751 | 5.3% |
| Arts & Humanities | 4,148 | 3.2% |
| Total | 128,276 | 100.0% |
Transportation & Commute in Marin County
Vehicle Availability by Sex in Marin County
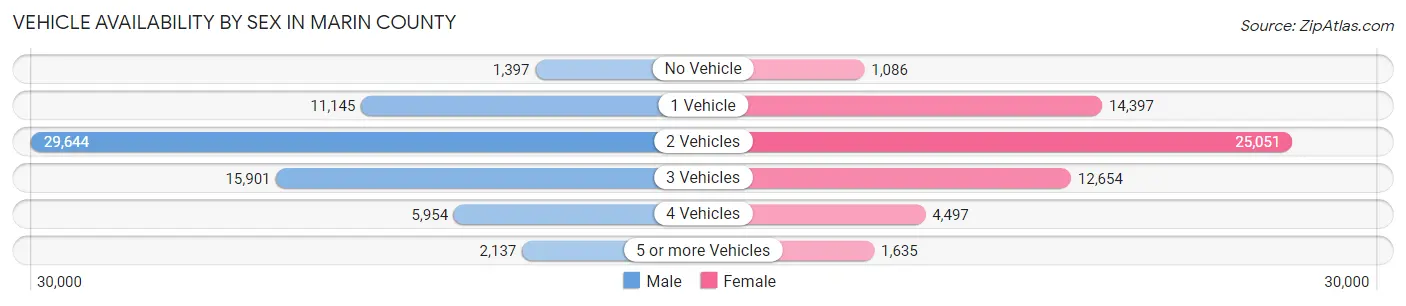
The most prevalent vehicle ownership categories in Marin County are males with 2 vehicles (29,644, accounting for 44.8%) and females with 2 vehicles (25,051, making up 50.0%).
| Vehicles Available | Male | Female |
| No Vehicle | 1,397 (2.1%) | 1,086 (1.8%) |
| 1 Vehicle | 11,145 (16.8%) | 14,397 (24.3%) |
| 2 Vehicles | 29,644 (44.8%) | 25,051 (42.2%) |
| 3 Vehicles | 15,901 (24.0%) | 12,654 (21.3%) |
| 4 Vehicles | 5,954 (9.0%) | 4,497 (7.6%) |
| 5 or more Vehicles | 2,137 (3.2%) | 1,635 (2.8%) |
| Total | 66,178 (100.0%) | 59,320 (100.0%) |
Commute Time in Marin County
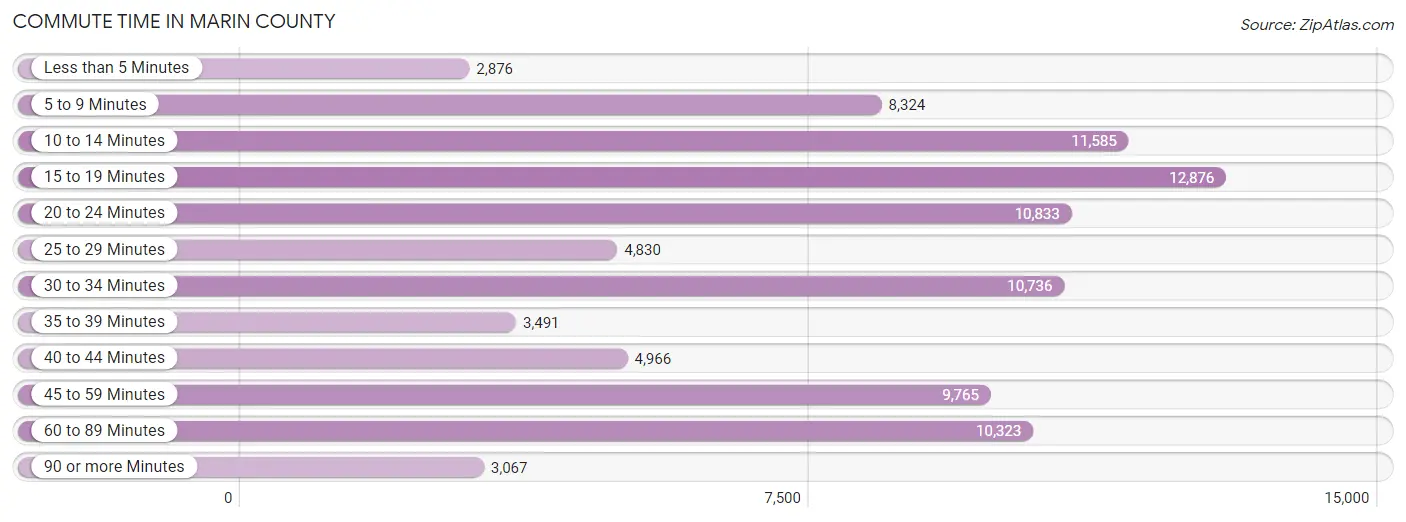
The most frequently occuring commute durations in Marin County are 15 to 19 minutes (12,876 commuters, 13.8%), 10 to 14 minutes (11,585 commuters, 12.4%), and 20 to 24 minutes (10,833 commuters, 11.6%).
| Commute Time | # Commuters | % Commuters |
| Less than 5 Minutes | 2,876 | 3.1% |
| 5 to 9 Minutes | 8,324 | 8.9% |
| 10 to 14 Minutes | 11,585 | 12.4% |
| 15 to 19 Minutes | 12,876 | 13.8% |
| 20 to 24 Minutes | 10,833 | 11.6% |
| 25 to 29 Minutes | 4,830 | 5.2% |
| 30 to 34 Minutes | 10,736 | 11.5% |
| 35 to 39 Minutes | 3,491 | 3.7% |
| 40 to 44 Minutes | 4,966 | 5.3% |
| 45 to 59 Minutes | 9,765 | 10.4% |
| 60 to 89 Minutes | 10,323 | 11.0% |
| 90 or more Minutes | 3,067 | 3.3% |
Commute Time by Sex in Marin County
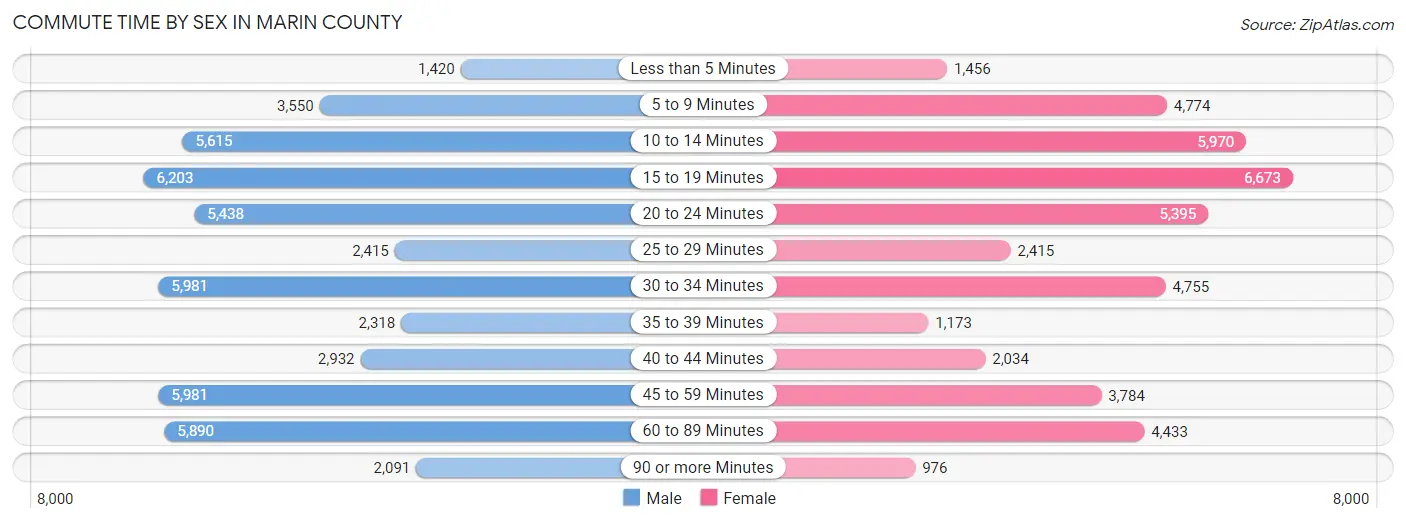
The most common commute times in Marin County are 15 to 19 minutes (6,203 commuters, 12.4%) for males and 15 to 19 minutes (6,673 commuters, 15.2%) for females.
| Commute Time | Male | Female |
| Less than 5 Minutes | 1,420 (2.9%) | 1,456 (3.3%) |
| 5 to 9 Minutes | 3,550 (7.1%) | 4,774 (10.9%) |
| 10 to 14 Minutes | 5,615 (11.3%) | 5,970 (13.6%) |
| 15 to 19 Minutes | 6,203 (12.4%) | 6,673 (15.2%) |
| 20 to 24 Minutes | 5,438 (10.9%) | 5,395 (12.3%) |
| 25 to 29 Minutes | 2,415 (4.9%) | 2,415 (5.5%) |
| 30 to 34 Minutes | 5,981 (12.0%) | 4,755 (10.8%) |
| 35 to 39 Minutes | 2,318 (4.6%) | 1,173 (2.7%) |
| 40 to 44 Minutes | 2,932 (5.9%) | 2,034 (4.6%) |
| 45 to 59 Minutes | 5,981 (12.0%) | 3,784 (8.6%) |
| 60 to 89 Minutes | 5,890 (11.8%) | 4,433 (10.1%) |
| 90 or more Minutes | 2,091 (4.2%) | 976 (2.2%) |
Time of Departure to Work by Sex in Marin County
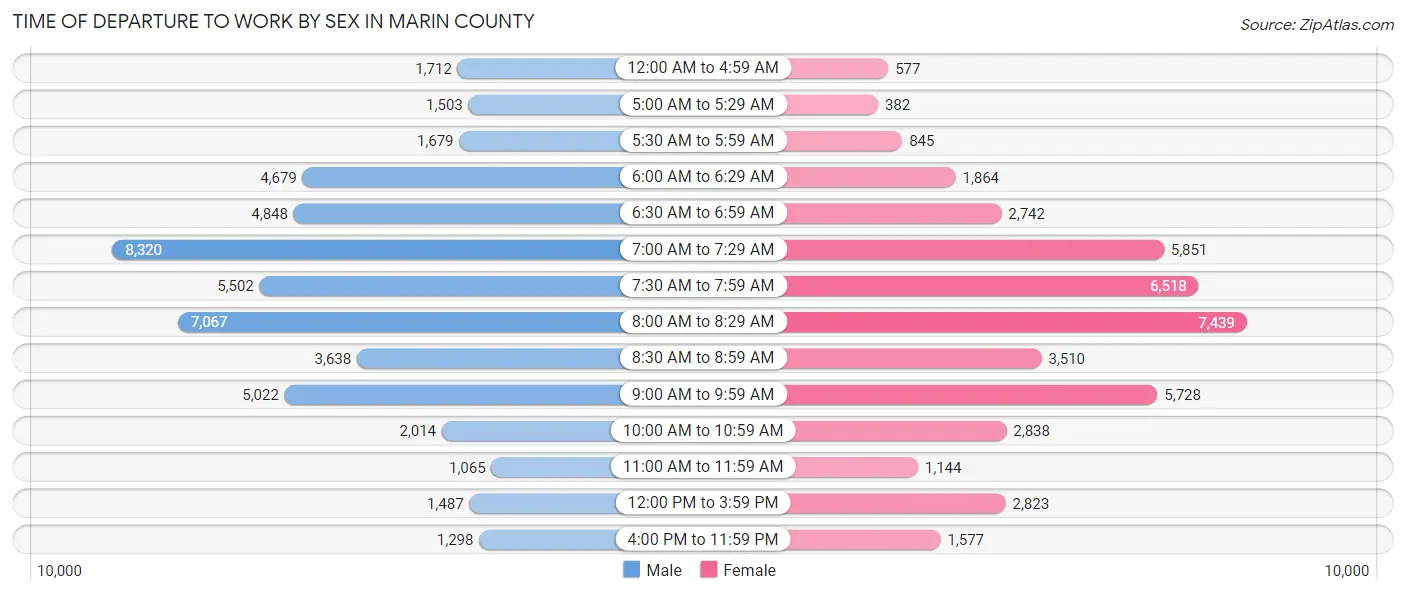
The most frequent times of departure to work in Marin County are 7:00 AM to 7:29 AM (8,320, 16.7%) for males and 8:00 AM to 8:29 AM (7,439, 17.0%) for females.
| Time of Departure | Male | Female |
| 12:00 AM to 4:59 AM | 1,712 (3.4%) | 577 (1.3%) |
| 5:00 AM to 5:29 AM | 1,503 (3.0%) | 382 (0.9%) |
| 5:30 AM to 5:59 AM | 1,679 (3.4%) | 845 (1.9%) |
| 6:00 AM to 6:29 AM | 4,679 (9.4%) | 1,864 (4.3%) |
| 6:30 AM to 6:59 AM | 4,848 (9.7%) | 2,742 (6.2%) |
| 7:00 AM to 7:29 AM | 8,320 (16.7%) | 5,851 (13.4%) |
| 7:30 AM to 7:59 AM | 5,502 (11.0%) | 6,518 (14.9%) |
| 8:00 AM to 8:29 AM | 7,067 (14.2%) | 7,439 (17.0%) |
| 8:30 AM to 8:59 AM | 3,638 (7.3%) | 3,510 (8.0%) |
| 9:00 AM to 9:59 AM | 5,022 (10.1%) | 5,728 (13.1%) |
| 10:00 AM to 10:59 AM | 2,014 (4.0%) | 2,838 (6.5%) |
| 11:00 AM to 11:59 AM | 1,065 (2.1%) | 1,144 (2.6%) |
| 12:00 PM to 3:59 PM | 1,487 (3.0%) | 2,823 (6.4%) |
| 4:00 PM to 11:59 PM | 1,298 (2.6%) | 1,577 (3.6%) |
| Total | 49,834 (100.0%) | 43,838 (100.0%) |
Housing Occupancy in Marin County
Occupancy by Ownership in Marin County
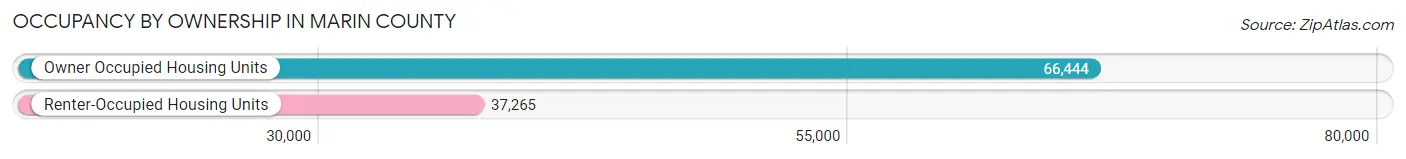
Of the total 103,709 dwellings in Marin County, owner-occupied units account for 66,444 (64.1%), while renter-occupied units make up 37,265 (35.9%).
| Occupancy | # Housing Units | % Housing Units |
| Owner Occupied Housing Units | 66,444 | 64.1% |
| Renter-Occupied Housing Units | 37,265 | 35.9% |
| Total Occupied Housing Units | 103,709 | 100.0% |
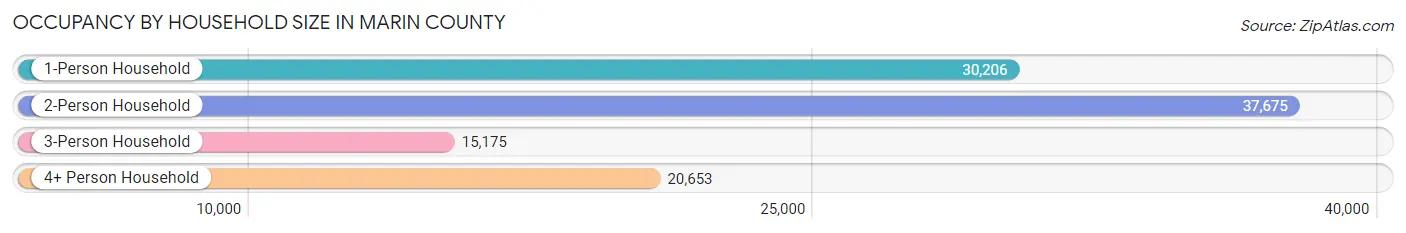
Occupancy by Household Size in Marin County
| Household Size | # Housing Units | % Housing Units |
| 1-Person Household | 30,206 | 29.1% |
| 2-Person Household | 37,675 | 36.3% |
| 3-Person Household | 15,175 | 14.6% |
| 4+ Person Household | 20,653 | 19.9% |
| Total Housing Units | 103,709 | 100.0% |
Occupancy by Ownership by Household Size in Marin County
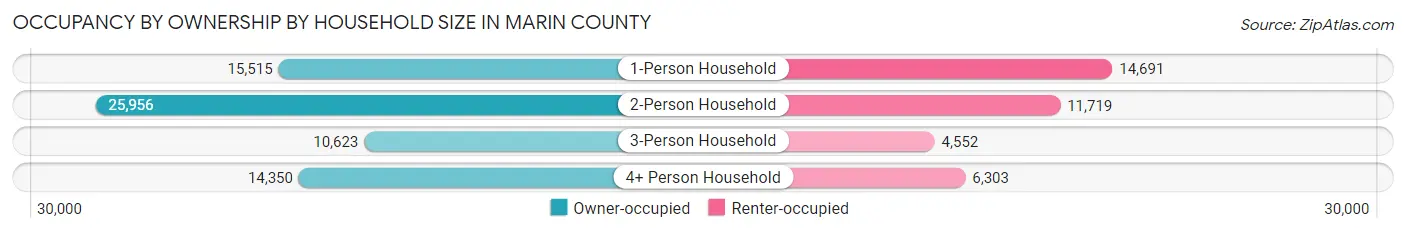
| Household Size | Owner-occupied | Renter-occupied |
| 1-Person Household | 15,515 (51.4%) | 14,691 (48.6%) |
| 2-Person Household | 25,956 (68.9%) | 11,719 (31.1%) |
| 3-Person Household | 10,623 (70.0%) | 4,552 (30.0%) |
| 4+ Person Household | 14,350 (69.5%) | 6,303 (30.5%) |
| Total Housing Units | 66,444 (64.1%) | 37,265 (35.9%) |
Occupancy by Educational Attainment in Marin County
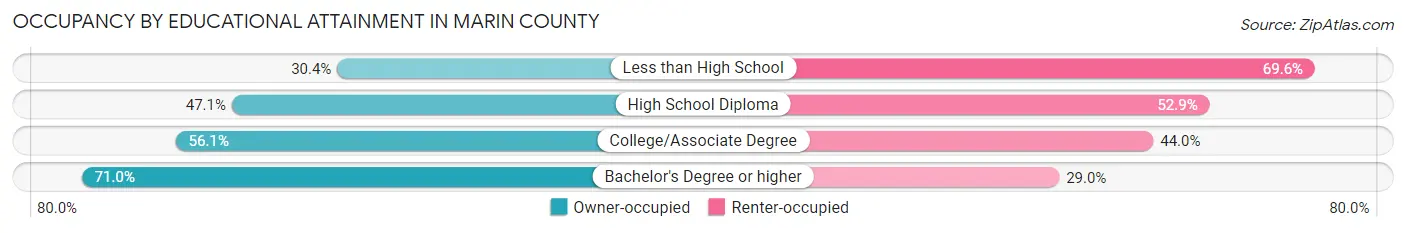
| Household Size | Owner-occupied | Renter-occupied |
| Less than High School | 1,346 (30.4%) | 3,078 (69.6%) |
| High School Diploma | 3,928 (47.1%) | 4,405 (52.9%) |
| College/Associate Degree | 12,698 (56.0%) | 9,956 (44.0%) |
| Bachelor's Degree or higher | 48,472 (71.0%) | 19,826 (29.0%) |
Occupancy by Age of Householder in Marin County
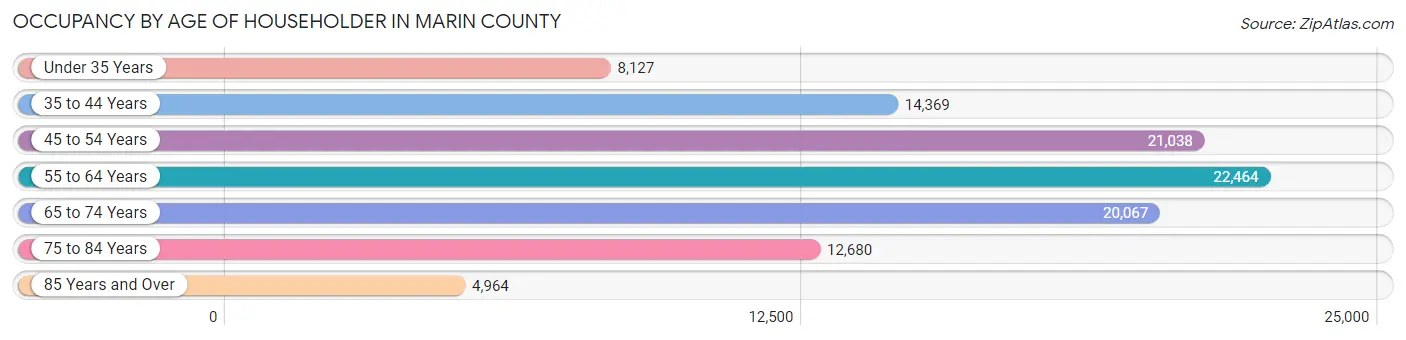
| Age Bracket | # Households | % Households |
| Under 35 Years | 8,127 | 7.8% |
| 35 to 44 Years | 14,369 | 13.9% |
| 45 to 54 Years | 21,038 | 20.3% |
| 55 to 64 Years | 22,464 | 21.7% |
| 65 to 74 Years | 20,067 | 19.4% |
| 75 to 84 Years | 12,680 | 12.2% |
| 85 Years and Over | 4,964 | 4.8% |
| Total | 103,709 | 100.0% |
Housing Finances in Marin County
Median Income by Occupancy in Marin County
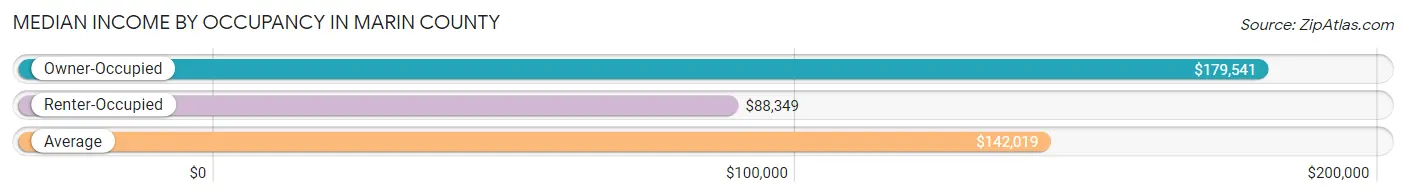
| Occupancy Type | # Households | Median Income |
| Owner-Occupied | 66,444 (64.1%) | $179,541 |
| Renter-Occupied | 37,265 (35.9%) | $88,349 |
| Average | 103,709 (100.0%) | $142,019 |
Occupancy by Householder Income Bracket in Marin County
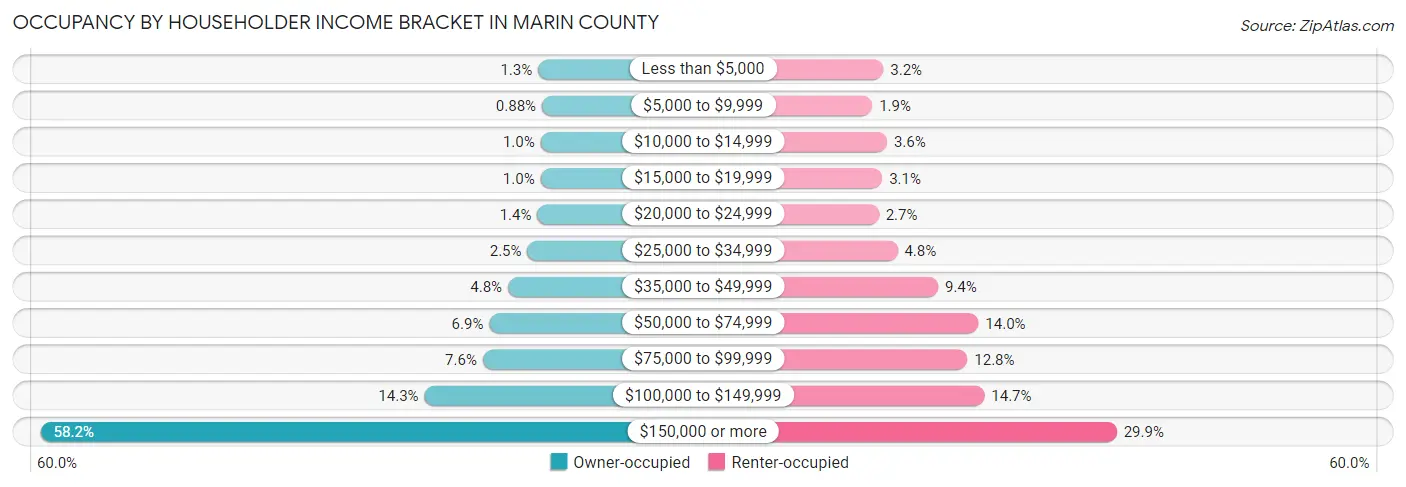
| Income Bracket | Owner-occupied | Renter-occupied |
| Less than $5,000 | 878 (1.3%) | 1,185 (3.2%) |
| $5,000 to $9,999 | 587 (0.9%) | 712 (1.9%) |
| $10,000 to $14,999 | 686 (1.0%) | 1,336 (3.6%) |
| $15,000 to $19,999 | 693 (1.0%) | 1,138 (3.0%) |
| $20,000 to $24,999 | 936 (1.4%) | 987 (2.6%) |
| $25,000 to $34,999 | 1,689 (2.5%) | 1,785 (4.8%) |
| $35,000 to $49,999 | 3,161 (4.8%) | 3,514 (9.4%) |
| $50,000 to $74,999 | 4,585 (6.9%) | 5,233 (14.0%) |
| $75,000 to $99,999 | 5,078 (7.6%) | 4,764 (12.8%) |
| $100,000 to $149,999 | 9,506 (14.3%) | 5,486 (14.7%) |
| $150,000 or more | 38,645 (58.2%) | 11,125 (29.8%) |
| Total | 66,444 (100.0%) | 37,265 (100.0%) |
Monthly Housing Cost Tiers in Marin County
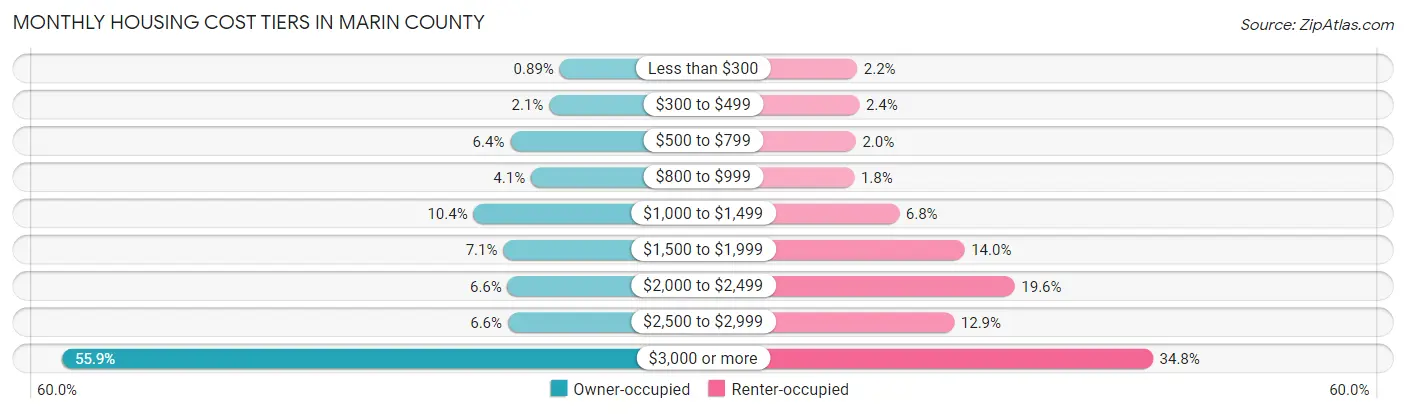
| Monthly Cost | Owner-occupied | Renter-occupied |
| Less than $300 | 594 (0.9%) | 801 (2.1%) |
| $300 to $499 | 1,360 (2.1%) | 886 (2.4%) |
| $500 to $799 | 4,217 (6.4%) | 741 (2.0%) |
| $800 to $999 | 2,696 (4.1%) | 683 (1.8%) |
| $1,000 to $1,499 | 6,917 (10.4%) | 2,529 (6.8%) |
| $1,500 to $1,999 | 4,728 (7.1%) | 5,220 (14.0%) |
| $2,000 to $2,499 | 4,415 (6.6%) | 7,287 (19.6%) |
| $2,500 to $2,999 | 4,393 (6.6%) | 4,792 (12.9%) |
| $3,000 or more | 37,124 (55.9%) | 12,976 (34.8%) |
| Total | 66,444 (100.0%) | 37,265 (100.0%) |
Physical Housing Characteristics in Marin County
Housing Structures in Marin County
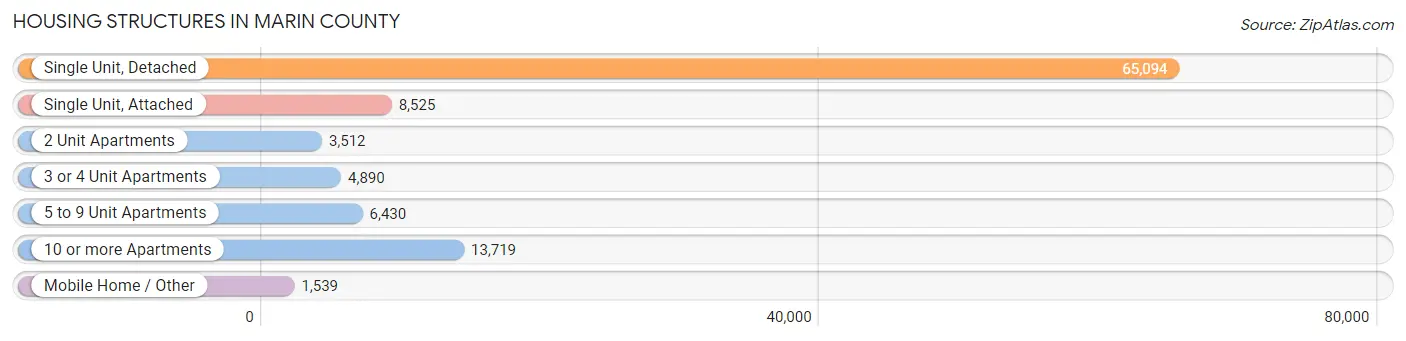
| Structure Type | # Housing Units | % Housing Units |
| Single Unit, Detached | 65,094 | 62.8% |
| Single Unit, Attached | 8,525 | 8.2% |
| 2 Unit Apartments | 3,512 | 3.4% |
| 3 or 4 Unit Apartments | 4,890 | 4.7% |
| 5 to 9 Unit Apartments | 6,430 | 6.2% |
| 10 or more Apartments | 13,719 | 13.2% |
| Mobile Home / Other | 1,539 | 1.5% |
| Total | 103,709 | 100.0% |
Housing Structures by Occupancy in Marin County
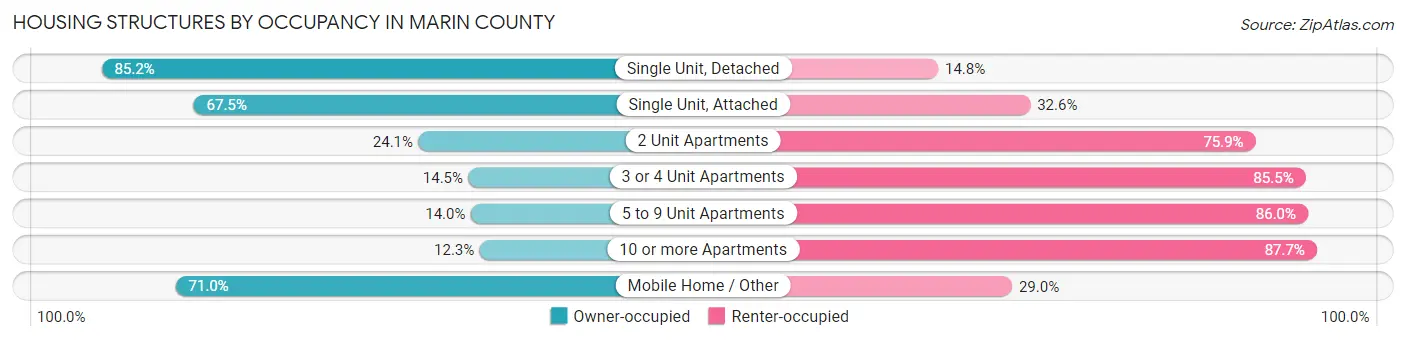
| Structure Type | Owner-occupied | Renter-occupied |
| Single Unit, Detached | 55,462 (85.2%) | 9,632 (14.8%) |
| Single Unit, Attached | 5,750 (67.4%) | 2,775 (32.6%) |
| 2 Unit Apartments | 846 (24.1%) | 2,666 (75.9%) |
| 3 or 4 Unit Apartments | 707 (14.5%) | 4,183 (85.5%) |
| 5 to 9 Unit Apartments | 900 (14.0%) | 5,530 (86.0%) |
| 10 or more Apartments | 1,687 (12.3%) | 12,032 (87.7%) |
| Mobile Home / Other | 1,092 (71.0%) | 447 (29.0%) |
| Total | 66,444 (64.1%) | 37,265 (35.9%) |
Housing Structures by Number of Rooms in Marin County
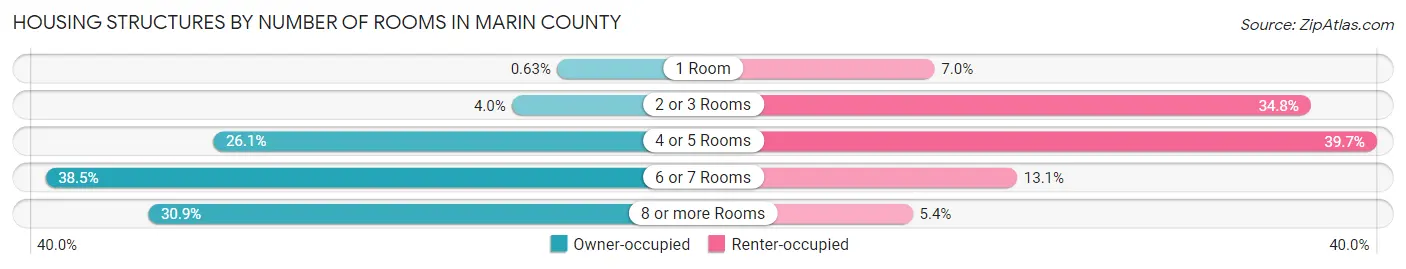
| Number of Rooms | Owner-occupied | Renter-occupied |
| 1 Room | 417 (0.6%) | 2,606 (7.0%) |
| 2 or 3 Rooms | 2,639 (4.0%) | 12,980 (34.8%) |
| 4 or 5 Rooms | 17,317 (26.1%) | 14,797 (39.7%) |
| 6 or 7 Rooms | 25,558 (38.5%) | 4,878 (13.1%) |
| 8 or more Rooms | 20,513 (30.9%) | 2,004 (5.4%) |
| Total | 66,444 (100.0%) | 37,265 (100.0%) |
Housing Structure by Heating Type in Marin County
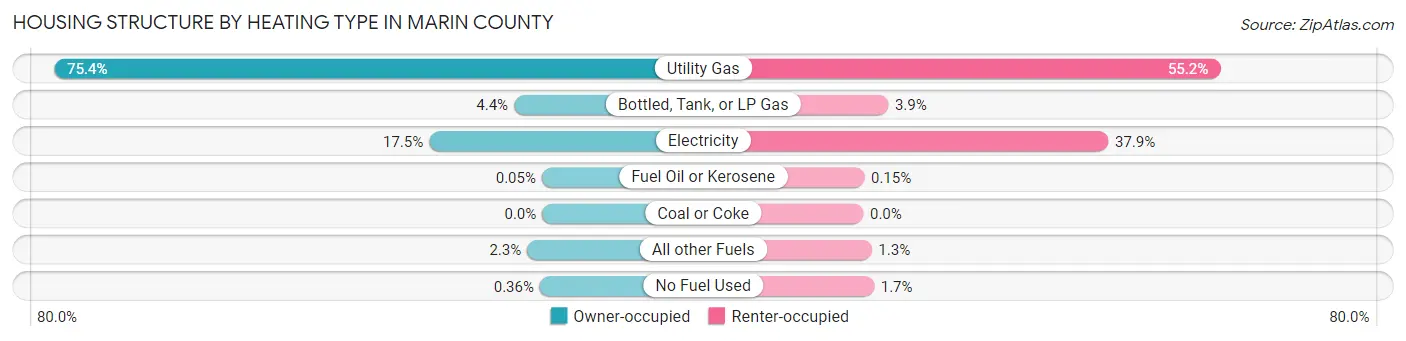
| Heating Type | Owner-occupied | Renter-occupied |
| Utility Gas | 50,124 (75.4%) | 20,560 (55.2%) |
| Bottled, Tank, or LP Gas | 2,889 (4.3%) | 1,436 (3.8%) |
| Electricity | 11,613 (17.5%) | 14,113 (37.9%) |
| Fuel Oil or Kerosene | 30 (0.1%) | 56 (0.2%) |
| Coal or Coke | 0 (0.0%) | 0 (0.0%) |
| All other Fuels | 1,550 (2.3%) | 481 (1.3%) |
| No Fuel Used | 238 (0.4%) | 619 (1.7%) |
| Total | 66,444 (100.0%) | 37,265 (100.0%) |
Household Vehicle Usage in Marin County
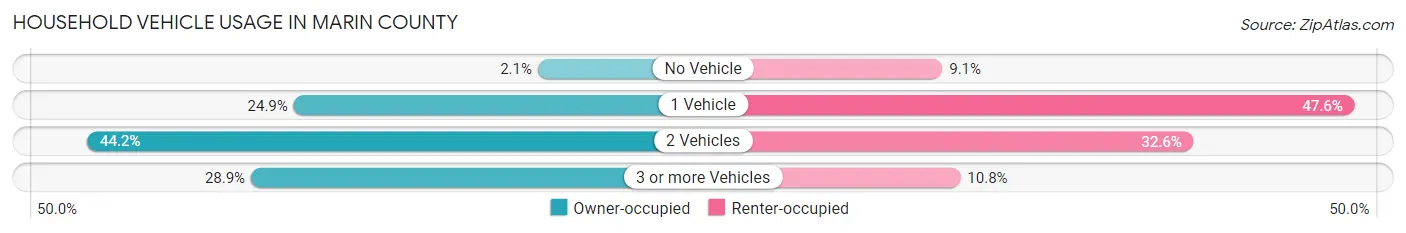
| Vehicles per Household | Owner-occupied | Renter-occupied |
| No Vehicle | 1,389 (2.1%) | 3,386 (9.1%) |
| 1 Vehicle | 16,535 (24.9%) | 17,732 (47.6%) |
| 2 Vehicles | 29,340 (44.2%) | 12,128 (32.6%) |
| 3 or more Vehicles | 19,180 (28.9%) | 4,019 (10.8%) |
| Total | 66,444 (100.0%) | 37,265 (100.0%) |
Real Estate & Mortgages in Marin County
Real Estate and Mortgage Overview in Marin County
| Characteristic | Without Mortgage | With Mortgage |
| Housing Units | 21,318 | 45,126 |
| Median Property Value | $1,165,500 | $1,365,400 |
| Median Household Income | $111,303 | $30,411 |
| Monthly Housing Costs | $1,156 | $35,488 |
| Real Estate Taxes | $6,947 | $397 |
Property Value by Mortgage Status in Marin County
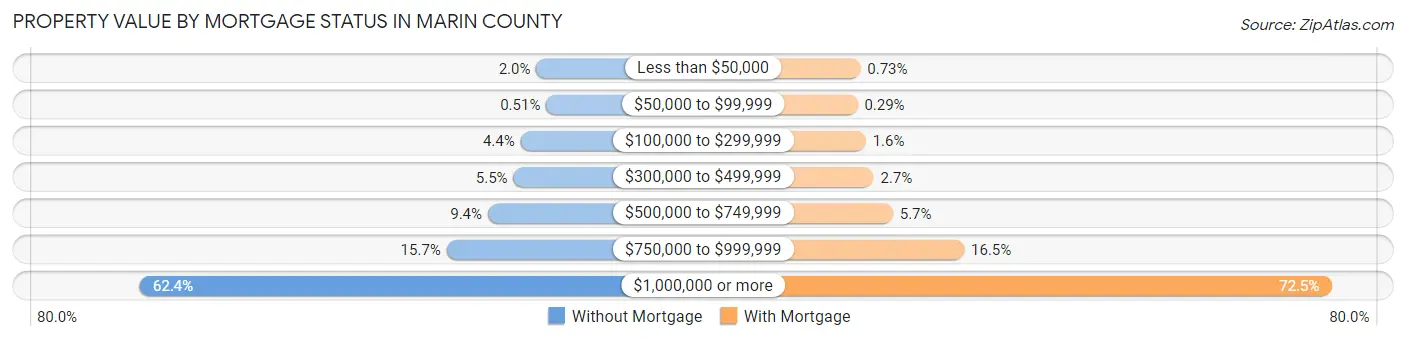
| Property Value | Without Mortgage | With Mortgage |
| Less than $50,000 | 433 (2.0%) | 328 (0.7%) |
| $50,000 to $99,999 | 108 (0.5%) | 131 (0.3%) |
| $100,000 to $299,999 | 942 (4.4%) | 699 (1.5%) |
| $300,000 to $499,999 | 1,174 (5.5%) | 1,237 (2.7%) |
| $500,000 to $749,999 | 2,007 (9.4%) | 2,559 (5.7%) |
| $750,000 to $999,999 | 3,345 (15.7%) | 7,462 (16.5%) |
| $1,000,000 or more | 13,309 (62.4%) | 32,710 (72.5%) |
| Total | 21,318 (100.0%) | 45,126 (100.0%) |
Household Income by Mortgage Status in Marin County
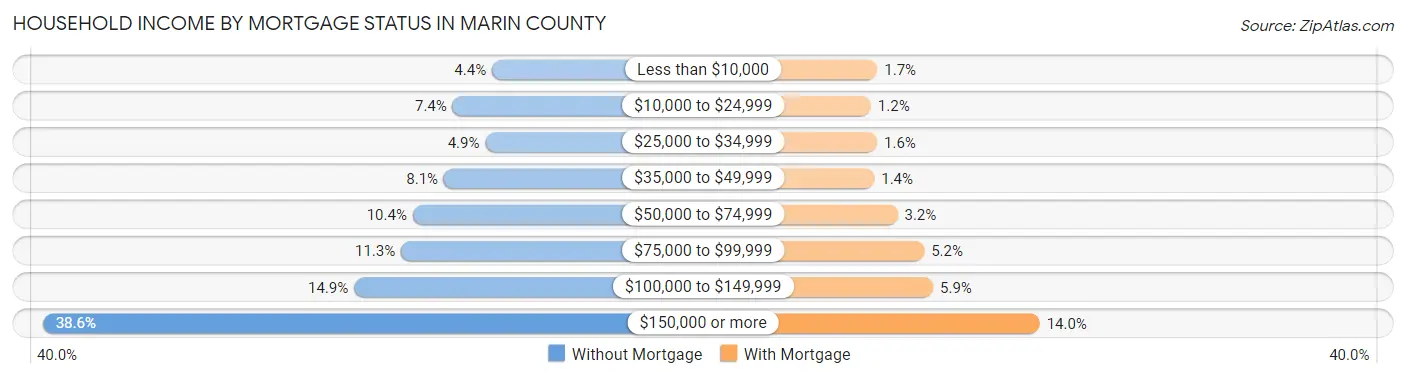
| Household Income | Without Mortgage | With Mortgage |
| Less than $10,000 | 935 (4.4%) | 750 (1.7%) |
| $10,000 to $24,999 | 1,576 (7.4%) | 530 (1.2%) |
| $25,000 to $34,999 | 1,044 (4.9%) | 739 (1.6%) |
| $35,000 to $49,999 | 1,716 (8.1%) | 645 (1.4%) |
| $50,000 to $74,999 | 2,224 (10.4%) | 1,445 (3.2%) |
| $75,000 to $99,999 | 2,413 (11.3%) | 2,361 (5.2%) |
| $100,000 to $149,999 | 3,176 (14.9%) | 2,665 (5.9%) |
| $150,000 or more | 8,234 (38.6%) | 6,330 (14.0%) |
| Total | 21,318 (100.0%) | 45,126 (100.0%) |
Property Value to Household Income Ratio in Marin County
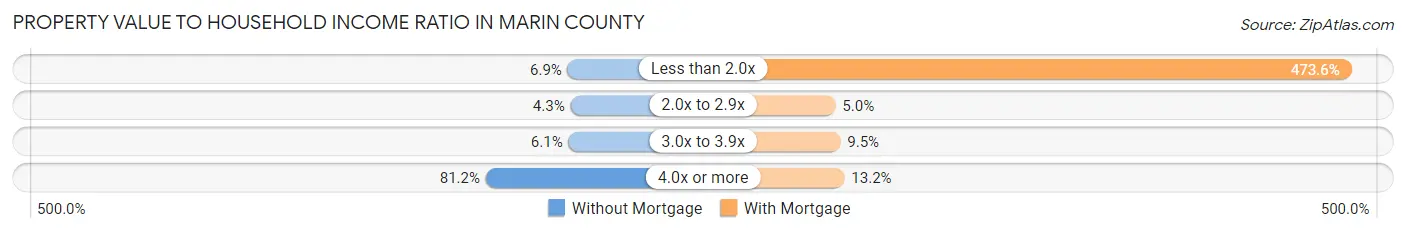
| Value-to-Income Ratio | Without Mortgage | With Mortgage |
| Less than 2.0x | 1,463 (6.9%) | 213,728 (473.6%) |
| 2.0x to 2.9x | 921 (4.3%) | 2,256 (5.0%) |
| 3.0x to 3.9x | 1,304 (6.1%) | 4,263 (9.5%) |
| 4.0x or more | 17,319 (81.2%) | 5,936 (13.2%) |
| Total | 21,318 (100.0%) | 45,126 (100.0%) |
Real Estate Taxes by Mortgage Status in Marin County
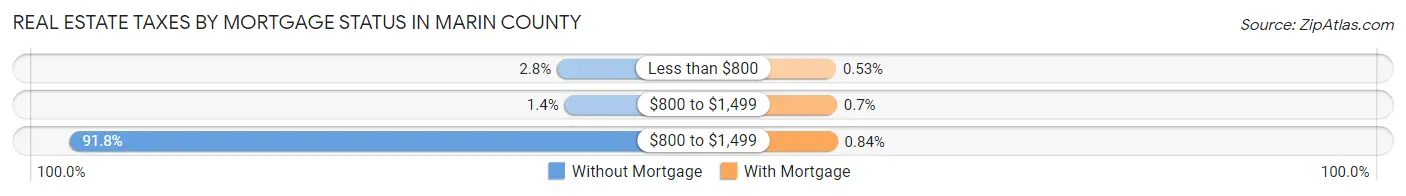
| Property Taxes | Without Mortgage | With Mortgage |
| Less than $800 | 589 (2.8%) | 240 (0.5%) |
| $800 to $1,499 | 297 (1.4%) | 314 (0.7%) |
| $800 to $1,499 | 19,570 (91.8%) | 377 (0.8%) |
| Total | 21,318 (100.0%) | 45,126 (100.0%) |
Health & Disability in Marin County
Health Insurance Coverage by Age in Marin County
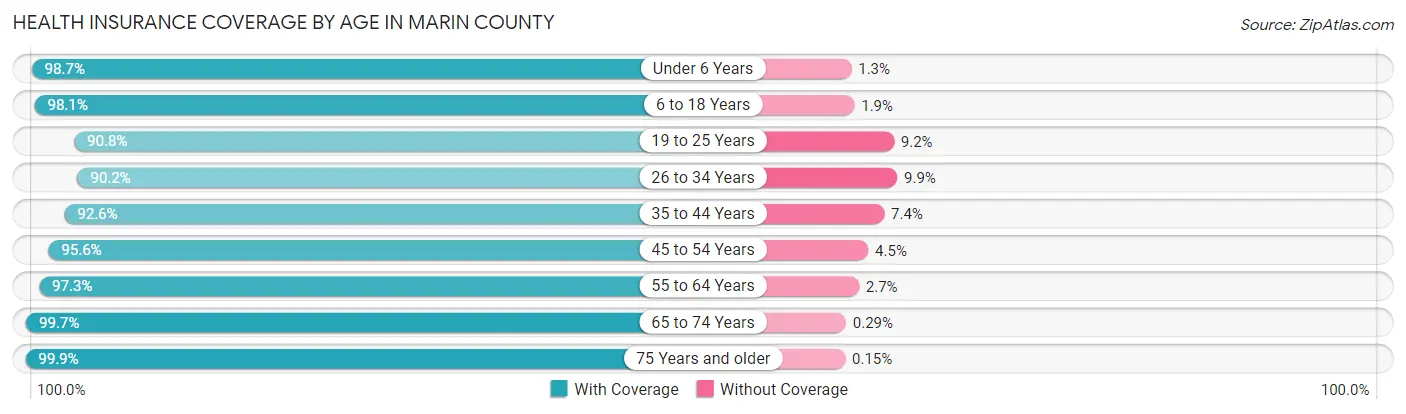
| Age Bracket | With Coverage | Without Coverage |
| Under 6 Years | 13,947 (98.7%) | 184 (1.3%) |
| 6 to 18 Years | 39,576 (98.1%) | 751 (1.9%) |
| 19 to 25 Years | 14,914 (90.8%) | 1,519 (9.2%) |
| 26 to 34 Years | 17,289 (90.1%) | 1,890 (9.9%) |
| 35 to 44 Years | 27,617 (92.6%) | 2,214 (7.4%) |
| 45 to 54 Years | 37,286 (95.6%) | 1,738 (4.4%) |
| 55 to 64 Years | 37,771 (97.3%) | 1,053 (2.7%) |
| 65 to 74 Years | 33,668 (99.7%) | 97 (0.3%) |
| 75 Years and older | 25,521 (99.9%) | 39 (0.2%) |
| Total | 247,589 (96.3%) | 9,485 (3.7%) |
Health Insurance Coverage by Citizenship Status in Marin County
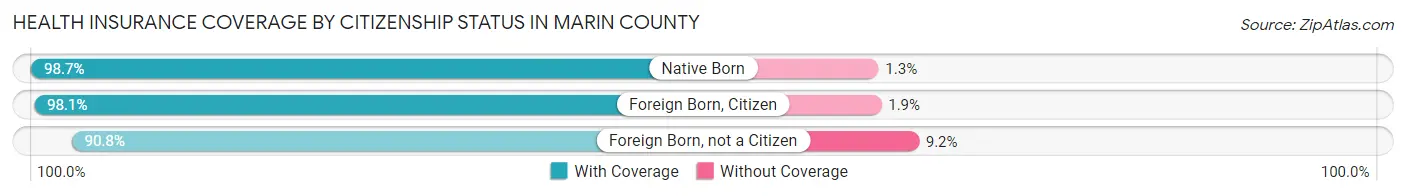
| Citizenship Status | With Coverage | Without Coverage |
| Native Born | 13,947 (98.7%) | 184 (1.3%) |
| Foreign Born, Citizen | 39,576 (98.1%) | 751 (1.9%) |
| Foreign Born, not a Citizen | 14,914 (90.8%) | 1,519 (9.2%) |
Health Insurance Coverage by Household Income in Marin County
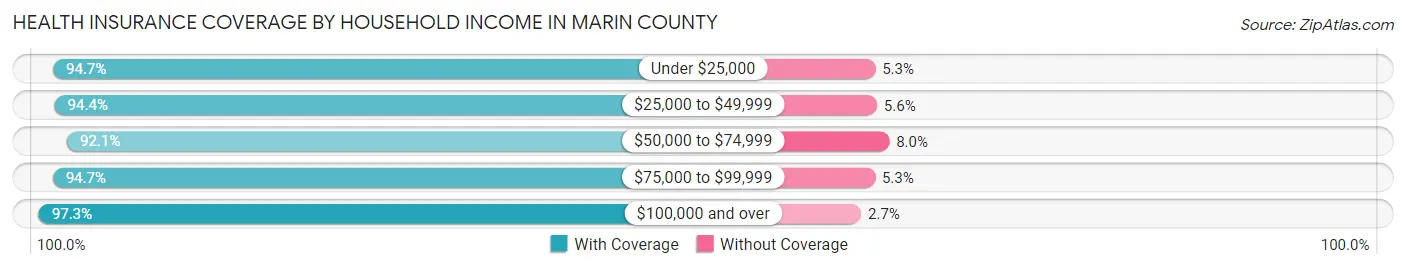
| Household Income | With Coverage | Without Coverage |
| Under $25,000 | 13,334 (94.7%) | 751 (5.3%) |
| $25,000 to $49,999 | 16,562 (94.4%) | 990 (5.6%) |
| $50,000 to $74,999 | 19,474 (92.0%) | 1,683 (8.0%) |
| $75,000 to $99,999 | 20,256 (94.7%) | 1,128 (5.3%) |
| $100,000 and over | 174,514 (97.3%) | 4,803 (2.7%) |
Public vs Private Health Insurance Coverage by Age in Marin County
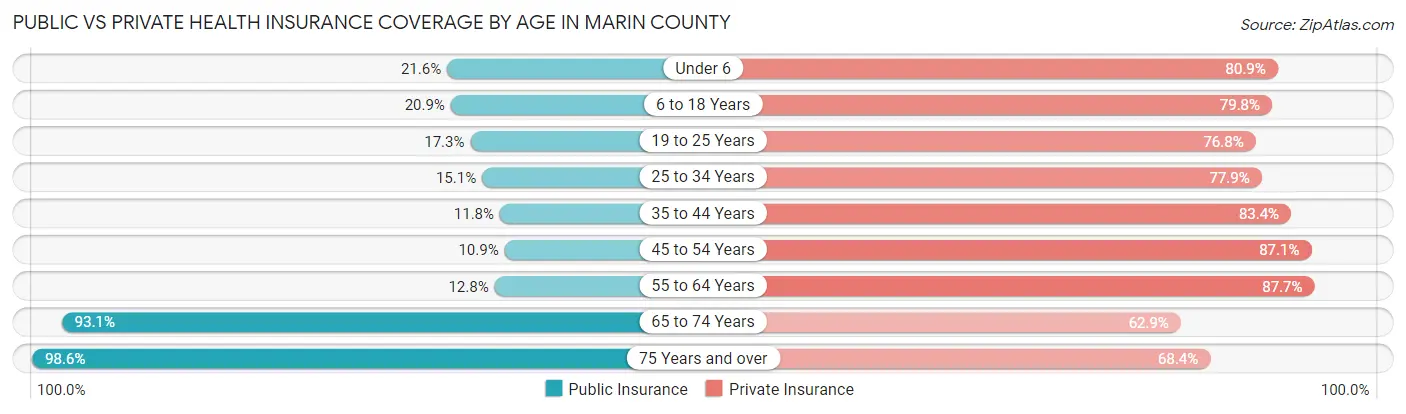
| Age Bracket | Public Insurance | Private Insurance |
| Under 6 | 3,053 (21.6%) | 11,431 (80.9%) |
| 6 to 18 Years | 8,434 (20.9%) | 32,189 (79.8%) |
| 19 to 25 Years | 2,838 (17.3%) | 12,618 (76.8%) |
| 25 to 34 Years | 2,896 (15.1%) | 14,943 (77.9%) |
| 35 to 44 Years | 3,515 (11.8%) | 24,867 (83.4%) |
| 45 to 54 Years | 4,265 (10.9%) | 34,001 (87.1%) |
| 55 to 64 Years | 4,961 (12.8%) | 34,052 (87.7%) |
| 65 to 74 Years | 31,443 (93.1%) | 21,237 (62.9%) |
| 75 Years and over | 25,207 (98.6%) | 17,473 (68.4%) |
| Total | 86,612 (33.7%) | 202,811 (78.9%) |
Disability Status by Sex by Age in Marin County
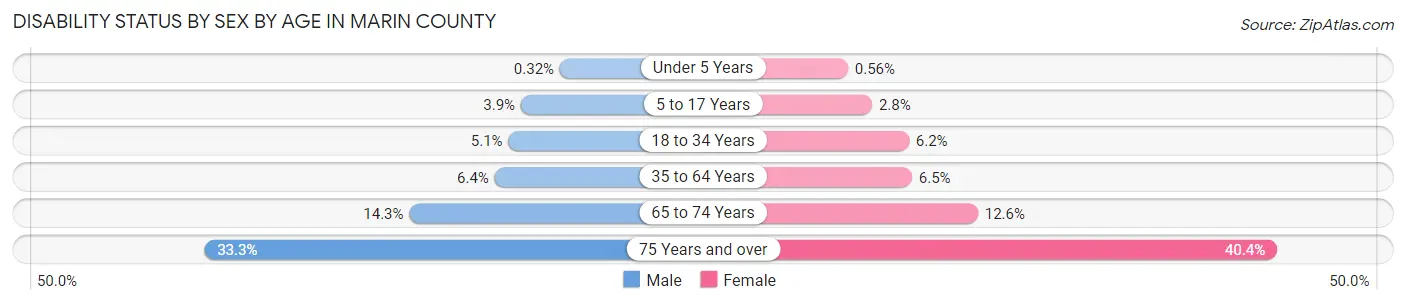
| Age Bracket | Male | Female |
| Under 5 Years | 19 (0.3%) | 31 (0.6%) |
| 5 to 17 Years | 790 (3.9%) | 543 (2.8%) |
| 18 to 34 Years | 1,023 (5.1%) | 1,191 (6.2%) |
| 35 to 64 Years | 3,361 (6.4%) | 3,567 (6.5%) |
| 65 to 74 Years | 2,211 (14.3%) | 2,308 (12.6%) |
| 75 Years and over | 3,619 (33.3%) | 5,937 (40.4%) |
Disability Class by Sex by Age in Marin County
Disability Class: Hearing Difficulty
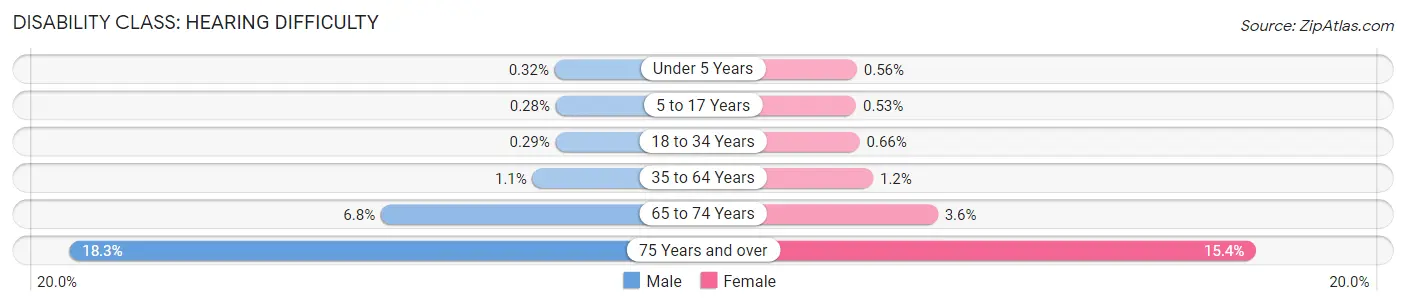
| Age Bracket | Male | Female |
| Under 5 Years | 19 (0.3%) | 31 (0.6%) |
| 5 to 17 Years | 56 (0.3%) | 103 (0.5%) |
| 18 to 34 Years | 59 (0.3%) | 127 (0.7%) |
| 35 to 64 Years | 603 (1.1%) | 639 (1.2%) |
| 65 to 74 Years | 1,047 (6.8%) | 651 (3.6%) |
| 75 Years and over | 1,992 (18.3%) | 2,261 (15.4%) |
Disability Class: Vision Difficulty
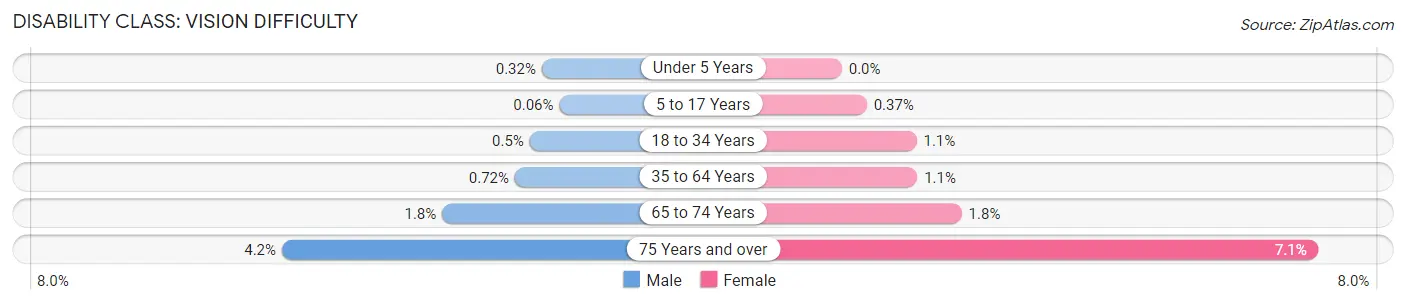
| Age Bracket | Male | Female |
| Under 5 Years | 19 (0.3%) | 0 (0.0%) |
| 5 to 17 Years | 13 (0.1%) | 72 (0.4%) |
| 18 to 34 Years | 100 (0.5%) | 212 (1.1%) |
| 35 to 64 Years | 382 (0.7%) | 614 (1.1%) |
| 65 to 74 Years | 278 (1.8%) | 326 (1.8%) |
| 75 Years and over | 454 (4.2%) | 1,041 (7.1%) |
Disability Class: Cognitive Difficulty
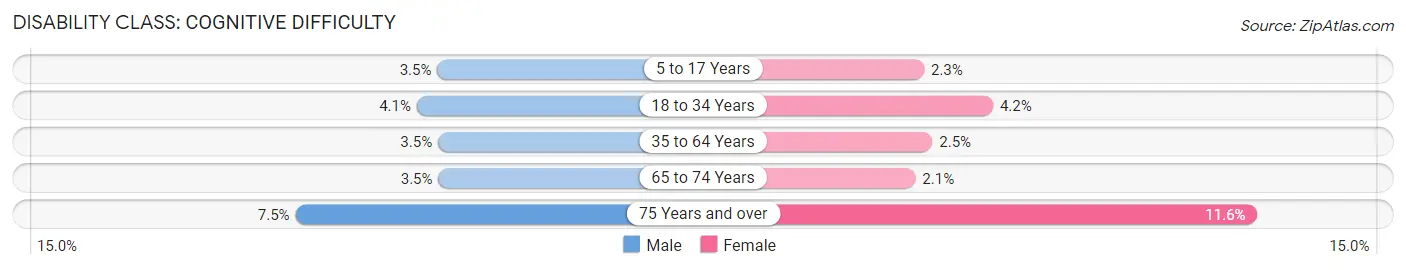
| Age Bracket | Male | Female |
| 5 to 17 Years | 704 (3.5%) | 445 (2.3%) |
| 18 to 34 Years | 818 (4.1%) | 806 (4.2%) |
| 35 to 64 Years | 1,842 (3.5%) | 1,385 (2.5%) |
| 65 to 74 Years | 539 (3.5%) | 375 (2.1%) |
| 75 Years and over | 810 (7.5%) | 1,701 (11.6%) |
Disability Class: Ambulatory Difficulty
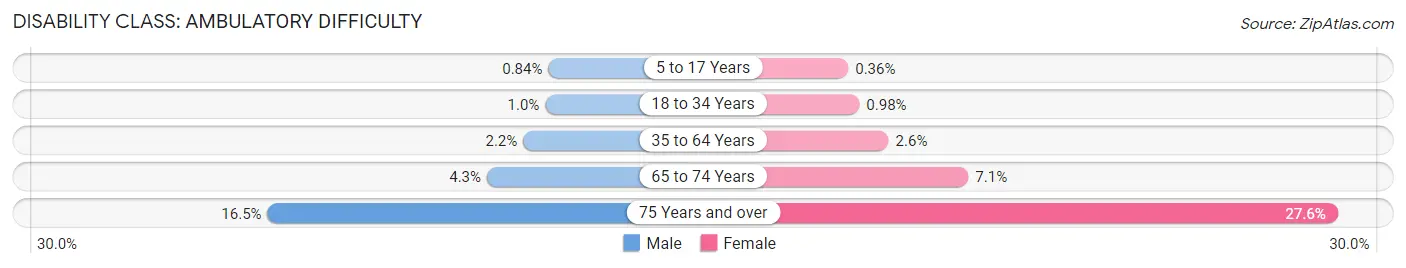
| Age Bracket | Male | Female |
| 5 to 17 Years | 168 (0.8%) | 69 (0.4%) |
| 18 to 34 Years | 202 (1.0%) | 188 (1.0%) |
| 35 to 64 Years | 1,180 (2.2%) | 1,435 (2.6%) |
| 65 to 74 Years | 660 (4.3%) | 1,289 (7.0%) |
| 75 Years and over | 1,790 (16.5%) | 4,059 (27.6%) |
Disability Class: Self-Care Difficulty
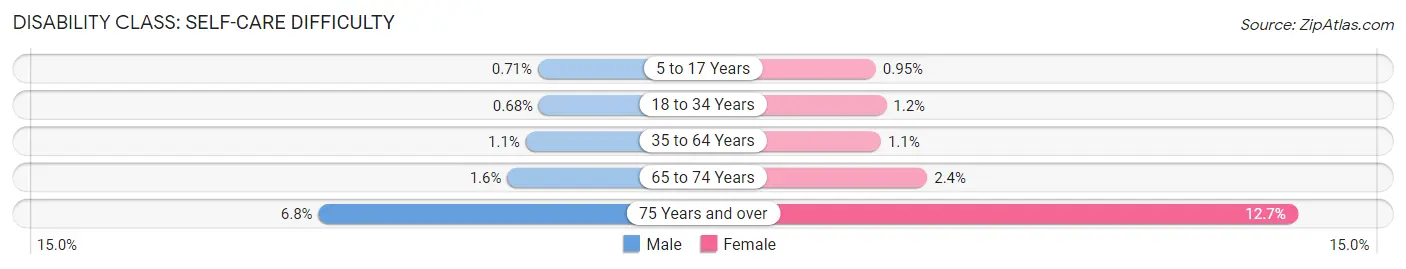
| Age Bracket | Male | Female |
| 5 to 17 Years | 142 (0.7%) | 184 (0.9%) |
| 18 to 34 Years | 136 (0.7%) | 238 (1.2%) |
| 35 to 64 Years | 552 (1.1%) | 600 (1.1%) |
| 65 to 74 Years | 241 (1.6%) | 435 (2.4%) |
| 75 Years and over | 741 (6.8%) | 1,866 (12.7%) |
Technology Access in Marin County
Computing Device Access in Marin County
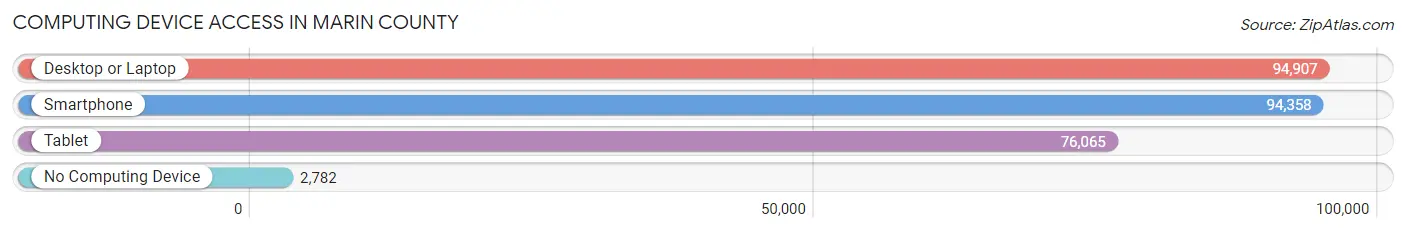
| Device Type | # Households | % Households |
| Desktop or Laptop | 94,907 | 91.5% |
| Smartphone | 94,358 | 91.0% |
| Tablet | 76,065 | 73.3% |
| No Computing Device | 2,782 | 2.7% |
| Total | 103,709 | 100.0% |
Internet Access in Marin County
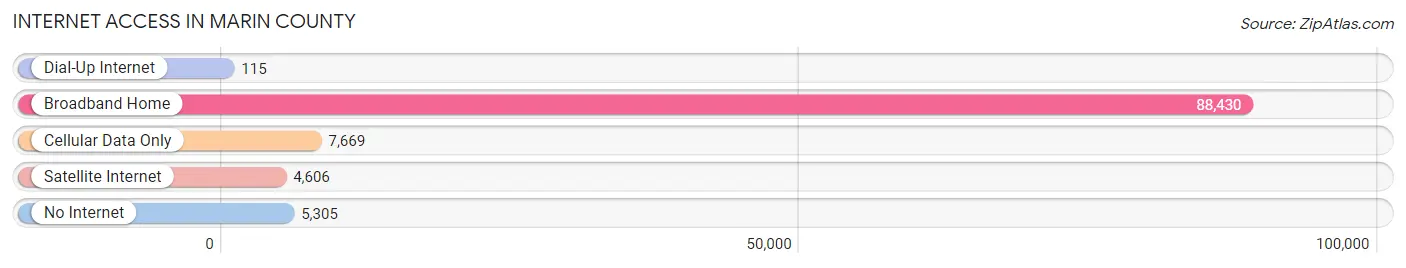
| Internet Type | # Households | % Households |
| Dial-Up Internet | 115 | 0.1% |
| Broadband Home | 88,430 | 85.3% |
| Cellular Data Only | 7,669 | 7.4% |
| Satellite Internet | 4,606 | 4.4% |
| No Internet | 5,305 | 5.1% |
| Total | 103,709 | 100.0% |
Marin County Summary
Marin County, California is a county located in the San Francisco Bay Area of the U.S. state of California. It is the smallest county in the state, with a population of approximately 250,000 people. The county seat is San Rafael. Marin County is known for its natural beauty, with its rolling hills, redwood forests, and coastal views. It is also known for its high quality of life, with its excellent schools, low crime rate, and vibrant cultural and recreational opportunities.
Geography
Marin County is located in the North Bay region of the San Francisco Bay Area, just north of San Francisco. It is bordered by Sonoma County to the north, Napa County to the east, San Francisco Bay to the south, and the Pacific Ocean to the west. The county covers an area of 828 square miles, with a population density of about 300 people per square mile. The county is divided into two distinct regions: the coastal region, which is characterized by its rugged coastline and redwood forests, and the inland region, which is characterized by its rolling hills and oak woodlands.
The county is home to several state and national parks, including Point Reyes National Seashore, Muir Woods National Monument, and Mount Tamalpais State Park. The county also contains several lakes, including Alpine Lake, Lake Lagunitas, and Lake Nicasio.
History
Marin County was first inhabited by Native Americans, including the Coast Miwok and the Pomo. The first Europeans to explore the area were Spanish explorers, who arrived in the late 1700s. The area was later claimed by Mexico, and then by the United States in 1846.
In 1850, Marin County was established as one of California's original 27 counties. The county was named after Chief Marin, a Native American leader of the Coast Miwok tribe. The county seat was established in San Rafael in 1872.
In the late 1800s, Marin County became a popular destination for wealthy San Franciscans, who built large estates in the area. The county also became a popular tourist destination, with its scenic coastline and redwood forests.
Economy
Marin County has a diverse economy, with a mix of industries including technology, finance, healthcare, tourism, and retail. The county is home to several major employers, including Autodesk, BioMarin Pharmaceutical, and Kaiser Permanente.
The county's largest industry is tourism, with visitors drawn to its scenic coastline and redwood forests. The county is also home to several wineries, which attract visitors from around the world.
Demographics
As of the 2010 census, Marin County had a population of 252,409. The racial makeup of the county was 77.2% White, 8.3% Asian, 6.3% Hispanic or Latino, 4.2% African American, and 0.7% Native American.
The median household income in Marin County was $90,890 in 2019, and the median home value was $1,072,400. The county has a high rate of educational attainment, with 91.3% of adults over the age of 25 having at least a high school diploma and 63.2% having a bachelor's degree or higher.
Marin County is known for its high quality of life, with its excellent schools, low crime rate, and vibrant cultural and recreational opportunities. It is also known for its natural beauty, with its rolling hills, redwood forests, and coastal views.
Common Questions
What is the Total Population of Marin County?
Total Population of Marin County is 260,485.
What is the Total Male Population of Marin County?
Total Male Population of Marin County is 127,983.
What is the Total Female Population of Marin County?
Total Female Population of Marin County is 132,502.
What is the Ratio of Males per 100 Females in Marin County?
There are 96.59 Males per 100 Females in Marin County.
What is the Ratio of Females per 100 Males in Marin County?
There are 103.53 Females per 100 Males in Marin County.
What is the Median Population Age in Marin County?
Median Population Age in Marin County is 47.4 Years.
What is the Average Family Size in Marin County
Average Family Size in Marin County is 3.0 People.
What is the Average Household Size in Marin County
Average Household Size in Marin County is 2.5 People.
What is Per Capita Income in Marin County?
Per Capita income in Marin County is $87,300.
What is the Median Family Income in Marin County?
Median Family Income in Marin County is $185,883.
What is the Median Household income in Marin County?
Median Household Income in Marin County is $142,019.
What is Income or Wage Gap in Marin County?
Income or Wage Gap in Marin County is 33.4%.
Women in Marin County earn 66.6 cents for every dollar earned by a man.
What is Family Income Deficit in Marin County?
Family Income Deficit in Marin County is $11,561.
Families that are below poverty line in Marin County earn $11,561 less on average than the poverty threshold level.
What is Inequality or Gini Index in Marin County?
Inequality or Gini Index in Marin County is 0.52.
How Large is the Labor Force in Marin County?
There are 137,061 People in the Labor Forcein in Marin County.
What is the Percentage of People in the Labor Force in Marin County?
63.3% of People are in the Labor Force in Marin County.
What is the Unemployment Rate in Marin County?
Unemployment Rate in Marin County is 5.8%.