Bostonia, CA
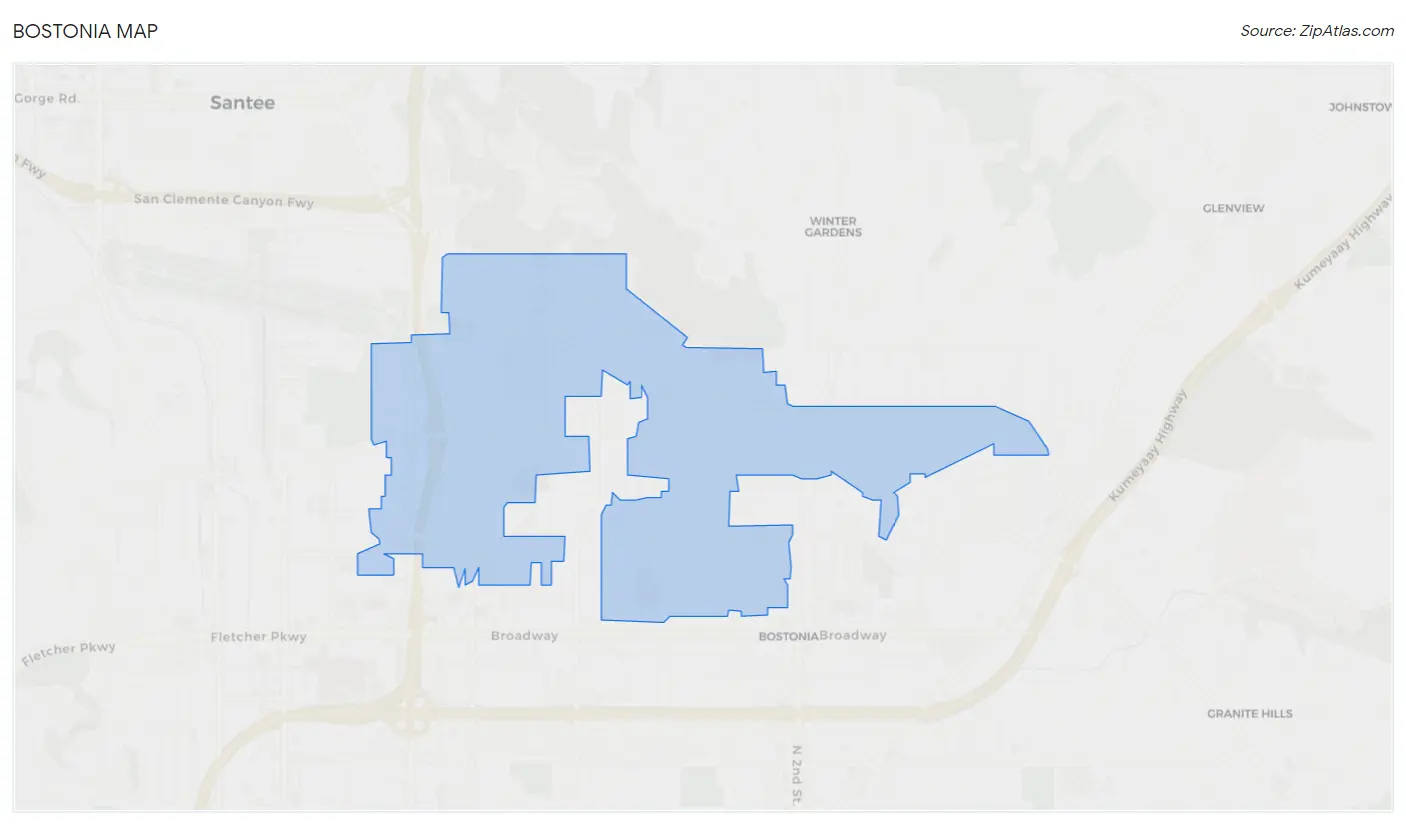
Bostonia Map
Bostonia Overview
16,850
TOTAL POPULATION
8,024
MALE POPULATION
8,826
FEMALE POPULATION
90.91
MALES / 100 FEMALES
110.00
FEMALES / 100 MALES
33.4
MEDIAN AGE
3.5
AVG FAMILY SIZE
2.9
AVG HOUSEHOLD SIZE
$31,020
PER CAPITA INCOME
$86,984
AVG FAMILY INCOME
$73,305
AVG HOUSEHOLD INCOME
25.4%
WAGE / INCOME GAP [ % ]
74.6¢/ $1
WAGE / INCOME GAP [ $ ]
$9,164
FAMILY INCOME DEFICIT
0.43
INEQUALITY / GINI INDEX
8,773
LABOR FORCE [ PEOPLE ]
66.5%
PERCENT IN LABOR FORCE
8.6%
UNEMPLOYMENT RATE
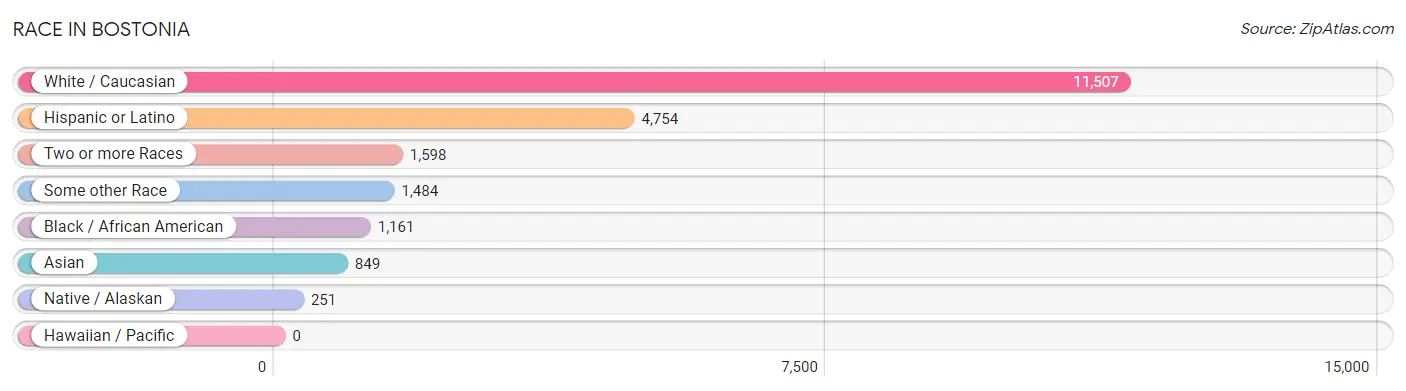
Race in Bostonia
The most populous races in Bostonia are White / Caucasian (11,507 | 68.3%), Hispanic or Latino (4,754 | 28.2%), and Two or more Races (1,598 | 9.5%).
| Race | # Population | % Population |
| Asian | 849 | 5.0% |
| Black / African American | 1,161 | 6.9% |
| Hawaiian / Pacific | 0 | 0.0% |
| Hispanic or Latino | 4,754 | 28.2% |
| Native / Alaskan | 251 | 1.5% |
| White / Caucasian | 11,507 | 68.3% |
| Two or more Races | 1,598 | 9.5% |
| Some other Race | 1,484 | 8.8% |
| Total | 16,850 | 100.0% |
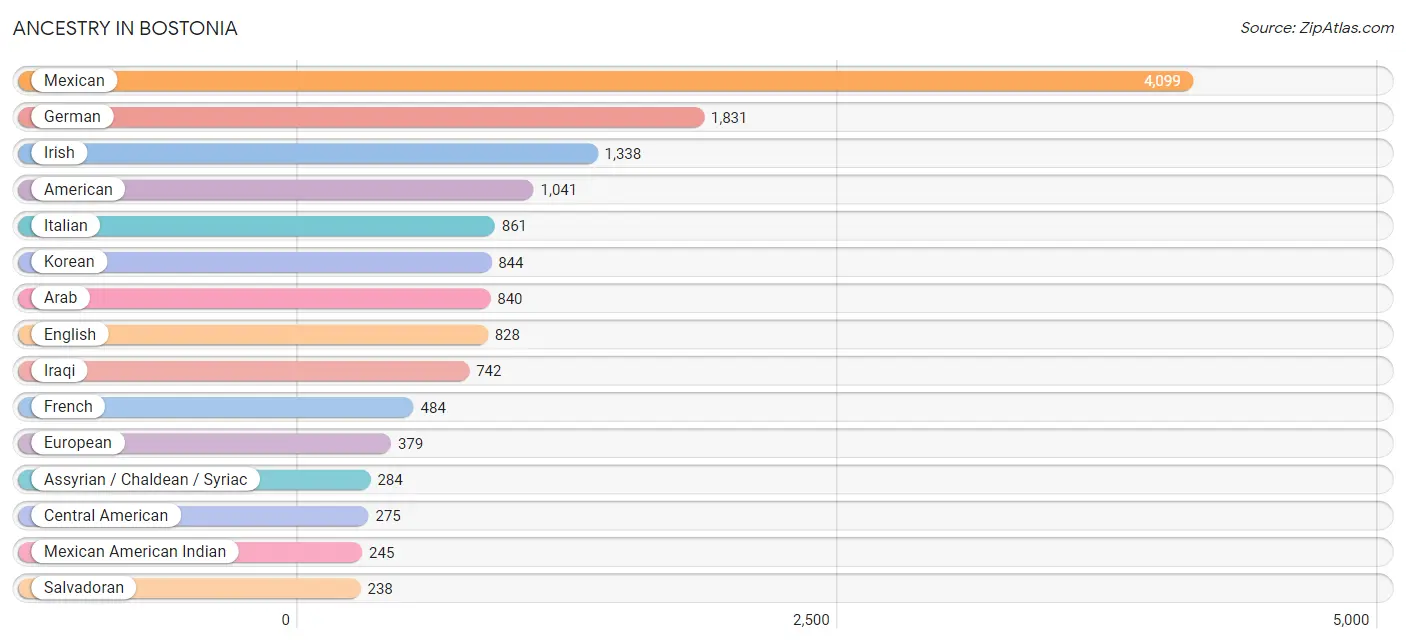
Ancestry in Bostonia
The most populous ancestries reported in Bostonia are Mexican (4,099 | 24.3%), German (1,831 | 10.9%), Irish (1,338 | 7.9%), American (1,041 | 6.2%), and Italian (861 | 5.1%), together accounting for 54.4% of all Bostonia residents.
| Ancestry | # Population | % Population |
| African | 74 | 0.4% |
| American | 1,041 | 6.2% |
| Apache | 9 | 0.1% |
| Arab | 840 | 5.0% |
| Assyrian / Chaldean / Syriac | 284 | 1.7% |
| Austrian | 14 | 0.1% |
| Belgian | 19 | 0.1% |
| Bhutanese | 77 | 0.5% |
| British | 105 | 0.6% |
| Burmese | 115 | 0.7% |
| Canadian | 28 | 0.2% |
| Central American | 275 | 1.6% |
| Cherokee | 67 | 0.4% |
| Chilean | 22 | 0.1% |
| Choctaw | 7 | 0.0% |
| Cree | 55 | 0.3% |
| Czechoslovakian | 42 | 0.3% |
| Danish | 31 | 0.2% |
| Dutch | 86 | 0.5% |
| Eastern European | 22 | 0.1% |
| English | 828 | 4.9% |
| European | 379 | 2.2% |
| Finnish | 52 | 0.3% |
| French | 484 | 2.9% |
| French Canadian | 27 | 0.2% |
| German | 1,831 | 10.9% |
| Guatemalan | 19 | 0.1% |
| Haitian | 29 | 0.2% |
| Honduran | 18 | 0.1% |
| Hungarian | 160 | 0.9% |
| Indian (Asian) | 206 | 1.2% |
| Iraqi | 742 | 4.4% |
| Irish | 1,338 | 7.9% |
| Iroquois | 16 | 0.1% |
| Italian | 861 | 5.1% |
| Jamaican | 40 | 0.2% |
| Korean | 844 | 5.0% |
| Latvian | 7 | 0.0% |
| Lebanese | 51 | 0.3% |
| Mexican | 4,099 | 24.3% |
| Mexican American Indian | 245 | 1.5% |
| Native Hawaiian | 40 | 0.2% |
| Northern European | 20 | 0.1% |
| Norwegian | 202 | 1.2% |
| Palestinian | 8 | 0.1% |
| Polish | 218 | 1.3% |
| Portuguese | 46 | 0.3% |
| Puerto Rican | 68 | 0.4% |
| Russian | 91 | 0.5% |
| Salvadoran | 238 | 1.4% |
| Scandinavian | 45 | 0.3% |
| Scotch-Irish | 56 | 0.3% |
| Scottish | 90 | 0.5% |
| Serbian | 20 | 0.1% |
| Sioux | 55 | 0.3% |
| South American | 22 | 0.1% |
| Spaniard | 87 | 0.5% |
| Subsaharan African | 74 | 0.4% |
| Swedish | 82 | 0.5% |
| Swiss | 109 | 0.6% |
| Ukrainian | 39 | 0.2% |
| Welsh | 108 | 0.6% |
| Yugoslavian | 20 | 0.1% | View All 63 Rows |
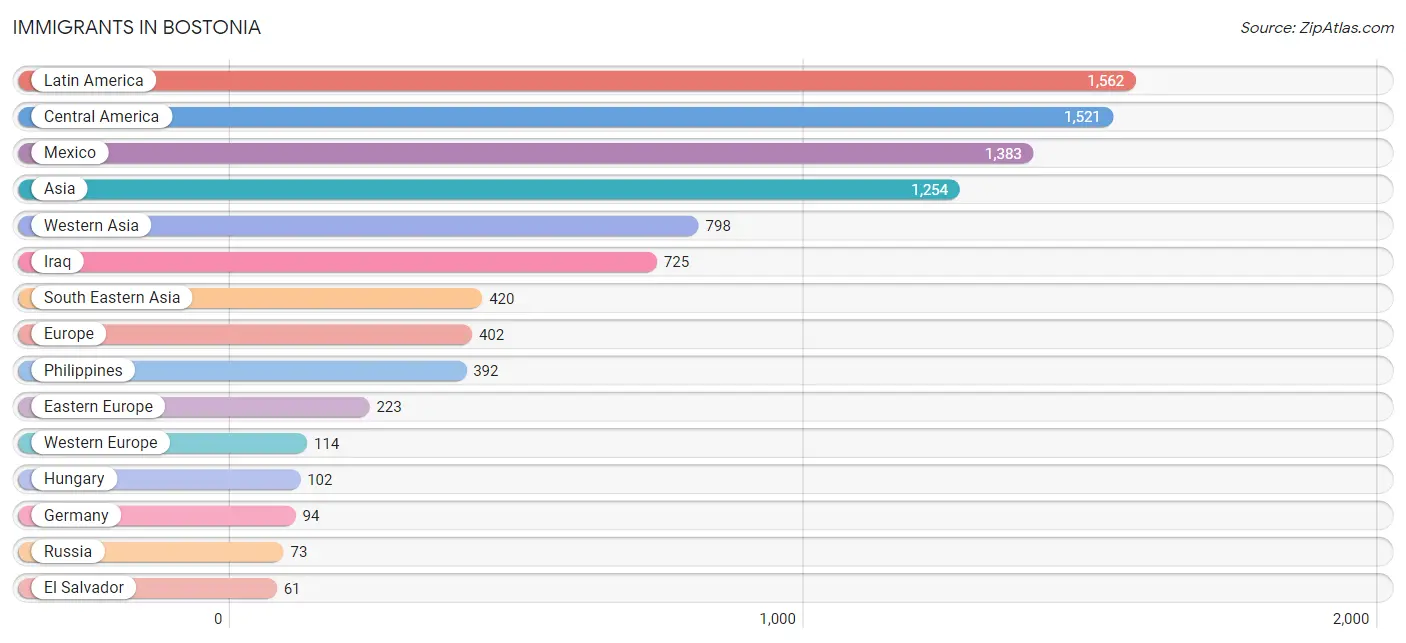
Immigrants in Bostonia
The most numerous immigrant groups reported in Bostonia came from Latin America (1,562 | 9.3%), Central America (1,521 | 9.0%), Mexico (1,383 | 8.2%), Asia (1,254 | 7.4%), and Western Asia (798 | 4.7%), together accounting for 38.7% of all Bostonia residents.
| Immigration Origin | # Population | % Population |
| Asia | 1,254 | 7.4% |
| Austria | 20 | 0.1% |
| Caribbean | 19 | 0.1% |
| Central America | 1,521 | 9.0% |
| Chile | 22 | 0.1% |
| China | 36 | 0.2% |
| Eastern Asia | 36 | 0.2% |
| Eastern Europe | 223 | 1.3% |
| El Salvador | 61 | 0.4% |
| England | 21 | 0.1% |
| Europe | 402 | 2.4% |
| Germany | 94 | 0.6% |
| Greece | 11 | 0.1% |
| Guatemala | 25 | 0.2% |
| Hungary | 102 | 0.6% |
| Indonesia | 28 | 0.2% |
| Iraq | 725 | 4.3% |
| Ireland | 33 | 0.2% |
| Israel | 8 | 0.1% |
| Jamaica | 19 | 0.1% |
| Jordan | 16 | 0.1% |
| Latin America | 1,562 | 9.3% |
| Lebanon | 49 | 0.3% |
| Mexico | 1,383 | 8.2% |
| Nicaragua | 52 | 0.3% |
| Northern Europe | 54 | 0.3% |
| Philippines | 392 | 2.3% |
| Poland | 48 | 0.3% |
| Russia | 73 | 0.4% |
| South America | 22 | 0.1% |
| South Eastern Asia | 420 | 2.5% |
| Southern Europe | 11 | 0.1% |
| Taiwan | 19 | 0.1% |
| Western Asia | 798 | 4.7% |
| Western Europe | 114 | 0.7% | View All 35 Rows |
Sex and Age in Bostonia
Sex and Age in Bostonia
The most populous age groups in Bostonia are 30 to 34 Years (815 | 10.2%) for men and 25 to 29 Years (871 | 9.9%) for women.
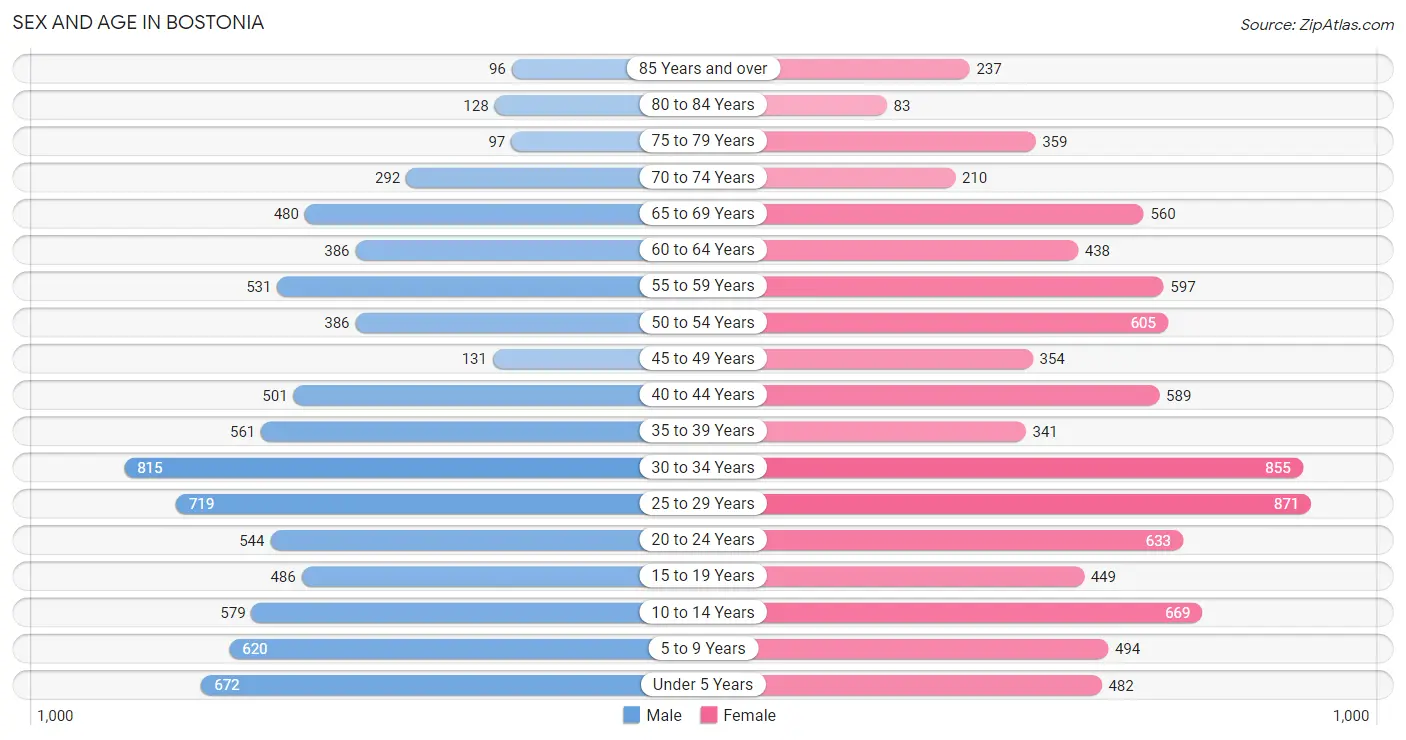
| Age Bracket | Male | Female |
| Under 5 Years | 672 (8.4%) | 482 (5.5%) |
| 5 to 9 Years | 620 (7.7%) | 494 (5.6%) |
| 10 to 14 Years | 579 (7.2%) | 669 (7.6%) |
| 15 to 19 Years | 486 (6.1%) | 449 (5.1%) |
| 20 to 24 Years | 544 (6.8%) | 633 (7.2%) |
| 25 to 29 Years | 719 (9.0%) | 871 (9.9%) |
| 30 to 34 Years | 815 (10.2%) | 855 (9.7%) |
| 35 to 39 Years | 561 (7.0%) | 341 (3.9%) |
| 40 to 44 Years | 501 (6.2%) | 589 (6.7%) |
| 45 to 49 Years | 131 (1.6%) | 354 (4.0%) |
| 50 to 54 Years | 386 (4.8%) | 605 (6.9%) |
| 55 to 59 Years | 531 (6.6%) | 597 (6.8%) |
| 60 to 64 Years | 386 (4.8%) | 438 (5.0%) |
| 65 to 69 Years | 480 (6.0%) | 560 (6.3%) |
| 70 to 74 Years | 292 (3.6%) | 210 (2.4%) |
| 75 to 79 Years | 97 (1.2%) | 359 (4.1%) |
| 80 to 84 Years | 128 (1.6%) | 83 (0.9%) |
| 85 Years and over | 96 (1.2%) | 237 (2.7%) |
| Total | 8,024 (100.0%) | 8,826 (100.0%) |
Families and Households in Bostonia
Median Family Size in Bostonia
The median family size in Bostonia is 3.47 persons per family, with married-couple families (2,378 | 61.2%) accounting for the largest median family size of 3.78 persons per family. On the other hand, single male/father families (521 | 13.4%) represent the smallest median family size with 2.64 persons per family.
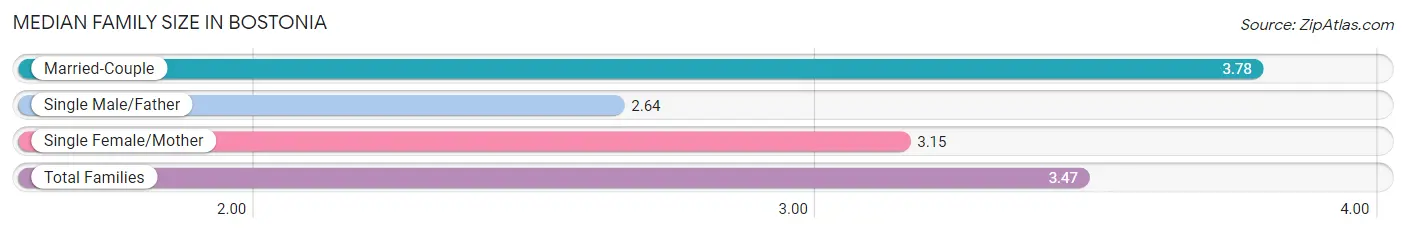
| Family Type | # Families | Family Size |
| Married-Couple | 2,378 (61.2%) | 3.78 |
| Single Male/Father | 521 (13.4%) | 2.64 |
| Single Female/Mother | 988 (25.4%) | 3.15 |
| Total Families | 3,887 (100.0%) | 3.47 |
Median Household Size in Bostonia
The median household size in Bostonia is 2.91 persons per household, with married-couple households (2,378 | 41.4%) accounting for the largest median household size of 3.83 persons per household. non-family households (1,861 | 32.4%) represent the smallest median household size with 1.42 persons per household.
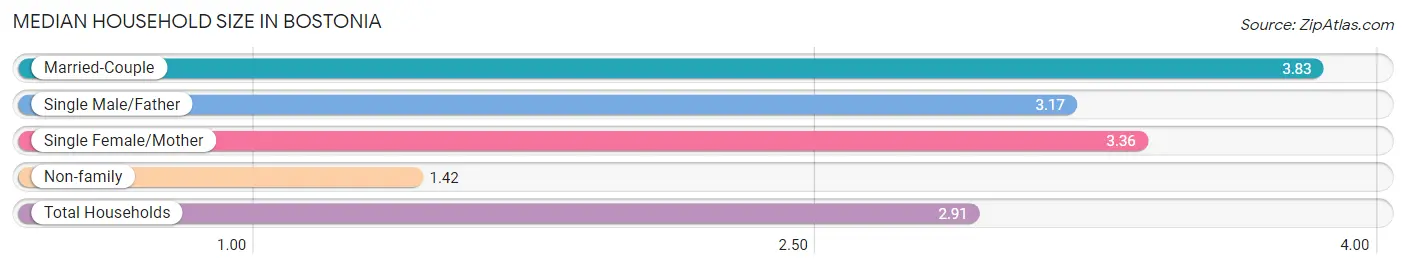
| Household Type | # Households | Household Size |
| Married-Couple | 2,378 (41.4%) | 3.83 |
| Single Male/Father | 521 (9.1%) | 3.17 |
| Single Female/Mother | 988 (17.2%) | 3.36 |
| Non-family | 1,861 (32.4%) | 1.42 |
| Total Households | 5,748 (100.0%) | 2.91 |
Household Size by Marriage Status in Bostonia
Out of a total of 5,748 households in Bostonia, 3,887 (67.6%) are family households, while 1,861 (32.4%) are nonfamily households. The most numerous type of family households are 2-person households, comprising 1,185, and the most common type of nonfamily households are 1-person households, comprising 1,259.
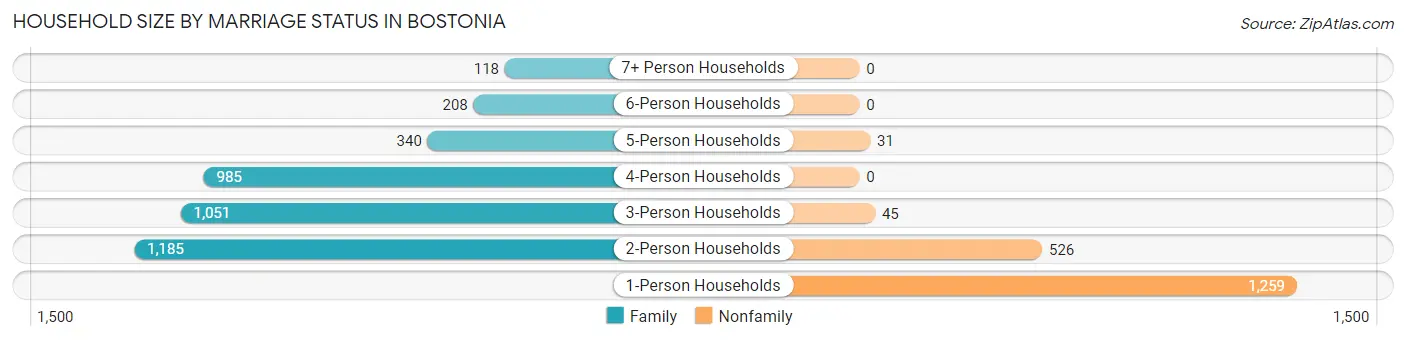
| Household Size | Family Households | Nonfamily Households |
| 1-Person Households | - | 1,259 (21.9%) |
| 2-Person Households | 1,185 (20.6%) | 526 (9.1%) |
| 3-Person Households | 1,051 (18.3%) | 45 (0.8%) |
| 4-Person Households | 985 (17.1%) | 0 (0.0%) |
| 5-Person Households | 340 (5.9%) | 31 (0.5%) |
| 6-Person Households | 208 (3.6%) | 0 (0.0%) |
| 7+ Person Households | 118 (2.1%) | 0 (0.0%) |
| Total | 3,887 (67.6%) | 1,861 (32.4%) |
Female Fertility in Bostonia
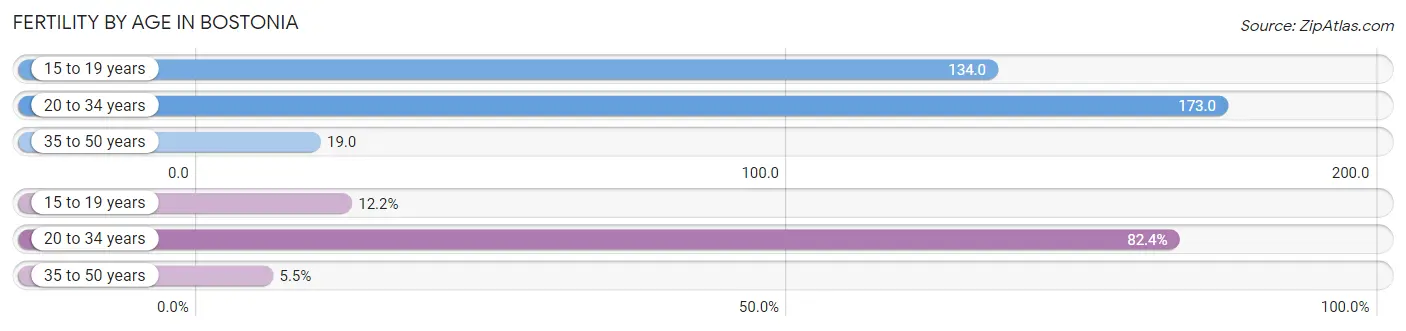
Fertility by Age in Bostonia
Average fertility rate in Bostonia is 117.0 births per 1,000 women. Women in the age bracket of 20 to 34 years have the highest fertility rate with 173.0 births per 1,000 women. Women in the age bracket of 20 to 34 years acount for 82.4% of all women with births.
| Age Bracket | Women with Births | Births / 1,000 Women |
| 15 to 19 years | 60 (12.1%) | 134.0 |
| 20 to 34 years | 407 (82.4%) | 173.0 |
| 35 to 50 years | 27 (5.5%) | 19.0 |
| Total | 494 (100.0%) | 117.0 |
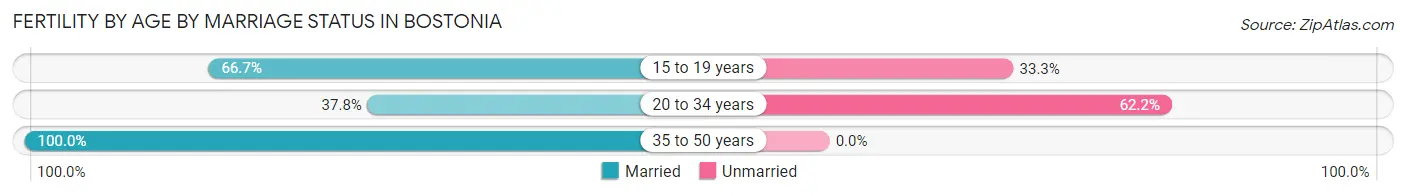
Fertility by Age by Marriage Status in Bostonia
44.7% of women with births (494) in Bostonia are married. The highest percentage of unmarried women with births falls into 20 to 34 years age bracket with 62.2% of them unmarried at the time of birth, while the lowest percentage of unmarried women with births belong to 35 to 50 years age bracket with 0.0% of them unmarried.
| Age Bracket | Married | Unmarried |
| 15 to 19 years | 40 (66.7%) | 20 (33.3%) |
| 20 to 34 years | 154 (37.8%) | 253 (62.2%) |
| 35 to 50 years | 27 (100.0%) | 0 (0.0%) |
| Total | 221 (44.7%) | 273 (55.3%) |
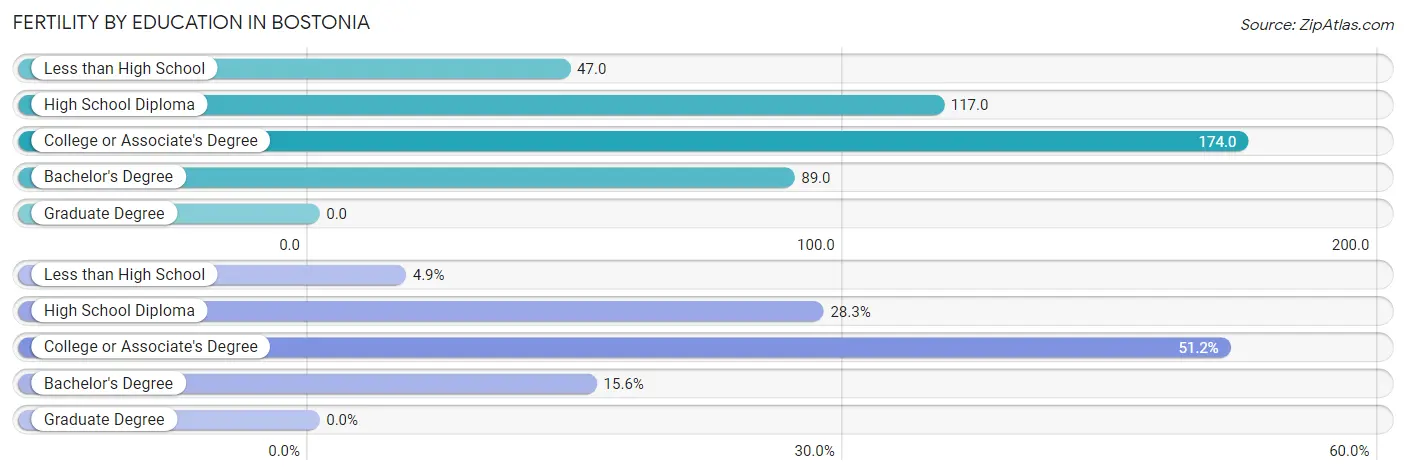
Fertility by Education in Bostonia
| Educational Attainment | Women with Births | Births / 1,000 Women |
| Less than High School | 24 (4.9%) | 47.0 |
| High School Diploma | 140 (28.3%) | 117.0 |
| College or Associate's Degree | 253 (51.2%) | 174.0 |
| Bachelor's Degree | 77 (15.6%) | 89.0 |
| Graduate Degree | 0 (0.0%) | 0.0 |
| Total | 494 (100.0%) | 117.0 |
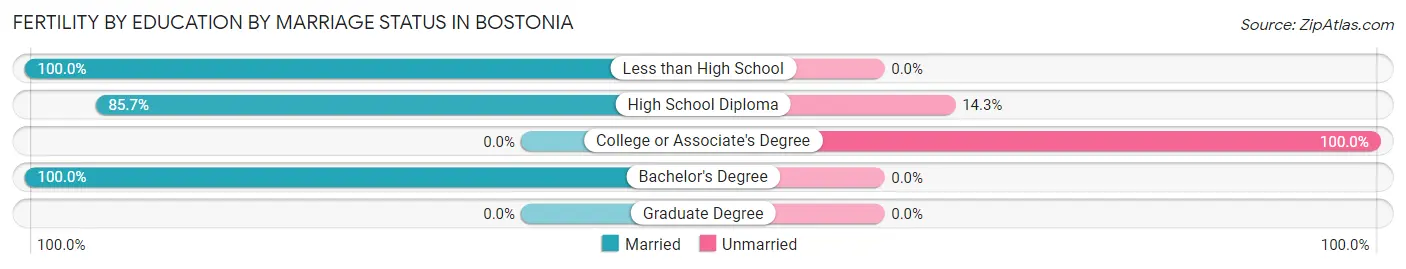
Fertility by Education by Marriage Status in Bostonia
55.3% of women with births in Bostonia are unmarried. Women with the educational attainment of less than high school are most likely to be married with 100.0% of them married at childbirth, while women with the educational attainment of college or associate's degree are least likely to be married with 100.0% of them unmarried at childbirth.
| Educational Attainment | Married | Unmarried |
| Less than High School | 24 (100.0%) | 0 (0.0%) |
| High School Diploma | 120 (85.7%) | 20 (14.3%) |
| College or Associate's Degree | 0 (0.0%) | 253 (100.0%) |
| Bachelor's Degree | 77 (100.0%) | 0 (0.0%) |
| Graduate Degree | 0 (0.0%) | 0 (0.0%) |
| Total | 221 (44.7%) | 273 (55.3%) |
Income in Bostonia
Income Overview in Bostonia
Per Capita Income in Bostonia is $31,020, while median incomes of families and households are $86,984 and $73,305 respectively.
| Characteristic | Number | Measure |
| Per Capita Income | 16,850 | $31,020 |
| Median Family Income | 3,887 | $86,984 |
| Mean Family Income | 3,887 | $102,482 |
| Median Household Income | 5,748 | $73,305 |
| Mean Household Income | 5,748 | $88,313 |
| Income Deficit | 3,887 | $9,164 |
| Wage / Income Gap (%) | 16,850 | 25.44% |
| Wage / Income Gap ($) | 16,850 | 74.56¢ per $1 |
| Gini / Inequality Index | 16,850 | 0.43 |
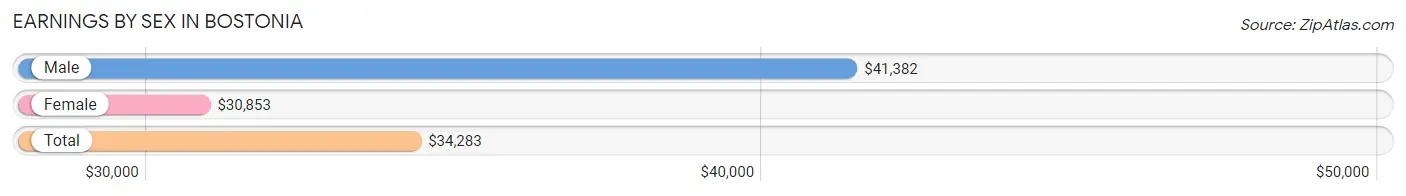
Earnings by Sex in Bostonia
Average Earnings in Bostonia are $34,283, $41,382 for men and $30,853 for women, a difference of 25.4%.
| Sex | Number | Average Earnings |
| Male | 4,428 (51.4%) | $41,382 |
| Female | 4,189 (48.6%) | $30,853 |
| Total | 8,617 (100.0%) | $34,283 |
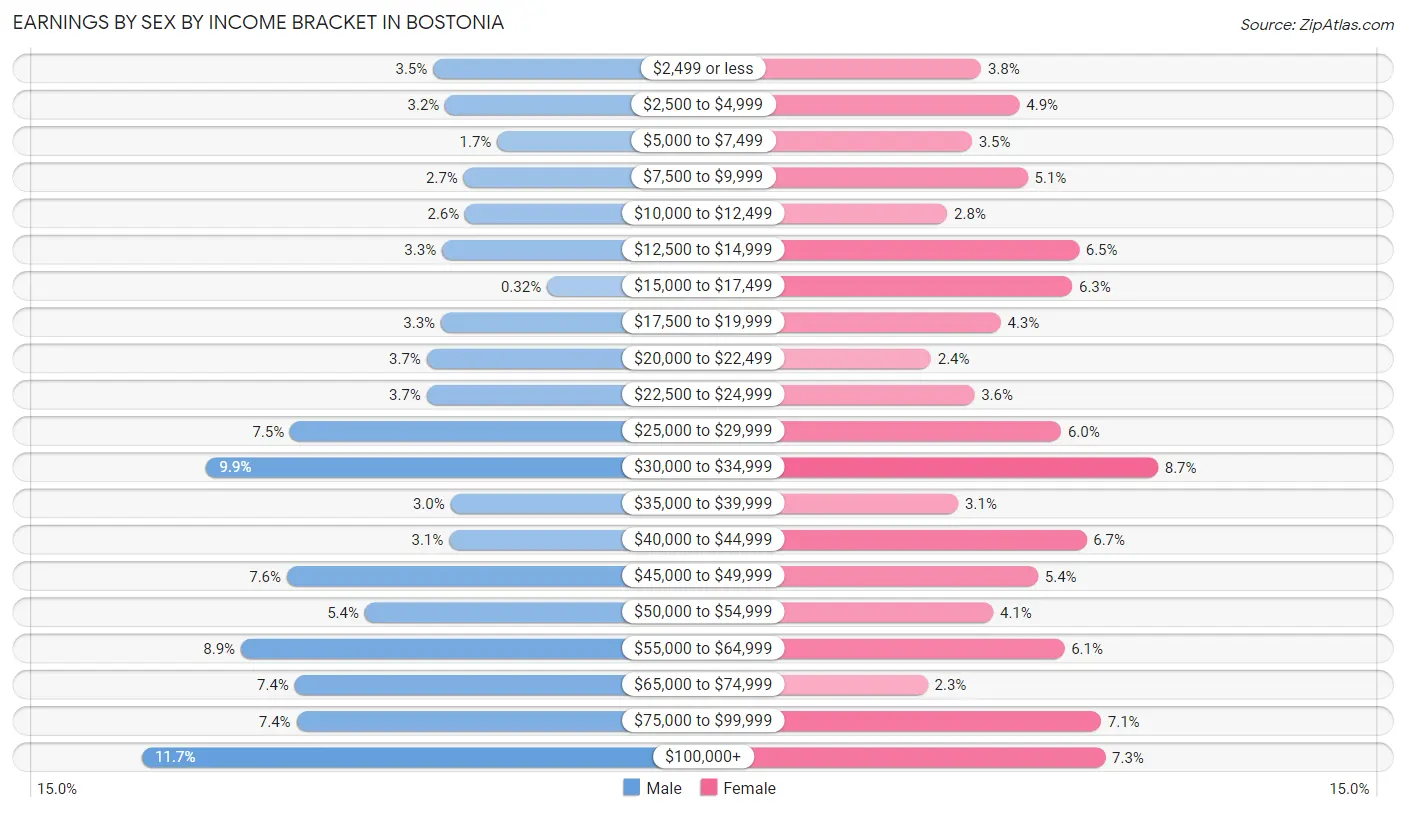
Earnings by Sex by Income Bracket in Bostonia
The most common earnings brackets in Bostonia are $100,000+ for men (518 | 11.7%) and $30,000 to $34,999 for women (366 | 8.7%).
| Income | Male | Female |
| $2,499 or less | 156 (3.5%) | 158 (3.8%) |
| $2,500 to $4,999 | 141 (3.2%) | 203 (4.9%) |
| $5,000 to $7,499 | 76 (1.7%) | 147 (3.5%) |
| $7,500 to $9,999 | 118 (2.7%) | 213 (5.1%) |
| $10,000 to $12,499 | 116 (2.6%) | 118 (2.8%) |
| $12,500 to $14,999 | 145 (3.3%) | 273 (6.5%) |
| $15,000 to $17,499 | 14 (0.3%) | 265 (6.3%) |
| $17,500 to $19,999 | 146 (3.3%) | 181 (4.3%) |
| $20,000 to $22,499 | 164 (3.7%) | 99 (2.4%) |
| $22,500 to $24,999 | 164 (3.7%) | 150 (3.6%) |
| $25,000 to $29,999 | 334 (7.5%) | 252 (6.0%) |
| $30,000 to $34,999 | 438 (9.9%) | 366 (8.7%) |
| $35,000 to $39,999 | 134 (3.0%) | 131 (3.1%) |
| $40,000 to $44,999 | 136 (3.1%) | 282 (6.7%) |
| $45,000 to $49,999 | 338 (7.6%) | 225 (5.4%) |
| $50,000 to $54,999 | 241 (5.4%) | 172 (4.1%) |
| $55,000 to $64,999 | 395 (8.9%) | 256 (6.1%) |
| $65,000 to $74,999 | 328 (7.4%) | 95 (2.3%) |
| $75,000 to $99,999 | 326 (7.4%) | 299 (7.1%) |
| $100,000+ | 518 (11.7%) | 304 (7.3%) |
| Total | 4,428 (100.0%) | 4,189 (100.0%) |
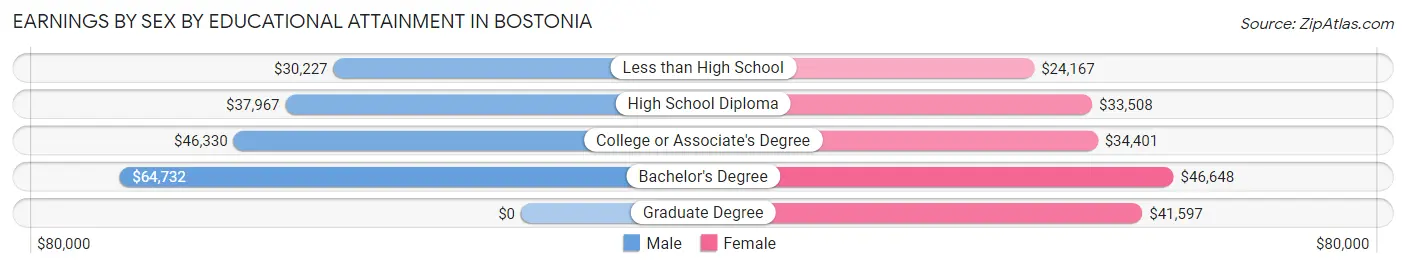
Earnings by Sex by Educational Attainment in Bostonia
Average earnings in Bostonia are $45,140 for men and $33,807 for women, a difference of 25.1%. Men with an educational attainment of bachelor's degree enjoy the highest average annual earnings of $64,732, while those with less than high school education earn the least with $30,227. Women with an educational attainment of bachelor's degree earn the most with the average annual earnings of $46,648, while those with less than high school education have the smallest earnings of $24,167.
| Educational Attainment | Male Income | Female Income |
| Less than High School | $30,227 | $24,167 |
| High School Diploma | $37,967 | $33,508 |
| College or Associate's Degree | $46,330 | $34,401 |
| Bachelor's Degree | $64,732 | $46,648 |
| Graduate Degree | - | - |
| Total | $45,140 | $33,807 |
Family Income in Bostonia
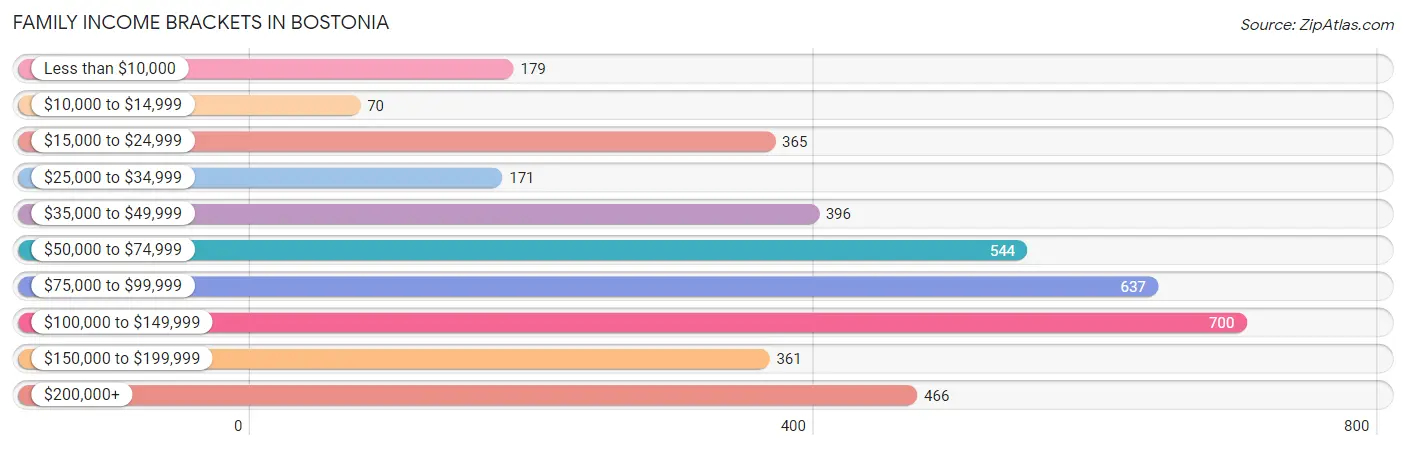
Family Income Brackets in Bostonia
According to the Bostonia family income data, there are 700 families falling into the $100,000 to $149,999 income range, which is the most common income bracket and makes up 18.0% of all families. Conversely, the $10,000 to $14,999 income bracket is the least frequent group with only 70 families (1.8%) belonging to this category.
| Income Bracket | # Families | % Families |
| Less than $10,000 | 179 | 4.6% |
| $10,000 to $14,999 | 70 | 1.8% |
| $15,000 to $24,999 | 365 | 9.4% |
| $25,000 to $34,999 | 171 | 4.4% |
| $35,000 to $49,999 | 396 | 10.2% |
| $50,000 to $74,999 | 544 | 14.0% |
| $75,000 to $99,999 | 637 | 16.4% |
| $100,000 to $149,999 | 700 | 18.0% |
| $150,000 to $199,999 | 361 | 9.3% |
| $200,000+ | 466 | 12.0% |
Family Income by Famaliy Size in Bostonia
7+ person families (99 | 2.5%) account for the highest median family income in Bostonia with $125,893 per family, while 2-person families (1,444 | 37.1%) have the highest median income of $30,304 per family member.
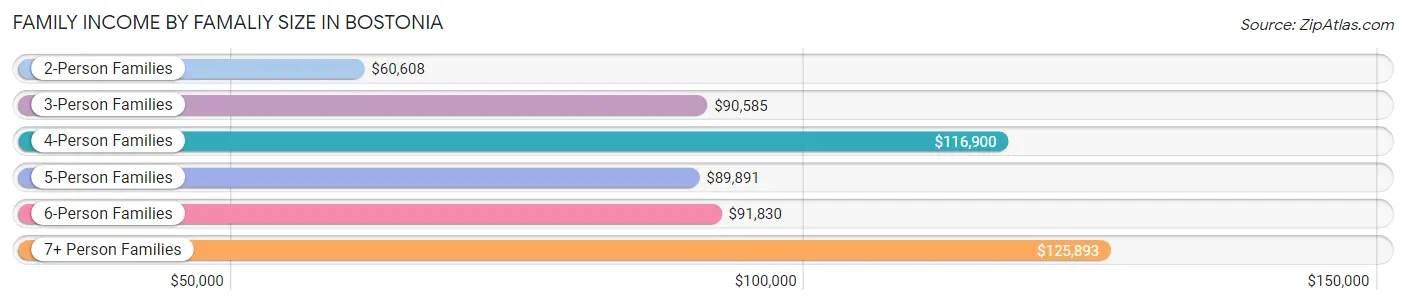
| Income Bracket | # Families | Median Income |
| 2-Person Families | 1,444 (37.1%) | $60,608 |
| 3-Person Families | 1,065 (27.4%) | $90,585 |
| 4-Person Families | 752 (19.4%) | $116,900 |
| 5-Person Families | 300 (7.7%) | $89,891 |
| 6-Person Families | 227 (5.8%) | $91,830 |
| 7+ Person Families | 99 (2.5%) | $125,893 |
| Total | 3,887 (100.0%) | $86,984 |
Family Income by Number of Earners in Bostonia
The median family income in Bostonia is $86,984, with families comprising 3+ earners (446) having the highest median family income of $125,396, while families with no earners (315) have the lowest median family income of $24,380, accounting for 11.5% and 8.1% of families, respectively.
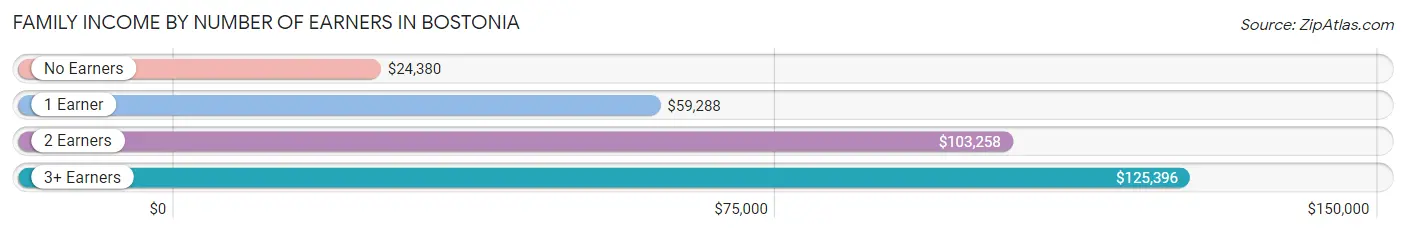
| Number of Earners | # Families | Median Income |
| No Earners | 315 (8.1%) | $24,380 |
| 1 Earner | 1,495 (38.5%) | $59,288 |
| 2 Earners | 1,631 (42.0%) | $103,258 |
| 3+ Earners | 446 (11.5%) | $125,396 |
| Total | 3,887 (100.0%) | $86,984 |
Household Income in Bostonia
Household Income Brackets in Bostonia
With 1,012 households falling in the category, the $100,000 to $149,999 income range is the most frequent in Bostonia, accounting for 17.6% of all households. In contrast, only 172 households (3.0%) fall into the less than $10,000 income bracket, making it the least populous group.
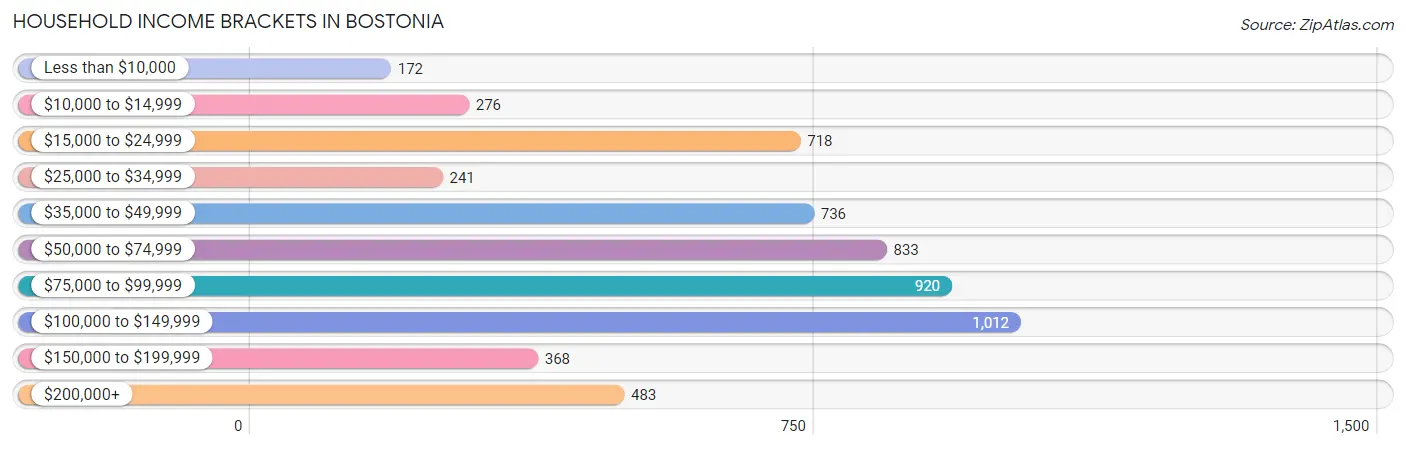
| Income Bracket | # Households | % Households |
| Less than $10,000 | 172 | 3.0% |
| $10,000 to $14,999 | 276 | 4.8% |
| $15,000 to $24,999 | 718 | 12.5% |
| $25,000 to $34,999 | 241 | 4.2% |
| $35,000 to $49,999 | 736 | 12.8% |
| $50,000 to $74,999 | 833 | 14.5% |
| $75,000 to $99,999 | 920 | 16.0% |
| $100,000 to $149,999 | 1,012 | 17.6% |
| $150,000 to $199,999 | 368 | 6.4% |
| $200,000+ | 483 | 8.4% |
Household Income by Householder Age in Bostonia
The median household income in Bostonia is $73,305, with the highest median household income of $81,349 found in the 15 to 24 years age bracket for the primary householder. A total of 265 households (4.6%) fall into this category. Meanwhile, the 65+ years age bracket for the primary householder has the lowest median household income of $64,149, with 1,552 households (27.0%) in this group.
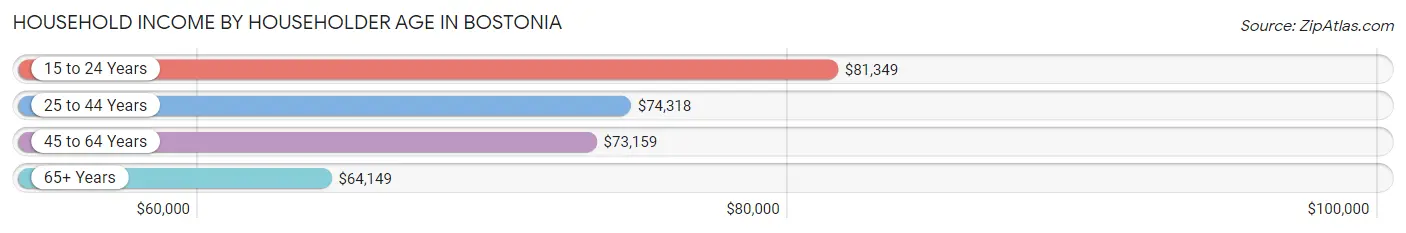
| Income Bracket | # Households | Median Income |
| 15 to 24 Years | 265 (4.6%) | $81,349 |
| 25 to 44 Years | 2,010 (35.0%) | $74,318 |
| 45 to 64 Years | 1,921 (33.4%) | $73,159 |
| 65+ Years | 1,552 (27.0%) | $64,149 |
| Total | 5,748 (100.0%) | $73,305 |
Poverty in Bostonia
Income Below Poverty by Sex and Age in Bostonia
With 11.2% poverty level for males and 17.3% for females among the residents of Bostonia, under 5 year old males and 15 year old females are the most vulnerable to poverty, with 175 males (26.0%) and 37 females (62.7%) in their respective age groups living below the poverty level.
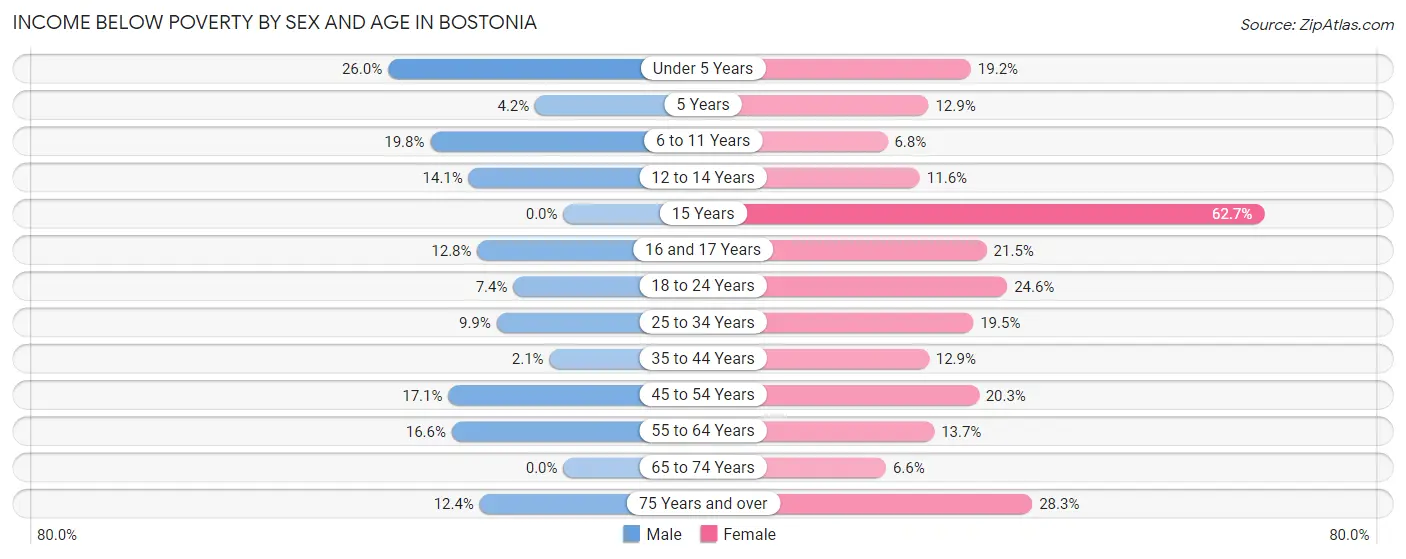
| Age Bracket | Male | Female |
| Under 5 Years | 175 (26.0%) | 88 (19.2%) |
| 5 Years | 9 (4.2%) | 13 (12.9%) |
| 6 to 11 Years | 133 (19.8%) | 35 (6.8%) |
| 12 to 14 Years | 38 (14.1%) | 63 (11.6%) |
| 15 Years | 0 (0.0%) | 37 (62.7%) |
| 16 and 17 Years | 30 (12.8%) | 37 (21.5%) |
| 18 to 24 Years | 53 (7.4%) | 209 (24.6%) |
| 25 to 34 Years | 152 (9.9%) | 337 (19.5%) |
| 35 to 44 Years | 22 (2.1%) | 120 (12.9%) |
| 45 to 54 Years | 87 (17.1%) | 195 (20.3%) |
| 55 to 64 Years | 150 (16.6%) | 142 (13.7%) |
| 65 to 74 Years | 0 (0.0%) | 50 (6.6%) |
| 75 Years and over | 37 (12.4%) | 192 (28.3%) |
| Total | 886 (11.2%) | 1,518 (17.3%) |
Income Above Poverty by Sex and Age in Bostonia
According to the poverty statistics in Bostonia, males aged 15 years and females aged 65 to 74 years are the age groups that are most secure financially, with 100.0% of males and 93.4% of females in these age groups living above the poverty line.
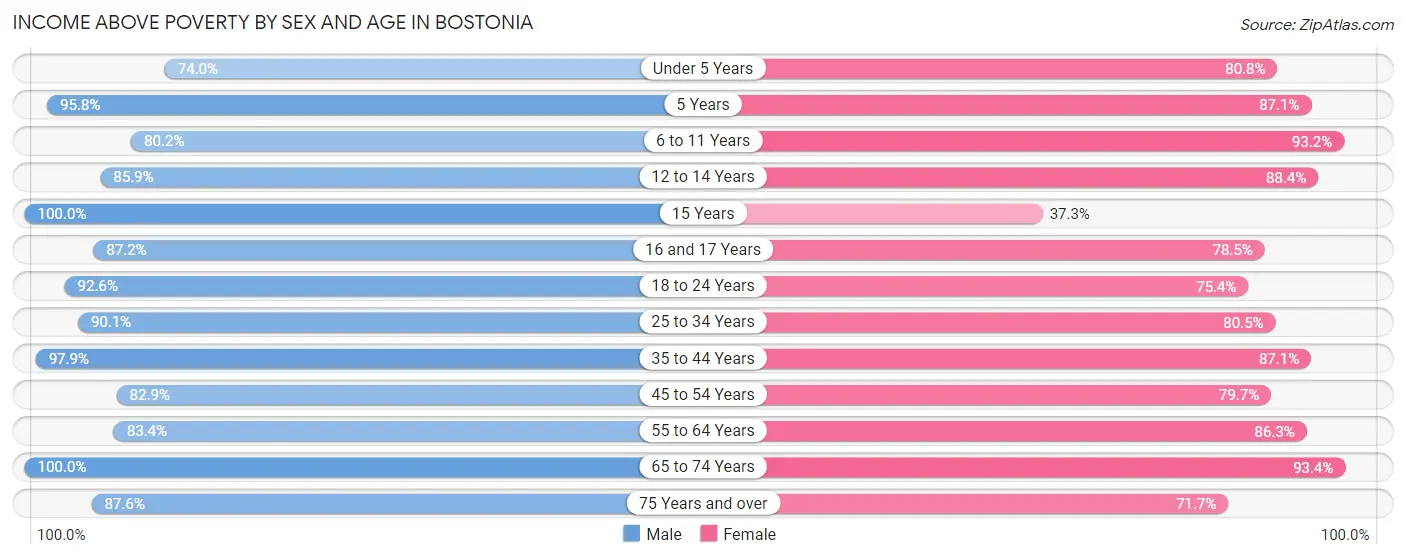
| Age Bracket | Male | Female |
| Under 5 Years | 497 (74.0%) | 371 (80.8%) |
| 5 Years | 206 (95.8%) | 88 (87.1%) |
| 6 to 11 Years | 540 (80.2%) | 481 (93.2%) |
| 12 to 14 Years | 232 (85.9%) | 480 (88.4%) |
| 15 Years | 82 (100.0%) | 22 (37.3%) |
| 16 and 17 Years | 205 (87.2%) | 135 (78.5%) |
| 18 to 24 Years | 660 (92.6%) | 642 (75.4%) |
| 25 to 34 Years | 1,382 (90.1%) | 1,389 (80.5%) |
| 35 to 44 Years | 1,040 (97.9%) | 809 (87.1%) |
| 45 to 54 Years | 422 (82.9%) | 764 (79.7%) |
| 55 to 64 Years | 755 (83.4%) | 893 (86.3%) |
| 65 to 74 Years | 772 (100.0%) | 712 (93.4%) |
| 75 Years and over | 261 (87.6%) | 487 (71.7%) |
| Total | 7,054 (88.8%) | 7,273 (82.7%) |
Income Below Poverty Among Married-Couple Families in Bostonia
The poverty statistics for married-couple families in Bostonia show that 3.1% or 74 of the total 2,378 families live below the poverty line. Families with 3 or 4 children have the highest poverty rate of 14.3%, comprising of 37 families. On the other hand, families with 1 or 2 children have the lowest poverty rate of 1.2%, which includes 13 families.
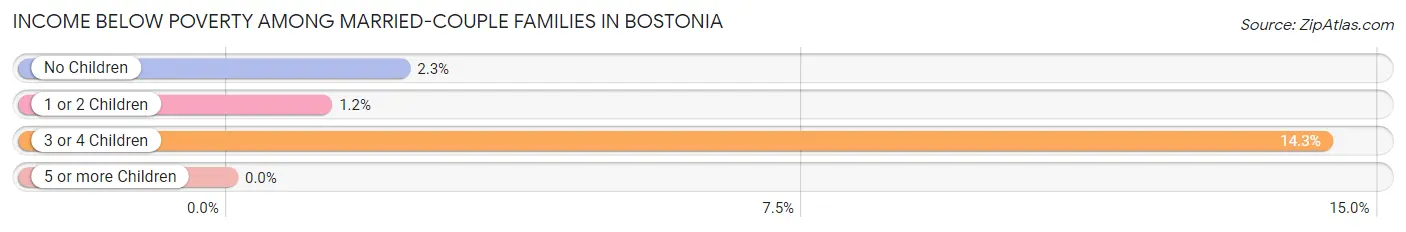
| Children | Above Poverty | Below Poverty |
| No Children | 1,041 (97.8%) | 24 (2.2%) |
| 1 or 2 Children | 1,041 (98.8%) | 13 (1.2%) |
| 3 or 4 Children | 222 (85.7%) | 37 (14.3%) |
| 5 or more Children | 0 (0.0%) | 0 (0.0%) |
| Total | 2,304 (96.9%) | 74 (3.1%) |
Income Below Poverty Among Single-Parent Households in Bostonia
According to the poverty data in Bostonia, 13.2% or 69 single-father households and 35.0% or 346 single-mother households are living below the poverty line. Among single-father households, those with no children have the highest poverty rate, with 41 households (19.2%) experiencing poverty. Likewise, among single-mother households, those with 3 or 4 children have the highest poverty rate, with 29 households (100.0%) falling below the poverty line.
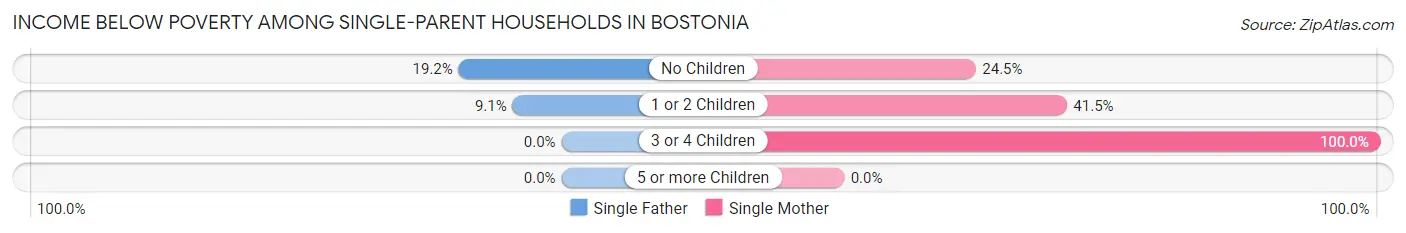
| Children | Single Father | Single Mother |
| No Children | 41 (19.2%) | 117 (24.5%) |
| 1 or 2 Children | 28 (9.1%) | 200 (41.5%) |
| 3 or 4 Children | 0 (0.0%) | 29 (100.0%) |
| 5 or more Children | 0 (0.0%) | 0 (0.0%) |
| Total | 69 (13.2%) | 346 (35.0%) |
Income Below Poverty Among Married-Couple vs Single-Parent Households in Bostonia
The poverty data for Bostonia shows that 74 of the married-couple family households (3.1%) and 415 of the single-parent households (27.5%) are living below the poverty level. Within the married-couple family households, those with 3 or 4 children have the highest poverty rate, with 37 households (14.3%) falling below the poverty line. Among the single-parent households, those with 3 or 4 children have the highest poverty rate, with 29 household (100.0%) living below poverty.
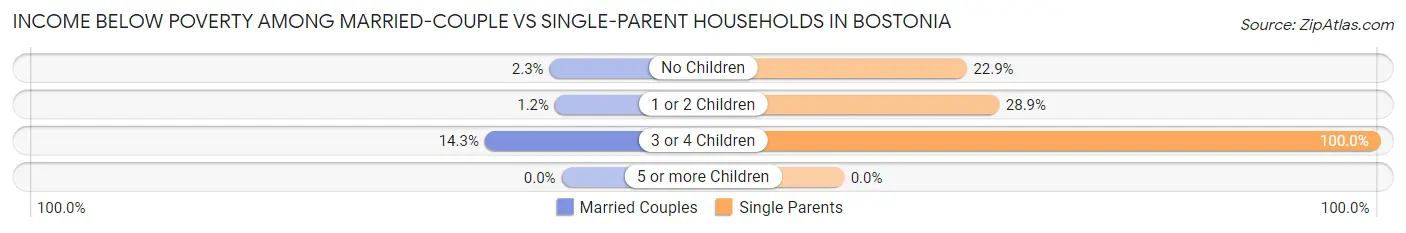
| Children | Married-Couple Families | Single-Parent Households |
| No Children | 24 (2.2%) | 158 (22.9%) |
| 1 or 2 Children | 13 (1.2%) | 228 (28.9%) |
| 3 or 4 Children | 37 (14.3%) | 29 (100.0%) |
| 5 or more Children | 0 (0.0%) | 0 (0.0%) |
| Total | 74 (3.1%) | 415 (27.5%) |
Employment Characteristics in Bostonia
Employment by Class of Employer in Bostonia
Among the 7,856 employed individuals in Bostonia, private company employees (5,546 | 70.6%), not-for-profit organizations (604 | 7.7%), and local government employees (500 | 6.4%) make up the most common classes of employment.
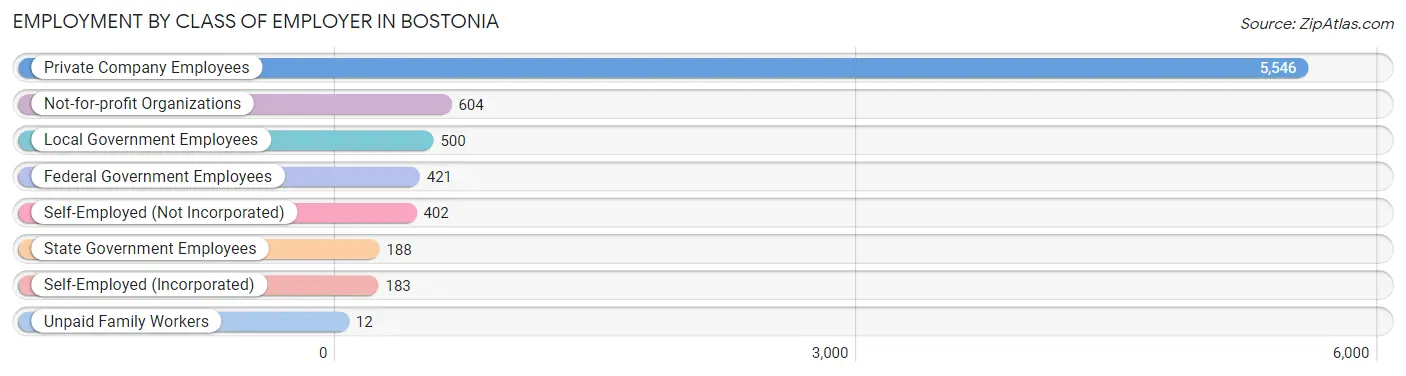
| Employer Class | # Employees | % Employees |
| Private Company Employees | 5,546 | 70.6% |
| Self-Employed (Incorporated) | 183 | 2.3% |
| Self-Employed (Not Incorporated) | 402 | 5.1% |
| Not-for-profit Organizations | 604 | 7.7% |
| Local Government Employees | 500 | 6.4% |
| State Government Employees | 188 | 2.4% |
| Federal Government Employees | 421 | 5.4% |
| Unpaid Family Workers | 12 | 0.2% |
| Total | 7,856 | 100.0% |
Employment Status by Age in Bostonia
According to the labor force statistics for Bostonia, out of the total population over 16 years of age (13,193), 66.5% or 8,773 individuals are in the labor force, with 8.6% or 754 of them unemployed. The age group with the highest labor force participation rate is 30 to 34 years, with 96.2% or 1,607 individuals in the labor force. Within the labor force, the 75 years and over age range has the highest percentage of unemployed individuals, with 62.1% or 18 of them being unemployed.
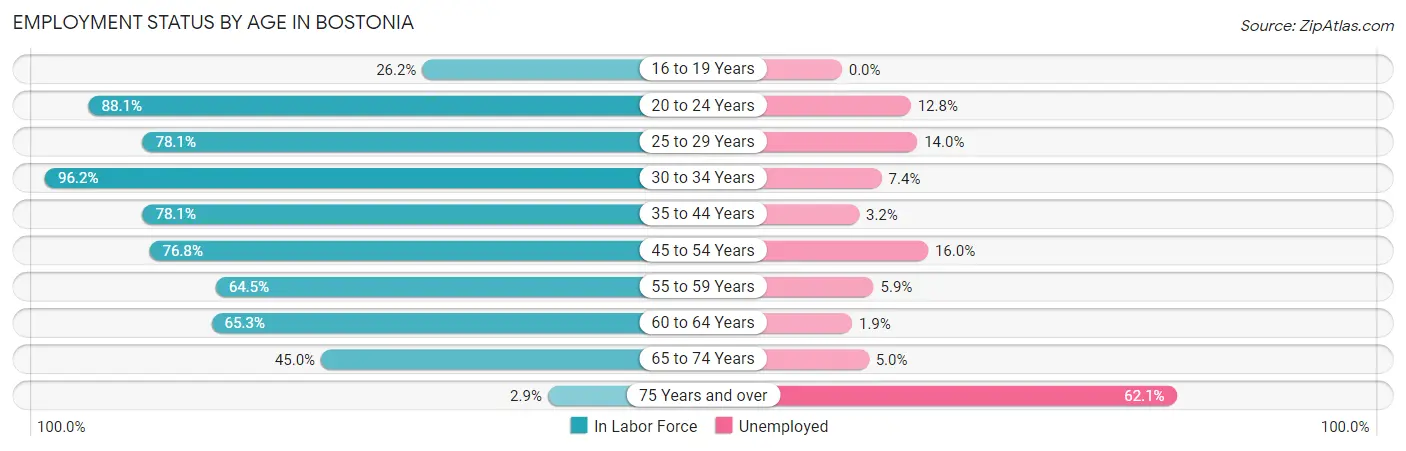
| Age Bracket | In Labor Force | Unemployed |
| 16 to 19 Years | 208 (26.2%) | 0 (0.0%) |
| 20 to 24 Years | 1,037 (88.1%) | 133 (12.8%) |
| 25 to 29 Years | 1,242 (78.1%) | 174 (14.0%) |
| 30 to 34 Years | 1,607 (96.2%) | 119 (7.4%) |
| 35 to 44 Years | 1,556 (78.1%) | 50 (3.2%) |
| 45 to 54 Years | 1,134 (76.8%) | 181 (16.0%) |
| 55 to 59 Years | 728 (64.5%) | 43 (5.9%) |
| 60 to 64 Years | 538 (65.3%) | 10 (1.9%) |
| 65 to 74 Years | 694 (45.0%) | 35 (5.0%) |
| 75 Years and over | 29 (2.9%) | 18 (62.1%) |
| Total | 8,773 (66.5%) | 754 (8.6%) |
Employment Status by Educational Attainment in Bostonia
According to labor force statistics for Bostonia, 78.4% of individuals (6,805) out of the total population between 25 and 64 years of age (8,680) are in the labor force, with 8.5% or 578 of them being unemployed. The group with the highest labor force participation rate are those with the educational attainment of bachelor's degree or higher, with 82.1% or 1,455 individuals in the labor force. Within the labor force, individuals with less than high school education have the highest percentage of unemployment, with 11.3% or 93 of them being unemployed.
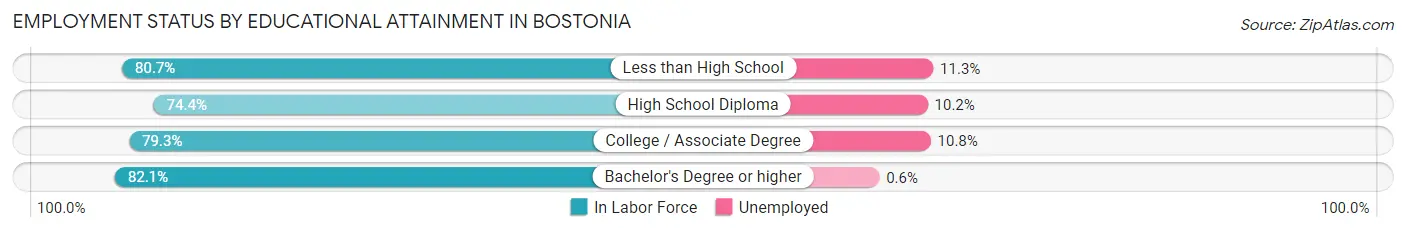
| Educational Attainment | In Labor Force | Unemployed |
| Less than High School | 826 (80.7%) | 116 (11.3%) |
| High School Diploma | 2,183 (74.4%) | 299 (10.2%) |
| College / Associate Degree | 2,339 (79.3%) | 319 (10.8%) |
| Bachelor's Degree or higher | 1,455 (82.1%) | 11 (0.6%) |
| Total | 6,805 (78.4%) | 738 (8.5%) |
Employment Occupations by Sex in Bostonia
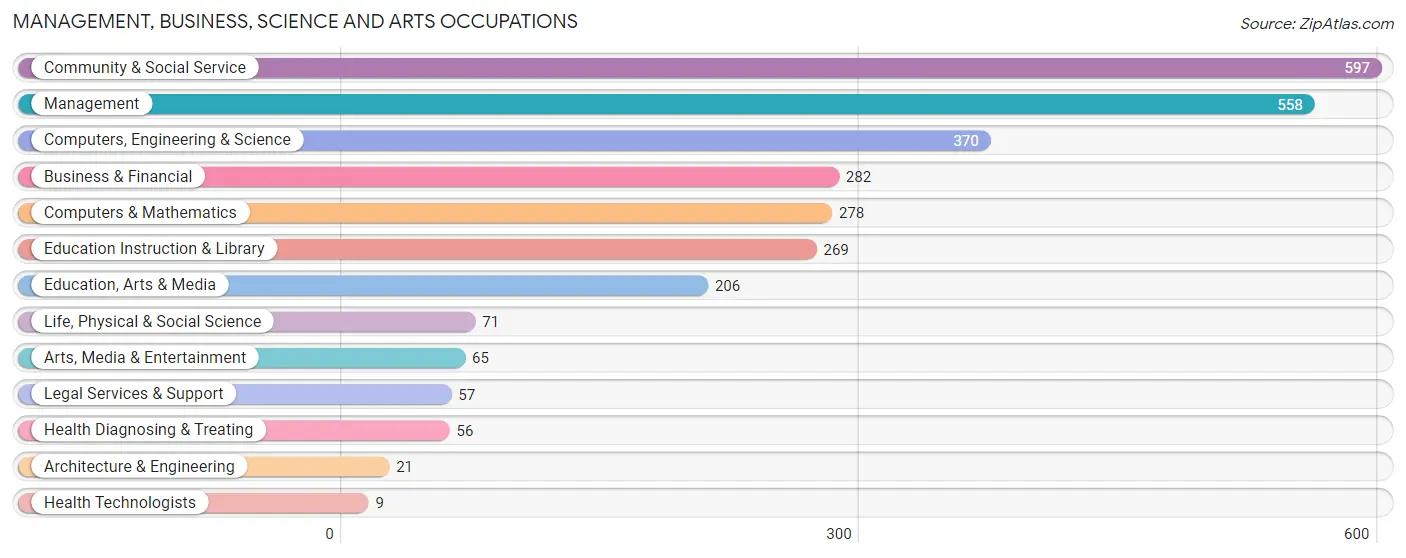
Management, Business, Science and Arts Occupations
The most common Management, Business, Science and Arts occupations in Bostonia are Community & Social Service (597 | 7.6%), Management (558 | 7.1%), Computers, Engineering & Science (370 | 4.7%), Business & Financial (282 | 3.6%), and Computers & Mathematics (278 | 3.5%).
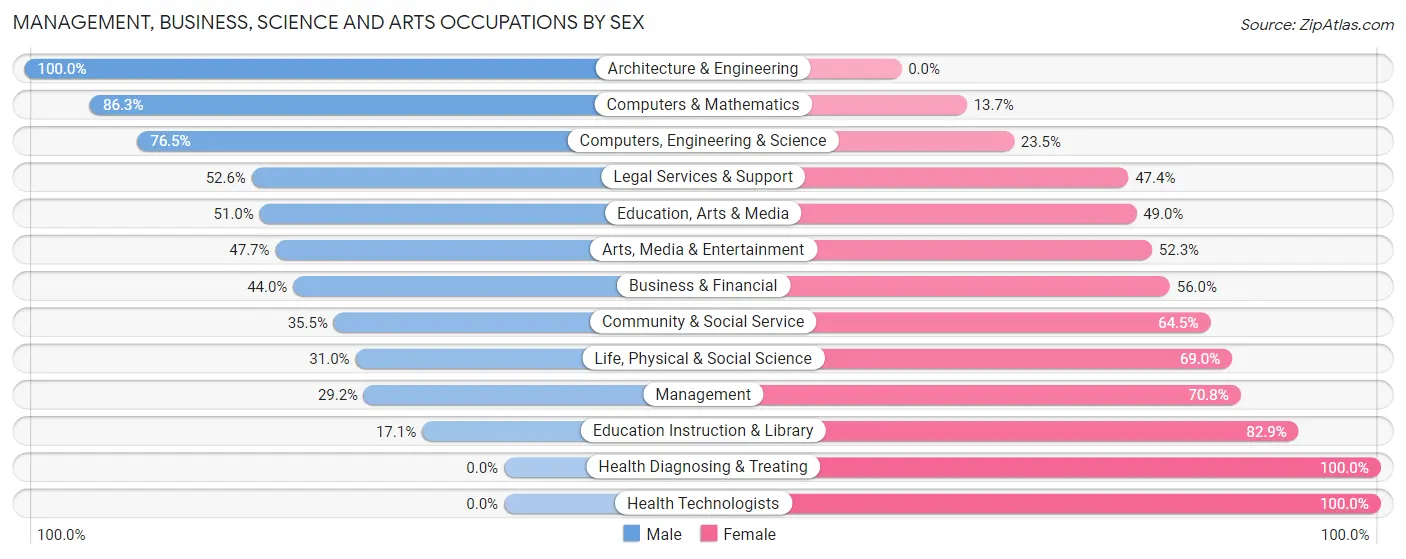
Management, Business, Science and Arts Occupations by Sex
Within the Management, Business, Science and Arts occupations in Bostonia, the most male-oriented occupations are Architecture & Engineering (100.0%), Computers & Mathematics (86.3%), and Computers, Engineering & Science (76.5%), while the most female-oriented occupations are Health Diagnosing & Treating (100.0%), Health Technologists (100.0%), and Education Instruction & Library (82.9%).
| Occupation | Male | Female |
| Management | 163 (29.2%) | 395 (70.8%) |
| Business & Financial | 124 (44.0%) | 158 (56.0%) |
| Computers, Engineering & Science | 283 (76.5%) | 87 (23.5%) |
| Computers & Mathematics | 240 (86.3%) | 38 (13.7%) |
| Architecture & Engineering | 21 (100.0%) | 0 (0.0%) |
| Life, Physical & Social Science | 22 (31.0%) | 49 (69.0%) |
| Community & Social Service | 212 (35.5%) | 385 (64.5%) |
| Education, Arts & Media | 105 (51.0%) | 101 (49.0%) |
| Legal Services & Support | 30 (52.6%) | 27 (47.4%) |
| Education Instruction & Library | 46 (17.1%) | 223 (82.9%) |
| Arts, Media & Entertainment | 31 (47.7%) | 34 (52.3%) |
| Health Diagnosing & Treating | 0 (0.0%) | 56 (100.0%) |
| Health Technologists | 0 (0.0%) | 9 (100.0%) |
| Total (Category) | 782 (42.0%) | 1,081 (58.0%) |
| Total (Overall) | 3,941 (50.3%) | 3,899 (49.7%) |
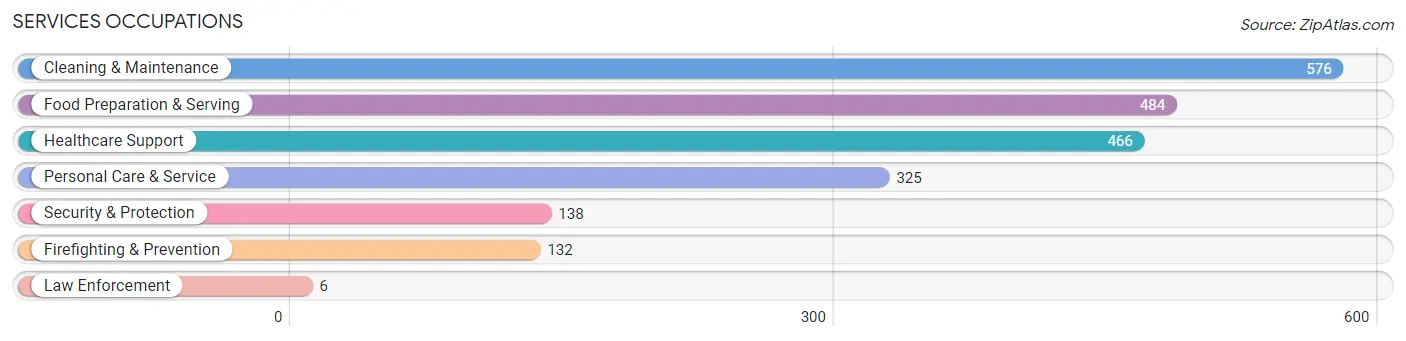
Services Occupations
The most common Services occupations in Bostonia are Cleaning & Maintenance (576 | 7.3%), Food Preparation & Serving (484 | 6.2%), Healthcare Support (466 | 5.9%), Personal Care & Service (325 | 4.2%), and Security & Protection (138 | 1.8%).
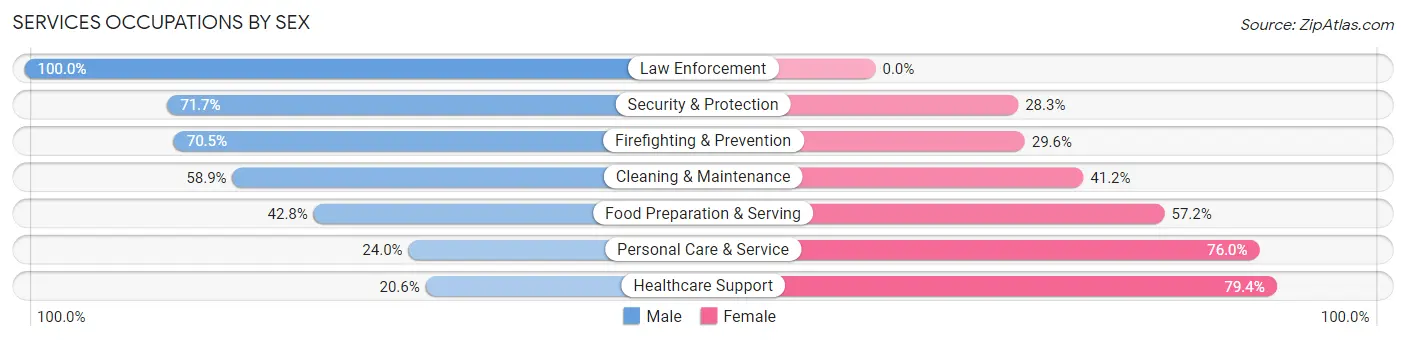
Services Occupations by Sex
Within the Services occupations in Bostonia, the most male-oriented occupations are Law Enforcement (100.0%), Security & Protection (71.7%), and Firefighting & Prevention (70.5%), while the most female-oriented occupations are Healthcare Support (79.4%), Personal Care & Service (76.0%), and Food Preparation & Serving (57.2%).
| Occupation | Male | Female |
| Healthcare Support | 96 (20.6%) | 370 (79.4%) |
| Security & Protection | 99 (71.7%) | 39 (28.3%) |
| Firefighting & Prevention | 93 (70.5%) | 39 (29.5%) |
| Law Enforcement | 6 (100.0%) | 0 (0.0%) |
| Food Preparation & Serving | 207 (42.8%) | 277 (57.2%) |
| Cleaning & Maintenance | 339 (58.9%) | 237 (41.1%) |
| Personal Care & Service | 78 (24.0%) | 247 (76.0%) |
| Total (Category) | 819 (41.2%) | 1,170 (58.8%) |
| Total (Overall) | 3,941 (50.3%) | 3,899 (49.7%) |
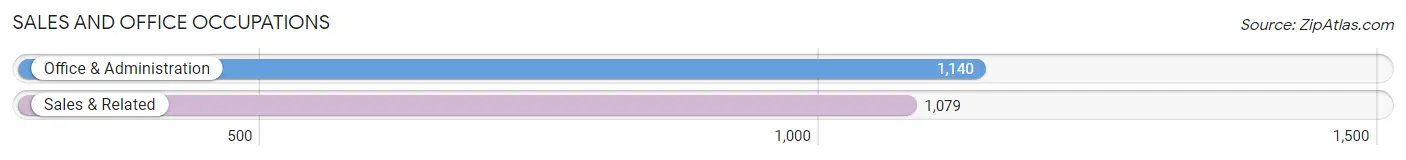
Sales and Office Occupations
The most common Sales and Office occupations in Bostonia are Office & Administration (1,140 | 14.5%), and Sales & Related (1,079 | 13.8%).
Sales and Office Occupations by Sex
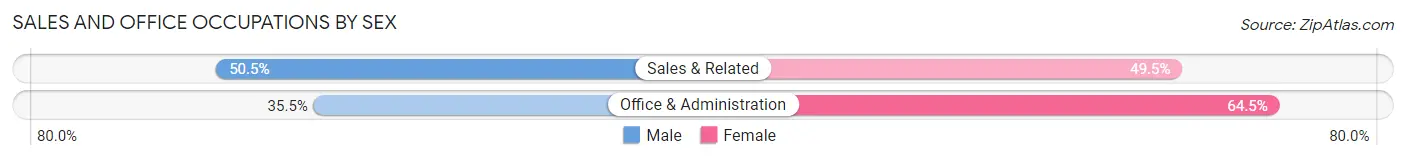
| Occupation | Male | Female |
| Sales & Related | 545 (50.5%) | 534 (49.5%) |
| Office & Administration | 405 (35.5%) | 735 (64.5%) |
| Total (Category) | 950 (42.8%) | 1,269 (57.2%) |
| Total (Overall) | 3,941 (50.3%) | 3,899 (49.7%) |
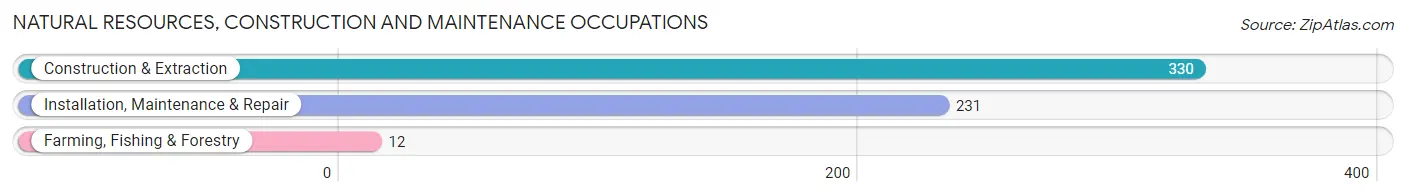
Natural Resources, Construction and Maintenance Occupations
The most common Natural Resources, Construction and Maintenance occupations in Bostonia are Construction & Extraction (330 | 4.2%), Installation, Maintenance & Repair (231 | 2.9%), and Farming, Fishing & Forestry (12 | 0.2%).
Natural Resources, Construction and Maintenance Occupations by Sex
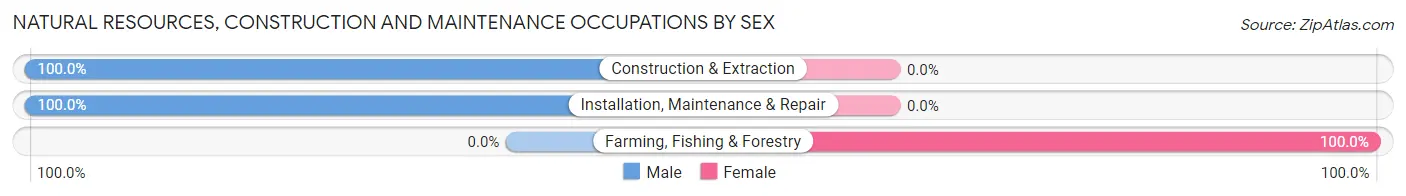
| Occupation | Male | Female |
| Farming, Fishing & Forestry | 0 (0.0%) | 12 (100.0%) |
| Construction & Extraction | 330 (100.0%) | 0 (0.0%) |
| Installation, Maintenance & Repair | 231 (100.0%) | 0 (0.0%) |
| Total (Category) | 561 (97.9%) | 12 (2.1%) |
| Total (Overall) | 3,941 (50.3%) | 3,899 (49.7%) |
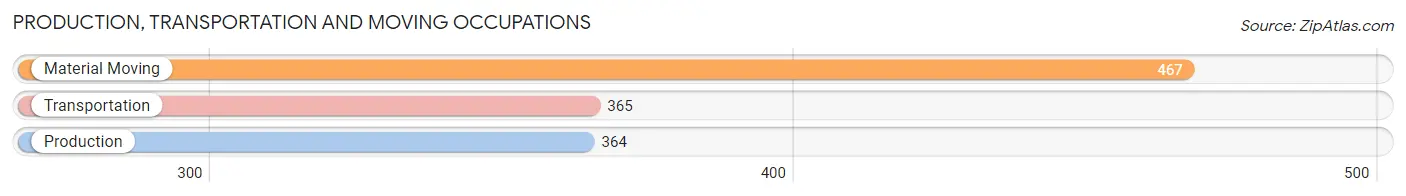
Production, Transportation and Moving Occupations
The most common Production, Transportation and Moving occupations in Bostonia are Material Moving (467 | 6.0%), Transportation (365 | 4.7%), and Production (364 | 4.6%).
Production, Transportation and Moving Occupations by Sex
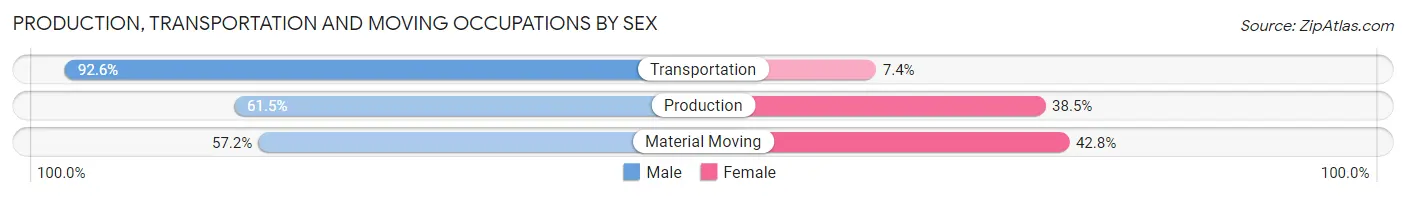
| Occupation | Male | Female |
| Production | 224 (61.5%) | 140 (38.5%) |
| Transportation | 338 (92.6%) | 27 (7.4%) |
| Material Moving | 267 (57.2%) | 200 (42.8%) |
| Total (Category) | 829 (69.3%) | 367 (30.7%) |
| Total (Overall) | 3,941 (50.3%) | 3,899 (49.7%) |
Employment Industries by Sex in Bostonia
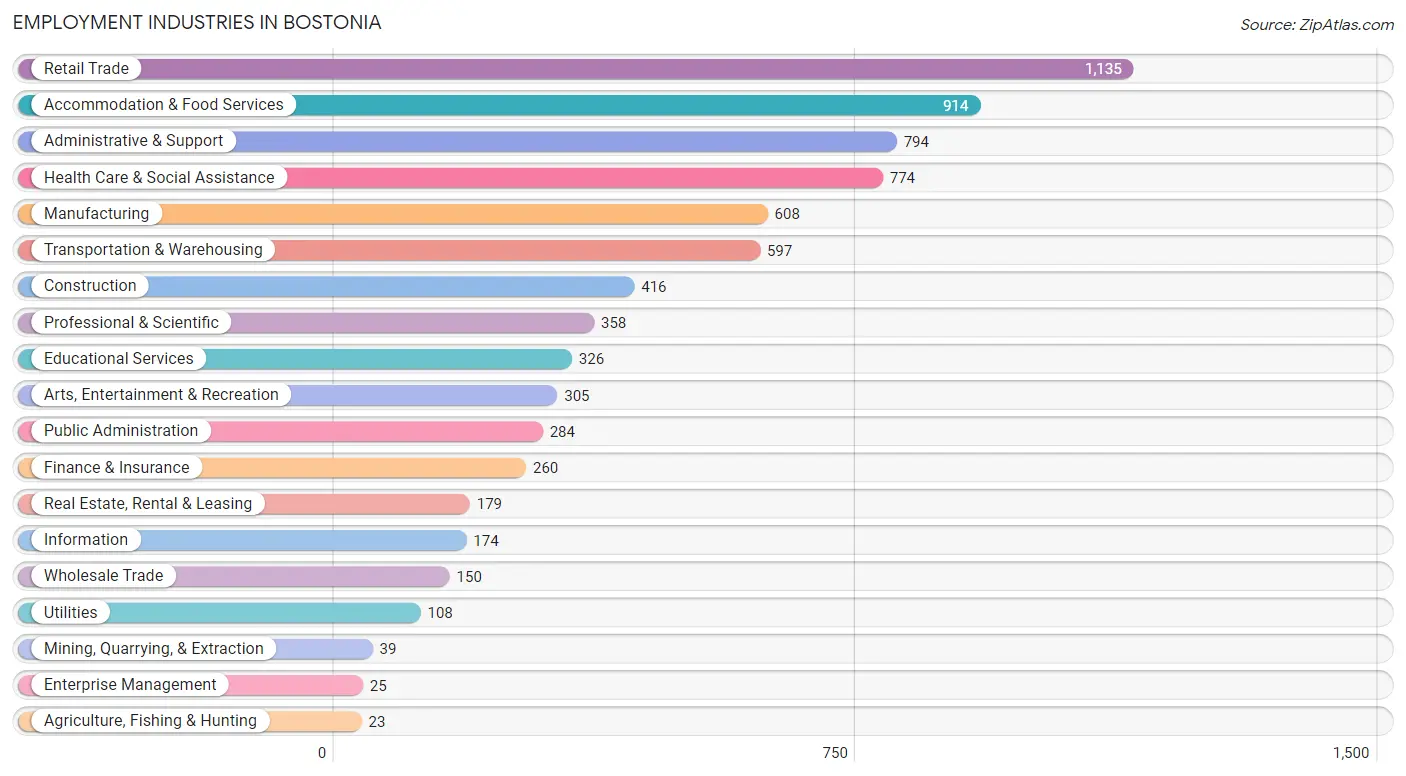
Employment Industries in Bostonia
The major employment industries in Bostonia include Retail Trade (1,135 | 14.5%), Accommodation & Food Services (914 | 11.7%), Administrative & Support (794 | 10.1%), Health Care & Social Assistance (774 | 9.9%), and Manufacturing (608 | 7.8%).
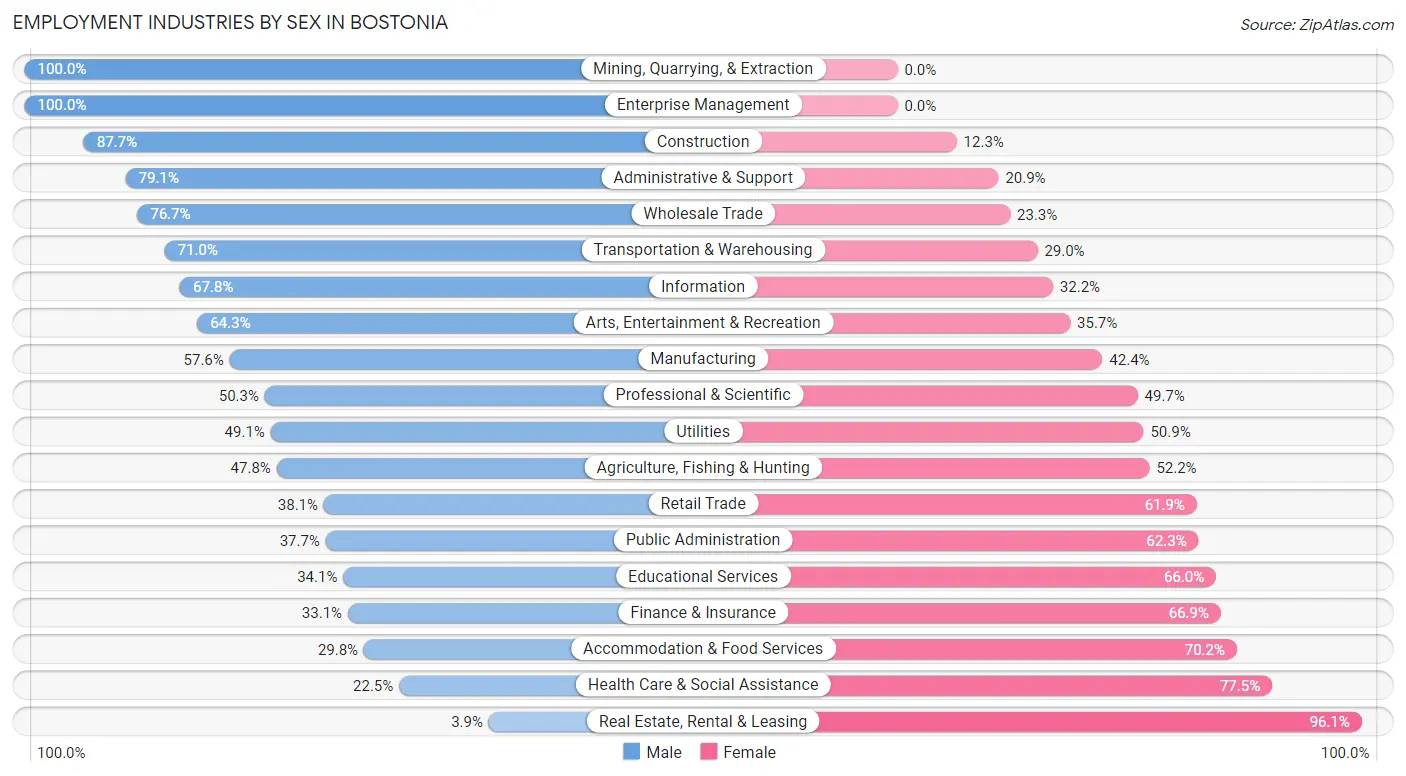
Employment Industries by Sex in Bostonia
The Bostonia industries that see more men than women are Mining, Quarrying, & Extraction (100.0%), Enterprise Management (100.0%), and Construction (87.7%), whereas the industries that tend to have a higher number of women are Real Estate, Rental & Leasing (96.1%), Health Care & Social Assistance (77.5%), and Accommodation & Food Services (70.2%).
| Industry | Male | Female |
| Agriculture, Fishing & Hunting | 11 (47.8%) | 12 (52.2%) |
| Mining, Quarrying, & Extraction | 39 (100.0%) | 0 (0.0%) |
| Construction | 365 (87.7%) | 51 (12.3%) |
| Manufacturing | 350 (57.6%) | 258 (42.4%) |
| Wholesale Trade | 115 (76.7%) | 35 (23.3%) |
| Retail Trade | 432 (38.1%) | 703 (61.9%) |
| Transportation & Warehousing | 424 (71.0%) | 173 (29.0%) |
| Utilities | 53 (49.1%) | 55 (50.9%) |
| Information | 118 (67.8%) | 56 (32.2%) |
| Finance & Insurance | 86 (33.1%) | 174 (66.9%) |
| Real Estate, Rental & Leasing | 7 (3.9%) | 172 (96.1%) |
| Professional & Scientific | 180 (50.3%) | 178 (49.7%) |
| Enterprise Management | 25 (100.0%) | 0 (0.0%) |
| Administrative & Support | 628 (79.1%) | 166 (20.9%) |
| Educational Services | 111 (34.1%) | 215 (65.9%) |
| Health Care & Social Assistance | 174 (22.5%) | 600 (77.5%) |
| Arts, Entertainment & Recreation | 196 (64.3%) | 109 (35.7%) |
| Accommodation & Food Services | 272 (29.8%) | 642 (70.2%) |
| Public Administration | 107 (37.7%) | 177 (62.3%) |
| Total | 3,941 (50.3%) | 3,899 (49.7%) |
Education in Bostonia
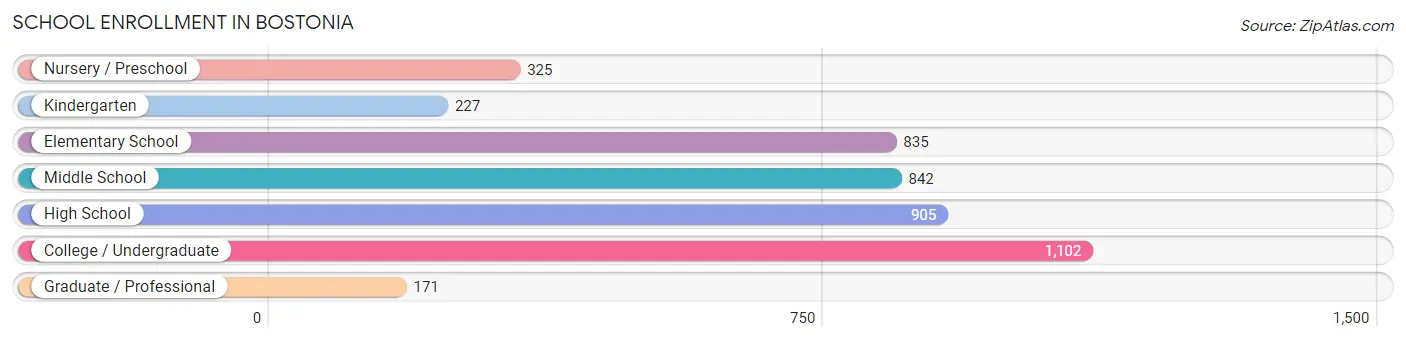
School Enrollment in Bostonia
The most common levels of schooling among the 4,407 students in Bostonia are college / undergraduate (1,102 | 25.0%), high school (905 | 20.5%), and middle school (842 | 19.1%).
| School Level | # Students | % Students |
| Nursery / Preschool | 325 | 7.4% |
| Kindergarten | 227 | 5.1% |
| Elementary School | 835 | 19.0% |
| Middle School | 842 | 19.1% |
| High School | 905 | 20.5% |
| College / Undergraduate | 1,102 | 25.0% |
| Graduate / Professional | 171 | 3.9% |
| Total | 4,407 | 100.0% |
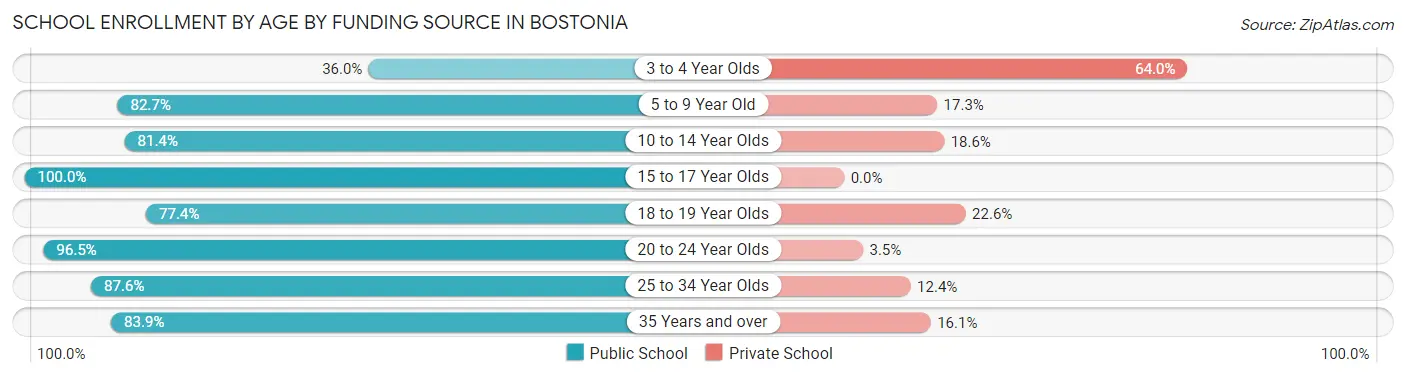
School Enrollment by Age by Funding Source in Bostonia
Out of a total of 4,407 students who are enrolled in schools in Bostonia, 696 (15.8%) attend a private institution, while the remaining 3,711 (84.2%) are enrolled in public schools. The age group of 3 to 4 year olds has the highest likelihood of being enrolled in private schools, with 112 (64.0% in the age bracket) enrolled. Conversely, the age group of 15 to 17 year olds has the lowest likelihood of being enrolled in a private school, with 548 (100.0% in the age bracket) attending a public institution.
| Age Bracket | Public School | Private School |
| 3 to 4 Year Olds | 63 (36.0%) | 112 (64.0%) |
| 5 to 9 Year Old | 921 (82.7%) | 193 (17.3%) |
| 10 to 14 Year Olds | 948 (81.4%) | 217 (18.6%) |
| 15 to 17 Year Olds | 548 (100.0%) | 0 (0.0%) |
| 18 to 19 Year Olds | 188 (77.4%) | 55 (22.6%) |
| 20 to 24 Year Olds | 385 (96.5%) | 14 (3.5%) |
| 25 to 34 Year Olds | 375 (87.6%) | 53 (12.4%) |
| 35 Years and over | 281 (83.9%) | 54 (16.1%) |
| Total | 3,711 (84.2%) | 696 (15.8%) |
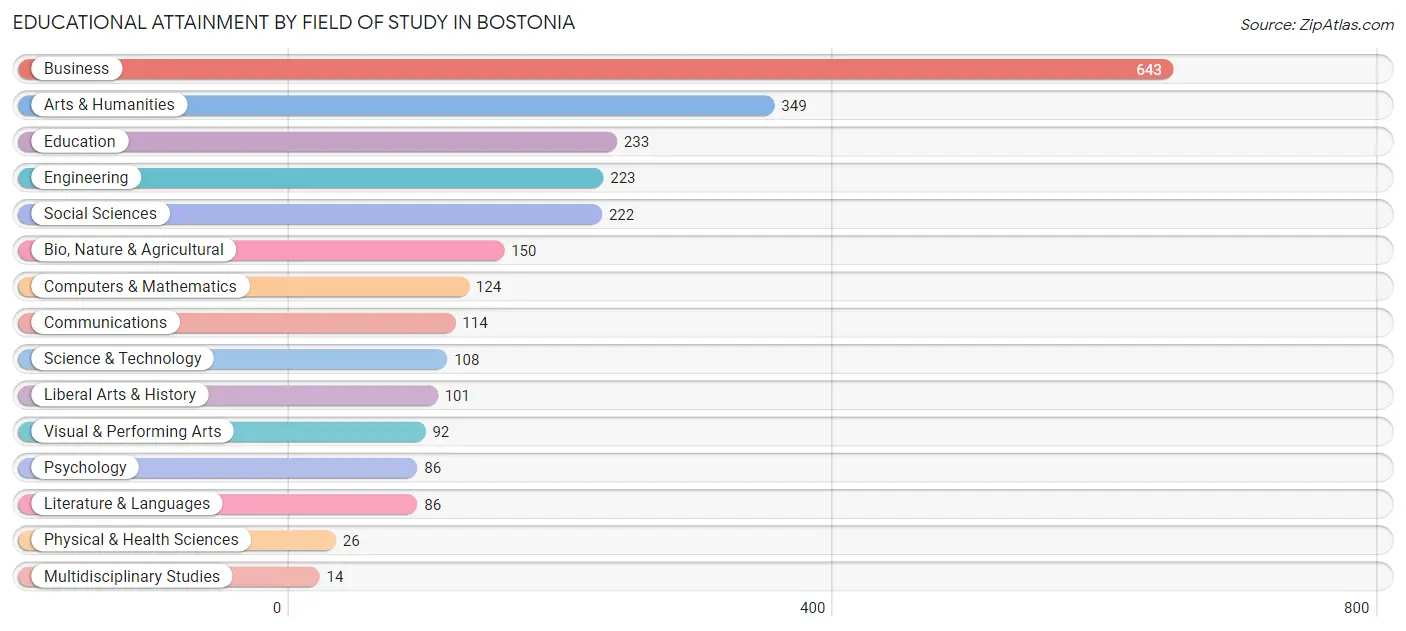
Educational Attainment by Field of Study in Bostonia
Business (643 | 25.0%), arts & humanities (349 | 13.6%), education (233 | 9.1%), engineering (223 | 8.7%), and social sciences (222 | 8.6%) are the most common fields of study among 2,571 individuals in Bostonia who have obtained a bachelor's degree or higher.
| Field of Study | # Graduates | % Graduates |
| Computers & Mathematics | 124 | 4.8% |
| Bio, Nature & Agricultural | 150 | 5.8% |
| Physical & Health Sciences | 26 | 1.0% |
| Psychology | 86 | 3.4% |
| Social Sciences | 222 | 8.6% |
| Engineering | 223 | 8.7% |
| Multidisciplinary Studies | 14 | 0.5% |
| Science & Technology | 108 | 4.2% |
| Business | 643 | 25.0% |
| Education | 233 | 9.1% |
| Literature & Languages | 86 | 3.4% |
| Liberal Arts & History | 101 | 3.9% |
| Visual & Performing Arts | 92 | 3.6% |
| Communications | 114 | 4.4% |
| Arts & Humanities | 349 | 13.6% |
| Total | 2,571 | 100.0% |
Transportation & Commute in Bostonia
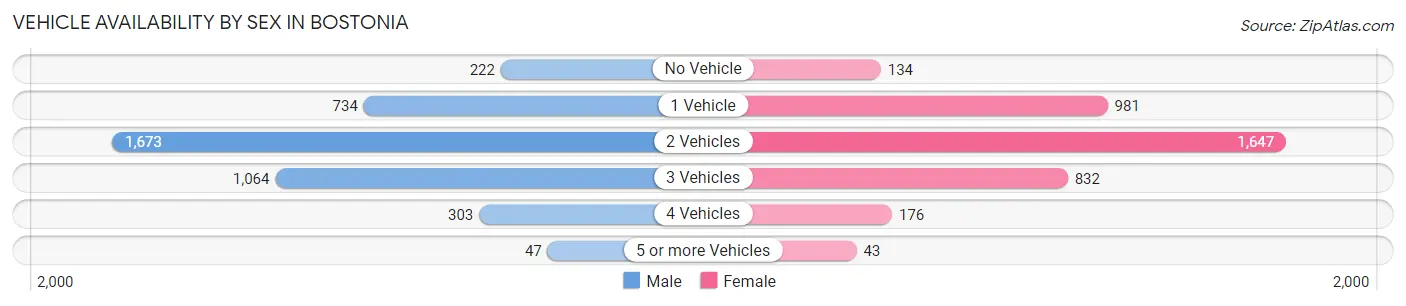
Vehicle Availability by Sex in Bostonia
The most prevalent vehicle ownership categories in Bostonia are males with 2 vehicles (1,673, accounting for 41.4%) and females with 2 vehicles (1,647, making up 43.9%).
| Vehicles Available | Male | Female |
| No Vehicle | 222 (5.5%) | 134 (3.5%) |
| 1 Vehicle | 734 (18.1%) | 981 (25.7%) |
| 2 Vehicles | 1,673 (41.4%) | 1,647 (43.2%) |
| 3 Vehicles | 1,064 (26.3%) | 832 (21.8%) |
| 4 Vehicles | 303 (7.5%) | 176 (4.6%) |
| 5 or more Vehicles | 47 (1.2%) | 43 (1.1%) |
| Total | 4,043 (100.0%) | 3,813 (100.0%) |
Commute Time in Bostonia
The most frequently occuring commute durations in Bostonia are 30 to 34 minutes (1,498 commuters, 21.0%), 20 to 24 minutes (1,070 commuters, 15.0%), and 10 to 14 minutes (1,040 commuters, 14.6%).
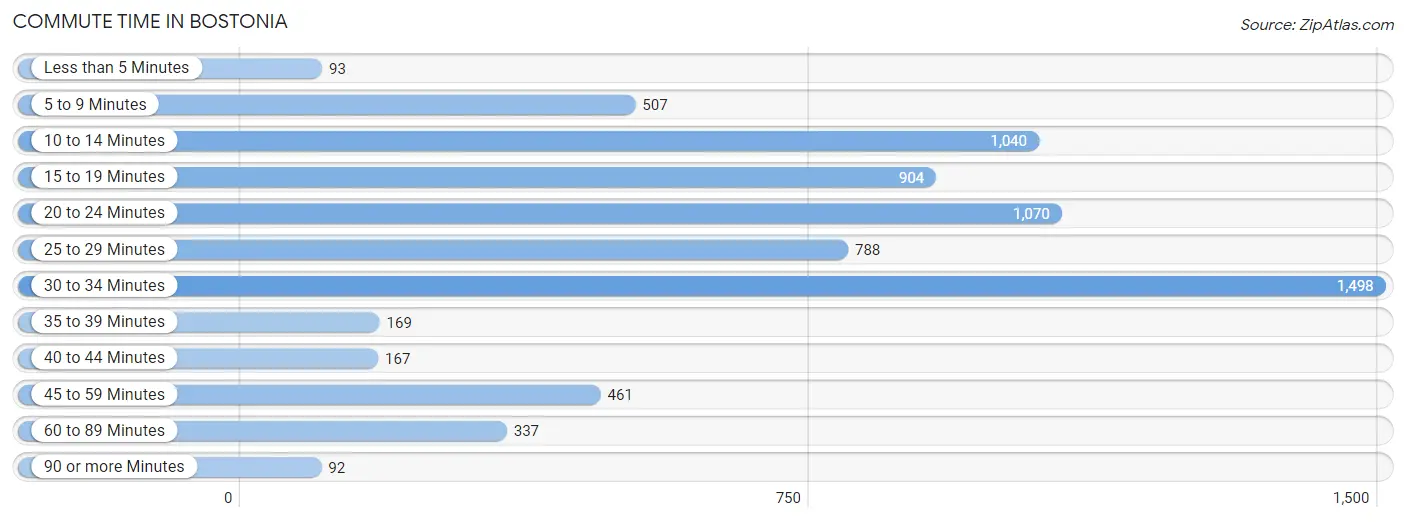
| Commute Time | # Commuters | % Commuters |
| Less than 5 Minutes | 93 | 1.3% |
| 5 to 9 Minutes | 507 | 7.1% |
| 10 to 14 Minutes | 1,040 | 14.6% |
| 15 to 19 Minutes | 904 | 12.7% |
| 20 to 24 Minutes | 1,070 | 15.0% |
| 25 to 29 Minutes | 788 | 11.1% |
| 30 to 34 Minutes | 1,498 | 21.0% |
| 35 to 39 Minutes | 169 | 2.4% |
| 40 to 44 Minutes | 167 | 2.3% |
| 45 to 59 Minutes | 461 | 6.5% |
| 60 to 89 Minutes | 337 | 4.7% |
| 90 or more Minutes | 92 | 1.3% |
Commute Time by Sex in Bostonia
The most common commute times in Bostonia are 30 to 34 minutes (667 commuters, 17.7%) for males and 30 to 34 minutes (831 commuters, 24.8%) for females.
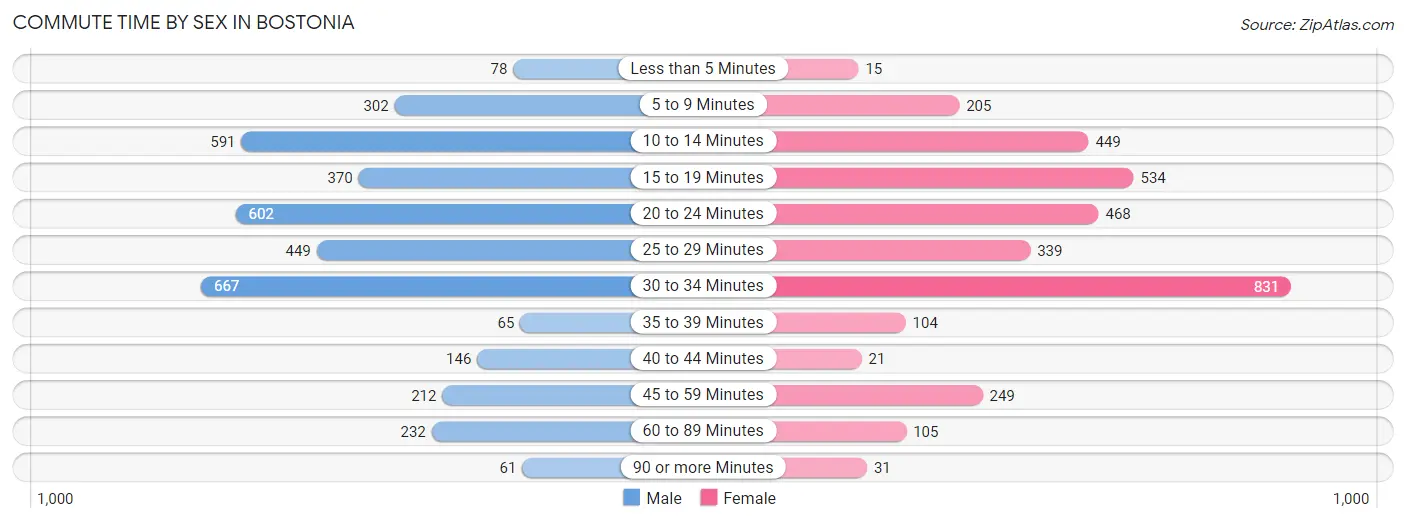
| Commute Time | Male | Female |
| Less than 5 Minutes | 78 (2.1%) | 15 (0.4%) |
| 5 to 9 Minutes | 302 (8.0%) | 205 (6.1%) |
| 10 to 14 Minutes | 591 (15.7%) | 449 (13.4%) |
| 15 to 19 Minutes | 370 (9.8%) | 534 (15.9%) |
| 20 to 24 Minutes | 602 (16.0%) | 468 (14.0%) |
| 25 to 29 Minutes | 449 (11.9%) | 339 (10.1%) |
| 30 to 34 Minutes | 667 (17.7%) | 831 (24.8%) |
| 35 to 39 Minutes | 65 (1.7%) | 104 (3.1%) |
| 40 to 44 Minutes | 146 (3.9%) | 21 (0.6%) |
| 45 to 59 Minutes | 212 (5.6%) | 249 (7.4%) |
| 60 to 89 Minutes | 232 (6.1%) | 105 (3.1%) |
| 90 or more Minutes | 61 (1.6%) | 31 (0.9%) |
Time of Departure to Work by Sex in Bostonia
The most frequent times of departure to work in Bostonia are 6:00 AM to 6:29 AM (741, 19.6%) for males and 12:00 PM to 3:59 PM (489, 14.6%) for females.
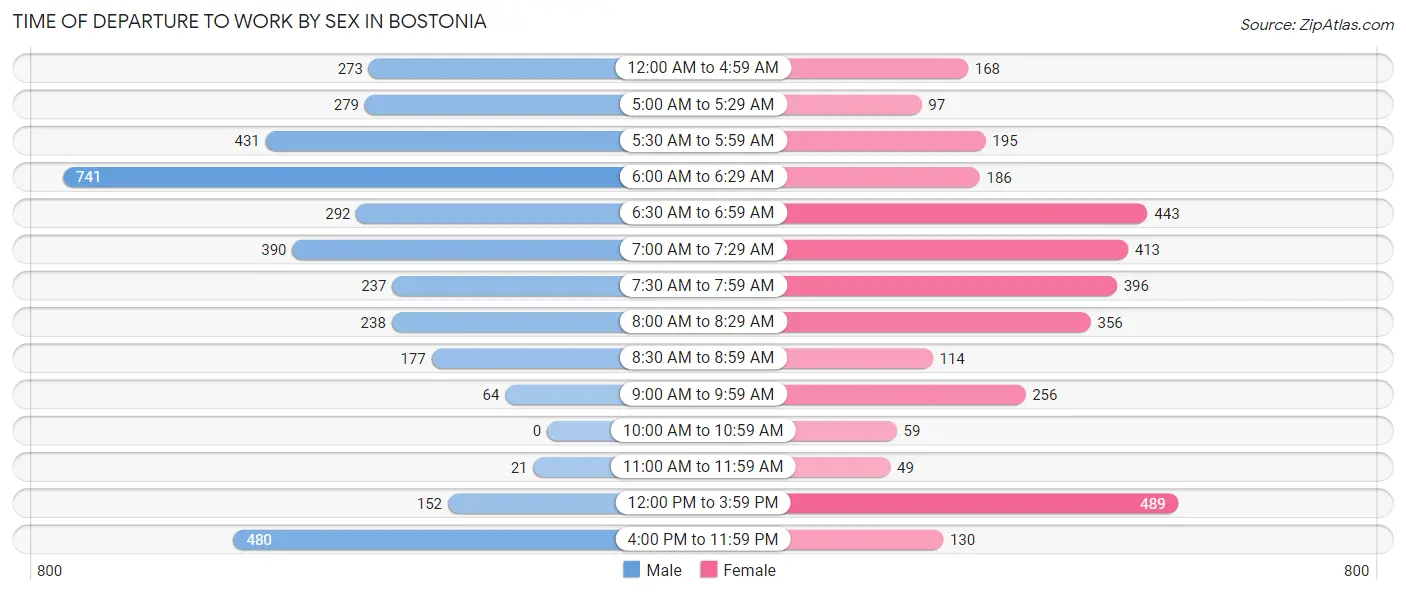
| Time of Departure | Male | Female |
| 12:00 AM to 4:59 AM | 273 (7.2%) | 168 (5.0%) |
| 5:00 AM to 5:29 AM | 279 (7.4%) | 97 (2.9%) |
| 5:30 AM to 5:59 AM | 431 (11.4%) | 195 (5.8%) |
| 6:00 AM to 6:29 AM | 741 (19.6%) | 186 (5.6%) |
| 6:30 AM to 6:59 AM | 292 (7.7%) | 443 (13.2%) |
| 7:00 AM to 7:29 AM | 390 (10.3%) | 413 (12.3%) |
| 7:30 AM to 7:59 AM | 237 (6.3%) | 396 (11.8%) |
| 8:00 AM to 8:29 AM | 238 (6.3%) | 356 (10.6%) |
| 8:30 AM to 8:59 AM | 177 (4.7%) | 114 (3.4%) |
| 9:00 AM to 9:59 AM | 64 (1.7%) | 256 (7.6%) |
| 10:00 AM to 10:59 AM | 0 (0.0%) | 59 (1.8%) |
| 11:00 AM to 11:59 AM | 21 (0.6%) | 49 (1.5%) |
| 12:00 PM to 3:59 PM | 152 (4.0%) | 489 (14.6%) |
| 4:00 PM to 11:59 PM | 480 (12.7%) | 130 (3.9%) |
| Total | 3,775 (100.0%) | 3,351 (100.0%) |
Housing Occupancy in Bostonia
Occupancy by Ownership in Bostonia
Of the total 5,748 dwellings in Bostonia, owner-occupied units account for 2,253 (39.2%), while renter-occupied units make up 3,495 (60.8%).
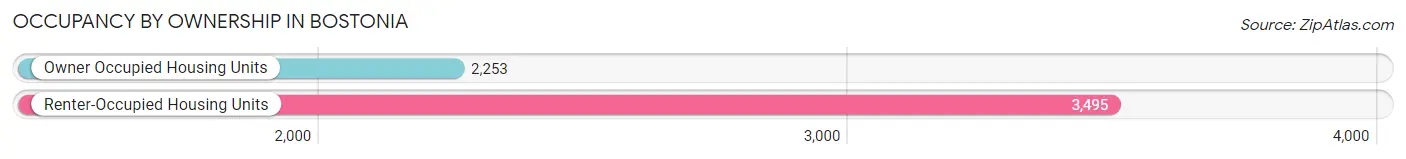
| Occupancy | # Housing Units | % Housing Units |
| Owner Occupied Housing Units | 2,253 | 39.2% |
| Renter-Occupied Housing Units | 3,495 | 60.8% |
| Total Occupied Housing Units | 5,748 | 100.0% |
Occupancy by Household Size in Bostonia
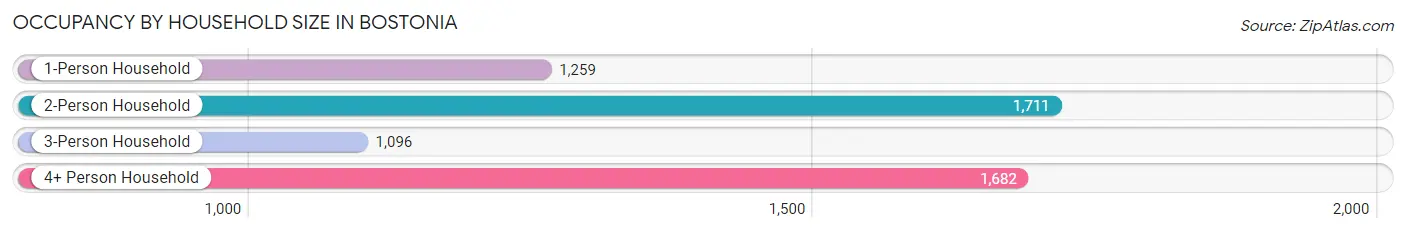
| Household Size | # Housing Units | % Housing Units |
| 1-Person Household | 1,259 | 21.9% |
| 2-Person Household | 1,711 | 29.8% |
| 3-Person Household | 1,096 | 19.1% |
| 4+ Person Household | 1,682 | 29.3% |
| Total Housing Units | 5,748 | 100.0% |
Occupancy by Ownership by Household Size in Bostonia
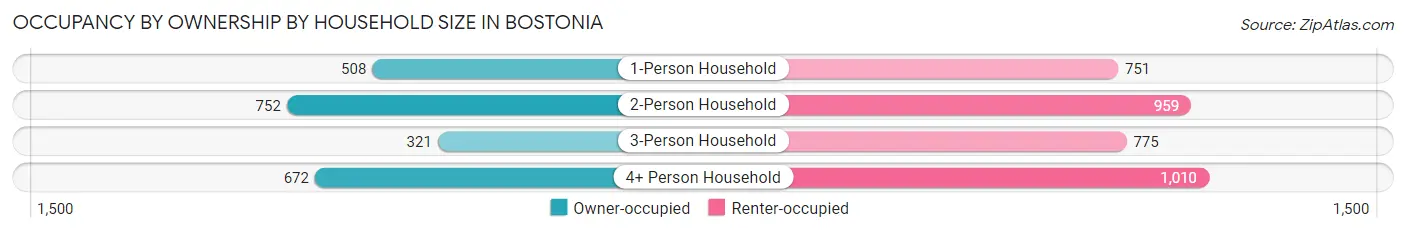
| Household Size | Owner-occupied | Renter-occupied |
| 1-Person Household | 508 (40.4%) | 751 (59.7%) |
| 2-Person Household | 752 (44.0%) | 959 (56.0%) |
| 3-Person Household | 321 (29.3%) | 775 (70.7%) |
| 4+ Person Household | 672 (40.0%) | 1,010 (60.1%) |
| Total Housing Units | 2,253 (39.2%) | 3,495 (60.8%) |
Occupancy by Educational Attainment in Bostonia
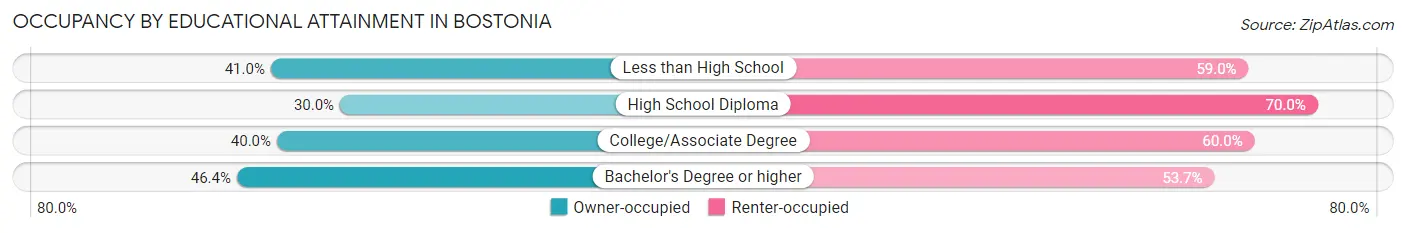
| Household Size | Owner-occupied | Renter-occupied |
| Less than High School | 256 (41.0%) | 369 (59.0%) |
| High School Diploma | 429 (30.0%) | 1,002 (70.0%) |
| College/Associate Degree | 901 (40.0%) | 1,352 (60.0%) |
| Bachelor's Degree or higher | 667 (46.4%) | 772 (53.6%) |
Occupancy by Age of Householder in Bostonia
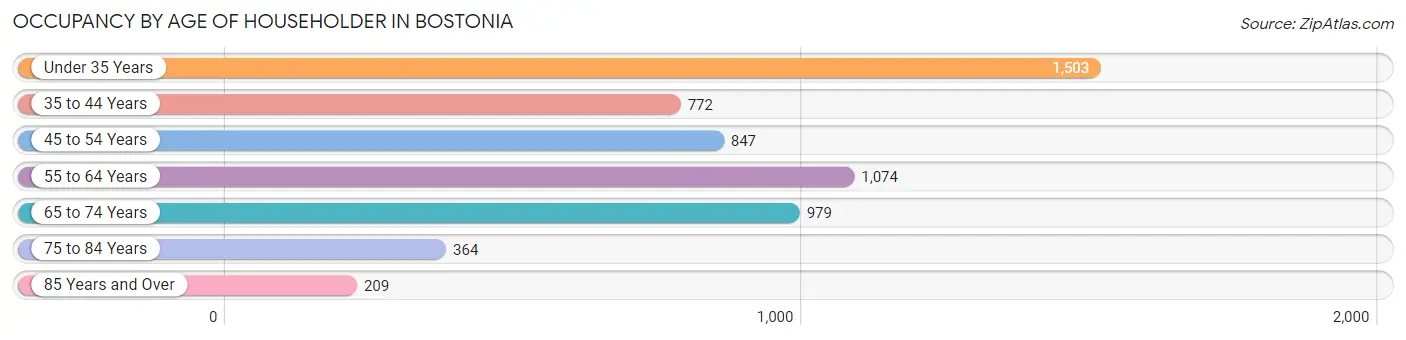
| Age Bracket | # Households | % Households |
| Under 35 Years | 1,503 | 26.2% |
| 35 to 44 Years | 772 | 13.4% |
| 45 to 54 Years | 847 | 14.7% |
| 55 to 64 Years | 1,074 | 18.7% |
| 65 to 74 Years | 979 | 17.0% |
| 75 to 84 Years | 364 | 6.3% |
| 85 Years and Over | 209 | 3.6% |
| Total | 5,748 | 100.0% |
Housing Finances in Bostonia
Median Income by Occupancy in Bostonia
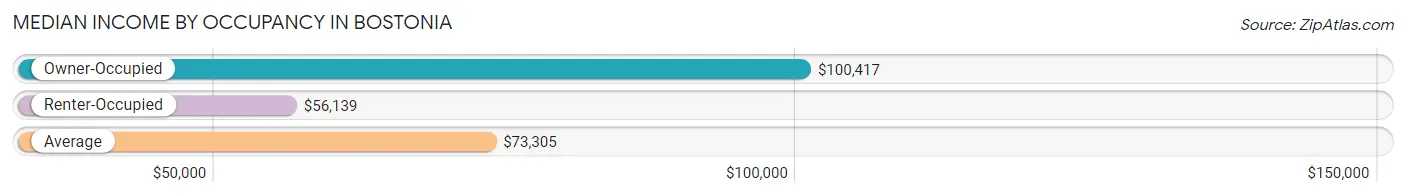
| Occupancy Type | # Households | Median Income |
| Owner-Occupied | 2,253 (39.2%) | $100,417 |
| Renter-Occupied | 3,495 (60.8%) | $56,139 |
| Average | 5,748 (100.0%) | $73,305 |
Occupancy by Householder Income Bracket in Bostonia
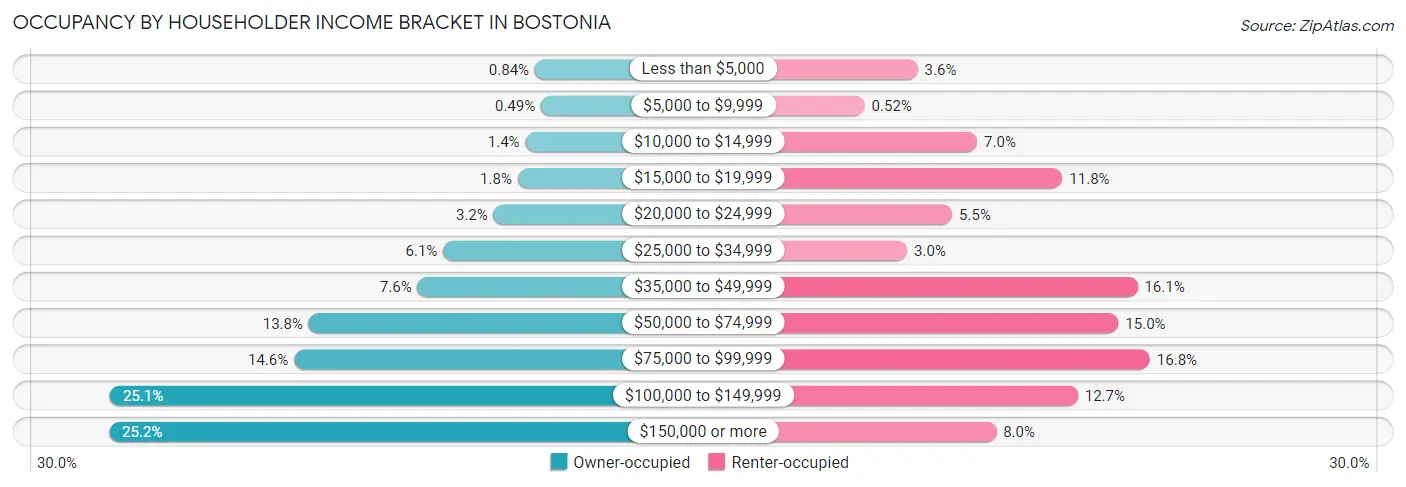
| Income Bracket | Owner-occupied | Renter-occupied |
| Less than $5,000 | 19 (0.8%) | 124 (3.5%) |
| $5,000 to $9,999 | 11 (0.5%) | 18 (0.5%) |
| $10,000 to $14,999 | 31 (1.4%) | 243 (7.0%) |
| $15,000 to $19,999 | 41 (1.8%) | 413 (11.8%) |
| $20,000 to $24,999 | 72 (3.2%) | 193 (5.5%) |
| $25,000 to $34,999 | 137 (6.1%) | 103 (2.9%) |
| $35,000 to $49,999 | 170 (7.5%) | 563 (16.1%) |
| $50,000 to $74,999 | 310 (13.8%) | 525 (15.0%) |
| $75,000 to $99,999 | 329 (14.6%) | 588 (16.8%) |
| $100,000 to $149,999 | 566 (25.1%) | 444 (12.7%) |
| $150,000 or more | 567 (25.2%) | 281 (8.0%) |
| Total | 2,253 (100.0%) | 3,495 (100.0%) |
Monthly Housing Cost Tiers in Bostonia
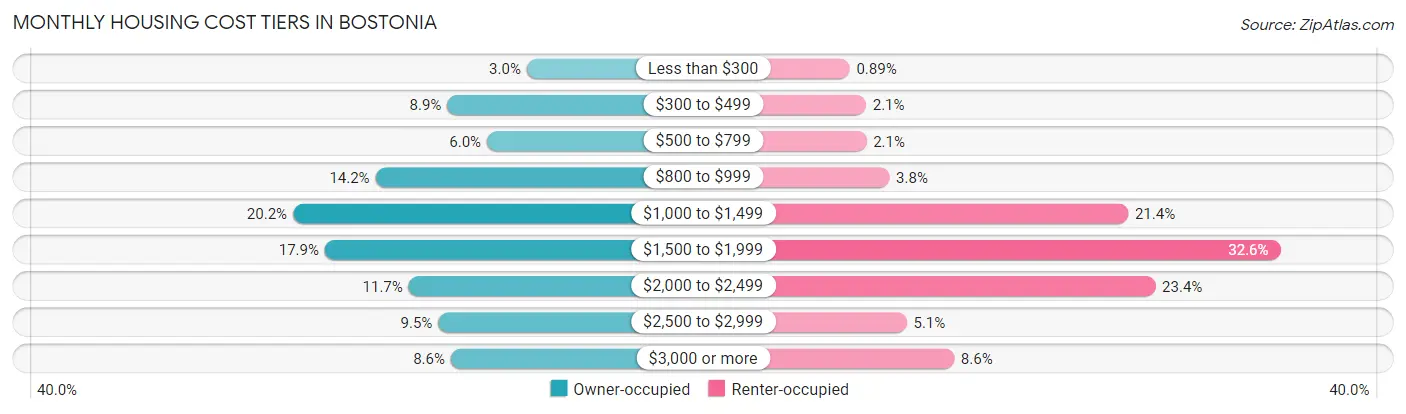
| Monthly Cost | Owner-occupied | Renter-occupied |
| Less than $300 | 68 (3.0%) | 31 (0.9%) |
| $300 to $499 | 200 (8.9%) | 73 (2.1%) |
| $500 to $799 | 134 (5.9%) | 74 (2.1%) |
| $800 to $999 | 319 (14.2%) | 133 (3.8%) |
| $1,000 to $1,499 | 456 (20.2%) | 748 (21.4%) |
| $1,500 to $1,999 | 403 (17.9%) | 1,140 (32.6%) |
| $2,000 to $2,499 | 264 (11.7%) | 818 (23.4%) |
| $2,500 to $2,999 | 215 (9.5%) | 178 (5.1%) |
| $3,000 or more | 194 (8.6%) | 300 (8.6%) |
| Total | 2,253 (100.0%) | 3,495 (100.0%) |
Physical Housing Characteristics in Bostonia
Housing Structures in Bostonia
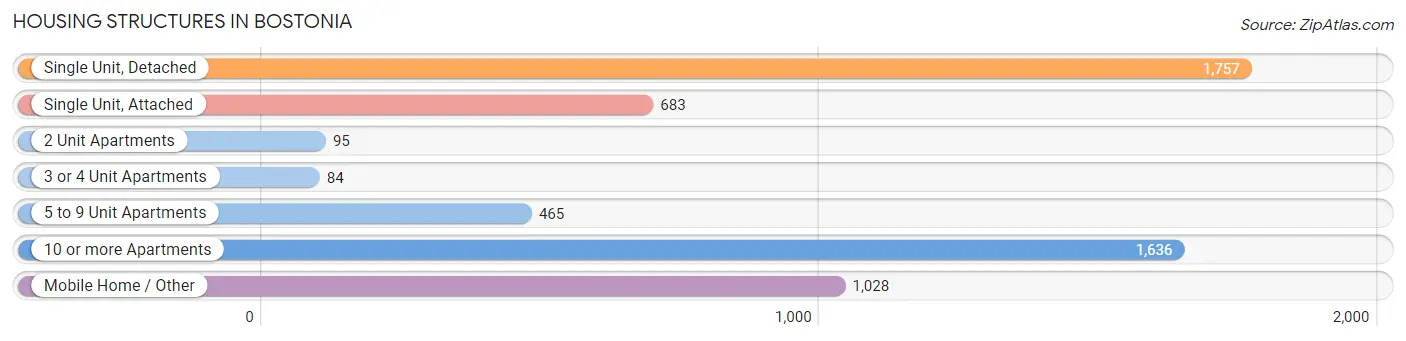
| Structure Type | # Housing Units | % Housing Units |
| Single Unit, Detached | 1,757 | 30.6% |
| Single Unit, Attached | 683 | 11.9% |
| 2 Unit Apartments | 95 | 1.7% |
| 3 or 4 Unit Apartments | 84 | 1.5% |
| 5 to 9 Unit Apartments | 465 | 8.1% |
| 10 or more Apartments | 1,636 | 28.5% |
| Mobile Home / Other | 1,028 | 17.9% |
| Total | 5,748 | 100.0% |
Housing Structures by Occupancy in Bostonia
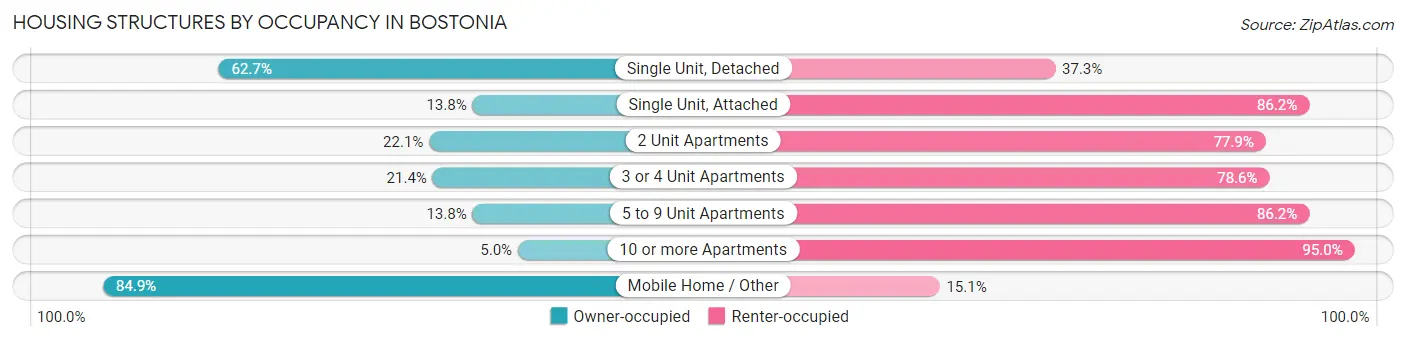
| Structure Type | Owner-occupied | Renter-occupied |
| Single Unit, Detached | 1,101 (62.7%) | 656 (37.3%) |
| Single Unit, Attached | 94 (13.8%) | 589 (86.2%) |
| 2 Unit Apartments | 21 (22.1%) | 74 (77.9%) |
| 3 or 4 Unit Apartments | 18 (21.4%) | 66 (78.6%) |
| 5 to 9 Unit Apartments | 64 (13.8%) | 401 (86.2%) |
| 10 or more Apartments | 82 (5.0%) | 1,554 (95.0%) |
| Mobile Home / Other | 873 (84.9%) | 155 (15.1%) |
| Total | 2,253 (39.2%) | 3,495 (60.8%) |
Housing Structures by Number of Rooms in Bostonia
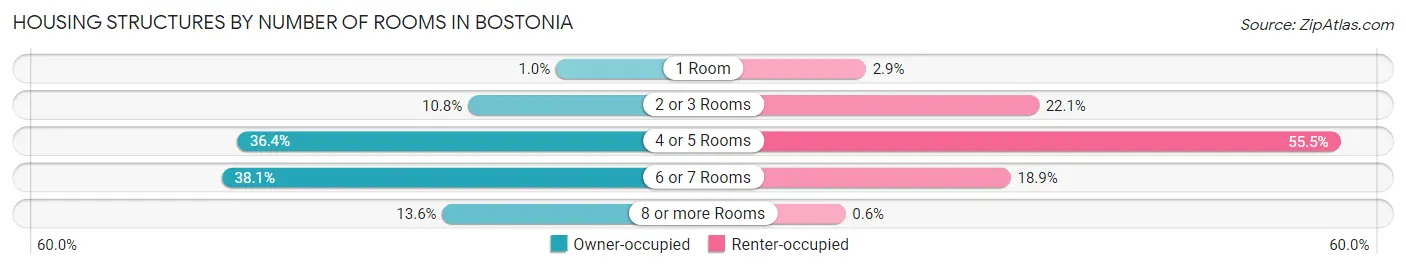
| Number of Rooms | Owner-occupied | Renter-occupied |
| 1 Room | 23 (1.0%) | 100 (2.9%) |
| 2 or 3 Rooms | 243 (10.8%) | 771 (22.1%) |
| 4 or 5 Rooms | 821 (36.4%) | 1,941 (55.5%) |
| 6 or 7 Rooms | 859 (38.1%) | 662 (18.9%) |
| 8 or more Rooms | 307 (13.6%) | 21 (0.6%) |
| Total | 2,253 (100.0%) | 3,495 (100.0%) |
Housing Structure by Heating Type in Bostonia
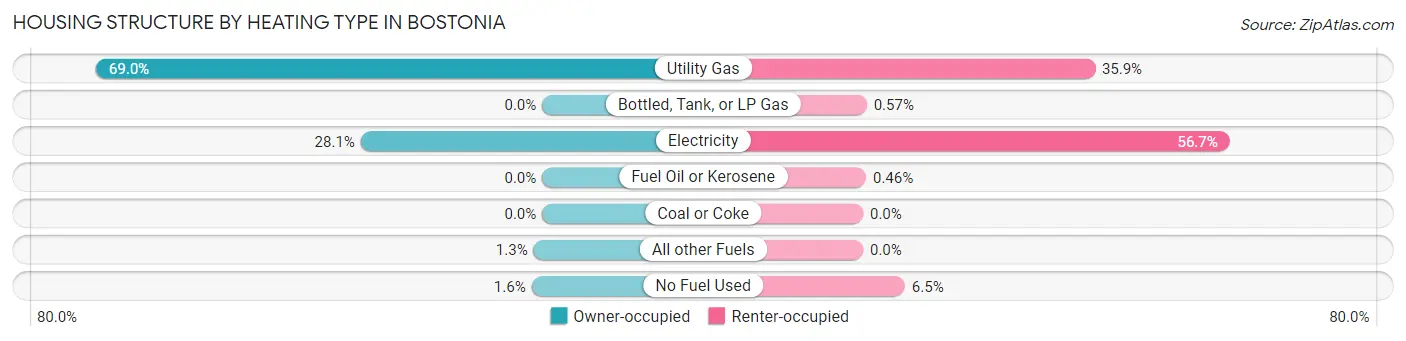
| Heating Type | Owner-occupied | Renter-occupied |
| Utility Gas | 1,554 (69.0%) | 1,253 (35.8%) |
| Bottled, Tank, or LP Gas | 0 (0.0%) | 20 (0.6%) |
| Electricity | 632 (28.1%) | 1,980 (56.7%) |
| Fuel Oil or Kerosene | 0 (0.0%) | 16 (0.5%) |
| Coal or Coke | 0 (0.0%) | 0 (0.0%) |
| All other Fuels | 30 (1.3%) | 0 (0.0%) |
| No Fuel Used | 37 (1.6%) | 226 (6.5%) |
| Total | 2,253 (100.0%) | 3,495 (100.0%) |
Household Vehicle Usage in Bostonia
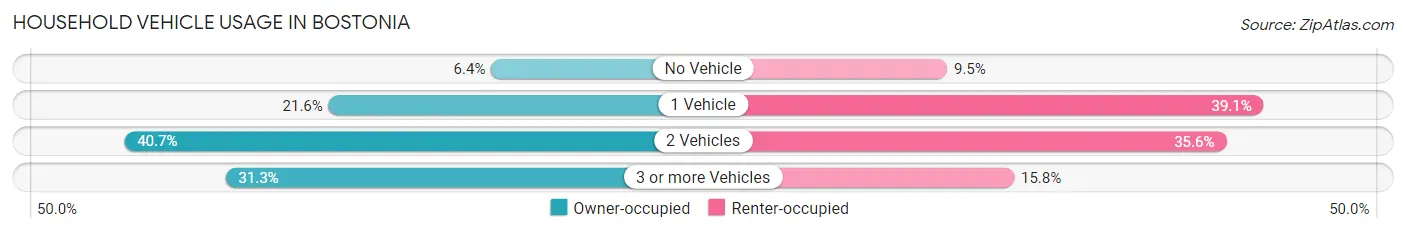
| Vehicles per Household | Owner-occupied | Renter-occupied |
| No Vehicle | 145 (6.4%) | 333 (9.5%) |
| 1 Vehicle | 487 (21.6%) | 1,366 (39.1%) |
| 2 Vehicles | 917 (40.7%) | 1,244 (35.6%) |
| 3 or more Vehicles | 704 (31.2%) | 552 (15.8%) |
| Total | 2,253 (100.0%) | 3,495 (100.0%) |
Real Estate & Mortgages in Bostonia
Real Estate and Mortgage Overview in Bostonia
| Characteristic | Without Mortgage | With Mortgage |
| Housing Units | 1,111 | 1,142 |
| Median Property Value | $151,100 | $557,200 |
| Median Household Income | $75,710 | $393 |
| Monthly Housing Costs | $1,001 | $194 |
| Real Estate Taxes | $1,383 | $102 |
Property Value by Mortgage Status in Bostonia
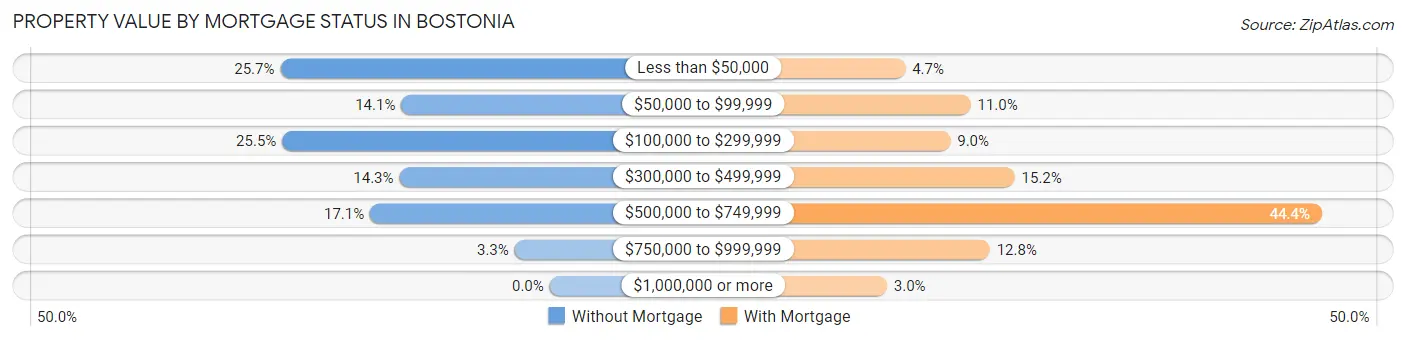
| Property Value | Without Mortgage | With Mortgage |
| Less than $50,000 | 285 (25.7%) | 54 (4.7%) |
| $50,000 to $99,999 | 157 (14.1%) | 125 (11.0%) |
| $100,000 to $299,999 | 283 (25.5%) | 103 (9.0%) |
| $300,000 to $499,999 | 159 (14.3%) | 173 (15.1%) |
| $500,000 to $749,999 | 190 (17.1%) | 507 (44.4%) |
| $750,000 to $999,999 | 37 (3.3%) | 146 (12.8%) |
| $1,000,000 or more | 0 (0.0%) | 34 (3.0%) |
| Total | 1,111 (100.0%) | 1,142 (100.0%) |
Household Income by Mortgage Status in Bostonia
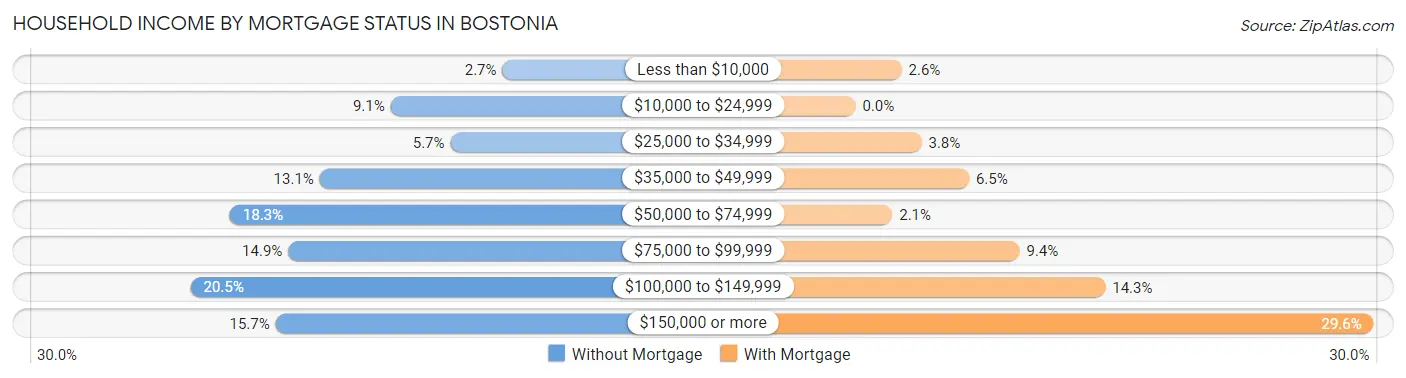
| Household Income | Without Mortgage | With Mortgage |
| Less than $10,000 | 30 (2.7%) | 30 (2.6%) |
| $10,000 to $24,999 | 101 (9.1%) | 0 (0.0%) |
| $25,000 to $34,999 | 63 (5.7%) | 43 (3.8%) |
| $35,000 to $49,999 | 146 (13.1%) | 74 (6.5%) |
| $50,000 to $74,999 | 203 (18.3%) | 24 (2.1%) |
| $75,000 to $99,999 | 166 (14.9%) | 107 (9.4%) |
| $100,000 to $149,999 | 228 (20.5%) | 163 (14.3%) |
| $150,000 or more | 174 (15.7%) | 338 (29.6%) |
| Total | 1,111 (100.0%) | 1,142 (100.0%) |
Property Value to Household Income Ratio in Bostonia
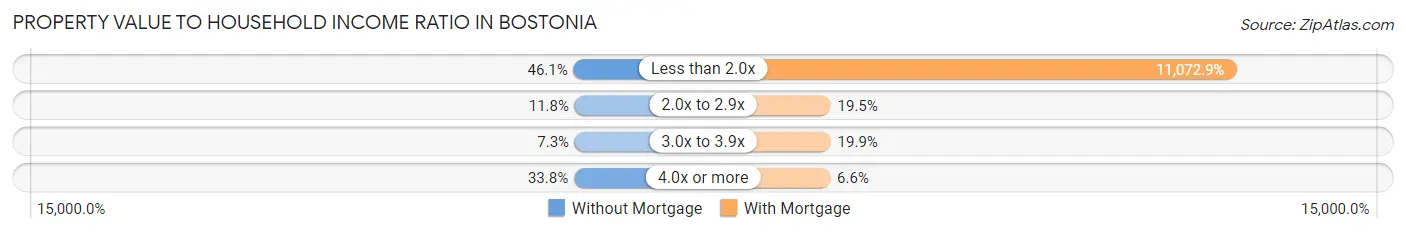
| Value-to-Income Ratio | Without Mortgage | With Mortgage |
| Less than 2.0x | 512 (46.1%) | 126,452 (11,072.8%) |
| 2.0x to 2.9x | 131 (11.8%) | 223 (19.5%) |
| 3.0x to 3.9x | 81 (7.3%) | 227 (19.9%) |
| 4.0x or more | 376 (33.8%) | 75 (6.6%) |
| Total | 1,111 (100.0%) | 1,142 (100.0%) |
Real Estate Taxes by Mortgage Status in Bostonia
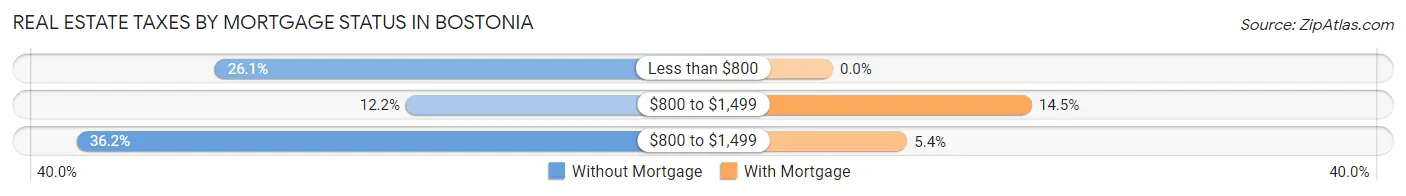
| Property Taxes | Without Mortgage | With Mortgage |
| Less than $800 | 290 (26.1%) | 0 (0.0%) |
| $800 to $1,499 | 135 (12.1%) | 166 (14.5%) |
| $800 to $1,499 | 402 (36.2%) | 62 (5.4%) |
| Total | 1,111 (100.0%) | 1,142 (100.0%) |
Health & Disability in Bostonia
Health Insurance Coverage by Age in Bostonia
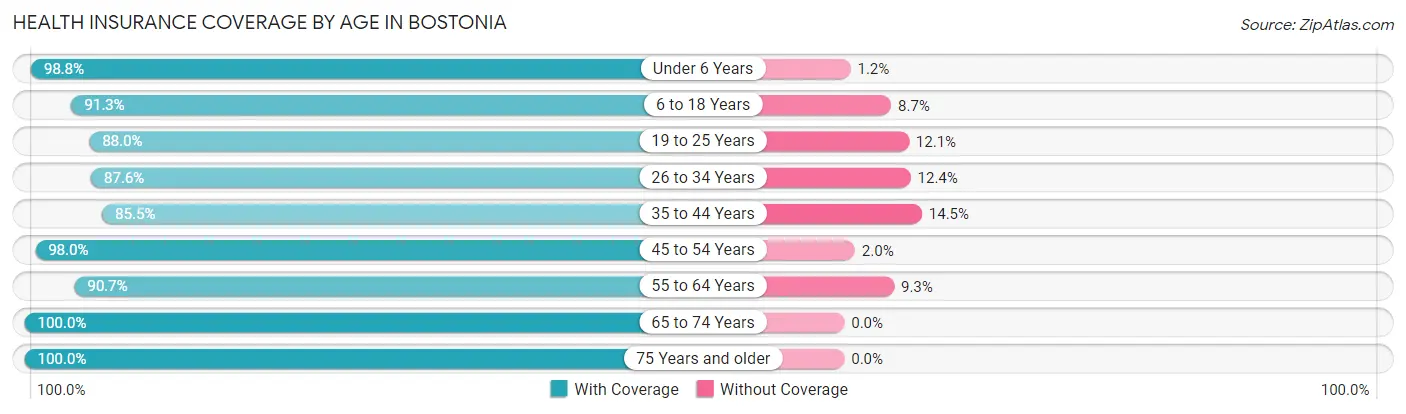
| Age Bracket | With Coverage | Without Coverage |
| Under 6 Years | 1,453 (98.8%) | 17 (1.2%) |
| 6 to 18 Years | 2,562 (91.3%) | 245 (8.7%) |
| 19 to 25 Years | 1,248 (87.9%) | 171 (12.0%) |
| 26 to 34 Years | 2,629 (87.6%) | 371 (12.4%) |
| 35 to 44 Years | 1,703 (85.5%) | 288 (14.5%) |
| 45 to 54 Years | 1,439 (98.0%) | 29 (2.0%) |
| 55 to 64 Years | 1,760 (90.7%) | 180 (9.3%) |
| 65 to 74 Years | 1,534 (100.0%) | 0 (0.0%) |
| 75 Years and older | 977 (100.0%) | 0 (0.0%) |
| Total | 15,305 (92.2%) | 1,301 (7.8%) |
Health Insurance Coverage by Citizenship Status in Bostonia
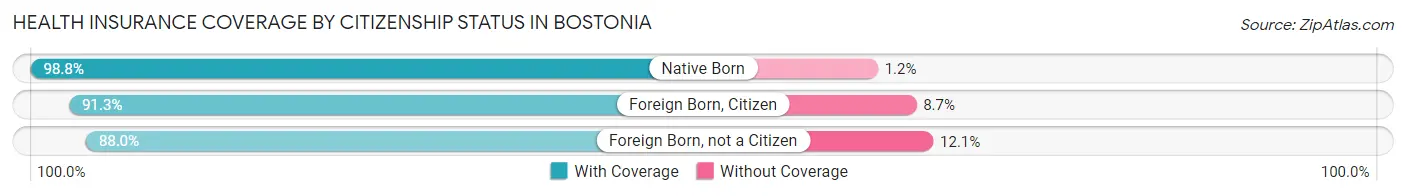
| Citizenship Status | With Coverage | Without Coverage |
| Native Born | 1,453 (98.8%) | 17 (1.2%) |
| Foreign Born, Citizen | 2,562 (91.3%) | 245 (8.7%) |
| Foreign Born, not a Citizen | 1,248 (87.9%) | 171 (12.0%) |
Health Insurance Coverage by Household Income in Bostonia
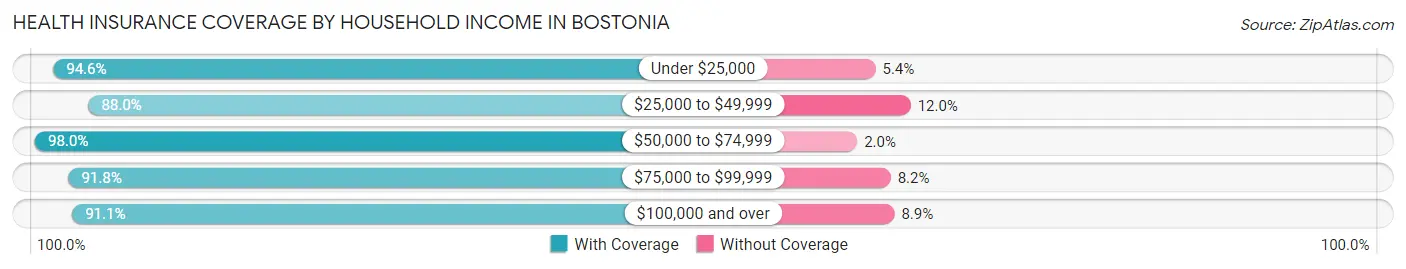
| Household Income | With Coverage | Without Coverage |
| Under $25,000 | 2,001 (94.6%) | 114 (5.4%) |
| $25,000 to $49,999 | 2,016 (88.0%) | 274 (12.0%) |
| $50,000 to $74,999 | 2,097 (98.0%) | 42 (2.0%) |
| $75,000 to $99,999 | 2,887 (91.8%) | 259 (8.2%) |
| $100,000 and over | 6,239 (91.1%) | 612 (8.9%) |
Public vs Private Health Insurance Coverage by Age in Bostonia
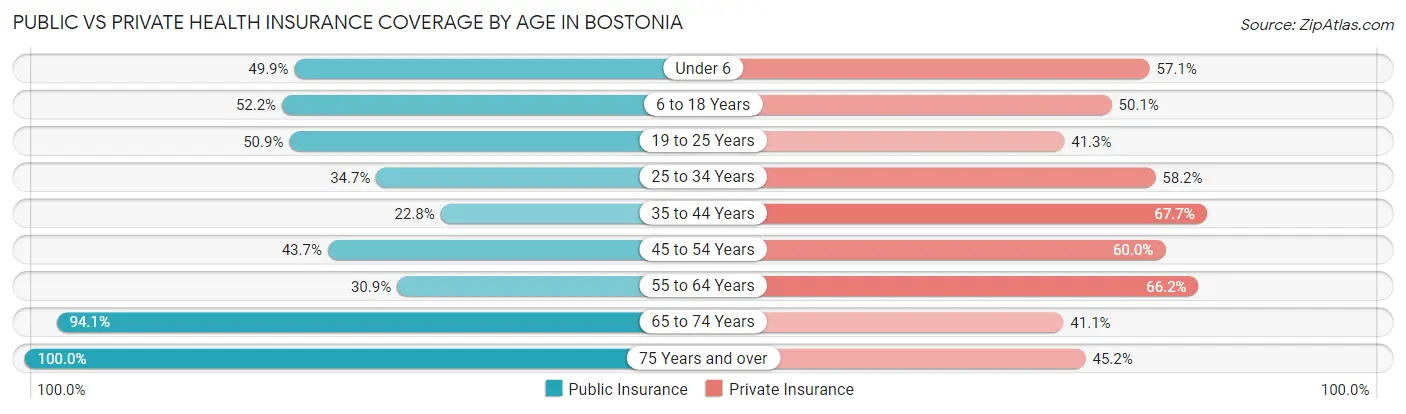
| Age Bracket | Public Insurance | Private Insurance |
| Under 6 | 734 (49.9%) | 840 (57.1%) |
| 6 to 18 Years | 1,466 (52.2%) | 1,406 (50.1%) |
| 19 to 25 Years | 722 (50.9%) | 586 (41.3%) |
| 25 to 34 Years | 1,042 (34.7%) | 1,746 (58.2%) |
| 35 to 44 Years | 454 (22.8%) | 1,348 (67.7%) |
| 45 to 54 Years | 642 (43.7%) | 881 (60.0%) |
| 55 to 64 Years | 599 (30.9%) | 1,284 (66.2%) |
| 65 to 74 Years | 1,443 (94.1%) | 631 (41.1%) |
| 75 Years and over | 977 (100.0%) | 442 (45.2%) |
| Total | 8,079 (48.6%) | 9,164 (55.2%) |
Disability Status by Sex by Age in Bostonia
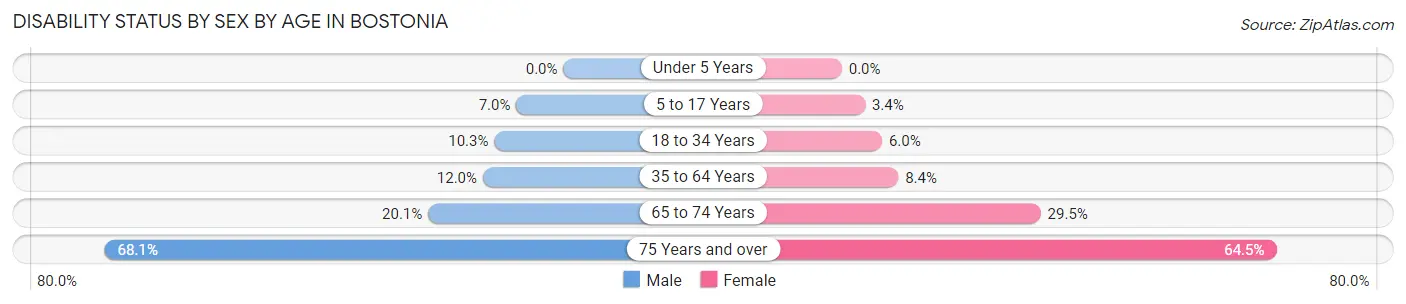
| Age Bracket | Male | Female |
| Under 5 Years | 0 (0.0%) | 0 (0.0%) |
| 5 to 17 Years | 106 (7.0%) | 48 (3.4%) |
| 18 to 34 Years | 212 (10.2%) | 153 (6.0%) |
| 35 to 64 Years | 296 (11.9%) | 245 (8.4%) |
| 65 to 74 Years | 155 (20.1%) | 225 (29.5%) |
| 75 Years and over | 203 (68.1%) | 438 (64.5%) |
Disability Class by Sex by Age in Bostonia
Disability Class: Hearing Difficulty
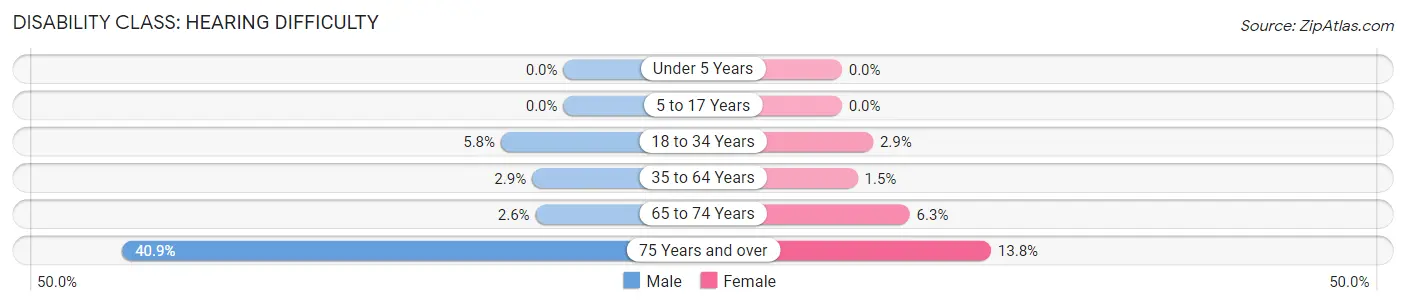
| Age Bracket | Male | Female |
| Under 5 Years | 0 (0.0%) | 0 (0.0%) |
| 5 to 17 Years | 0 (0.0%) | 0 (0.0%) |
| 18 to 34 Years | 120 (5.8%) | 74 (2.9%) |
| 35 to 64 Years | 72 (2.9%) | 43 (1.5%) |
| 65 to 74 Years | 20 (2.6%) | 48 (6.3%) |
| 75 Years and over | 122 (40.9%) | 94 (13.8%) |
Disability Class: Vision Difficulty
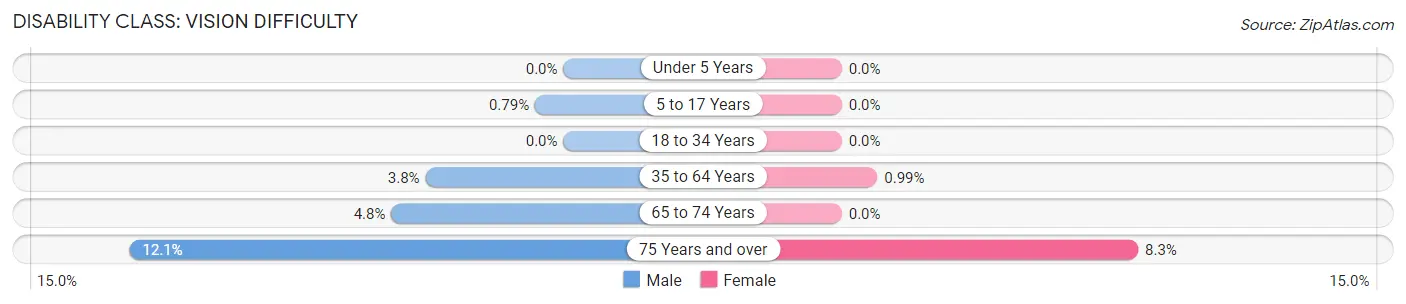
| Age Bracket | Male | Female |
| Under 5 Years | 0 (0.0%) | 0 (0.0%) |
| 5 to 17 Years | 12 (0.8%) | 0 (0.0%) |
| 18 to 34 Years | 0 (0.0%) | 0 (0.0%) |
| 35 to 64 Years | 95 (3.8%) | 29 (1.0%) |
| 65 to 74 Years | 37 (4.8%) | 0 (0.0%) |
| 75 Years and over | 36 (12.1%) | 56 (8.3%) |
Disability Class: Cognitive Difficulty
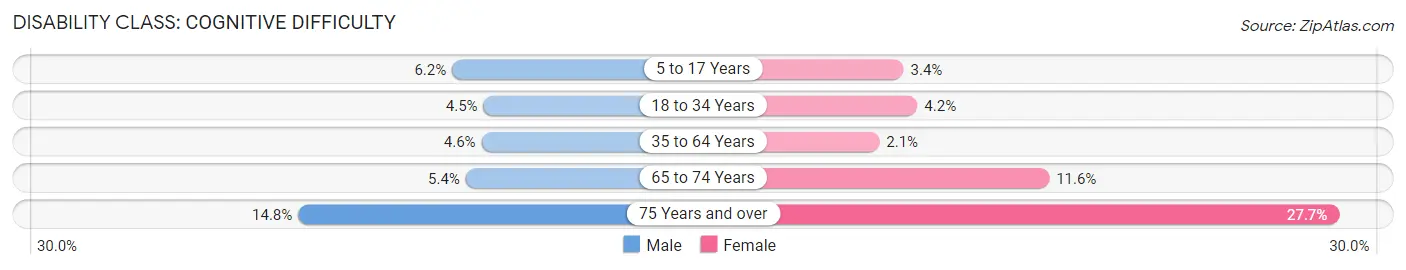
| Age Bracket | Male | Female |
| 5 to 17 Years | 94 (6.2%) | 48 (3.4%) |
| 18 to 34 Years | 92 (4.4%) | 108 (4.2%) |
| 35 to 64 Years | 113 (4.6%) | 61 (2.1%) |
| 65 to 74 Years | 42 (5.4%) | 88 (11.6%) |
| 75 Years and over | 44 (14.8%) | 188 (27.7%) |
Disability Class: Ambulatory Difficulty
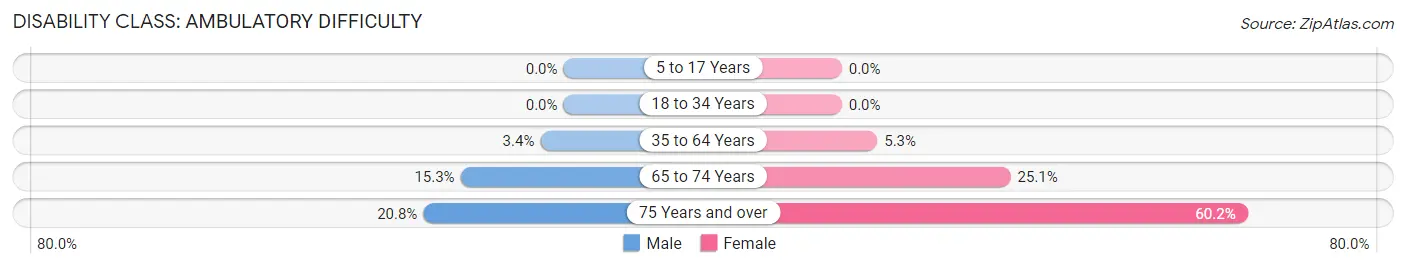
| Age Bracket | Male | Female |
| 5 to 17 Years | 0 (0.0%) | 0 (0.0%) |
| 18 to 34 Years | 0 (0.0%) | 0 (0.0%) |
| 35 to 64 Years | 85 (3.4%) | 154 (5.3%) |
| 65 to 74 Years | 118 (15.3%) | 191 (25.1%) |
| 75 Years and over | 62 (20.8%) | 409 (60.2%) |
Disability Class: Self-Care Difficulty
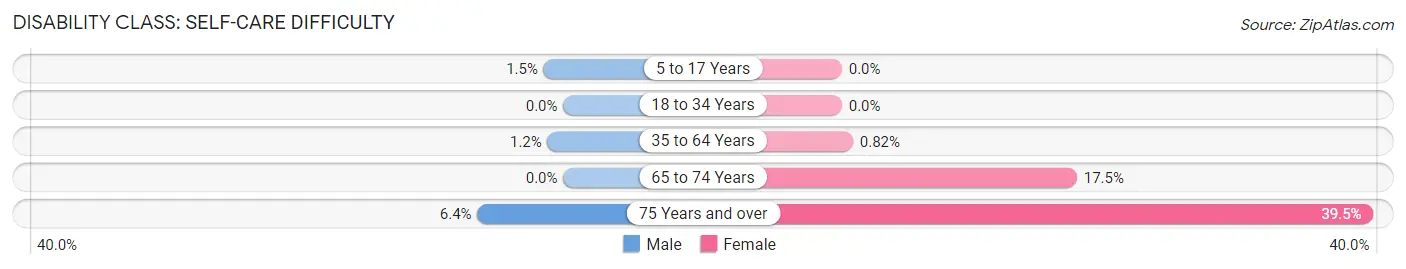
| Age Bracket | Male | Female |
| 5 to 17 Years | 22 (1.5%) | 0 (0.0%) |
| 18 to 34 Years | 0 (0.0%) | 0 (0.0%) |
| 35 to 64 Years | 29 (1.2%) | 24 (0.8%) |
| 65 to 74 Years | 0 (0.0%) | 133 (17.4%) |
| 75 Years and over | 19 (6.4%) | 268 (39.5%) |
Technology Access in Bostonia
Computing Device Access in Bostonia
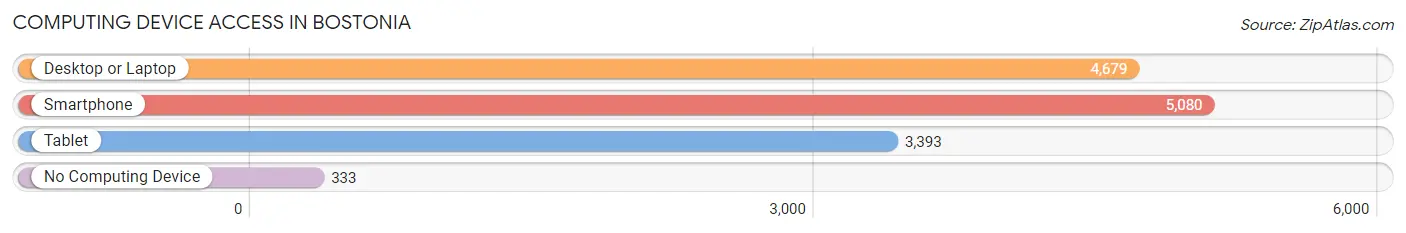
| Device Type | # Households | % Households |
| Desktop or Laptop | 4,679 | 81.4% |
| Smartphone | 5,080 | 88.4% |
| Tablet | 3,393 | 59.0% |
| No Computing Device | 333 | 5.8% |
| Total | 5,748 | 100.0% |
Internet Access in Bostonia
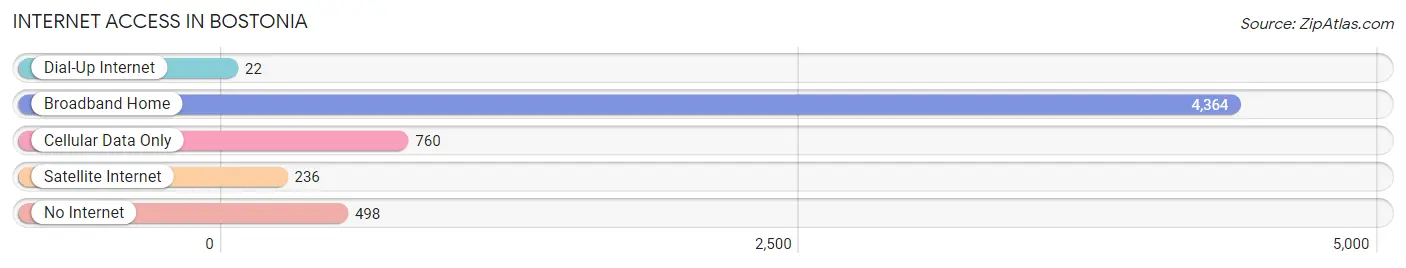
| Internet Type | # Households | % Households |
| Dial-Up Internet | 22 | 0.4% |
| Broadband Home | 4,364 | 75.9% |
| Cellular Data Only | 760 | 13.2% |
| Satellite Internet | 236 | 4.1% |
| No Internet | 498 | 8.7% |
| Total | 5,748 | 100.0% |
Bostonia Summary
History
The city of Bostonia, California is located in the San Diego County of Southern California. It is a small city with a population of approximately 10,000 people. The city was founded in 1887 by a group of settlers from Boston, Massachusetts. The settlers named the city after their hometown and it has been known as Bostonia ever since.
The city was originally a farming community, with the main crops being wheat, barley, and oats. The city also had a thriving dairy industry, with several local dairies producing milk and other dairy products. The city was also home to a number of small businesses, including a blacksmith, a general store, and a post office.
In the early 1900s, the city began to grow and develop. The population increased and the city began to attract more businesses. The city was home to a number of small manufacturing companies, including a furniture factory, a cannery, and a shoe factory. The city also had a number of small retail stores, including a grocery store, a drug store, and a hardware store.
The city continued to grow and develop throughout the 20th century. In the 1950s, the city was home to a number of new businesses, including a bowling alley, a movie theater, and a drive-in restaurant. The city also had a number of new residential developments, including a number of new subdivisions.
In the late 20th century, the city began to experience a decline in population and businesses. The city was hit hard by the recession of the early 2000s and many businesses closed their doors. The city has since been working to revitalize its economy and attract new businesses and residents.
Geography
Bostonia is located in the San Diego County of Southern California. It is situated in the foothills of the Cuyamaca Mountains, about 25 miles east of downtown San Diego. The city is bordered by the cities of El Cajon, La Mesa, and Lemon Grove.
The city has a total area of 2.3 square miles, all of which is land. The city is located at an elevation of approximately 1,000 feet above sea level. The climate in Bostonia is mild and temperate, with temperatures ranging from the mid-50s in the winter to the mid-80s in the summer.
Economy
The economy of Bostonia is largely based on the service industry. The city is home to a number of small businesses, including restaurants, retail stores, and professional services. The city also has a number of manufacturing companies, including a furniture factory, a cannery, and a shoe factory.
The city is also home to a number of government offices, including the San Diego County Sheriff’s Office and the San Diego County Fire Department. The city is also home to a number of educational institutions, including a community college and a number of elementary and secondary schools.
Demographics
As of the 2010 census, the population of Bostonia was 10,092. The population is largely white (77.3%), with a small Hispanic population (14.2%) and a small African American population (3.2%). The median household income in the city is $50,945, and the median home value is $323,000. The city has a high rate of homeownership (76.2%) and a low rate of poverty (7.2%).
Common Questions
What is the Total Population of Bostonia?
Total Population of Bostonia is 16,850.
What is the Total Male Population of Bostonia?
Total Male Population of Bostonia is 8,024.
What is the Total Female Population of Bostonia?
Total Female Population of Bostonia is 8,826.
What is the Ratio of Males per 100 Females in Bostonia?
There are 90.91 Males per 100 Females in Bostonia.
What is the Ratio of Females per 100 Males in Bostonia?
There are 110.00 Females per 100 Males in Bostonia.
What is the Median Population Age in Bostonia?
Median Population Age in Bostonia is 33.4 Years.
What is the Average Family Size in Bostonia
Average Family Size in Bostonia is 3.5 People.
What is the Average Household Size in Bostonia
Average Household Size in Bostonia is 2.9 People.
What is Per Capita Income in Bostonia?
Per Capita income in Bostonia is $31,020.
What is the Median Family Income in Bostonia?
Median Family Income in Bostonia is $86,984.
What is the Median Household income in Bostonia?
Median Household Income in Bostonia is $73,305.
What is Income or Wage Gap in Bostonia?
Income or Wage Gap in Bostonia is 25.4%.
Women in Bostonia earn 74.6 cents for every dollar earned by a man.
What is Family Income Deficit in Bostonia?
Family Income Deficit in Bostonia is $9,164.
Families that are below poverty line in Bostonia earn $9,164 less on average than the poverty threshold level.
What is Inequality or Gini Index in Bostonia?
Inequality or Gini Index in Bostonia is 0.43.
How Large is the Labor Force in Bostonia?
There are 8,773 People in the Labor Forcein in Bostonia.
What is the Percentage of People in the Labor Force in Bostonia?
66.5% of People are in the Labor Force in Bostonia.
What is the Unemployment Rate in Bostonia?
Unemployment Rate in Bostonia is 8.6%.