Bombay Beach, CA
Bombay Beach Map
Bombay Beach Overview
242
TOTAL POPULATION
142
MALE POPULATION
100
FEMALE POPULATION
142.00
MALES / 100 FEMALES
70.42
FEMALES / 100 MALES
33.8
MEDIAN AGE
3.2
AVG FAMILY SIZE
2.2
AVG HOUSEHOLD SIZE
$11,881
PER CAPITA INCOME
$22,344
AVG HOUSEHOLD INCOME
0.42
INEQUALITY / GINI INDEX
82
LABOR FORCE [ PEOPLE ]
47.1%
PERCENT IN LABOR FORCE
14.3%
UNEMPLOYMENT RATE
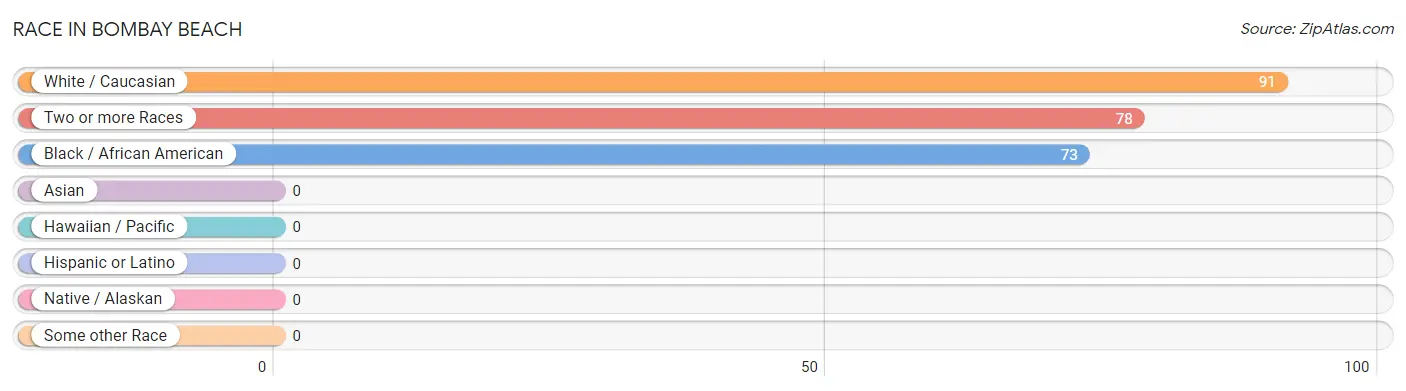
Race in Bombay Beach
The most populous races in Bombay Beach are White / Caucasian (91 | 37.6%), Two or more Races (78 | 32.2%), and Black / African American (73 | 30.2%).
| Race | # Population | % Population |
| Asian | 0 | 0.0% |
| Black / African American | 73 | 30.2% |
| Hawaiian / Pacific | 0 | 0.0% |
| Hispanic or Latino | 0 | 0.0% |
| Native / Alaskan | 0 | 0.0% |
| White / Caucasian | 91 | 37.6% |
| Two or more Races | 78 | 32.2% |
| Some other Race | 0 | 0.0% |
| Total | 242 | 100.0% |
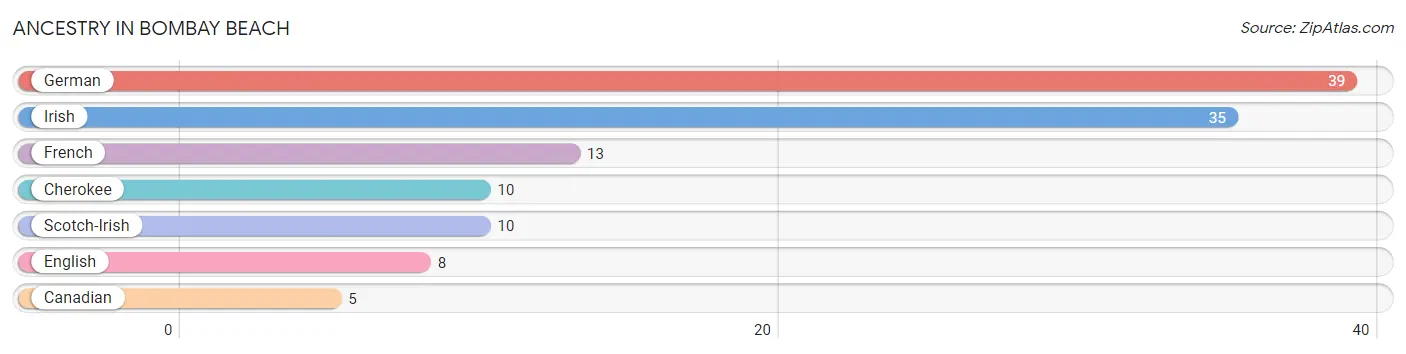
Ancestry in Bombay Beach
The most populous ancestries reported in Bombay Beach are German (39 | 16.1%), Irish (35 | 14.5%), French (13 | 5.4%), Cherokee (10 | 4.1%), and Scotch-Irish (10 | 4.1%), together accounting for 44.2% of all Bombay Beach residents.
| Ancestry | # Population | % Population |
| Canadian | 5 | 2.1% |
| Cherokee | 10 | 4.1% |
| English | 8 | 3.3% |
| French | 13 | 5.4% |
| German | 39 | 16.1% |
| Irish | 35 | 14.5% |
| Scotch-Irish | 10 | 4.1% | View All 7 Rows |
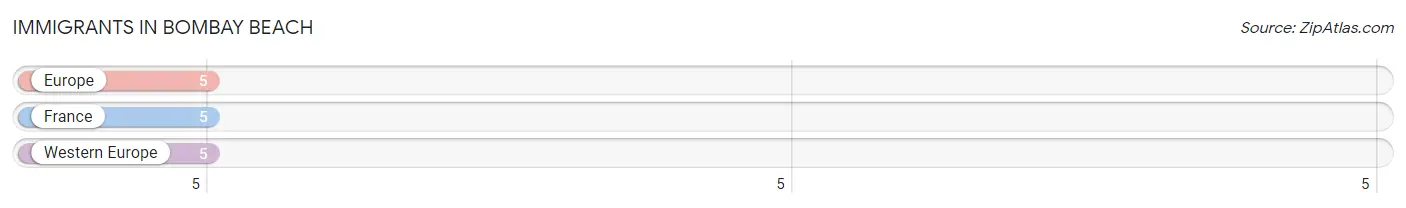
Immigrants in Bombay Beach
The most numerous immigrant groups reported in Bombay Beach came from Europe (5 | 2.1%), France (5 | 2.1%), and Western Europe (5 | 2.1%), together accounting for 6.2% of all Bombay Beach residents.
| Immigration Origin | # Population | % Population |
| Europe | 5 | 2.1% |
| France | 5 | 2.1% |
| Western Europe | 5 | 2.1% | View All 3 Rows |
Sex and Age in Bombay Beach
Sex and Age in Bombay Beach
The most populous age groups in Bombay Beach are 65 to 69 Years (47 | 33.1%) for men and Under 5 Years (34 | 34.0%) for women.

| Age Bracket | Male | Female |
| Under 5 Years | 0 (0.0%) | 34 (34.0%) |
| 5 to 9 Years | 0 (0.0%) | 0 (0.0%) |
| 10 to 14 Years | 0 (0.0%) | 34 (34.0%) |
| 15 to 19 Years | 0 (0.0%) | 0 (0.0%) |
| 20 to 24 Years | 0 (0.0%) | 0 (0.0%) |
| 25 to 29 Years | 0 (0.0%) | 0 (0.0%) |
| 30 to 34 Years | 44 (31.0%) | 19 (19.0%) |
| 35 to 39 Years | 0 (0.0%) | 0 (0.0%) |
| 40 to 44 Years | 0 (0.0%) | 0 (0.0%) |
| 45 to 49 Years | 8 (5.6%) | 0 (0.0%) |
| 50 to 54 Years | 21 (14.8%) | 0 (0.0%) |
| 55 to 59 Years | 0 (0.0%) | 0 (0.0%) |
| 60 to 64 Years | 11 (7.7%) | 5 (5.0%) |
| 65 to 69 Years | 47 (33.1%) | 0 (0.0%) |
| 70 to 74 Years | 8 (5.6%) | 0 (0.0%) |
| 75 to 79 Years | 0 (0.0%) | 0 (0.0%) |
| 80 to 84 Years | 0 (0.0%) | 0 (0.0%) |
| 85 Years and over | 3 (2.1%) | 8 (8.0%) |
| Total | 142 (100.0%) | 100 (100.0%) |
Families and Households in Bombay Beach
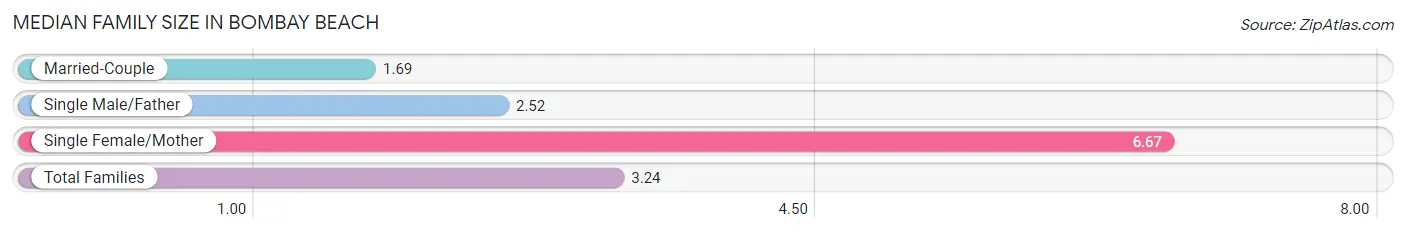
Median Family Size in Bombay Beach
The median family size in Bombay Beach is 3.24 persons per family, with single female/mother families (12 | 22.2%) accounting for the largest median family size of 6.67 persons per family. On the other hand, married-couple families (13 | 24.1%) represent the smallest median family size with 1.69 persons per family.
| Family Type | # Families | Family Size |
| Married-Couple | 13 (24.1%) | 1.69 |
| Single Male/Father | 29 (53.7%) | 2.52 |
| Single Female/Mother | 12 (22.2%) | 6.67 |
| Total Families | 54 (100.0%) | 3.24 |
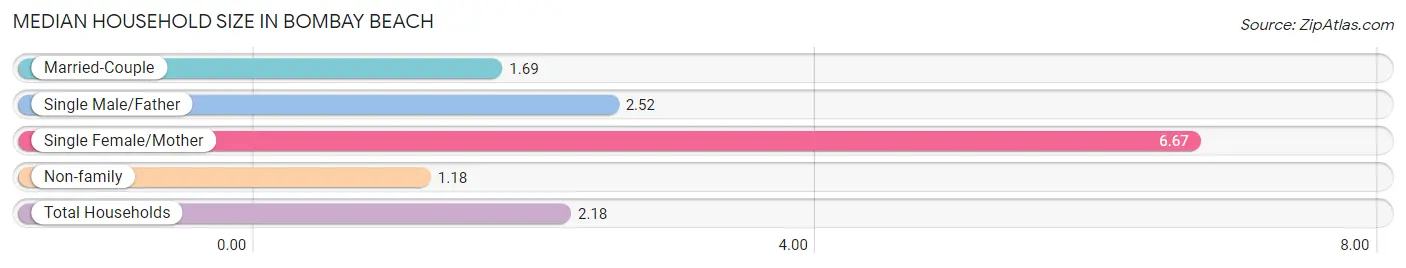
Median Household Size in Bombay Beach
The median household size in Bombay Beach is 2.18 persons per household, with single female/mother households (12 | 10.8%) accounting for the largest median household size of 6.67 persons per household. non-family households (57 | 51.3%) represent the smallest median household size with 1.18 persons per household.
| Household Type | # Households | Household Size |
| Married-Couple | 13 (11.7%) | 1.69 |
| Single Male/Father | 29 (26.1%) | 2.52 |
| Single Female/Mother | 12 (10.8%) | 6.67 |
| Non-family | 57 (51.3%) | 1.18 |
| Total Households | 111 (100.0%) | 2.18 |
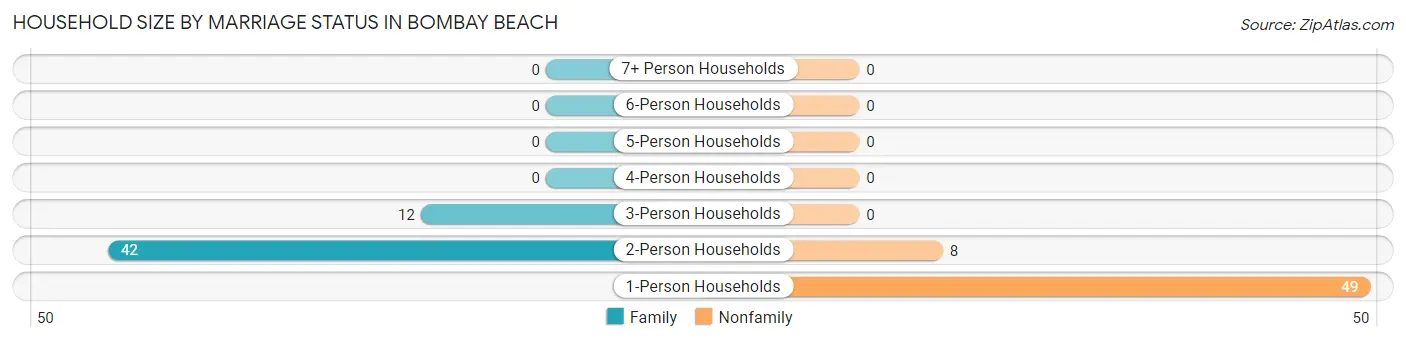
Household Size by Marriage Status in Bombay Beach
Out of a total of 111 households in Bombay Beach, 54 (48.6%) are family households, while 57 (51.3%) are nonfamily households. The most numerous type of family households are 2-person households, comprising 42, and the most common type of nonfamily households are 1-person households, comprising 49.
| Household Size | Family Households | Nonfamily Households |
| 1-Person Households | - | 49 (44.1%) |
| 2-Person Households | 42 (37.8%) | 8 (7.2%) |
| 3-Person Households | 12 (10.8%) | 0 (0.0%) |
| 4-Person Households | 0 (0.0%) | 0 (0.0%) |
| 5-Person Households | 0 (0.0%) | 0 (0.0%) |
| 6-Person Households | 0 (0.0%) | 0 (0.0%) |
| 7+ Person Households | 0 (0.0%) | 0 (0.0%) |
| Total | 54 (48.6%) | 57 (51.3%) |
Female Fertility in Bombay Beach
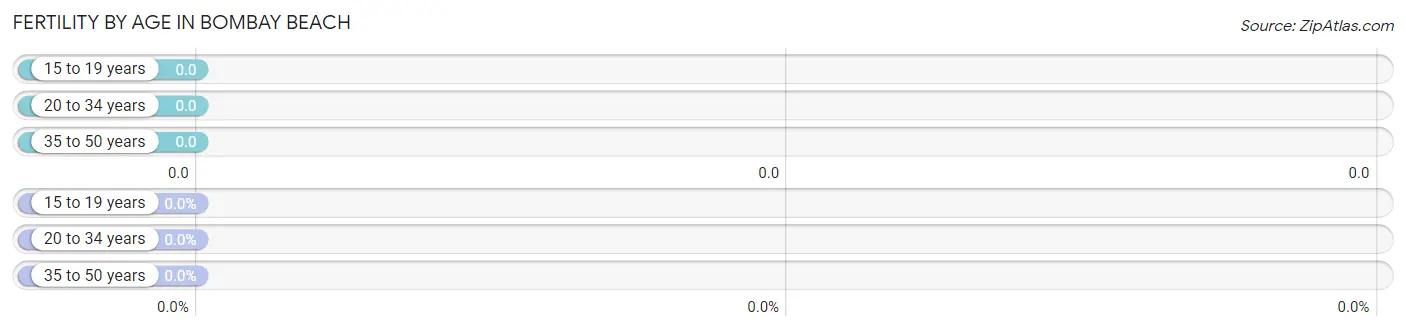
Fertility by Age in Bombay Beach
| Age Bracket | Women with Births | Births / 1,000 Women |
| 15 to 19 years | 0 (0.0%) | 0.0 |
| 20 to 34 years | 0 (0.0%) | 0.0 |
| 35 to 50 years | 0 (0.0%) | 0.0 |
| Total | 0 (0.0%) | 0.0 |
Fertility by Age by Marriage Status in Bombay Beach
| Age Bracket | Married | Unmarried |
| 15 to 19 years | 0 (0.0%) | 0 (0.0%) |
| 20 to 34 years | 0 (0.0%) | 0 (0.0%) |
| 35 to 50 years | 0 (0.0%) | 0 (0.0%) |
| Total | 0 (0.0%) | 0 (0.0%) |
Fertility by Education in Bombay Beach
| Educational Attainment | Women with Births | Births / 1,000 Women |
| Less than High School | 0 (0.0%) | 0.0 |
| High School Diploma | 0 (0.0%) | 0.0 |
| College or Associate's Degree | 0 (0.0%) | 0.0 |
| Bachelor's Degree | 0 (0.0%) | 0.0 |
| Graduate Degree | 0 (0.0%) | 0.0 |
| Total | 0 (0.0%) | 0.0 |
Fertility by Education by Marriage Status in Bombay Beach
| Educational Attainment | Married | Unmarried |
| Less than High School | 0 (0.0%) | 0 (0.0%) |
| High School Diploma | 0 (0.0%) | 0 (0.0%) |
| College or Associate's Degree | 0 (0.0%) | 0 (0.0%) |
| Bachelor's Degree | 0 (0.0%) | 0 (0.0%) |
| Graduate Degree | 0 (0.0%) | 0 (0.0%) |
| Total | 0 (0.0%) | 0 (0.0%) |
Income in Bombay Beach
Income Overview in Bombay Beach
| Characteristic | Number | Measure |
| Per Capita Income | 242 | $11,881 |
| Median Family Income | 54 | $0 |
| Mean Family Income | 54 | $13,631 |
| Median Household Income | 111 | $22,344 |
| Mean Household Income | 111 | $26,025 |
| Income Deficit | 54 | $0 |
| Wage / Income Gap (%) | 242 | 0.00% |
| Wage / Income Gap ($) | 242 | 100.00¢ per $1 |
| Gini / Inequality Index | 242 | 0.42 |
Earnings by Sex in Bombay Beach
| Sex | Number | Average Earnings |
| Male | 55 (76.4%) | $0 |
| Female | 17 (23.6%) | $0 |
| Total | 72 (100.0%) | $0 |
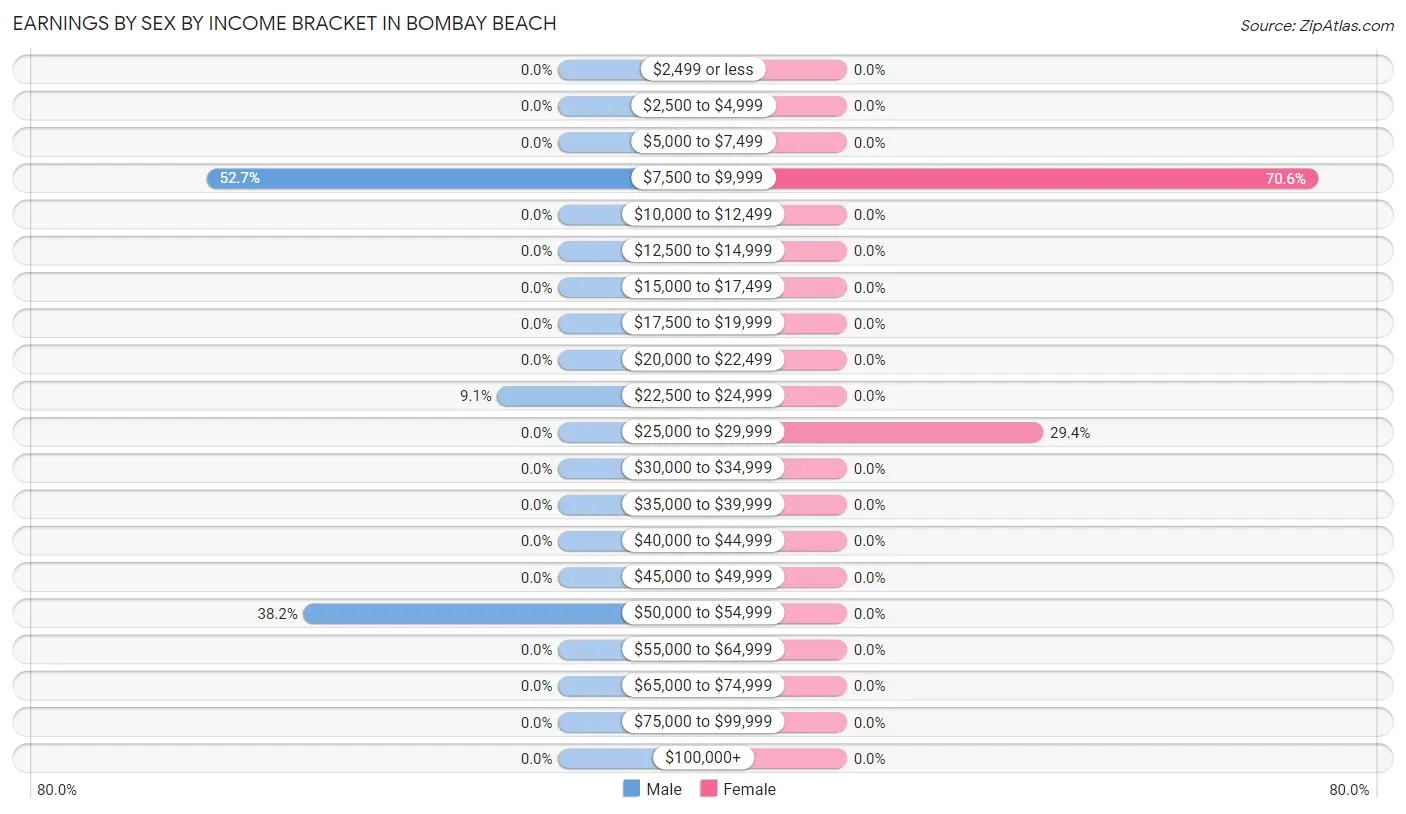
Earnings by Sex by Income Bracket in Bombay Beach
The most common earnings brackets in Bombay Beach are $7,500 to $9,999 for men (29 | 52.7%) and $7,500 to $9,999 for women (12 | 70.6%).
| Income | Male | Female |
| $2,499 or less | 0 (0.0%) | 0 (0.0%) |
| $2,500 to $4,999 | 0 (0.0%) | 0 (0.0%) |
| $5,000 to $7,499 | 0 (0.0%) | 0 (0.0%) |
| $7,500 to $9,999 | 29 (52.7%) | 12 (70.6%) |
| $10,000 to $12,499 | 0 (0.0%) | 0 (0.0%) |
| $12,500 to $14,999 | 0 (0.0%) | 0 (0.0%) |
| $15,000 to $17,499 | 0 (0.0%) | 0 (0.0%) |
| $17,500 to $19,999 | 0 (0.0%) | 0 (0.0%) |
| $20,000 to $22,499 | 0 (0.0%) | 0 (0.0%) |
| $22,500 to $24,999 | 5 (9.1%) | 0 (0.0%) |
| $25,000 to $29,999 | 0 (0.0%) | 5 (29.4%) |
| $30,000 to $34,999 | 0 (0.0%) | 0 (0.0%) |
| $35,000 to $39,999 | 0 (0.0%) | 0 (0.0%) |
| $40,000 to $44,999 | 0 (0.0%) | 0 (0.0%) |
| $45,000 to $49,999 | 0 (0.0%) | 0 (0.0%) |
| $50,000 to $54,999 | 21 (38.2%) | 0 (0.0%) |
| $55,000 to $64,999 | 0 (0.0%) | 0 (0.0%) |
| $65,000 to $74,999 | 0 (0.0%) | 0 (0.0%) |
| $75,000 to $99,999 | 0 (0.0%) | 0 (0.0%) |
| $100,000+ | 0 (0.0%) | 0 (0.0%) |
| Total | 55 (100.0%) | 17 (100.0%) |
Earnings by Sex by Educational Attainment in Bombay Beach
| Educational Attainment | Male Income | Female Income |
| Less than High School | - | - |
| High School Diploma | - | - |
| College or Associate's Degree | - | - |
| Bachelor's Degree | - | - |
| Graduate Degree | - | - |
| Total | - | - |
Family Income in Bombay Beach
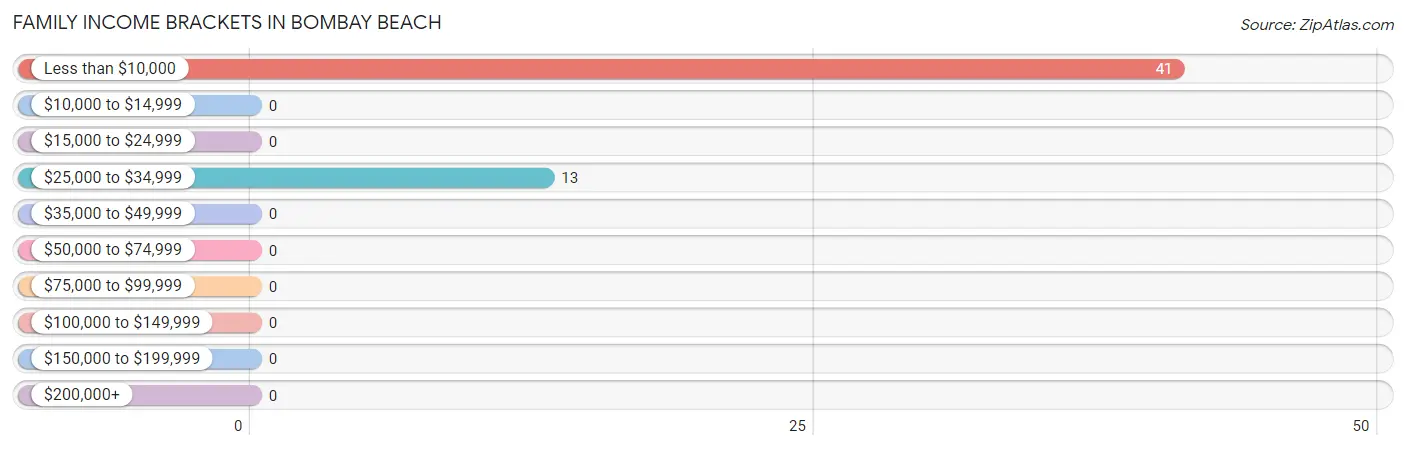
Family Income Brackets in Bombay Beach
According to the Bombay Beach family income data, there are 41 families falling into the less than $10,000 income range, which is the most common income bracket and makes up 75.9% of all families.
| Income Bracket | # Families | % Families |
| Less than $10,000 | 41 | 75.9% |
| $10,000 to $14,999 | 0 | 0.0% |
| $15,000 to $24,999 | 0 | 0.0% |
| $25,000 to $34,999 | 13 | 24.1% |
| $35,000 to $49,999 | 0 | 0.0% |
| $50,000 to $74,999 | 0 | 0.0% |
| $75,000 to $99,999 | 0 | 0.0% |
| $100,000 to $149,999 | 0 | 0.0% |
| $150,000 to $199,999 | 0 | 0.0% |
| $200,000+ | 0 | 0.0% |
Family Income by Famaliy Size in Bombay Beach
| Income Bracket | # Families | Median Income |
| 2-Person Families | 42 (77.8%) | $0 |
| 3-Person Families | 12 (22.2%) | $0 |
| 4-Person Families | 0 (0.0%) | $0 |
| 5-Person Families | 0 (0.0%) | $0 |
| 6-Person Families | 0 (0.0%) | $0 |
| 7+ Person Families | 0 (0.0%) | $0 |
| Total | 54 (100.0%) | $0 |
Family Income by Number of Earners in Bombay Beach
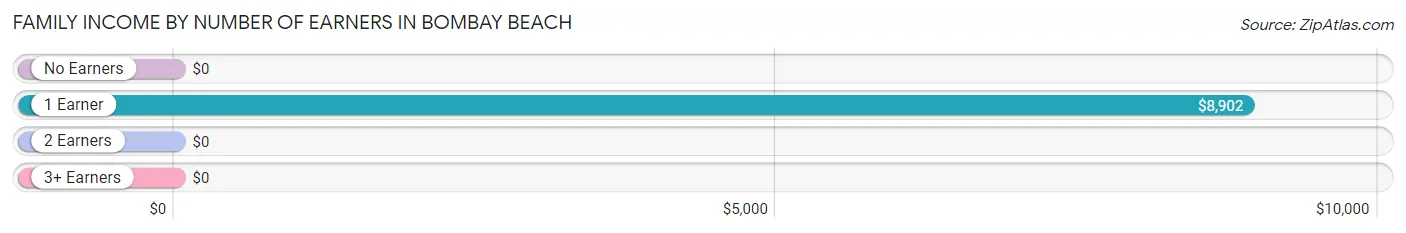
| Number of Earners | # Families | Median Income |
| No Earners | 8 (14.8%) | $0 |
| 1 Earner | 46 (85.2%) | $8,902 |
| 2 Earners | 0 (0.0%) | $0 |
| 3+ Earners | 0 (0.0%) | $0 |
| Total | 54 (100.0%) | $0 |
Household Income in Bombay Beach
Household Income Brackets in Bombay Beach
With 48 households falling in the category, the less than $10,000 income range is the most frequent in Bombay Beach, accounting for 43.2% of all households.
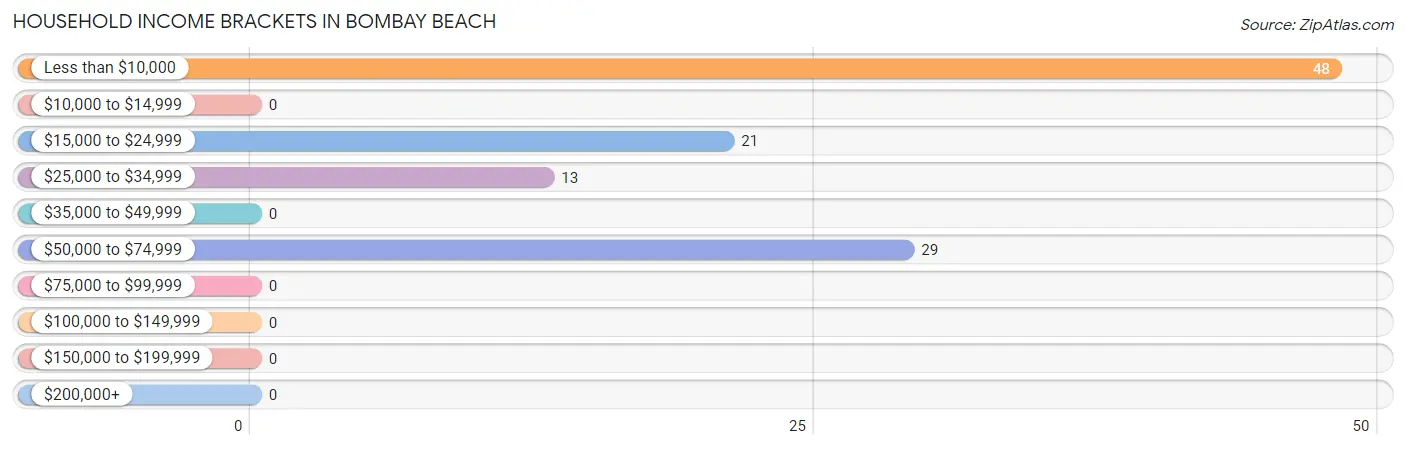
| Income Bracket | # Households | % Households |
| Less than $10,000 | 48 | 43.2% |
| $10,000 to $14,999 | 0 | 0.0% |
| $15,000 to $24,999 | 21 | 18.9% |
| $25,000 to $34,999 | 13 | 11.7% |
| $35,000 to $49,999 | 0 | 0.0% |
| $50,000 to $74,999 | 29 | 26.1% |
| $75,000 to $99,999 | 0 | 0.0% |
| $100,000 to $149,999 | 0 | 0.0% |
| $150,000 to $199,999 | 0 | 0.0% |
| $200,000+ | 0 | 0.0% |
Household Income by Householder Age in Bombay Beach
The median household income in Bombay Beach is $22,344, with the highest median household income of $53,631 found in the 45 to 64 years age bracket for the primary householder. A total of 39 households (35.1%) fall into this category.
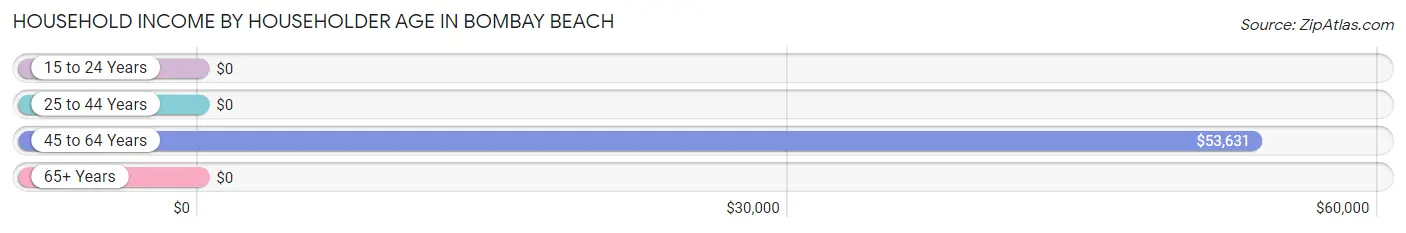
| Income Bracket | # Households | Median Income |
| 15 to 24 Years | 0 (0.0%) | $0 |
| 25 to 44 Years | 19 (17.1%) | $0 |
| 45 to 64 Years | 39 (35.1%) | $53,631 |
| 65+ Years | 53 (47.7%) | $0 |
| Total | 111 (100.0%) | $22,344 |
Poverty in Bombay Beach
Income Below Poverty by Sex and Age in Bombay Beach
With 57.0% poverty level for males and 87.0% for females among the residents of Bombay Beach, 25 to 34 year old males and under 5 year old females are the most vulnerable to poverty, with 44 males (100.0%) and 34 females (100.0%) in their respective age groups living below the poverty level.
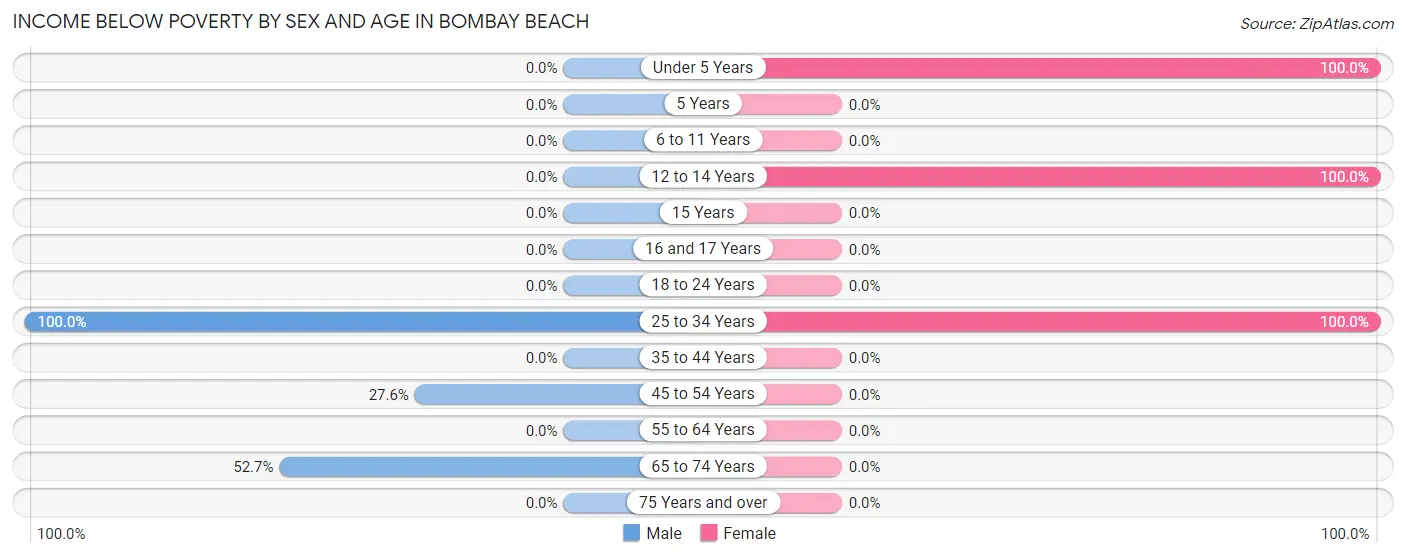
| Age Bracket | Male | Female |
| Under 5 Years | 0 (0.0%) | 34 (100.0%) |
| 5 Years | 0 (0.0%) | 0 (0.0%) |
| 6 to 11 Years | 0 (0.0%) | 0 (0.0%) |
| 12 to 14 Years | 0 (0.0%) | 34 (100.0%) |
| 15 Years | 0 (0.0%) | 0 (0.0%) |
| 16 and 17 Years | 0 (0.0%) | 0 (0.0%) |
| 18 to 24 Years | 0 (0.0%) | 0 (0.0%) |
| 25 to 34 Years | 44 (100.0%) | 19 (100.0%) |
| 35 to 44 Years | 0 (0.0%) | 0 (0.0%) |
| 45 to 54 Years | 8 (27.6%) | 0 (0.0%) |
| 55 to 64 Years | 0 (0.0%) | 0 (0.0%) |
| 65 to 74 Years | 29 (52.7%) | 0 (0.0%) |
| 75 Years and over | 0 (0.0%) | 0 (0.0%) |
| Total | 81 (57.0%) | 87 (87.0%) |
Income Above Poverty by Sex and Age in Bombay Beach
According to the poverty statistics in Bombay Beach, males aged 55 to 64 years and females aged 55 to 64 years are the age groups that are most secure financially, with 100.0% of males and 100.0% of females in these age groups living above the poverty line.
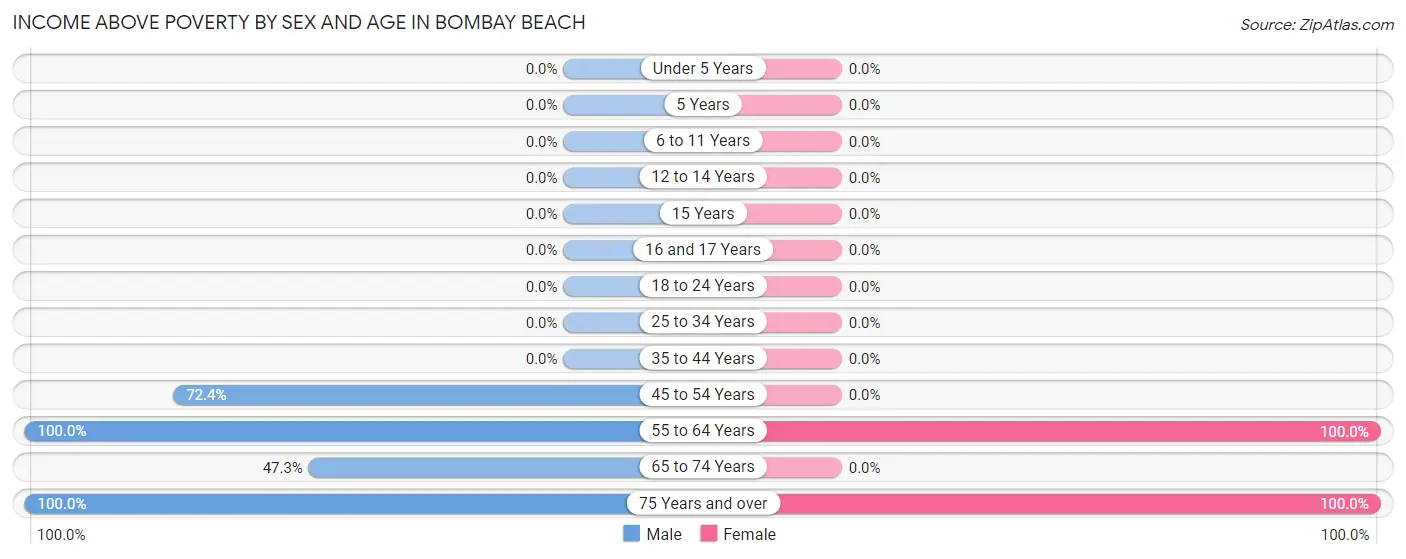
| Age Bracket | Male | Female |
| Under 5 Years | 0 (0.0%) | 0 (0.0%) |
| 5 Years | 0 (0.0%) | 0 (0.0%) |
| 6 to 11 Years | 0 (0.0%) | 0 (0.0%) |
| 12 to 14 Years | 0 (0.0%) | 0 (0.0%) |
| 15 Years | 0 (0.0%) | 0 (0.0%) |
| 16 and 17 Years | 0 (0.0%) | 0 (0.0%) |
| 18 to 24 Years | 0 (0.0%) | 0 (0.0%) |
| 25 to 34 Years | 0 (0.0%) | 0 (0.0%) |
| 35 to 44 Years | 0 (0.0%) | 0 (0.0%) |
| 45 to 54 Years | 21 (72.4%) | 0 (0.0%) |
| 55 to 64 Years | 11 (100.0%) | 5 (100.0%) |
| 65 to 74 Years | 26 (47.3%) | 0 (0.0%) |
| 75 Years and over | 3 (100.0%) | 8 (100.0%) |
| Total | 61 (43.0%) | 13 (13.0%) |
Income Below Poverty Among Married-Couple Families in Bombay Beach
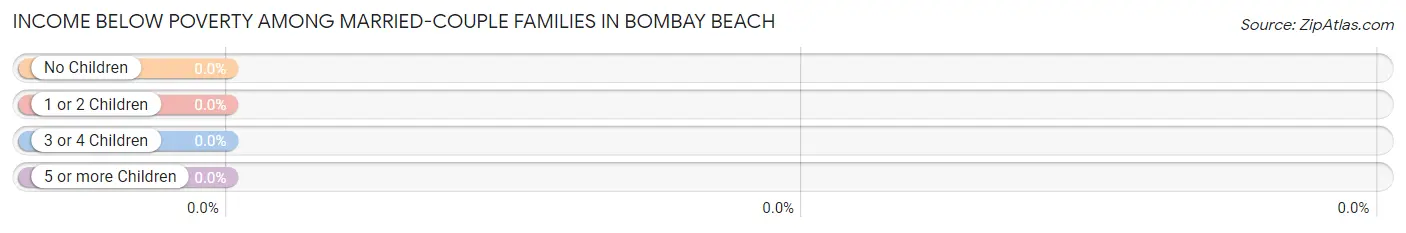
| Children | Above Poverty | Below Poverty |
| No Children | 13 (100.0%) | 0 (0.0%) |
| 1 or 2 Children | 0 (0.0%) | 0 (0.0%) |
| 3 or 4 Children | 0 (0.0%) | 0 (0.0%) |
| 5 or more Children | 0 (0.0%) | 0 (0.0%) |
| Total | 13 (100.0%) | 0 (0.0%) |
Income Below Poverty Among Single-Parent Households in Bombay Beach
According to the poverty data in Bombay Beach, 100.0% or 29 single-father households and 100.0% or 12 single-mother households are living below the poverty line. Among single-father households, those with no children have the highest poverty rate, with 29 households (100.0%) experiencing poverty. Likewise, among single-mother households, those with 1 or 2 children have the highest poverty rate, with 12 households (100.0%) falling below the poverty line.
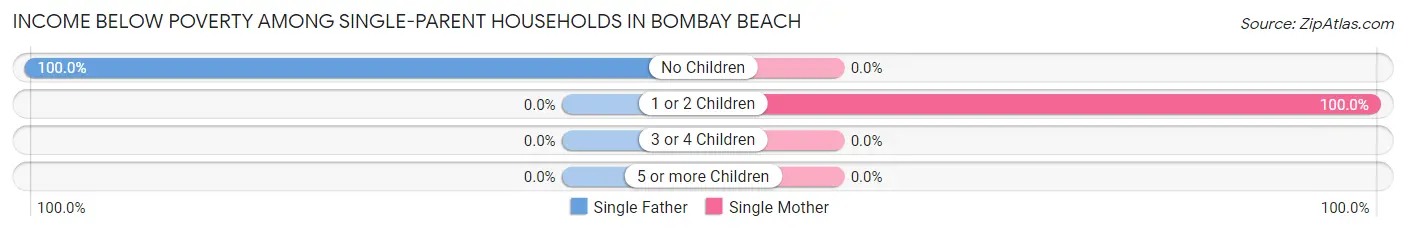
| Children | Single Father | Single Mother |
| No Children | 29 (100.0%) | 0 (0.0%) |
| 1 or 2 Children | 0 (0.0%) | 12 (100.0%) |
| 3 or 4 Children | 0 (0.0%) | 0 (0.0%) |
| 5 or more Children | 0 (0.0%) | 0 (0.0%) |
| Total | 29 (100.0%) | 12 (100.0%) |
Income Below Poverty Among Married-Couple vs Single-Parent Households in Bombay Beach
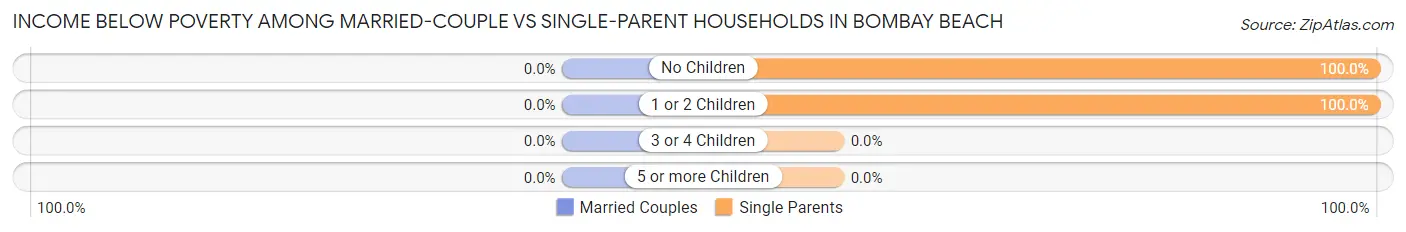
| Children | Married-Couple Families | Single-Parent Households |
| No Children | 0 (0.0%) | 29 (100.0%) |
| 1 or 2 Children | 0 (0.0%) | 12 (100.0%) |
| 3 or 4 Children | 0 (0.0%) | 0 (0.0%) |
| 5 or more Children | 0 (0.0%) | 0 (0.0%) |
| Total | 0 (0.0%) | 41 (100.0%) |
Employment Characteristics in Bombay Beach
Employment by Class of Employer in Bombay Beach
Among the 72 employed individuals in Bombay Beach, private company employees (60 | 83.3%), and federal government employees (12 | 16.7%) make up the most common classes of employment.
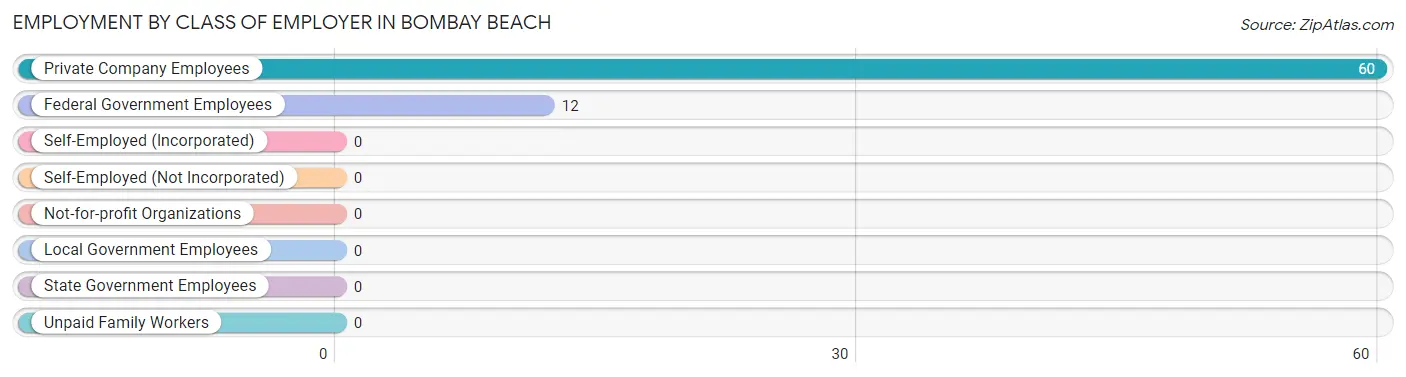
| Employer Class | # Employees | % Employees |
| Private Company Employees | 60 | 83.3% |
| Self-Employed (Incorporated) | 0 | 0.0% |
| Self-Employed (Not Incorporated) | 0 | 0.0% |
| Not-for-profit Organizations | 0 | 0.0% |
| Local Government Employees | 0 | 0.0% |
| State Government Employees | 0 | 0.0% |
| Federal Government Employees | 12 | 16.7% |
| Unpaid Family Workers | 0 | 0.0% |
| Total | 72 | 100.0% |
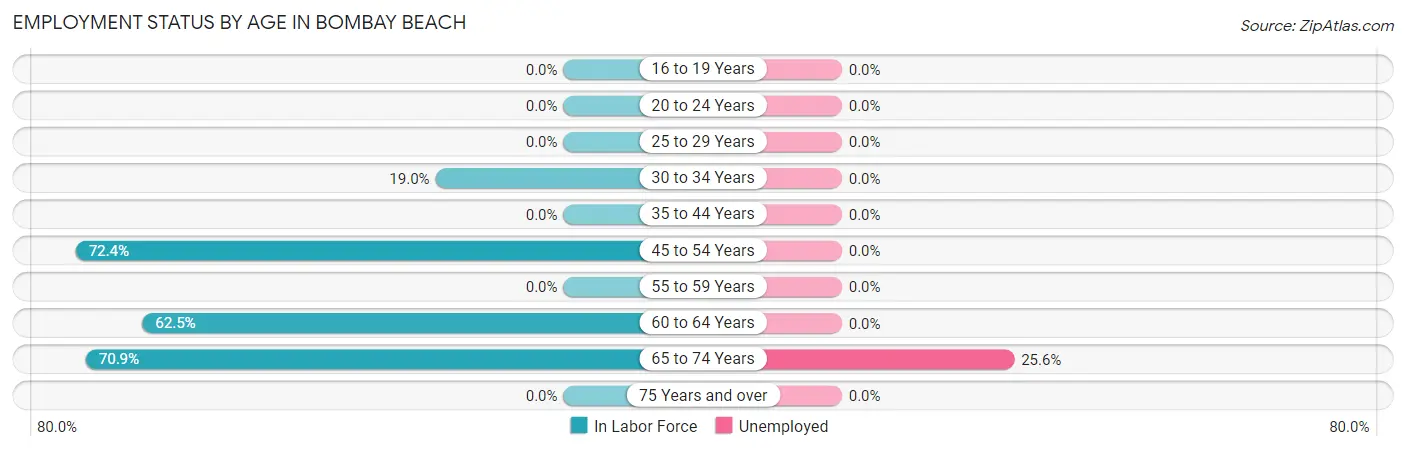
Employment Status by Age in Bombay Beach
According to the labor force statistics for Bombay Beach, out of the total population over 16 years of age (174), 47.1% or 82 individuals are in the labor force, with 14.3% or 12 of them unemployed. The age group with the highest labor force participation rate is 45 to 54 years, with 72.4% or 21 individuals in the labor force. Within the labor force, the 65 to 74 years age range has the highest percentage of unemployed individuals, with 25.6% or 10 of them being unemployed.
| Age Bracket | In Labor Force | Unemployed |
| 16 to 19 Years | 0 (0.0%) | 0 (0.0%) |
| 20 to 24 Years | 0 (0.0%) | 0 (0.0%) |
| 25 to 29 Years | 0 (0.0%) | 0 (0.0%) |
| 30 to 34 Years | 12 (19.0%) | 0 (0.0%) |
| 35 to 44 Years | 0 (0.0%) | 0 (0.0%) |
| 45 to 54 Years | 21 (72.4%) | 0 (0.0%) |
| 55 to 59 Years | 0 (0.0%) | 0 (0.0%) |
| 60 to 64 Years | 10 (62.5%) | 0 (0.0%) |
| 65 to 74 Years | 39 (70.9%) | 10 (25.6%) |
| 75 Years and over | 0 (0.0%) | 0 (0.0%) |
| Total | 82 (47.1%) | 12 (14.3%) |
Employment Status by Educational Attainment in Bombay Beach
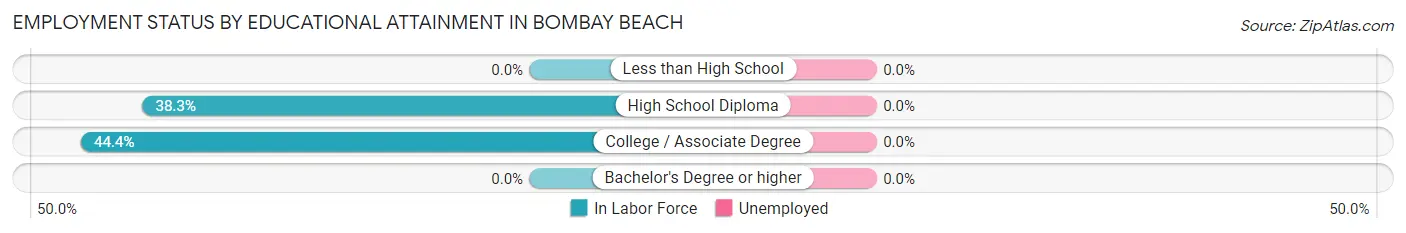
| Educational Attainment | In Labor Force | Unemployed |
| Less than High School | 0 (0.0%) | 0 (0.0%) |
| High School Diploma | 31 (38.3%) | 0 (0.0%) |
| College / Associate Degree | 12 (44.4%) | 0 (0.0%) |
| Bachelor's Degree or higher | 0 (0.0%) | 0 (0.0%) |
| Total | 43 (39.8%) | 0 (0.0%) |
Employment Occupations by Sex in Bombay Beach
Management, Business, Science and Arts Occupations
The most common Management, Business, Science and Arts occupations in Bombay Beach are , and Management (21 | 35.0%).
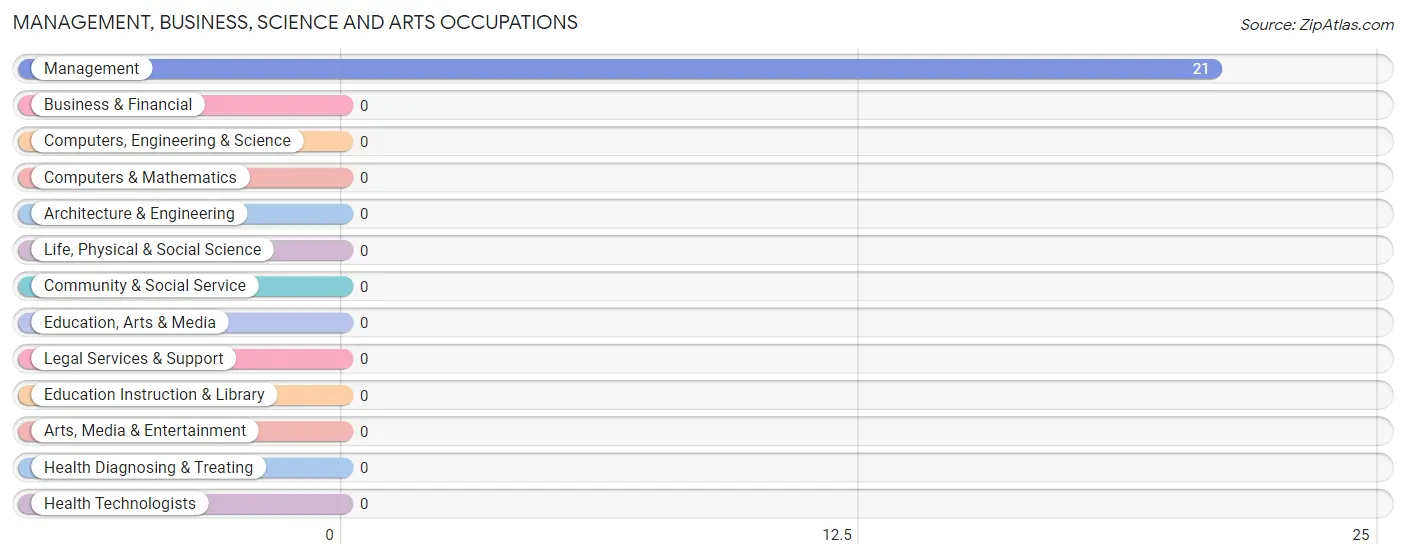
Management, Business, Science and Arts Occupations by Sex
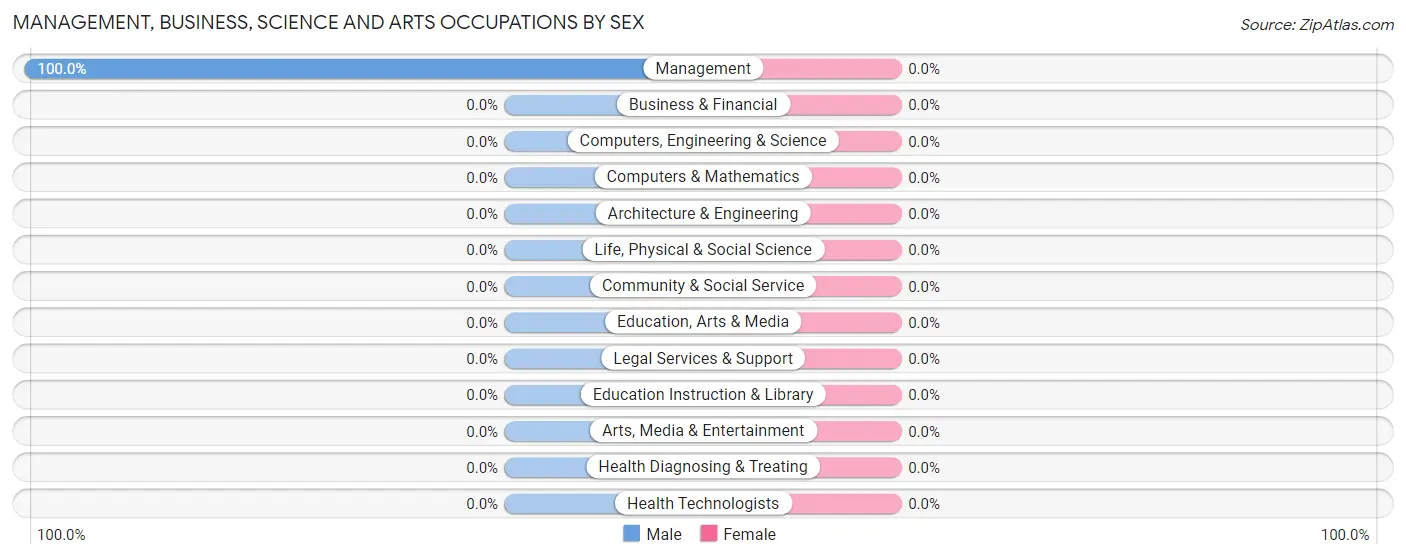
| Occupation | Male | Female |
| Management | 21 (100.0%) | 0 (0.0%) |
| Business & Financial | 0 (0.0%) | 0 (0.0%) |
| Computers, Engineering & Science | 0 (0.0%) | 0 (0.0%) |
| Computers & Mathematics | 0 (0.0%) | 0 (0.0%) |
| Architecture & Engineering | 0 (0.0%) | 0 (0.0%) |
| Life, Physical & Social Science | 0 (0.0%) | 0 (0.0%) |
| Community & Social Service | 0 (0.0%) | 0 (0.0%) |
| Education, Arts & Media | 0 (0.0%) | 0 (0.0%) |
| Legal Services & Support | 0 (0.0%) | 0 (0.0%) |
| Education Instruction & Library | 0 (0.0%) | 0 (0.0%) |
| Arts, Media & Entertainment | 0 (0.0%) | 0 (0.0%) |
| Health Diagnosing & Treating | 0 (0.0%) | 0 (0.0%) |
| Health Technologists | 0 (0.0%) | 0 (0.0%) |
| Total (Category) | 21 (100.0%) | 0 (0.0%) |
| Total (Overall) | 55 (91.7%) | 5 (8.3%) |
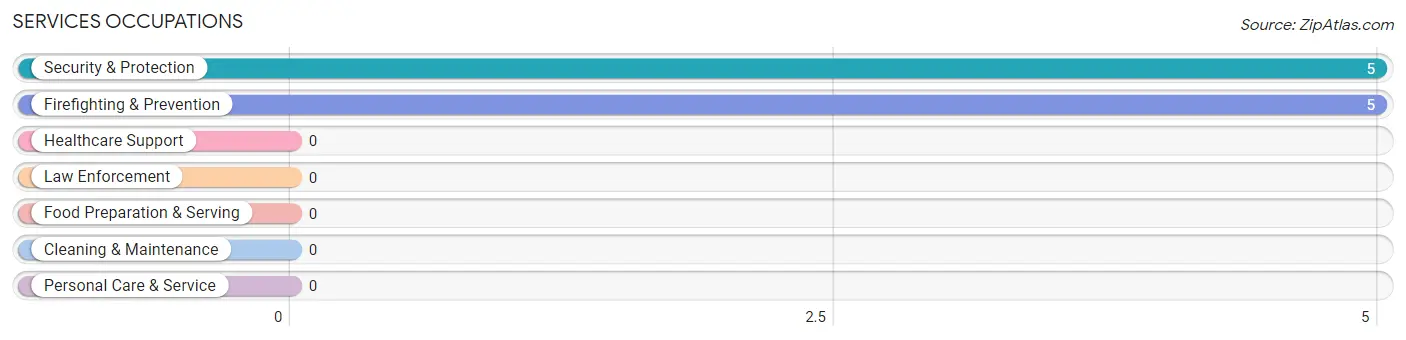
Services Occupations
The most common Services occupations in Bombay Beach are Security & Protection (5 | 8.3%), and Firefighting & Prevention (5 | 8.3%).
Services Occupations by Sex
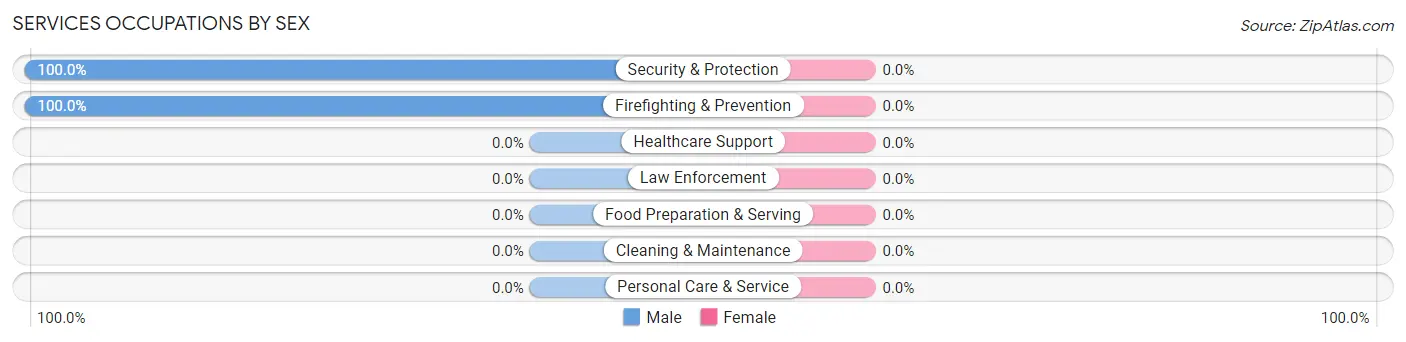
| Occupation | Male | Female |
| Healthcare Support | 0 (0.0%) | 0 (0.0%) |
| Security & Protection | 5 (100.0%) | 0 (0.0%) |
| Firefighting & Prevention | 5 (100.0%) | 0 (0.0%) |
| Law Enforcement | 0 (0.0%) | 0 (0.0%) |
| Food Preparation & Serving | 0 (0.0%) | 0 (0.0%) |
| Cleaning & Maintenance | 0 (0.0%) | 0 (0.0%) |
| Personal Care & Service | 0 (0.0%) | 0 (0.0%) |
| Total (Category) | 5 (100.0%) | 0 (0.0%) |
| Total (Overall) | 55 (91.7%) | 5 (8.3%) |
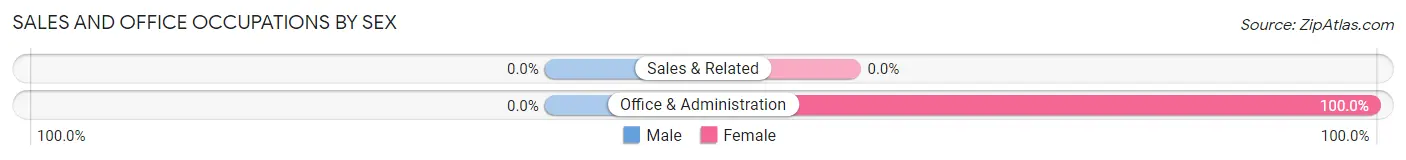
Sales and Office Occupations
The most common Sales and Office occupations in Bombay Beach are , and Office & Administration (5 | 8.3%).
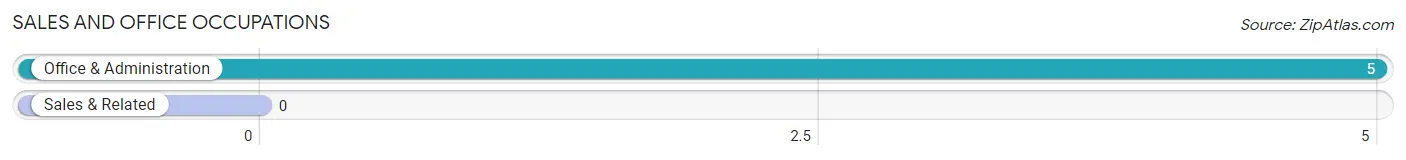
Sales and Office Occupations by Sex
| Occupation | Male | Female |
| Sales & Related | 0 (0.0%) | 0 (0.0%) |
| Office & Administration | 0 (0.0%) | 5 (100.0%) |
| Total (Category) | 0 (0.0%) | 5 (100.0%) |
| Total (Overall) | 55 (91.7%) | 5 (8.3%) |
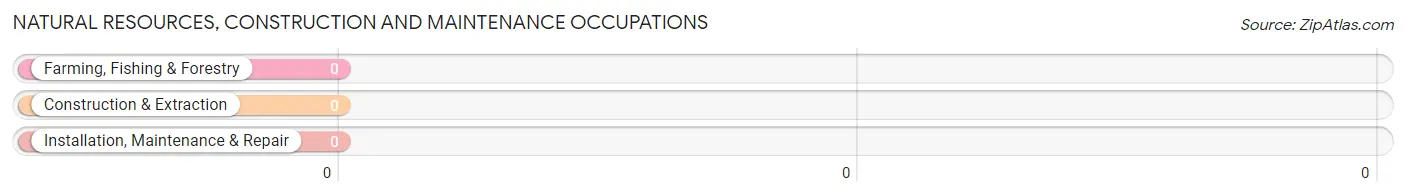
Natural Resources, Construction and Maintenance Occupations
Natural Resources, Construction and Maintenance Occupations by Sex
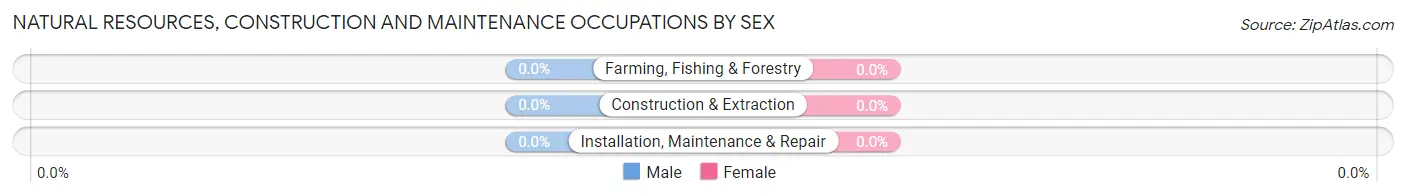
| Occupation | Male | Female |
| Farming, Fishing & Forestry | 0 (0.0%) | 0 (0.0%) |
| Construction & Extraction | 0 (0.0%) | 0 (0.0%) |
| Installation, Maintenance & Repair | 0 (0.0%) | 0 (0.0%) |
| Total (Category) | 0 (0.0%) | 0 (0.0%) |
| Total (Overall) | 55 (91.7%) | 5 (8.3%) |
Production, Transportation and Moving Occupations
The most common Production, Transportation and Moving occupations in Bombay Beach are , and Transportation (29 | 48.3%).
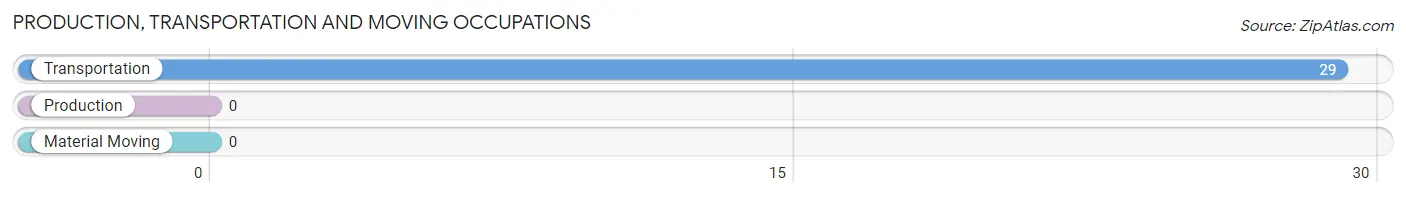
Production, Transportation and Moving Occupations by Sex
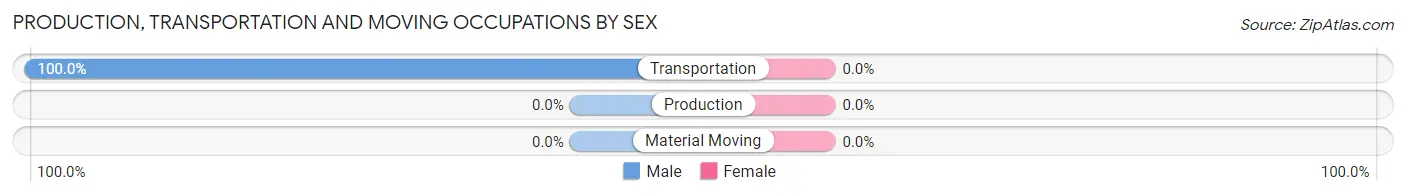
| Occupation | Male | Female |
| Production | 0 (0.0%) | 0 (0.0%) |
| Transportation | 29 (100.0%) | 0 (0.0%) |
| Material Moving | 0 (0.0%) | 0 (0.0%) |
| Total (Category) | 29 (100.0%) | 0 (0.0%) |
| Total (Overall) | 55 (91.7%) | 5 (8.3%) |
Employment Industries by Sex in Bombay Beach
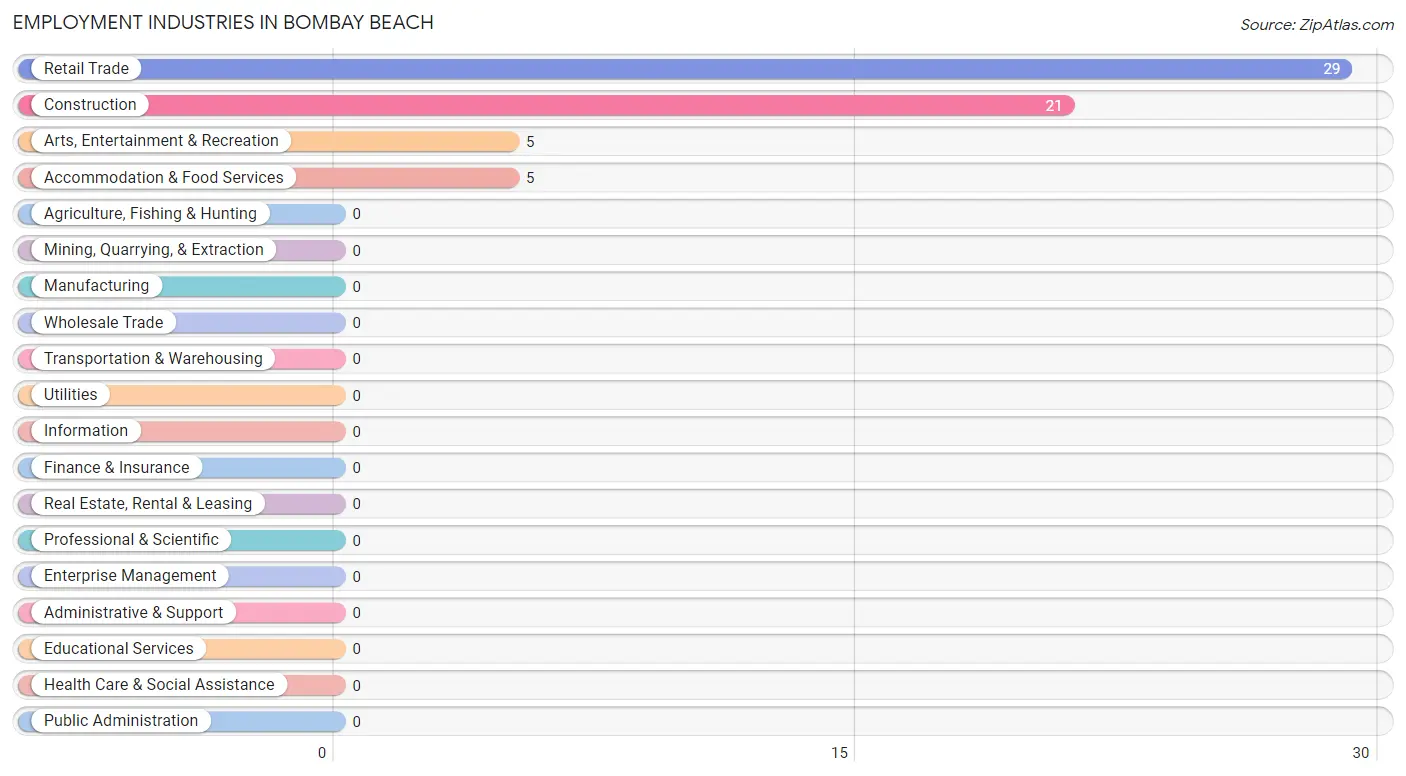
Employment Industries in Bombay Beach
The major employment industries in Bombay Beach include Retail Trade (29 | 48.3%), Construction (21 | 35.0%), Arts, Entertainment & Recreation (5 | 8.3%), and Accommodation & Food Services (5 | 8.3%).
Employment Industries by Sex in Bombay Beach
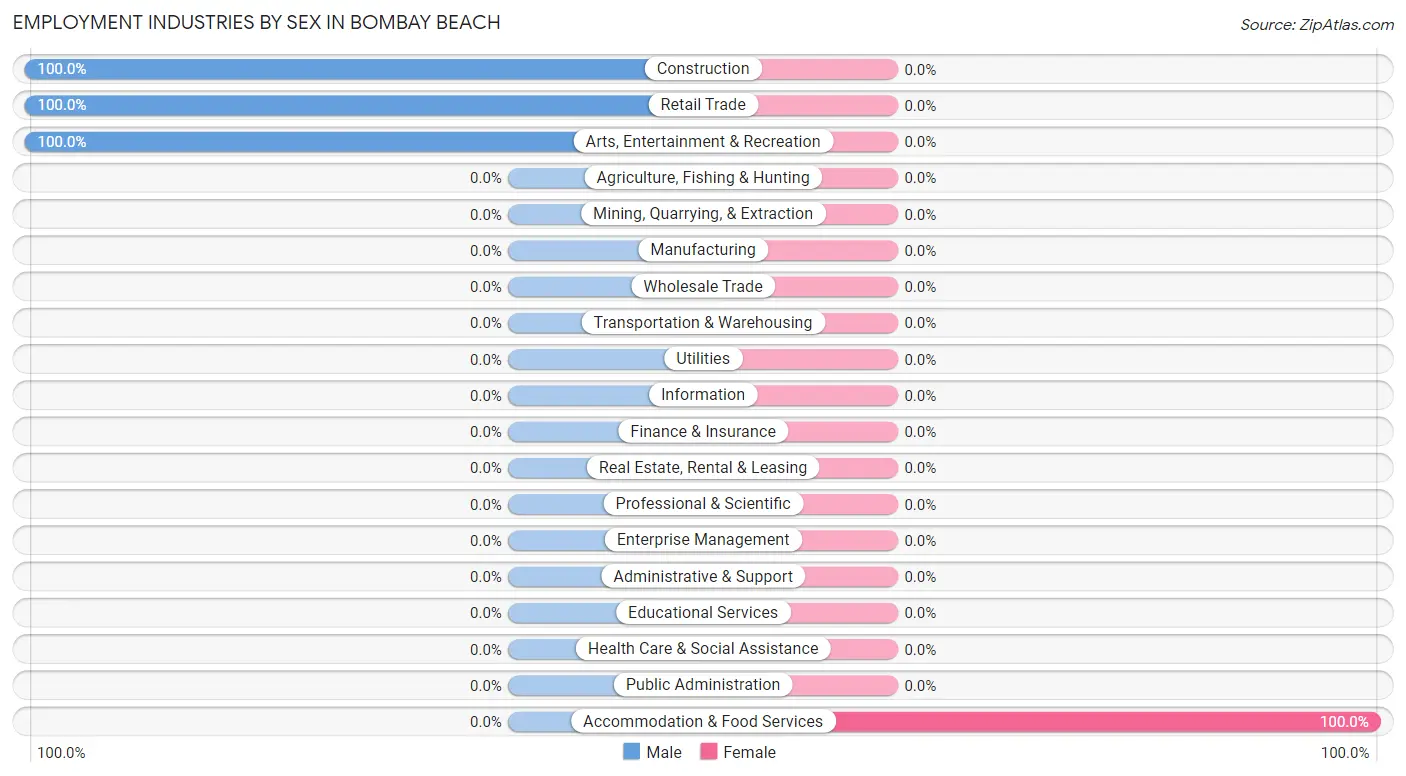
| Industry | Male | Female |
| Agriculture, Fishing & Hunting | 0 (0.0%) | 0 (0.0%) |
| Mining, Quarrying, & Extraction | 0 (0.0%) | 0 (0.0%) |
| Construction | 21 (100.0%) | 0 (0.0%) |
| Manufacturing | 0 (0.0%) | 0 (0.0%) |
| Wholesale Trade | 0 (0.0%) | 0 (0.0%) |
| Retail Trade | 29 (100.0%) | 0 (0.0%) |
| Transportation & Warehousing | 0 (0.0%) | 0 (0.0%) |
| Utilities | 0 (0.0%) | 0 (0.0%) |
| Information | 0 (0.0%) | 0 (0.0%) |
| Finance & Insurance | 0 (0.0%) | 0 (0.0%) |
| Real Estate, Rental & Leasing | 0 (0.0%) | 0 (0.0%) |
| Professional & Scientific | 0 (0.0%) | 0 (0.0%) |
| Enterprise Management | 0 (0.0%) | 0 (0.0%) |
| Administrative & Support | 0 (0.0%) | 0 (0.0%) |
| Educational Services | 0 (0.0%) | 0 (0.0%) |
| Health Care & Social Assistance | 0 (0.0%) | 0 (0.0%) |
| Arts, Entertainment & Recreation | 5 (100.0%) | 0 (0.0%) |
| Accommodation & Food Services | 0 (0.0%) | 5 (100.0%) |
| Public Administration | 0 (0.0%) | 0 (0.0%) |
| Total | 55 (91.7%) | 5 (8.3%) |
Education in Bombay Beach
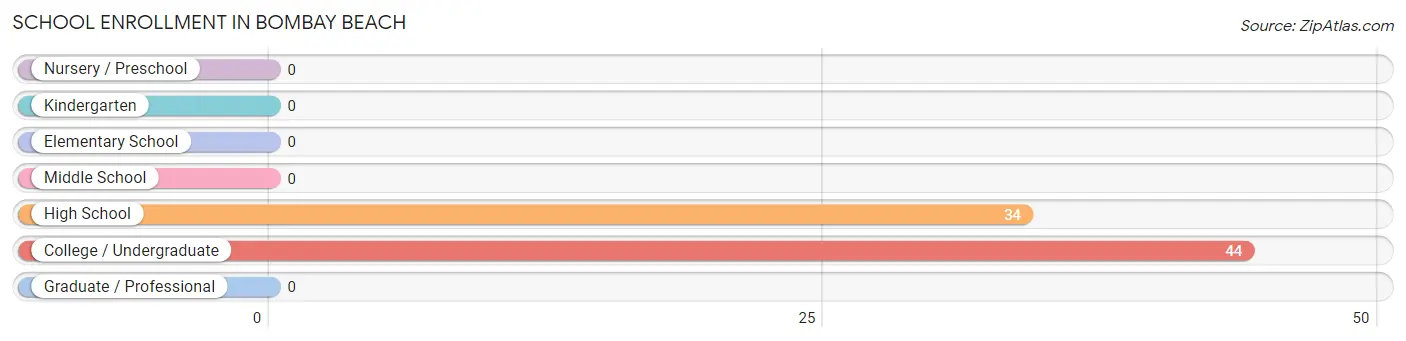
School Enrollment in Bombay Beach
The most common levels of schooling among the 78 students in Bombay Beach are college / undergraduate (44 | 56.4%), and high school (34 | 43.6%).
| School Level | # Students | % Students |
| Nursery / Preschool | 0 | 0.0% |
| Kindergarten | 0 | 0.0% |
| Elementary School | 0 | 0.0% |
| Middle School | 0 | 0.0% |
| High School | 34 | 43.6% |
| College / Undergraduate | 44 | 56.4% |
| Graduate / Professional | 0 | 0.0% |
| Total | 78 | 100.0% |
School Enrollment by Age by Funding Source in Bombay Beach
Out of a total of 78 students who are enrolled in schools in Bombay Beach, 44 (56.4%) attend a private institution, while the remaining 34 (43.6%) are enrolled in public schools. The age group of 25 to 34 year olds has the highest likelihood of being enrolled in private schools, with 44 (100.0% in the age bracket) enrolled. Conversely, the age group of 10 to 14 year olds has the lowest likelihood of being enrolled in a private school, with 34 (100.0% in the age bracket) attending a public institution.
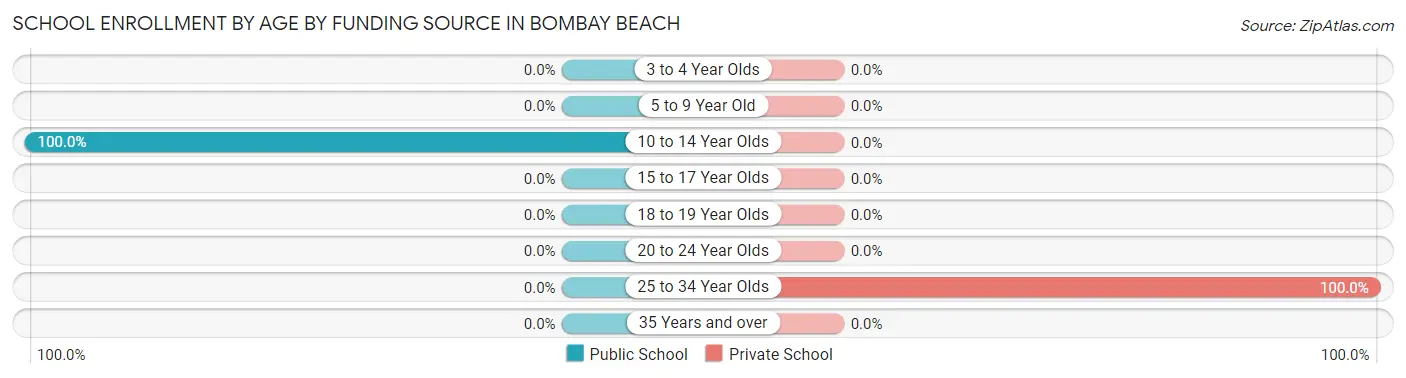
| Age Bracket | Public School | Private School |
| 3 to 4 Year Olds | 0 (0.0%) | 0 (0.0%) |
| 5 to 9 Year Old | 0 (0.0%) | 0 (0.0%) |
| 10 to 14 Year Olds | 34 (100.0%) | 0 (0.0%) |
| 15 to 17 Year Olds | 0 (0.0%) | 0 (0.0%) |
| 18 to 19 Year Olds | 0 (0.0%) | 0 (0.0%) |
| 20 to 24 Year Olds | 0 (0.0%) | 0 (0.0%) |
| 25 to 34 Year Olds | 0 (0.0%) | 44 (100.0%) |
| 35 Years and over | 0 (0.0%) | 0 (0.0%) |
| Total | 34 (43.6%) | 44 (56.4%) |
Educational Attainment by Field of Study in Bombay Beach
, and science & technology (29 | 100.0%) are the most common fields of study among 29 individuals in Bombay Beach who have obtained a bachelor's degree or higher.
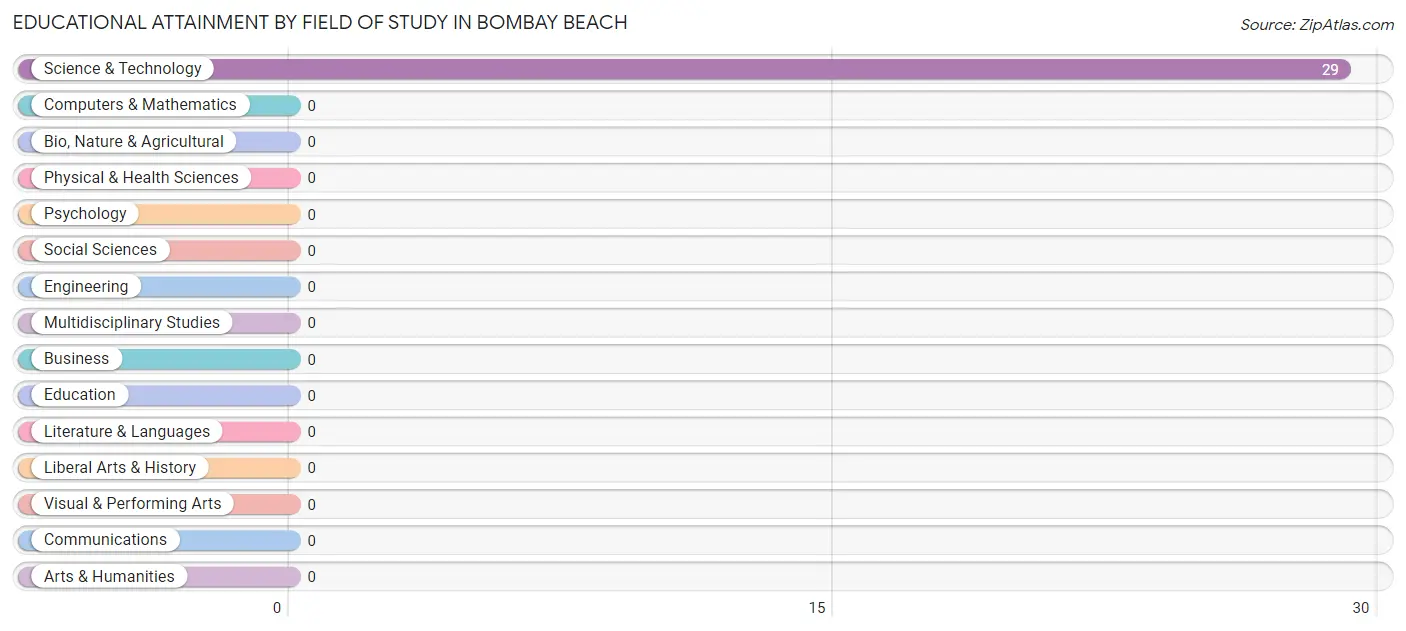
| Field of Study | # Graduates | % Graduates |
| Computers & Mathematics | 0 | 0.0% |
| Bio, Nature & Agricultural | 0 | 0.0% |
| Physical & Health Sciences | 0 | 0.0% |
| Psychology | 0 | 0.0% |
| Social Sciences | 0 | 0.0% |
| Engineering | 0 | 0.0% |
| Multidisciplinary Studies | 0 | 0.0% |
| Science & Technology | 29 | 100.0% |
| Business | 0 | 0.0% |
| Education | 0 | 0.0% |
| Literature & Languages | 0 | 0.0% |
| Liberal Arts & History | 0 | 0.0% |
| Visual & Performing Arts | 0 | 0.0% |
| Communications | 0 | 0.0% |
| Arts & Humanities | 0 | 0.0% |
| Total | 29 | 100.0% |
Transportation & Commute in Bombay Beach
Vehicle Availability by Sex in Bombay Beach
The most prevalent vehicle ownership categories in Bombay Beach are males with 2 vehicles (34, accounting for 61.8%) and females with 2 vehicles (0, making up 200.0%).
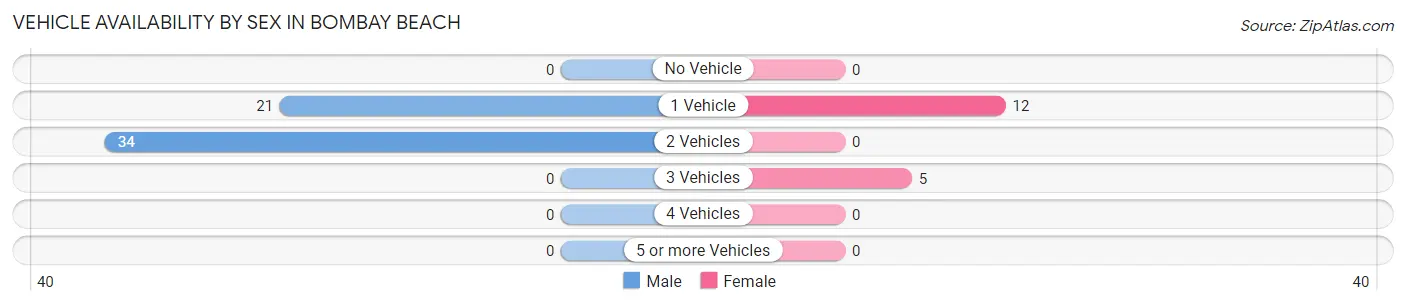
| Vehicles Available | Male | Female |
| No Vehicle | 0 (0.0%) | 0 (0.0%) |
| 1 Vehicle | 21 (38.2%) | 12 (70.6%) |
| 2 Vehicles | 34 (61.8%) | 0 (0.0%) |
| 3 Vehicles | 0 (0.0%) | 5 (29.4%) |
| 4 Vehicles | 0 (0.0%) | 0 (0.0%) |
| 5 or more Vehicles | 0 (0.0%) | 0 (0.0%) |
| Total | 55 (100.0%) | 17 (100.0%) |
Commute Time in Bombay Beach
The most frequently occuring commute durations in Bombay Beach are 60 to 89 minutes (55 commuters, 91.7%), 15 to 19 minutes (5 commuters, 8.3%), and less than 5 minutes (0 commuters, 0.0%).
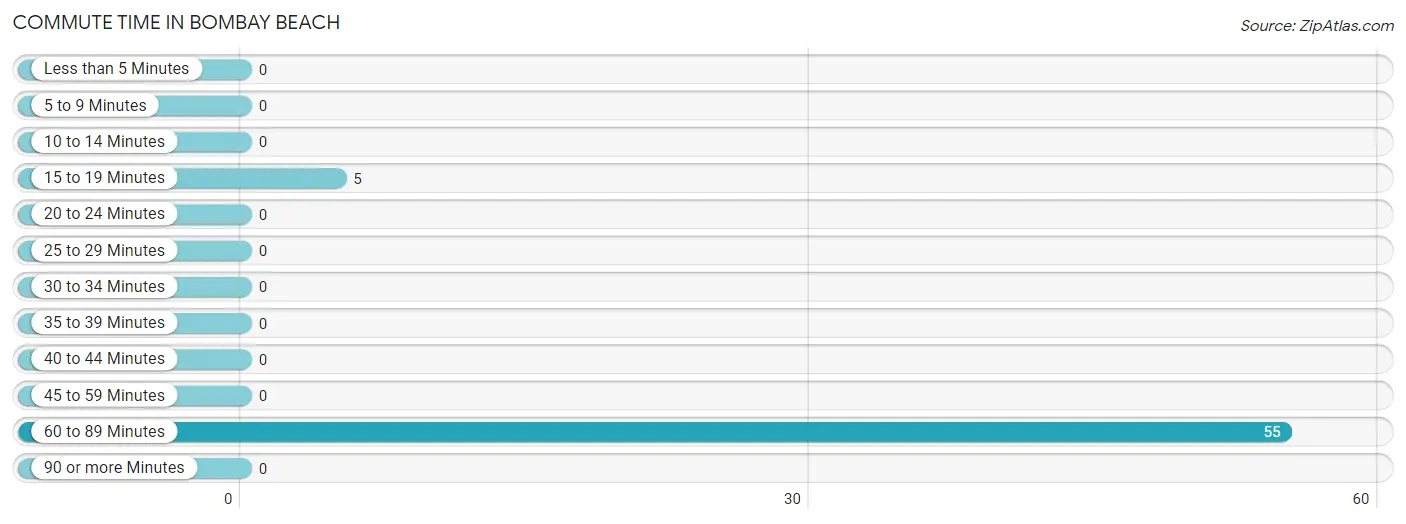
| Commute Time | # Commuters | % Commuters |
| Less than 5 Minutes | 0 | 0.0% |
| 5 to 9 Minutes | 0 | 0.0% |
| 10 to 14 Minutes | 0 | 0.0% |
| 15 to 19 Minutes | 5 | 8.3% |
| 20 to 24 Minutes | 0 | 0.0% |
| 25 to 29 Minutes | 0 | 0.0% |
| 30 to 34 Minutes | 0 | 0.0% |
| 35 to 39 Minutes | 0 | 0.0% |
| 40 to 44 Minutes | 0 | 0.0% |
| 45 to 59 Minutes | 0 | 0.0% |
| 60 to 89 Minutes | 55 | 91.7% |
| 90 or more Minutes | 0 | 0.0% |
Commute Time by Sex in Bombay Beach
The most common commute times in Bombay Beach are 60 to 89 minutes (55 commuters, 100.0%) for males and 15 to 19 minutes (5 commuters, 100.0%) for females.
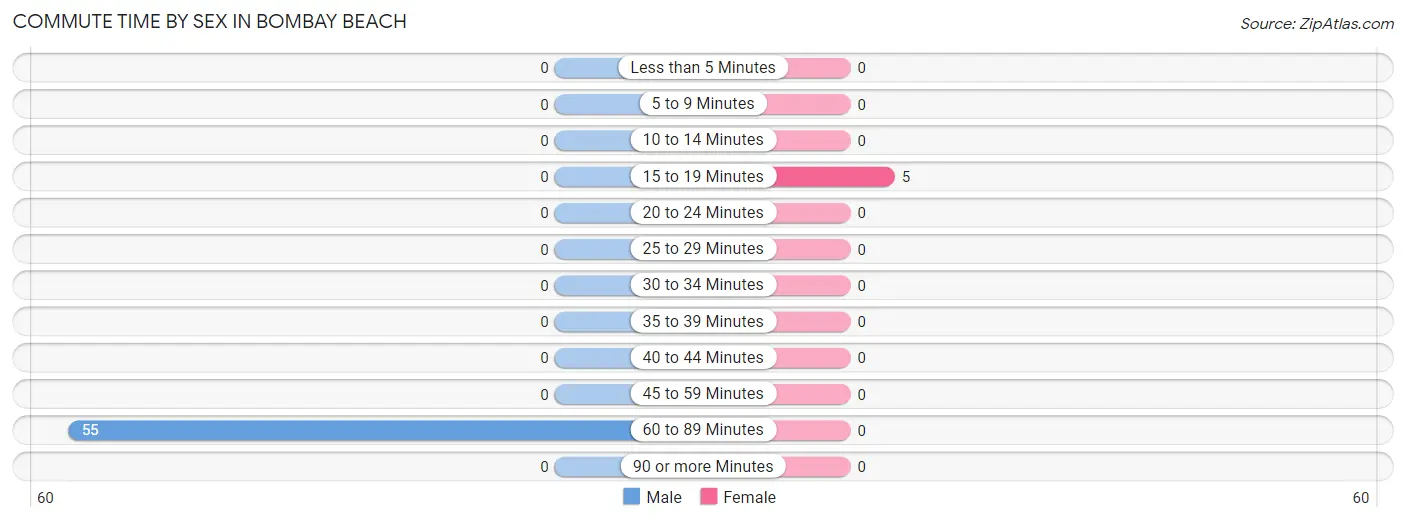
| Commute Time | Male | Female |
| Less than 5 Minutes | 0 (0.0%) | 0 (0.0%) |
| 5 to 9 Minutes | 0 (0.0%) | 0 (0.0%) |
| 10 to 14 Minutes | 0 (0.0%) | 0 (0.0%) |
| 15 to 19 Minutes | 0 (0.0%) | 5 (100.0%) |
| 20 to 24 Minutes | 0 (0.0%) | 0 (0.0%) |
| 25 to 29 Minutes | 0 (0.0%) | 0 (0.0%) |
| 30 to 34 Minutes | 0 (0.0%) | 0 (0.0%) |
| 35 to 39 Minutes | 0 (0.0%) | 0 (0.0%) |
| 40 to 44 Minutes | 0 (0.0%) | 0 (0.0%) |
| 45 to 59 Minutes | 0 (0.0%) | 0 (0.0%) |
| 60 to 89 Minutes | 55 (100.0%) | 0 (0.0%) |
| 90 or more Minutes | 0 (0.0%) | 0 (0.0%) |
Time of Departure to Work by Sex in Bombay Beach
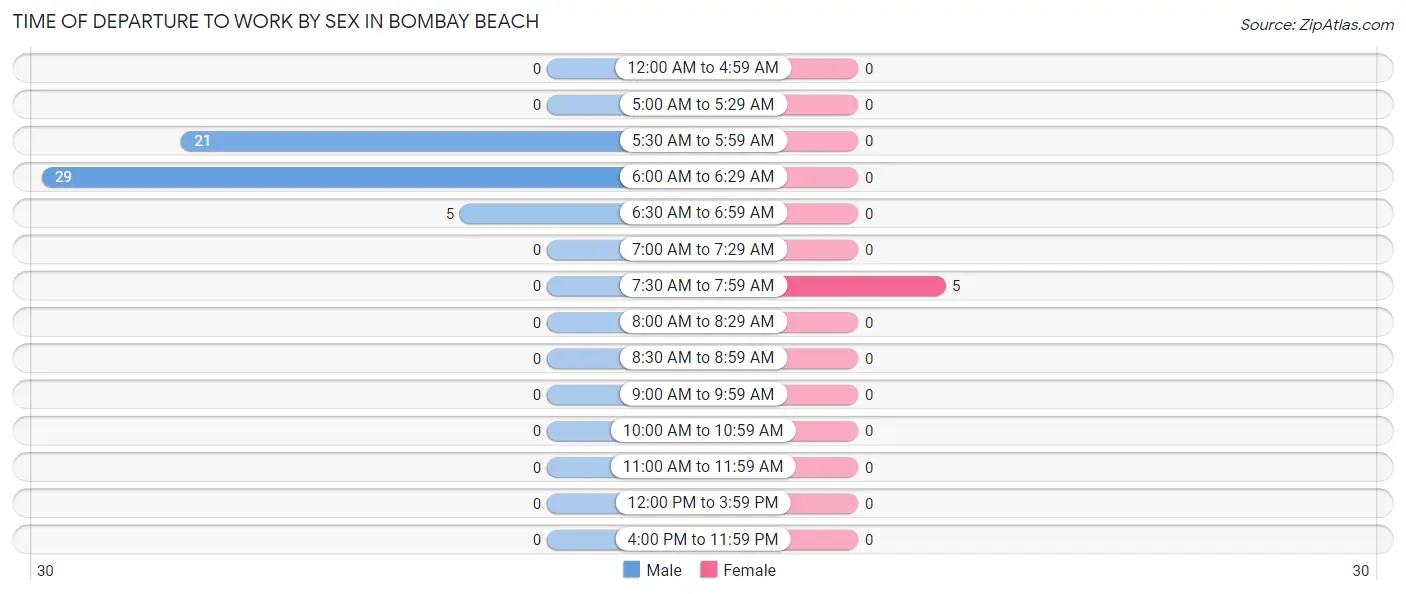
The most frequent times of departure to work in Bombay Beach are 6:00 AM to 6:29 AM (29, 52.7%) for males and 7:30 AM to 7:59 AM (5, 100.0%) for females.
| Time of Departure | Male | Female |
| 12:00 AM to 4:59 AM | 0 (0.0%) | 0 (0.0%) |
| 5:00 AM to 5:29 AM | 0 (0.0%) | 0 (0.0%) |
| 5:30 AM to 5:59 AM | 21 (38.2%) | 0 (0.0%) |
| 6:00 AM to 6:29 AM | 29 (52.7%) | 0 (0.0%) |
| 6:30 AM to 6:59 AM | 5 (9.1%) | 0 (0.0%) |
| 7:00 AM to 7:29 AM | 0 (0.0%) | 0 (0.0%) |
| 7:30 AM to 7:59 AM | 0 (0.0%) | 5 (100.0%) |
| 8:00 AM to 8:29 AM | 0 (0.0%) | 0 (0.0%) |
| 8:30 AM to 8:59 AM | 0 (0.0%) | 0 (0.0%) |
| 9:00 AM to 9:59 AM | 0 (0.0%) | 0 (0.0%) |
| 10:00 AM to 10:59 AM | 0 (0.0%) | 0 (0.0%) |
| 11:00 AM to 11:59 AM | 0 (0.0%) | 0 (0.0%) |
| 12:00 PM to 3:59 PM | 0 (0.0%) | 0 (0.0%) |
| 4:00 PM to 11:59 PM | 0 (0.0%) | 0 (0.0%) |
| Total | 55 (100.0%) | 5 (100.0%) |
Housing Occupancy in Bombay Beach
Occupancy by Ownership in Bombay Beach
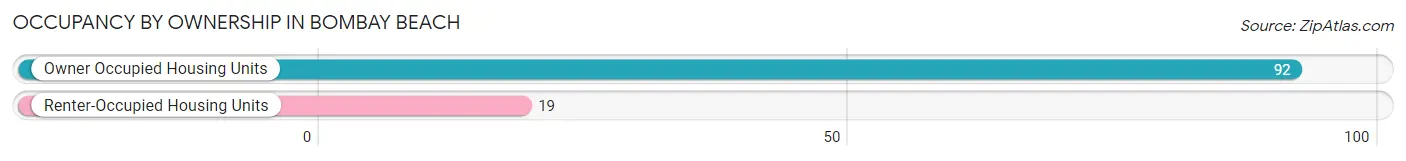
Of the total 111 dwellings in Bombay Beach, owner-occupied units account for 92 (82.9%), while renter-occupied units make up 19 (17.1%).
| Occupancy | # Housing Units | % Housing Units |
| Owner Occupied Housing Units | 92 | 82.9% |
| Renter-Occupied Housing Units | 19 | 17.1% |
| Total Occupied Housing Units | 111 | 100.0% |
Occupancy by Household Size in Bombay Beach
| Household Size | # Housing Units | % Housing Units |
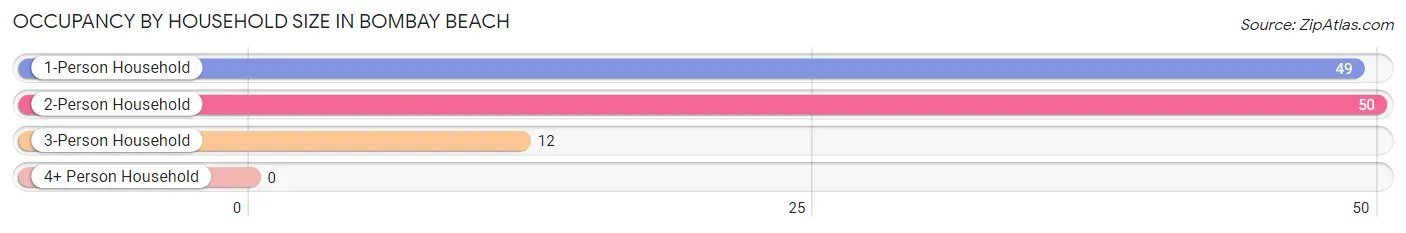
| 1-Person Household | 49 | 44.1% |
| 2-Person Household | 50 | 45.1% |
| 3-Person Household | 12 | 10.8% |
| 4+ Person Household | 0 | 0.0% |
| Total Housing Units | 111 | 100.0% |
Occupancy by Ownership by Household Size in Bombay Beach
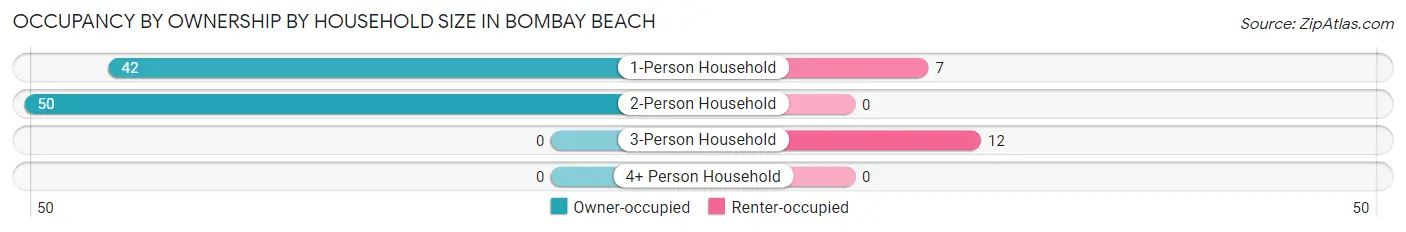
| Household Size | Owner-occupied | Renter-occupied |
| 1-Person Household | 42 (85.7%) | 7 (14.3%) |
| 2-Person Household | 50 (100.0%) | 0 (0.0%) |
| 3-Person Household | 0 (0.0%) | 12 (100.0%) |
| 4+ Person Household | 0 (0.0%) | 0 (0.0%) |
| Total Housing Units | 92 (82.9%) | 19 (17.1%) |
Occupancy by Educational Attainment in Bombay Beach
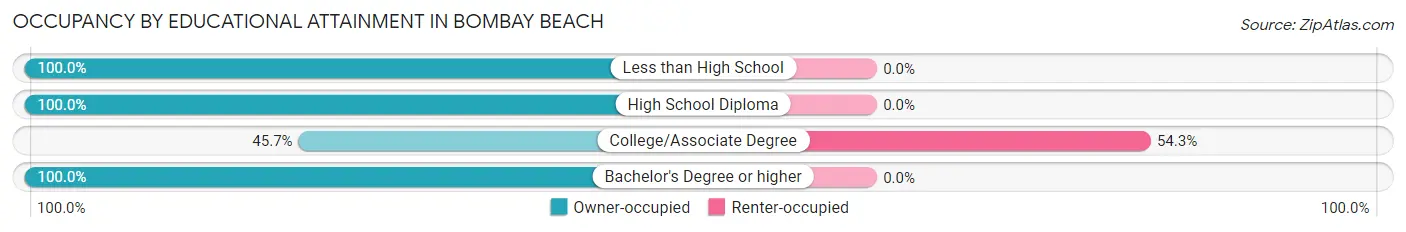
| Household Size | Owner-occupied | Renter-occupied |
| Less than High School | 8 (100.0%) | 0 (0.0%) |
| High School Diploma | 39 (100.0%) | 0 (0.0%) |
| College/Associate Degree | 16 (45.7%) | 19 (54.3%) |
| Bachelor's Degree or higher | 29 (100.0%) | 0 (0.0%) |
Occupancy by Age of Householder in Bombay Beach
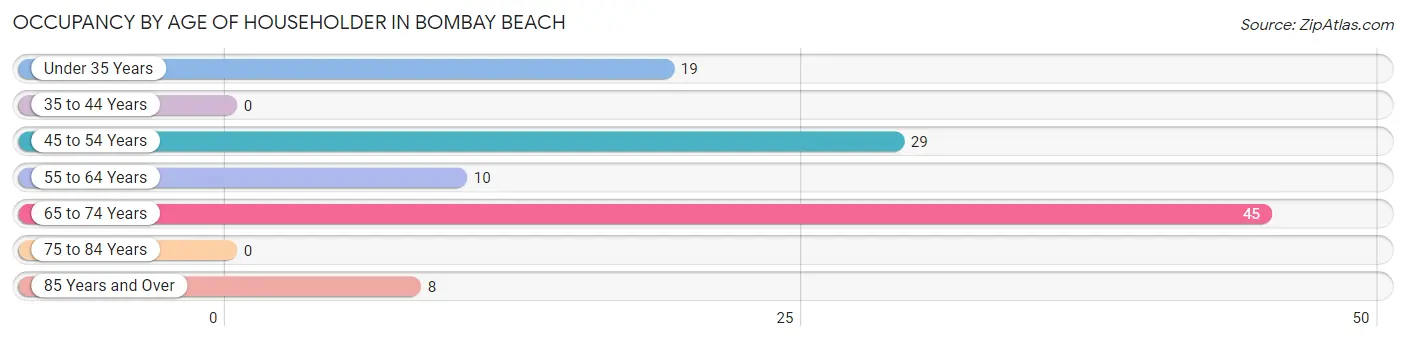
| Age Bracket | # Households | % Households |
| Under 35 Years | 19 | 17.1% |
| 35 to 44 Years | 0 | 0.0% |
| 45 to 54 Years | 29 | 26.1% |
| 55 to 64 Years | 10 | 9.0% |
| 65 to 74 Years | 45 | 40.5% |
| 75 to 84 Years | 0 | 0.0% |
| 85 Years and Over | 8 | 7.2% |
| Total | 111 | 100.0% |
Housing Finances in Bombay Beach
Median Income by Occupancy in Bombay Beach
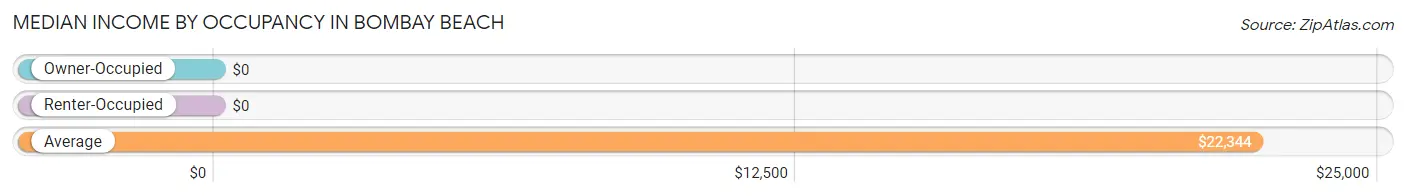
| Occupancy Type | # Households | Median Income |
| Owner-Occupied | 92 (82.9%) | $0 |
| Renter-Occupied | 19 (17.1%) | $0 |
| Average | 111 (100.0%) | $22,344 |
Occupancy by Householder Income Bracket in Bombay Beach
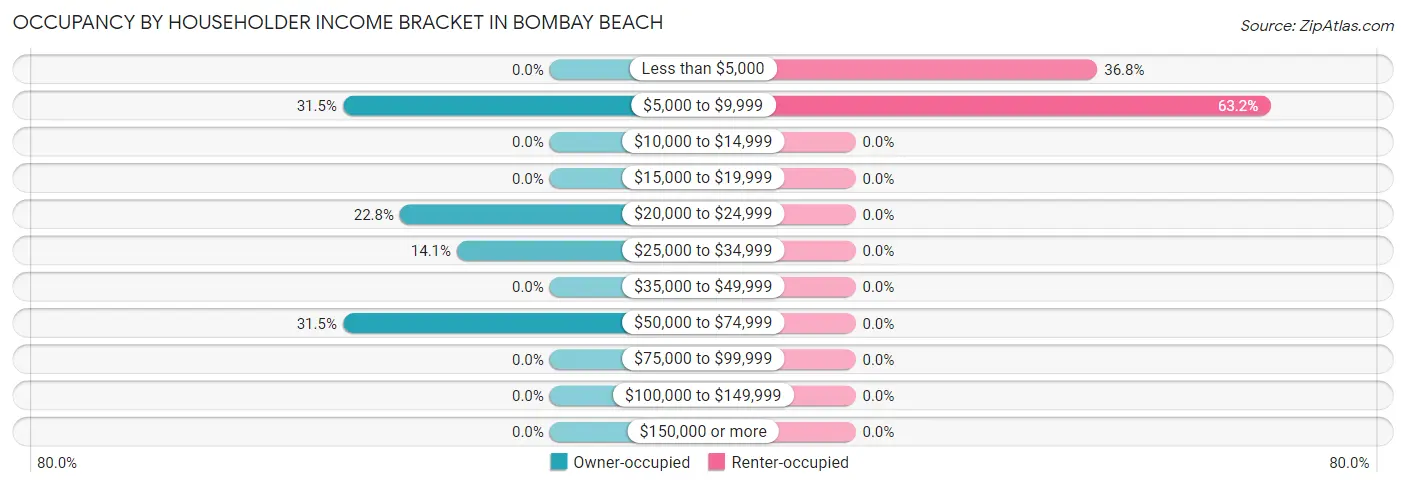
| Income Bracket | Owner-occupied | Renter-occupied |
| Less than $5,000 | 0 (0.0%) | 7 (36.8%) |
| $5,000 to $9,999 | 29 (31.5%) | 12 (63.2%) |
| $10,000 to $14,999 | 0 (0.0%) | 0 (0.0%) |
| $15,000 to $19,999 | 0 (0.0%) | 0 (0.0%) |
| $20,000 to $24,999 | 21 (22.8%) | 0 (0.0%) |
| $25,000 to $34,999 | 13 (14.1%) | 0 (0.0%) |
| $35,000 to $49,999 | 0 (0.0%) | 0 (0.0%) |
| $50,000 to $74,999 | 29 (31.5%) | 0 (0.0%) |
| $75,000 to $99,999 | 0 (0.0%) | 0 (0.0%) |
| $100,000 to $149,999 | 0 (0.0%) | 0 (0.0%) |
| $150,000 or more | 0 (0.0%) | 0 (0.0%) |
| Total | 92 (100.0%) | 19 (100.0%) |
Monthly Housing Cost Tiers in Bombay Beach
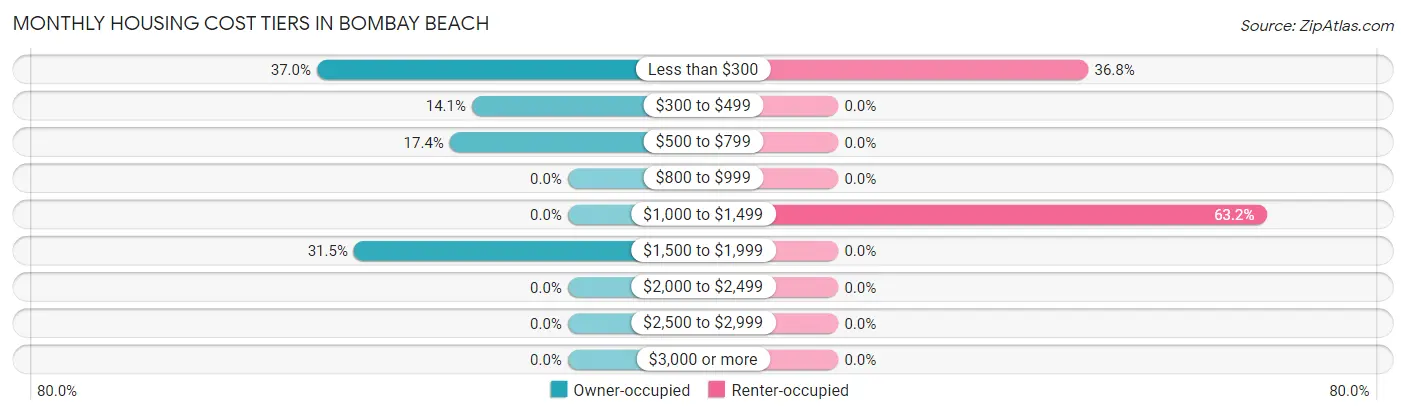
| Monthly Cost | Owner-occupied | Renter-occupied |
| Less than $300 | 34 (37.0%) | 7 (36.8%) |
| $300 to $499 | 13 (14.1%) | 0 (0.0%) |
| $500 to $799 | 16 (17.4%) | 0 (0.0%) |
| $800 to $999 | 0 (0.0%) | 0 (0.0%) |
| $1,000 to $1,499 | 0 (0.0%) | 12 (63.2%) |
| $1,500 to $1,999 | 29 (31.5%) | 0 (0.0%) |
| $2,000 to $2,499 | 0 (0.0%) | 0 (0.0%) |
| $2,500 to $2,999 | 0 (0.0%) | 0 (0.0%) |
| $3,000 or more | 0 (0.0%) | 0 (0.0%) |
| Total | 92 (100.0%) | 19 (100.0%) |
Physical Housing Characteristics in Bombay Beach
Housing Structures in Bombay Beach
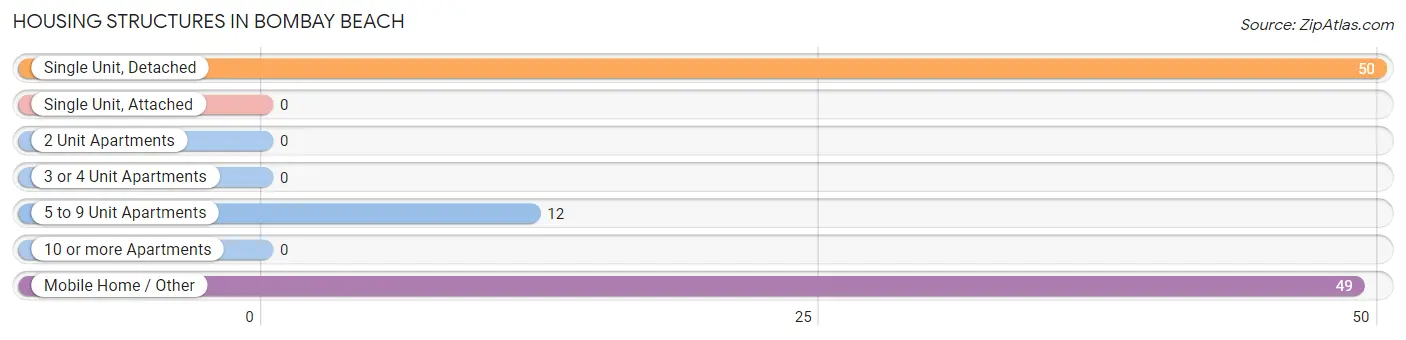
| Structure Type | # Housing Units | % Housing Units |
| Single Unit, Detached | 50 | 45.1% |
| Single Unit, Attached | 0 | 0.0% |
| 2 Unit Apartments | 0 | 0.0% |
| 3 or 4 Unit Apartments | 0 | 0.0% |
| 5 to 9 Unit Apartments | 12 | 10.8% |
| 10 or more Apartments | 0 | 0.0% |
| Mobile Home / Other | 49 | 44.1% |
| Total | 111 | 100.0% |
Housing Structures by Occupancy in Bombay Beach
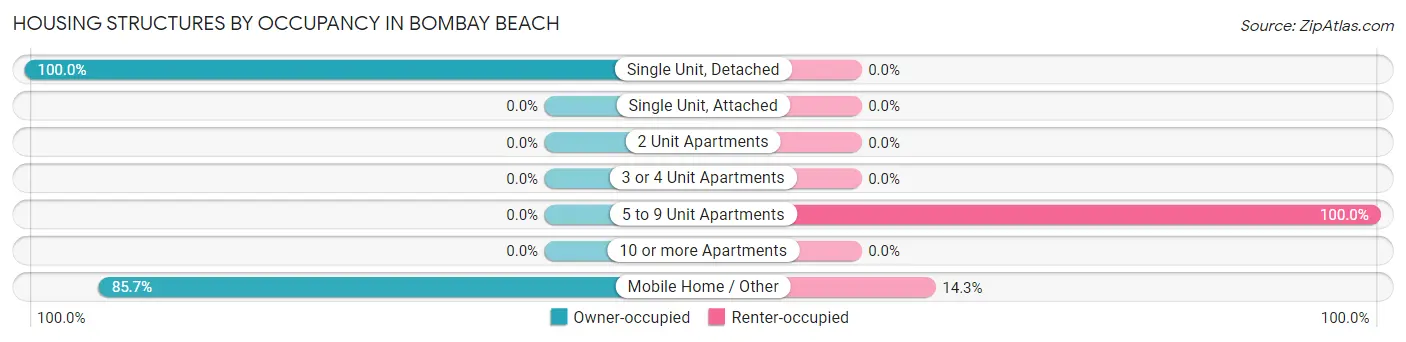
| Structure Type | Owner-occupied | Renter-occupied |
| Single Unit, Detached | 50 (100.0%) | 0 (0.0%) |
| Single Unit, Attached | 0 (0.0%) | 0 (0.0%) |
| 2 Unit Apartments | 0 (0.0%) | 0 (0.0%) |
| 3 or 4 Unit Apartments | 0 (0.0%) | 0 (0.0%) |
| 5 to 9 Unit Apartments | 0 (0.0%) | 12 (100.0%) |
| 10 or more Apartments | 0 (0.0%) | 0 (0.0%) |
| Mobile Home / Other | 42 (85.7%) | 7 (14.3%) |
| Total | 92 (82.9%) | 19 (17.1%) |
Housing Structures by Number of Rooms in Bombay Beach
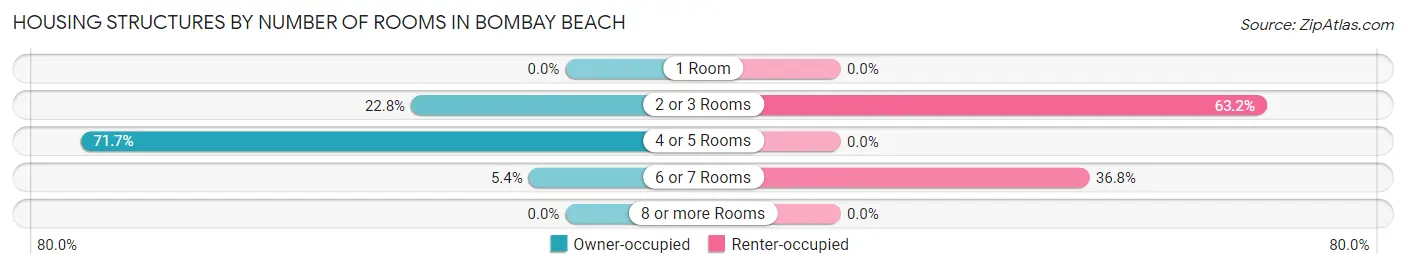
| Number of Rooms | Owner-occupied | Renter-occupied |
| 1 Room | 0 (0.0%) | 0 (0.0%) |
| 2 or 3 Rooms | 21 (22.8%) | 12 (63.2%) |
| 4 or 5 Rooms | 66 (71.7%) | 0 (0.0%) |
| 6 or 7 Rooms | 5 (5.4%) | 7 (36.8%) |
| 8 or more Rooms | 0 (0.0%) | 0 (0.0%) |
| Total | 92 (100.0%) | 19 (100.0%) |
Housing Structure by Heating Type in Bombay Beach
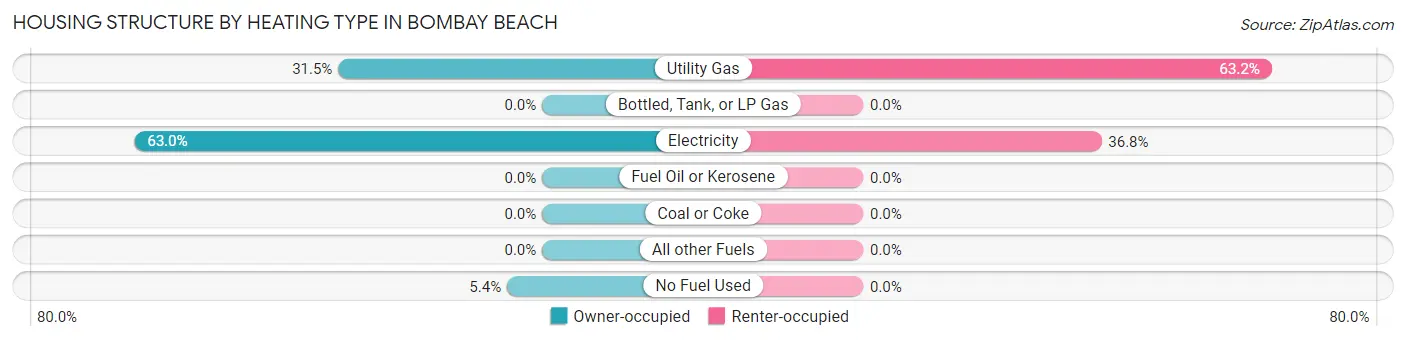
| Heating Type | Owner-occupied | Renter-occupied |
| Utility Gas | 29 (31.5%) | 12 (63.2%) |
| Bottled, Tank, or LP Gas | 0 (0.0%) | 0 (0.0%) |
| Electricity | 58 (63.0%) | 7 (36.8%) |
| Fuel Oil or Kerosene | 0 (0.0%) | 0 (0.0%) |
| Coal or Coke | 0 (0.0%) | 0 (0.0%) |
| All other Fuels | 0 (0.0%) | 0 (0.0%) |
| No Fuel Used | 5 (5.4%) | 0 (0.0%) |
| Total | 92 (100.0%) | 19 (100.0%) |
Household Vehicle Usage in Bombay Beach
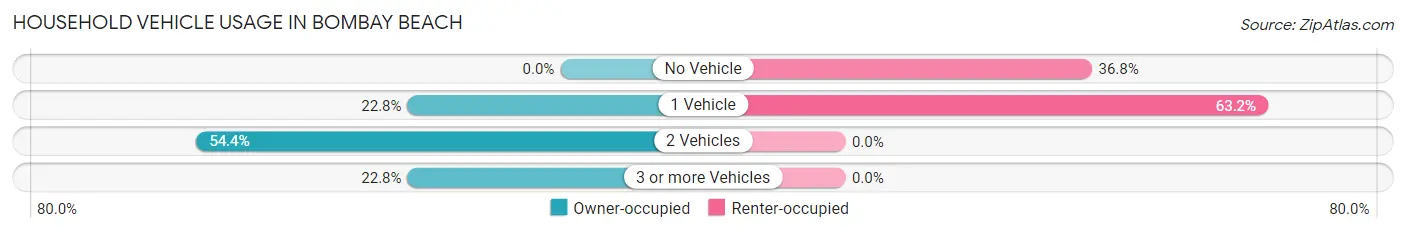
| Vehicles per Household | Owner-occupied | Renter-occupied |
| No Vehicle | 0 (0.0%) | 7 (36.8%) |
| 1 Vehicle | 21 (22.8%) | 12 (63.2%) |
| 2 Vehicles | 50 (54.3%) | 0 (0.0%) |
| 3 or more Vehicles | 21 (22.8%) | 0 (0.0%) |
| Total | 92 (100.0%) | 19 (100.0%) |
Real Estate & Mortgages in Bombay Beach
Real Estate and Mortgage Overview in Bombay Beach
| Characteristic | Without Mortgage | With Mortgage |
| Housing Units | 63 | 29 |
| Median Property Value | - | - |
| Median Household Income | - | - |
| Monthly Housing Costs | $290 | $0 |
| Real Estate Taxes | $938 | $0 |
Property Value by Mortgage Status in Bombay Beach
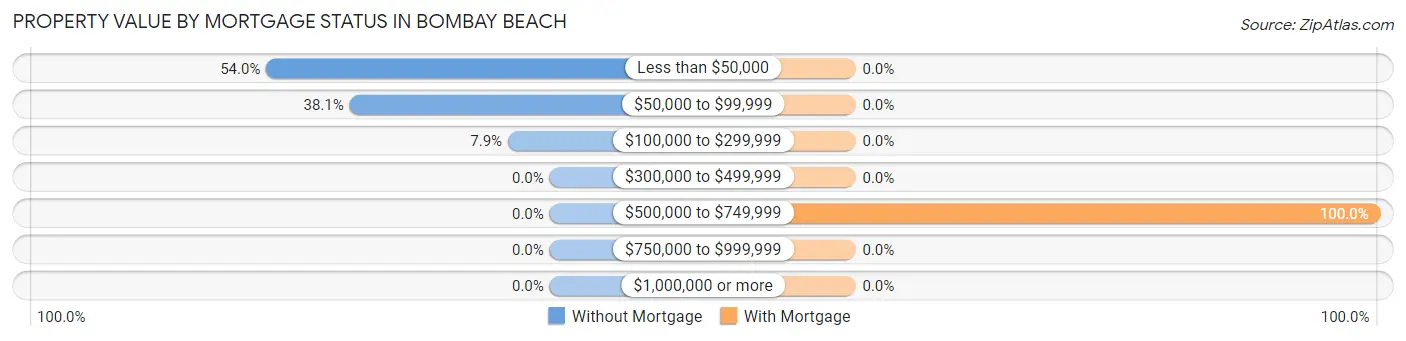
| Property Value | Without Mortgage | With Mortgage |
| Less than $50,000 | 34 (54.0%) | 0 (0.0%) |
| $50,000 to $99,999 | 24 (38.1%) | 0 (0.0%) |
| $100,000 to $299,999 | 5 (7.9%) | 0 (0.0%) |
| $300,000 to $499,999 | 0 (0.0%) | 0 (0.0%) |
| $500,000 to $749,999 | 0 (0.0%) | 29 (100.0%) |
| $750,000 to $999,999 | 0 (0.0%) | 0 (0.0%) |
| $1,000,000 or more | 0 (0.0%) | 0 (0.0%) |
| Total | 63 (100.0%) | 29 (100.0%) |
Household Income by Mortgage Status in Bombay Beach
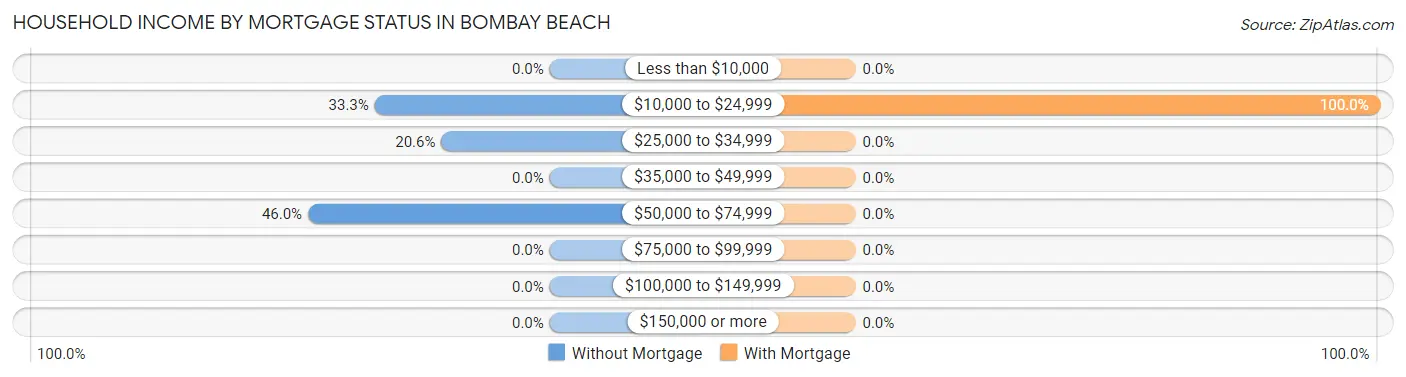
| Household Income | Without Mortgage | With Mortgage |
| Less than $10,000 | 0 (0.0%) | 0 (0.0%) |
| $10,000 to $24,999 | 21 (33.3%) | 29 (100.0%) |
| $25,000 to $34,999 | 13 (20.6%) | 0 (0.0%) |
| $35,000 to $49,999 | 0 (0.0%) | 0 (0.0%) |
| $50,000 to $74,999 | 29 (46.0%) | 0 (0.0%) |
| $75,000 to $99,999 | 0 (0.0%) | 0 (0.0%) |
| $100,000 to $149,999 | 0 (0.0%) | 0 (0.0%) |
| $150,000 or more | 0 (0.0%) | 0 (0.0%) |
| Total | 63 (100.0%) | 29 (100.0%) |
Property Value to Household Income Ratio in Bombay Beach
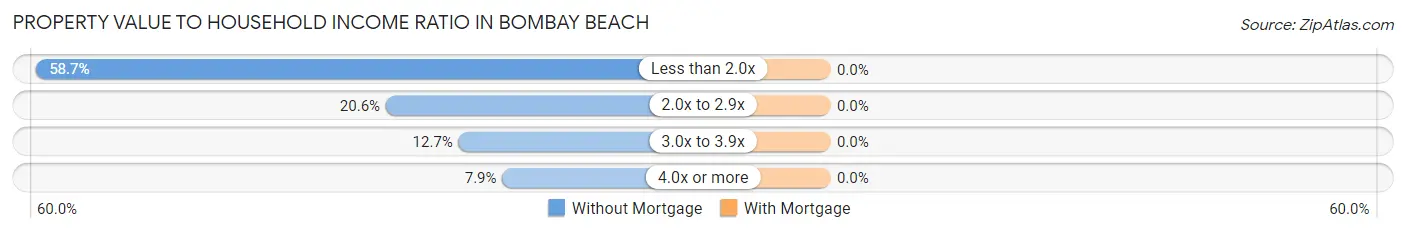
| Value-to-Income Ratio | Without Mortgage | With Mortgage |
| Less than 2.0x | 37 (58.7%) | 0 (0.0%) |
| 2.0x to 2.9x | 13 (20.6%) | 0 (0.0%) |
| 3.0x to 3.9x | 8 (12.7%) | 0 (0.0%) |
| 4.0x or more | 5 (7.9%) | 0 (0.0%) |
| Total | 63 (100.0%) | 29 (100.0%) |
Real Estate Taxes by Mortgage Status in Bombay Beach
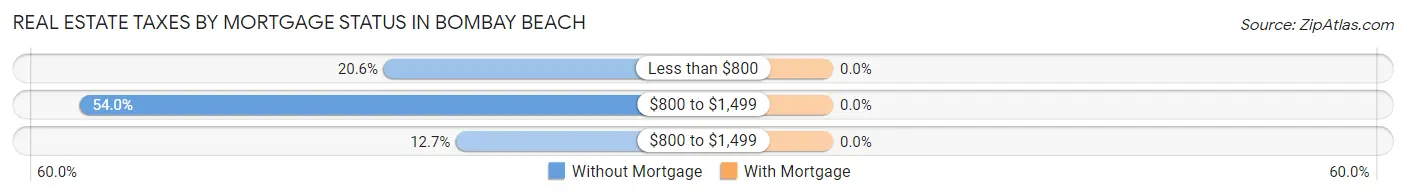
| Property Taxes | Without Mortgage | With Mortgage |
| Less than $800 | 13 (20.6%) | 0 (0.0%) |
| $800 to $1,499 | 34 (54.0%) | 0 (0.0%) |
| $800 to $1,499 | 8 (12.7%) | 0 (0.0%) |
| Total | 63 (100.0%) | 29 (100.0%) |
Health & Disability in Bombay Beach
Health Insurance Coverage by Age in Bombay Beach
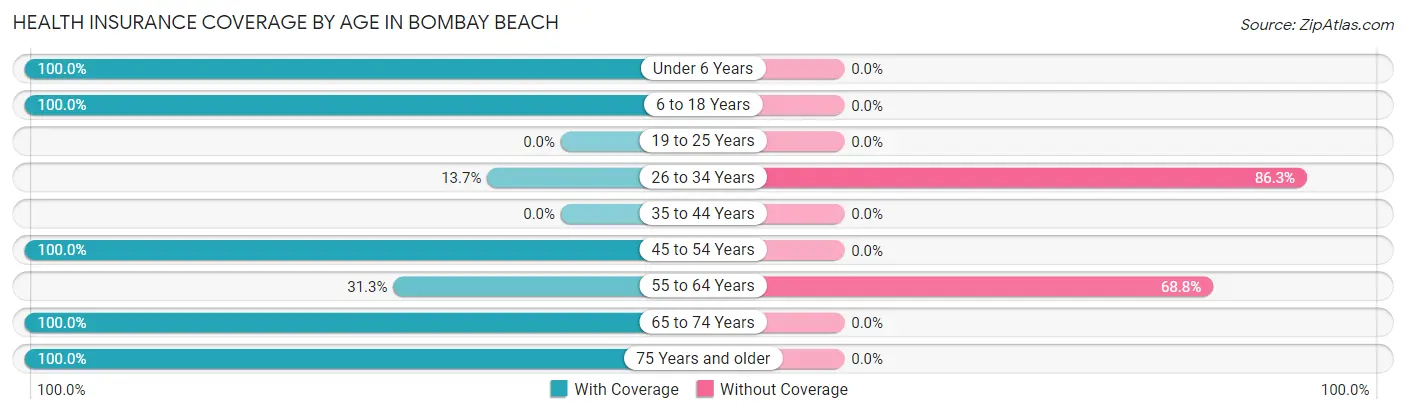
| Age Bracket | With Coverage | Without Coverage |
| Under 6 Years | 34 (100.0%) | 0 (0.0%) |
| 6 to 18 Years | 34 (100.0%) | 0 (0.0%) |
| 19 to 25 Years | 0 (0.0%) | 0 (0.0%) |
| 26 to 34 Years | 7 (13.7%) | 44 (86.3%) |
| 35 to 44 Years | 0 (0.0%) | 0 (0.0%) |
| 45 to 54 Years | 29 (100.0%) | 0 (0.0%) |
| 55 to 64 Years | 5 (31.2%) | 11 (68.8%) |
| 65 to 74 Years | 55 (100.0%) | 0 (0.0%) |
| 75 Years and older | 11 (100.0%) | 0 (0.0%) |
| Total | 175 (76.1%) | 55 (23.9%) |
Health Insurance Coverage by Citizenship Status in Bombay Beach
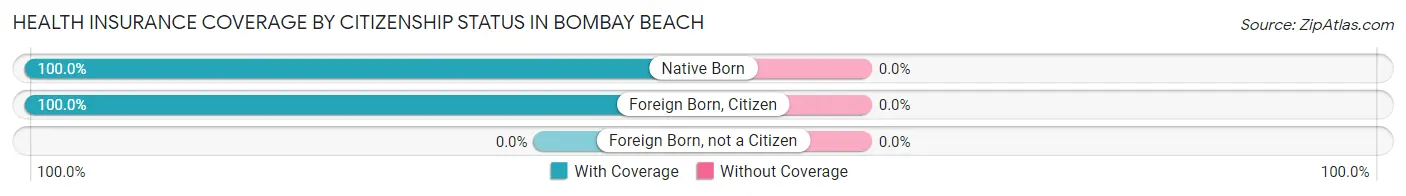
| Citizenship Status | With Coverage | Without Coverage |
| Native Born | 34 (100.0%) | 0 (0.0%) |
| Foreign Born, Citizen | 34 (100.0%) | 0 (0.0%) |
| Foreign Born, not a Citizen | 0 (0.0%) | 0 (0.0%) |
Health Insurance Coverage by Household Income in Bombay Beach
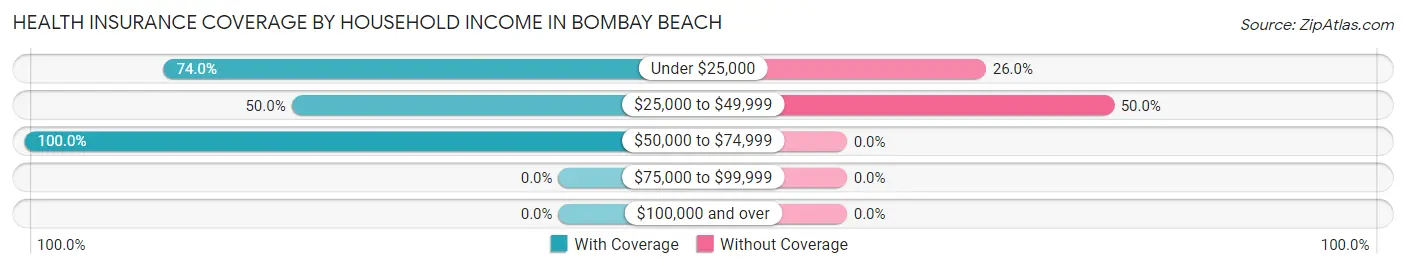
| Household Income | With Coverage | Without Coverage |
| Under $25,000 | 125 (74.0%) | 44 (26.0%) |
| $25,000 to $49,999 | 11 (50.0%) | 11 (50.0%) |
| $50,000 to $74,999 | 39 (100.0%) | 0 (0.0%) |
| $75,000 to $99,999 | 0 (0.0%) | 0 (0.0%) |
| $100,000 and over | 0 (0.0%) | 0 (0.0%) |
Public vs Private Health Insurance Coverage by Age in Bombay Beach
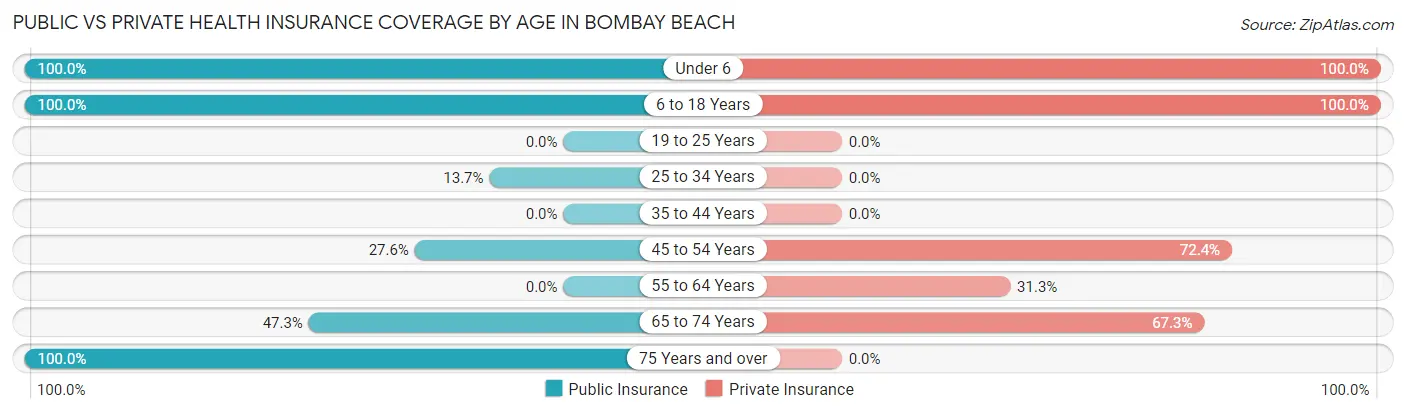
| Age Bracket | Public Insurance | Private Insurance |
| Under 6 | 34 (100.0%) | 34 (100.0%) |
| 6 to 18 Years | 34 (100.0%) | 34 (100.0%) |
| 19 to 25 Years | 0 (0.0%) | 0 (0.0%) |
| 25 to 34 Years | 7 (13.7%) | 0 (0.0%) |
| 35 to 44 Years | 0 (0.0%) | 0 (0.0%) |
| 45 to 54 Years | 8 (27.6%) | 21 (72.4%) |
| 55 to 64 Years | 0 (0.0%) | 5 (31.2%) |
| 65 to 74 Years | 26 (47.3%) | 37 (67.3%) |
| 75 Years and over | 11 (100.0%) | 0 (0.0%) |
| Total | 120 (52.2%) | 131 (57.0%) |
Disability Status by Sex by Age in Bombay Beach
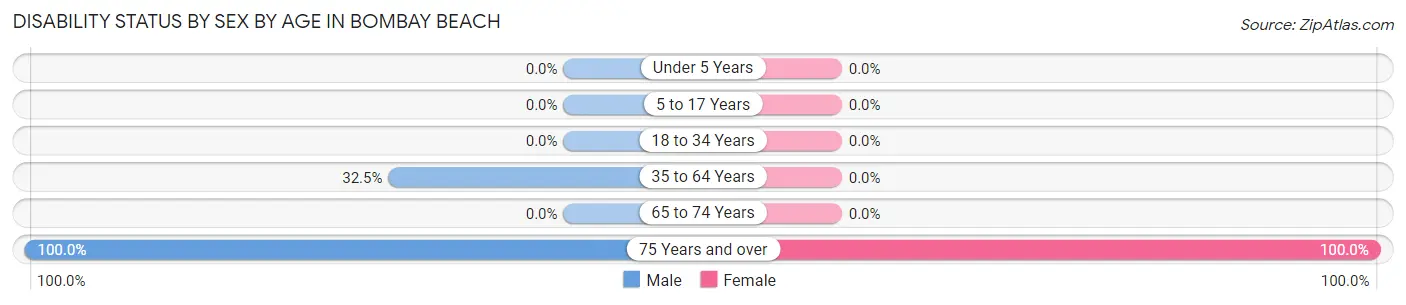
| Age Bracket | Male | Female |
| Under 5 Years | 0 (0.0%) | 0 (0.0%) |
| 5 to 17 Years | 0 (0.0%) | 0 (0.0%) |
| 18 to 34 Years | 0 (0.0%) | 0 (0.0%) |
| 35 to 64 Years | 13 (32.5%) | 0 (0.0%) |
| 65 to 74 Years | 0 (0.0%) | 0 (0.0%) |
| 75 Years and over | 3 (100.0%) | 8 (100.0%) |
Disability Class by Sex by Age in Bombay Beach
Disability Class: Hearing Difficulty
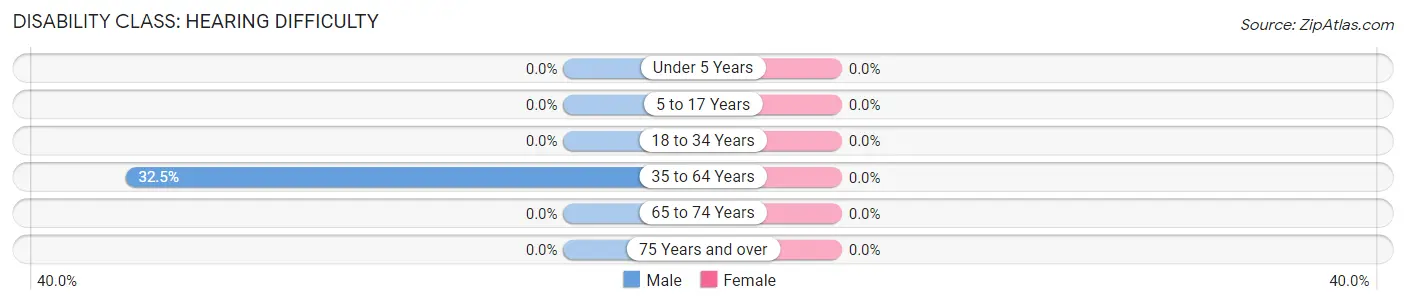
| Age Bracket | Male | Female |
| Under 5 Years | 0 (0.0%) | 0 (0.0%) |
| 5 to 17 Years | 0 (0.0%) | 0 (0.0%) |
| 18 to 34 Years | 0 (0.0%) | 0 (0.0%) |
| 35 to 64 Years | 13 (32.5%) | 0 (0.0%) |
| 65 to 74 Years | 0 (0.0%) | 0 (0.0%) |
| 75 Years and over | 0 (0.0%) | 0 (0.0%) |
Disability Class: Vision Difficulty
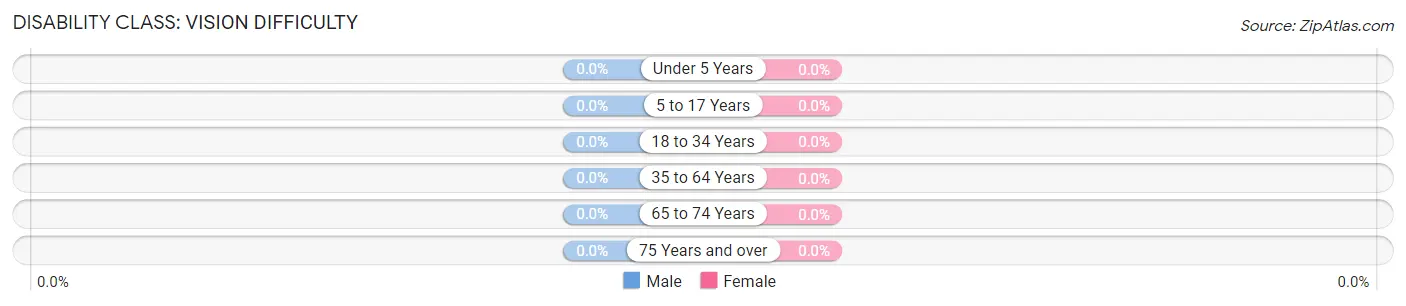
| Age Bracket | Male | Female |
| Under 5 Years | 0 (0.0%) | 0 (0.0%) |
| 5 to 17 Years | 0 (0.0%) | 0 (0.0%) |
| 18 to 34 Years | 0 (0.0%) | 0 (0.0%) |
| 35 to 64 Years | 0 (0.0%) | 0 (0.0%) |
| 65 to 74 Years | 0 (0.0%) | 0 (0.0%) |
| 75 Years and over | 0 (0.0%) | 0 (0.0%) |
Disability Class: Cognitive Difficulty
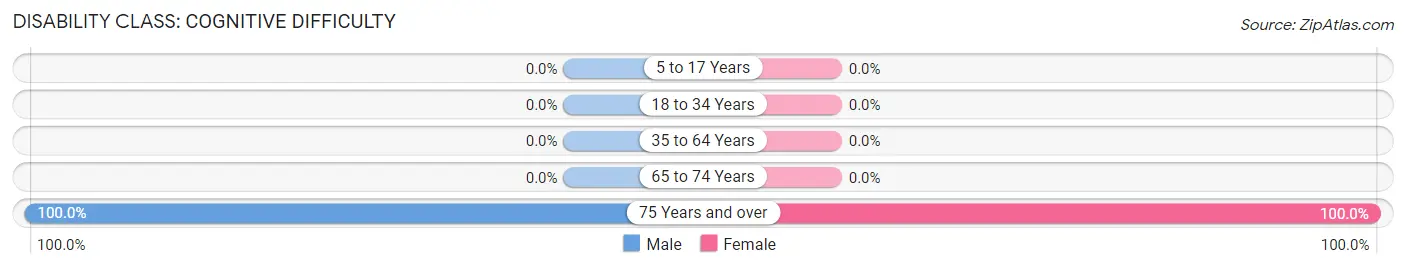
| Age Bracket | Male | Female |
| 5 to 17 Years | 0 (0.0%) | 0 (0.0%) |
| 18 to 34 Years | 0 (0.0%) | 0 (0.0%) |
| 35 to 64 Years | 0 (0.0%) | 0 (0.0%) |
| 65 to 74 Years | 0 (0.0%) | 0 (0.0%) |
| 75 Years and over | 3 (100.0%) | 8 (100.0%) |
Disability Class: Ambulatory Difficulty
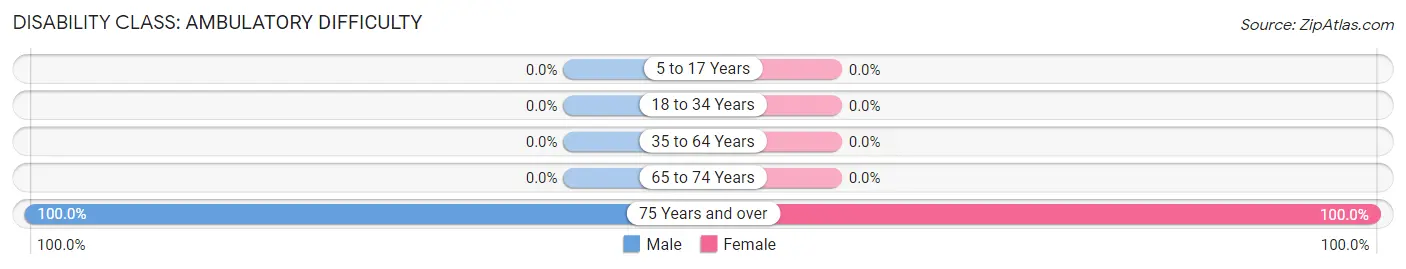
| Age Bracket | Male | Female |
| 5 to 17 Years | 0 (0.0%) | 0 (0.0%) |
| 18 to 34 Years | 0 (0.0%) | 0 (0.0%) |
| 35 to 64 Years | 0 (0.0%) | 0 (0.0%) |
| 65 to 74 Years | 0 (0.0%) | 0 (0.0%) |
| 75 Years and over | 3 (100.0%) | 8 (100.0%) |
Disability Class: Self-Care Difficulty
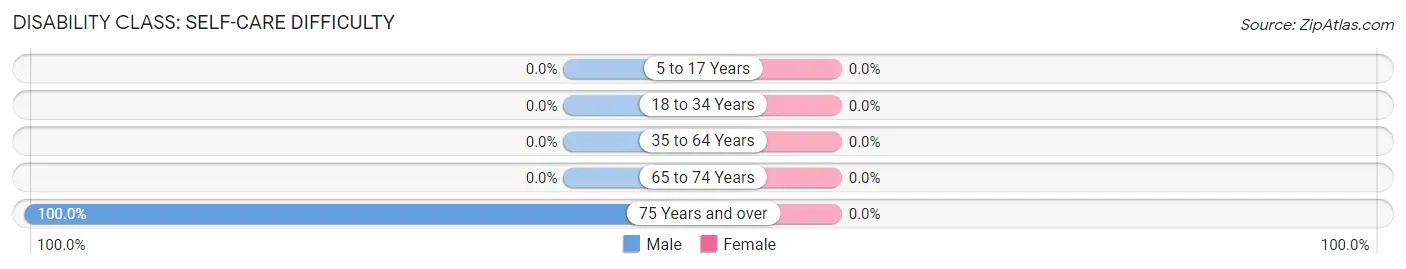
| Age Bracket | Male | Female |
| 5 to 17 Years | 0 (0.0%) | 0 (0.0%) |
| 18 to 34 Years | 0 (0.0%) | 0 (0.0%) |
| 35 to 64 Years | 0 (0.0%) | 0 (0.0%) |
| 65 to 74 Years | 0 (0.0%) | 0 (0.0%) |
| 75 Years and over | 3 (100.0%) | 0 (0.0%) |
Technology Access in Bombay Beach
Computing Device Access in Bombay Beach
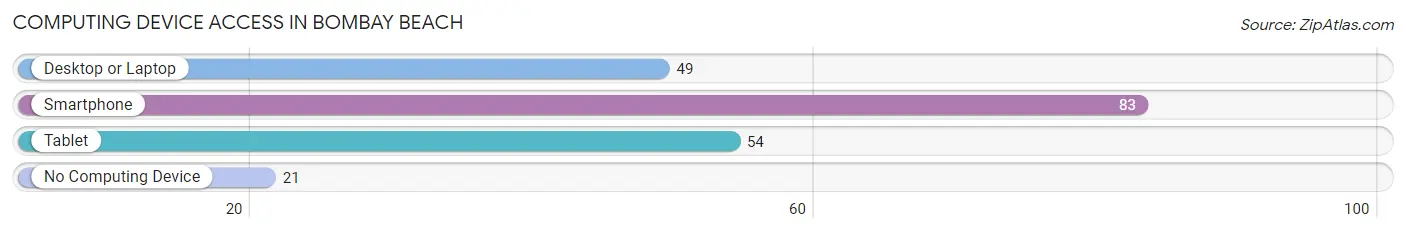
| Device Type | # Households | % Households |
| Desktop or Laptop | 49 | 44.1% |
| Smartphone | 83 | 74.8% |
| Tablet | 54 | 48.6% |
| No Computing Device | 21 | 18.9% |
| Total | 111 | 100.0% |
Internet Access in Bombay Beach
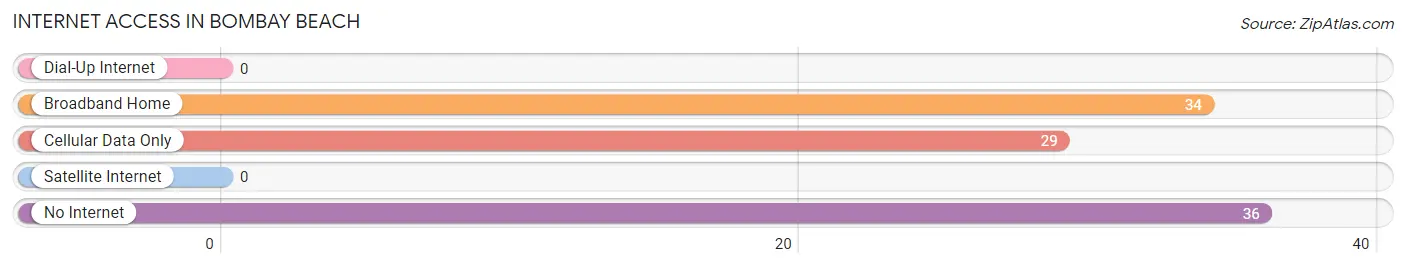
| Internet Type | # Households | % Households |
| Dial-Up Internet | 0 | 0.0% |
| Broadband Home | 34 | 30.6% |
| Cellular Data Only | 29 | 26.1% |
| Satellite Internet | 0 | 0.0% |
| No Internet | 36 | 32.4% |
| Total | 111 | 100.0% |
Bombay Beach Summary
Bombay Beach is a small unincorporated community located in the southeastern corner of California’s Imperial County, on the eastern shore of the Salton Sea. It is situated at the base of the Chocolate Mountains, and is the lowest community in the United States, at an elevation of -227 feet below sea level. The town was founded in the early 1950s as a resort destination, and has since become a popular destination for tourists and outdoor enthusiasts.
History
Bombay Beach was founded in the early 1950s as a resort destination. The town was named after the Bombay Beach Resort, which was built in 1952 by the Salton Sea Beach Company. The resort was designed to be a luxurious destination for wealthy tourists, and featured a golf course, tennis courts, and a large swimming pool. The resort was a popular destination for celebrities, including Elvis Presley, who visited in the 1950s.
The town experienced a period of growth in the 1950s and 1960s, as more people moved to the area to take advantage of the resort. However, the town began to decline in the 1970s, as the Salton Sea began to shrink due to agricultural runoff and other environmental factors. By the 1980s, the town had become a ghost town, with only a few hundred residents remaining.
Geography
Bombay Beach is located in the southeastern corner of California’s Imperial County, on the eastern shore of the Salton Sea. It is situated at the base of the Chocolate Mountains, and is the lowest community in the United States, at an elevation of -227 feet below sea level. The town is surrounded by the Salton Sea State Recreation Area, which offers a variety of outdoor activities, including camping, fishing, and boating.
The town is located approximately 120 miles east of Los Angeles, and is accessible via State Route 111. The nearest major cities are Palm Springs, which is located approximately 40 miles to the west, and Brawley, which is located approximately 25 miles to the north.
Economy
The economy of Bombay Beach is largely based on tourism. The town is a popular destination for outdoor enthusiasts, and offers a variety of activities, including camping, fishing, and boating. The town is also home to a number of small businesses, including restaurants, convenience stores, and gas stations.
Demographics
As of the 2010 census, the population of Bombay Beach was 365. The racial makeup of the town was 73.3% White, 0.3% African American, 0.3% Native American, 0.3% Asian, 0.3% Pacific Islander, and 24.7% from other races. The median household income was $25,000, and the median age was 44.
Conclusion
Bombay Beach is a small unincorporated community located in the southeastern corner of California’s Imperial County, on the eastern shore of the Salton Sea. It is situated at the base of the Chocolate Mountains, and is the lowest community in the United States, at an elevation of -227 feet below sea level. The town was founded in the early 1950s as a resort destination, and has since become a popular destination for tourists and outdoor enthusiasts. The economy of Bombay Beach is largely based on tourism, and the town is home to a number of small businesses. As of the 2010 census, the population of Bombay Beach was 365, with a median household income of $25,000 and a median age of 44.
Common Questions
What is the Total Population of Bombay Beach?
Total Population of Bombay Beach is 242.
What is the Total Male Population of Bombay Beach?
Total Male Population of Bombay Beach is 142.
What is the Total Female Population of Bombay Beach?
Total Female Population of Bombay Beach is 100.
What is the Ratio of Males per 100 Females in Bombay Beach?
There are 142.00 Males per 100 Females in Bombay Beach.
What is the Ratio of Females per 100 Males in Bombay Beach?
There are 70.42 Females per 100 Males in Bombay Beach.
What is the Median Population Age in Bombay Beach?
Median Population Age in Bombay Beach is 33.8 Years.
What is the Average Family Size in Bombay Beach
Average Family Size in Bombay Beach is 3.2 People.
What is the Average Household Size in Bombay Beach
Average Household Size in Bombay Beach is 2.2 People.
What is Per Capita Income in Bombay Beach?
Per Capita income in Bombay Beach is $11,881.
What is the Median Household income in Bombay Beach?
Median Household Income in Bombay Beach is $22,344.
What is Inequality or Gini Index in Bombay Beach?
Inequality or Gini Index in Bombay Beach is 0.42.
How Large is the Labor Force in Bombay Beach?
There are 82 People in the Labor Forcein in Bombay Beach.
What is the Percentage of People in the Labor Force in Bombay Beach?
47.1% of People are in the Labor Force in Bombay Beach.
What is the Unemployment Rate in Bombay Beach?
Unemployment Rate in Bombay Beach is 14.3%.