Bay Point, CA
Bay Point Map
Bay Point Overview
24,407
TOTAL POPULATION
13,024
MALE POPULATION
11,383
FEMALE POPULATION
114.42
MALES / 100 FEMALES
87.40
FEMALES / 100 MALES
32.5
MEDIAN AGE
3.9
AVG FAMILY SIZE
3.7
AVG HOUSEHOLD SIZE
$28,414
PER CAPITA INCOME
$75,849
AVG FAMILY INCOME
$79,226
AVG HOUSEHOLD INCOME
32.2%
WAGE / INCOME GAP [ % ]
67.8¢/ $1
WAGE / INCOME GAP [ $ ]
0.41
INEQUALITY / GINI INDEX
12,810
LABOR FORCE [ PEOPLE ]
68.6%
PERCENT IN LABOR FORCE
9.9%
UNEMPLOYMENT RATE
Bay Point Area Codes
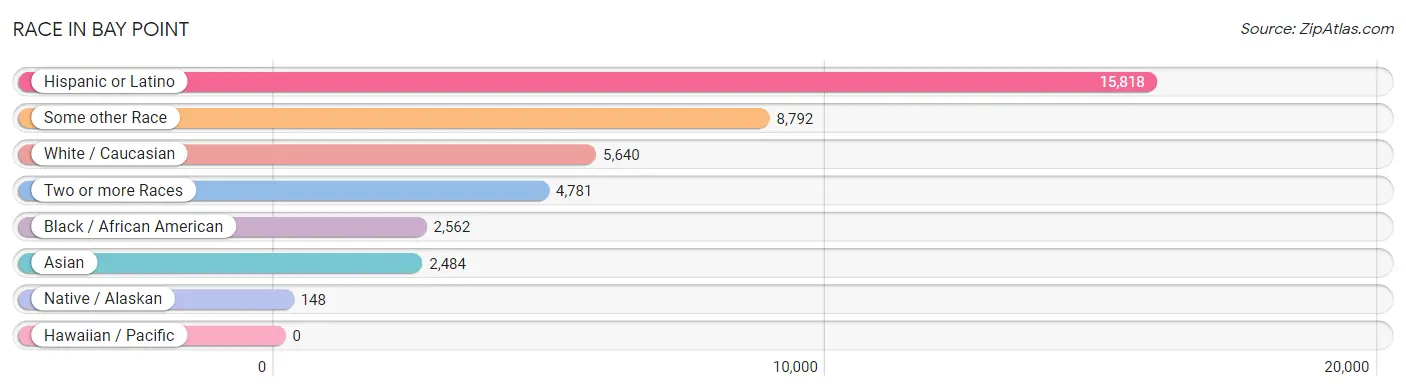
Race in Bay Point
The most populous races in Bay Point are Hispanic or Latino (15,818 | 64.8%), Some other Race (8,792 | 36.0%), and White / Caucasian (5,640 | 23.1%).
| Race | # Population | % Population |
| Asian | 2,484 | 10.2% |
| Black / African American | 2,562 | 10.5% |
| Hawaiian / Pacific | 0 | 0.0% |
| Hispanic or Latino | 15,818 | 64.8% |
| Native / Alaskan | 148 | 0.6% |
| White / Caucasian | 5,640 | 23.1% |
| Two or more Races | 4,781 | 19.6% |
| Some other Race | 8,792 | 36.0% |
| Total | 24,407 | 100.0% |
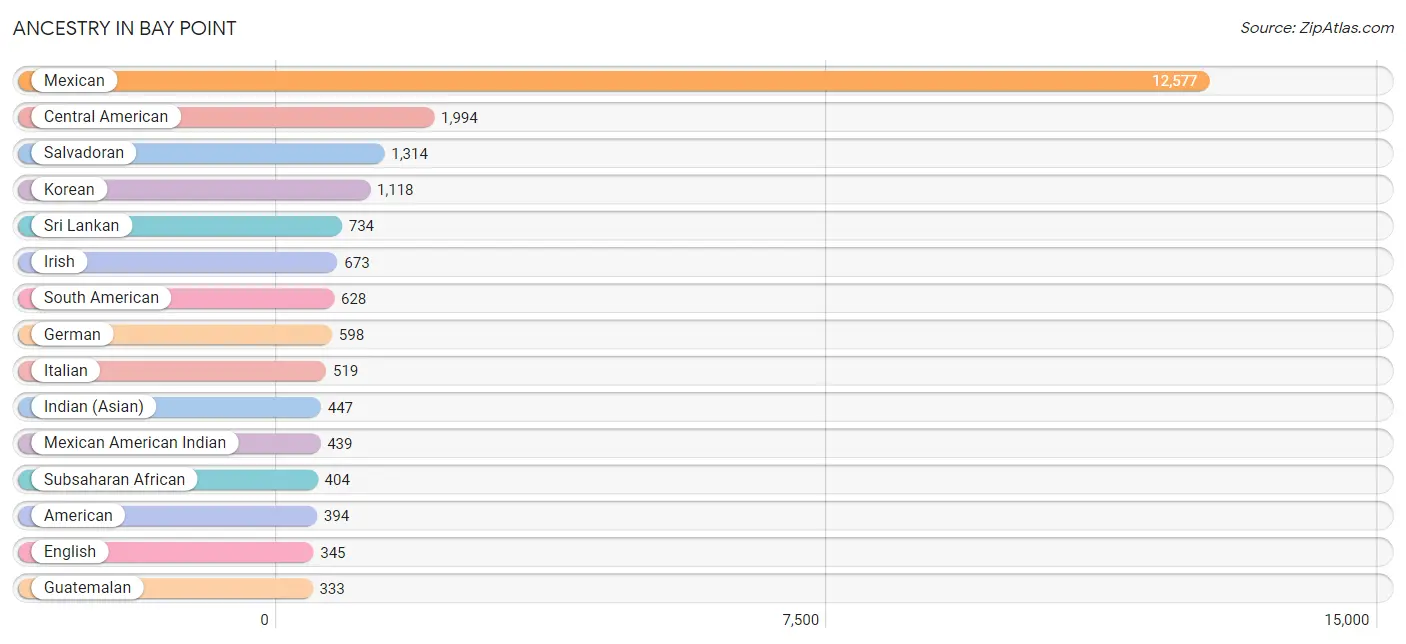
Ancestry in Bay Point
The most populous ancestries reported in Bay Point are Mexican (12,577 | 51.5%), Central American (1,994 | 8.2%), Salvadoran (1,314 | 5.4%), Korean (1,118 | 4.6%), and Sri Lankan (734 | 3.0%), together accounting for 72.7% of all Bay Point residents.
| Ancestry | # Population | % Population |
| Afghan | 27 | 0.1% |
| African | 237 | 1.0% |
| American | 394 | 1.6% |
| Argentinean | 40 | 0.2% |
| Bhutanese | 154 | 0.6% |
| Blackfeet | 11 | 0.1% |
| Brazilian | 9 | 0.0% |
| British | 5 | 0.0% |
| Burmese | 33 | 0.1% |
| Cape Verdean | 16 | 0.1% |
| Central American | 1,994 | 8.2% |
| Central American Indian | 109 | 0.4% |
| Cherokee | 15 | 0.1% |
| Choctaw | 13 | 0.1% |
| Colombian | 203 | 0.8% |
| Costa Rican | 26 | 0.1% |
| Cuban | 21 | 0.1% |
| Dominican | 21 | 0.1% |
| Dutch | 182 | 0.7% |
| Eastern European | 19 | 0.1% |
| English | 345 | 1.4% |
| European | 201 | 0.8% |
| French | 63 | 0.3% |
| German | 598 | 2.5% |
| Guatemalan | 333 | 1.4% |
| Indian (Asian) | 447 | 1.8% |
| Iranian | 38 | 0.2% |
| Irish | 673 | 2.8% |
| Italian | 519 | 2.1% |
| Korean | 1,118 | 4.6% |
| Mexican | 12,577 | 51.5% |
| Mexican American Indian | 439 | 1.8% |
| Native Hawaiian | 9 | 0.0% |
| Nicaraguan | 321 | 1.3% |
| Nigerian | 151 | 0.6% |
| Northern European | 12 | 0.1% |
| Norwegian | 33 | 0.1% |
| Peruvian | 294 | 1.2% |
| Polish | 67 | 0.3% |
| Portuguese | 139 | 0.6% |
| Pueblo | 11 | 0.1% |
| Puerto Rican | 170 | 0.7% |
| Russian | 7 | 0.0% |
| Salvadoran | 1,314 | 5.4% |
| Samoan | 64 | 0.3% |
| Scotch-Irish | 81 | 0.3% |
| Scottish | 132 | 0.5% |
| Slavic | 5 | 0.0% |
| South American | 628 | 2.6% |
| South American Indian | 93 | 0.4% |
| Spaniard | 81 | 0.3% |
| Spanish | 65 | 0.3% |
| Sri Lankan | 734 | 3.0% |
| Subsaharan African | 404 | 1.7% |
| Swedish | 28 | 0.1% |
| Swiss | 21 | 0.1% |
| Thai | 283 | 1.2% |
| Ukrainian | 25 | 0.1% |
| Uruguayan | 91 | 0.4% |
| Welsh | 71 | 0.3% |
| Yaqui | 3 | 0.0% | View All 61 Rows |
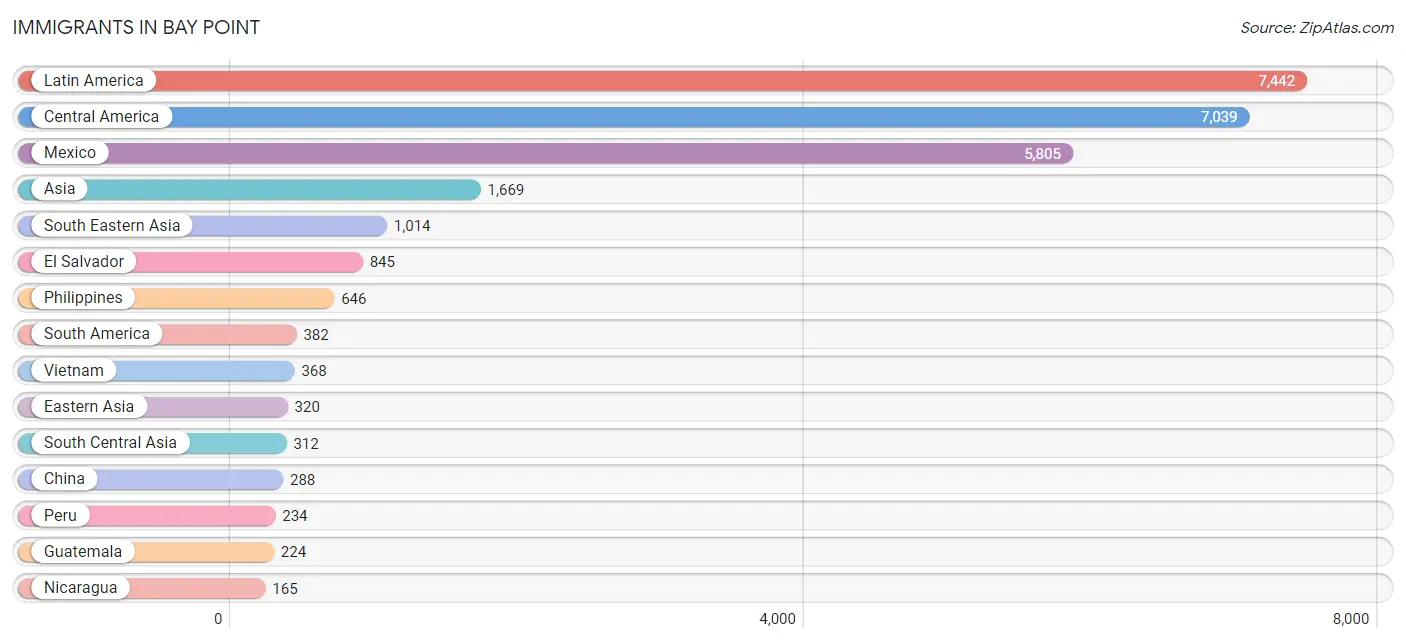
Immigrants in Bay Point
The most numerous immigrant groups reported in Bay Point came from Latin America (7,442 | 30.5%), Central America (7,039 | 28.8%), Mexico (5,805 | 23.8%), Asia (1,669 | 6.8%), and South Eastern Asia (1,014 | 4.2%), together accounting for 94.1% of all Bay Point residents.
| Immigration Origin | # Population | % Population |
| Afghanistan | 27 | 0.1% |
| Africa | 128 | 0.5% |
| Argentina | 15 | 0.1% |
| Asia | 1,669 | 6.8% |
| Brazil | 9 | 0.0% |
| Caribbean | 21 | 0.1% |
| Central America | 7,039 | 28.8% |
| China | 288 | 1.2% |
| Colombia | 80 | 0.3% |
| Dominican Republic | 21 | 0.1% |
| Eastern Asia | 320 | 1.3% |
| Eastern Europe | 49 | 0.2% |
| El Salvador | 845 | 3.5% |
| Europe | 123 | 0.5% |
| Germany | 29 | 0.1% |
| Guatemala | 224 | 0.9% |
| Hong Kong | 52 | 0.2% |
| India | 123 | 0.5% |
| Iran | 26 | 0.1% |
| Ireland | 2 | 0.0% |
| Israel | 23 | 0.1% |
| Korea | 32 | 0.1% |
| Latin America | 7,442 | 30.5% |
| Mexico | 5,805 | 23.8% |
| Nicaragua | 165 | 0.7% |
| Nigeria | 128 | 0.5% |
| Northern Europe | 45 | 0.2% |
| Oceania | 24 | 0.1% |
| Pakistan | 136 | 0.6% |
| Peru | 234 | 1.0% |
| Philippines | 646 | 2.6% |
| Russia | 24 | 0.1% |
| South America | 382 | 1.6% |
| South Central Asia | 312 | 1.3% |
| South Eastern Asia | 1,014 | 4.2% |
| Ukraine | 25 | 0.1% |
| Uruguay | 44 | 0.2% |
| Vietnam | 368 | 1.5% |
| Western Africa | 128 | 0.5% |
| Western Asia | 23 | 0.1% |
| Western Europe | 29 | 0.1% | View All 41 Rows |
Sex and Age in Bay Point
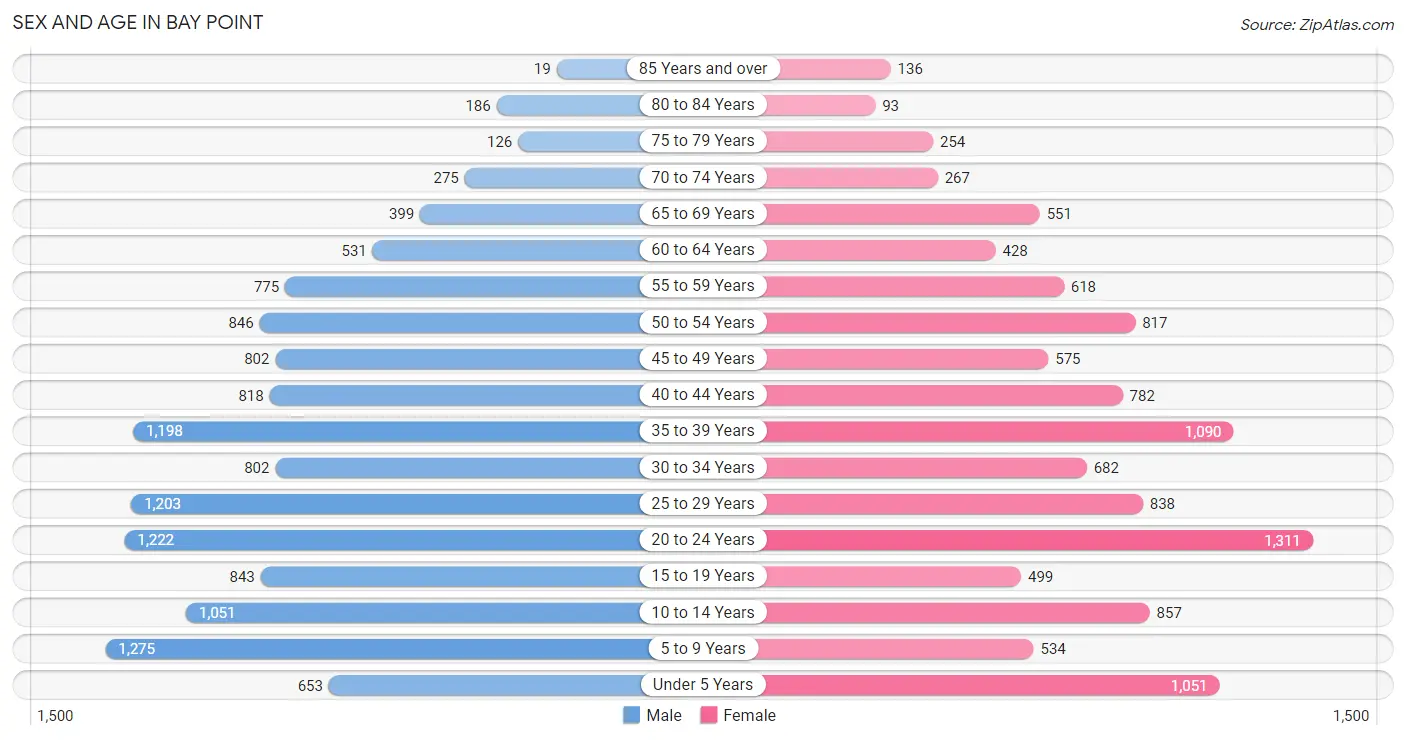
Sex and Age in Bay Point
The most populous age groups in Bay Point are 5 to 9 Years (1,275 | 9.8%) for men and 20 to 24 Years (1,311 | 11.5%) for women.
| Age Bracket | Male | Female |
| Under 5 Years | 653 (5.0%) | 1,051 (9.2%) |
| 5 to 9 Years | 1,275 (9.8%) | 534 (4.7%) |
| 10 to 14 Years | 1,051 (8.1%) | 857 (7.5%) |
| 15 to 19 Years | 843 (6.5%) | 499 (4.4%) |
| 20 to 24 Years | 1,222 (9.4%) | 1,311 (11.5%) |
| 25 to 29 Years | 1,203 (9.2%) | 838 (7.4%) |
| 30 to 34 Years | 802 (6.2%) | 682 (6.0%) |
| 35 to 39 Years | 1,198 (9.2%) | 1,090 (9.6%) |
| 40 to 44 Years | 818 (6.3%) | 782 (6.9%) |
| 45 to 49 Years | 802 (6.2%) | 575 (5.1%) |
| 50 to 54 Years | 846 (6.5%) | 817 (7.2%) |
| 55 to 59 Years | 775 (5.9%) | 618 (5.4%) |
| 60 to 64 Years | 531 (4.1%) | 428 (3.8%) |
| 65 to 69 Years | 399 (3.1%) | 551 (4.8%) |
| 70 to 74 Years | 275 (2.1%) | 267 (2.4%) |
| 75 to 79 Years | 126 (1.0%) | 254 (2.2%) |
| 80 to 84 Years | 186 (1.4%) | 93 (0.8%) |
| 85 Years and over | 19 (0.2%) | 136 (1.2%) |
| Total | 13,024 (100.0%) | 11,383 (100.0%) |
Families and Households in Bay Point
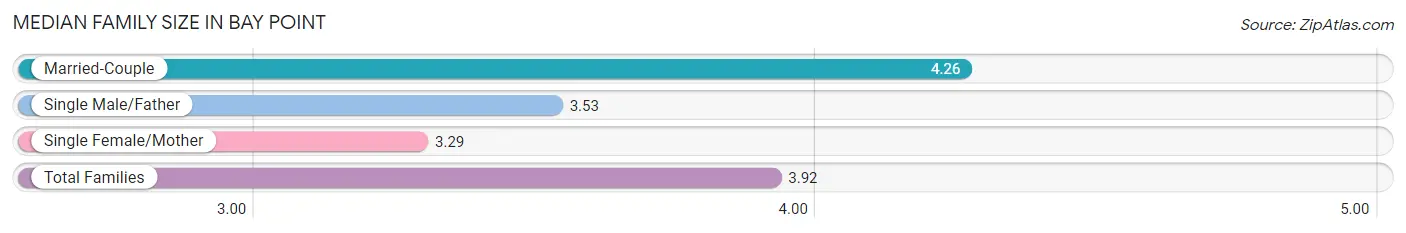
Median Family Size in Bay Point
The median family size in Bay Point is 3.92 persons per family, with married-couple families (3,281 | 60.7%) accounting for the largest median family size of 4.26 persons per family. On the other hand, single female/mother families (1,277 | 23.6%) represent the smallest median family size with 3.29 persons per family.
| Family Type | # Families | Family Size |
| Married-Couple | 3,281 (60.7%) | 4.26 |
| Single Male/Father | 848 (15.7%) | 3.53 |
| Single Female/Mother | 1,277 (23.6%) | 3.29 |
| Total Families | 5,406 (100.0%) | 3.92 |
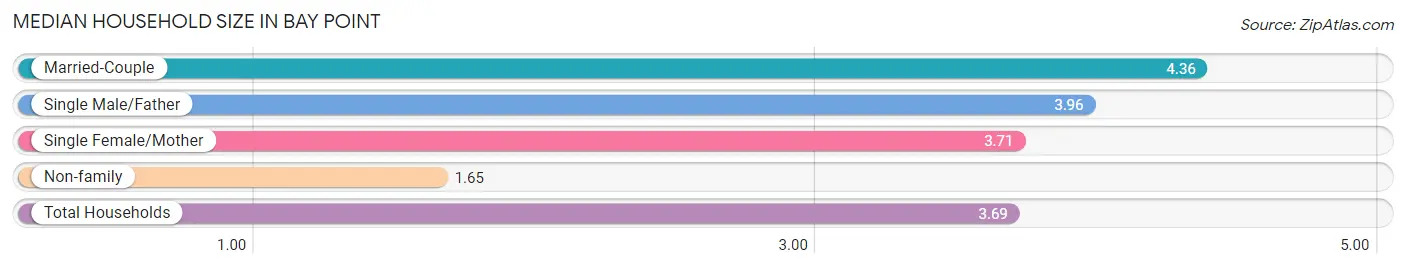
Median Household Size in Bay Point
The median household size in Bay Point is 3.69 persons per household, with married-couple households (3,281 | 49.7%) accounting for the largest median household size of 4.36 persons per household. non-family households (1,198 | 18.1%) represent the smallest median household size with 1.65 persons per household.
| Household Type | # Households | Household Size |
| Married-Couple | 3,281 (49.7%) | 4.36 |
| Single Male/Father | 848 (12.8%) | 3.96 |
| Single Female/Mother | 1,277 (19.3%) | 3.71 |
| Non-family | 1,198 (18.1%) | 1.65 |
| Total Households | 6,604 (100.0%) | 3.69 |
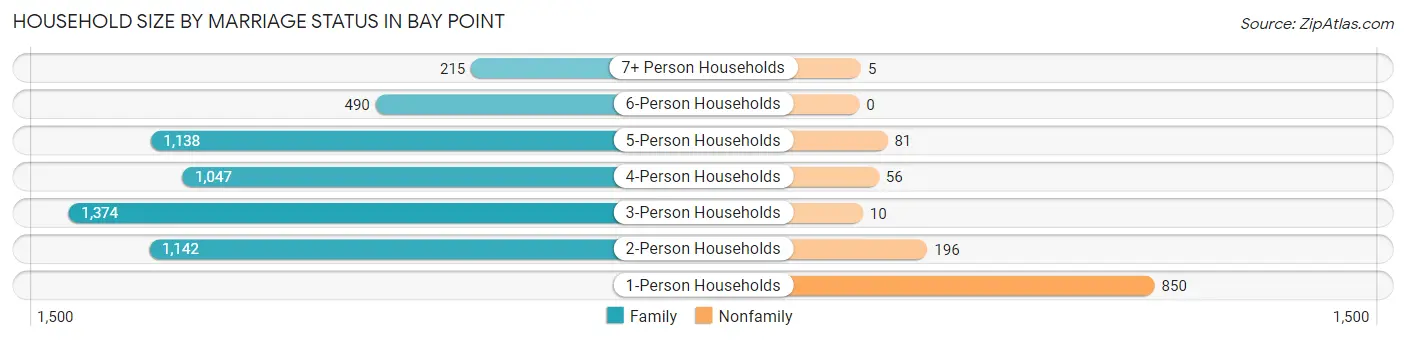
Household Size by Marriage Status in Bay Point
Out of a total of 6,604 households in Bay Point, 5,406 (81.9%) are family households, while 1,198 (18.1%) are nonfamily households. The most numerous type of family households are 3-person households, comprising 1,374, and the most common type of nonfamily households are 1-person households, comprising 850.
| Household Size | Family Households | Nonfamily Households |
| 1-Person Households | - | 850 (12.9%) |
| 2-Person Households | 1,142 (17.3%) | 196 (3.0%) |
| 3-Person Households | 1,374 (20.8%) | 10 (0.2%) |
| 4-Person Households | 1,047 (15.9%) | 56 (0.9%) |
| 5-Person Households | 1,138 (17.2%) | 81 (1.2%) |
| 6-Person Households | 490 (7.4%) | 0 (0.0%) |
| 7+ Person Households | 215 (3.3%) | 5 (0.1%) |
| Total | 5,406 (81.9%) | 1,198 (18.1%) |
Female Fertility in Bay Point
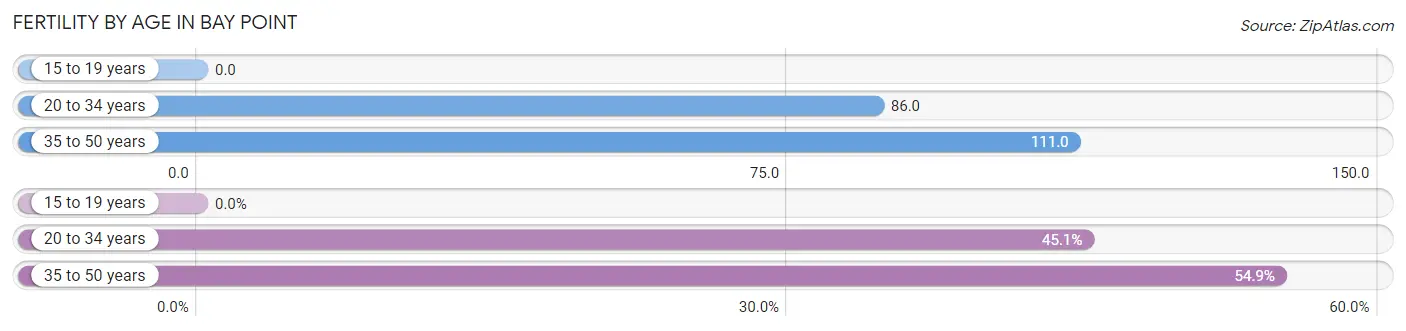
Fertility by Age in Bay Point
Average fertility rate in Bay Point is 90.0 births per 1,000 women. Women in the age bracket of 35 to 50 years have the highest fertility rate with 111.0 births per 1,000 women. Women in the age bracket of 35 to 50 years acount for 54.9% of all women with births.
| Age Bracket | Women with Births | Births / 1,000 Women |
| 15 to 19 years | 0 (0.0%) | 0.0 |
| 20 to 34 years | 244 (45.1%) | 86.0 |
| 35 to 50 years | 297 (54.9%) | 111.0 |
| Total | 541 (100.0%) | 90.0 |
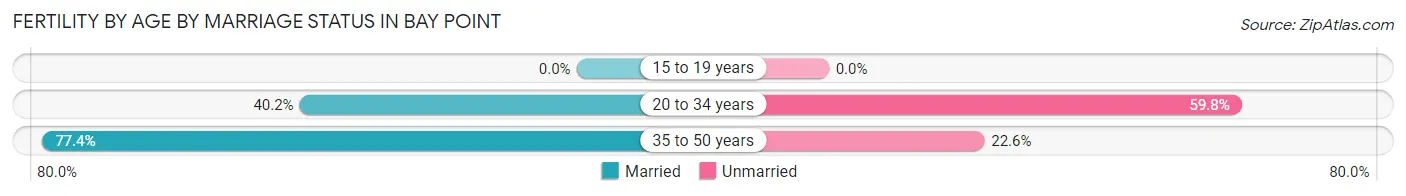
Fertility by Age by Marriage Status in Bay Point
60.6% of women with births (541) in Bay Point are married. The highest percentage of unmarried women with births falls into 20 to 34 years age bracket with 59.8% of them unmarried at the time of birth, while the lowest percentage of unmarried women with births belong to 35 to 50 years age bracket with 22.6% of them unmarried.
| Age Bracket | Married | Unmarried |
| 15 to 19 years | 0 (0.0%) | 0 (0.0%) |
| 20 to 34 years | 98 (40.2%) | 146 (59.8%) |
| 35 to 50 years | 230 (77.4%) | 67 (22.6%) |
| Total | 328 (60.6%) | 213 (39.4%) |
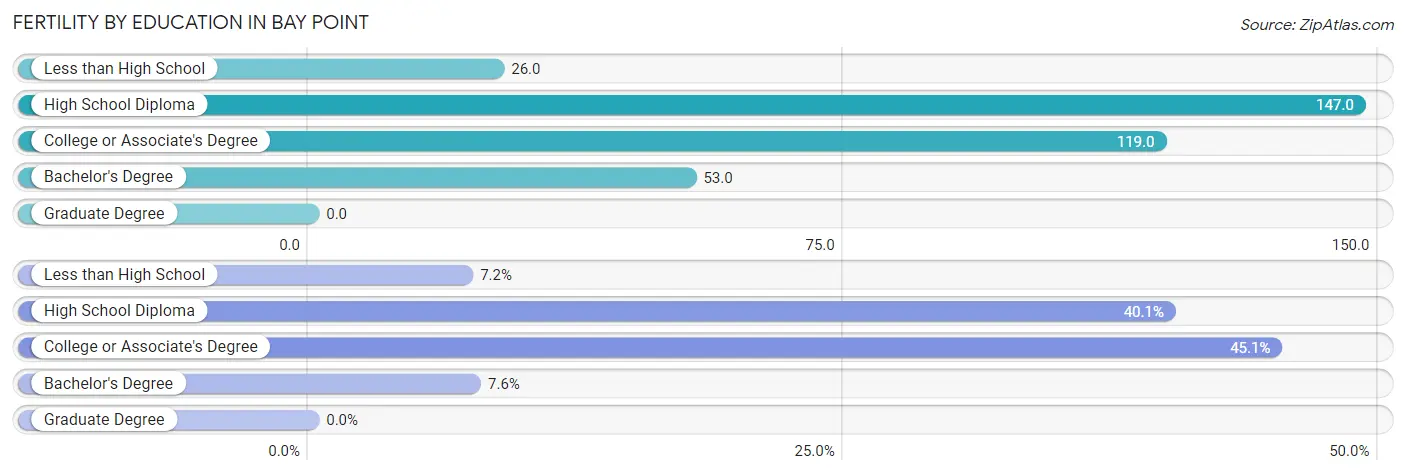
Fertility by Education in Bay Point
| Educational Attainment | Women with Births | Births / 1,000 Women |
| Less than High School | 39 (7.2%) | 26.0 |
| High School Diploma | 217 (40.1%) | 147.0 |
| College or Associate's Degree | 244 (45.1%) | 119.0 |
| Bachelor's Degree | 41 (7.6%) | 53.0 |
| Graduate Degree | 0 (0.0%) | 0.0 |
| Total | 541 (100.0%) | 90.0 |
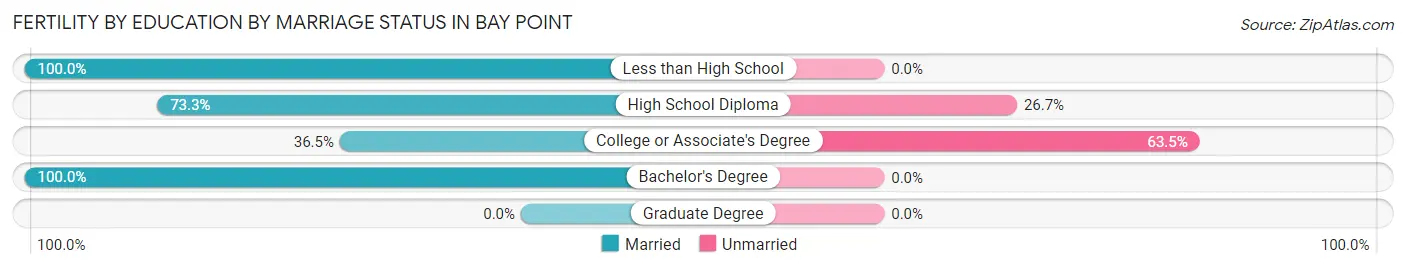
Fertility by Education by Marriage Status in Bay Point
39.4% of women with births in Bay Point are unmarried. Women with the educational attainment of less than high school are most likely to be married with 100.0% of them married at childbirth, while women with the educational attainment of college or associate's degree are least likely to be married with 63.5% of them unmarried at childbirth.
| Educational Attainment | Married | Unmarried |
| Less than High School | 39 (100.0%) | 0 (0.0%) |
| High School Diploma | 159 (73.3%) | 58 (26.7%) |
| College or Associate's Degree | 89 (36.5%) | 155 (63.5%) |
| Bachelor's Degree | 41 (100.0%) | 0 (0.0%) |
| Graduate Degree | 0 (0.0%) | 0 (0.0%) |
| Total | 328 (60.6%) | 213 (39.4%) |
Income in Bay Point
Income Overview in Bay Point
Per Capita Income in Bay Point is $28,414, while median incomes of families and households are $75,849 and $79,226 respectively.
| Characteristic | Number | Measure |
| Per Capita Income | 24,407 | $28,414 |
| Median Family Income | 5,406 | $75,849 |
| Mean Family Income | 5,406 | $93,123 |
| Median Household Income | 6,604 | $79,226 |
| Mean Household Income | 6,604 | $100,231 |
| Income Deficit | 5,406 | $0 |
| Wage / Income Gap (%) | 24,407 | 32.25% |
| Wage / Income Gap ($) | 24,407 | 67.75¢ per $1 |
| Gini / Inequality Index | 24,407 | 0.41 |
Earnings by Sex in Bay Point
Average Earnings in Bay Point are $34,374, $41,346 for men and $28,012 for women, a difference of 32.3%.
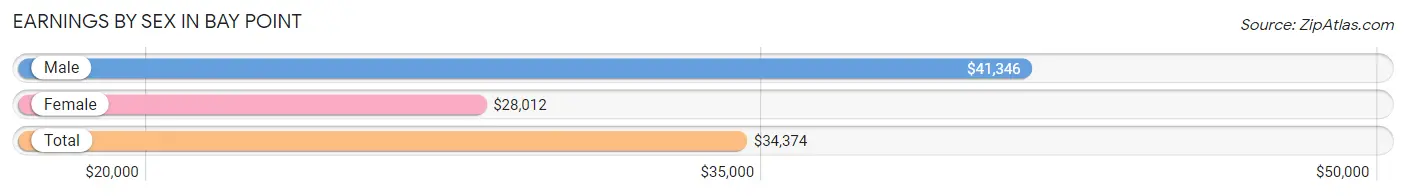
| Sex | Number | Average Earnings |
| Male | 7,481 (57.7%) | $41,346 |
| Female | 5,492 (42.3%) | $28,012 |
| Total | 12,973 (100.0%) | $34,374 |
Earnings by Sex by Income Bracket in Bay Point
The most common earnings brackets in Bay Point are $100,000+ for men (750 | 10.0%) and $30,000 to $34,999 for women (541 | 9.9%).
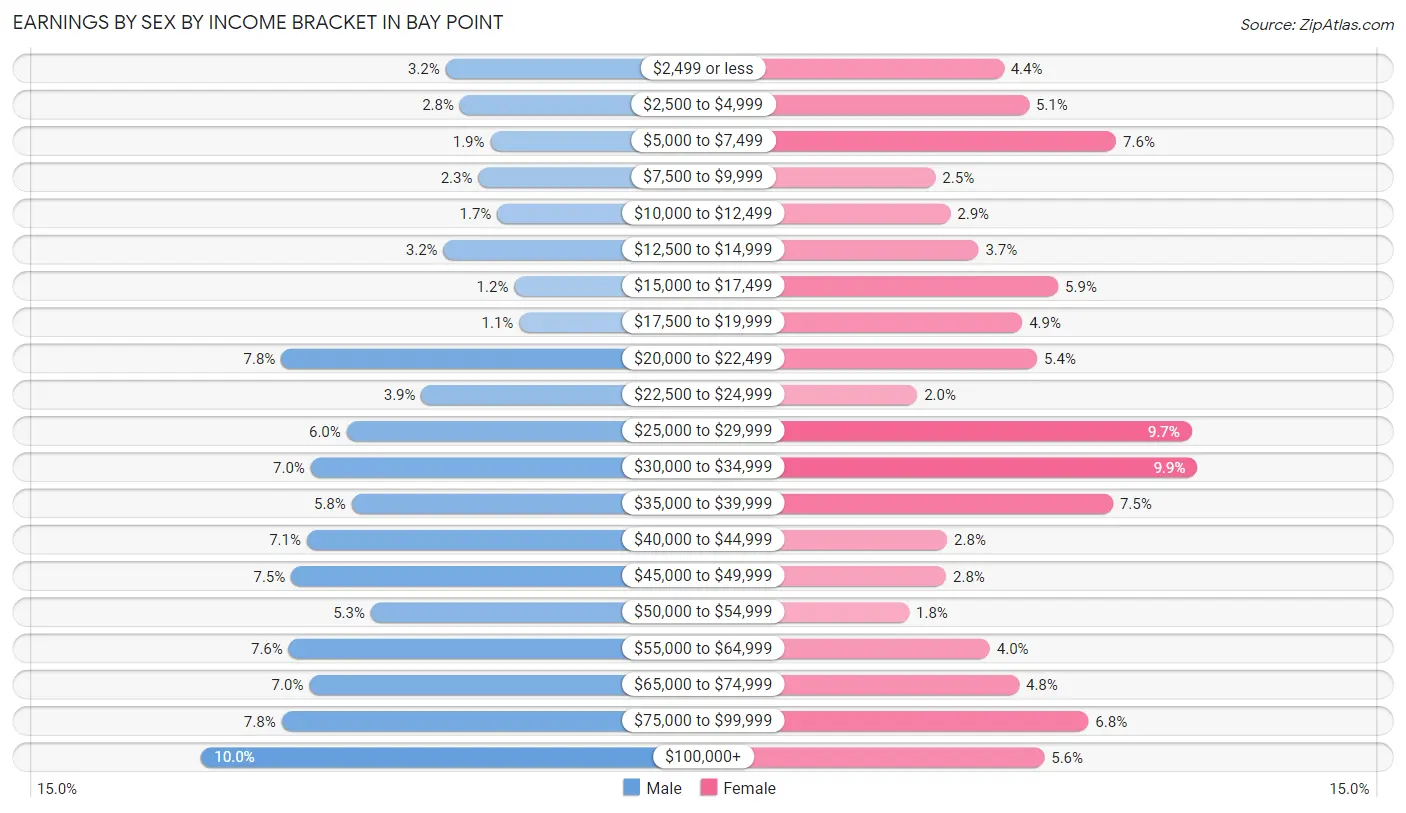
| Income | Male | Female |
| $2,499 or less | 237 (3.2%) | 242 (4.4%) |
| $2,500 to $4,999 | 207 (2.8%) | 281 (5.1%) |
| $5,000 to $7,499 | 143 (1.9%) | 416 (7.6%) |
| $7,500 to $9,999 | 168 (2.2%) | 137 (2.5%) |
| $10,000 to $12,499 | 129 (1.7%) | 160 (2.9%) |
| $12,500 to $14,999 | 242 (3.2%) | 203 (3.7%) |
| $15,000 to $17,499 | 93 (1.2%) | 326 (5.9%) |
| $17,500 to $19,999 | 82 (1.1%) | 271 (4.9%) |
| $20,000 to $22,499 | 583 (7.8%) | 294 (5.3%) |
| $22,500 to $24,999 | 288 (3.8%) | 109 (2.0%) |
| $25,000 to $29,999 | 445 (5.9%) | 532 (9.7%) |
| $30,000 to $34,999 | 521 (7.0%) | 541 (9.9%) |
| $35,000 to $39,999 | 435 (5.8%) | 411 (7.5%) |
| $40,000 to $44,999 | 529 (7.1%) | 155 (2.8%) |
| $45,000 to $49,999 | 562 (7.5%) | 153 (2.8%) |
| $50,000 to $54,999 | 394 (5.3%) | 96 (1.8%) |
| $55,000 to $64,999 | 567 (7.6%) | 221 (4.0%) |
| $65,000 to $74,999 | 524 (7.0%) | 266 (4.8%) |
| $75,000 to $99,999 | 582 (7.8%) | 373 (6.8%) |
| $100,000+ | 750 (10.0%) | 305 (5.6%) |
| Total | 7,481 (100.0%) | 5,492 (100.0%) |
Earnings by Sex by Educational Attainment in Bay Point
Average earnings in Bay Point are $46,233 for men and $30,716 for women, a difference of 33.6%. Men with an educational attainment of bachelor's degree enjoy the highest average annual earnings of $80,203, while those with less than high school education earn the least with $34,923. Women with an educational attainment of graduate degree earn the most with the average annual earnings of $79,406, while those with high school diploma education have the smallest earnings of $19,183.
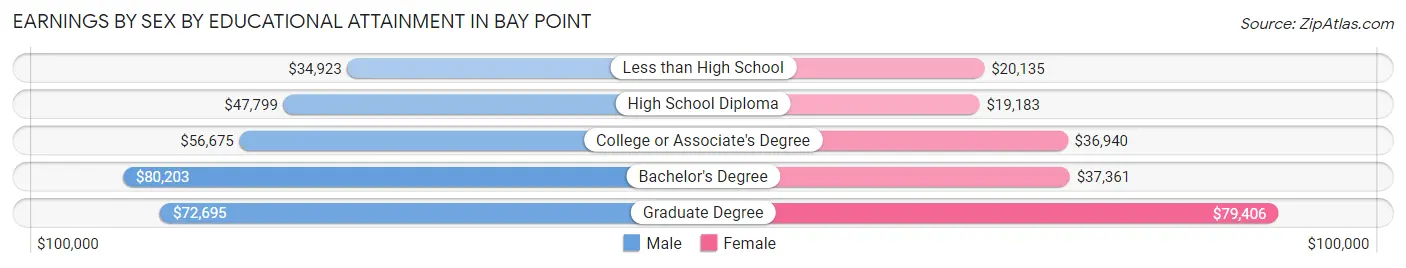
| Educational Attainment | Male Income | Female Income |
| Less than High School | $34,923 | $20,135 |
| High School Diploma | $47,799 | $19,183 |
| College or Associate's Degree | $56,675 | $36,940 |
| Bachelor's Degree | $80,203 | $37,361 |
| Graduate Degree | $72,695 | $79,406 |
| Total | $46,233 | $30,716 |
Family Income in Bay Point
Family Income Brackets in Bay Point
According to the Bay Point family income data, there are 1,016 families falling into the $50,000 to $74,999 income range, which is the most common income bracket and makes up 18.8% of all families. Conversely, the less than $10,000 income bracket is the least frequent group with only 124 families (2.3%) belonging to this category.
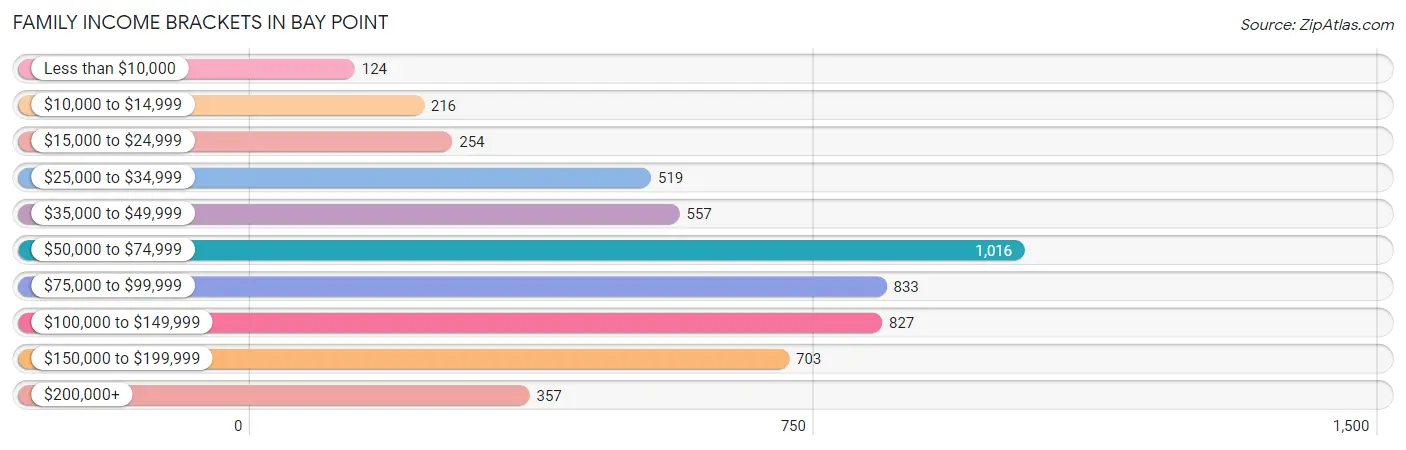
| Income Bracket | # Families | % Families |
| Less than $10,000 | 124 | 2.3% |
| $10,000 to $14,999 | 216 | 4.0% |
| $15,000 to $24,999 | 254 | 4.7% |
| $25,000 to $34,999 | 519 | 9.6% |
| $35,000 to $49,999 | 557 | 10.3% |
| $50,000 to $74,999 | 1,016 | 18.8% |
| $75,000 to $99,999 | 833 | 15.4% |
| $100,000 to $149,999 | 827 | 15.3% |
| $150,000 to $199,999 | 703 | 13.0% |
| $200,000+ | 357 | 6.6% |
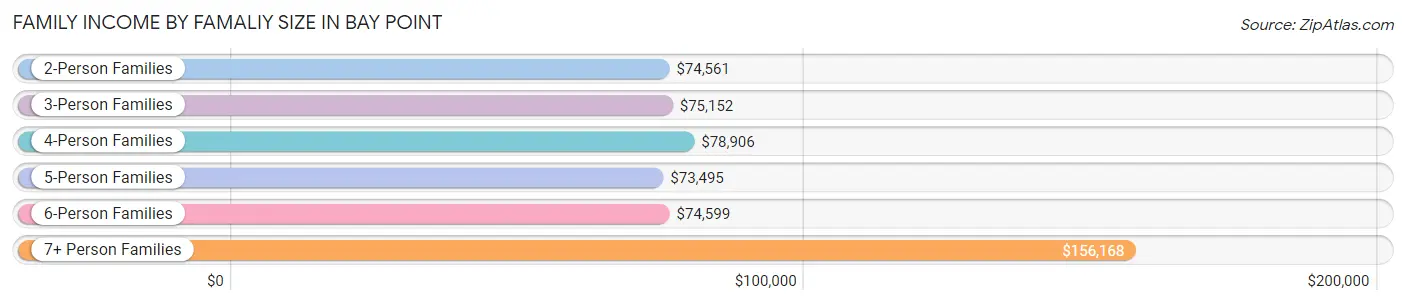
Family Income by Famaliy Size in Bay Point
7+ person families (141 | 2.6%) account for the highest median family income in Bay Point with $156,168 per family, while 2-person families (1,426 | 26.4%) have the highest median income of $37,280 per family member.
| Income Bracket | # Families | Median Income |
| 2-Person Families | 1,426 (26.4%) | $74,561 |
| 3-Person Families | 1,394 (25.8%) | $75,152 |
| 4-Person Families | 942 (17.4%) | $78,906 |
| 5-Person Families | 1,043 (19.3%) | $73,495 |
| 6-Person Families | 460 (8.5%) | $74,599 |
| 7+ Person Families | 141 (2.6%) | $156,168 |
| Total | 5,406 (100.0%) | $75,849 |
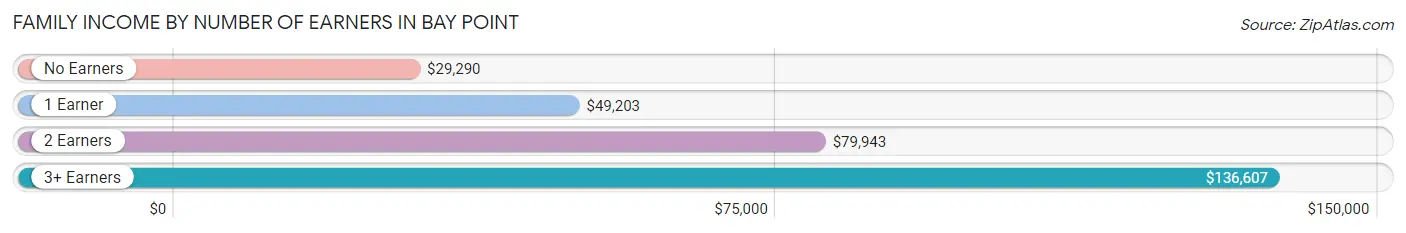
Family Income by Number of Earners in Bay Point
The median family income in Bay Point is $75,849, with families comprising 3+ earners (1,065) having the highest median family income of $136,607, while families with no earners (407) have the lowest median family income of $29,290, accounting for 19.7% and 7.5% of families, respectively.
| Number of Earners | # Families | Median Income |
| No Earners | 407 (7.5%) | $29,290 |
| 1 Earner | 1,729 (32.0%) | $49,203 |
| 2 Earners | 2,205 (40.8%) | $79,943 |
| 3+ Earners | 1,065 (19.7%) | $136,607 |
| Total | 5,406 (100.0%) | $75,849 |
Household Income in Bay Point
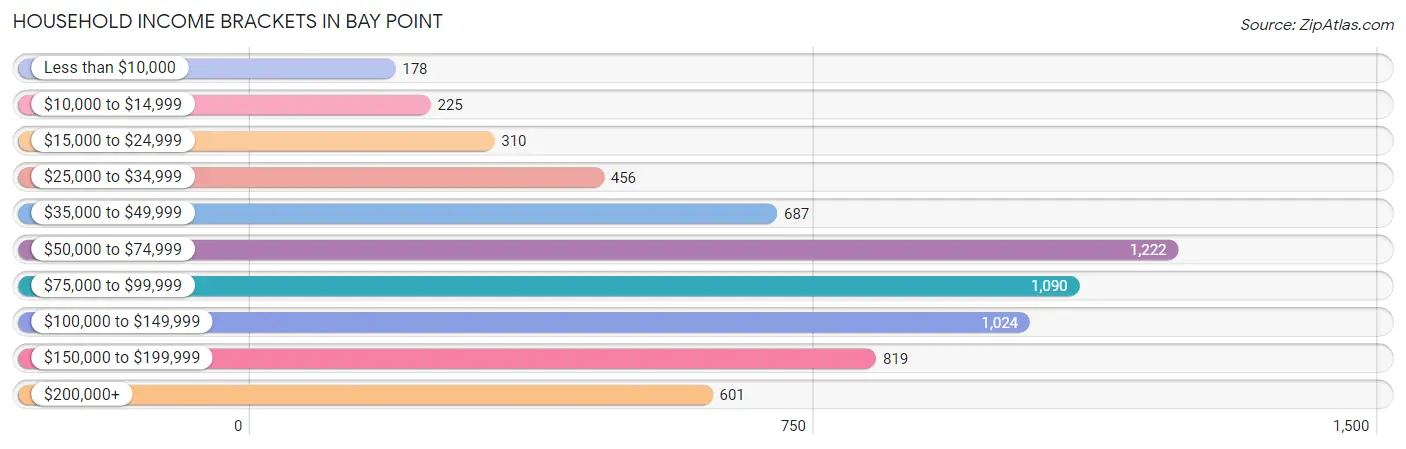
Household Income Brackets in Bay Point
With 1,222 households falling in the category, the $50,000 to $74,999 income range is the most frequent in Bay Point, accounting for 18.5% of all households. In contrast, only 178 households (2.7%) fall into the less than $10,000 income bracket, making it the least populous group.
| Income Bracket | # Households | % Households |
| Less than $10,000 | 178 | 2.7% |
| $10,000 to $14,999 | 225 | 3.4% |
| $15,000 to $24,999 | 310 | 4.7% |
| $25,000 to $34,999 | 456 | 6.9% |
| $35,000 to $49,999 | 687 | 10.4% |
| $50,000 to $74,999 | 1,222 | 18.5% |
| $75,000 to $99,999 | 1,090 | 16.5% |
| $100,000 to $149,999 | 1,024 | 15.5% |
| $150,000 to $199,999 | 819 | 12.4% |
| $200,000+ | 601 | 9.1% |
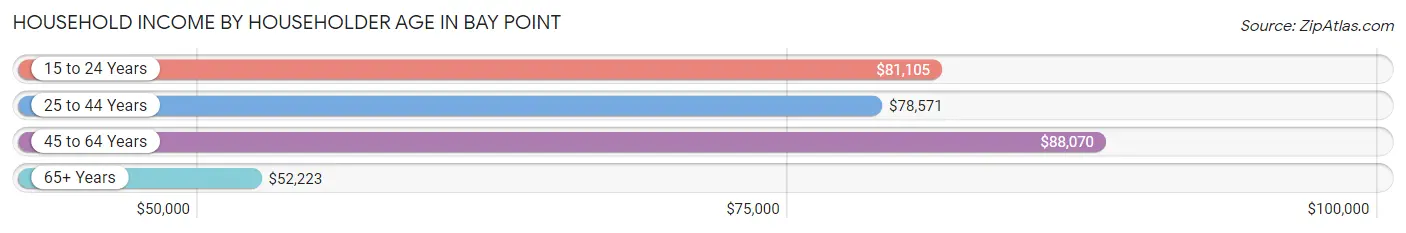
Household Income by Householder Age in Bay Point
The median household income in Bay Point is $79,226, with the highest median household income of $88,070 found in the 45 to 64 years age bracket for the primary householder. A total of 2,545 households (38.5%) fall into this category. Meanwhile, the 65+ years age bracket for the primary householder has the lowest median household income of $52,223, with 1,277 households (19.3%) in this group.
| Income Bracket | # Households | Median Income |
| 15 to 24 Years | 224 (3.4%) | $81,105 |
| 25 to 44 Years | 2,558 (38.7%) | $78,571 |
| 45 to 64 Years | 2,545 (38.5%) | $88,070 |
| 65+ Years | 1,277 (19.3%) | $52,223 |
| Total | 6,604 (100.0%) | $79,226 |
Poverty in Bay Point
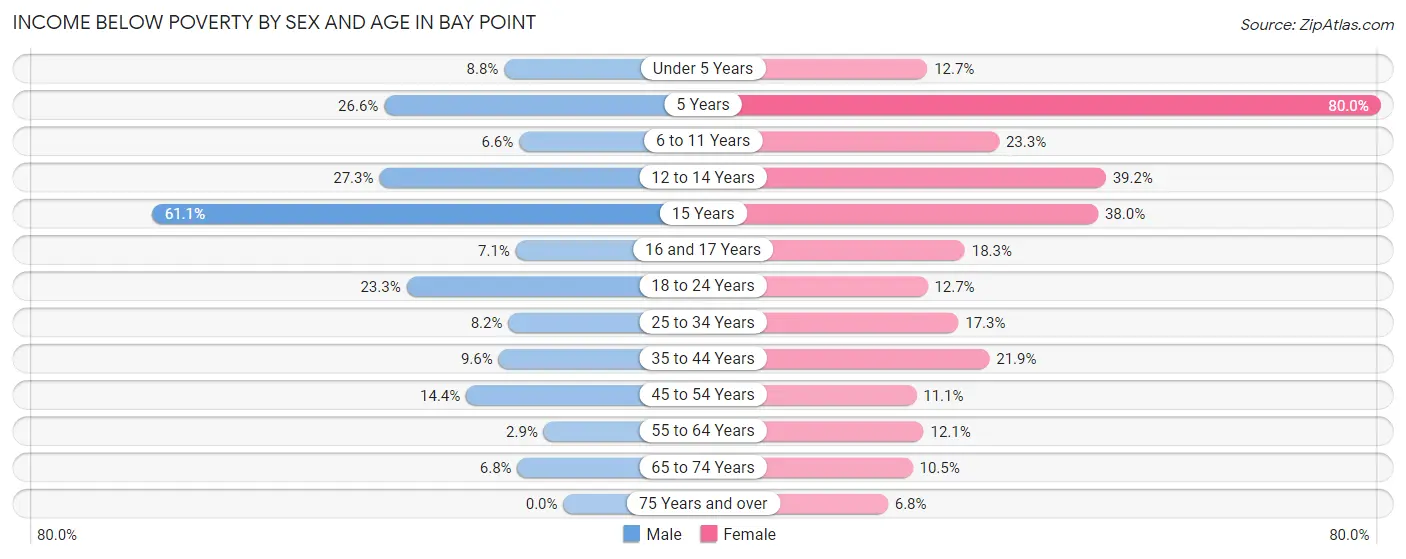
Income Below Poverty by Sex and Age in Bay Point
With 12.0% poverty level for males and 16.9% for females among the residents of Bay Point, 15 year old males and 5 year old females are the most vulnerable to poverty, with 77 males (61.1%) and 28 females (80.0%) in their respective age groups living below the poverty level.
| Age Bracket | Male | Female |
| Under 5 Years | 54 (8.8%) | 126 (12.7%) |
| 5 Years | 66 (26.6%) | 28 (80.0%) |
| 6 to 11 Years | 88 (6.6%) | 190 (23.3%) |
| 12 to 14 Years | 202 (27.3%) | 212 (39.2%) |
| 15 Years | 77 (61.1%) | 70 (38.0%) |
| 16 and 17 Years | 24 (7.1%) | 21 (18.3%) |
| 18 to 24 Years | 372 (23.3%) | 192 (12.7%) |
| 25 to 34 Years | 164 (8.2%) | 263 (17.3%) |
| 35 to 44 Years | 194 (9.6%) | 410 (21.9%) |
| 45 to 54 Years | 238 (14.4%) | 154 (11.1%) |
| 55 to 64 Years | 38 (2.9%) | 127 (12.1%) |
| 65 to 74 Years | 46 (6.8%) | 86 (10.5%) |
| 75 Years and over | 0 (0.0%) | 33 (6.8%) |
| Total | 1,563 (12.0%) | 1,912 (16.9%) |
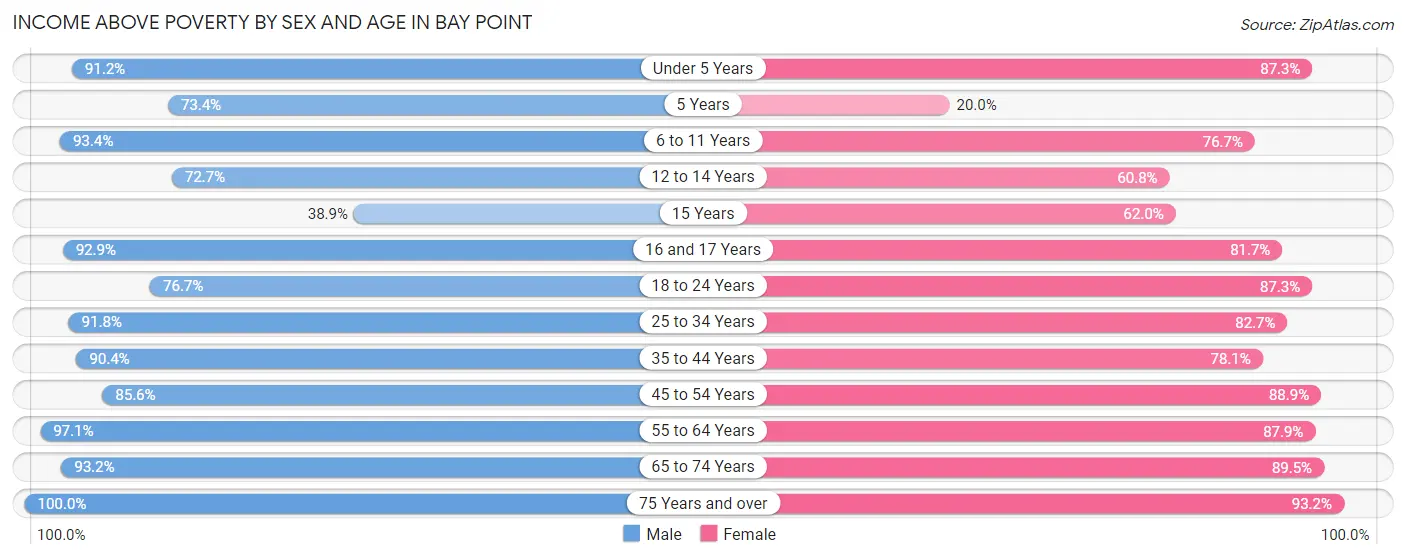
Income Above Poverty by Sex and Age in Bay Point
According to the poverty statistics in Bay Point, males aged 75 years and over and females aged 75 years and over are the age groups that are most secure financially, with 100.0% of males and 93.2% of females in these age groups living above the poverty line.
| Age Bracket | Male | Female |
| Under 5 Years | 560 (91.2%) | 868 (87.3%) |
| 5 Years | 182 (73.4%) | 7 (20.0%) |
| 6 to 11 Years | 1,251 (93.4%) | 624 (76.7%) |
| 12 to 14 Years | 537 (72.7%) | 329 (60.8%) |
| 15 Years | 49 (38.9%) | 114 (62.0%) |
| 16 and 17 Years | 315 (92.9%) | 94 (81.7%) |
| 18 to 24 Years | 1,225 (76.7%) | 1,317 (87.3%) |
| 25 to 34 Years | 1,841 (91.8%) | 1,257 (82.7%) |
| 35 to 44 Years | 1,822 (90.4%) | 1,462 (78.1%) |
| 45 to 54 Years | 1,410 (85.6%) | 1,238 (88.9%) |
| 55 to 64 Years | 1,268 (97.1%) | 919 (87.9%) |
| 65 to 74 Years | 628 (93.2%) | 732 (89.5%) |
| 75 Years and over | 331 (100.0%) | 450 (93.2%) |
| Total | 11,419 (88.0%) | 9,411 (83.1%) |
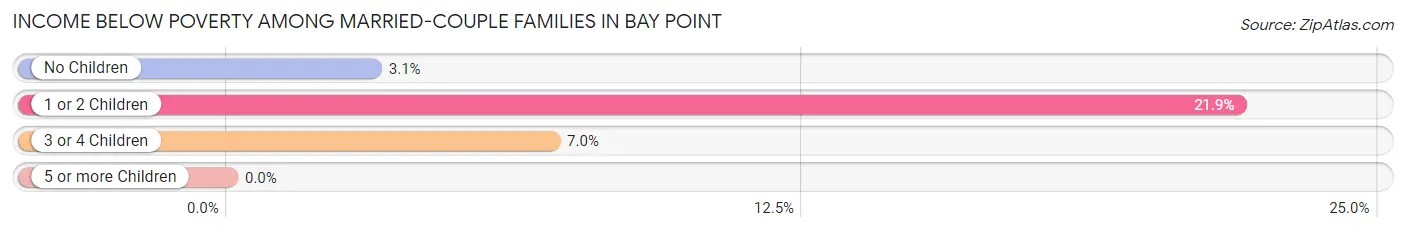
Income Below Poverty Among Married-Couple Families in Bay Point
The poverty statistics for married-couple families in Bay Point show that 11.3% or 370 of the total 3,281 families live below the poverty line. Families with 1 or 2 children have the highest poverty rate of 21.9%, comprising of 287 families. On the other hand, families with 5 or more children have the lowest poverty rate of 0.0%, which includes 0 families.
| Children | Above Poverty | Below Poverty |
| No Children | 1,363 (96.9%) | 44 (3.1%) |
| 1 or 2 Children | 1,021 (78.1%) | 287 (21.9%) |
| 3 or 4 Children | 517 (93.0%) | 39 (7.0%) |
| 5 or more Children | 10 (100.0%) | 0 (0.0%) |
| Total | 2,911 (88.7%) | 370 (11.3%) |
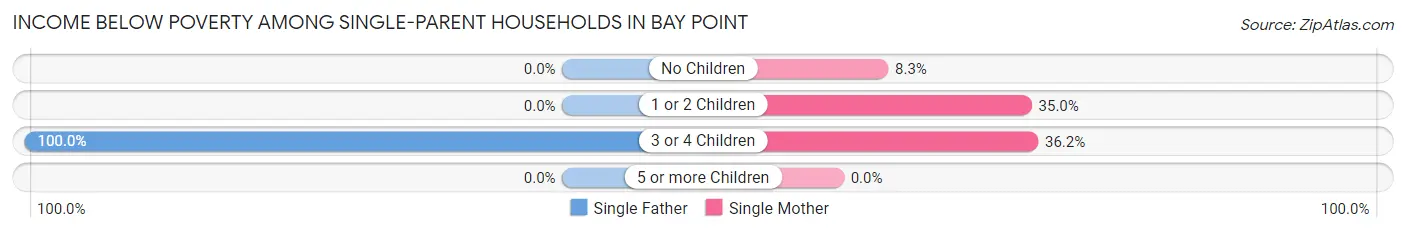
Income Below Poverty Among Single-Parent Households in Bay Point
According to the poverty data in Bay Point, 3.9% or 33 single-father households and 23.7% or 303 single-mother households are living below the poverty line. Among single-father households, those with 3 or 4 children have the highest poverty rate, with 33 households (100.0%) experiencing poverty. Likewise, among single-mother households, those with 3 or 4 children have the highest poverty rate, with 42 households (36.2%) falling below the poverty line.
| Children | Single Father | Single Mother |
| No Children | 0 (0.0%) | 45 (8.3%) |
| 1 or 2 Children | 0 (0.0%) | 216 (35.0%) |
| 3 or 4 Children | 33 (100.0%) | 42 (36.2%) |
| 5 or more Children | 0 (0.0%) | 0 (0.0%) |
| Total | 33 (3.9%) | 303 (23.7%) |
Income Below Poverty Among Married-Couple vs Single-Parent Households in Bay Point
The poverty data for Bay Point shows that 370 of the married-couple family households (11.3%) and 336 of the single-parent households (15.8%) are living below the poverty level. Within the married-couple family households, those with 1 or 2 children have the highest poverty rate, with 287 households (21.9%) falling below the poverty line. Among the single-parent households, those with 3 or 4 children have the highest poverty rate, with 75 household (50.3%) living below poverty.
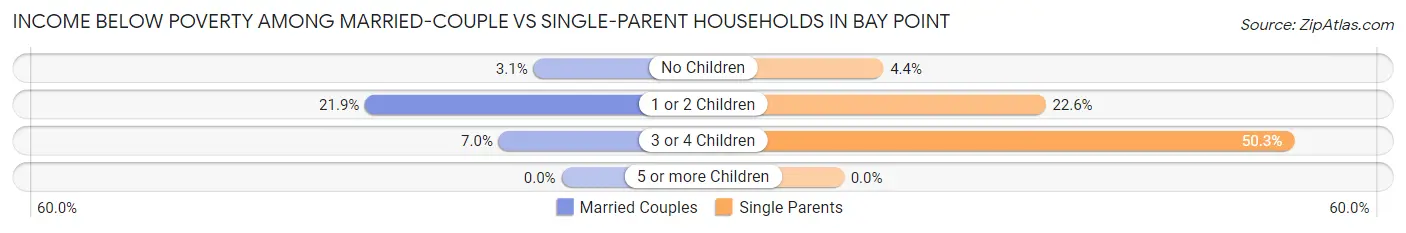
| Children | Married-Couple Families | Single-Parent Households |
| No Children | 44 (3.1%) | 45 (4.4%) |
| 1 or 2 Children | 287 (21.9%) | 216 (22.6%) |
| 3 or 4 Children | 39 (7.0%) | 75 (50.3%) |
| 5 or more Children | 0 (0.0%) | 0 (0.0%) |
| Total | 370 (11.3%) | 336 (15.8%) |
Employment Characteristics in Bay Point
Employment by Class of Employer in Bay Point
Among the 11,109 employed individuals in Bay Point, private company employees (7,559 | 68.0%), self-employed (not incorporated) (1,267 | 11.4%), and not-for-profit organizations (1,031 | 9.3%) make up the most common classes of employment.
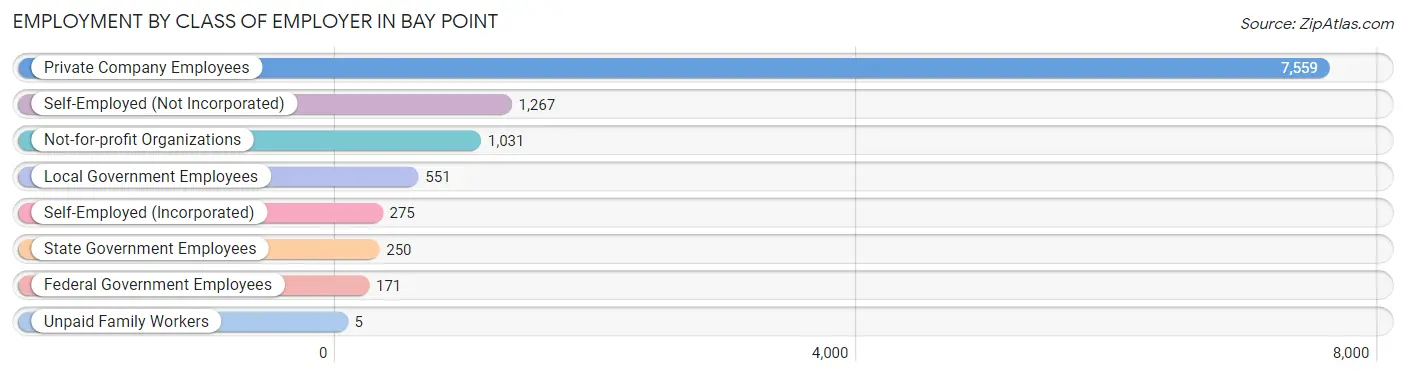
| Employer Class | # Employees | % Employees |
| Private Company Employees | 7,559 | 68.0% |
| Self-Employed (Incorporated) | 275 | 2.5% |
| Self-Employed (Not Incorporated) | 1,267 | 11.4% |
| Not-for-profit Organizations | 1,031 | 9.3% |
| Local Government Employees | 551 | 5.0% |
| State Government Employees | 250 | 2.2% |
| Federal Government Employees | 171 | 1.5% |
| Unpaid Family Workers | 5 | 0.1% |
| Total | 11,109 | 100.0% |
Employment Status by Age in Bay Point
According to the labor force statistics for Bay Point, out of the total population over 16 years of age (18,674), 68.6% or 12,810 individuals are in the labor force, with 9.9% or 1,268 of them unemployed. The age group with the highest labor force participation rate is 25 to 29 years, with 84.1% or 1,716 individuals in the labor force. Within the labor force, the 20 to 24 years age range has the highest percentage of unemployed individuals, with 14.7% or 287 of them being unemployed.
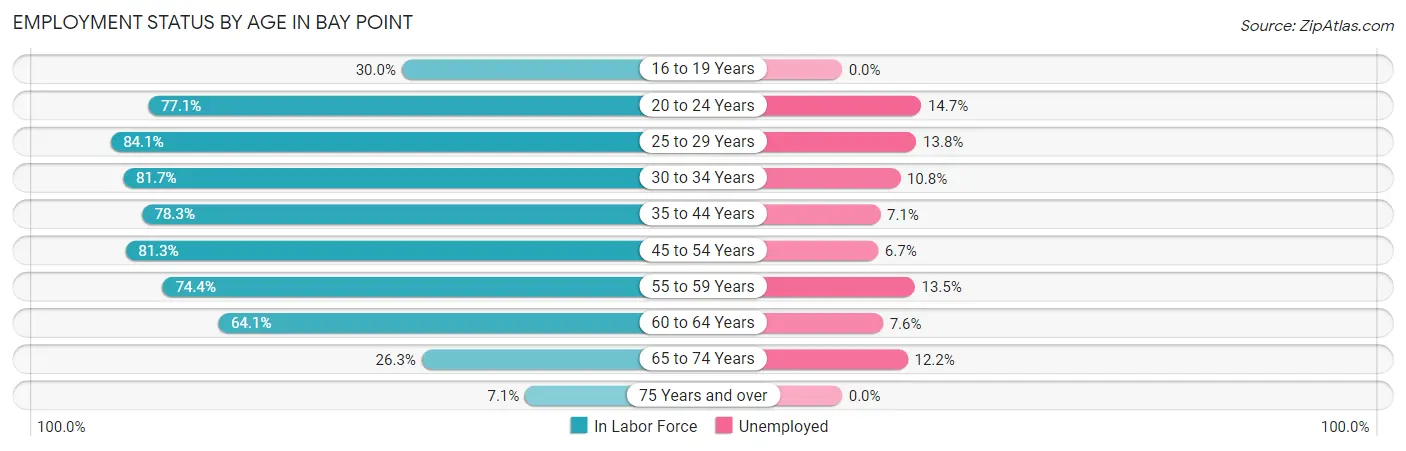
| Age Bracket | In Labor Force | Unemployed |
| 16 to 19 Years | 309 (30.0%) | 0 (0.0%) |
| 20 to 24 Years | 1,953 (77.1%) | 287 (14.7%) |
| 25 to 29 Years | 1,716 (84.1%) | 237 (13.8%) |
| 30 to 34 Years | 1,212 (81.7%) | 131 (10.8%) |
| 35 to 44 Years | 3,044 (78.3%) | 216 (7.1%) |
| 45 to 54 Years | 2,472 (81.3%) | 166 (6.7%) |
| 55 to 59 Years | 1,036 (74.4%) | 140 (13.5%) |
| 60 to 64 Years | 615 (64.1%) | 47 (7.6%) |
| 65 to 74 Years | 392 (26.3%) | 48 (12.2%) |
| 75 Years and over | 58 (7.1%) | 0 (0.0%) |
| Total | 12,810 (68.6%) | 1,268 (9.9%) |
Employment Status by Educational Attainment in Bay Point
According to labor force statistics for Bay Point, 78.9% of individuals (10,103) out of the total population between 25 and 64 years of age (12,805) are in the labor force, with 9.3% or 940 of them being unemployed. The group with the highest labor force participation rate are those with the educational attainment of college / associate degree, with 83.3% or 2,701 individuals in the labor force. Within the labor force, individuals with high school diploma education have the highest percentage of unemployment, with 13.6% or 438 of them being unemployed.
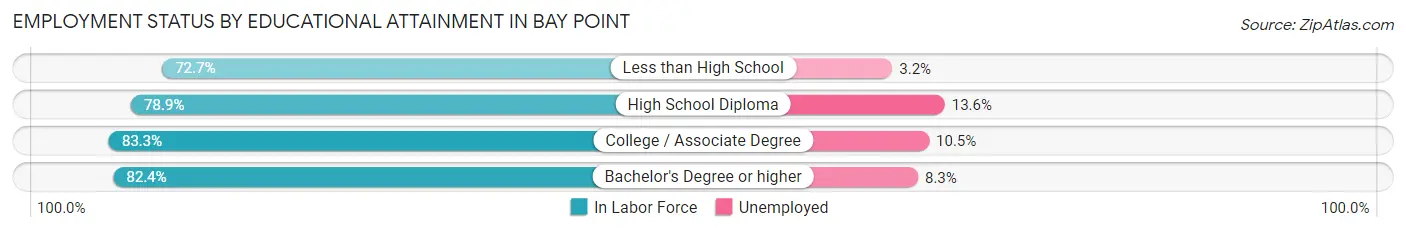
| Educational Attainment | In Labor Force | Unemployed |
| Less than High School | 2,558 (72.7%) | 113 (3.2%) |
| High School Diploma | 3,218 (78.9%) | 555 (13.6%) |
| College / Associate Degree | 2,701 (83.3%) | 341 (10.5%) |
| Bachelor's Degree or higher | 1,619 (82.4%) | 163 (8.3%) |
| Total | 10,103 (78.9%) | 1,191 (9.3%) |
Employment Occupations by Sex in Bay Point
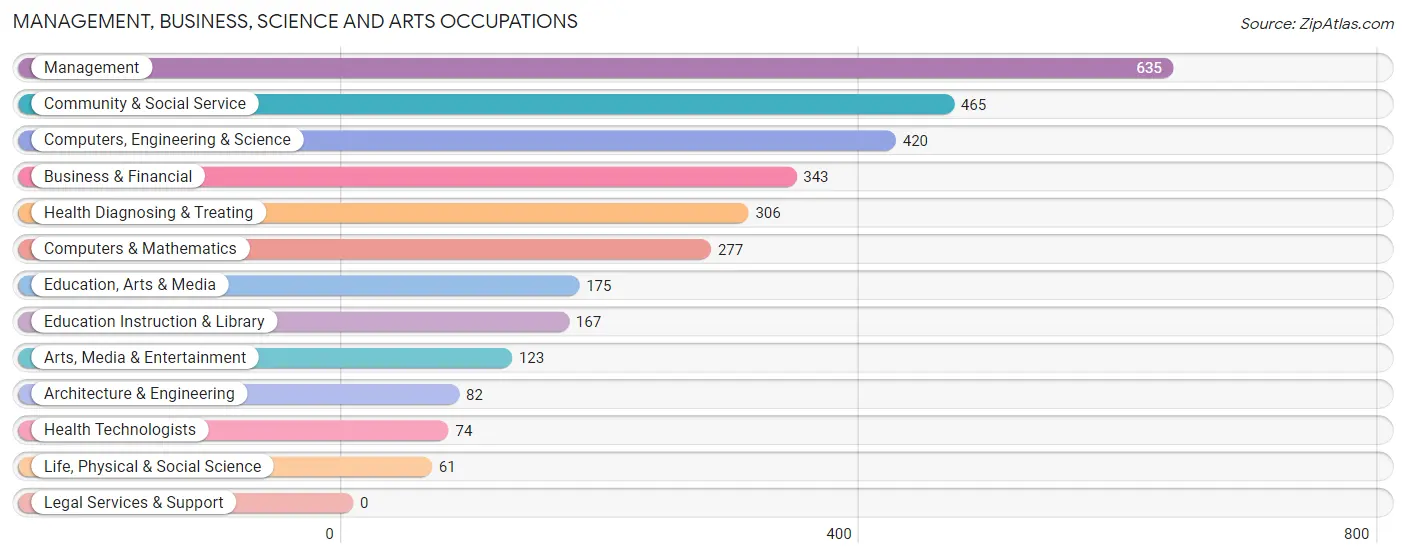
Management, Business, Science and Arts Occupations
The most common Management, Business, Science and Arts occupations in Bay Point are Management (635 | 5.5%), Community & Social Service (465 | 4.0%), Computers, Engineering & Science (420 | 3.6%), Business & Financial (343 | 3.0%), and Health Diagnosing & Treating (306 | 2.6%).
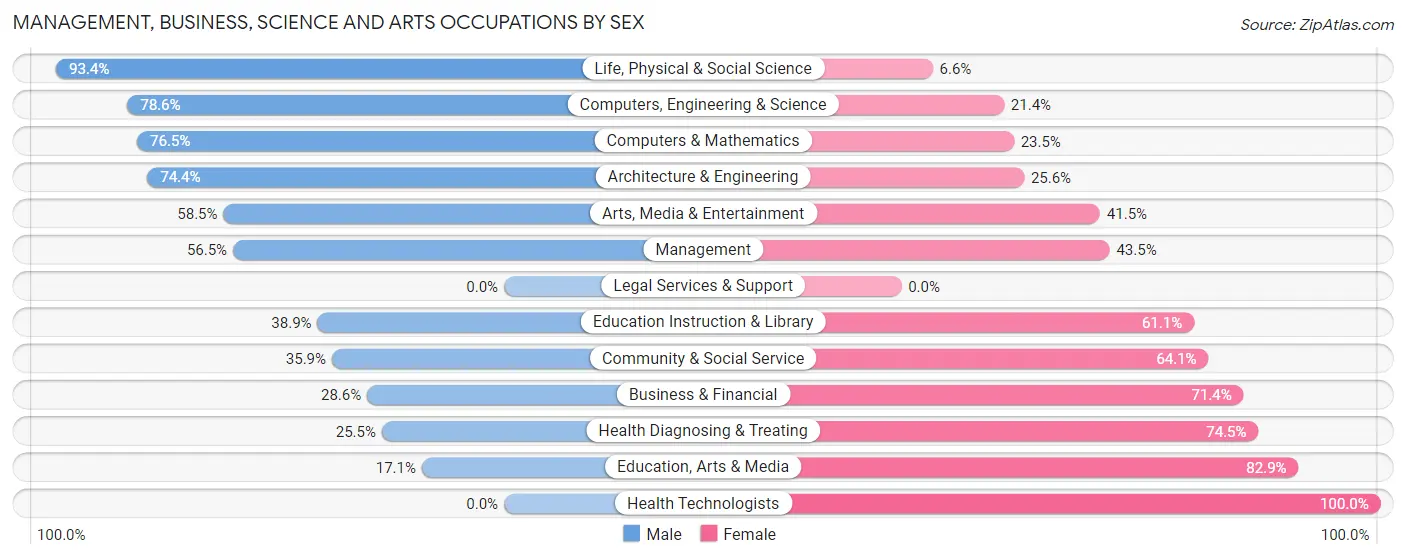
Management, Business, Science and Arts Occupations by Sex
Within the Management, Business, Science and Arts occupations in Bay Point, the most male-oriented occupations are Life, Physical & Social Science (93.4%), Computers, Engineering & Science (78.6%), and Computers & Mathematics (76.5%), while the most female-oriented occupations are Health Technologists (100.0%), Education, Arts & Media (82.9%), and Health Diagnosing & Treating (74.5%).
| Occupation | Male | Female |
| Management | 359 (56.5%) | 276 (43.5%) |
| Business & Financial | 98 (28.6%) | 245 (71.4%) |
| Computers, Engineering & Science | 330 (78.6%) | 90 (21.4%) |
| Computers & Mathematics | 212 (76.5%) | 65 (23.5%) |
| Architecture & Engineering | 61 (74.4%) | 21 (25.6%) |
| Life, Physical & Social Science | 57 (93.4%) | 4 (6.6%) |
| Community & Social Service | 167 (35.9%) | 298 (64.1%) |
| Education, Arts & Media | 30 (17.1%) | 145 (82.9%) |
| Legal Services & Support | 0 (0.0%) | 0 (0.0%) |
| Education Instruction & Library | 65 (38.9%) | 102 (61.1%) |
| Arts, Media & Entertainment | 72 (58.5%) | 51 (41.5%) |
| Health Diagnosing & Treating | 78 (25.5%) | 228 (74.5%) |
| Health Technologists | 0 (0.0%) | 74 (100.0%) |
| Total (Category) | 1,032 (47.6%) | 1,137 (52.4%) |
| Total (Overall) | 6,833 (59.2%) | 4,704 (40.8%) |
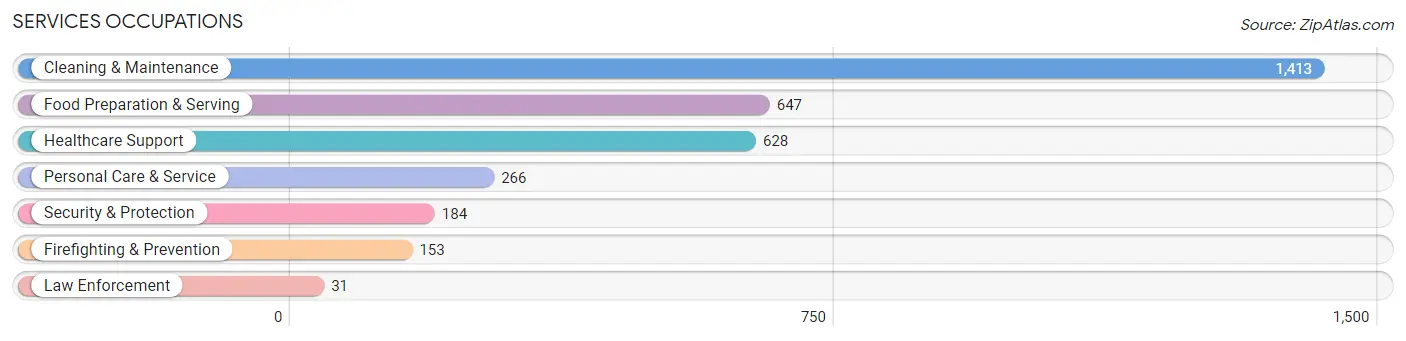
Services Occupations
The most common Services occupations in Bay Point are Cleaning & Maintenance (1,413 | 12.2%), Food Preparation & Serving (647 | 5.6%), Healthcare Support (628 | 5.4%), Personal Care & Service (266 | 2.3%), and Security & Protection (184 | 1.6%).
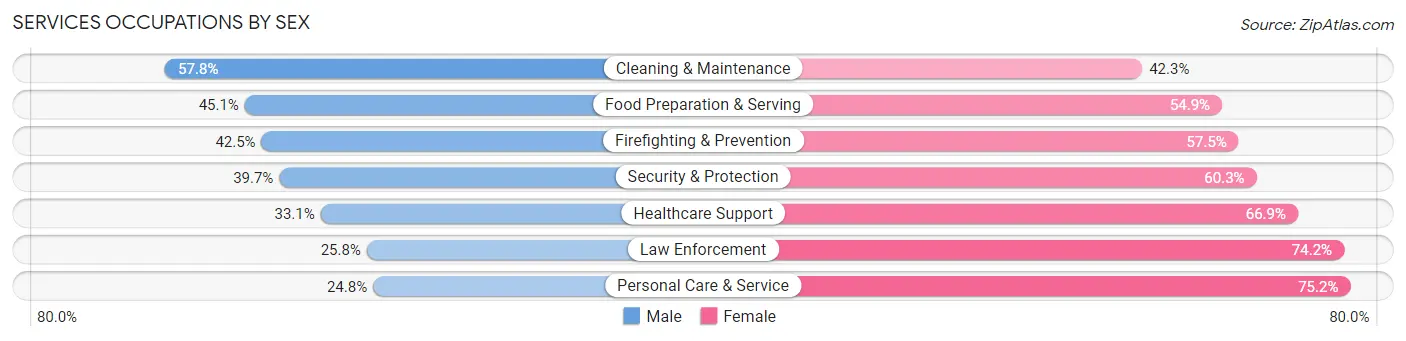
Services Occupations by Sex
Within the Services occupations in Bay Point, the most male-oriented occupations are Cleaning & Maintenance (57.8%), Food Preparation & Serving (45.1%), and Firefighting & Prevention (42.5%), while the most female-oriented occupations are Personal Care & Service (75.2%), Law Enforcement (74.2%), and Healthcare Support (66.9%).
| Occupation | Male | Female |
| Healthcare Support | 208 (33.1%) | 420 (66.9%) |
| Security & Protection | 73 (39.7%) | 111 (60.3%) |
| Firefighting & Prevention | 65 (42.5%) | 88 (57.5%) |
| Law Enforcement | 8 (25.8%) | 23 (74.2%) |
| Food Preparation & Serving | 292 (45.1%) | 355 (54.9%) |
| Cleaning & Maintenance | 816 (57.8%) | 597 (42.2%) |
| Personal Care & Service | 66 (24.8%) | 200 (75.2%) |
| Total (Category) | 1,455 (46.4%) | 1,683 (53.6%) |
| Total (Overall) | 6,833 (59.2%) | 4,704 (40.8%) |
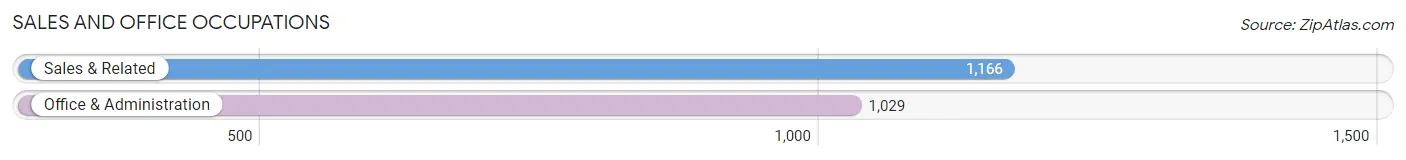
Sales and Office Occupations
The most common Sales and Office occupations in Bay Point are Sales & Related (1,166 | 10.1%), and Office & Administration (1,029 | 8.9%).
Sales and Office Occupations by Sex
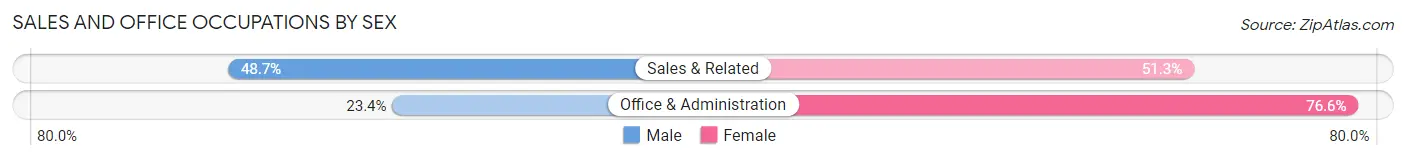
| Occupation | Male | Female |
| Sales & Related | 568 (48.7%) | 598 (51.3%) |
| Office & Administration | 241 (23.4%) | 788 (76.6%) |
| Total (Category) | 809 (36.9%) | 1,386 (63.1%) |
| Total (Overall) | 6,833 (59.2%) | 4,704 (40.8%) |
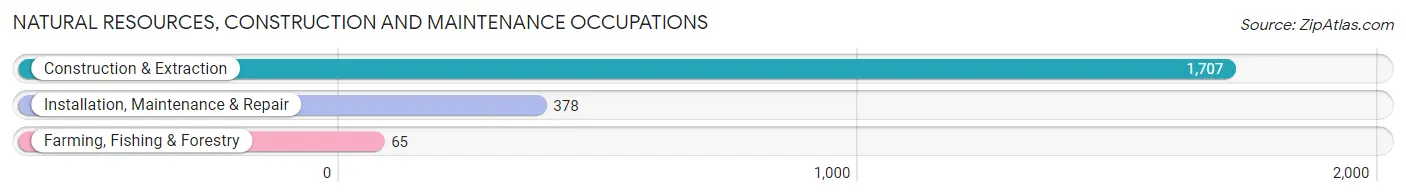
Natural Resources, Construction and Maintenance Occupations
The most common Natural Resources, Construction and Maintenance occupations in Bay Point are Construction & Extraction (1,707 | 14.8%), Installation, Maintenance & Repair (378 | 3.3%), and Farming, Fishing & Forestry (65 | 0.6%).
Natural Resources, Construction and Maintenance Occupations by Sex
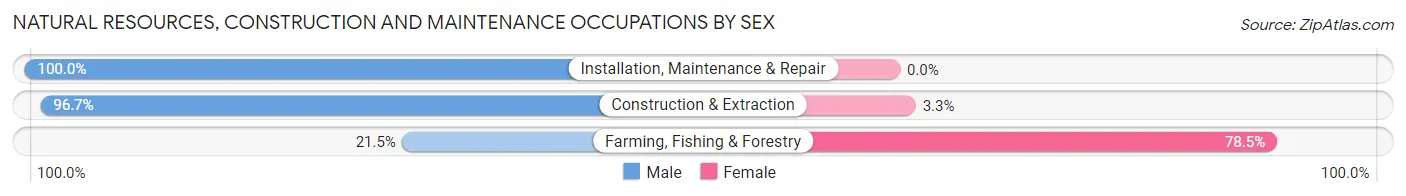
| Occupation | Male | Female |
| Farming, Fishing & Forestry | 14 (21.5%) | 51 (78.5%) |
| Construction & Extraction | 1,651 (96.7%) | 56 (3.3%) |
| Installation, Maintenance & Repair | 378 (100.0%) | 0 (0.0%) |
| Total (Category) | 2,043 (95.0%) | 107 (5.0%) |
| Total (Overall) | 6,833 (59.2%) | 4,704 (40.8%) |
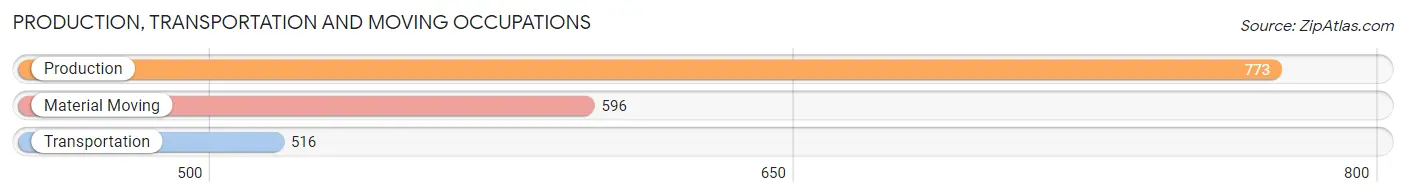
Production, Transportation and Moving Occupations
The most common Production, Transportation and Moving occupations in Bay Point are Production (773 | 6.7%), Material Moving (596 | 5.2%), and Transportation (516 | 4.5%).
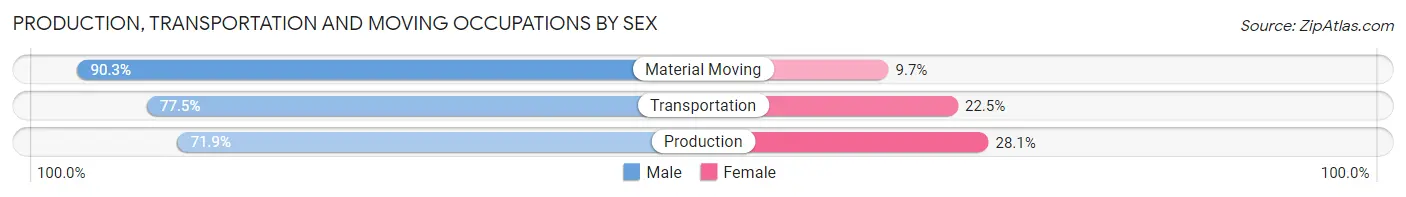
Production, Transportation and Moving Occupations by Sex
| Occupation | Male | Female |
| Production | 556 (71.9%) | 217 (28.1%) |
| Transportation | 400 (77.5%) | 116 (22.5%) |
| Material Moving | 538 (90.3%) | 58 (9.7%) |
| Total (Category) | 1,494 (79.3%) | 391 (20.7%) |
| Total (Overall) | 6,833 (59.2%) | 4,704 (40.8%) |
Employment Industries by Sex in Bay Point
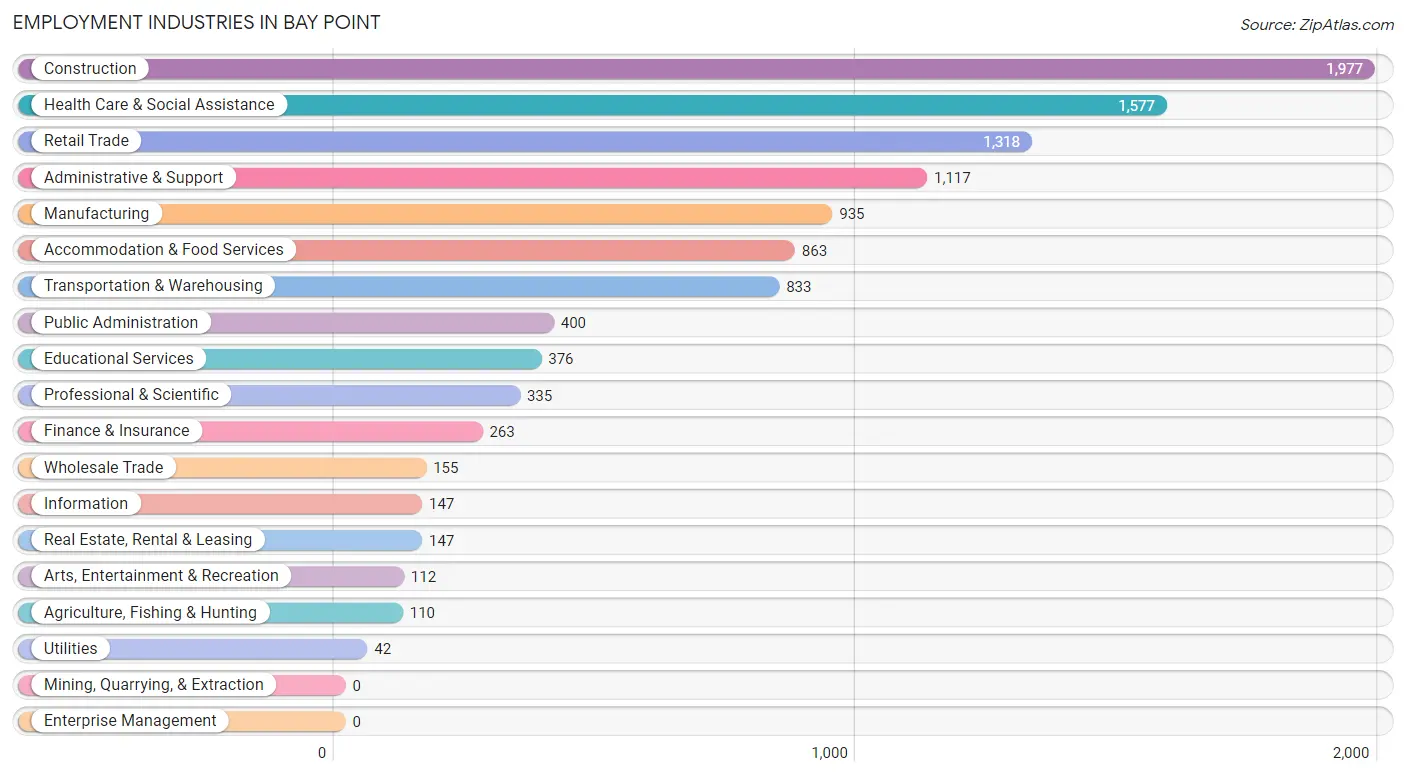
Employment Industries in Bay Point
The major employment industries in Bay Point include Construction (1,977 | 17.1%), Health Care & Social Assistance (1,577 | 13.7%), Retail Trade (1,318 | 11.4%), Administrative & Support (1,117 | 9.7%), and Manufacturing (935 | 8.1%).
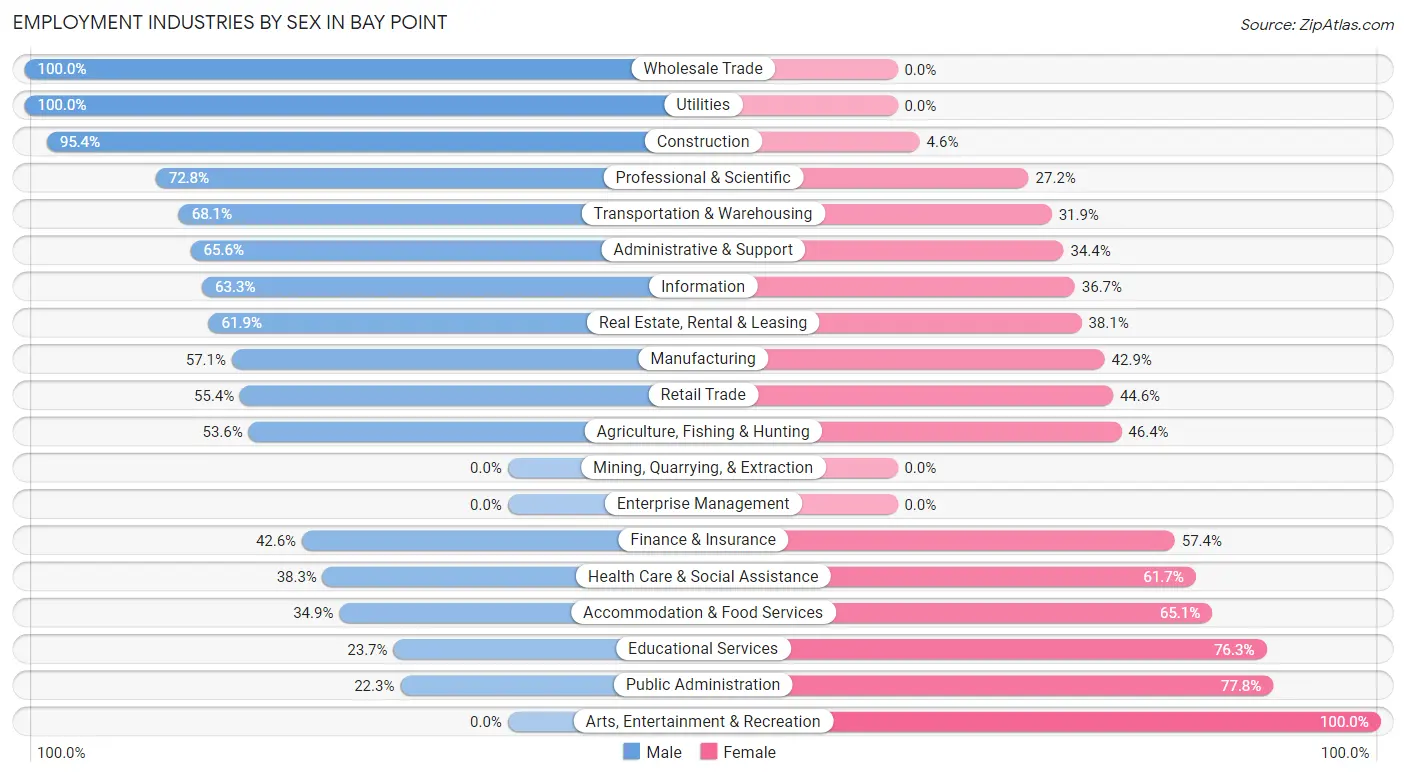
Employment Industries by Sex in Bay Point
The Bay Point industries that see more men than women are Wholesale Trade (100.0%), Utilities (100.0%), and Construction (95.4%), whereas the industries that tend to have a higher number of women are Arts, Entertainment & Recreation (100.0%), Public Administration (77.7%), and Educational Services (76.3%).
| Industry | Male | Female |
| Agriculture, Fishing & Hunting | 59 (53.6%) | 51 (46.4%) |
| Mining, Quarrying, & Extraction | 0 (0.0%) | 0 (0.0%) |
| Construction | 1,886 (95.4%) | 91 (4.6%) |
| Manufacturing | 534 (57.1%) | 401 (42.9%) |
| Wholesale Trade | 155 (100.0%) | 0 (0.0%) |
| Retail Trade | 730 (55.4%) | 588 (44.6%) |
| Transportation & Warehousing | 567 (68.1%) | 266 (31.9%) |
| Utilities | 42 (100.0%) | 0 (0.0%) |
| Information | 93 (63.3%) | 54 (36.7%) |
| Finance & Insurance | 112 (42.6%) | 151 (57.4%) |
| Real Estate, Rental & Leasing | 91 (61.9%) | 56 (38.1%) |
| Professional & Scientific | 244 (72.8%) | 91 (27.2%) |
| Enterprise Management | 0 (0.0%) | 0 (0.0%) |
| Administrative & Support | 733 (65.6%) | 384 (34.4%) |
| Educational Services | 89 (23.7%) | 287 (76.3%) |
| Health Care & Social Assistance | 604 (38.3%) | 973 (61.7%) |
| Arts, Entertainment & Recreation | 0 (0.0%) | 112 (100.0%) |
| Accommodation & Food Services | 301 (34.9%) | 562 (65.1%) |
| Public Administration | 89 (22.3%) | 311 (77.7%) |
| Total | 6,833 (59.2%) | 4,704 (40.8%) |
Education in Bay Point
School Enrollment in Bay Point
The most common levels of schooling among the 6,521 students in Bay Point are college / undergraduate (1,635 | 25.1%), elementary school (1,625 | 24.9%), and middle school (1,596 | 24.5%).
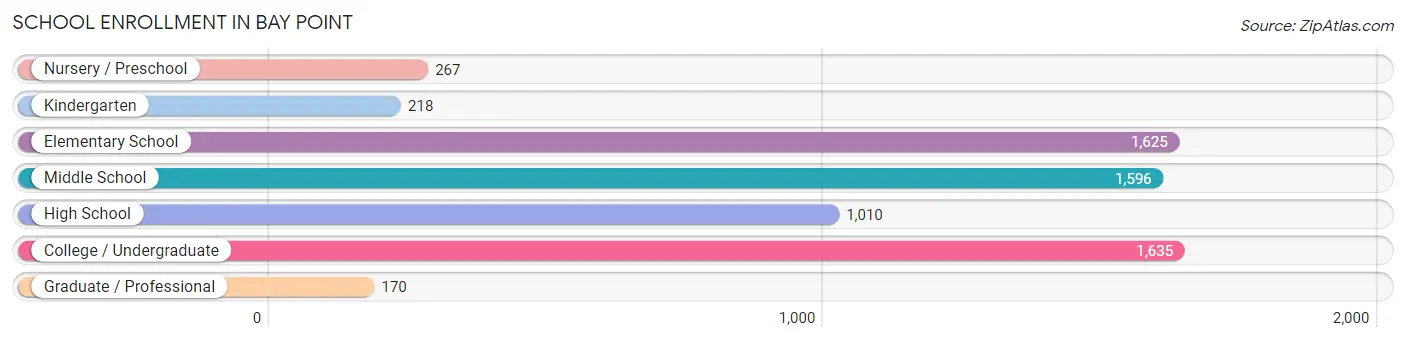
| School Level | # Students | % Students |
| Nursery / Preschool | 267 | 4.1% |
| Kindergarten | 218 | 3.3% |
| Elementary School | 1,625 | 24.9% |
| Middle School | 1,596 | 24.5% |
| High School | 1,010 | 15.5% |
| College / Undergraduate | 1,635 | 25.1% |
| Graduate / Professional | 170 | 2.6% |
| Total | 6,521 | 100.0% |
School Enrollment by Age by Funding Source in Bay Point
Out of a total of 6,521 students who are enrolled in schools in Bay Point, 861 (13.2%) attend a private institution, while the remaining 5,660 (86.8%) are enrolled in public schools. The age group of 3 to 4 year olds has the highest likelihood of being enrolled in private schools, with 120 (51.9% in the age bracket) enrolled. Conversely, the age group of 20 to 24 year olds has the lowest likelihood of being enrolled in a private school, with 865 (94.4% in the age bracket) attending a public institution.
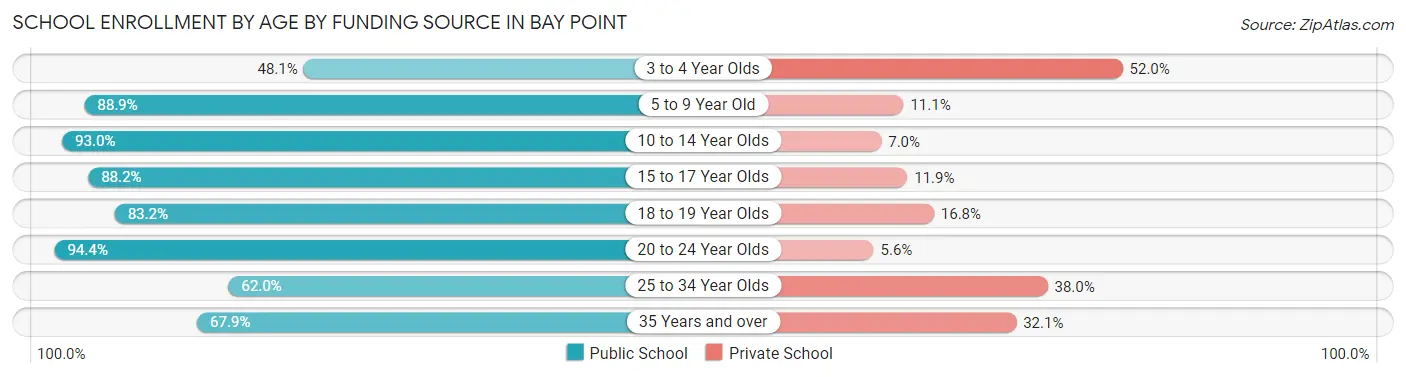
| Age Bracket | Public School | Private School |
| 3 to 4 Year Olds | 111 (48.0%) | 120 (51.9%) |
| 5 to 9 Year Old | 1,556 (88.9%) | 195 (11.1%) |
| 10 to 14 Year Olds | 1,766 (93.0%) | 133 (7.0%) |
| 15 to 17 Year Olds | 677 (88.1%) | 91 (11.8%) |
| 18 to 19 Year Olds | 322 (83.2%) | 65 (16.8%) |
| 20 to 24 Year Olds | 865 (94.4%) | 51 (5.6%) |
| 25 to 34 Year Olds | 214 (62.0%) | 131 (38.0%) |
| 35 Years and over | 152 (67.9%) | 72 (32.1%) |
| Total | 5,660 (86.8%) | 861 (13.2%) |
Educational Attainment by Field of Study in Bay Point
Business (476 | 18.9%), science & technology (312 | 12.4%), engineering (272 | 10.8%), arts & humanities (248 | 9.8%), and social sciences (228 | 9.0%) are the most common fields of study among 2,521 individuals in Bay Point who have obtained a bachelor's degree or higher.
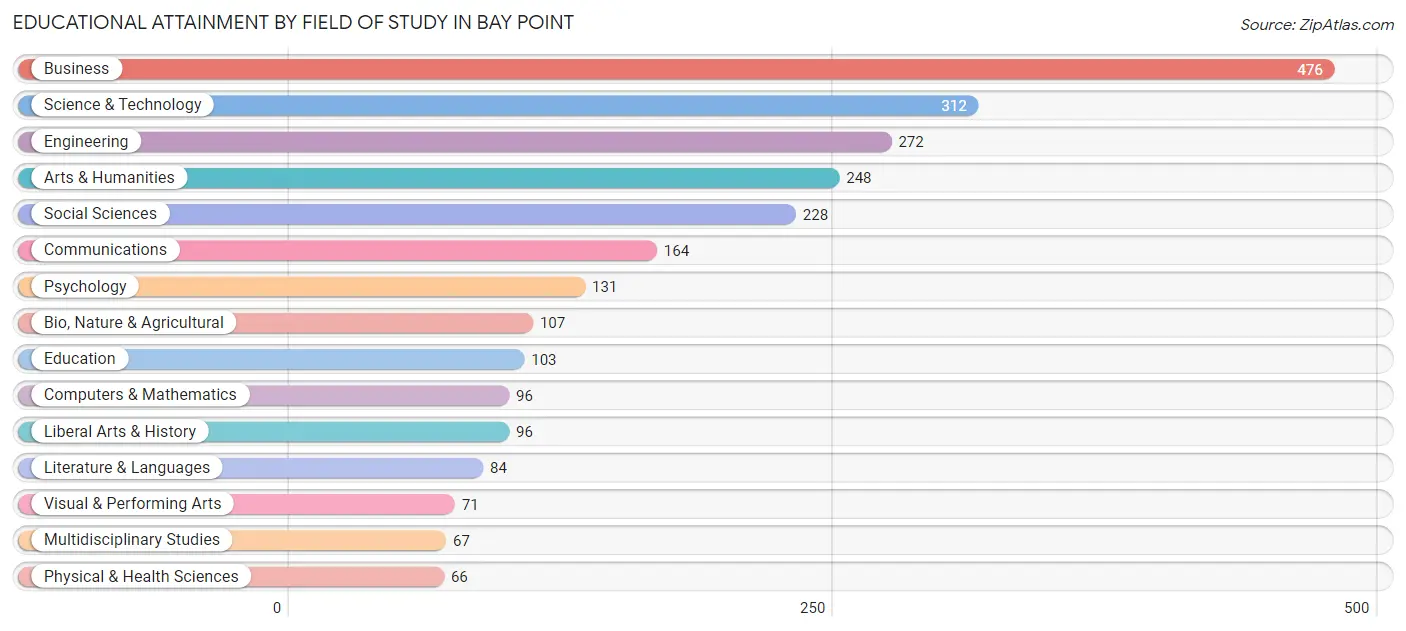
| Field of Study | # Graduates | % Graduates |
| Computers & Mathematics | 96 | 3.8% |
| Bio, Nature & Agricultural | 107 | 4.2% |
| Physical & Health Sciences | 66 | 2.6% |
| Psychology | 131 | 5.2% |
| Social Sciences | 228 | 9.0% |
| Engineering | 272 | 10.8% |
| Multidisciplinary Studies | 67 | 2.7% |
| Science & Technology | 312 | 12.4% |
| Business | 476 | 18.9% |
| Education | 103 | 4.1% |
| Literature & Languages | 84 | 3.3% |
| Liberal Arts & History | 96 | 3.8% |
| Visual & Performing Arts | 71 | 2.8% |
| Communications | 164 | 6.5% |
| Arts & Humanities | 248 | 9.8% |
| Total | 2,521 | 100.0% |
Transportation & Commute in Bay Point
Vehicle Availability by Sex in Bay Point
The most prevalent vehicle ownership categories in Bay Point are males with 3 vehicles (2,222, accounting for 33.9%) and females with 3 vehicles (1,161, making up 49.0%).
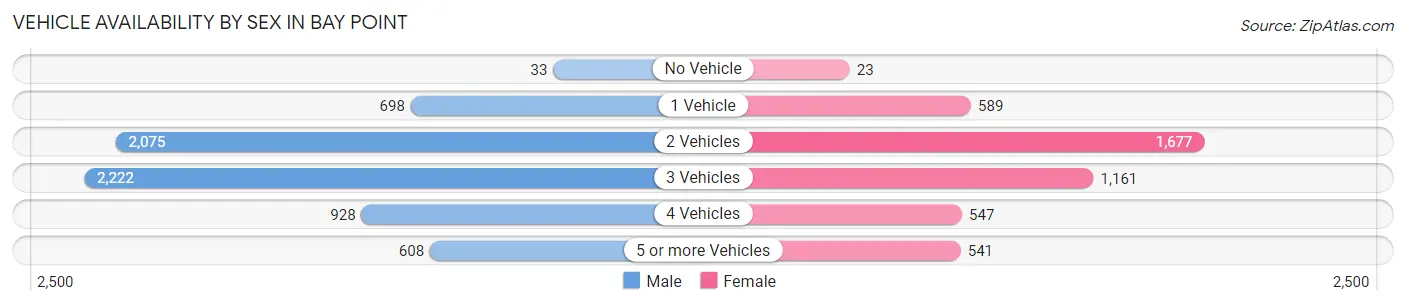
| Vehicles Available | Male | Female |
| No Vehicle | 33 (0.5%) | 23 (0.5%) |
| 1 Vehicle | 698 (10.6%) | 589 (13.0%) |
| 2 Vehicles | 2,075 (31.6%) | 1,677 (36.9%) |
| 3 Vehicles | 2,222 (33.9%) | 1,161 (25.6%) |
| 4 Vehicles | 928 (14.1%) | 547 (12.0%) |
| 5 or more Vehicles | 608 (9.3%) | 541 (11.9%) |
| Total | 6,564 (100.0%) | 4,538 (100.0%) |
Commute Time in Bay Point
The most frequently occuring commute durations in Bay Point are 30 to 34 minutes (2,031 commuters, 19.1%), 20 to 24 minutes (1,485 commuters, 14.0%), and 60 to 89 minutes (1,403 commuters, 13.2%).
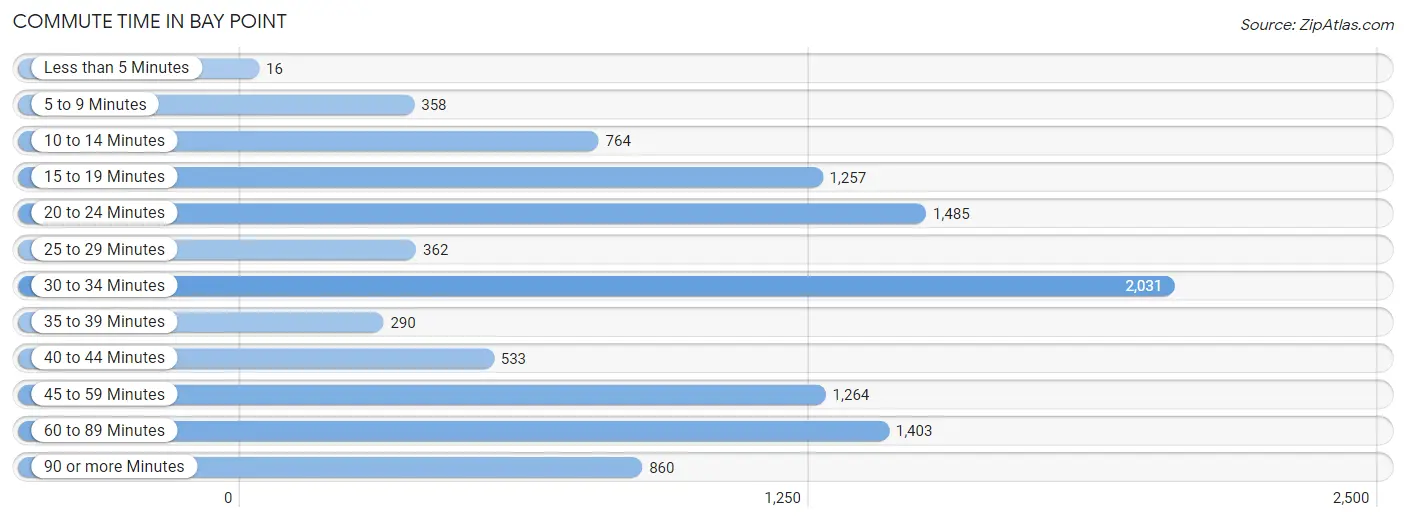
| Commute Time | # Commuters | % Commuters |
| Less than 5 Minutes | 16 | 0.2% |
| 5 to 9 Minutes | 358 | 3.4% |
| 10 to 14 Minutes | 764 | 7.2% |
| 15 to 19 Minutes | 1,257 | 11.8% |
| 20 to 24 Minutes | 1,485 | 14.0% |
| 25 to 29 Minutes | 362 | 3.4% |
| 30 to 34 Minutes | 2,031 | 19.1% |
| 35 to 39 Minutes | 290 | 2.7% |
| 40 to 44 Minutes | 533 | 5.0% |
| 45 to 59 Minutes | 1,264 | 11.9% |
| 60 to 89 Minutes | 1,403 | 13.2% |
| 90 or more Minutes | 860 | 8.1% |
Commute Time by Sex in Bay Point
The most common commute times in Bay Point are 30 to 34 minutes (1,388 commuters, 21.9%) for males and 15 to 19 minutes (666 commuters, 15.5%) for females.
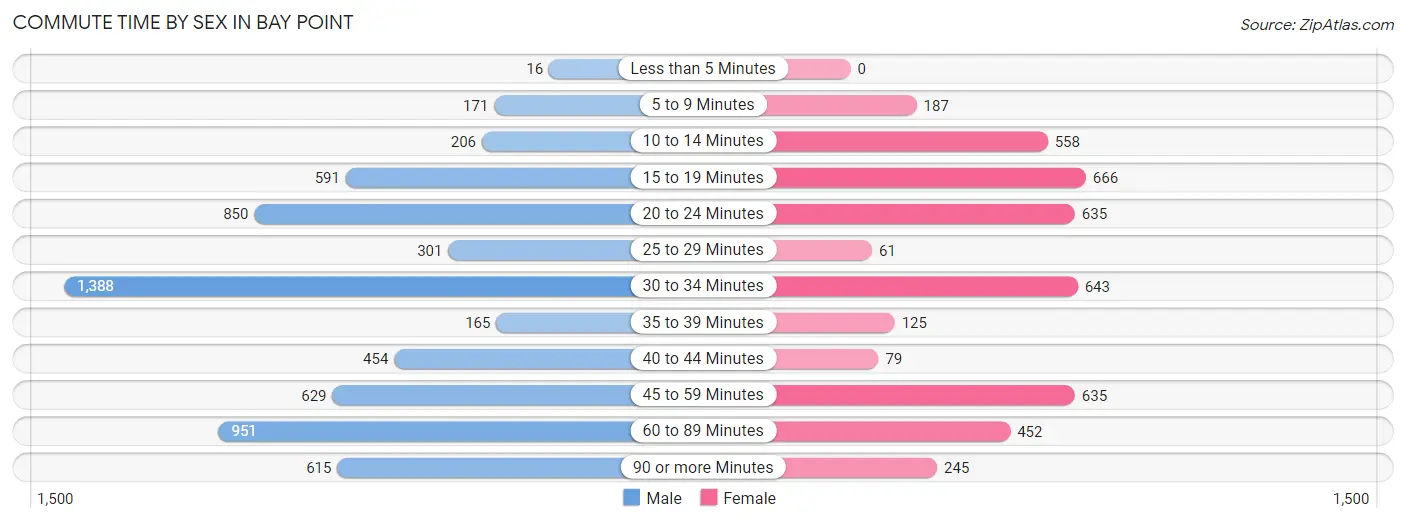
| Commute Time | Male | Female |
| Less than 5 Minutes | 16 (0.3%) | 0 (0.0%) |
| 5 to 9 Minutes | 171 (2.7%) | 187 (4.4%) |
| 10 to 14 Minutes | 206 (3.3%) | 558 (13.0%) |
| 15 to 19 Minutes | 591 (9.3%) | 666 (15.5%) |
| 20 to 24 Minutes | 850 (13.4%) | 635 (14.8%) |
| 25 to 29 Minutes | 301 (4.8%) | 61 (1.4%) |
| 30 to 34 Minutes | 1,388 (21.9%) | 643 (15.0%) |
| 35 to 39 Minutes | 165 (2.6%) | 125 (2.9%) |
| 40 to 44 Minutes | 454 (7.2%) | 79 (1.8%) |
| 45 to 59 Minutes | 629 (9.9%) | 635 (14.8%) |
| 60 to 89 Minutes | 951 (15.0%) | 452 (10.5%) |
| 90 or more Minutes | 615 (9.7%) | 245 (5.7%) |
Time of Departure to Work by Sex in Bay Point
The most frequent times of departure to work in Bay Point are 6:00 AM to 6:29 AM (1,029, 16.2%) for males and 12:00 PM to 3:59 PM (604, 14.1%) for females.
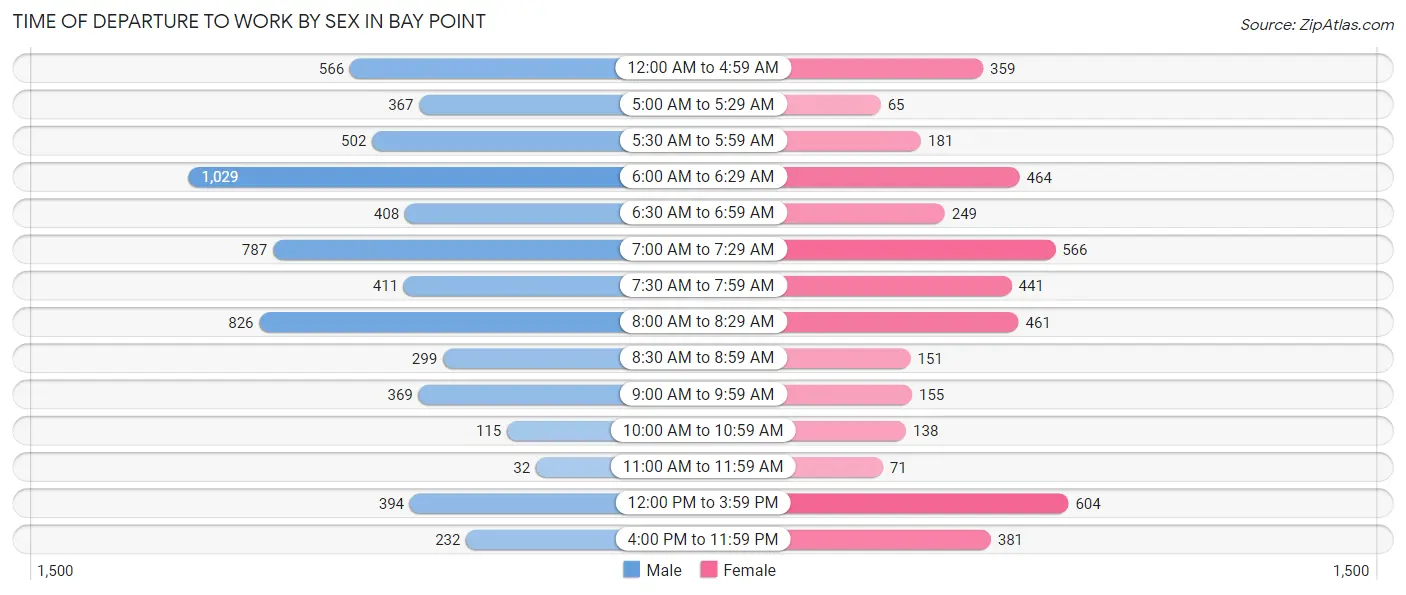
| Time of Departure | Male | Female |
| 12:00 AM to 4:59 AM | 566 (8.9%) | 359 (8.4%) |
| 5:00 AM to 5:29 AM | 367 (5.8%) | 65 (1.5%) |
| 5:30 AM to 5:59 AM | 502 (7.9%) | 181 (4.2%) |
| 6:00 AM to 6:29 AM | 1,029 (16.2%) | 464 (10.8%) |
| 6:30 AM to 6:59 AM | 408 (6.4%) | 249 (5.8%) |
| 7:00 AM to 7:29 AM | 787 (12.4%) | 566 (13.2%) |
| 7:30 AM to 7:59 AM | 411 (6.5%) | 441 (10.3%) |
| 8:00 AM to 8:29 AM | 826 (13.0%) | 461 (10.8%) |
| 8:30 AM to 8:59 AM | 299 (4.7%) | 151 (3.5%) |
| 9:00 AM to 9:59 AM | 369 (5.8%) | 155 (3.6%) |
| 10:00 AM to 10:59 AM | 115 (1.8%) | 138 (3.2%) |
| 11:00 AM to 11:59 AM | 32 (0.5%) | 71 (1.7%) |
| 12:00 PM to 3:59 PM | 394 (6.2%) | 604 (14.1%) |
| 4:00 PM to 11:59 PM | 232 (3.7%) | 381 (8.9%) |
| Total | 6,337 (100.0%) | 4,286 (100.0%) |
Housing Occupancy in Bay Point
Occupancy by Ownership in Bay Point
Of the total 6,604 dwellings in Bay Point, owner-occupied units account for 3,722 (56.4%), while renter-occupied units make up 2,882 (43.6%).
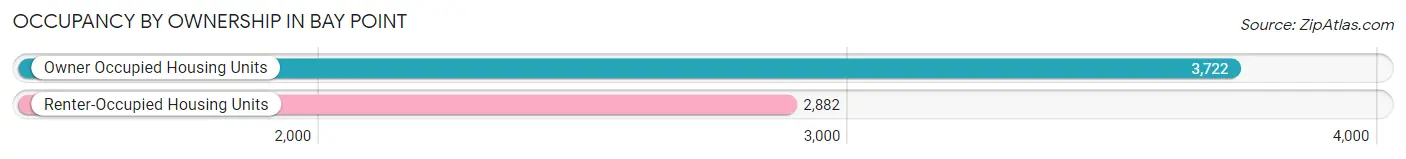
| Occupancy | # Housing Units | % Housing Units |
| Owner Occupied Housing Units | 3,722 | 56.4% |
| Renter-Occupied Housing Units | 2,882 | 43.6% |
| Total Occupied Housing Units | 6,604 | 100.0% |
Occupancy by Household Size in Bay Point
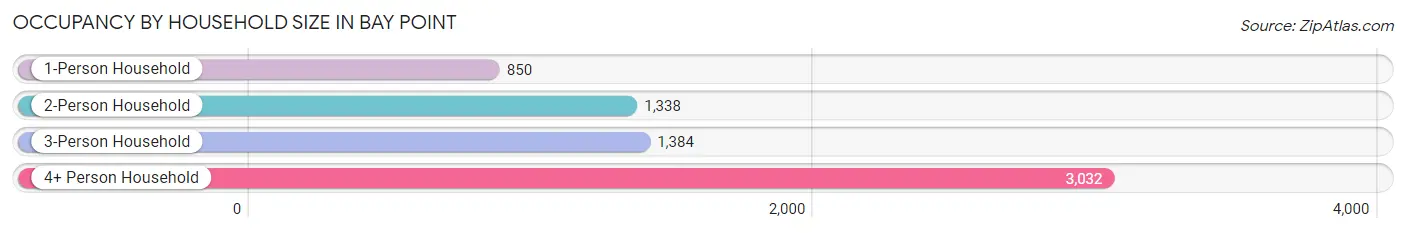
| Household Size | # Housing Units | % Housing Units |
| 1-Person Household | 850 | 12.9% |
| 2-Person Household | 1,338 | 20.3% |
| 3-Person Household | 1,384 | 21.0% |
| 4+ Person Household | 3,032 | 45.9% |
| Total Housing Units | 6,604 | 100.0% |
Occupancy by Ownership by Household Size in Bay Point
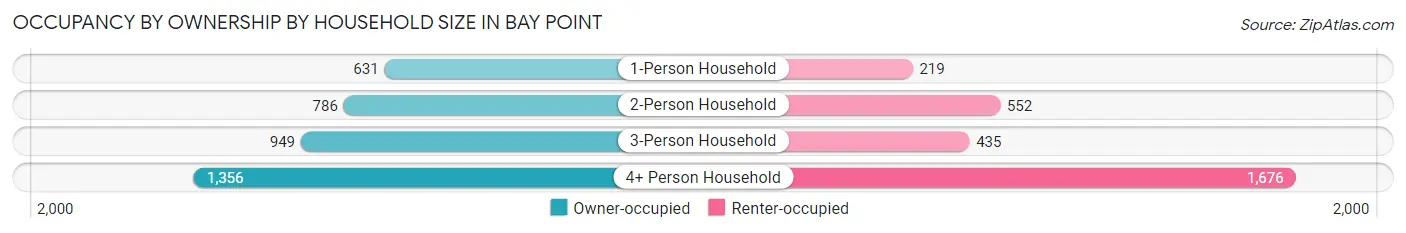
| Household Size | Owner-occupied | Renter-occupied |
| 1-Person Household | 631 (74.2%) | 219 (25.8%) |
| 2-Person Household | 786 (58.7%) | 552 (41.3%) |
| 3-Person Household | 949 (68.6%) | 435 (31.4%) |
| 4+ Person Household | 1,356 (44.7%) | 1,676 (55.3%) |
| Total Housing Units | 3,722 (56.4%) | 2,882 (43.6%) |
Occupancy by Educational Attainment in Bay Point
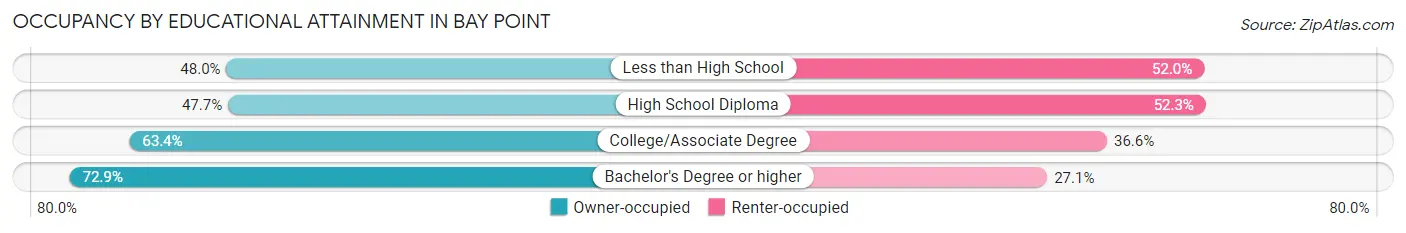
| Household Size | Owner-occupied | Renter-occupied |
| Less than High School | 920 (48.0%) | 997 (52.0%) |
| High School Diploma | 814 (47.7%) | 891 (52.3%) |
| College/Associate Degree | 1,236 (63.4%) | 714 (36.6%) |
| Bachelor's Degree or higher | 752 (72.9%) | 280 (27.1%) |
Occupancy by Age of Householder in Bay Point
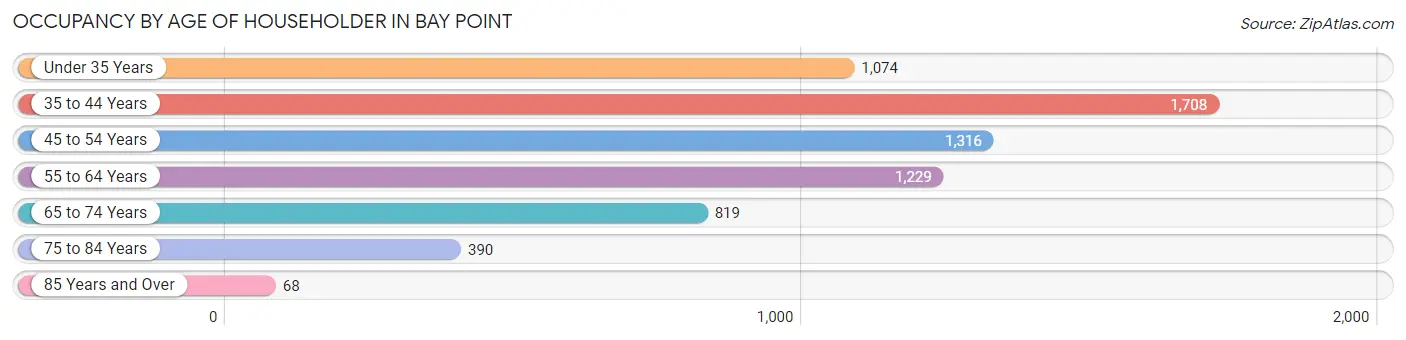
| Age Bracket | # Households | % Households |
| Under 35 Years | 1,074 | 16.3% |
| 35 to 44 Years | 1,708 | 25.9% |
| 45 to 54 Years | 1,316 | 19.9% |
| 55 to 64 Years | 1,229 | 18.6% |
| 65 to 74 Years | 819 | 12.4% |
| 75 to 84 Years | 390 | 5.9% |
| 85 Years and Over | 68 | 1.0% |
| Total | 6,604 | 100.0% |
Housing Finances in Bay Point
Median Income by Occupancy in Bay Point
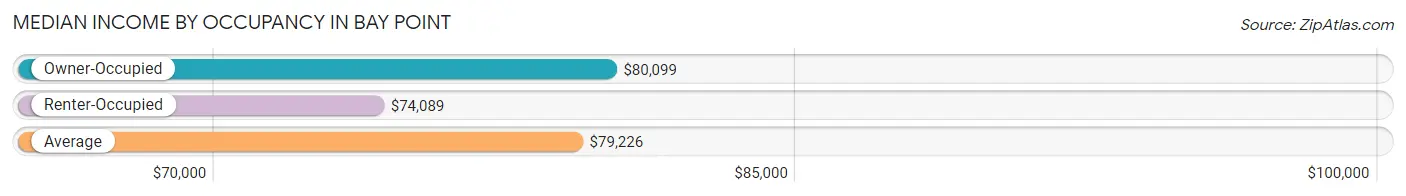
| Occupancy Type | # Households | Median Income |
| Owner-Occupied | 3,722 (56.4%) | $80,099 |
| Renter-Occupied | 2,882 (43.6%) | $74,089 |
| Average | 6,604 (100.0%) | $79,226 |
Occupancy by Householder Income Bracket in Bay Point
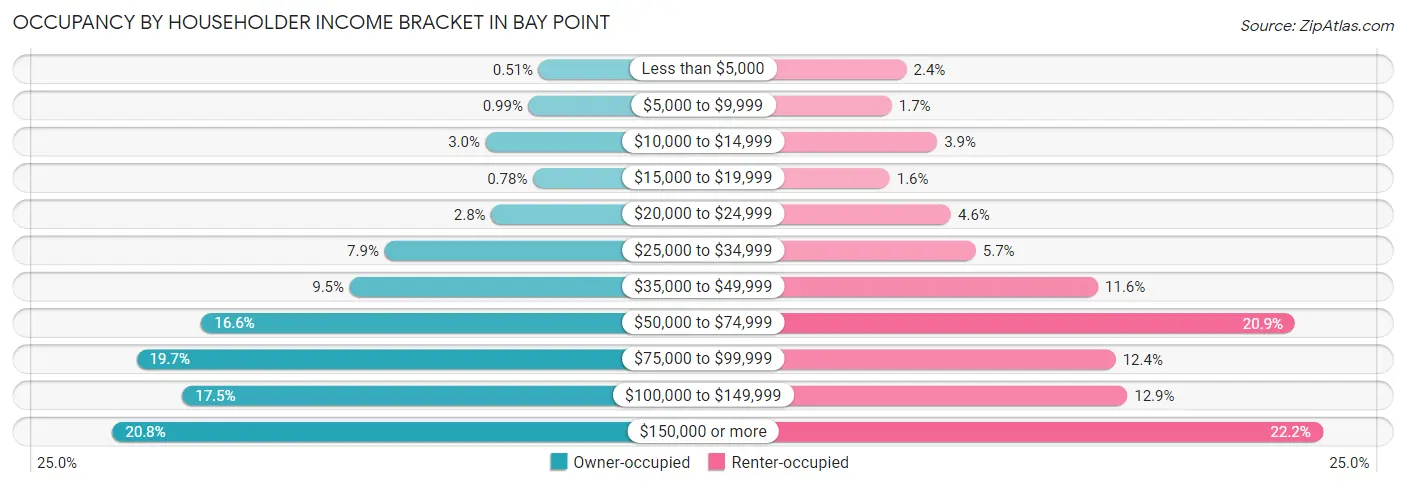
| Income Bracket | Owner-occupied | Renter-occupied |
| Less than $5,000 | 19 (0.5%) | 70 (2.4%) |
| $5,000 to $9,999 | 37 (1.0%) | 50 (1.7%) |
| $10,000 to $14,999 | 113 (3.0%) | 112 (3.9%) |
| $15,000 to $19,999 | 29 (0.8%) | 47 (1.6%) |
| $20,000 to $24,999 | 103 (2.8%) | 131 (4.5%) |
| $25,000 to $34,999 | 292 (7.9%) | 165 (5.7%) |
| $35,000 to $49,999 | 354 (9.5%) | 333 (11.6%) |
| $50,000 to $74,999 | 617 (16.6%) | 603 (20.9%) |
| $75,000 to $99,999 | 732 (19.7%) | 357 (12.4%) |
| $100,000 to $149,999 | 651 (17.5%) | 373 (12.9%) |
| $150,000 or more | 775 (20.8%) | 641 (22.2%) |
| Total | 3,722 (100.0%) | 2,882 (100.0%) |
Monthly Housing Cost Tiers in Bay Point
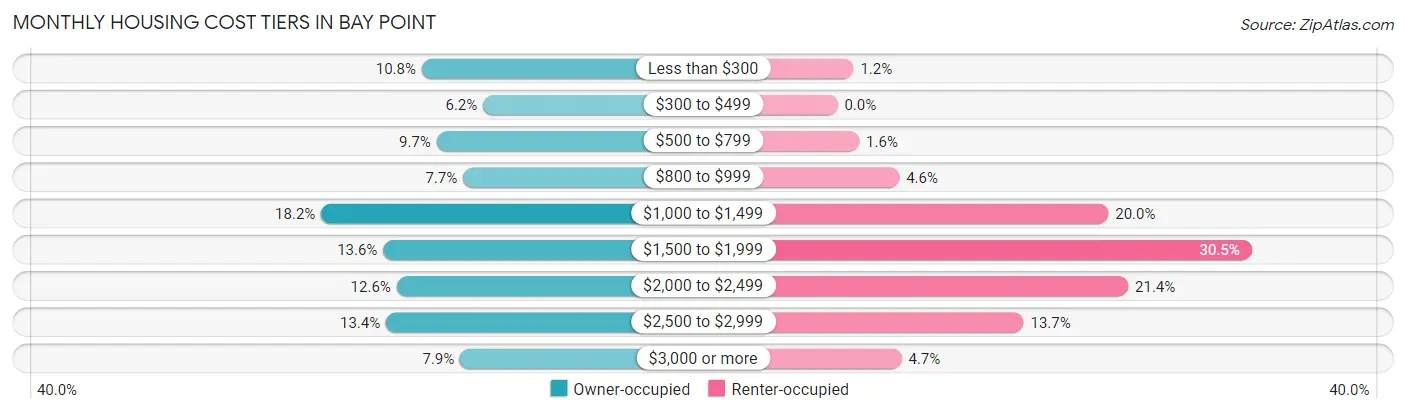
| Monthly Cost | Owner-occupied | Renter-occupied |
| Less than $300 | 400 (10.7%) | 34 (1.2%) |
| $300 to $499 | 232 (6.2%) | 0 (0.0%) |
| $500 to $799 | 359 (9.7%) | 46 (1.6%) |
| $800 to $999 | 287 (7.7%) | 131 (4.5%) |
| $1,000 to $1,499 | 676 (18.2%) | 575 (20.0%) |
| $1,500 to $1,999 | 506 (13.6%) | 879 (30.5%) |
| $2,000 to $2,499 | 469 (12.6%) | 617 (21.4%) |
| $2,500 to $2,999 | 498 (13.4%) | 395 (13.7%) |
| $3,000 or more | 295 (7.9%) | 136 (4.7%) |
| Total | 3,722 (100.0%) | 2,882 (100.0%) |
Physical Housing Characteristics in Bay Point
Housing Structures in Bay Point
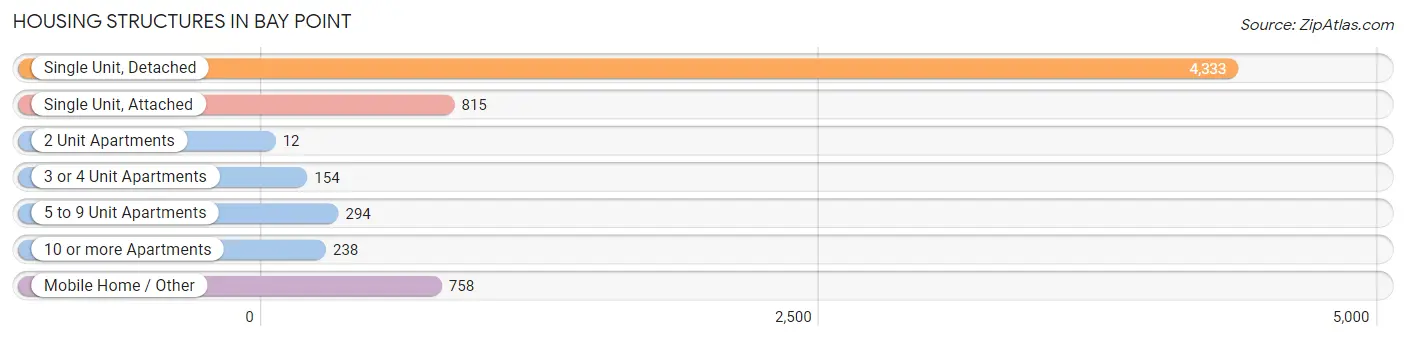
| Structure Type | # Housing Units | % Housing Units |
| Single Unit, Detached | 4,333 | 65.6% |
| Single Unit, Attached | 815 | 12.3% |
| 2 Unit Apartments | 12 | 0.2% |
| 3 or 4 Unit Apartments | 154 | 2.3% |
| 5 to 9 Unit Apartments | 294 | 4.4% |
| 10 or more Apartments | 238 | 3.6% |
| Mobile Home / Other | 758 | 11.5% |
| Total | 6,604 | 100.0% |
Housing Structures by Occupancy in Bay Point
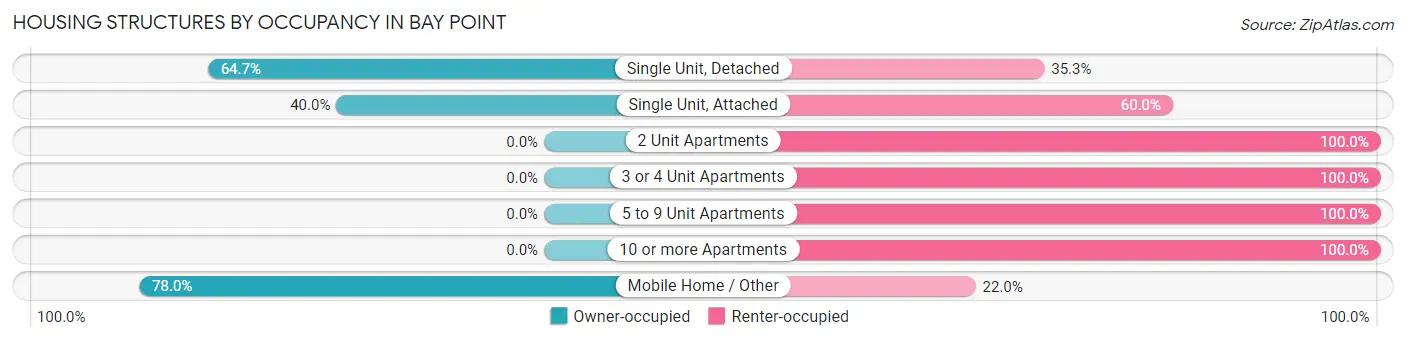
| Structure Type | Owner-occupied | Renter-occupied |
| Single Unit, Detached | 2,805 (64.7%) | 1,528 (35.3%) |
| Single Unit, Attached | 326 (40.0%) | 489 (60.0%) |
| 2 Unit Apartments | 0 (0.0%) | 12 (100.0%) |
| 3 or 4 Unit Apartments | 0 (0.0%) | 154 (100.0%) |
| 5 to 9 Unit Apartments | 0 (0.0%) | 294 (100.0%) |
| 10 or more Apartments | 0 (0.0%) | 238 (100.0%) |
| Mobile Home / Other | 591 (78.0%) | 167 (22.0%) |
| Total | 3,722 (56.4%) | 2,882 (43.6%) |
Housing Structures by Number of Rooms in Bay Point
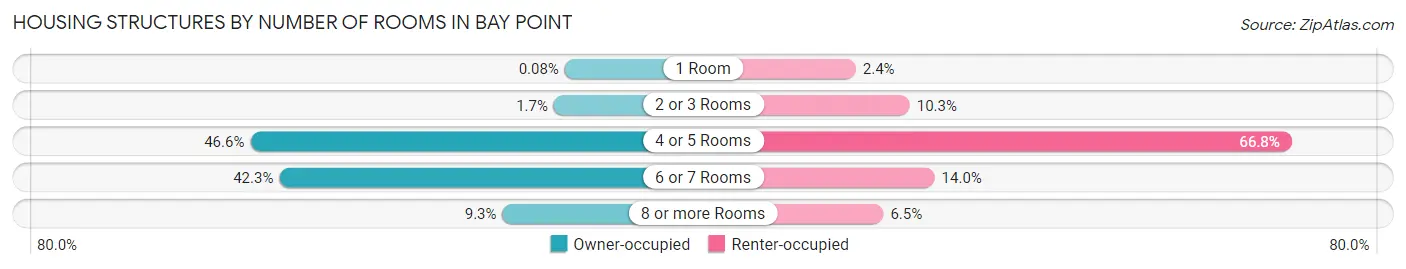
| Number of Rooms | Owner-occupied | Renter-occupied |
| 1 Room | 3 (0.1%) | 68 (2.4%) |
| 2 or 3 Rooms | 63 (1.7%) | 298 (10.3%) |
| 4 or 5 Rooms | 1,735 (46.6%) | 1,926 (66.8%) |
| 6 or 7 Rooms | 1,575 (42.3%) | 404 (14.0%) |
| 8 or more Rooms | 346 (9.3%) | 186 (6.5%) |
| Total | 3,722 (100.0%) | 2,882 (100.0%) |
Housing Structure by Heating Type in Bay Point
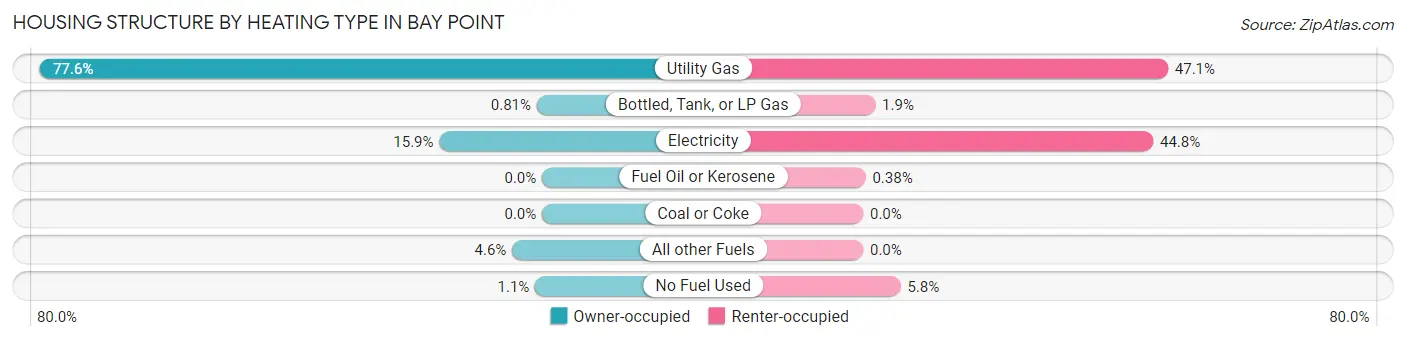
| Heating Type | Owner-occupied | Renter-occupied |
| Utility Gas | 2,889 (77.6%) | 1,358 (47.1%) |
| Bottled, Tank, or LP Gas | 30 (0.8%) | 54 (1.9%) |
| Electricity | 591 (15.9%) | 1,292 (44.8%) |
| Fuel Oil or Kerosene | 0 (0.0%) | 11 (0.4%) |
| Coal or Coke | 0 (0.0%) | 0 (0.0%) |
| All other Fuels | 172 (4.6%) | 0 (0.0%) |
| No Fuel Used | 40 (1.1%) | 167 (5.8%) |
| Total | 3,722 (100.0%) | 2,882 (100.0%) |
Household Vehicle Usage in Bay Point
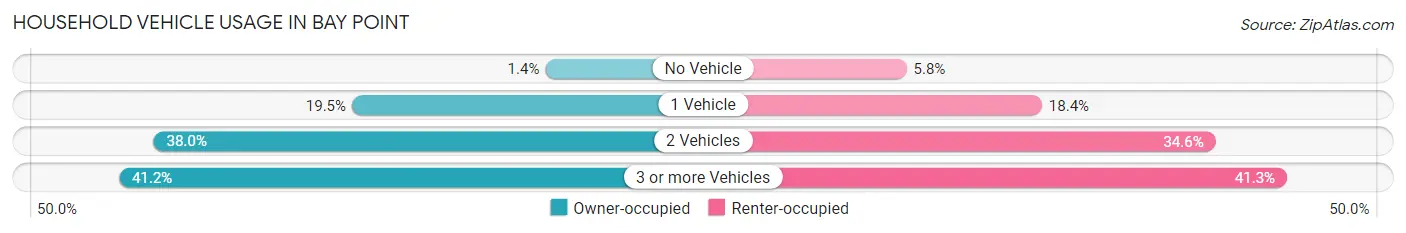
| Vehicles per Household | Owner-occupied | Renter-occupied |
| No Vehicle | 52 (1.4%) | 166 (5.8%) |
| 1 Vehicle | 724 (19.5%) | 530 (18.4%) |
| 2 Vehicles | 1,413 (38.0%) | 997 (34.6%) |
| 3 or more Vehicles | 1,533 (41.2%) | 1,189 (41.3%) |
| Total | 3,722 (100.0%) | 2,882 (100.0%) |
Real Estate & Mortgages in Bay Point
Real Estate and Mortgage Overview in Bay Point
| Characteristic | Without Mortgage | With Mortgage |
| Housing Units | 1,506 | 2,216 |
| Median Property Value | $310,000 | $471,700 |
| Median Household Income | $64,693 | $548 |
| Monthly Housing Costs | $588 | $295 |
| Real Estate Taxes | $1,719 | $46 |
Property Value by Mortgage Status in Bay Point
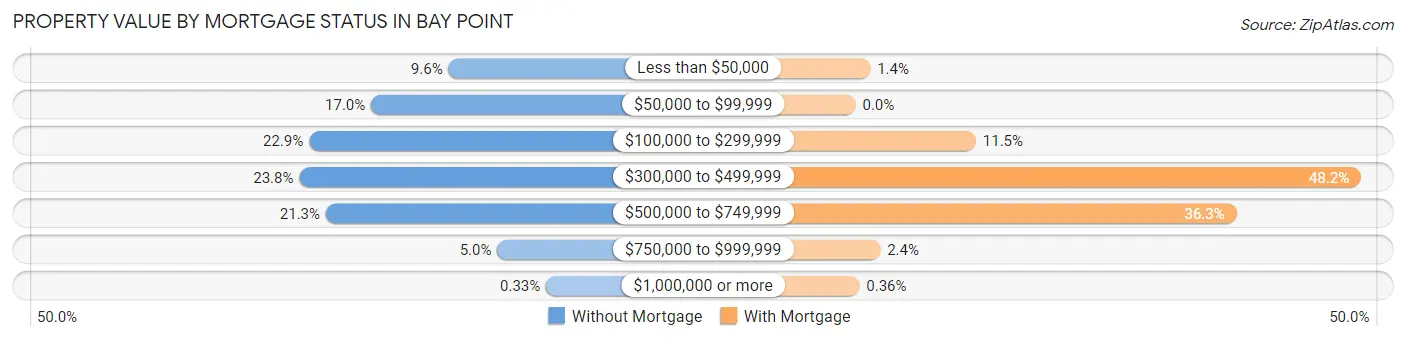
| Property Value | Without Mortgage | With Mortgage |
| Less than $50,000 | 145 (9.6%) | 31 (1.4%) |
| $50,000 to $99,999 | 256 (17.0%) | 0 (0.0%) |
| $100,000 to $299,999 | 345 (22.9%) | 254 (11.5%) |
| $300,000 to $499,999 | 359 (23.8%) | 1,067 (48.1%) |
| $500,000 to $749,999 | 321 (21.3%) | 804 (36.3%) |
| $750,000 to $999,999 | 75 (5.0%) | 52 (2.4%) |
| $1,000,000 or more | 5 (0.3%) | 8 (0.4%) |
| Total | 1,506 (100.0%) | 2,216 (100.0%) |
Household Income by Mortgage Status in Bay Point
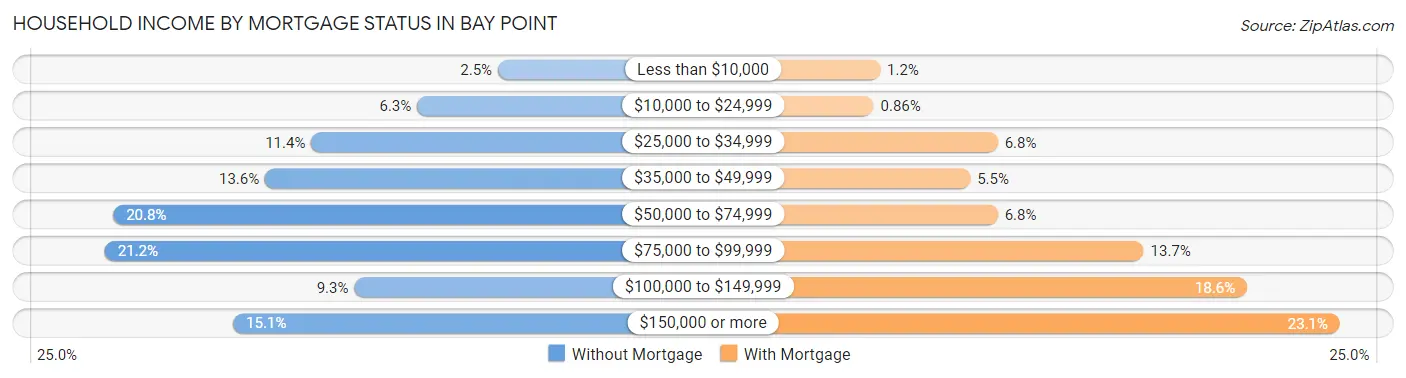
| Household Income | Without Mortgage | With Mortgage |
| Less than $10,000 | 37 (2.5%) | 26 (1.2%) |
| $10,000 to $24,999 | 95 (6.3%) | 19 (0.9%) |
| $25,000 to $34,999 | 171 (11.4%) | 150 (6.8%) |
| $35,000 to $49,999 | 204 (13.6%) | 121 (5.5%) |
| $50,000 to $74,999 | 313 (20.8%) | 150 (6.8%) |
| $75,000 to $99,999 | 319 (21.2%) | 304 (13.7%) |
| $100,000 to $149,999 | 140 (9.3%) | 413 (18.6%) |
| $150,000 or more | 227 (15.1%) | 511 (23.1%) |
| Total | 1,506 (100.0%) | 2,216 (100.0%) |
Property Value to Household Income Ratio in Bay Point
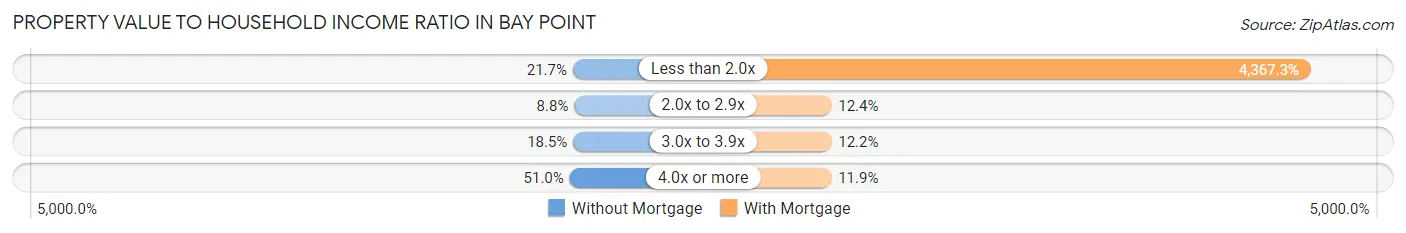
| Value-to-Income Ratio | Without Mortgage | With Mortgage |
| Less than 2.0x | 327 (21.7%) | 96,780 (4,367.3%) |
| 2.0x to 2.9x | 133 (8.8%) | 275 (12.4%) |
| 3.0x to 3.9x | 278 (18.5%) | 270 (12.2%) |
| 4.0x or more | 768 (51.0%) | 264 (11.9%) |
| Total | 1,506 (100.0%) | 2,216 (100.0%) |
Real Estate Taxes by Mortgage Status in Bay Point
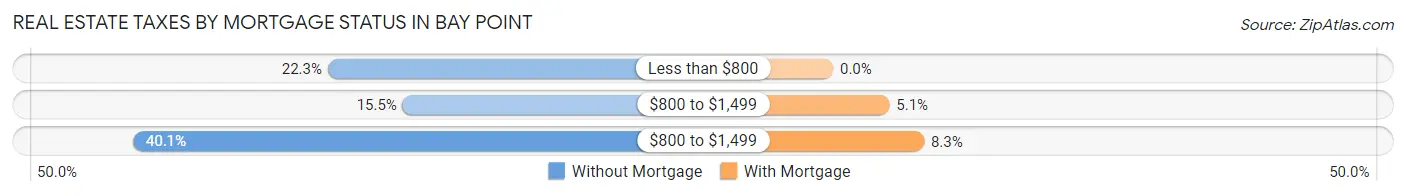
| Property Taxes | Without Mortgage | With Mortgage |
| Less than $800 | 336 (22.3%) | 0 (0.0%) |
| $800 to $1,499 | 233 (15.5%) | 114 (5.1%) |
| $800 to $1,499 | 604 (40.1%) | 184 (8.3%) |
| Total | 1,506 (100.0%) | 2,216 (100.0%) |
Health & Disability in Bay Point
Health Insurance Coverage by Age in Bay Point
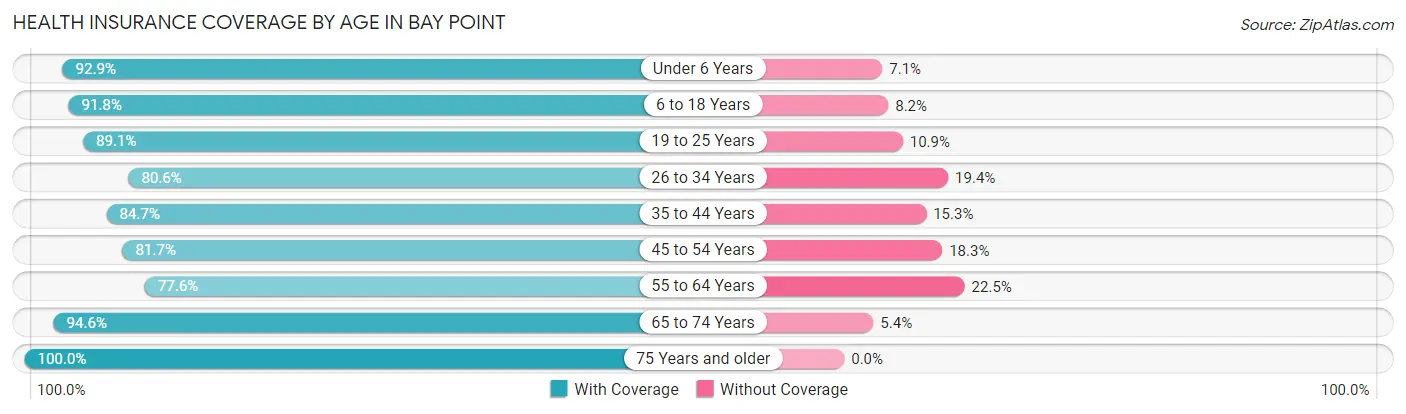
| Age Bracket | With Coverage | Without Coverage |
| Under 6 Years | 1,846 (92.9%) | 141 (7.1%) |
| 6 to 18 Years | 4,189 (91.8%) | 374 (8.2%) |
| 19 to 25 Years | 2,743 (89.1%) | 336 (10.9%) |
| 26 to 34 Years | 2,569 (80.6%) | 617 (19.4%) |
| 35 to 44 Years | 3,294 (84.7%) | 594 (15.3%) |
| 45 to 54 Years | 2,485 (81.7%) | 555 (18.3%) |
| 55 to 64 Years | 1,824 (77.5%) | 528 (22.5%) |
| 65 to 74 Years | 1,411 (94.6%) | 81 (5.4%) |
| 75 Years and older | 814 (100.0%) | 0 (0.0%) |
| Total | 21,175 (86.8%) | 3,226 (13.2%) |
Health Insurance Coverage by Citizenship Status in Bay Point
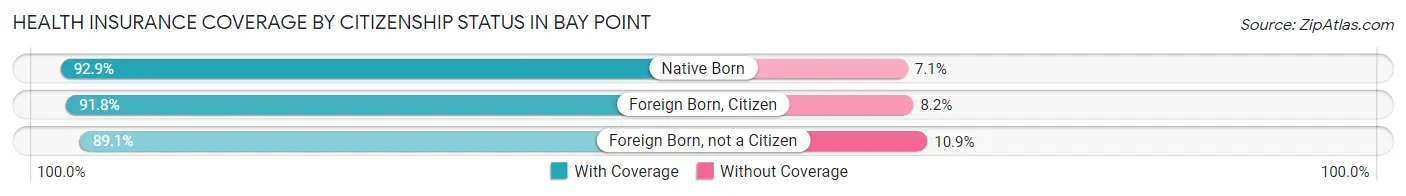
| Citizenship Status | With Coverage | Without Coverage |
| Native Born | 1,846 (92.9%) | 141 (7.1%) |
| Foreign Born, Citizen | 4,189 (91.8%) | 374 (8.2%) |
| Foreign Born, not a Citizen | 2,743 (89.1%) | 336 (10.9%) |
Health Insurance Coverage by Household Income in Bay Point
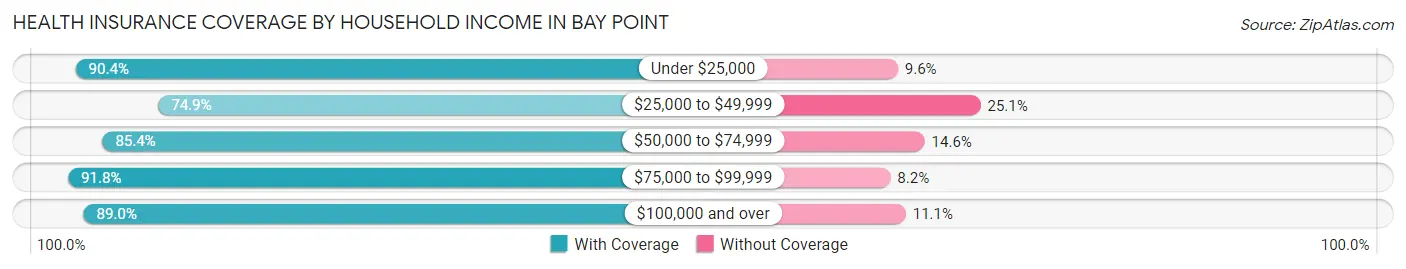
| Household Income | With Coverage | Without Coverage |
| Under $25,000 | 1,946 (90.4%) | 206 (9.6%) |
| $25,000 to $49,999 | 2,730 (74.9%) | 913 (25.1%) |
| $50,000 to $74,999 | 4,128 (85.4%) | 705 (14.6%) |
| $75,000 to $99,999 | 3,718 (91.8%) | 331 (8.2%) |
| $100,000 and over | 8,612 (88.9%) | 1,070 (11.1%) |
Public vs Private Health Insurance Coverage by Age in Bay Point
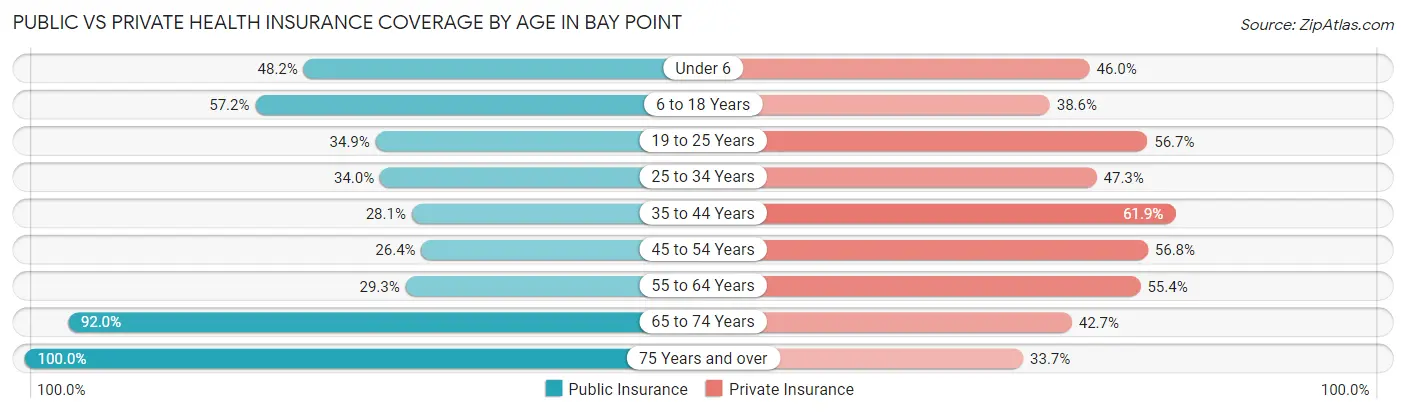
| Age Bracket | Public Insurance | Private Insurance |
| Under 6 | 958 (48.2%) | 914 (46.0%) |
| 6 to 18 Years | 2,609 (57.2%) | 1,762 (38.6%) |
| 19 to 25 Years | 1,073 (34.8%) | 1,746 (56.7%) |
| 25 to 34 Years | 1,084 (34.0%) | 1,507 (47.3%) |
| 35 to 44 Years | 1,094 (28.1%) | 2,406 (61.9%) |
| 45 to 54 Years | 801 (26.4%) | 1,727 (56.8%) |
| 55 to 64 Years | 689 (29.3%) | 1,304 (55.4%) |
| 65 to 74 Years | 1,372 (92.0%) | 637 (42.7%) |
| 75 Years and over | 814 (100.0%) | 274 (33.7%) |
| Total | 10,494 (43.0%) | 12,277 (50.3%) |
Disability Status by Sex by Age in Bay Point
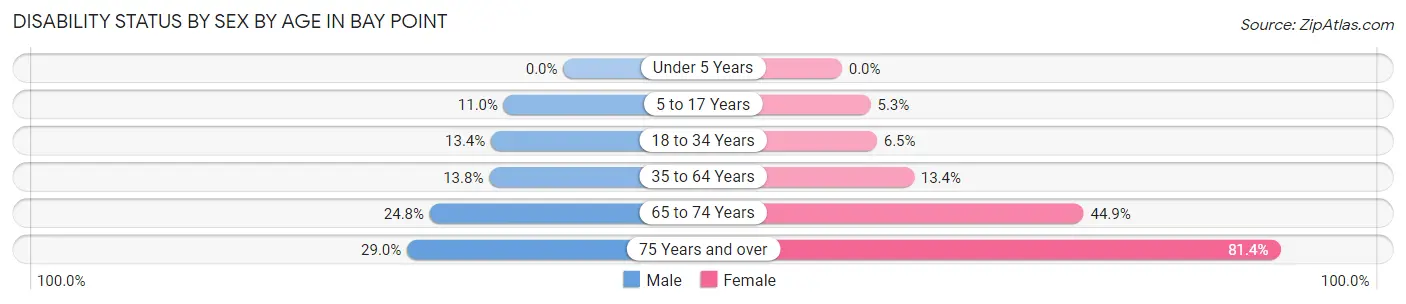
| Age Bracket | Male | Female |
| Under 5 Years | 0 (0.0%) | 0 (0.0%) |
| 5 to 17 Years | 308 (11.0%) | 90 (5.3%) |
| 18 to 34 Years | 483 (13.4%) | 197 (6.5%) |
| 35 to 64 Years | 684 (13.8%) | 576 (13.4%) |
| 65 to 74 Years | 167 (24.8%) | 367 (44.9%) |
| 75 Years and over | 96 (29.0%) | 393 (81.4%) |
Disability Class by Sex by Age in Bay Point
Disability Class: Hearing Difficulty
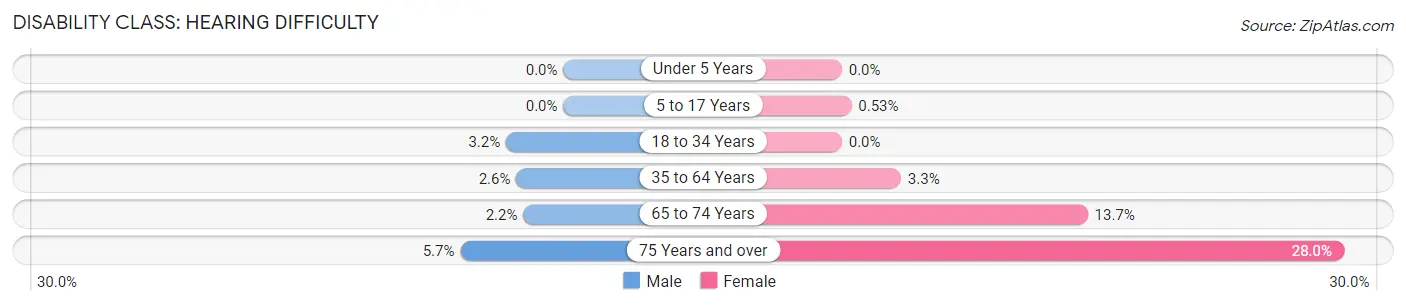
| Age Bracket | Male | Female |
| Under 5 Years | 0 (0.0%) | 0 (0.0%) |
| 5 to 17 Years | 0 (0.0%) | 9 (0.5%) |
| 18 to 34 Years | 115 (3.2%) | 0 (0.0%) |
| 35 to 64 Years | 130 (2.6%) | 142 (3.3%) |
| 65 to 74 Years | 15 (2.2%) | 112 (13.7%) |
| 75 Years and over | 19 (5.7%) | 135 (28.0%) |
Disability Class: Vision Difficulty
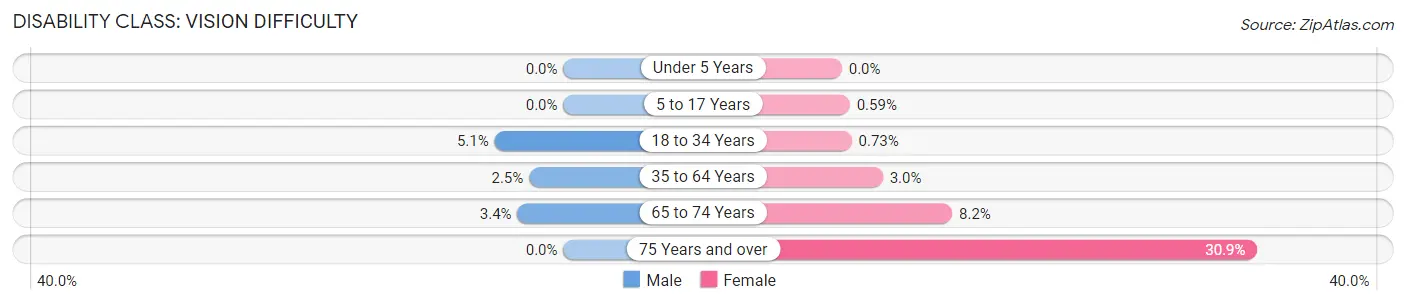
| Age Bracket | Male | Female |
| Under 5 Years | 0 (0.0%) | 0 (0.0%) |
| 5 to 17 Years | 0 (0.0%) | 10 (0.6%) |
| 18 to 34 Years | 184 (5.1%) | 22 (0.7%) |
| 35 to 64 Years | 126 (2.5%) | 131 (3.0%) |
| 65 to 74 Years | 23 (3.4%) | 67 (8.2%) |
| 75 Years and over | 0 (0.0%) | 149 (30.8%) |
Disability Class: Cognitive Difficulty
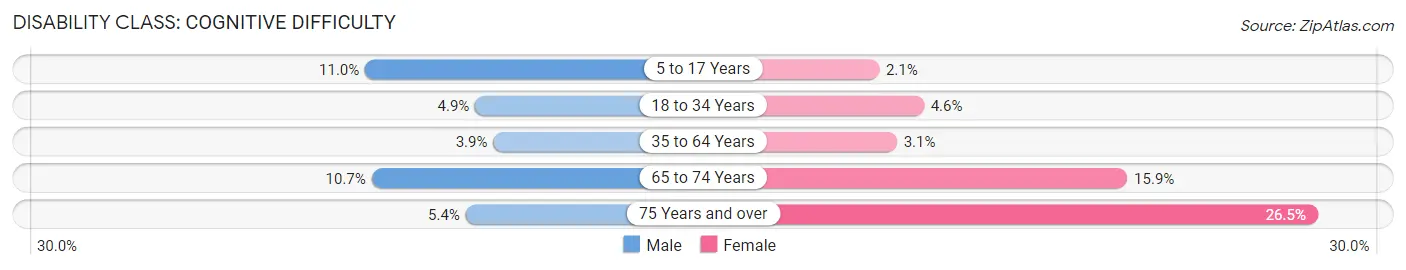
| Age Bracket | Male | Female |
| 5 to 17 Years | 308 (11.0%) | 35 (2.1%) |
| 18 to 34 Years | 177 (4.9%) | 138 (4.6%) |
| 35 to 64 Years | 194 (3.9%) | 132 (3.1%) |
| 65 to 74 Years | 72 (10.7%) | 130 (15.9%) |
| 75 Years and over | 18 (5.4%) | 128 (26.5%) |
Disability Class: Ambulatory Difficulty
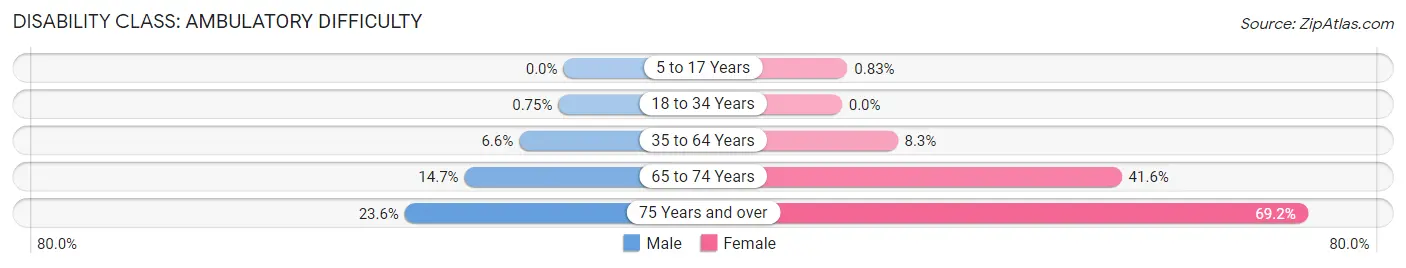
| Age Bracket | Male | Female |
| 5 to 17 Years | 0 (0.0%) | 14 (0.8%) |
| 18 to 34 Years | 27 (0.7%) | 0 (0.0%) |
| 35 to 64 Years | 327 (6.6%) | 357 (8.3%) |
| 65 to 74 Years | 99 (14.7%) | 340 (41.6%) |
| 75 Years and over | 78 (23.6%) | 334 (69.2%) |
Disability Class: Self-Care Difficulty
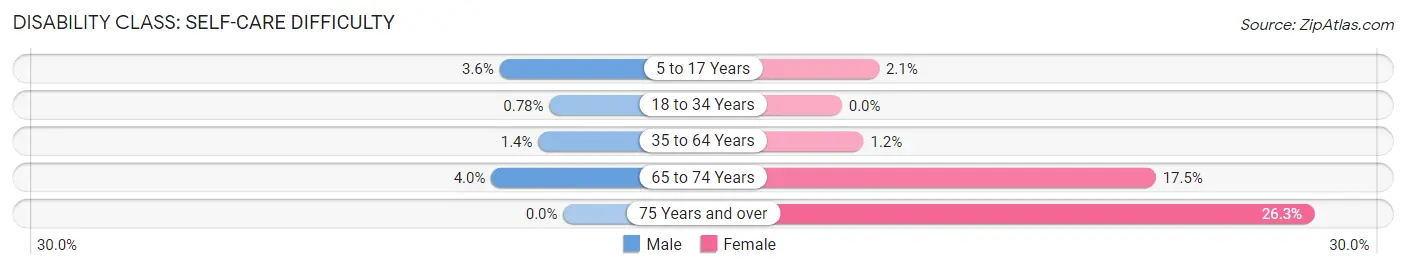
| Age Bracket | Male | Female |
| 5 to 17 Years | 99 (3.5%) | 35 (2.1%) |
| 18 to 34 Years | 28 (0.8%) | 0 (0.0%) |
| 35 to 64 Years | 69 (1.4%) | 52 (1.2%) |
| 65 to 74 Years | 27 (4.0%) | 143 (17.5%) |
| 75 Years and over | 0 (0.0%) | 127 (26.3%) |
Technology Access in Bay Point
Computing Device Access in Bay Point
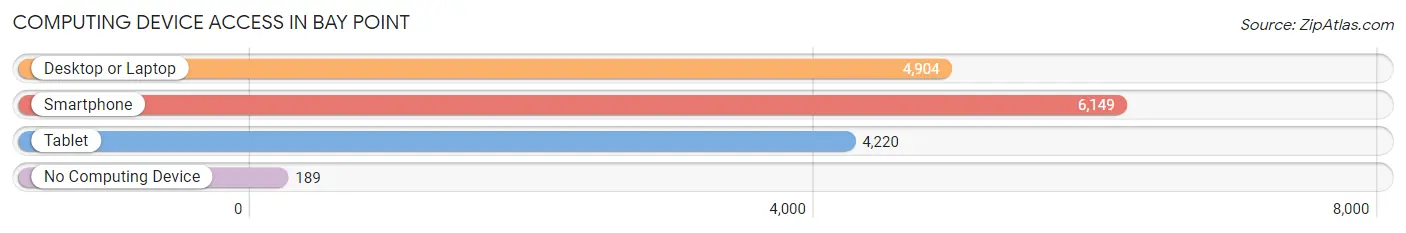
| Device Type | # Households | % Households |
| Desktop or Laptop | 4,904 | 74.3% |
| Smartphone | 6,149 | 93.1% |
| Tablet | 4,220 | 63.9% |
| No Computing Device | 189 | 2.9% |
| Total | 6,604 | 100.0% |
Internet Access in Bay Point
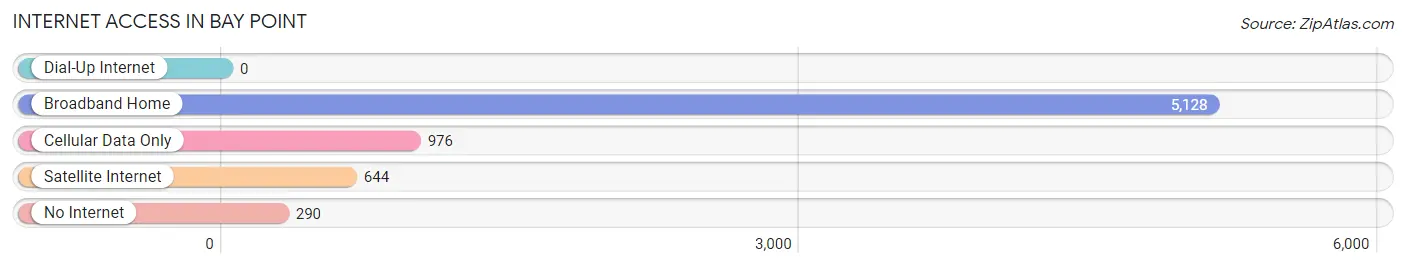
| Internet Type | # Households | % Households |
| Dial-Up Internet | 0 | 0.0% |
| Broadband Home | 5,128 | 77.6% |
| Cellular Data Only | 976 | 14.8% |
| Satellite Internet | 644 | 9.8% |
| No Internet | 290 | 4.4% |
| Total | 6,604 | 100.0% |
Bay Point Summary
Bay Point is a census-designated place (CDP) located in Contra Costa County, California, United States. It is located in the San Francisco Bay Area, about 25 miles northeast of San Francisco. As of the 2010 census, the population of Bay Point was 21,349.
Geography
Bay Point is located at 37°56'17" North, 122°2'2" West (37.938056, -122.033889). It is situated at an elevation of 20 feet (6 m) above sea level.
The CDP has a total area of 4 2 square miles 10 8 km2 all of it land
History
Bay Point was originally known as West Pittsburg, and was part of the Rancho Los Meganos Mexican land grant. It was settled in the mid-19th century by settlers from the East Coast. The town was renamed Bay Point in the late 19th century, after the nearby bay.
In the early 20th century, Bay Point was a popular destination for vacationers from San Francisco. It was also home to a large Italian-American population.
Economy
The economy of Bay Point is largely based on the service industry. The largest employers in the area are the Contra Costa County government, the Pittsburg Unified School District, and the Contra Costa County Sheriff's Office.
Demographics
As of the 2010 census, there were 21,349 people, 6,945 households, and 5,093 families residing in the CDP. The population density was 5,093.2 people per square mile (1,964.3/km2). There were 7,541 housing units at an average density of 1,811.3 per square mile (699.3/km2). The racial makeup of the CDP was 44.2% White, 16.2% African American, 0.7% Native American, 16.3% Asian, 0.3% Pacific Islander, 16.2% from other races, and 6.2% from two or more races. Hispanic or Latino of any race were 33.2% of the population.
There were 6,945 households, out of which 37.2% had children under the age of 18 living with them, 46.2% were married couples living together, 17.3% had a female householder with no husband present, and 29.2% were non-families. 22.3% of all households were made up of individuals, and 8.2% had someone living alone who was 65 years of age or older. The average household size was 3.06 and the average family size was 3.56.
In the CDP, the population was spread out, with 28.3% under the age of 18, 10.2% from 18 to 24, 30.2% from 25 to 44, 20.7% from 45 to 64, and 10.6% who were 65 years of age or older. The median age was 33 years. For every 100 females, there were 97.2 males. For every 100 females age 18 and over, there were 94.2 males.
The median income for a household in the CDP was $50,945, and the median income for a family was $55,945. Males had a median income of $41,813 versus $32,917 for females. The per capita income for the CDP was $20,945. About 8.2% of families and 10.2% of the population were below the poverty line, including 14.2% of those under age 18 and 6.2% of those age 65 or over.
Common Questions
What is the Total Population of Bay Point?
Total Population of Bay Point is 24,407.
What is the Total Male Population of Bay Point?
Total Male Population of Bay Point is 13,024.
What is the Total Female Population of Bay Point?
Total Female Population of Bay Point is 11,383.
What is the Ratio of Males per 100 Females in Bay Point?
There are 114.42 Males per 100 Females in Bay Point.
What is the Ratio of Females per 100 Males in Bay Point?
There are 87.40 Females per 100 Males in Bay Point.
What is the Median Population Age in Bay Point?
Median Population Age in Bay Point is 32.5 Years.
What is the Average Family Size in Bay Point
Average Family Size in Bay Point is 3.9 People.
What is the Average Household Size in Bay Point
Average Household Size in Bay Point is 3.7 People.
What is Per Capita Income in Bay Point?
Per Capita income in Bay Point is $28,414.
What is the Median Family Income in Bay Point?
Median Family Income in Bay Point is $75,849.
What is the Median Household income in Bay Point?
Median Household Income in Bay Point is $79,226.
What is Income or Wage Gap in Bay Point?
Income or Wage Gap in Bay Point is 32.2%.
Women in Bay Point earn 67.8 cents for every dollar earned by a man.
What is Inequality or Gini Index in Bay Point?
Inequality or Gini Index in Bay Point is 0.41.
How Large is the Labor Force in Bay Point?
There are 12,810 People in the Labor Forcein in Bay Point.
What is the Percentage of People in the Labor Force in Bay Point?
68.6% of People are in the Labor Force in Bay Point.
What is the Unemployment Rate in Bay Point?
Unemployment Rate in Bay Point is 9.9%.