August, CA
August Map
August Overview
9,089
TOTAL POPULATION
4,598
MALE POPULATION
4,491
FEMALE POPULATION
102.38
MALES / 100 FEMALES
97.67
FEMALES / 100 MALES
26.9
MEDIAN AGE
5.0
AVG FAMILY SIZE
3.9
AVG HOUSEHOLD SIZE
$19,774
PER CAPITA INCOME
$63,235
AVG FAMILY INCOME
$51,733
AVG HOUSEHOLD INCOME
25.0%
WAGE / INCOME GAP [ % ]
75.0¢/ $1
WAGE / INCOME GAP [ $ ]
0.47
INEQUALITY / GINI INDEX
3,650
LABOR FORCE [ PEOPLE ]
59.4%
PERCENT IN LABOR FORCE
8.5%
UNEMPLOYMENT RATE
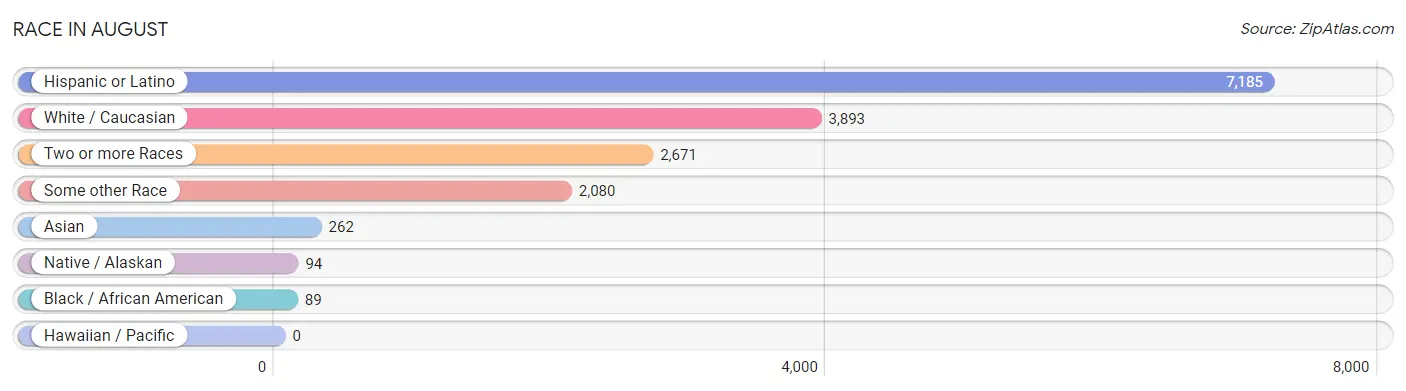
Race in August
The most populous races in August are Hispanic or Latino (7,185 | 79.0%), White / Caucasian (3,893 | 42.8%), and Two or more Races (2,671 | 29.4%).
| Race | # Population | % Population |
| Asian | 262 | 2.9% |
| Black / African American | 89 | 1.0% |
| Hawaiian / Pacific | 0 | 0.0% |
| Hispanic or Latino | 7,185 | 79.0% |
| Native / Alaskan | 94 | 1.0% |
| White / Caucasian | 3,893 | 42.8% |
| Two or more Races | 2,671 | 29.4% |
| Some other Race | 2,080 | 22.9% |
| Total | 9,089 | 100.0% |
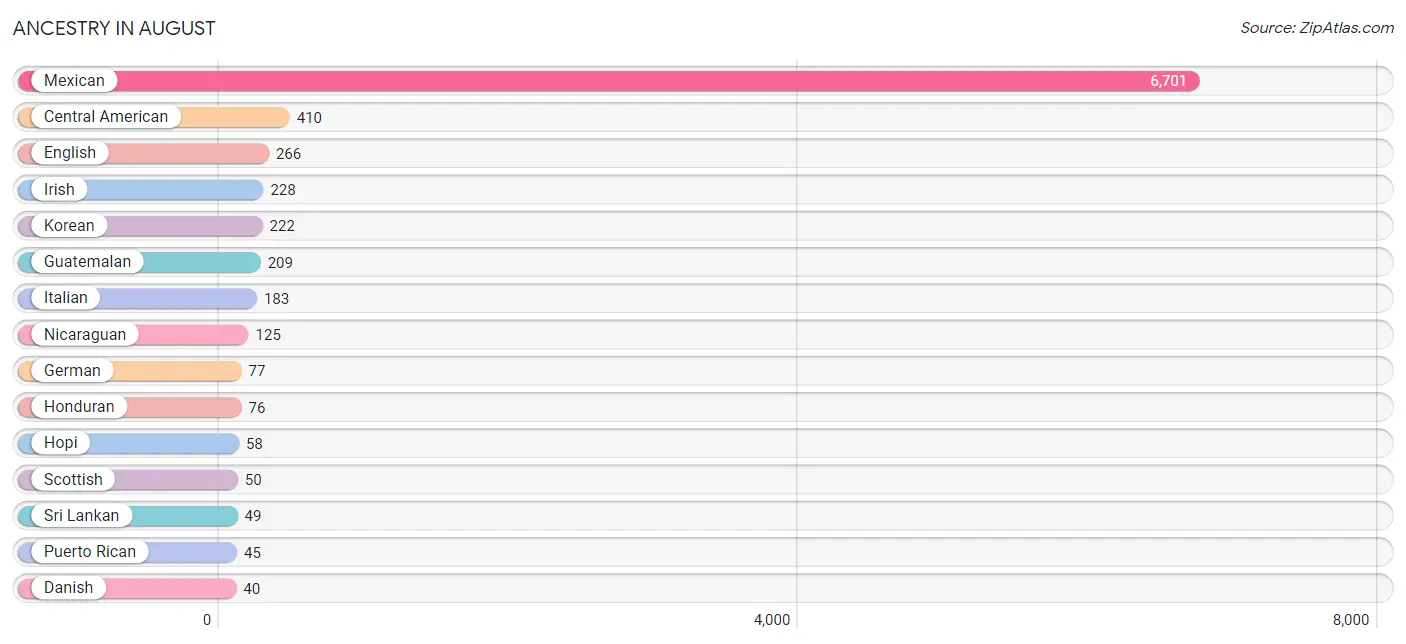
Ancestry in August
The most populous ancestries reported in August are Mexican (6,701 | 73.7%), Central American (410 | 4.5%), English (266 | 2.9%), Irish (228 | 2.5%), and Korean (222 | 2.4%), together accounting for 86.1% of all August residents.
| Ancestry | # Population | % Population |
| American | 33 | 0.4% |
| Basque | 6 | 0.1% |
| Central American | 410 | 4.5% |
| Central American Indian | 18 | 0.2% |
| Cherokee | 12 | 0.1% |
| Choctaw | 8 | 0.1% |
| Danish | 40 | 0.4% |
| English | 266 | 2.9% |
| French | 33 | 0.4% |
| German | 77 | 0.9% |
| Guatemalan | 209 | 2.3% |
| Honduran | 76 | 0.8% |
| Hopi | 58 | 0.6% |
| Hungarian | 11 | 0.1% |
| Irish | 228 | 2.5% |
| Italian | 183 | 2.0% |
| Japanese | 26 | 0.3% |
| Korean | 222 | 2.4% |
| Malaysian | 10 | 0.1% |
| Mexican | 6,701 | 73.7% |
| Mexican American Indian | 15 | 0.2% |
| Native Hawaiian | 12 | 0.1% |
| Nicaraguan | 125 | 1.4% |
| Northern European | 13 | 0.1% |
| Polish | 11 | 0.1% |
| Portuguese | 36 | 0.4% |
| Puerto Rican | 45 | 0.5% |
| Scotch-Irish | 21 | 0.2% |
| Scottish | 50 | 0.5% |
| Sri Lankan | 49 | 0.5% |
| Swiss | 7 | 0.1% | View All 31 Rows |
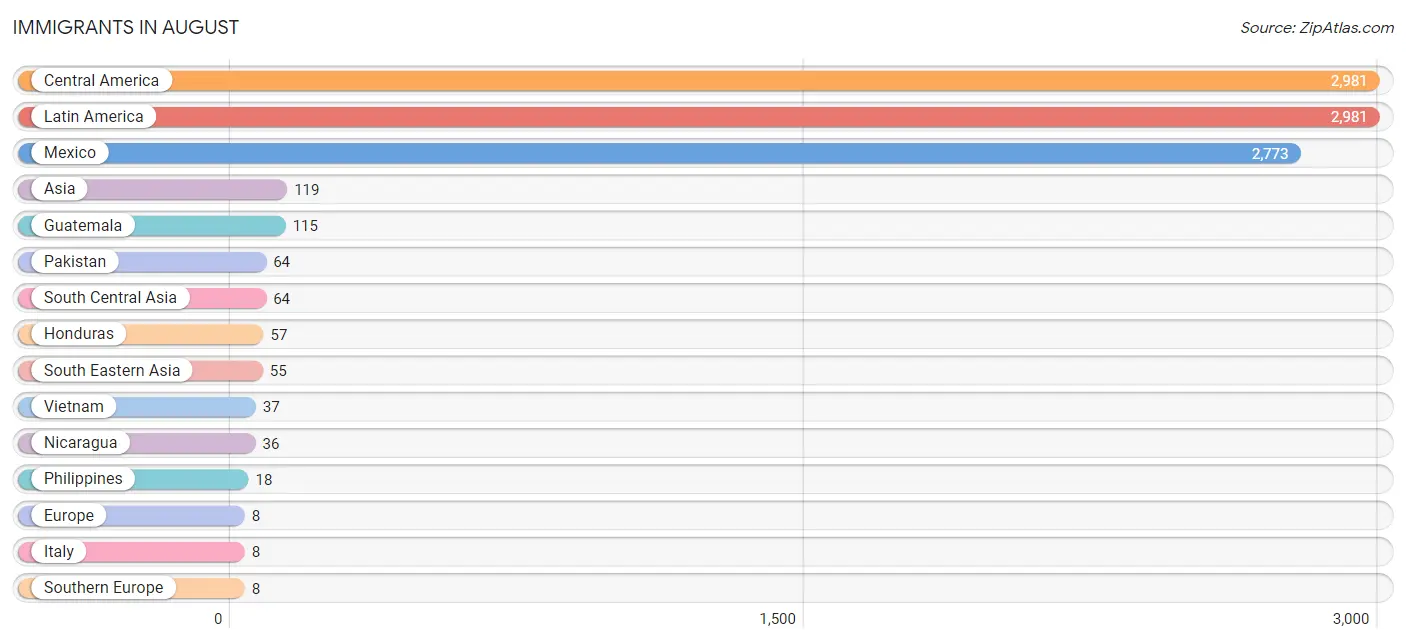
Immigrants in August
The most numerous immigrant groups reported in August came from Central America (2,981 | 32.8%), Latin America (2,981 | 32.8%), Mexico (2,773 | 30.5%), Asia (119 | 1.3%), and Guatemala (115 | 1.3%), together accounting for 98.7% of all August residents.
| Immigration Origin | # Population | % Population |
| Asia | 119 | 1.3% |
| Central America | 2,981 | 32.8% |
| Europe | 8 | 0.1% |
| Guatemala | 115 | 1.3% |
| Honduras | 57 | 0.6% |
| Italy | 8 | 0.1% |
| Latin America | 2,981 | 32.8% |
| Mexico | 2,773 | 30.5% |
| Nicaragua | 36 | 0.4% |
| Pakistan | 64 | 0.7% |
| Philippines | 18 | 0.2% |
| South Central Asia | 64 | 0.7% |
| South Eastern Asia | 55 | 0.6% |
| Southern Europe | 8 | 0.1% |
| Vietnam | 37 | 0.4% | View All 15 Rows |
Sex and Age in August
Sex and Age in August
The most populous age groups in August are 20 to 24 Years (714 | 15.5%) for men and 25 to 29 Years (587 | 13.1%) for women.
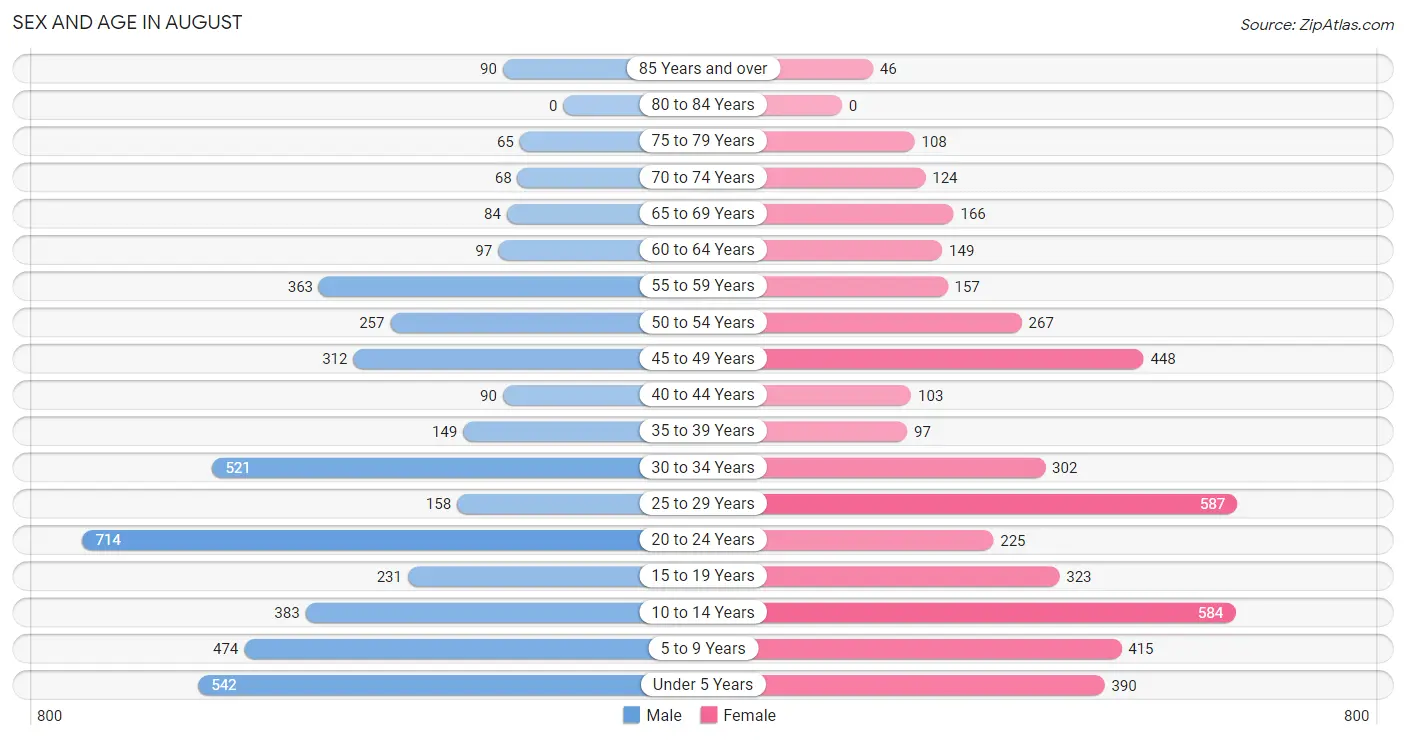
| Age Bracket | Male | Female |
| Under 5 Years | 542 (11.8%) | 390 (8.7%) |
| 5 to 9 Years | 474 (10.3%) | 415 (9.2%) |
| 10 to 14 Years | 383 (8.3%) | 584 (13.0%) |
| 15 to 19 Years | 231 (5.0%) | 323 (7.2%) |
| 20 to 24 Years | 714 (15.5%) | 225 (5.0%) |
| 25 to 29 Years | 158 (3.4%) | 587 (13.1%) |
| 30 to 34 Years | 521 (11.3%) | 302 (6.7%) |
| 35 to 39 Years | 149 (3.2%) | 97 (2.2%) |
| 40 to 44 Years | 90 (2.0%) | 103 (2.3%) |
| 45 to 49 Years | 312 (6.8%) | 448 (10.0%) |
| 50 to 54 Years | 257 (5.6%) | 267 (5.9%) |
| 55 to 59 Years | 363 (7.9%) | 157 (3.5%) |
| 60 to 64 Years | 97 (2.1%) | 149 (3.3%) |
| 65 to 69 Years | 84 (1.8%) | 166 (3.7%) |
| 70 to 74 Years | 68 (1.5%) | 124 (2.8%) |
| 75 to 79 Years | 65 (1.4%) | 108 (2.4%) |
| 80 to 84 Years | 0 (0.0%) | 0 (0.0%) |
| 85 Years and over | 90 (2.0%) | 46 (1.0%) |
| Total | 4,598 (100.0%) | 4,491 (100.0%) |
Families and Households in August
Median Family Size in August
The median family size in August is 4.99 persons per family, with married-couple families (1,152 | 72.7%) accounting for the largest median family size of 5.45 persons per family. On the other hand, single female/mother families (358 | 22.6%) represent the smallest median family size with 3.62 persons per family.
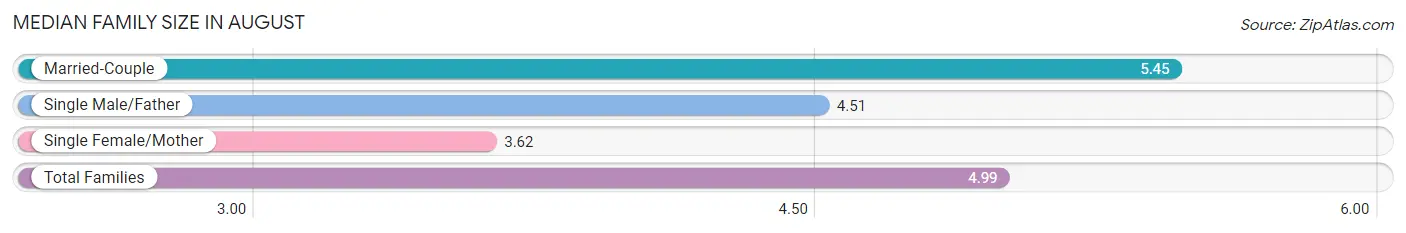
| Family Type | # Families | Family Size |
| Married-Couple | 1,152 (72.7%) | 5.45 |
| Single Male/Father | 74 (4.7%) | 4.51 |
| Single Female/Mother | 358 (22.6%) | 3.62 |
| Total Families | 1,584 (100.0%) | 4.99 |
Median Household Size in August
The median household size in August is 3.93 persons per household, with married-couple households (1,152 | 50.3%) accounting for the largest median household size of 5.52 persons per household. non-family households (704 | 30.8%) represent the smallest median household size with 1.22 persons per household.
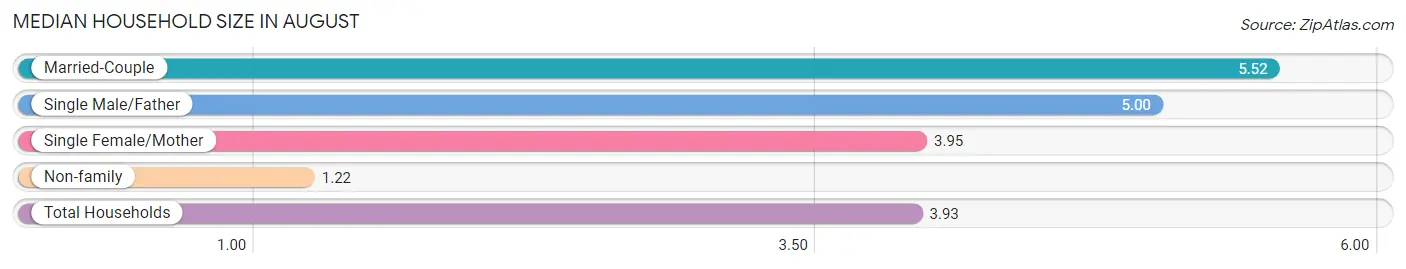
| Household Type | # Households | Household Size |
| Married-Couple | 1,152 (50.3%) | 5.52 |
| Single Male/Father | 74 (3.2%) | 5.00 |
| Single Female/Mother | 358 (15.7%) | 3.95 |
| Non-family | 704 (30.8%) | 1.22 |
| Total Households | 2,288 (100.0%) | 3.93 |
Household Size by Marriage Status in August
Out of a total of 2,288 households in August, 1,584 (69.2%) are family households, while 704 (30.8%) are nonfamily households. The most numerous type of family households are 4-person households, comprising 419, and the most common type of nonfamily households are 1-person households, comprising 576.
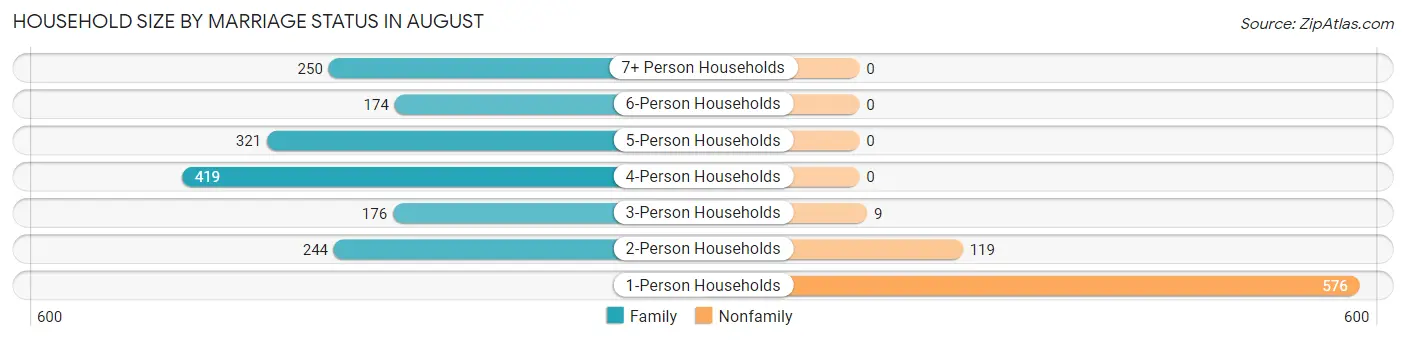
| Household Size | Family Households | Nonfamily Households |
| 1-Person Households | - | 576 (25.2%) |
| 2-Person Households | 244 (10.7%) | 119 (5.2%) |
| 3-Person Households | 176 (7.7%) | 9 (0.4%) |
| 4-Person Households | 419 (18.3%) | 0 (0.0%) |
| 5-Person Households | 321 (14.0%) | 0 (0.0%) |
| 6-Person Households | 174 (7.6%) | 0 (0.0%) |
| 7+ Person Households | 250 (10.9%) | 0 (0.0%) |
| Total | 1,584 (69.2%) | 704 (30.8%) |
Female Fertility in August
Fertility by Age in August
Average fertility rate in August is 42.0 births per 1,000 women. Women in the age bracket of 20 to 34 years have the highest fertility rate with 71.0 births per 1,000 women. Women in the age bracket of 20 to 34 years acount for 85.9% of all women with births.
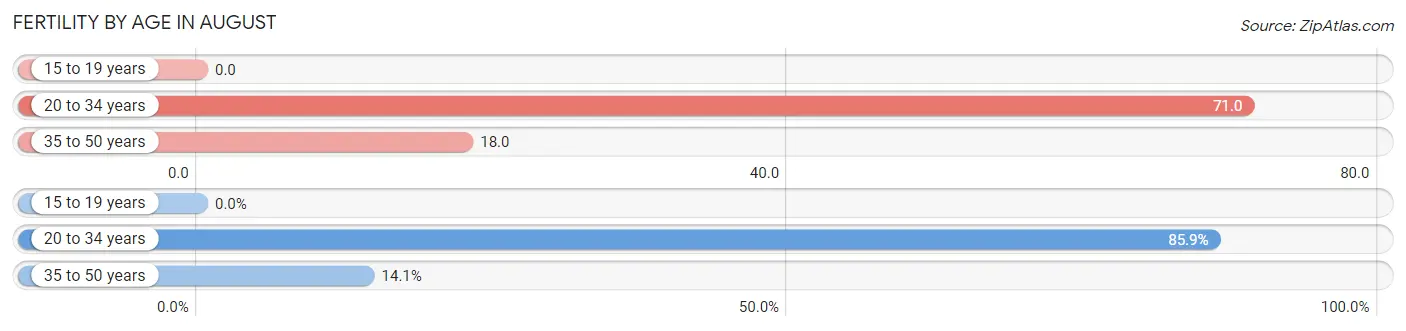
| Age Bracket | Women with Births | Births / 1,000 Women |
| 15 to 19 years | 0 (0.0%) | 0.0 |
| 20 to 34 years | 79 (85.9%) | 71.0 |
| 35 to 50 years | 13 (14.1%) | 18.0 |
| Total | 92 (100.0%) | 42.0 |
Fertility by Age by Marriage Status in August
94.6% of women with births (92) in August are married. The highest percentage of unmarried women with births falls into 20 to 34 years age bracket with 6.3% of them unmarried at the time of birth, while the lowest percentage of unmarried women with births belong to 35 to 50 years age bracket with 0.0% of them unmarried.
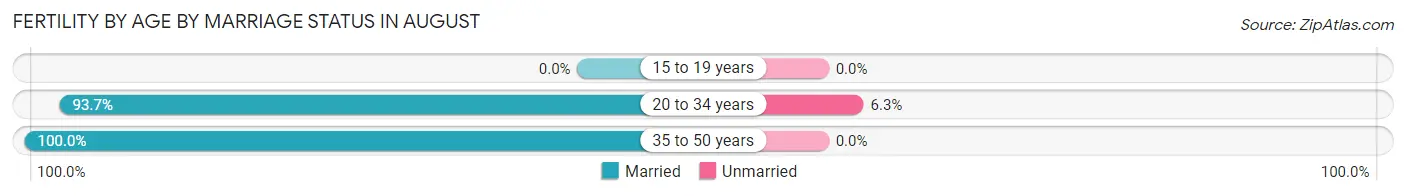
| Age Bracket | Married | Unmarried |
| 15 to 19 years | 0 (0.0%) | 0 (0.0%) |
| 20 to 34 years | 74 (93.7%) | 5 (6.3%) |
| 35 to 50 years | 13 (100.0%) | 0 (0.0%) |
| Total | 87 (94.6%) | 5 (5.4%) |
Fertility by Education in August
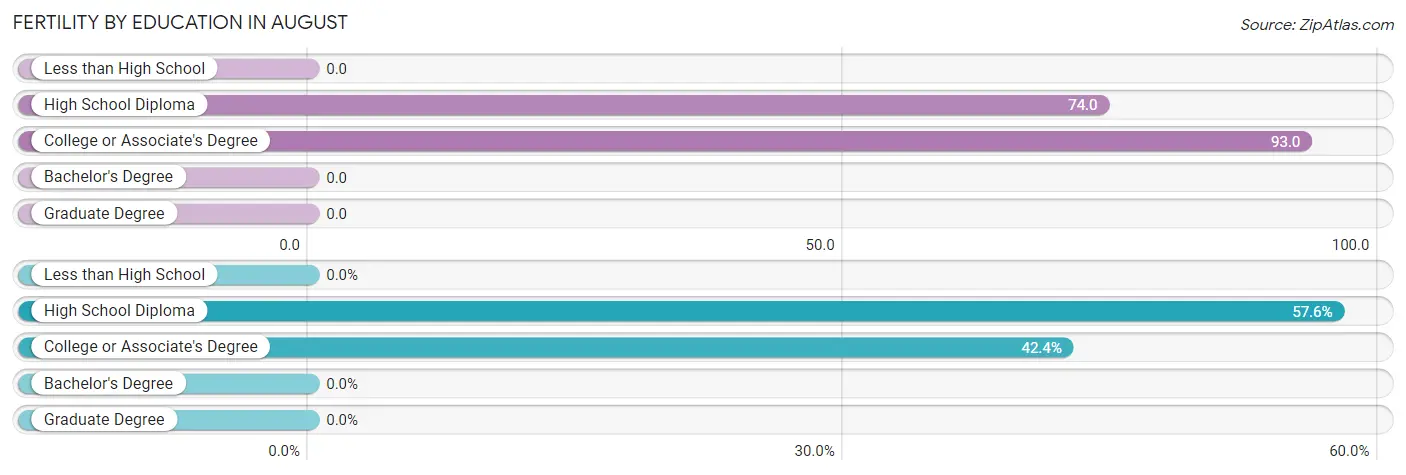
| Educational Attainment | Women with Births | Births / 1,000 Women |
| Less than High School | 0 (0.0%) | 0.0 |
| High School Diploma | 53 (57.6%) | 74.0 |
| College or Associate's Degree | 39 (42.4%) | 93.0 |
| Bachelor's Degree | 0 (0.0%) | 0.0 |
| Graduate Degree | 0 (0.0%) | 0.0 |
| Total | 92 (100.0%) | 42.0 |
Fertility by Education by Marriage Status in August
5.4% of women with births in August are unmarried. Women with the educational attainment of high school diploma are most likely to be married with 100.0% of them married at childbirth, while women with the educational attainment of college or associate's degree are least likely to be married with 12.8% of them unmarried at childbirth.
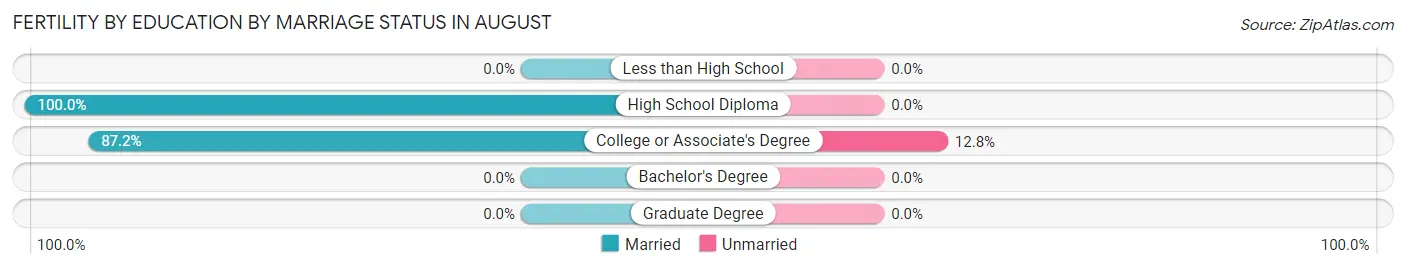
| Educational Attainment | Married | Unmarried |
| Less than High School | 0 (0.0%) | 0 (0.0%) |
| High School Diploma | 53 (100.0%) | 0 (0.0%) |
| College or Associate's Degree | 34 (87.2%) | 5 (12.8%) |
| Bachelor's Degree | 0 (0.0%) | 0 (0.0%) |
| Graduate Degree | 0 (0.0%) | 0 (0.0%) |
| Total | 87 (94.6%) | 5 (5.4%) |
Income in August
Income Overview in August
Per Capita Income in August is $19,774, while median incomes of families and households are $63,235 and $51,733 respectively.
| Characteristic | Number | Measure |
| Per Capita Income | 9,089 | $19,774 |
| Median Family Income | 1,584 | $63,235 |
| Mean Family Income | 1,584 | $88,487 |
| Median Household Income | 2,288 | $51,733 |
| Mean Household Income | 2,288 | $75,539 |
| Income Deficit | 1,584 | $0 |
| Wage / Income Gap (%) | 9,089 | 24.96% |
| Wage / Income Gap ($) | 9,089 | 75.04¢ per $1 |
| Gini / Inequality Index | 9,089 | 0.47 |
Earnings by Sex in August
Average Earnings in August are $27,668, $29,440 for men and $22,091 for women, a difference of 25.0%.
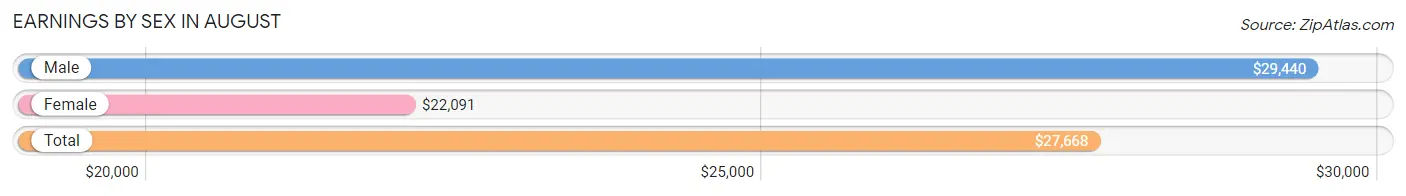
| Sex | Number | Average Earnings |
| Male | 2,470 (65.3%) | $29,440 |
| Female | 1,310 (34.7%) | $22,091 |
| Total | 3,780 (100.0%) | $27,668 |
Earnings by Sex by Income Bracket in August
The most common earnings brackets in August are $75,000 to $99,999 for men (226 | 9.1%) and $15,000 to $17,499 for women (191 | 14.6%).
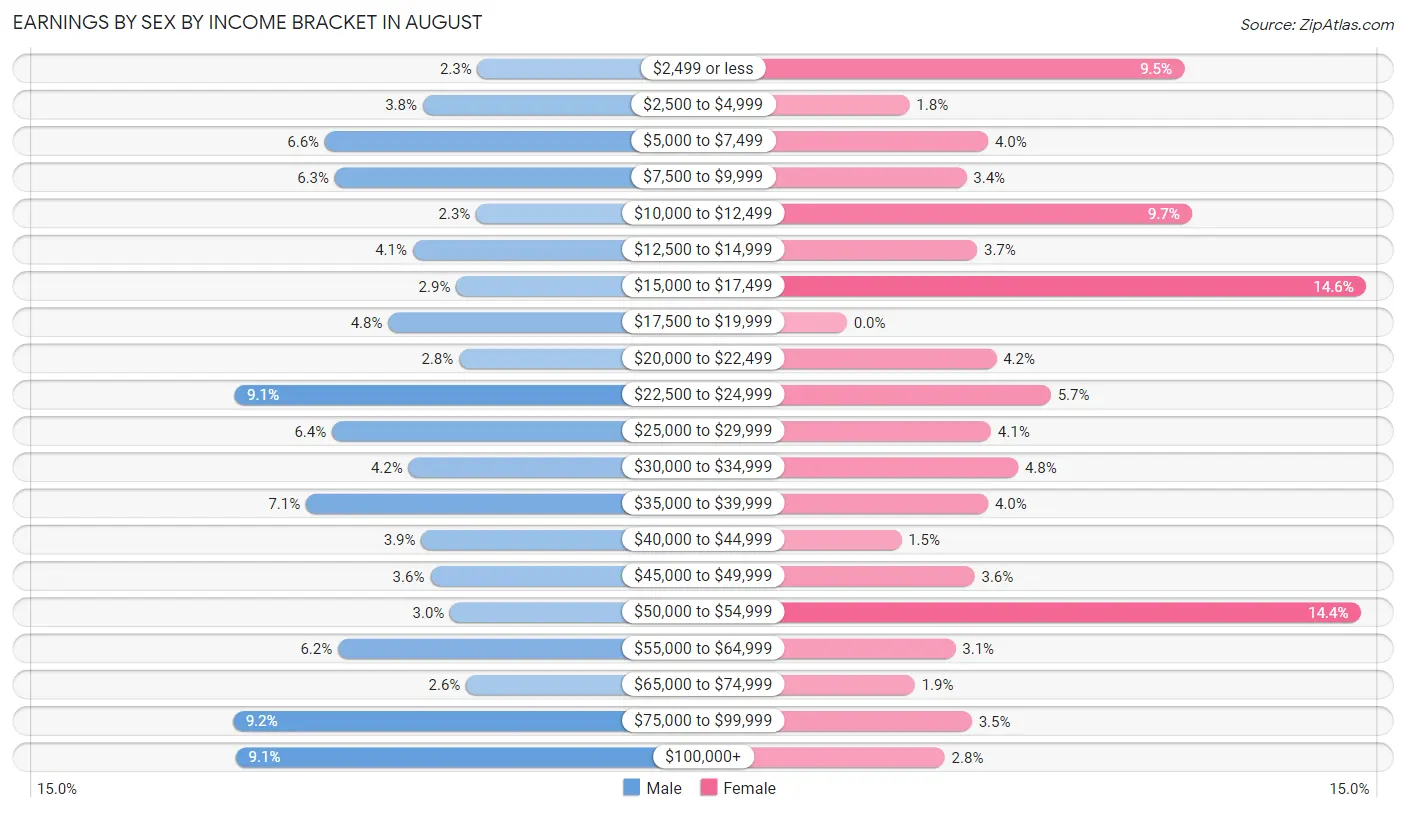
| Income | Male | Female |
| $2,499 or less | 56 (2.3%) | 124 (9.5%) |
| $2,500 to $4,999 | 94 (3.8%) | 23 (1.8%) |
| $5,000 to $7,499 | 162 (6.6%) | 52 (4.0%) |
| $7,500 to $9,999 | 155 (6.3%) | 44 (3.4%) |
| $10,000 to $12,499 | 57 (2.3%) | 127 (9.7%) |
| $12,500 to $14,999 | 101 (4.1%) | 48 (3.7%) |
| $15,000 to $17,499 | 71 (2.9%) | 191 (14.6%) |
| $17,500 to $19,999 | 118 (4.8%) | 0 (0.0%) |
| $20,000 to $22,499 | 69 (2.8%) | 55 (4.2%) |
| $22,500 to $24,999 | 225 (9.1%) | 75 (5.7%) |
| $25,000 to $29,999 | 157 (6.4%) | 53 (4.1%) |
| $30,000 to $34,999 | 104 (4.2%) | 63 (4.8%) |
| $35,000 to $39,999 | 175 (7.1%) | 52 (4.0%) |
| $40,000 to $44,999 | 95 (3.8%) | 20 (1.5%) |
| $45,000 to $49,999 | 89 (3.6%) | 47 (3.6%) |
| $50,000 to $54,999 | 75 (3.0%) | 189 (14.4%) |
| $55,000 to $64,999 | 153 (6.2%) | 40 (3.0%) |
| $65,000 to $74,999 | 64 (2.6%) | 25 (1.9%) |
| $75,000 to $99,999 | 226 (9.1%) | 46 (3.5%) |
| $100,000+ | 224 (9.1%) | 36 (2.8%) |
| Total | 2,470 (100.0%) | 1,310 (100.0%) |
Earnings by Sex by Educational Attainment in August
Average earnings in August are $40,597 for men and $22,059 for women, a difference of 45.7%. Men with an educational attainment of college or associate's degree enjoy the highest average annual earnings of $62,386, while those with less than high school education earn the least with $27,935. Women with an educational attainment of college or associate's degree earn the most with the average annual earnings of $37,792, while those with less than high school education have the smallest earnings of $16,844.
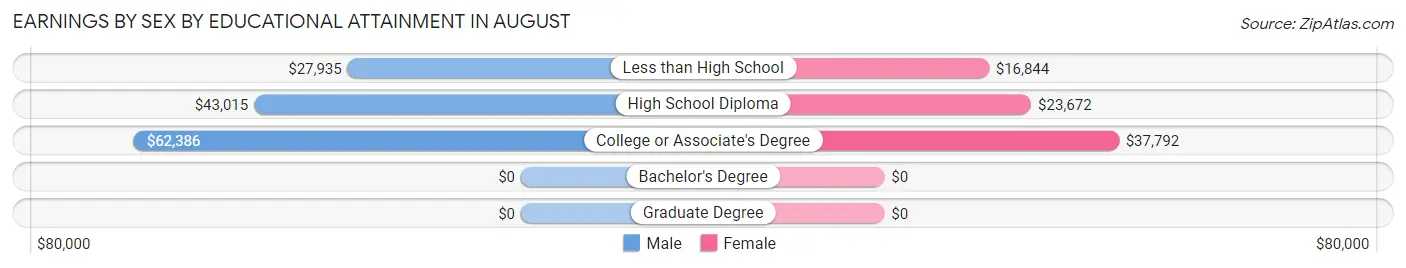
| Educational Attainment | Male Income | Female Income |
| Less than High School | $27,935 | $16,844 |
| High School Diploma | $43,015 | $23,672 |
| College or Associate's Degree | $62,386 | $37,792 |
| Bachelor's Degree | - | - |
| Graduate Degree | - | - |
| Total | $40,597 | $22,059 |
Family Income in August
Family Income Brackets in August
According to the August family income data, there are 303 families falling into the $100,000 to $149,999 income range, which is the most common income bracket and makes up 19.1% of all families. Conversely, the $10,000 to $14,999 income bracket is the least frequent group with only 17 families (1.1%) belonging to this category.
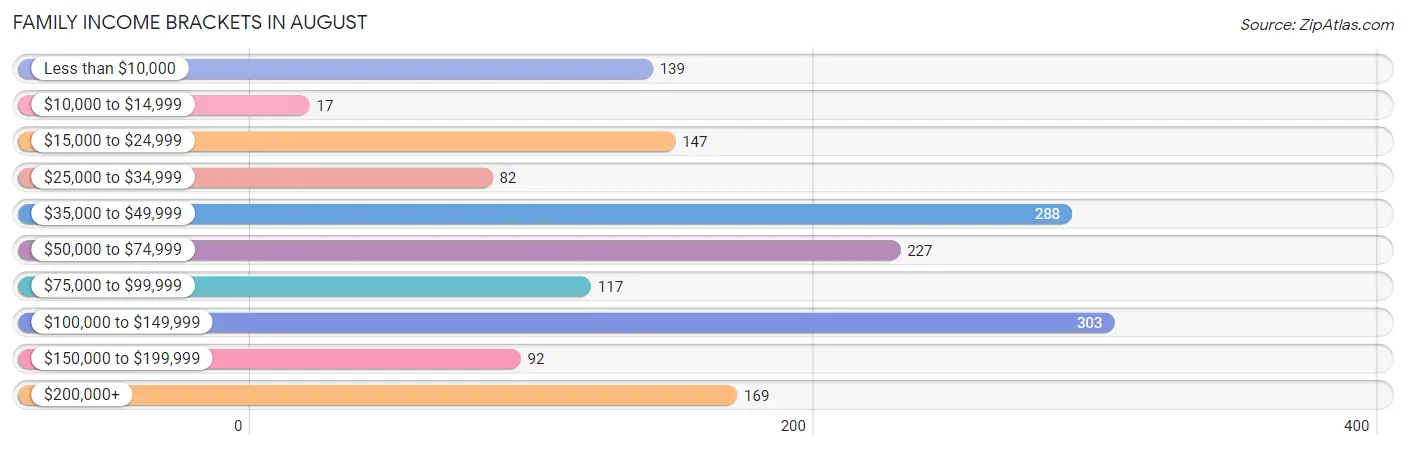
| Income Bracket | # Families | % Families |
| Less than $10,000 | 139 | 8.8% |
| $10,000 to $14,999 | 17 | 1.1% |
| $15,000 to $24,999 | 147 | 9.3% |
| $25,000 to $34,999 | 82 | 5.2% |
| $35,000 to $49,999 | 288 | 18.2% |
| $50,000 to $74,999 | 227 | 14.3% |
| $75,000 to $99,999 | 117 | 7.4% |
| $100,000 to $149,999 | 303 | 19.1% |
| $150,000 to $199,999 | 92 | 5.8% |
| $200,000+ | 169 | 10.7% |
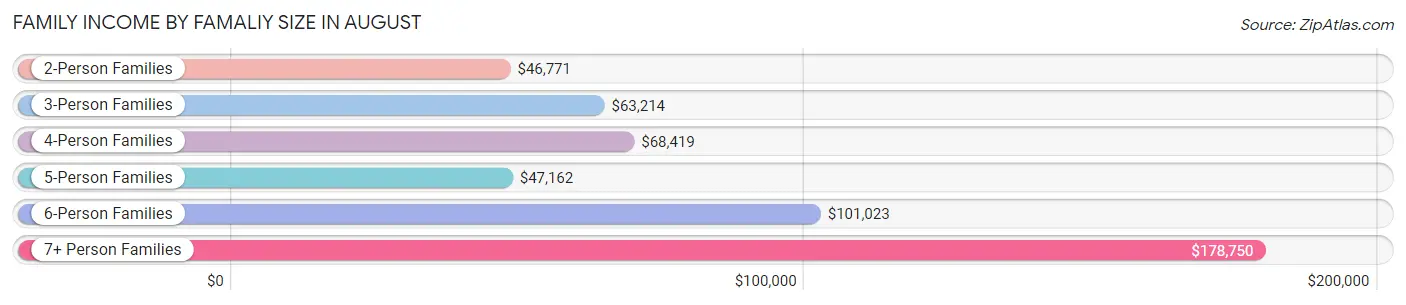
Family Income by Famaliy Size in August
7+ person families (250 | 15.8%) account for the highest median family income in August with $178,750 per family, while 7+ person families (250 | 15.8%) have the highest median income of $25,536 per family member.
| Income Bracket | # Families | Median Income |
| 2-Person Families | 261 (16.5%) | $46,771 |
| 3-Person Families | 216 (13.6%) | $63,214 |
| 4-Person Families | 445 (28.1%) | $68,419 |
| 5-Person Families | 286 (18.1%) | $47,162 |
| 6-Person Families | 126 (8.0%) | $101,023 |
| 7+ Person Families | 250 (15.8%) | $178,750 |
| Total | 1,584 (100.0%) | $63,235 |
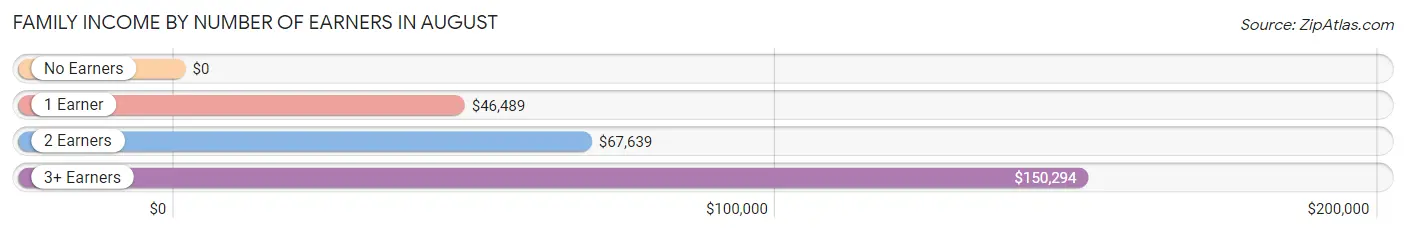
Family Income by Number of Earners in August
| Number of Earners | # Families | Median Income |
| No Earners | 168 (10.6%) | $0 |
| 1 Earner | 547 (34.5%) | $46,489 |
| 2 Earners | 489 (30.9%) | $67,639 |
| 3+ Earners | 380 (24.0%) | $150,294 |
| Total | 1,584 (100.0%) | $63,235 |
Household Income in August
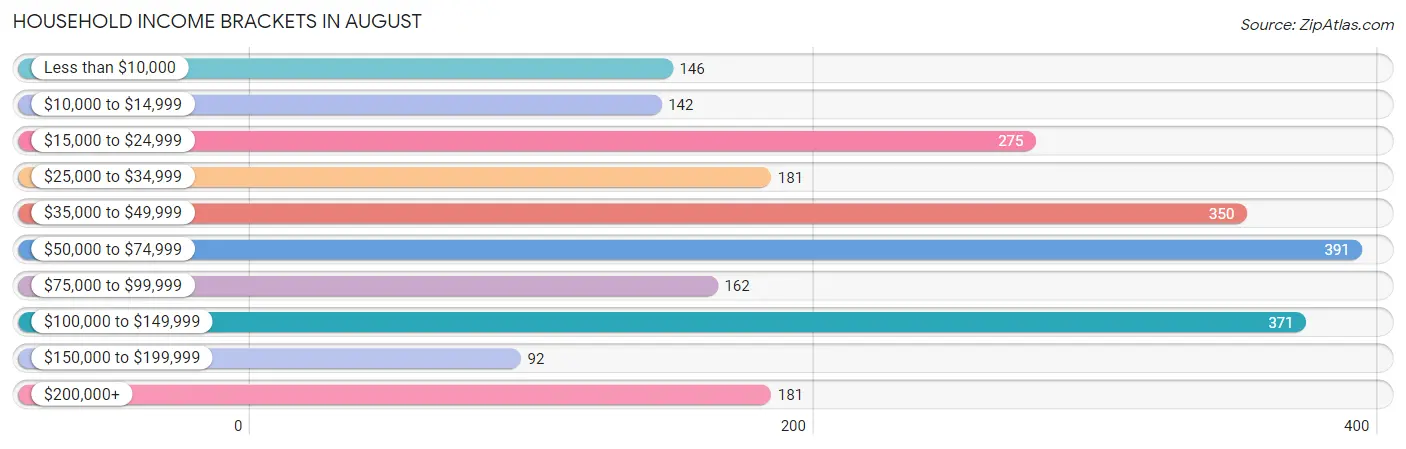
Household Income Brackets in August
With 391 households falling in the category, the $50,000 to $74,999 income range is the most frequent in August, accounting for 17.1% of all households. In contrast, only 92 households (4.0%) fall into the $150,000 to $199,999 income bracket, making it the least populous group.
| Income Bracket | # Households | % Households |
| Less than $10,000 | 146 | 6.4% |
| $10,000 to $14,999 | 142 | 6.2% |
| $15,000 to $24,999 | 275 | 12.0% |
| $25,000 to $34,999 | 181 | 7.9% |
| $35,000 to $49,999 | 350 | 15.3% |
| $50,000 to $74,999 | 391 | 17.1% |
| $75,000 to $99,999 | 162 | 7.1% |
| $100,000 to $149,999 | 371 | 16.2% |
| $150,000 to $199,999 | 92 | 4.0% |
| $200,000+ | 181 | 7.9% |
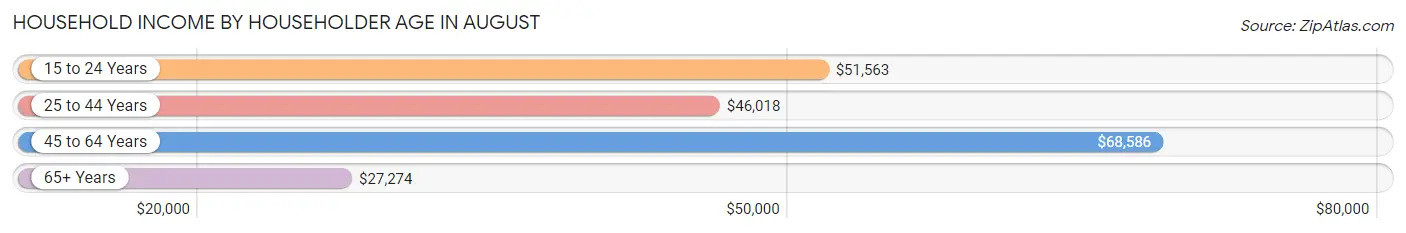
Household Income by Householder Age in August
The median household income in August is $51,733, with the highest median household income of $68,586 found in the 45 to 64 years age bracket for the primary householder. A total of 939 households (41.0%) fall into this category. Meanwhile, the 65+ years age bracket for the primary householder has the lowest median household income of $27,274, with 563 households (24.6%) in this group.
| Income Bracket | # Households | Median Income |
| 15 to 24 Years | 65 (2.8%) | $51,563 |
| 25 to 44 Years | 721 (31.5%) | $46,018 |
| 45 to 64 Years | 939 (41.0%) | $68,586 |
| 65+ Years | 563 (24.6%) | $27,274 |
| Total | 2,288 (100.0%) | $51,733 |
Poverty in August
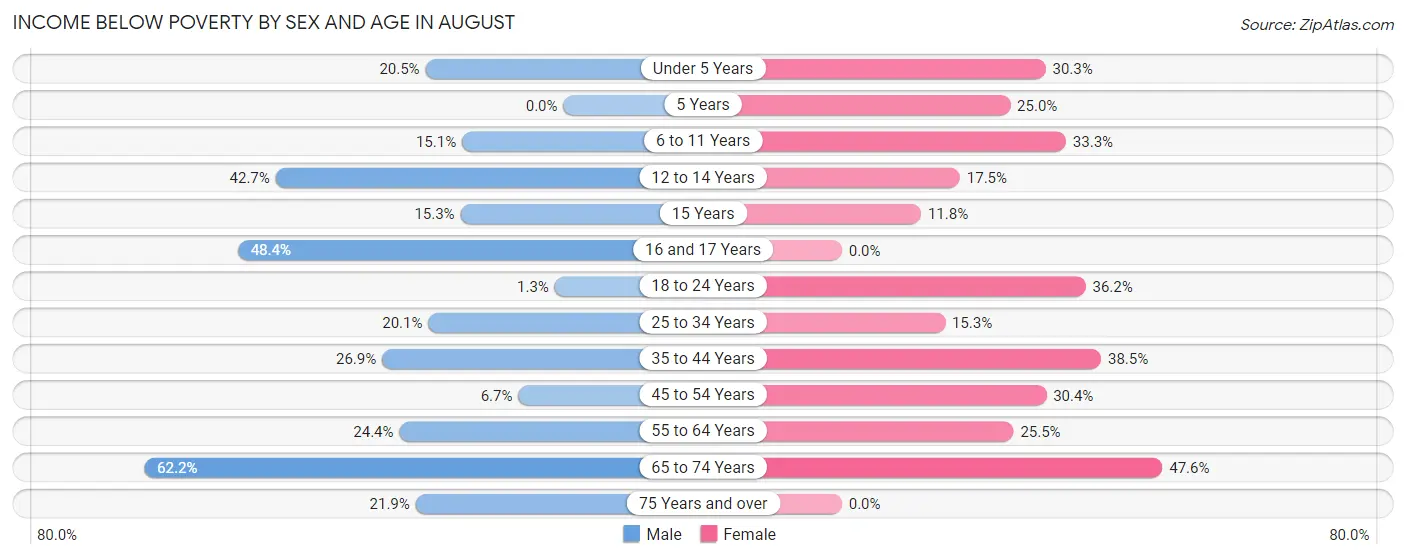
Income Below Poverty by Sex and Age in August
With 18.3% poverty level for males and 26.9% for females among the residents of August, 65 to 74 year old males and 65 to 74 year old females are the most vulnerable to poverty, with 89 males (62.2%) and 138 females (47.6%) in their respective age groups living below the poverty level.
| Age Bracket | Male | Female |
| Under 5 Years | 102 (20.5%) | 118 (30.3%) |
| 5 Years | 0 (0.0%) | 15 (25.0%) |
| 6 to 11 Years | 93 (15.0%) | 210 (33.3%) |
| 12 to 14 Years | 94 (42.7%) | 54 (17.5%) |
| 15 Years | 11 (15.3%) | 10 (11.8%) |
| 16 and 17 Years | 44 (48.3%) | 0 (0.0%) |
| 18 to 24 Years | 10 (1.3%) | 152 (36.2%) |
| 25 to 34 Years | 132 (20.1%) | 135 (15.3%) |
| 35 to 44 Years | 63 (26.9%) | 77 (38.5%) |
| 45 to 54 Years | 37 (6.7%) | 217 (30.3%) |
| 55 to 64 Years | 112 (24.3%) | 78 (25.5%) |
| 65 to 74 Years | 89 (62.2%) | 138 (47.6%) |
| 75 Years and over | 34 (21.9%) | 0 (0.0%) |
| Total | 821 (18.3%) | 1,204 (26.9%) |
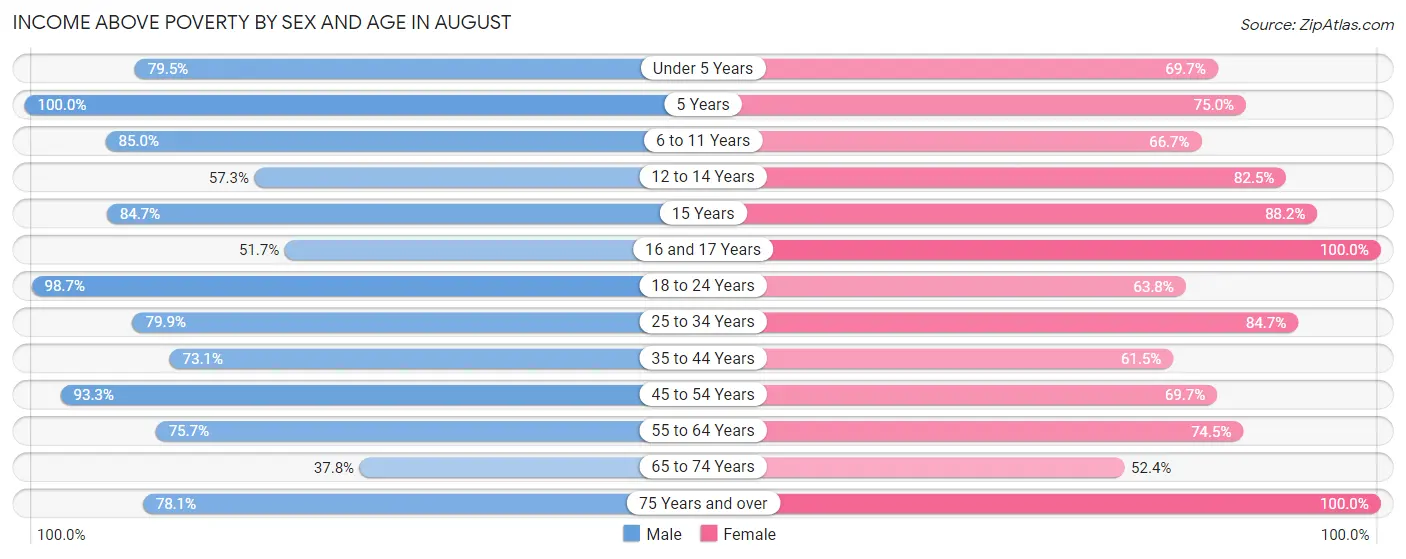
Income Above Poverty by Sex and Age in August
According to the poverty statistics in August, males aged 5 years and females aged 16 and 17 years are the age groups that are most secure financially, with 100.0% of males and 100.0% of females in these age groups living above the poverty line.
| Age Bracket | Male | Female |
| Under 5 Years | 396 (79.5%) | 272 (69.7%) |
| 5 Years | 19 (100.0%) | 45 (75.0%) |
| 6 to 11 Years | 525 (85.0%) | 421 (66.7%) |
| 12 to 14 Years | 126 (57.3%) | 254 (82.5%) |
| 15 Years | 61 (84.7%) | 75 (88.2%) |
| 16 and 17 Years | 47 (51.6%) | 40 (100.0%) |
| 18 to 24 Years | 764 (98.7%) | 268 (63.8%) |
| 25 to 34 Years | 526 (79.9%) | 746 (84.7%) |
| 35 to 44 Years | 171 (73.1%) | 123 (61.5%) |
| 45 to 54 Years | 516 (93.3%) | 498 (69.7%) |
| 55 to 64 Years | 348 (75.6%) | 228 (74.5%) |
| 65 to 74 Years | 54 (37.8%) | 152 (52.4%) |
| 75 Years and over | 121 (78.1%) | 154 (100.0%) |
| Total | 3,674 (81.7%) | 3,276 (73.1%) |
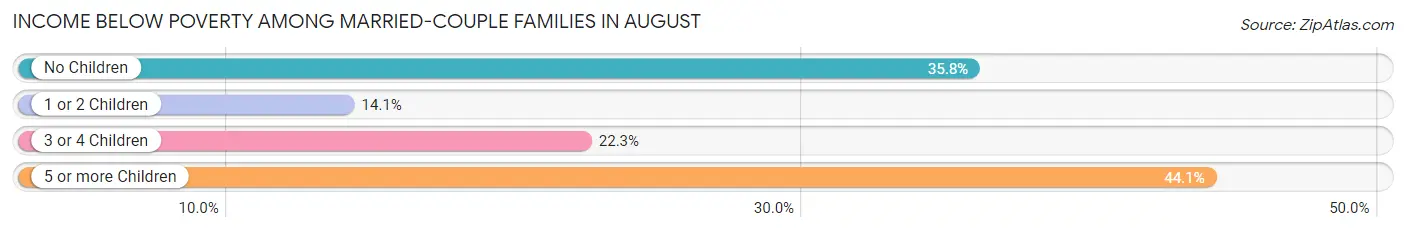
Income Below Poverty Among Married-Couple Families in August
The poverty statistics for married-couple families in August show that 23.9% or 275 of the total 1,152 families live below the poverty line. Families with 5 or more children have the highest poverty rate of 44.1%, comprising of 26 families. On the other hand, families with 1 or 2 children have the lowest poverty rate of 14.1%, which includes 62 families.
| Children | Above Poverty | Below Poverty |
| No Children | 197 (64.2%) | 110 (35.8%) |
| 1 or 2 Children | 379 (85.9%) | 62 (14.1%) |
| 3 or 4 Children | 268 (77.7%) | 77 (22.3%) |
| 5 or more Children | 33 (55.9%) | 26 (44.1%) |
| Total | 877 (76.1%) | 275 (23.9%) |
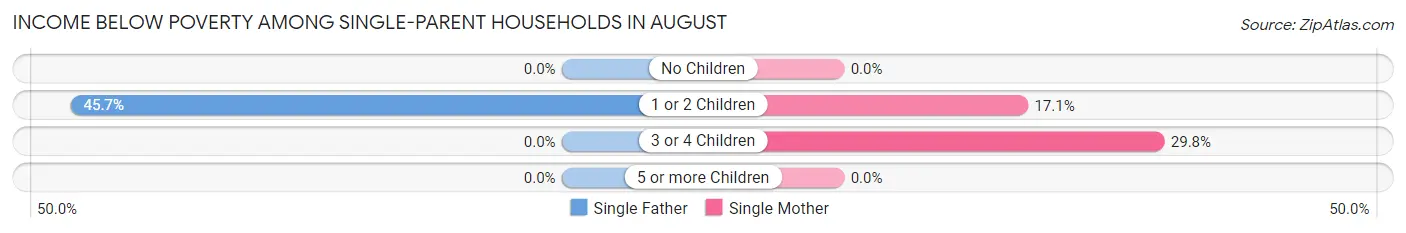
Income Below Poverty Among Single-Parent Households in August
According to the poverty data in August, 21.6% or 16 single-father households and 11.7% or 42 single-mother households are living below the poverty line. Among single-father households, those with 1 or 2 children have the highest poverty rate, with 16 households (45.7%) experiencing poverty. Likewise, among single-mother households, those with 3 or 4 children have the highest poverty rate, with 17 households (29.8%) falling below the poverty line.
| Children | Single Father | Single Mother |
| No Children | 0 (0.0%) | 0 (0.0%) |
| 1 or 2 Children | 16 (45.7%) | 25 (17.1%) |
| 3 or 4 Children | 0 (0.0%) | 17 (29.8%) |
| 5 or more Children | 0 (0.0%) | 0 (0.0%) |
| Total | 16 (21.6%) | 42 (11.7%) |
Income Below Poverty Among Married-Couple vs Single-Parent Households in August
The poverty data for August shows that 275 of the married-couple family households (23.9%) and 58 of the single-parent households (13.4%) are living below the poverty level. Within the married-couple family households, those with 5 or more children have the highest poverty rate, with 26 households (44.1%) falling below the poverty line. Among the single-parent households, those with 3 or 4 children have the highest poverty rate, with 17 household (28.3%) living below poverty.
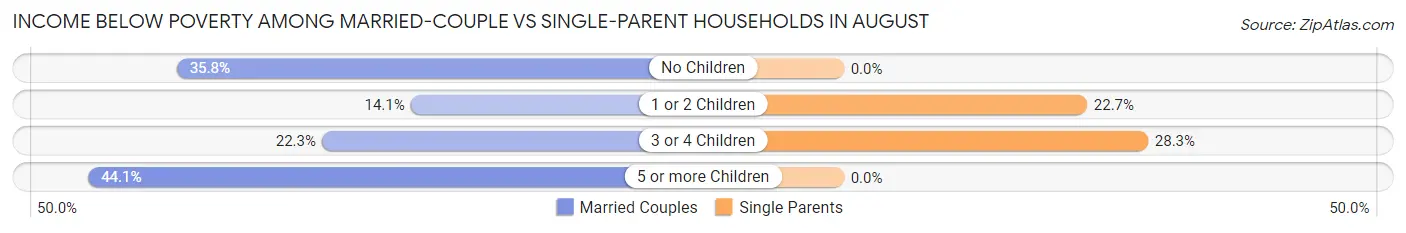
| Children | Married-Couple Families | Single-Parent Households |
| No Children | 110 (35.8%) | 0 (0.0%) |
| 1 or 2 Children | 62 (14.1%) | 41 (22.7%) |
| 3 or 4 Children | 77 (22.3%) | 17 (28.3%) |
| 5 or more Children | 26 (44.1%) | 0 (0.0%) |
| Total | 275 (23.9%) | 58 (13.4%) |
Employment Characteristics in August
Employment by Class of Employer in August
Among the 3,202 employed individuals in August, private company employees (2,557 | 79.9%), self-employed (not incorporated) (259 | 8.1%), and not-for-profit organizations (131 | 4.1%) make up the most common classes of employment.
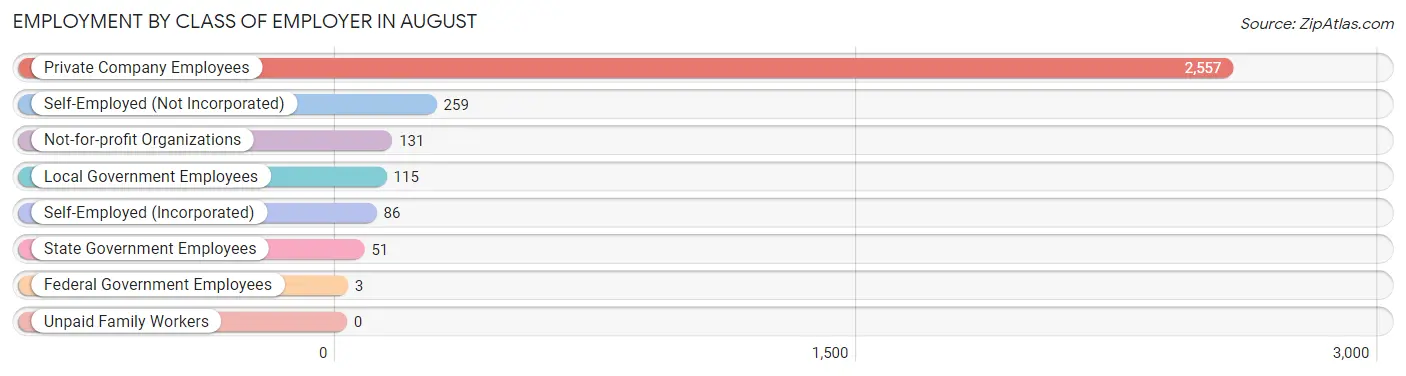
| Employer Class | # Employees | % Employees |
| Private Company Employees | 2,557 | 79.9% |
| Self-Employed (Incorporated) | 86 | 2.7% |
| Self-Employed (Not Incorporated) | 259 | 8.1% |
| Not-for-profit Organizations | 131 | 4.1% |
| Local Government Employees | 115 | 3.6% |
| State Government Employees | 51 | 1.6% |
| Federal Government Employees | 3 | 0.1% |
| Unpaid Family Workers | 0 | 0.0% |
| Total | 3,202 | 100.0% |
Employment Status by Age in August
According to the labor force statistics for August, out of the total population over 16 years of age (6,144), 59.4% or 3,650 individuals are in the labor force, with 8.5% or 310 of them unemployed. The age group with the highest labor force participation rate is 55 to 59 years, with 81.0% or 421 individuals in the labor force. Within the labor force, the 30 to 34 years age range has the highest percentage of unemployed individuals, with 18.2% or 100 of them being unemployed.
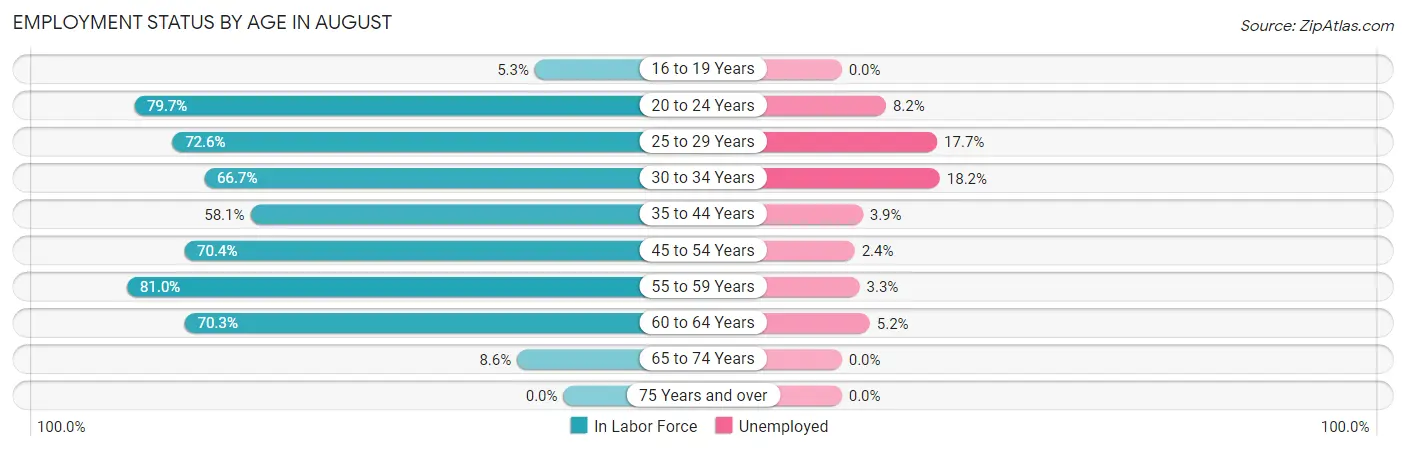
| Age Bracket | In Labor Force | Unemployed |
| 16 to 19 Years | 21 (5.3%) | 0 (0.0%) |
| 20 to 24 Years | 748 (79.7%) | 61 (8.2%) |
| 25 to 29 Years | 541 (72.6%) | 96 (17.7%) |
| 30 to 34 Years | 549 (66.7%) | 100 (18.2%) |
| 35 to 44 Years | 255 (58.1%) | 10 (3.9%) |
| 45 to 54 Years | 904 (70.4%) | 22 (2.4%) |
| 55 to 59 Years | 421 (81.0%) | 14 (3.3%) |
| 60 to 64 Years | 173 (70.3%) | 9 (5.2%) |
| 65 to 74 Years | 38 (8.6%) | 0 (0.0%) |
| 75 Years and over | 0 (0.0%) | 0 (0.0%) |
| Total | 3,650 (59.4%) | 310 (8.5%) |
Employment Status by Educational Attainment in August
According to labor force statistics for August, 70.1% of individuals (2,844) out of the total population between 25 and 64 years of age (4,057) are in the labor force, with 8.8% or 250 of them being unemployed. The group with the highest labor force participation rate are those with the educational attainment of college / associate degree, with 73.4% or 586 individuals in the labor force. Within the labor force, individuals with college / associate degree education have the highest percentage of unemployment, with 15.9% or 93 of them being unemployed.
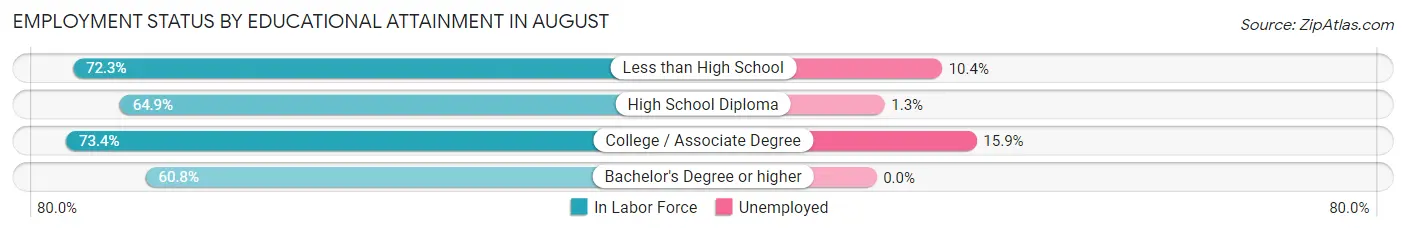
| Educational Attainment | In Labor Force | Unemployed |
| Less than High School | 1,410 (72.3%) | 203 (10.4%) |
| High School Diploma | 816 (64.9%) | 16 (1.3%) |
| College / Associate Degree | 586 (73.4%) | 127 (15.9%) |
| Bachelor's Degree or higher | 31 (60.8%) | 0 (0.0%) |
| Total | 2,844 (70.1%) | 357 (8.8%) |
Employment Occupations by Sex in August
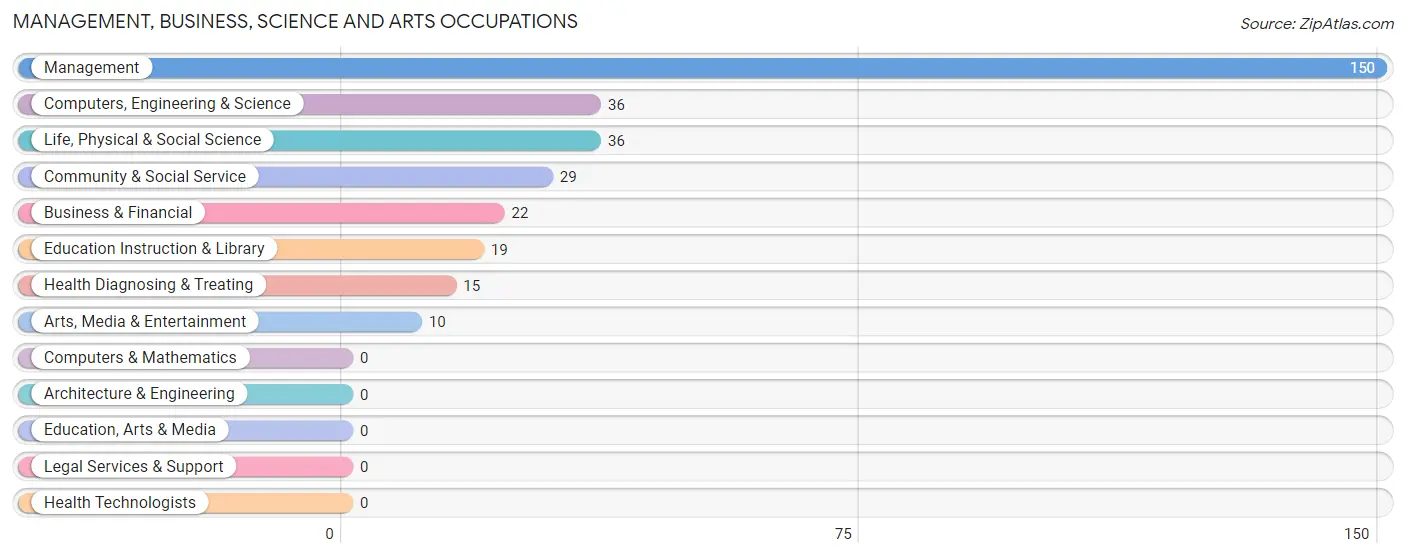
Management, Business, Science and Arts Occupations
The most common Management, Business, Science and Arts occupations in August are Management (150 | 4.5%), Computers, Engineering & Science (36 | 1.1%), Life, Physical & Social Science (36 | 1.1%), Community & Social Service (29 | 0.9%), and Business & Financial (22 | 0.7%).
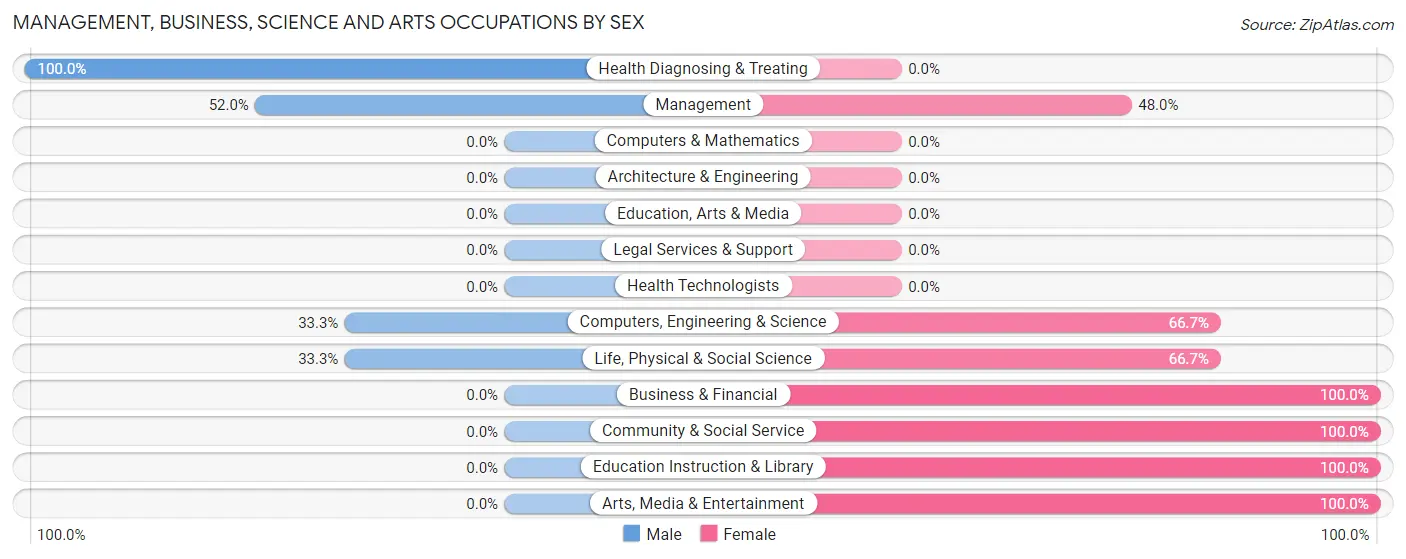
Management, Business, Science and Arts Occupations by Sex
Within the Management, Business, Science and Arts occupations in August, the most male-oriented occupations are Health Diagnosing & Treating (100.0%), Management (52.0%), and Computers, Engineering & Science (33.3%), while the most female-oriented occupations are Business & Financial (100.0%), Community & Social Service (100.0%), and Education Instruction & Library (100.0%).
| Occupation | Male | Female |
| Management | 78 (52.0%) | 72 (48.0%) |
| Business & Financial | 0 (0.0%) | 22 (100.0%) |
| Computers, Engineering & Science | 12 (33.3%) | 24 (66.7%) |
| Computers & Mathematics | 0 (0.0%) | 0 (0.0%) |
| Architecture & Engineering | 0 (0.0%) | 0 (0.0%) |
| Life, Physical & Social Science | 12 (33.3%) | 24 (66.7%) |
| Community & Social Service | 0 (0.0%) | 29 (100.0%) |
| Education, Arts & Media | 0 (0.0%) | 0 (0.0%) |
| Legal Services & Support | 0 (0.0%) | 0 (0.0%) |
| Education Instruction & Library | 0 (0.0%) | 19 (100.0%) |
| Arts, Media & Entertainment | 0 (0.0%) | 10 (100.0%) |
| Health Diagnosing & Treating | 15 (100.0%) | 0 (0.0%) |
| Health Technologists | 0 (0.0%) | 0 (0.0%) |
| Total (Category) | 105 (41.7%) | 147 (58.3%) |
| Total (Overall) | 2,239 (67.1%) | 1,099 (32.9%) |
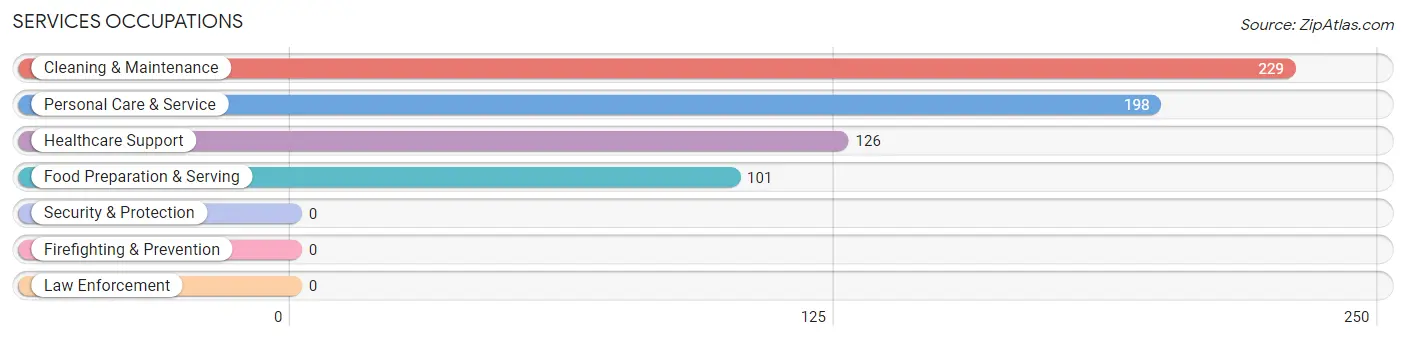
Services Occupations
The most common Services occupations in August are Cleaning & Maintenance (229 | 6.9%), Personal Care & Service (198 | 5.9%), Healthcare Support (126 | 3.8%), and Food Preparation & Serving (101 | 3.0%).
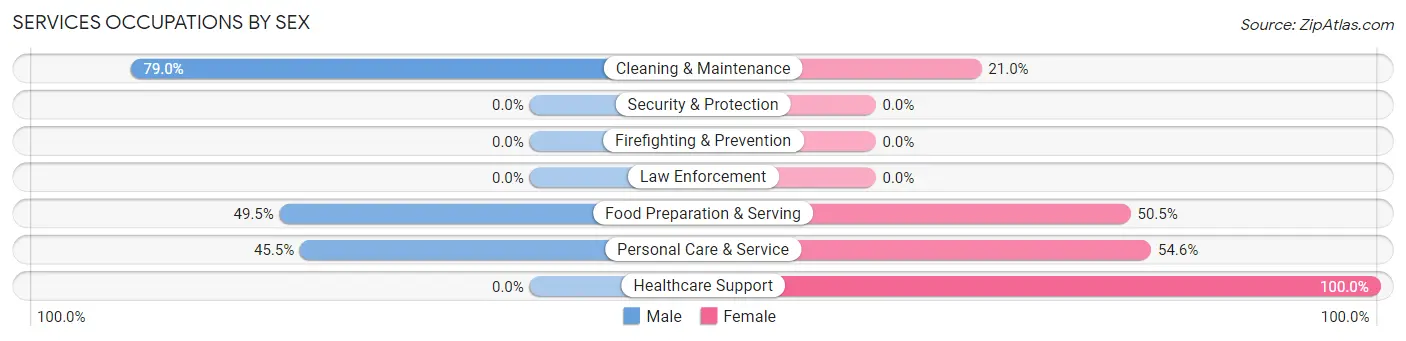
Services Occupations by Sex
Within the Services occupations in August, the most male-oriented occupations are Cleaning & Maintenance (79.0%), Food Preparation & Serving (49.5%), and Personal Care & Service (45.5%), while the most female-oriented occupations are Healthcare Support (100.0%), Personal Care & Service (54.5%), and Food Preparation & Serving (50.5%).
| Occupation | Male | Female |
| Healthcare Support | 0 (0.0%) | 126 (100.0%) |
| Security & Protection | 0 (0.0%) | 0 (0.0%) |
| Firefighting & Prevention | 0 (0.0%) | 0 (0.0%) |
| Law Enforcement | 0 (0.0%) | 0 (0.0%) |
| Food Preparation & Serving | 50 (49.5%) | 51 (50.5%) |
| Cleaning & Maintenance | 181 (79.0%) | 48 (21.0%) |
| Personal Care & Service | 90 (45.5%) | 108 (54.5%) |
| Total (Category) | 321 (49.1%) | 333 (50.9%) |
| Total (Overall) | 2,239 (67.1%) | 1,099 (32.9%) |
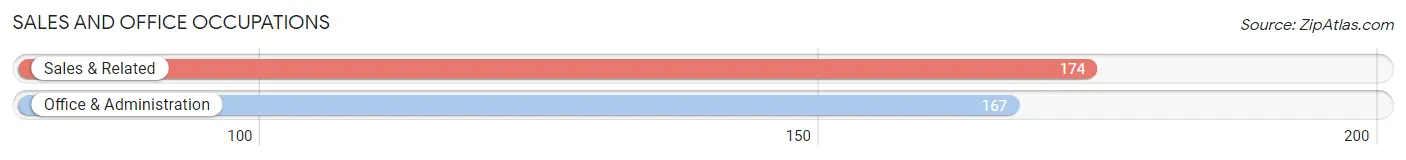
Sales and Office Occupations
The most common Sales and Office occupations in August are Sales & Related (174 | 5.2%), and Office & Administration (167 | 5.0%).
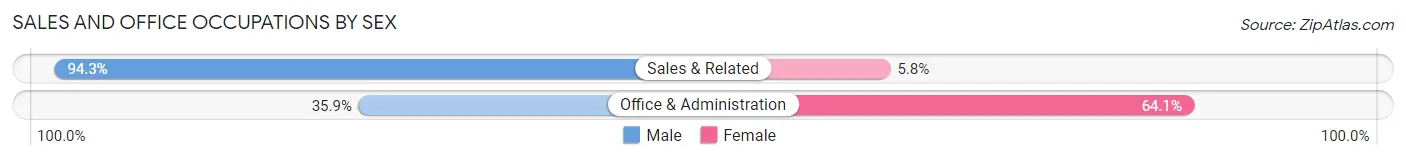
Sales and Office Occupations by Sex
| Occupation | Male | Female |
| Sales & Related | 164 (94.3%) | 10 (5.8%) |
| Office & Administration | 60 (35.9%) | 107 (64.1%) |
| Total (Category) | 224 (65.7%) | 117 (34.3%) |
| Total (Overall) | 2,239 (67.1%) | 1,099 (32.9%) |
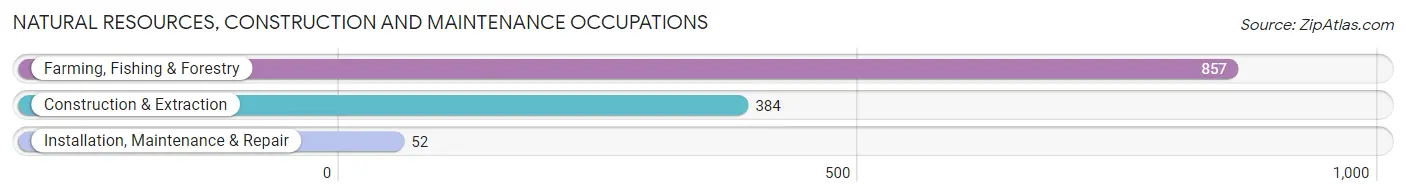
Natural Resources, Construction and Maintenance Occupations
The most common Natural Resources, Construction and Maintenance occupations in August are Farming, Fishing & Forestry (857 | 25.7%), Construction & Extraction (384 | 11.5%), and Installation, Maintenance & Repair (52 | 1.6%).
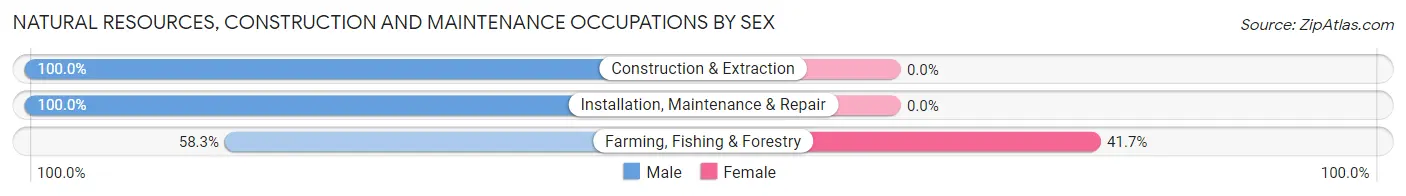
Natural Resources, Construction and Maintenance Occupations by Sex
| Occupation | Male | Female |
| Farming, Fishing & Forestry | 500 (58.3%) | 357 (41.7%) |
| Construction & Extraction | 384 (100.0%) | 0 (0.0%) |
| Installation, Maintenance & Repair | 52 (100.0%) | 0 (0.0%) |
| Total (Category) | 936 (72.4%) | 357 (27.6%) |
| Total (Overall) | 2,239 (67.1%) | 1,099 (32.9%) |
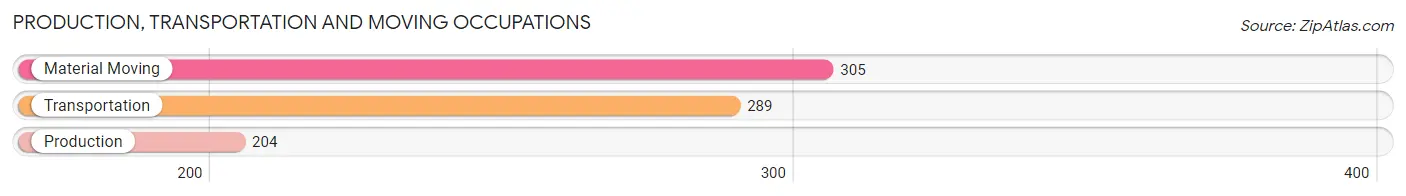
Production, Transportation and Moving Occupations
The most common Production, Transportation and Moving occupations in August are Material Moving (305 | 9.1%), Transportation (289 | 8.7%), and Production (204 | 6.1%).
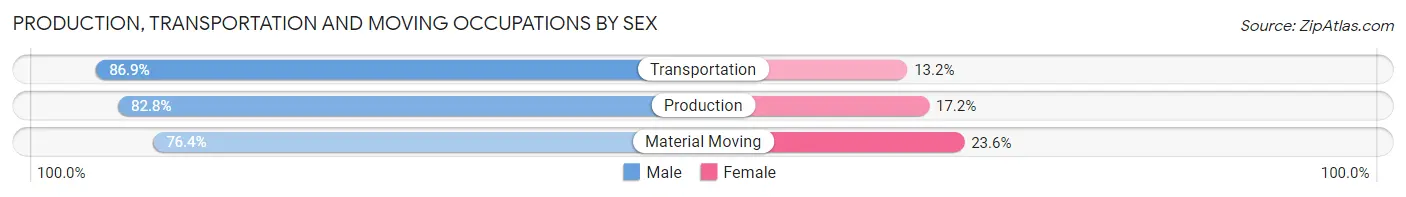
Production, Transportation and Moving Occupations by Sex
| Occupation | Male | Female |
| Production | 169 (82.8%) | 35 (17.2%) |
| Transportation | 251 (86.9%) | 38 (13.2%) |
| Material Moving | 233 (76.4%) | 72 (23.6%) |
| Total (Category) | 653 (81.8%) | 145 (18.2%) |
| Total (Overall) | 2,239 (67.1%) | 1,099 (32.9%) |
Employment Industries by Sex in August
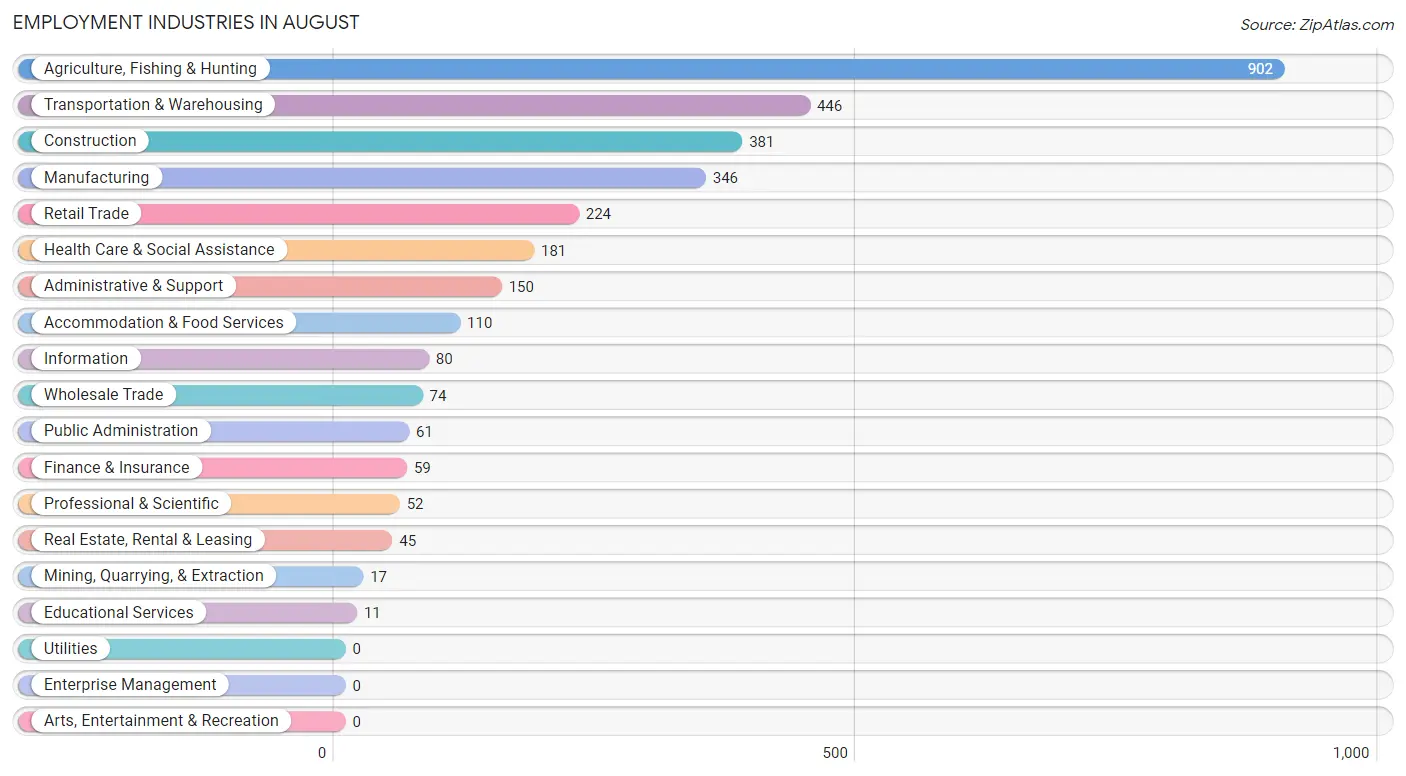
Employment Industries in August
The major employment industries in August include Agriculture, Fishing & Hunting (902 | 27.0%), Transportation & Warehousing (446 | 13.4%), Construction (381 | 11.4%), Manufacturing (346 | 10.4%), and Retail Trade (224 | 6.7%).
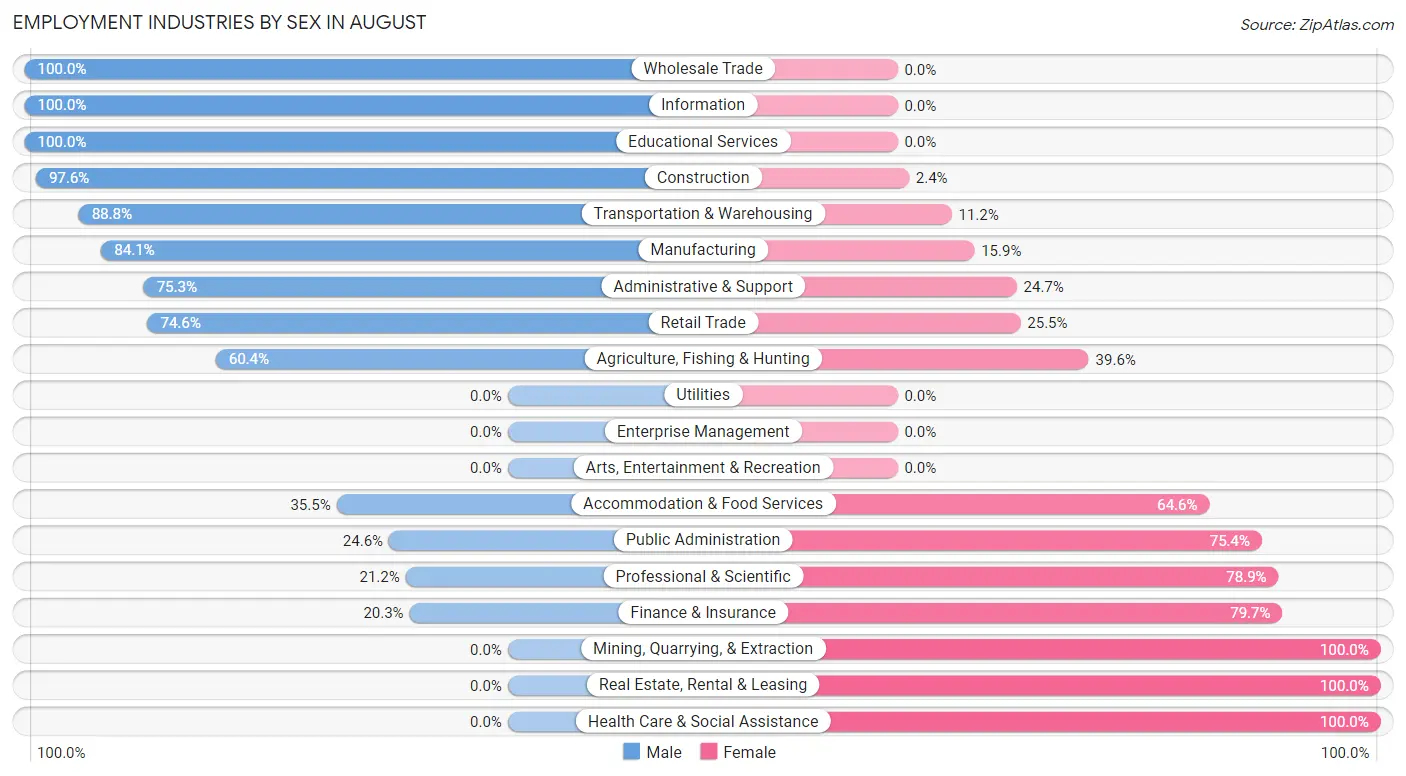
Employment Industries by Sex in August
The August industries that see more men than women are Wholesale Trade (100.0%), Information (100.0%), and Educational Services (100.0%), whereas the industries that tend to have a higher number of women are Mining, Quarrying, & Extraction (100.0%), Real Estate, Rental & Leasing (100.0%), and Health Care & Social Assistance (100.0%).
| Industry | Male | Female |
| Agriculture, Fishing & Hunting | 545 (60.4%) | 357 (39.6%) |
| Mining, Quarrying, & Extraction | 0 (0.0%) | 17 (100.0%) |
| Construction | 372 (97.6%) | 9 (2.4%) |
| Manufacturing | 291 (84.1%) | 55 (15.9%) |
| Wholesale Trade | 74 (100.0%) | 0 (0.0%) |
| Retail Trade | 167 (74.6%) | 57 (25.5%) |
| Transportation & Warehousing | 396 (88.8%) | 50 (11.2%) |
| Utilities | 0 (0.0%) | 0 (0.0%) |
| Information | 80 (100.0%) | 0 (0.0%) |
| Finance & Insurance | 12 (20.3%) | 47 (79.7%) |
| Real Estate, Rental & Leasing | 0 (0.0%) | 45 (100.0%) |
| Professional & Scientific | 11 (21.1%) | 41 (78.8%) |
| Enterprise Management | 0 (0.0%) | 0 (0.0%) |
| Administrative & Support | 113 (75.3%) | 37 (24.7%) |
| Educational Services | 11 (100.0%) | 0 (0.0%) |
| Health Care & Social Assistance | 0 (0.0%) | 181 (100.0%) |
| Arts, Entertainment & Recreation | 0 (0.0%) | 0 (0.0%) |
| Accommodation & Food Services | 39 (35.4%) | 71 (64.5%) |
| Public Administration | 15 (24.6%) | 46 (75.4%) |
| Total | 2,239 (67.1%) | 1,099 (32.9%) |
Education in August
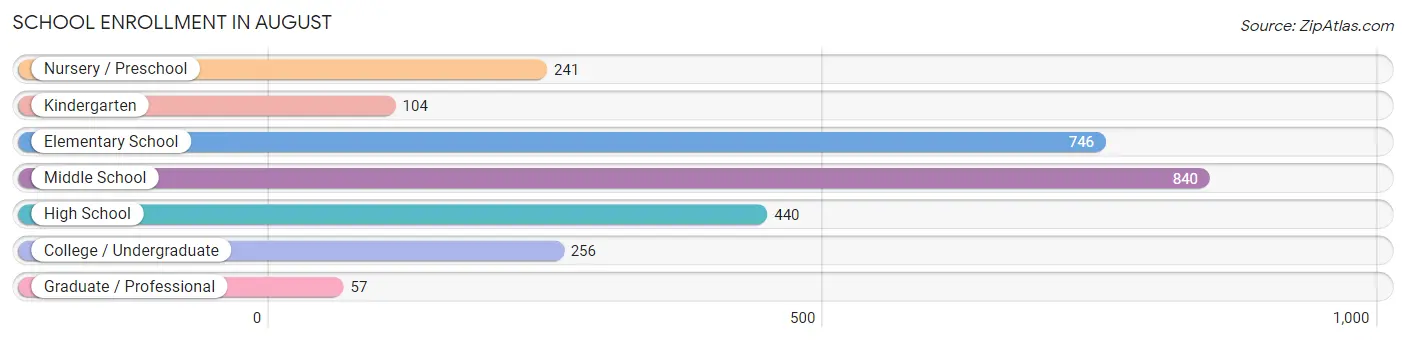
School Enrollment in August
The most common levels of schooling among the 2,684 students in August are middle school (840 | 31.3%), elementary school (746 | 27.8%), and high school (440 | 16.4%).
| School Level | # Students | % Students |
| Nursery / Preschool | 241 | 9.0% |
| Kindergarten | 104 | 3.9% |
| Elementary School | 746 | 27.8% |
| Middle School | 840 | 31.3% |
| High School | 440 | 16.4% |
| College / Undergraduate | 256 | 9.5% |
| Graduate / Professional | 57 | 2.1% |
| Total | 2,684 | 100.0% |
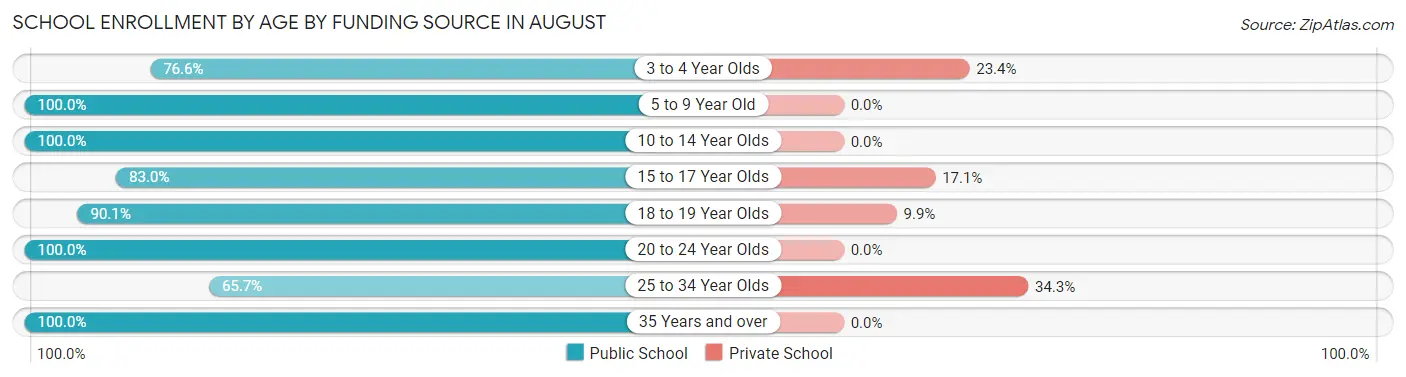
School Enrollment by Age by Funding Source in August
Out of a total of 2,684 students who are enrolled in schools in August, 137 (5.1%) attend a private institution, while the remaining 2,547 (94.9%) are enrolled in public schools. The age group of 25 to 34 year olds has the highest likelihood of being enrolled in private schools, with 34 (34.3% in the age bracket) enrolled. Conversely, the age group of 5 to 9 year old has the lowest likelihood of being enrolled in a private school, with 874 (100.0% in the age bracket) attending a public institution.
| Age Bracket | Public School | Private School |
| 3 to 4 Year Olds | 144 (76.6%) | 44 (23.4%) |
| 5 to 9 Year Old | 874 (100.0%) | 0 (0.0%) |
| 10 to 14 Year Olds | 946 (100.0%) | 0 (0.0%) |
| 15 to 17 Year Olds | 214 (83.0%) | 44 (17.1%) |
| 18 to 19 Year Olds | 128 (90.1%) | 14 (9.9%) |
| 20 to 24 Year Olds | 152 (100.0%) | 0 (0.0%) |
| 25 to 34 Year Olds | 65 (65.7%) | 34 (34.3%) |
| 35 Years and over | 25 (100.0%) | 0 (0.0%) |
| Total | 2,547 (94.9%) | 137 (5.1%) |
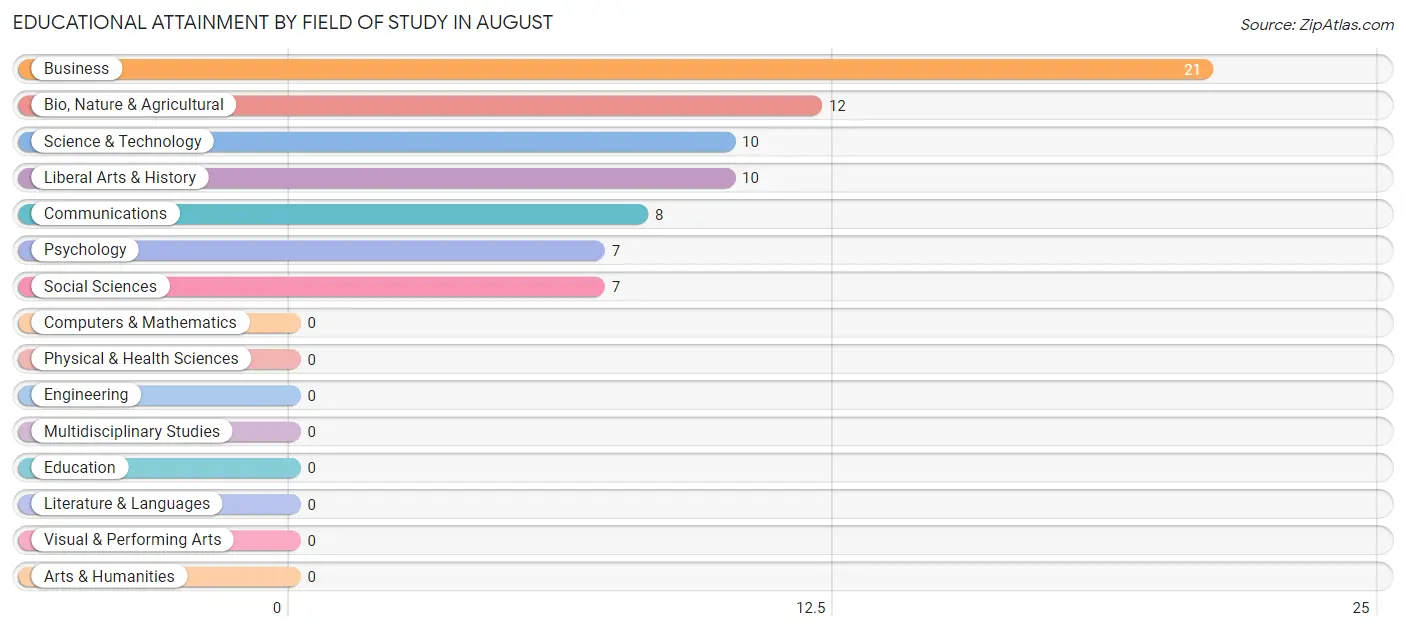
Educational Attainment by Field of Study in August
Business (21 | 28.0%), bio, nature & agricultural (12 | 16.0%), science & technology (10 | 13.3%), liberal arts & history (10 | 13.3%), and communications (8 | 10.7%) are the most common fields of study among 75 individuals in August who have obtained a bachelor's degree or higher.
| Field of Study | # Graduates | % Graduates |
| Computers & Mathematics | 0 | 0.0% |
| Bio, Nature & Agricultural | 12 | 16.0% |
| Physical & Health Sciences | 0 | 0.0% |
| Psychology | 7 | 9.3% |
| Social Sciences | 7 | 9.3% |
| Engineering | 0 | 0.0% |
| Multidisciplinary Studies | 0 | 0.0% |
| Science & Technology | 10 | 13.3% |
| Business | 21 | 28.0% |
| Education | 0 | 0.0% |
| Literature & Languages | 0 | 0.0% |
| Liberal Arts & History | 10 | 13.3% |
| Visual & Performing Arts | 0 | 0.0% |
| Communications | 8 | 10.7% |
| Arts & Humanities | 0 | 0.0% |
| Total | 75 | 100.0% |
Transportation & Commute in August
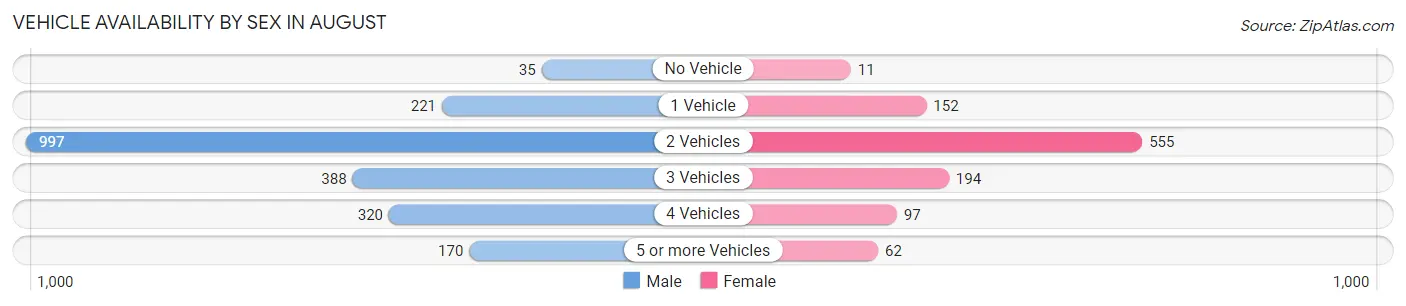
Vehicle Availability by Sex in August
The most prevalent vehicle ownership categories in August are males with 2 vehicles (997, accounting for 46.8%) and females with 2 vehicles (555, making up 93.1%).
| Vehicles Available | Male | Female |
| No Vehicle | 35 (1.6%) | 11 (1.0%) |
| 1 Vehicle | 221 (10.4%) | 152 (14.2%) |
| 2 Vehicles | 997 (46.8%) | 555 (51.8%) |
| 3 Vehicles | 388 (18.2%) | 194 (18.1%) |
| 4 Vehicles | 320 (15.0%) | 97 (9.1%) |
| 5 or more Vehicles | 170 (8.0%) | 62 (5.8%) |
| Total | 2,131 (100.0%) | 1,071 (100.0%) |
Commute Time in August
The most frequently occuring commute durations in August are 90 or more minutes (534 commuters, 17.1%), 30 to 34 minutes (503 commuters, 16.2%), and 15 to 19 minutes (482 commuters, 15.5%).
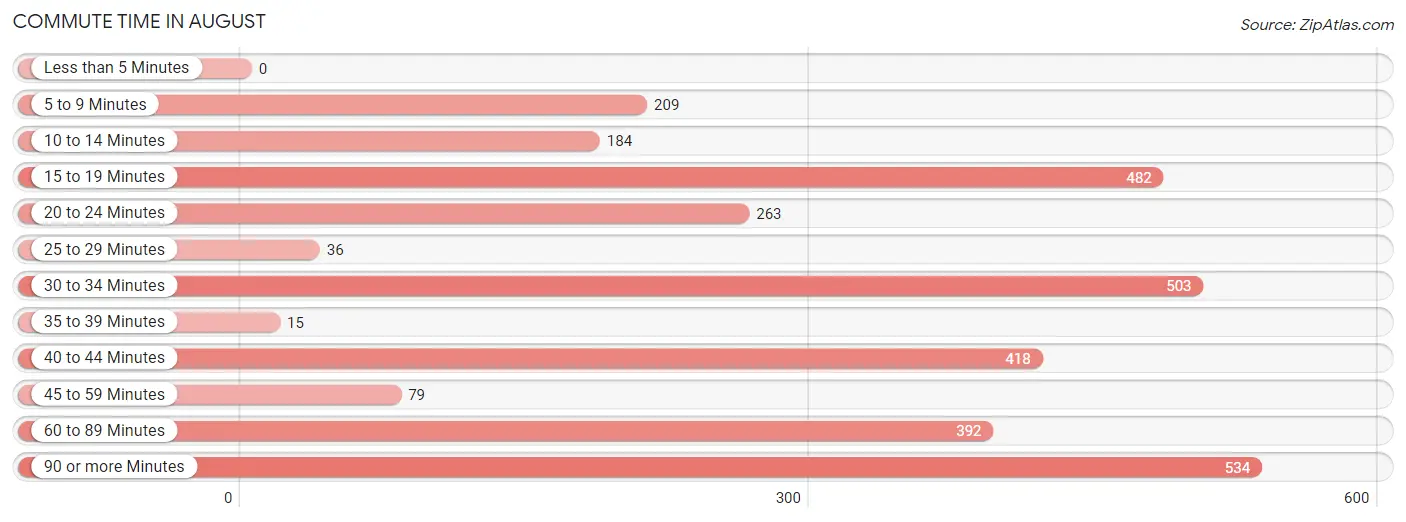
| Commute Time | # Commuters | % Commuters |
| Less than 5 Minutes | 0 | 0.0% |
| 5 to 9 Minutes | 209 | 6.7% |
| 10 to 14 Minutes | 184 | 5.9% |
| 15 to 19 Minutes | 482 | 15.5% |
| 20 to 24 Minutes | 263 | 8.4% |
| 25 to 29 Minutes | 36 | 1.2% |
| 30 to 34 Minutes | 503 | 16.2% |
| 35 to 39 Minutes | 15 | 0.5% |
| 40 to 44 Minutes | 418 | 13.4% |
| 45 to 59 Minutes | 79 | 2.5% |
| 60 to 89 Minutes | 392 | 12.6% |
| 90 or more Minutes | 534 | 17.1% |
Commute Time by Sex in August
The most common commute times in August are 30 to 34 minutes (391 commuters, 18.3%) for males and 40 to 44 minutes (256 commuters, 26.0%) for females.
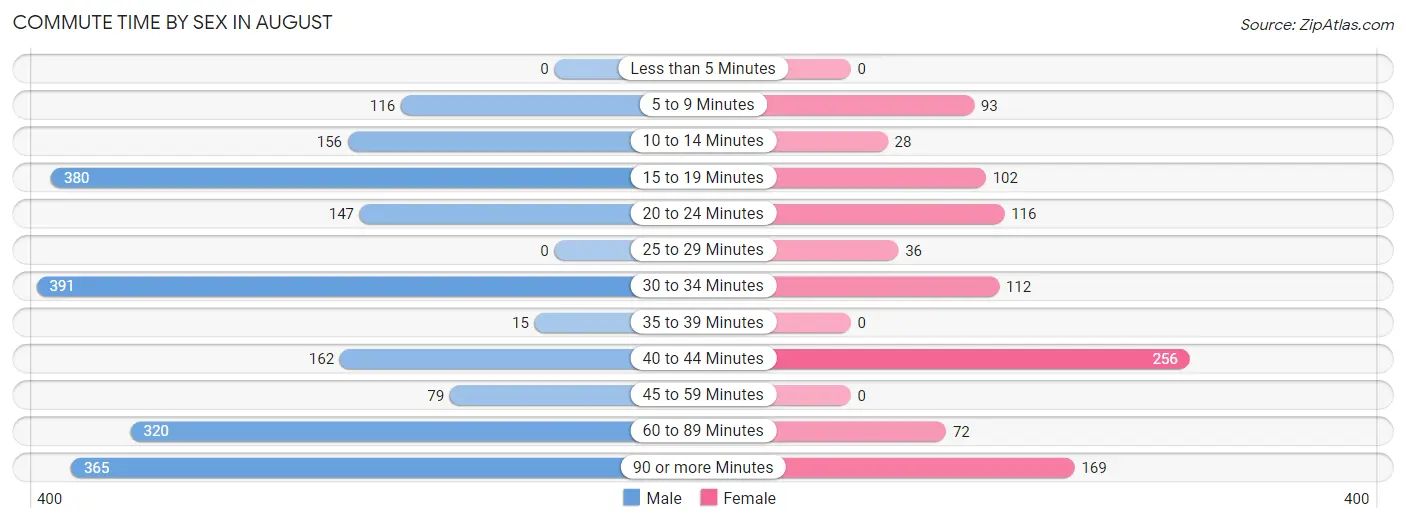
| Commute Time | Male | Female |
| Less than 5 Minutes | 0 (0.0%) | 0 (0.0%) |
| 5 to 9 Minutes | 116 (5.4%) | 93 (9.5%) |
| 10 to 14 Minutes | 156 (7.3%) | 28 (2.9%) |
| 15 to 19 Minutes | 380 (17.8%) | 102 (10.4%) |
| 20 to 24 Minutes | 147 (6.9%) | 116 (11.8%) |
| 25 to 29 Minutes | 0 (0.0%) | 36 (3.7%) |
| 30 to 34 Minutes | 391 (18.3%) | 112 (11.4%) |
| 35 to 39 Minutes | 15 (0.7%) | 0 (0.0%) |
| 40 to 44 Minutes | 162 (7.6%) | 256 (26.0%) |
| 45 to 59 Minutes | 79 (3.7%) | 0 (0.0%) |
| 60 to 89 Minutes | 320 (15.0%) | 72 (7.3%) |
| 90 or more Minutes | 365 (17.1%) | 169 (17.2%) |
Time of Departure to Work by Sex in August
The most frequent times of departure to work in August are 6:00 AM to 6:29 AM (647, 30.4%) for males and 8:00 AM to 8:29 AM (278, 28.2%) for females.
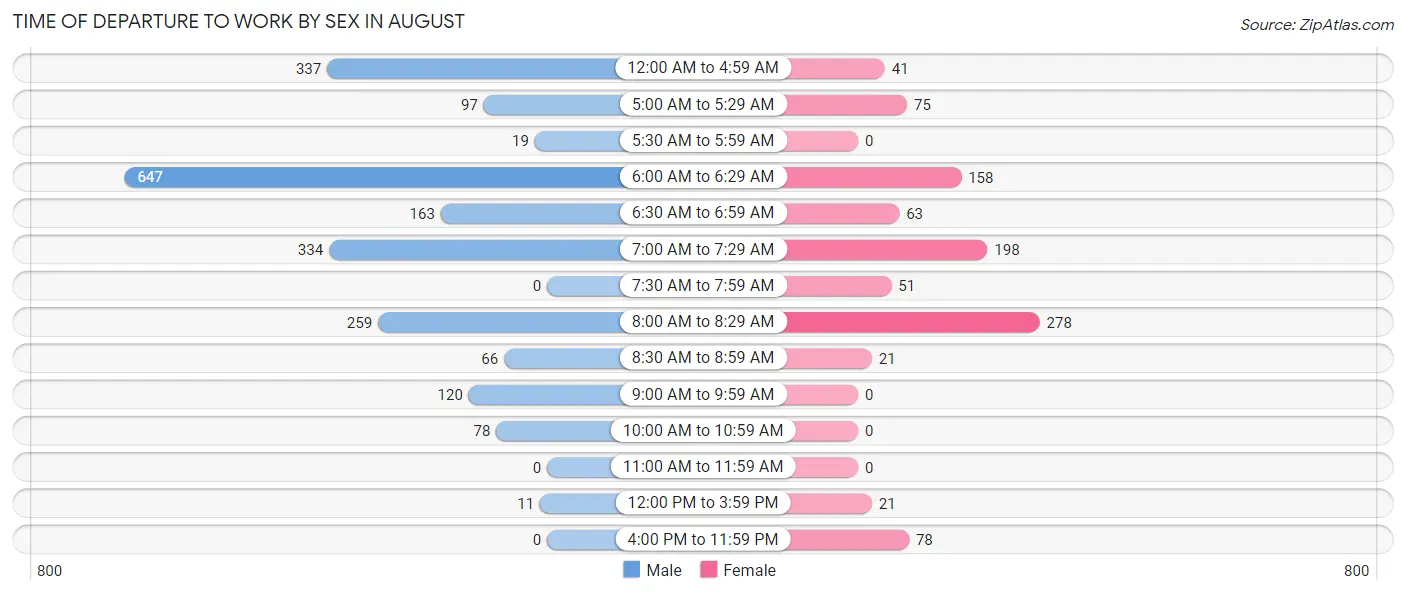
| Time of Departure | Male | Female |
| 12:00 AM to 4:59 AM | 337 (15.8%) | 41 (4.2%) |
| 5:00 AM to 5:29 AM | 97 (4.5%) | 75 (7.6%) |
| 5:30 AM to 5:59 AM | 19 (0.9%) | 0 (0.0%) |
| 6:00 AM to 6:29 AM | 647 (30.4%) | 158 (16.1%) |
| 6:30 AM to 6:59 AM | 163 (7.6%) | 63 (6.4%) |
| 7:00 AM to 7:29 AM | 334 (15.7%) | 198 (20.1%) |
| 7:30 AM to 7:59 AM | 0 (0.0%) | 51 (5.2%) |
| 8:00 AM to 8:29 AM | 259 (12.1%) | 278 (28.2%) |
| 8:30 AM to 8:59 AM | 66 (3.1%) | 21 (2.1%) |
| 9:00 AM to 9:59 AM | 120 (5.6%) | 0 (0.0%) |
| 10:00 AM to 10:59 AM | 78 (3.7%) | 0 (0.0%) |
| 11:00 AM to 11:59 AM | 0 (0.0%) | 0 (0.0%) |
| 12:00 PM to 3:59 PM | 11 (0.5%) | 21 (2.1%) |
| 4:00 PM to 11:59 PM | 0 (0.0%) | 78 (7.9%) |
| Total | 2,131 (100.0%) | 984 (100.0%) |
Housing Occupancy in August
Occupancy by Ownership in August
Of the total 2,288 dwellings in August, owner-occupied units account for 1,247 (54.5%), while renter-occupied units make up 1,041 (45.5%).
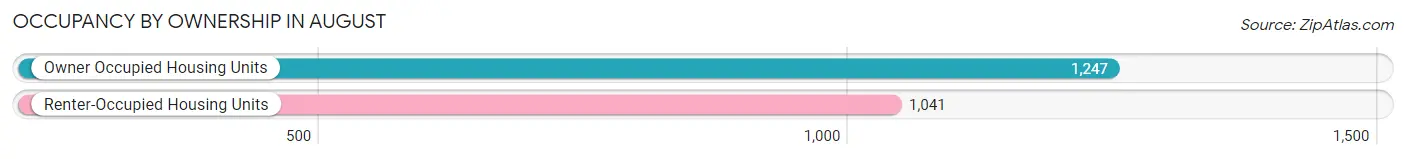
| Occupancy | # Housing Units | % Housing Units |
| Owner Occupied Housing Units | 1,247 | 54.5% |
| Renter-Occupied Housing Units | 1,041 | 45.5% |
| Total Occupied Housing Units | 2,288 | 100.0% |
Occupancy by Household Size in August
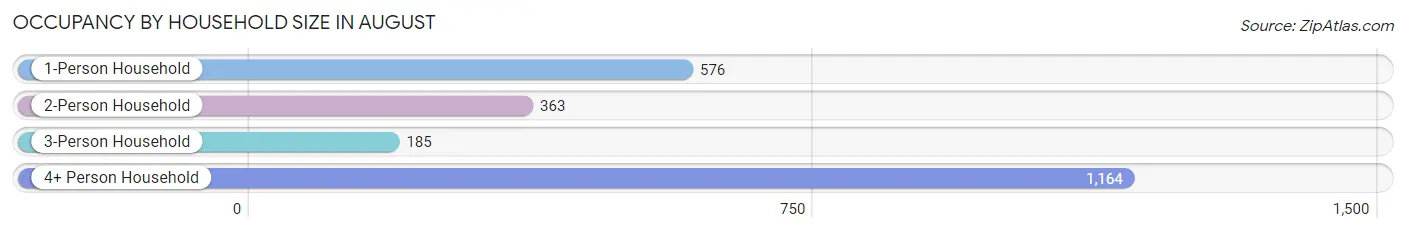
| Household Size | # Housing Units | % Housing Units |
| 1-Person Household | 576 | 25.2% |
| 2-Person Household | 363 | 15.9% |
| 3-Person Household | 185 | 8.1% |
| 4+ Person Household | 1,164 | 50.9% |
| Total Housing Units | 2,288 | 100.0% |
Occupancy by Ownership by Household Size in August
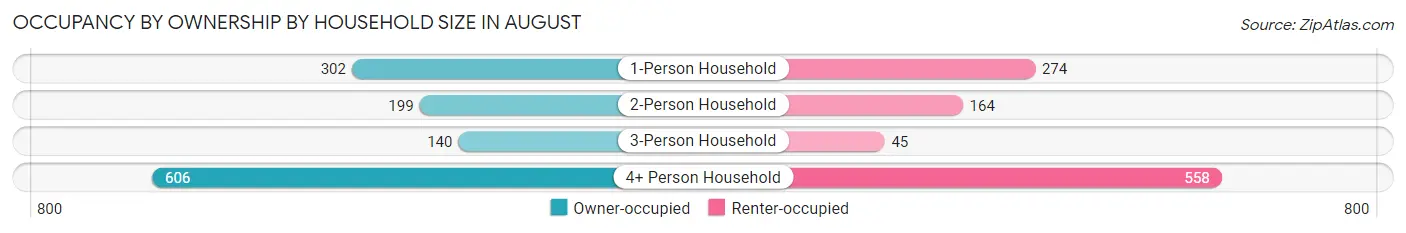
| Household Size | Owner-occupied | Renter-occupied |
| 1-Person Household | 302 (52.4%) | 274 (47.6%) |
| 2-Person Household | 199 (54.8%) | 164 (45.2%) |
| 3-Person Household | 140 (75.7%) | 45 (24.3%) |
| 4+ Person Household | 606 (52.1%) | 558 (47.9%) |
| Total Housing Units | 1,247 (54.5%) | 1,041 (45.5%) |
Occupancy by Educational Attainment in August
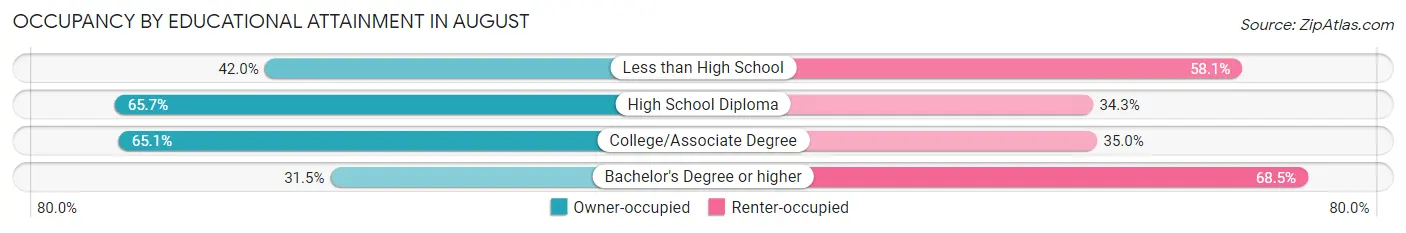
| Household Size | Owner-occupied | Renter-occupied |
| Less than High School | 388 (41.9%) | 537 (58.1%) |
| High School Diploma | 335 (65.7%) | 175 (34.3%) |
| College/Associate Degree | 495 (65.0%) | 266 (34.9%) |
| Bachelor's Degree or higher | 29 (31.5%) | 63 (68.5%) |
Occupancy by Age of Householder in August
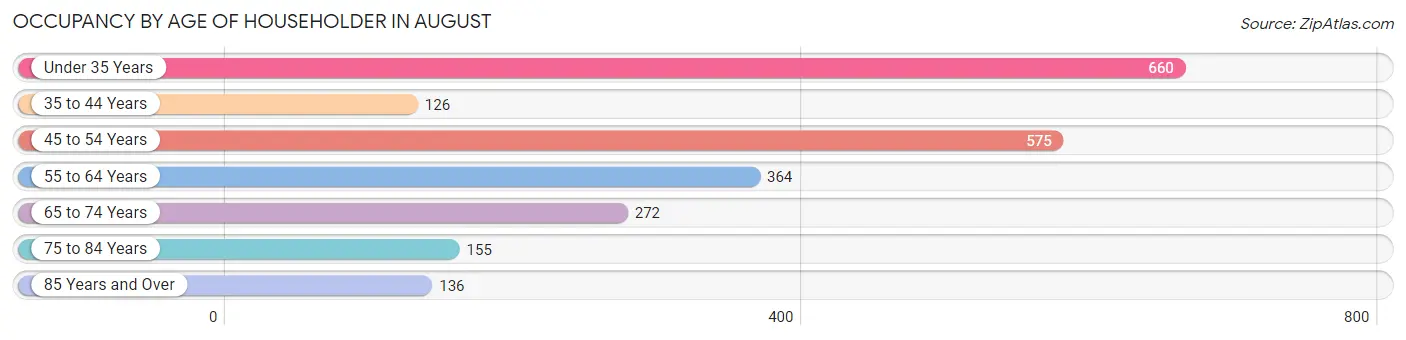
| Age Bracket | # Households | % Households |
| Under 35 Years | 660 | 28.8% |
| 35 to 44 Years | 126 | 5.5% |
| 45 to 54 Years | 575 | 25.1% |
| 55 to 64 Years | 364 | 15.9% |
| 65 to 74 Years | 272 | 11.9% |
| 75 to 84 Years | 155 | 6.8% |
| 85 Years and Over | 136 | 5.9% |
| Total | 2,288 | 100.0% |
Housing Finances in August
Median Income by Occupancy in August
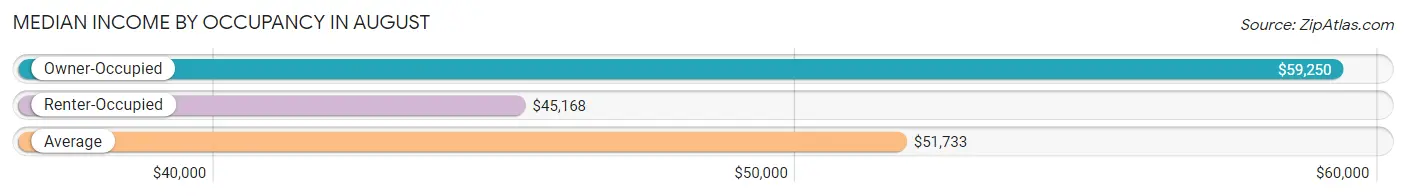
| Occupancy Type | # Households | Median Income |
| Owner-Occupied | 1,247 (54.5%) | $59,250 |
| Renter-Occupied | 1,041 (45.5%) | $45,168 |
| Average | 2,288 (100.0%) | $51,733 |
Occupancy by Householder Income Bracket in August
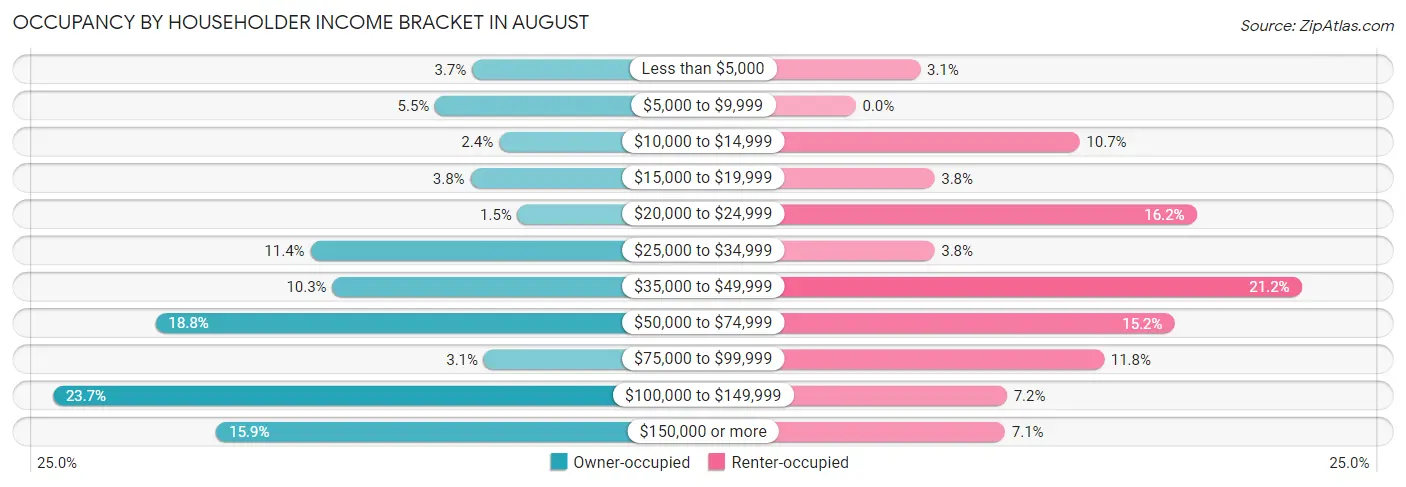
| Income Bracket | Owner-occupied | Renter-occupied |
| Less than $5,000 | 46 (3.7%) | 32 (3.1%) |
| $5,000 to $9,999 | 68 (5.4%) | 0 (0.0%) |
| $10,000 to $14,999 | 30 (2.4%) | 111 (10.7%) |
| $15,000 to $19,999 | 47 (3.8%) | 39 (3.7%) |
| $20,000 to $24,999 | 19 (1.5%) | 169 (16.2%) |
| $25,000 to $34,999 | 142 (11.4%) | 39 (3.7%) |
| $35,000 to $49,999 | 129 (10.3%) | 221 (21.2%) |
| $50,000 to $74,999 | 234 (18.8%) | 158 (15.2%) |
| $75,000 to $99,999 | 39 (3.1%) | 123 (11.8%) |
| $100,000 to $149,999 | 295 (23.7%) | 75 (7.2%) |
| $150,000 or more | 198 (15.9%) | 74 (7.1%) |
| Total | 1,247 (100.0%) | 1,041 (100.0%) |
Monthly Housing Cost Tiers in August
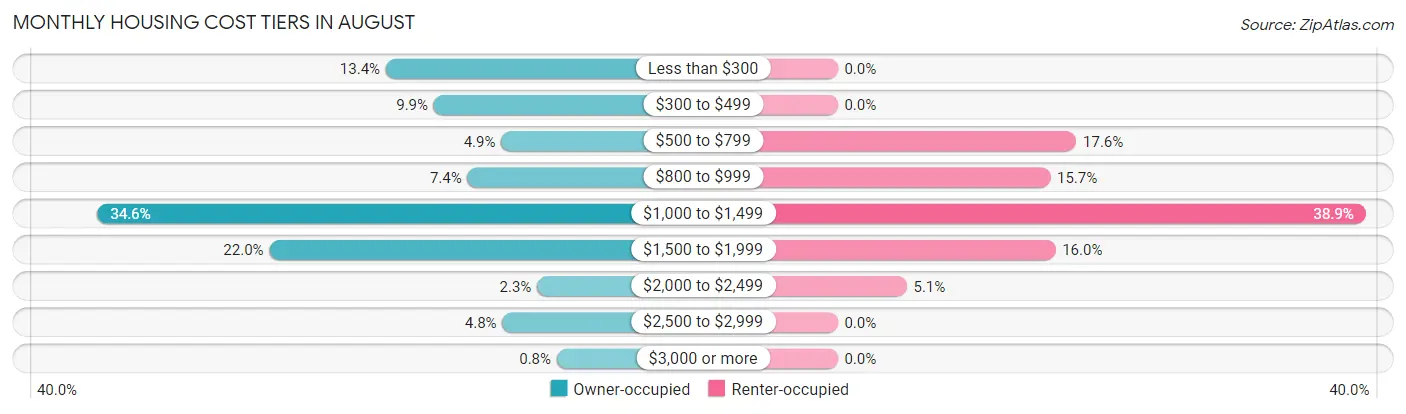
| Monthly Cost | Owner-occupied | Renter-occupied |
| Less than $300 | 167 (13.4%) | 0 (0.0%) |
| $300 to $499 | 123 (9.9%) | 0 (0.0%) |
| $500 to $799 | 61 (4.9%) | 183 (17.6%) |
| $800 to $999 | 92 (7.4%) | 163 (15.7%) |
| $1,000 to $1,499 | 432 (34.6%) | 405 (38.9%) |
| $1,500 to $1,999 | 274 (22.0%) | 167 (16.0%) |
| $2,000 to $2,499 | 28 (2.2%) | 53 (5.1%) |
| $2,500 to $2,999 | 60 (4.8%) | 0 (0.0%) |
| $3,000 or more | 10 (0.8%) | 0 (0.0%) |
| Total | 1,247 (100.0%) | 1,041 (100.0%) |
Physical Housing Characteristics in August
Housing Structures in August
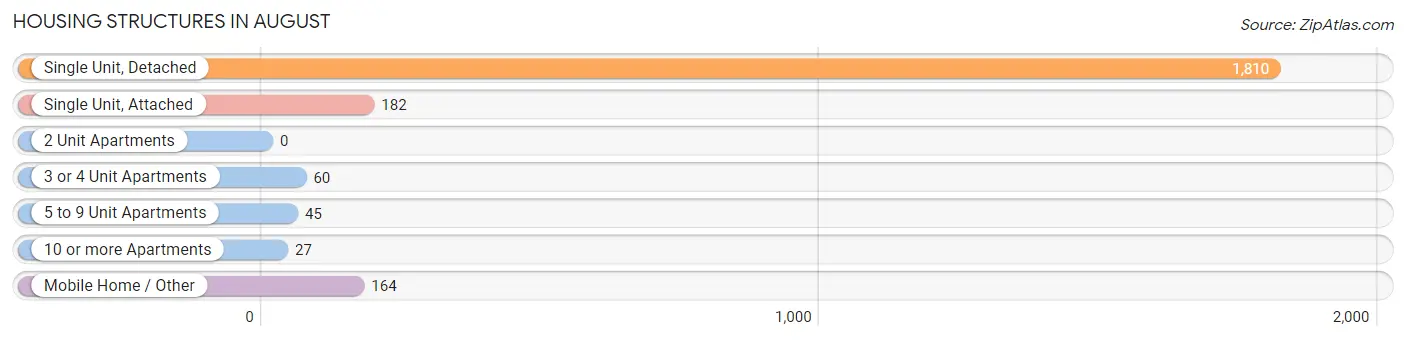
| Structure Type | # Housing Units | % Housing Units |
| Single Unit, Detached | 1,810 | 79.1% |
| Single Unit, Attached | 182 | 8.0% |
| 2 Unit Apartments | 0 | 0.0% |
| 3 or 4 Unit Apartments | 60 | 2.6% |
| 5 to 9 Unit Apartments | 45 | 2.0% |
| 10 or more Apartments | 27 | 1.2% |
| Mobile Home / Other | 164 | 7.2% |
| Total | 2,288 | 100.0% |
Housing Structures by Occupancy in August
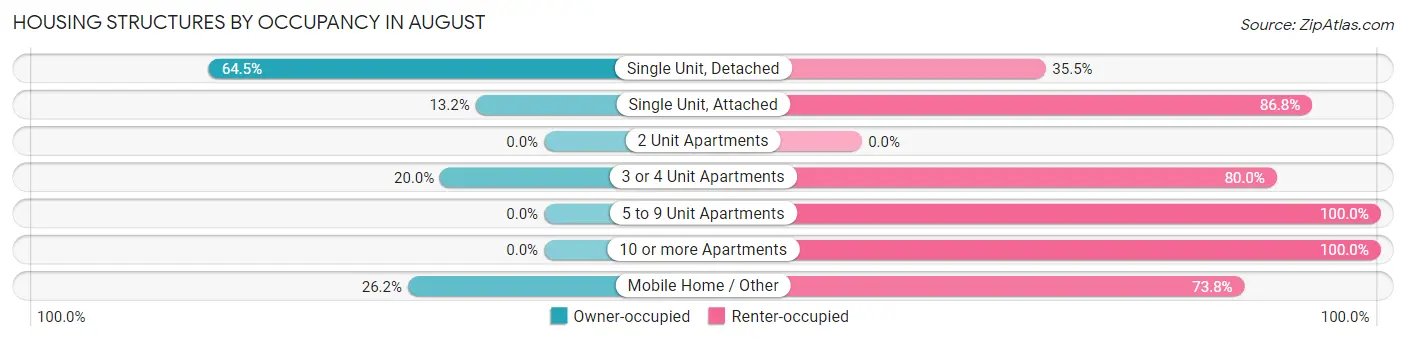
| Structure Type | Owner-occupied | Renter-occupied |
| Single Unit, Detached | 1,168 (64.5%) | 642 (35.5%) |
| Single Unit, Attached | 24 (13.2%) | 158 (86.8%) |
| 2 Unit Apartments | 0 (0.0%) | 0 (0.0%) |
| 3 or 4 Unit Apartments | 12 (20.0%) | 48 (80.0%) |
| 5 to 9 Unit Apartments | 0 (0.0%) | 45 (100.0%) |
| 10 or more Apartments | 0 (0.0%) | 27 (100.0%) |
| Mobile Home / Other | 43 (26.2%) | 121 (73.8%) |
| Total | 1,247 (54.5%) | 1,041 (45.5%) |
Housing Structures by Number of Rooms in August
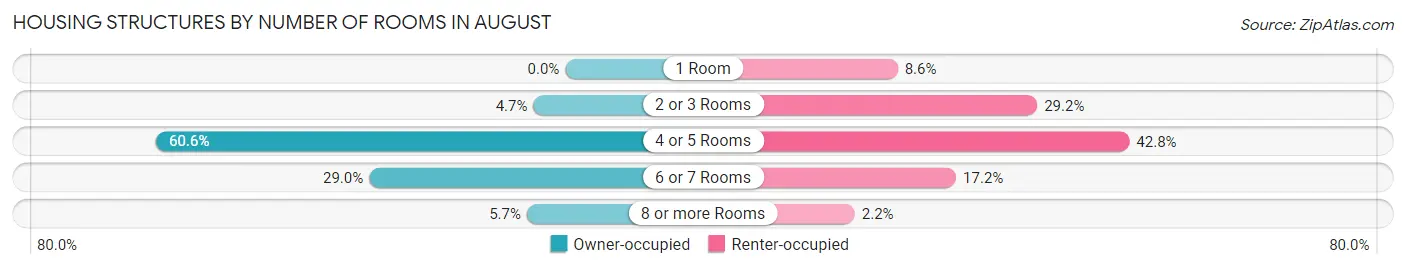
| Number of Rooms | Owner-occupied | Renter-occupied |
| 1 Room | 0 (0.0%) | 89 (8.6%) |
| 2 or 3 Rooms | 59 (4.7%) | 304 (29.2%) |
| 4 or 5 Rooms | 755 (60.6%) | 446 (42.8%) |
| 6 or 7 Rooms | 362 (29.0%) | 179 (17.2%) |
| 8 or more Rooms | 71 (5.7%) | 23 (2.2%) |
| Total | 1,247 (100.0%) | 1,041 (100.0%) |
Housing Structure by Heating Type in August
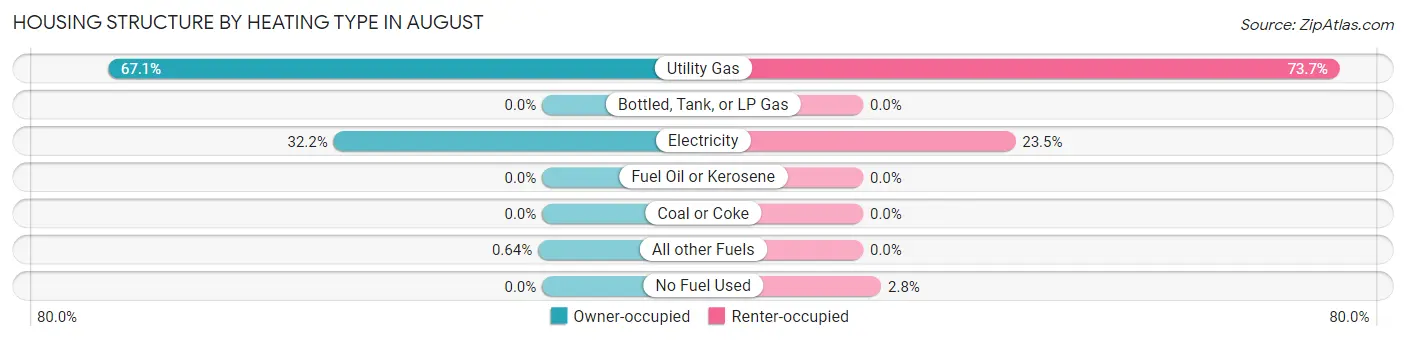
| Heating Type | Owner-occupied | Renter-occupied |
| Utility Gas | 837 (67.1%) | 767 (73.7%) |
| Bottled, Tank, or LP Gas | 0 (0.0%) | 0 (0.0%) |
| Electricity | 402 (32.2%) | 245 (23.5%) |
| Fuel Oil or Kerosene | 0 (0.0%) | 0 (0.0%) |
| Coal or Coke | 0 (0.0%) | 0 (0.0%) |
| All other Fuels | 8 (0.6%) | 0 (0.0%) |
| No Fuel Used | 0 (0.0%) | 29 (2.8%) |
| Total | 1,247 (100.0%) | 1,041 (100.0%) |
Household Vehicle Usage in August
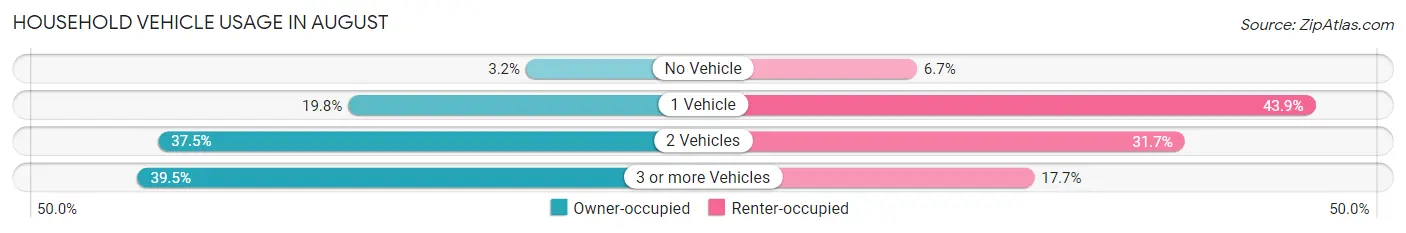
| Vehicles per Household | Owner-occupied | Renter-occupied |
| No Vehicle | 40 (3.2%) | 70 (6.7%) |
| 1 Vehicle | 247 (19.8%) | 457 (43.9%) |
| 2 Vehicles | 468 (37.5%) | 330 (31.7%) |
| 3 or more Vehicles | 492 (39.5%) | 184 (17.7%) |
| Total | 1,247 (100.0%) | 1,041 (100.0%) |
Real Estate & Mortgages in August
Real Estate and Mortgage Overview in August
| Characteristic | Without Mortgage | With Mortgage |
| Housing Units | 388 | 859 |
| Median Property Value | $234,800 | $260,500 |
| Median Household Income | $27,286 | $174 |
| Monthly Housing Costs | $321 | $10 |
| Real Estate Taxes | $1,146 | $0 |
Property Value by Mortgage Status in August
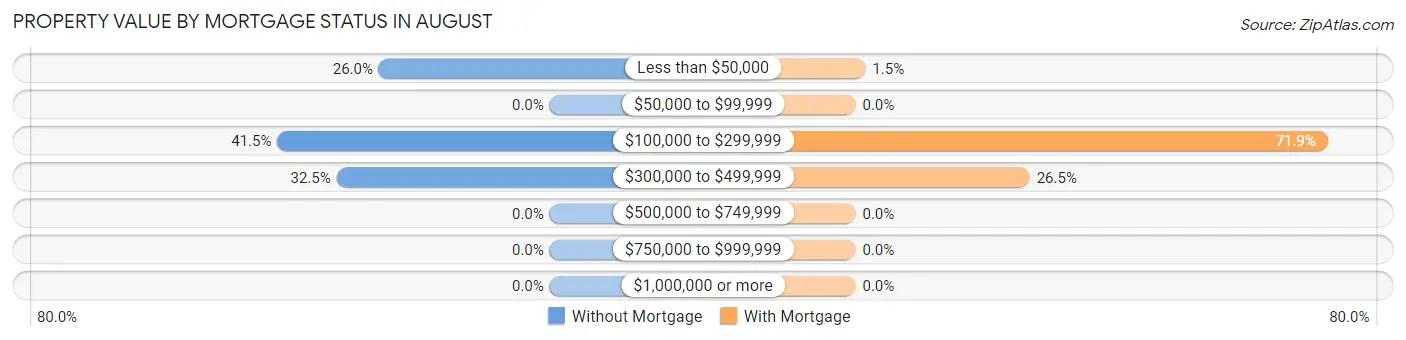
| Property Value | Without Mortgage | With Mortgage |
| Less than $50,000 | 101 (26.0%) | 13 (1.5%) |
| $50,000 to $99,999 | 0 (0.0%) | 0 (0.0%) |
| $100,000 to $299,999 | 161 (41.5%) | 618 (71.9%) |
| $300,000 to $499,999 | 126 (32.5%) | 228 (26.5%) |
| $500,000 to $749,999 | 0 (0.0%) | 0 (0.0%) |
| $750,000 to $999,999 | 0 (0.0%) | 0 (0.0%) |
| $1,000,000 or more | 0 (0.0%) | 0 (0.0%) |
| Total | 388 (100.0%) | 859 (100.0%) |
Household Income by Mortgage Status in August
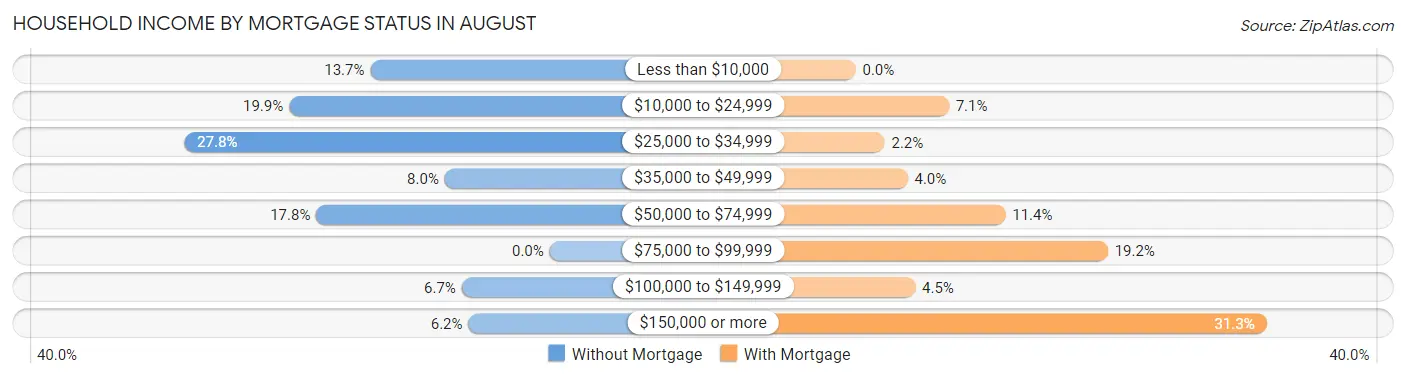
| Household Income | Without Mortgage | With Mortgage |
| Less than $10,000 | 53 (13.7%) | 0 (0.0%) |
| $10,000 to $24,999 | 77 (19.9%) | 61 (7.1%) |
| $25,000 to $34,999 | 108 (27.8%) | 19 (2.2%) |
| $35,000 to $49,999 | 31 (8.0%) | 34 (4.0%) |
| $50,000 to $74,999 | 69 (17.8%) | 98 (11.4%) |
| $75,000 to $99,999 | 0 (0.0%) | 165 (19.2%) |
| $100,000 to $149,999 | 26 (6.7%) | 39 (4.5%) |
| $150,000 or more | 24 (6.2%) | 269 (31.3%) |
| Total | 388 (100.0%) | 859 (100.0%) |
Property Value to Household Income Ratio in August
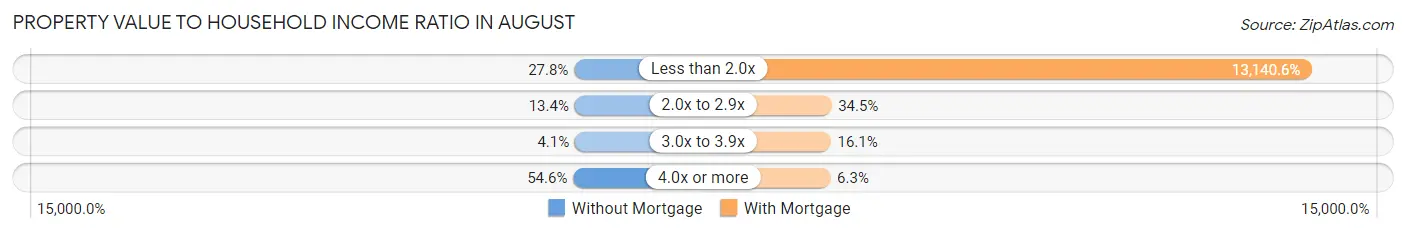
| Value-to-Income Ratio | Without Mortgage | With Mortgage |
| Less than 2.0x | 108 (27.8%) | 112,878 (13,140.6%) |
| 2.0x to 2.9x | 52 (13.4%) | 296 (34.5%) |
| 3.0x to 3.9x | 16 (4.1%) | 138 (16.1%) |
| 4.0x or more | 212 (54.6%) | 54 (6.3%) |
| Total | 388 (100.0%) | 859 (100.0%) |
Real Estate Taxes by Mortgage Status in August
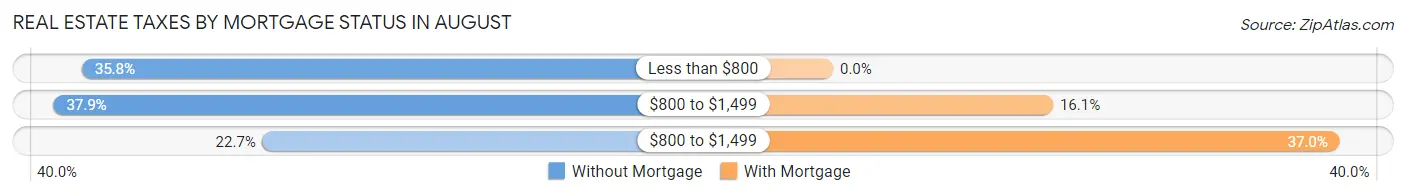
| Property Taxes | Without Mortgage | With Mortgage |
| Less than $800 | 139 (35.8%) | 0 (0.0%) |
| $800 to $1,499 | 147 (37.9%) | 138 (16.1%) |
| $800 to $1,499 | 88 (22.7%) | 318 (37.0%) |
| Total | 388 (100.0%) | 859 (100.0%) |
Health & Disability in August
Health Insurance Coverage by Age in August
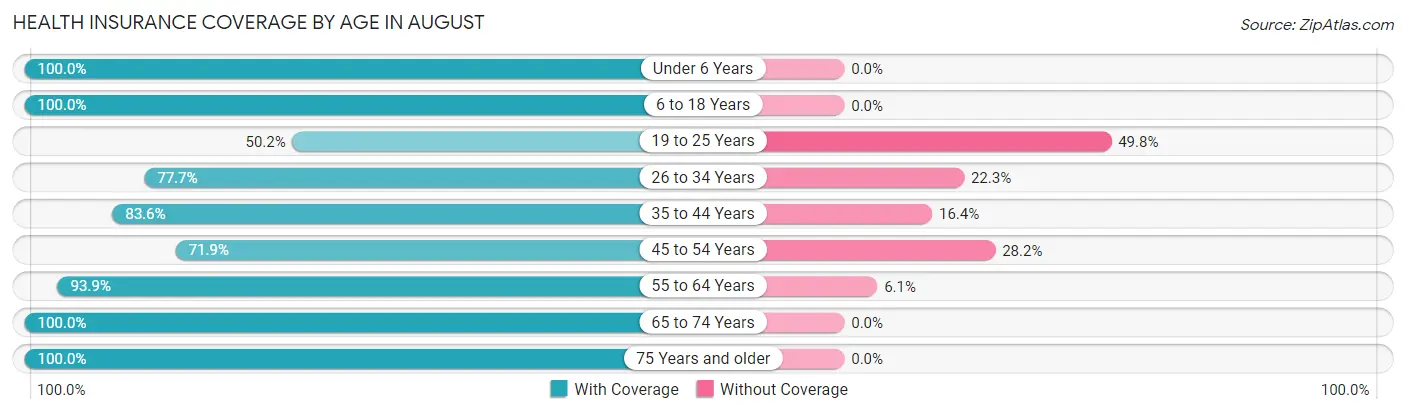
| Age Bracket | With Coverage | Without Coverage |
| Under 6 Years | 1,011 (100.0%) | 0 (0.0%) |
| 6 to 18 Years | 2,220 (100.0%) | 0 (0.0%) |
| 19 to 25 Years | 579 (50.2%) | 574 (49.8%) |
| 26 to 34 Years | 1,107 (77.7%) | 318 (22.3%) |
| 35 to 44 Years | 363 (83.6%) | 71 (16.4%) |
| 45 to 54 Years | 911 (71.9%) | 357 (28.1%) |
| 55 to 64 Years | 719 (93.9%) | 47 (6.1%) |
| 65 to 74 Years | 433 (100.0%) | 0 (0.0%) |
| 75 Years and older | 309 (100.0%) | 0 (0.0%) |
| Total | 7,652 (84.8%) | 1,367 (15.2%) |
Health Insurance Coverage by Citizenship Status in August
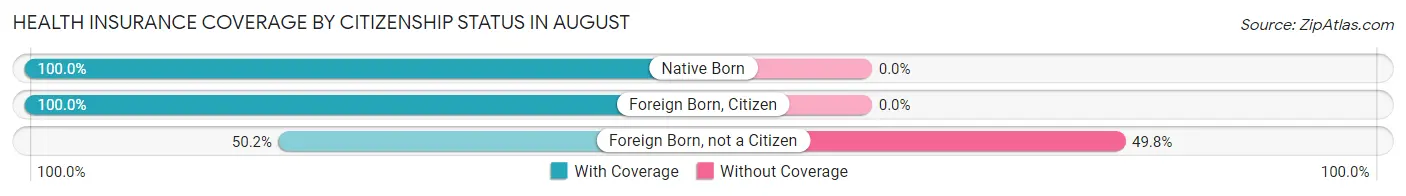
| Citizenship Status | With Coverage | Without Coverage |
| Native Born | 1,011 (100.0%) | 0 (0.0%) |
| Foreign Born, Citizen | 2,220 (100.0%) | 0 (0.0%) |
| Foreign Born, not a Citizen | 579 (50.2%) | 574 (49.8%) |
Health Insurance Coverage by Household Income in August
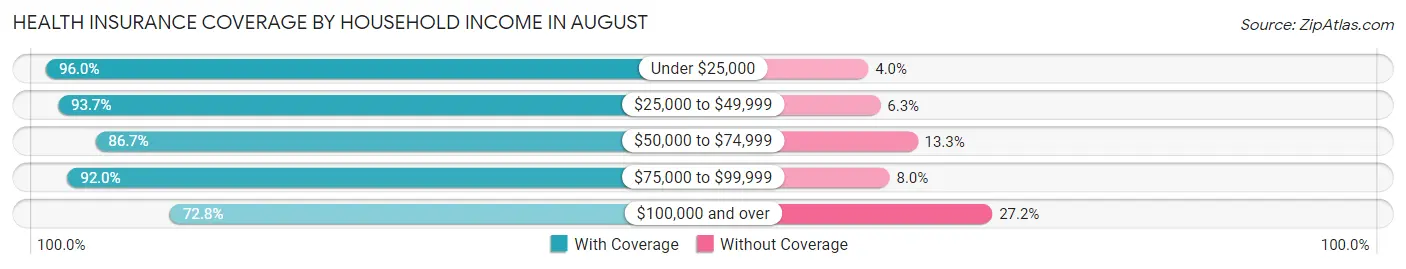
| Household Income | With Coverage | Without Coverage |
| Under $25,000 | 1,644 (96.0%) | 69 (4.0%) |
| $25,000 to $49,999 | 1,672 (93.7%) | 112 (6.3%) |
| $50,000 to $74,999 | 916 (86.7%) | 140 (13.3%) |
| $75,000 to $99,999 | 792 (92.0%) | 69 (8.0%) |
| $100,000 and over | 2,609 (72.8%) | 977 (27.2%) |
Public vs Private Health Insurance Coverage by Age in August
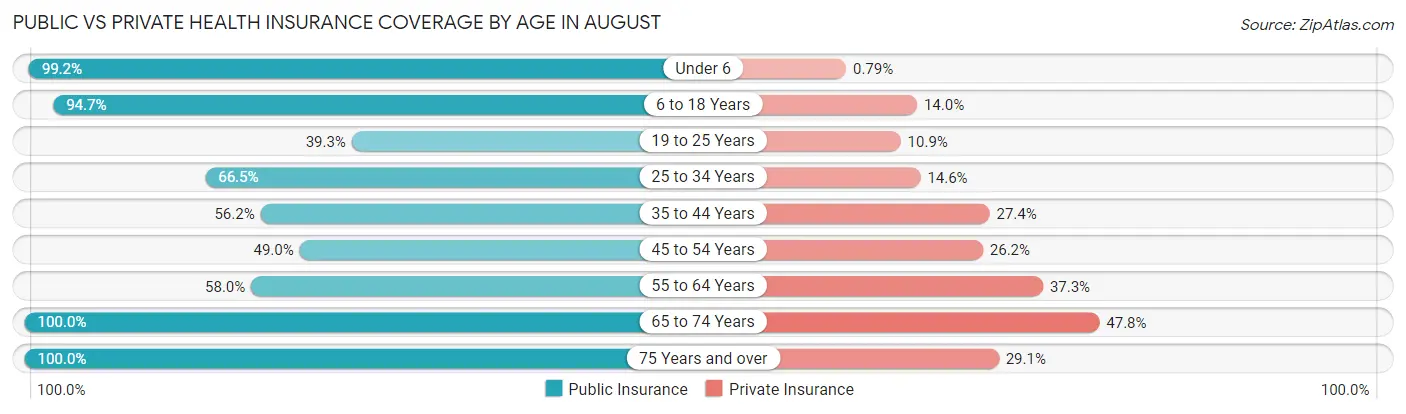
| Age Bracket | Public Insurance | Private Insurance |
| Under 6 | 1,003 (99.2%) | 8 (0.8%) |
| 6 to 18 Years | 2,102 (94.7%) | 310 (14.0%) |
| 19 to 25 Years | 453 (39.3%) | 126 (10.9%) |
| 25 to 34 Years | 947 (66.5%) | 208 (14.6%) |
| 35 to 44 Years | 244 (56.2%) | 119 (27.4%) |
| 45 to 54 Years | 621 (49.0%) | 332 (26.2%) |
| 55 to 64 Years | 444 (58.0%) | 286 (37.3%) |
| 65 to 74 Years | 433 (100.0%) | 207 (47.8%) |
| 75 Years and over | 309 (100.0%) | 90 (29.1%) |
| Total | 6,556 (72.7%) | 1,686 (18.7%) |
Disability Status by Sex by Age in August
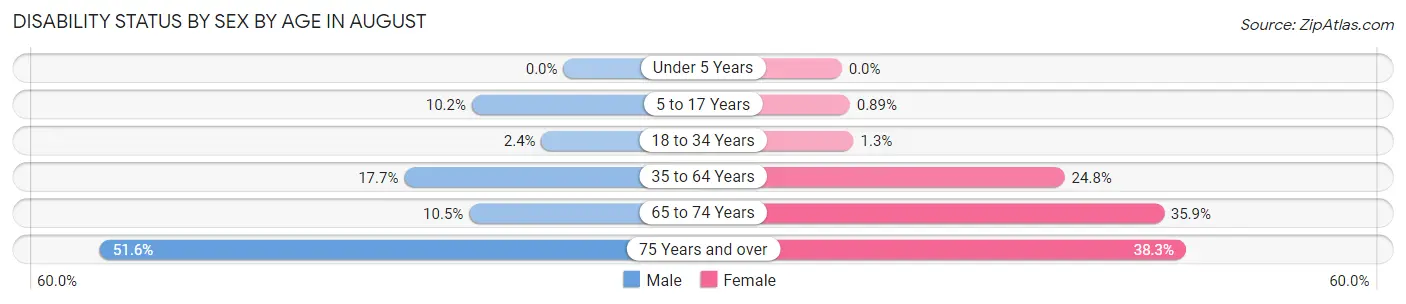
| Age Bracket | Male | Female |
| Under 5 Years | 0 (0.0%) | 0 (0.0%) |
| 5 to 17 Years | 104 (10.2%) | 10 (0.9%) |
| 18 to 34 Years | 35 (2.4%) | 17 (1.3%) |
| 35 to 64 Years | 221 (17.7%) | 303 (24.8%) |
| 65 to 74 Years | 15 (10.5%) | 104 (35.9%) |
| 75 Years and over | 80 (51.6%) | 59 (38.3%) |
Disability Class by Sex by Age in August
Disability Class: Hearing Difficulty
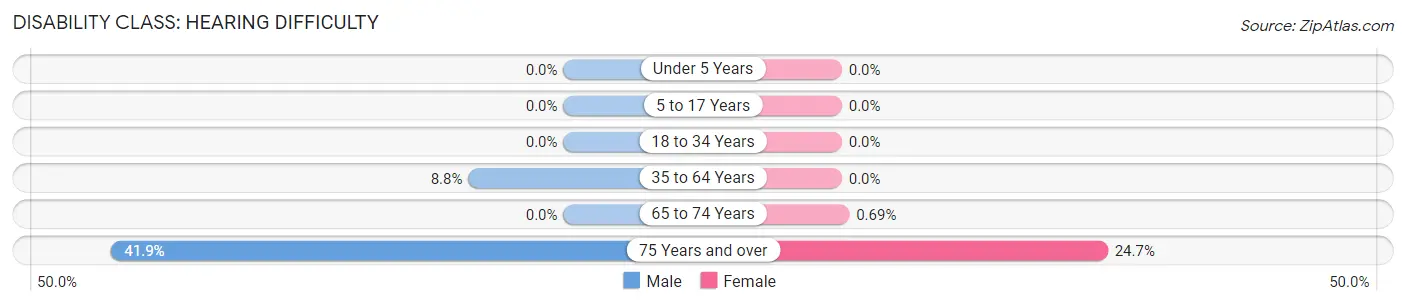
| Age Bracket | Male | Female |
| Under 5 Years | 0 (0.0%) | 0 (0.0%) |
| 5 to 17 Years | 0 (0.0%) | 0 (0.0%) |
| 18 to 34 Years | 0 (0.0%) | 0 (0.0%) |
| 35 to 64 Years | 110 (8.8%) | 0 (0.0%) |
| 65 to 74 Years | 0 (0.0%) | 2 (0.7%) |
| 75 Years and over | 65 (41.9%) | 38 (24.7%) |
Disability Class: Vision Difficulty
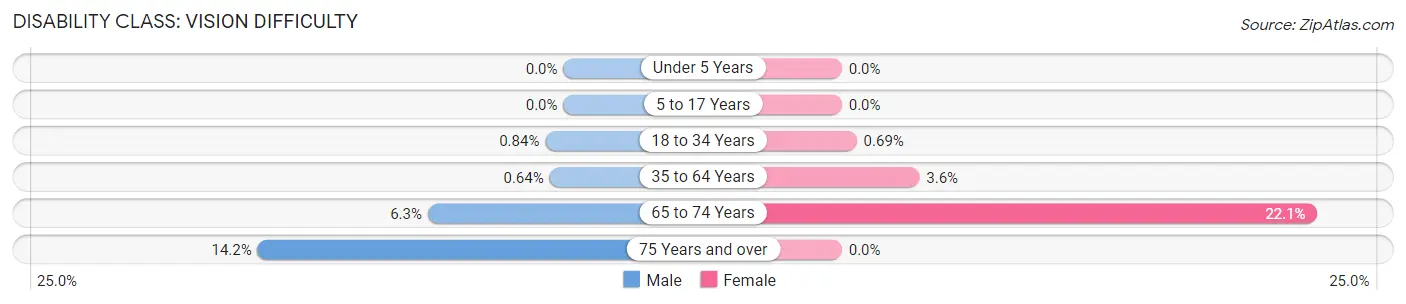
| Age Bracket | Male | Female |
| Under 5 Years | 0 (0.0%) | 0 (0.0%) |
| 5 to 17 Years | 0 (0.0%) | 0 (0.0%) |
| 18 to 34 Years | 12 (0.8%) | 9 (0.7%) |
| 35 to 64 Years | 8 (0.6%) | 44 (3.6%) |
| 65 to 74 Years | 9 (6.3%) | 64 (22.1%) |
| 75 Years and over | 22 (14.2%) | 0 (0.0%) |
Disability Class: Cognitive Difficulty
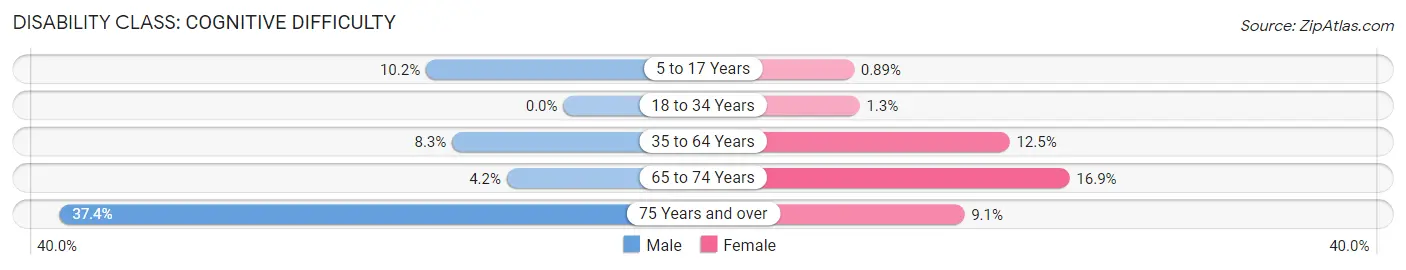
| Age Bracket | Male | Female |
| 5 to 17 Years | 104 (10.2%) | 10 (0.9%) |
| 18 to 34 Years | 0 (0.0%) | 17 (1.3%) |
| 35 to 64 Years | 103 (8.3%) | 152 (12.4%) |
| 65 to 74 Years | 6 (4.2%) | 49 (16.9%) |
| 75 Years and over | 58 (37.4%) | 14 (9.1%) |
Disability Class: Ambulatory Difficulty
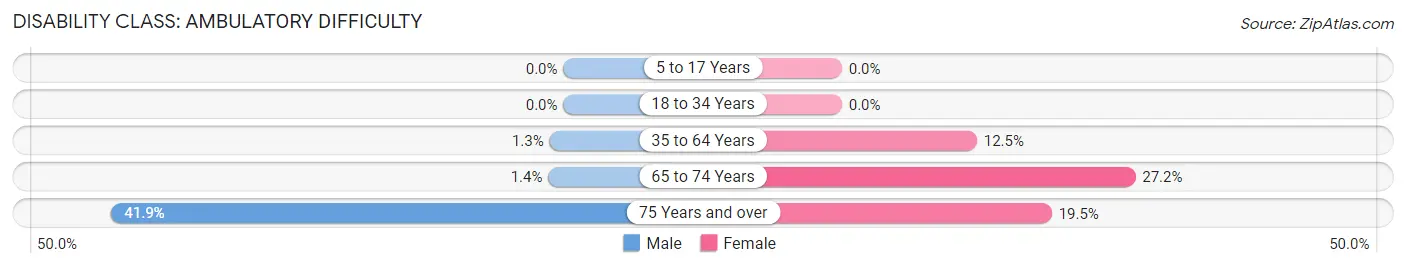
| Age Bracket | Male | Female |
| 5 to 17 Years | 0 (0.0%) | 0 (0.0%) |
| 18 to 34 Years | 0 (0.0%) | 0 (0.0%) |
| 35 to 64 Years | 16 (1.3%) | 153 (12.5%) |
| 65 to 74 Years | 2 (1.4%) | 79 (27.2%) |
| 75 Years and over | 65 (41.9%) | 30 (19.5%) |
Disability Class: Self-Care Difficulty
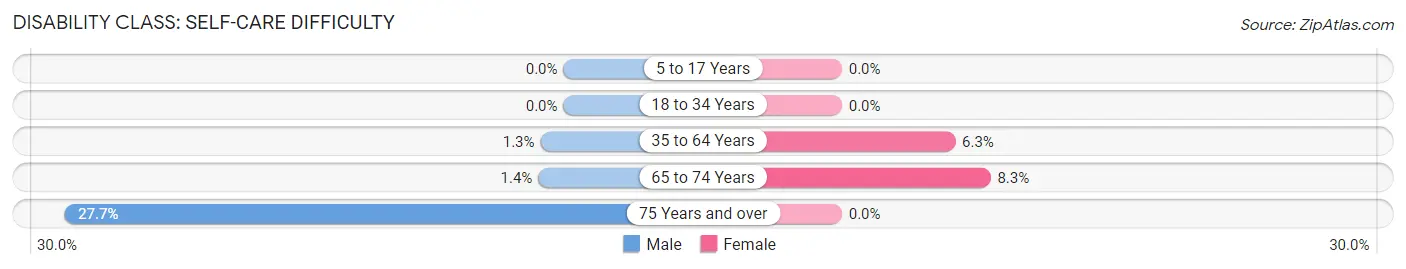
| Age Bracket | Male | Female |
| 5 to 17 Years | 0 (0.0%) | 0 (0.0%) |
| 18 to 34 Years | 0 (0.0%) | 0 (0.0%) |
| 35 to 64 Years | 16 (1.3%) | 77 (6.3%) |
| 65 to 74 Years | 2 (1.4%) | 24 (8.3%) |
| 75 Years and over | 43 (27.7%) | 0 (0.0%) |
Technology Access in August
Computing Device Access in August
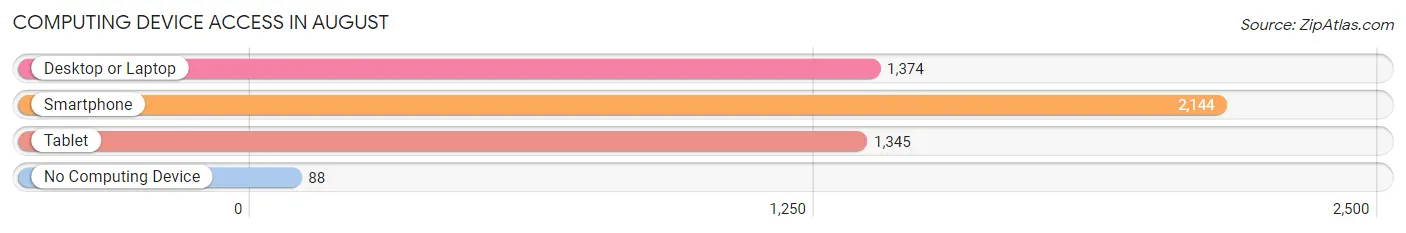
| Device Type | # Households | % Households |
| Desktop or Laptop | 1,374 | 60.1% |
| Smartphone | 2,144 | 93.7% |
| Tablet | 1,345 | 58.8% |
| No Computing Device | 88 | 3.8% |
| Total | 2,288 | 100.0% |
Internet Access in August
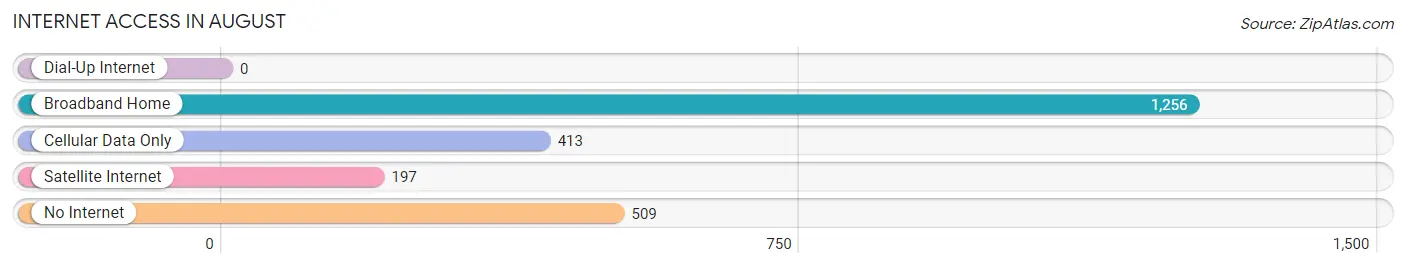
| Internet Type | # Households | % Households |
| Dial-Up Internet | 0 | 0.0% |
| Broadband Home | 1,256 | 54.9% |
| Cellular Data Only | 413 | 18.0% |
| Satellite Internet | 197 | 8.6% |
| No Internet | 509 | 22.3% |
| Total | 2,288 | 100.0% |
August Summary
August, California is a small unincorporated community located in the Sierra Nevada foothills of El Dorado County. It is situated in the western part of the county, approximately 25 miles east of Placerville and 40 miles northeast of Sacramento. The population of August was estimated to be around 200 people in 2000.
History
August was founded in 1849 by a group of miners who were searching for gold in the area. The town was named after August Scholz, one of the miners who discovered gold in the area. The town quickly grew and by 1851, it had a population of over 500 people. The town was home to several businesses, including a hotel, saloon, and general store.
In the late 1800s, the town began to decline as the gold rush ended and the population decreased. By the early 1900s, the town was nearly abandoned. In the 1950s, the town was revitalized when the nearby Union Pacific Railroad began to operate in the area. This brought new businesses and people to the area, and the population began to grow again.
Geography
August is located in the Sierra Nevada foothills of El Dorado County. It is situated in the western part of the county, approximately 25 miles east of Placerville and 40 miles northeast of Sacramento. The town is surrounded by rolling hills and is located at an elevation of 2,000 feet.
The climate in August is mild and dry, with hot summers and cool winters. The average annual temperature is around 60 degrees Fahrenheit. The average annual precipitation is around 20 inches.
Economy
The economy of August is largely based on tourism and agriculture. The town is home to several wineries and vineyards, as well as several small businesses. The town is also home to a few small farms, which produce a variety of fruits and vegetables.
Demographics
As of the 2000 census, the population of August was estimated to be around 200 people. The racial makeup of the town was 97.5% White, 0.5% African American, 0.5% Native American, 0.5% Asian, and 1% from other races. The median household income was $45,000. The median age was 44 years.
Conclusion
August, California is a small unincorporated community located in the Sierra Nevada foothills of El Dorado County. It was founded in 1849 by a group of miners who were searching for gold in the area. The town is surrounded by rolling hills and is located at an elevation of 2,000 feet. The economy of August is largely based on tourism and agriculture. As of the 2000 census, the population of August was estimated to be around 200 people.
Common Questions
What is the Total Population of August?
Total Population of August is 9,089.
What is the Total Male Population of August?
Total Male Population of August is 4,598.
What is the Total Female Population of August?
Total Female Population of August is 4,491.
What is the Ratio of Males per 100 Females in August?
There are 102.38 Males per 100 Females in August.
What is the Ratio of Females per 100 Males in August?
There are 97.67 Females per 100 Males in August.
What is the Median Population Age in August?
Median Population Age in August is 26.9 Years.
What is the Average Family Size in August
Average Family Size in August is 5.0 People.
What is the Average Household Size in August
Average Household Size in August is 3.9 People.
What is Per Capita Income in August?
Per Capita income in August is $19,774.
What is the Median Family Income in August?
Median Family Income in August is $63,235.
What is the Median Household income in August?
Median Household Income in August is $51,733.
What is Income or Wage Gap in August?
Income or Wage Gap in August is 25.0%.
Women in August earn 75.0 cents for every dollar earned by a man.
What is Inequality or Gini Index in August?
Inequality or Gini Index in August is 0.47.
How Large is the Labor Force in August?
There are 3,650 People in the Labor Forcein in August.
What is the Percentage of People in the Labor Force in August?
59.4% of People are in the Labor Force in August.
What is the Unemployment Rate in August?
Unemployment Rate in August is 8.5%.