Zip Codes with the Highest Percentage of Renter-Occupied Units in Prescott Valley, AZ
RELATED REPORTS & OPTIONS
Highest Renter-Occupied
Prescott Valley
Compare Zip Codes
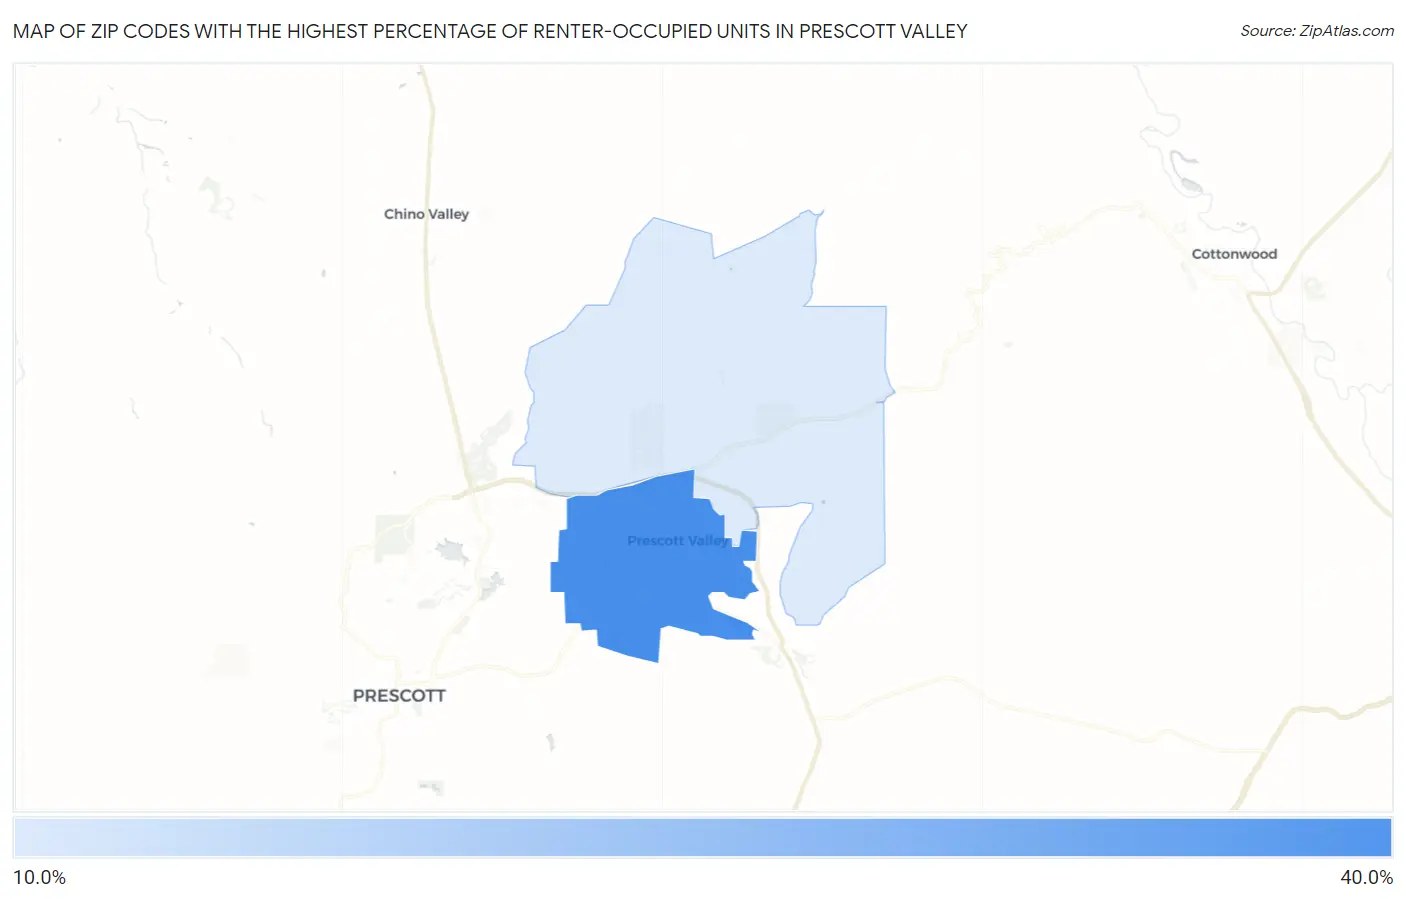
Map of Zip Codes with the Highest Percentage of Renter-Occupied Units in Prescott Valley
0.0%
40.0%
Zip Codes with the Highest Percentage of Renter-Occupied Units in Prescott Valley, AZ
| Zip Code | % Renter-Occupied | vs State | vs National | |
| 1. | 86314 | 33.2% | 33.7%(-0.552)#136 | 35.2%(-2.01)#8,232 |
| 2. | 86315 | 14.1% | 33.7%(-19.6)#304 | 35.2%(-21.0)#23,957 |
1
Common Questions
What are the Top Zip Codes with the Highest Percentage of Renter-Occupied Units in Prescott Valley, AZ?
Top Zip Codes with the Highest Percentage of Renter-Occupied Units in Prescott Valley, AZ are:
What zip code has the Highest Percentage of Renter-Occupied Units in Prescott Valley, AZ?
86314 has the Highest Percentage of Renter-Occupied Units in Prescott Valley, AZ with 33.2%.
What is the Percentage of Renter-Occupied Units in Prescott Valley, AZ?
Percentage of Renter-Occupied Units in Prescott Valley is 28.8%.
What is the Percentage of Renter-Occupied Units in Arizona?
Percentage of Renter-Occupied Units in Arizona is 33.7%.
What is the Percentage of Renter-Occupied Units in the United States?
Percentage of Renter-Occupied Units in the United States is 35.2%.