Zip Codes with the Highest Percentage of Population Employed in Transportation & Warehousing in Montana
RELATED REPORTS & OPTIONS
Transportation & Warehousing
Montana
Compare Zip Codes
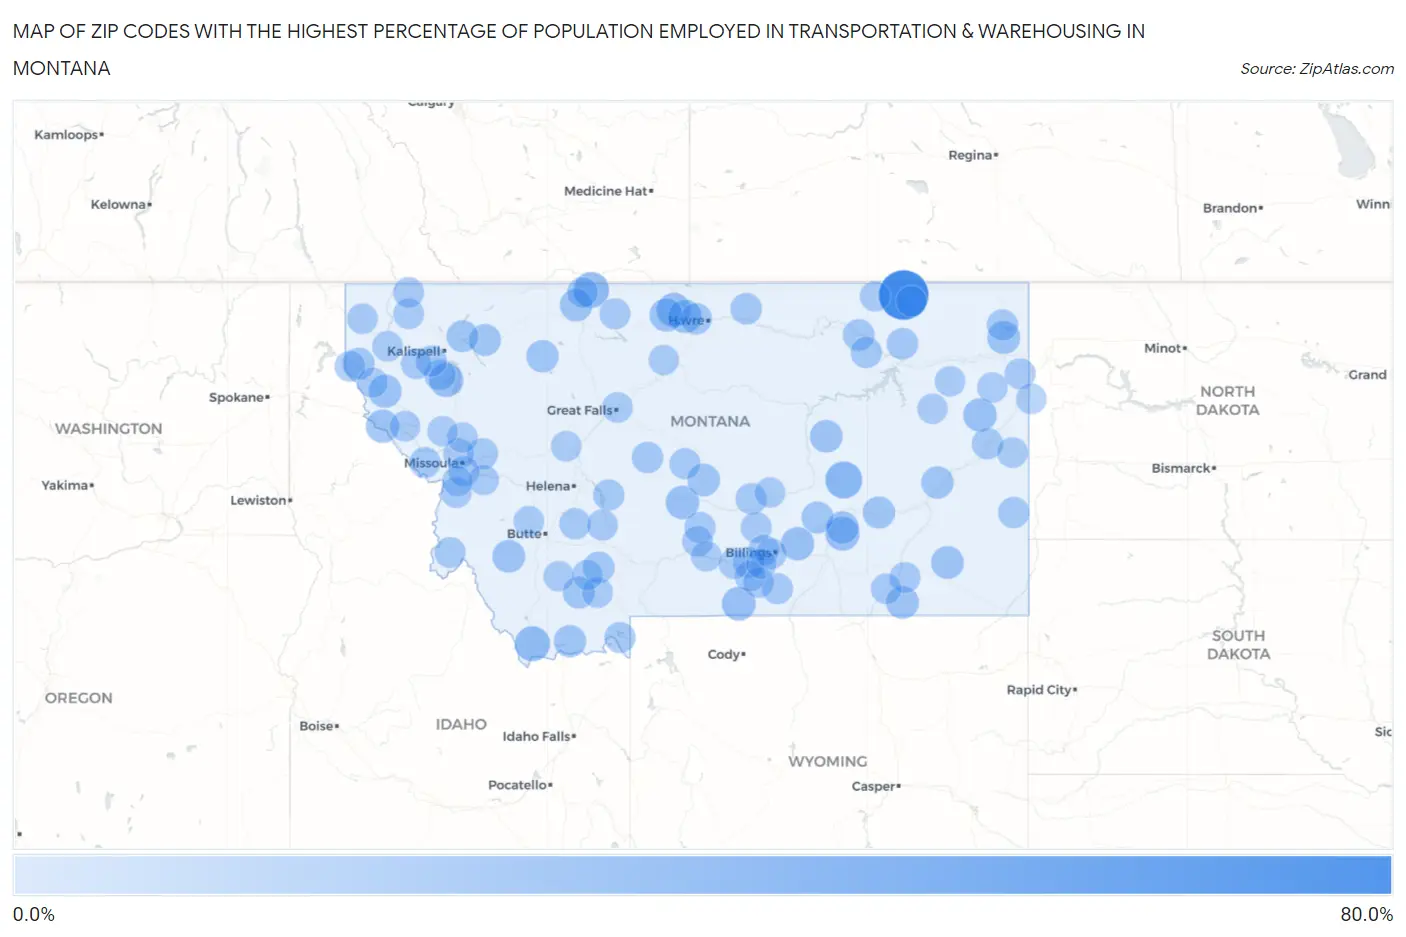
Map of Zip Codes with the Highest Percentage of Population Employed in Transportation & Warehousing in Montana
0.0%
80.0%
Zip Codes with the Highest Percentage of Population Employed in Transportation & Warehousing in Montana
| Zip Code | % Employed | vs State | vs National | |
| 1. | 59240 | 75.0% | 4.3%(+70.7)#1 | 4.9%(+70.1)#33 |
| 2. | 59039 | 28.6% | 4.3%(+24.3)#2 | 4.9%(+23.6)#260 |
| 3. | 59484 | 24.4% | 4.3%(+20.2)#3 | 4.9%(+19.5)#347 |
| 4. | 59724 | 22.2% | 4.3%(+18.0)#4 | 4.9%(+17.3)#426 |
| 5. | 59914 | 19.1% | 4.3%(+14.9)#5 | 4.9%(+14.2)#586 |
| 6. | 59525 | 19.1% | 4.3%(+14.8)#6 | 4.9%(+14.2)#588 |
| 7. | 59010 | 18.8% | 4.3%(+14.5)#7 | 4.9%(+13.8)#617 |
| 8. | 59007 | 17.8% | 4.3%(+13.6)#8 | 4.9%(+12.9)#698 |
| 9. | 59085 | 17.0% | 4.3%(+12.8)#9 | 4.9%(+12.1)#774 |
| 10. | 59532 | 16.9% | 4.3%(+12.6)#10 | 4.9%(+12.0)#784 |
| 11. | 59315 | 16.7% | 4.3%(+12.4)#11 | 4.9%(+11.7)#826 |
| 12. | 59006 | 16.4% | 4.3%(+12.2)#12 | 4.9%(+11.5)#856 |
| 13. | 59528 | 16.3% | 4.3%(+12.0)#13 | 4.9%(+11.3)#872 |
| 14. | 59842 | 16.2% | 4.3%(+11.9)#14 | 4.9%(+11.2)#881 |
| 15. | 59873 | 15.8% | 4.3%(+11.5)#15 | 4.9%(+10.8)#943 |
| 16. | 59226 | 15.4% | 4.3%(+11.1)#16 | 4.9%(+10.4)#988 |
| 17. | 59762 | 14.5% | 4.3%(+10.3)#17 | 4.9%(+9.60)#1,156 |
| 18. | 59062 | 14.3% | 4.3%(+10.0)#18 | 4.9%(+9.34)#1,220 |
| 19. | 59343 | 14.3% | 4.3%(+10.0)#19 | 4.9%(+9.34)#1,222 |
| 20. | 59454 | 14.1% | 4.3%(+9.81)#20 | 4.9%(+9.12)#1,270 |
| 21. | 59077 | 13.8% | 4.3%(+9.54)#21 | 4.9%(+8.85)#1,325 |
| 22. | 59038 | 13.6% | 4.3%(+9.35)#22 | 4.9%(+8.66)#1,374 |
| 23. | 59453 | 13.5% | 4.3%(+9.28)#23 | 4.9%(+8.59)#1,386 |
| 24. | 59338 | 13.3% | 4.3%(+9.08)#24 | 4.9%(+8.39)#1,445 |
| 25. | 59432 | 12.7% | 4.3%(+8.42)#25 | 4.9%(+7.73)#1,627 |
| 26. | 59739 | 12.6% | 4.3%(+8.37)#26 | 4.9%(+7.68)#1,648 |
| 27. | 59327 | 12.3% | 4.3%(+8.07)#27 | 4.9%(+7.37)#1,743 |
| 28. | 59755 | 11.5% | 4.3%(+7.22)#28 | 4.9%(+6.53)#2,086 |
| 29. | 59916 | 11.3% | 4.3%(+7.07)#29 | 4.9%(+6.37)#2,168 |
| 30. | 59853 | 11.3% | 4.3%(+7.00)#30 | 4.9%(+6.30)#2,205 |
| 31. | 59926 | 11.1% | 4.3%(+6.86)#31 | 4.9%(+6.16)#2,269 |
| 32. | 59024 | 11.0% | 4.3%(+6.78)#32 | 4.9%(+6.09)#2,308 |
| 33. | 59745 | 10.9% | 4.3%(+6.61)#33 | 4.9%(+5.92)#2,384 |
| 34. | 59241 | 10.6% | 4.3%(+6.39)#34 | 4.9%(+5.70)#2,500 |
| 35. | 59248 | 10.0% | 4.3%(+5.77)#35 | 4.9%(+5.08)#2,867 |
| 36. | 59465 | 10.0% | 4.3%(+5.75)#36 | 4.9%(+5.05)#2,895 |
| 37. | 59501 | 9.7% | 4.3%(+5.44)#37 | 4.9%(+4.74)#3,080 |
| 38. | 59547 | 9.7% | 4.3%(+5.42)#38 | 4.9%(+4.73)#3,097 |
| 39. | 59330 | 9.5% | 4.3%(+5.20)#39 | 4.9%(+4.51)#3,269 |
| 40. | 59313 | 9.4% | 4.3%(+5.17)#40 | 4.9%(+4.48)#3,288 |
| 41. | 59632 | 9.4% | 4.3%(+5.15)#41 | 4.9%(+4.46)#3,313 |
| 42. | 59929 | 9.3% | 4.3%(+5.08)#42 | 4.9%(+4.39)#3,369 |
| 43. | 59046 | 9.3% | 4.3%(+5.04)#43 | 4.9%(+4.35)#3,401 |
| 44. | 59247 | 9.1% | 4.3%(+4.84)#44 | 4.9%(+4.14)#3,608 |
| 45. | 59823 | 9.0% | 4.3%(+4.78)#45 | 4.9%(+4.09)#3,668 |
| 46. | 59230 | 8.9% | 4.3%(+4.62)#46 | 4.9%(+3.93)#3,849 |
| 47. | 59644 | 8.8% | 4.3%(+4.52)#47 | 4.9%(+3.83)#3,959 |
| 48. | 59920 | 8.6% | 4.3%(+4.38)#48 | 4.9%(+3.69)#4,107 |
| 49. | 59055 | 8.6% | 4.3%(+4.37)#49 | 4.9%(+3.67)#4,135 |
| 50. | 59820 | 8.4% | 4.3%(+4.18)#50 | 4.9%(+3.49)#4,341 |
| 51. | 59066 | 8.3% | 4.3%(+4.01)#51 | 4.9%(+3.31)#4,562 |
| 52. | 59758 | 8.2% | 4.3%(+3.92)#52 | 4.9%(+3.23)#4,663 |
| 53. | 59452 | 8.2% | 4.3%(+3.91)#53 | 4.9%(+3.22)#4,677 |
| 54. | 59829 | 8.1% | 4.3%(+3.89)#54 | 4.9%(+3.20)#4,709 |
| 55. | 59643 | 8.1% | 4.3%(+3.82)#55 | 4.9%(+3.13)#4,793 |
| 56. | 59063 | 8.0% | 4.3%(+3.77)#56 | 4.9%(+3.07)#4,868 |
| 57. | 59015 | 8.0% | 4.3%(+3.73)#57 | 4.9%(+3.03)#4,927 |
| 58. | 59444 | 8.0% | 4.3%(+3.70)#58 | 4.9%(+3.01)#4,959 |
| 59. | 59003 | 7.8% | 4.3%(+3.59)#59 | 4.9%(+2.90)#5,111 |
| 60. | 59808 | 7.8% | 4.3%(+3.59)#60 | 4.9%(+2.90)#5,126 |
| 61. | 59870 | 7.8% | 4.3%(+3.52)#61 | 4.9%(+2.83)#5,213 |
| 62. | 59729 | 7.7% | 4.3%(+3.48)#62 | 4.9%(+2.79)#5,264 |
| 63. | 59221 | 7.7% | 4.3%(+3.41)#63 | 4.9%(+2.72)#5,379 |
| 64. | 59353 | 7.6% | 4.3%(+3.37)#64 | 4.9%(+2.68)#5,436 |
| 65. | 59925 | 7.4% | 4.3%(+3.12)#65 | 4.9%(+2.43)#5,862 |
| 66. | 59011 | 7.3% | 4.3%(+3.09)#66 | 4.9%(+2.40)#5,917 |
| 67. | 59803 | 7.3% | 4.3%(+3.08)#67 | 4.9%(+2.39)#5,923 |
| 68. | 59934 | 7.3% | 4.3%(+3.06)#68 | 4.9%(+2.36)#5,987 |
| 69. | 59106 | 7.3% | 4.3%(+3.00)#69 | 4.9%(+2.31)#6,082 |
| 70. | 59029 | 7.2% | 4.3%(+2.96)#70 | 4.9%(+2.27)#6,164 |
| 71. | 59917 | 7.2% | 4.3%(+2.93)#71 | 4.9%(+2.24)#6,206 |
| 72. | 59414 | 7.2% | 4.3%(+2.91)#72 | 4.9%(+2.22)#6,240 |
| 73. | 59012 | 7.1% | 4.3%(+2.89)#73 | 4.9%(+2.20)#6,296 |
| 74. | 59935 | 7.1% | 4.3%(+2.82)#74 | 4.9%(+2.12)#6,406 |
| 75. | 59844 | 7.0% | 4.3%(+2.79)#75 | 4.9%(+2.10)#6,472 |
| 76. | 59260 | 7.0% | 4.3%(+2.79)#76 | 4.9%(+2.10)#6,475 |
| 77. | 59866 | 7.0% | 4.3%(+2.75)#77 | 4.9%(+2.06)#6,551 |
| 78. | 59033 | 7.0% | 4.3%(+2.72)#78 | 4.9%(+2.03)#6,608 |
| 79. | 59482 | 6.9% | 4.3%(+2.64)#79 | 4.9%(+1.95)#6,758 |
| 80. | 59923 | 6.9% | 4.3%(+2.64)#80 | 4.9%(+1.95)#6,772 |
| 81. | 59102 | 6.8% | 4.3%(+2.59)#81 | 4.9%(+1.90)#6,875 |
| 82. | 59825 | 6.8% | 4.3%(+2.58)#82 | 4.9%(+1.89)#6,895 |
| 83. | 59756 | 6.8% | 4.3%(+2.56)#83 | 4.9%(+1.87)#6,931 |
| 84. | 59041 | 6.8% | 4.3%(+2.54)#84 | 4.9%(+1.84)#6,995 |
| 85. | 59648 | 6.7% | 4.3%(+2.49)#85 | 4.9%(+1.80)#7,061 |
| 86. | 59740 | 6.7% | 4.3%(+2.45)#86 | 4.9%(+1.75)#7,153 |
| 87. | 59833 | 6.7% | 4.3%(+2.44)#87 | 4.9%(+1.75)#7,165 |
| 88. | 59072 | 6.7% | 4.3%(+2.41)#88 | 4.9%(+1.72)#7,226 |
| 89. | 59754 | 6.6% | 4.3%(+2.33)#89 | 4.9%(+1.64)#7,402 |
| 90. | 59821 | 6.5% | 4.3%(+2.25)#90 | 4.9%(+1.55)#7,569 |
| 91. | 59215 | 6.4% | 4.3%(+2.19)#91 | 4.9%(+1.50)#7,692 |
| 92. | 59270 | 6.4% | 4.3%(+2.17)#92 | 4.9%(+1.48)#7,744 |
| 93. | 59243 | 6.3% | 4.3%(+2.08)#93 | 4.9%(+1.39)#7,967 |
| 94. | 59831 | 6.3% | 4.3%(+2.02)#94 | 4.9%(+1.33)#8,095 |
| 95. | 59250 | 6.2% | 4.3%(+1.96)#95 | 4.9%(+1.27)#8,246 |
| 96. | 59019 | 6.2% | 4.3%(+1.96)#96 | 4.9%(+1.27)#8,251 |
| 97. | 59044 | 6.2% | 4.3%(+1.95)#97 | 4.9%(+1.26)#8,278 |
| 98. | 59874 | 6.2% | 4.3%(+1.91)#98 | 4.9%(+1.22)#8,377 |
| 99. | 59460 | 6.1% | 4.3%(+1.87)#99 | 4.9%(+1.18)#8,480 |
| 100. | 59274 | 6.1% | 4.3%(+1.81)#100 | 4.9%(+1.11)#8,651 |
Common Questions
What are the Top 10 Zip Codes with the Highest Percentage of Population Employed in Transportation & Warehousing in Montana?
Top 10 Zip Codes with the Highest Percentage of Population Employed in Transportation & Warehousing in Montana are:
What zip code has the Highest Percentage of Population Employed in Transportation & Warehousing in Montana?
59240 has the Highest Percentage of Population Employed in Transportation & Warehousing in Montana with 75.0%.
What is the Percentage of Population Employed in Transportation & Warehousing in the State of Montana?
Percentage of Population Employed in Transportation & Warehousing in Montana is 4.3%.
What is the Percentage of Population Employed in Transportation & Warehousing in the United States?
Percentage of Population Employed in Transportation & Warehousing in the United States is 4.9%.