Spanish American Indian vs Immigrants from Moldova Family Households
COMPARE
Spanish American Indian
Immigrants from Moldova
Family Households
Family Households Comparison
Spanish American Indians
Immigrants from Moldova
71.2%
FAMILY HOUSEHOLDS
100.0/ 100
METRIC RATING
2nd/ 347
METRIC RANK
64.4%
FAMILY HOUSEHOLDS
65.2/ 100
METRIC RATING
160th/ 347
METRIC RANK
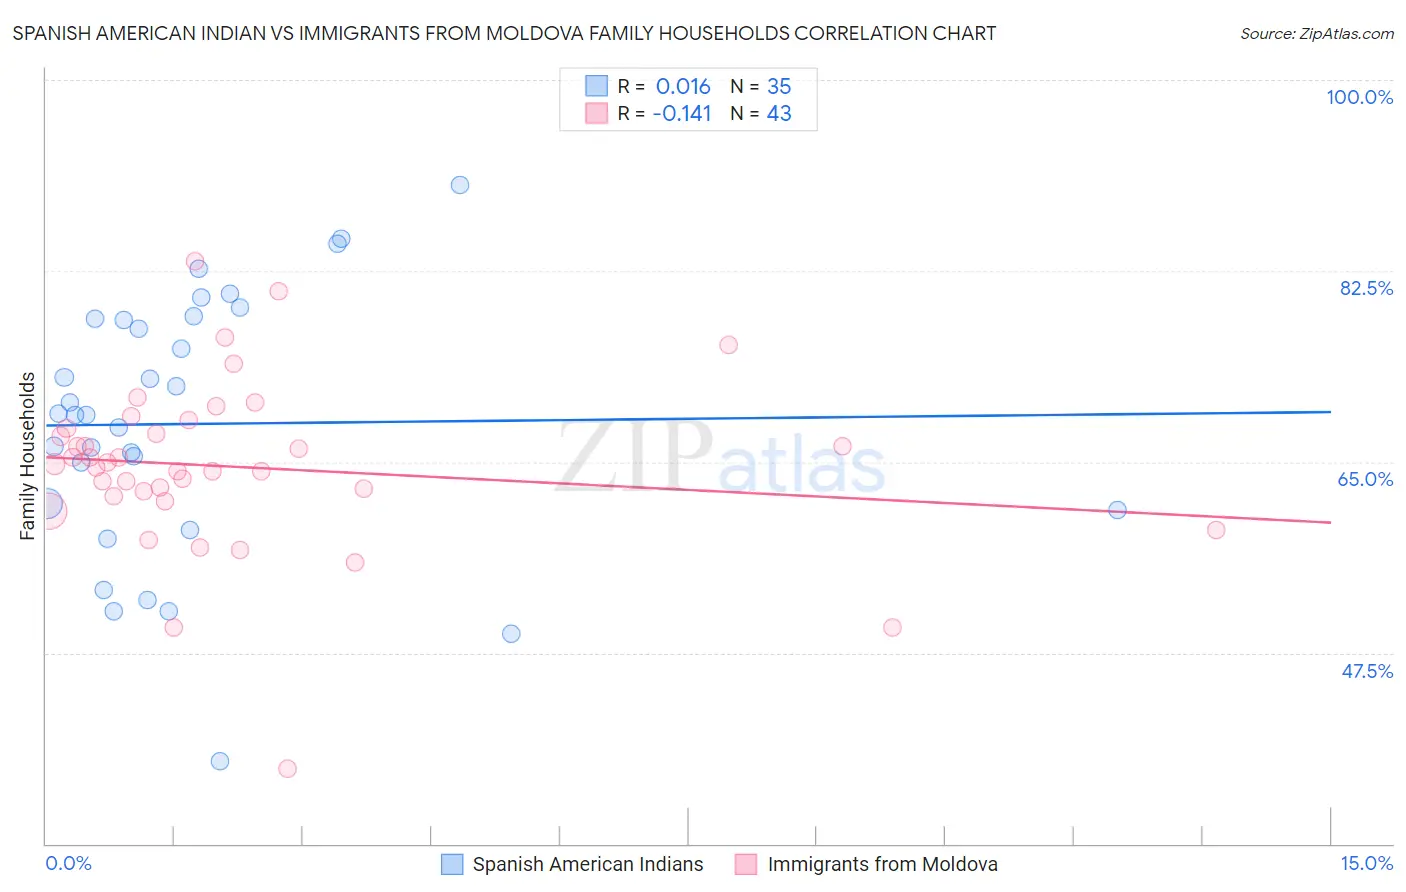
Spanish American Indian vs Immigrants from Moldova Family Households Correlation Chart
The statistical analysis conducted on geographies consisting of 73,145,550 people shows no correlation between the proportion of Spanish American Indians and percentage of family households in the United States with a correlation coefficient (R) of 0.016 and weighted average of 71.2%. Similarly, the statistical analysis conducted on geographies consisting of 124,364,803 people shows a poor negative correlation between the proportion of Immigrants from Moldova and percentage of family households in the United States with a correlation coefficient (R) of -0.141 and weighted average of 64.4%, a difference of 10.4%.
Family Households Correlation Summary
| Measurement | Spanish American Indian | Immigrants from Moldova |
| Minimum | 37.6% | 36.9% |
| Maximum | 90.4% | 83.4% |
| Range | 52.8% | 46.5% |
| Mean | 68.5% | 64.5% |
| Median | 69.3% | 64.8% |
| Interquartile 25% (IQ1) | 60.6% | 61.9% |
| Interquartile 75% (IQ3) | 78.1% | 68.1% |
| Interquartile Range (IQR) | 17.5% | 6.2% |
| Standard Deviation (Sample) | 11.9% | 8.0% |
| Standard Deviation (Population) | 11.8% | 7.9% |
Similar Demographics by Family Households
Demographics Similar to Spanish American Indians by Family Households
In terms of family households, the demographic groups most similar to Spanish American Indians are Yup'ik (72.4%, a difference of 1.8%), Tongan (69.6%, a difference of 2.2%), Yakama (69.3%, a difference of 2.7%), Yuman (69.3%, a difference of 2.7%), and Immigrants from Mexico (69.1%, a difference of 2.9%).
| Demographics | Rating | Rank | Family Households |
| Yup'ik | 100 /100 | #1 | Exceptional 72.4% |
| Spanish American Indians | 100.0 /100 | #2 | Exceptional 71.2% |
| Tongans | 100.0 /100 | #3 | Exceptional 69.6% |
| Yakama | 100.0 /100 | #4 | Exceptional 69.3% |
| Yuman | 100.0 /100 | #5 | Exceptional 69.3% |
| Immigrants | Mexico | 100.0 /100 | #6 | Exceptional 69.1% |
| Mexicans | 100.0 /100 | #7 | Exceptional 69.0% |
| Immigrants | Fiji | 100.0 /100 | #8 | Exceptional 68.8% |
| Native Hawaiians | 100.0 /100 | #9 | Exceptional 68.4% |
| Immigrants | Philippines | 100.0 /100 | #10 | Exceptional 68.3% |
| Immigrants | Central America | 100.0 /100 | #11 | Exceptional 68.3% |
| Koreans | 100.0 /100 | #12 | Exceptional 68.3% |
| Pueblo | 100.0 /100 | #13 | Exceptional 68.2% |
| Immigrants | Cuba | 100.0 /100 | #14 | Exceptional 68.2% |
| Assyrians/Chaldeans/Syriacs | 100.0 /100 | #15 | Exceptional 68.2% |
Demographics Similar to Immigrants from Moldova by Family Households
In terms of family households, the demographic groups most similar to Immigrants from Moldova are German (64.4%, a difference of 0.010%), Canadian (64.4%, a difference of 0.020%), Lebanese (64.4%, a difference of 0.020%), Czech (64.5%, a difference of 0.030%), and Uruguayan (64.5%, a difference of 0.040%).
| Demographics | Rating | Rank | Family Households |
| Swedes | 69.8 /100 | #153 | Good 64.5% |
| Austrians | 68.5 /100 | #154 | Good 64.5% |
| Uruguayans | 67.7 /100 | #155 | Good 64.5% |
| Czechs | 67.0 /100 | #156 | Good 64.5% |
| Canadians | 66.6 /100 | #157 | Good 64.4% |
| Lebanese | 66.4 /100 | #158 | Good 64.4% |
| Germans | 65.8 /100 | #159 | Good 64.4% |
| Immigrants | Moldova | 65.2 /100 | #160 | Good 64.4% |
| Immigrants | England | 62.6 /100 | #161 | Good 64.4% |
| British | 61.6 /100 | #162 | Good 64.4% |
| Chickasaw | 61.5 /100 | #163 | Good 64.4% |
| Immigrants | Nigeria | 60.1 /100 | #164 | Good 64.4% |
| Immigrants | Southern Europe | 60.0 /100 | #165 | Good 64.4% |
| Scotch-Irish | 59.2 /100 | #166 | Average 64.4% |
| Irish | 57.9 /100 | #167 | Average 64.4% |