Sri Lankan vs Immigrants from Czechoslovakia Cognitive Disability
COMPARE
Sri Lankan
Immigrants from Czechoslovakia
Cognitive Disability
Cognitive Disability Comparison
Sri Lankans
Immigrants from Czechoslovakia
17.1%
COGNITIVE DISABILITY
78.9/ 100
METRIC RATING
156th/ 347
METRIC RANK
16.2%
COGNITIVE DISABILITY
100.0/ 100
METRIC RATING
11th/ 347
METRIC RANK
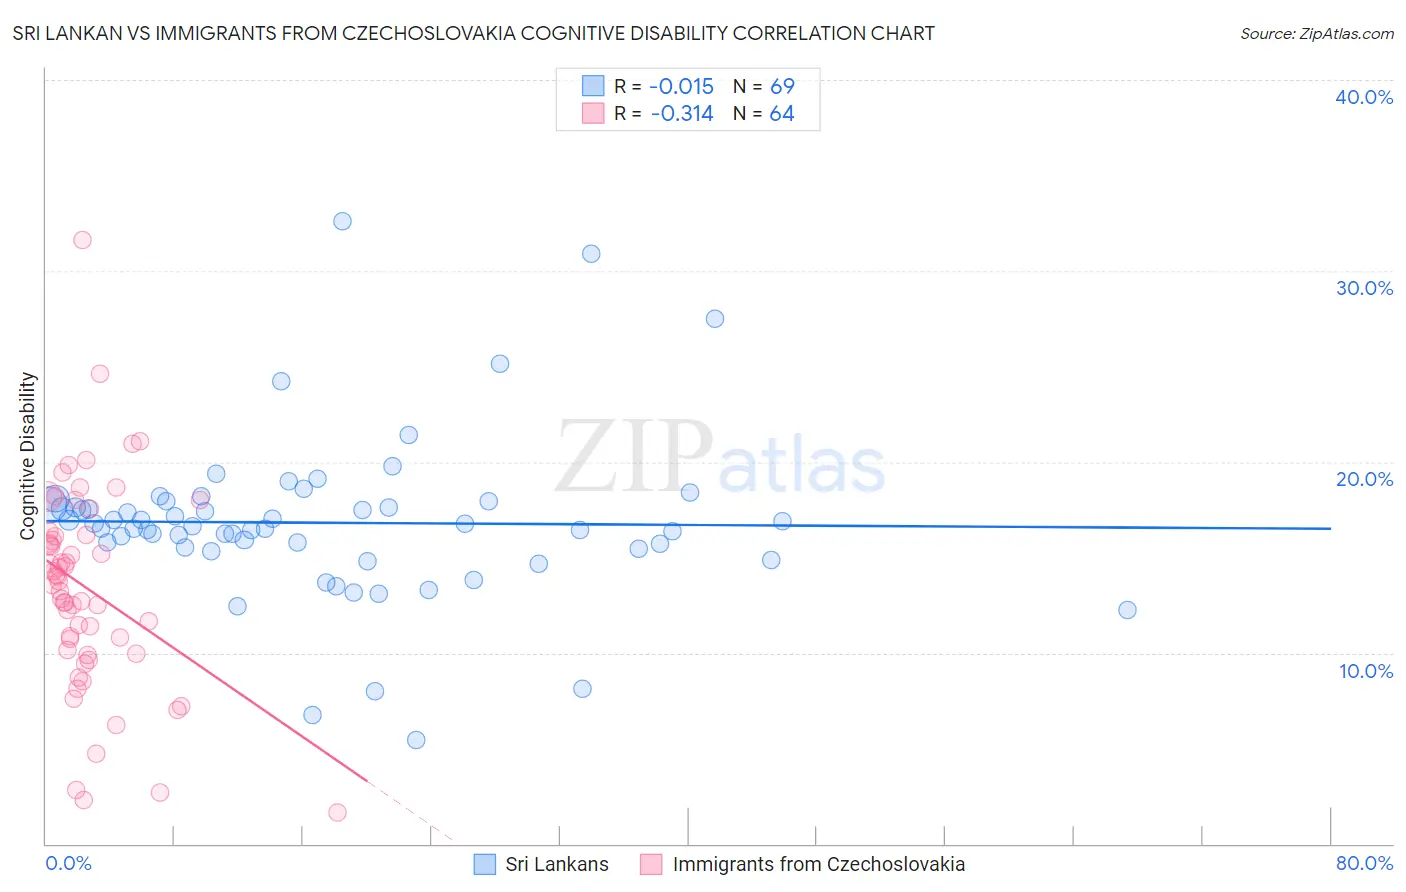
Sri Lankan vs Immigrants from Czechoslovakia Cognitive Disability Correlation Chart
The statistical analysis conducted on geographies consisting of 440,507,273 people shows no correlation between the proportion of Sri Lankans and percentage of population with cognitive disability in the United States with a correlation coefficient (R) of -0.015 and weighted average of 17.1%. Similarly, the statistical analysis conducted on geographies consisting of 195,454,125 people shows a mild negative correlation between the proportion of Immigrants from Czechoslovakia and percentage of population with cognitive disability in the United States with a correlation coefficient (R) of -0.314 and weighted average of 16.2%, a difference of 5.6%.
Cognitive Disability Correlation Summary
| Measurement | Sri Lankan | Immigrants from Czechoslovakia |
| Minimum | 5.5% | 1.7% |
| Maximum | 32.6% | 31.6% |
| Range | 27.2% | 30.0% |
| Mean | 16.8% | 13.3% |
| Median | 16.6% | 13.6% |
| Interquartile 25% (IQ1) | 15.5% | 10.1% |
| Interquartile 75% (IQ3) | 17.8% | 16.1% |
| Interquartile Range (IQR) | 2.4% | 6.1% |
| Standard Deviation (Sample) | 4.3% | 5.4% |
| Standard Deviation (Population) | 4.3% | 5.3% |
Similar Demographics by Cognitive Disability
Demographics Similar to Sri Lankans by Cognitive Disability
In terms of cognitive disability, the demographic groups most similar to Sri Lankans are Brazilian (17.1%, a difference of 0.0%), Immigrants from Malaysia (17.1%, a difference of 0.020%), Immigrants from Kazakhstan (17.1%, a difference of 0.070%), Immigrants from Australia (17.1%, a difference of 0.12%), and Immigrants from Indonesia (17.1%, a difference of 0.18%).
| Demographics | Rating | Rank | Cognitive Disability |
| Cypriots | 85.7 /100 | #149 | Excellent 17.1% |
| Basques | 85.5 /100 | #150 | Excellent 17.1% |
| Syrians | 83.0 /100 | #151 | Excellent 17.1% |
| Immigrants | Indonesia | 82.7 /100 | #152 | Excellent 17.1% |
| Immigrants | Kazakhstan | 80.5 /100 | #153 | Excellent 17.1% |
| Immigrants | Malaysia | 79.3 /100 | #154 | Good 17.1% |
| Brazilians | 78.9 /100 | #155 | Good 17.1% |
| Sri Lankans | 78.9 /100 | #156 | Good 17.1% |
| Immigrants | Australia | 76.0 /100 | #157 | Good 17.1% |
| Celtics | 74.1 /100 | #158 | Good 17.1% |
| Immigrants | Latvia | 73.2 /100 | #159 | Good 17.2% |
| Australians | 72.4 /100 | #160 | Good 17.2% |
| Americans | 72.2 /100 | #161 | Good 17.2% |
| Yugoslavians | 71.6 /100 | #162 | Good 17.2% |
| Immigrants | Switzerland | 71.5 /100 | #163 | Good 17.2% |
Demographics Similar to Immigrants from Czechoslovakia by Cognitive Disability
In terms of cognitive disability, the demographic groups most similar to Immigrants from Czechoslovakia are Immigrants from Scotland (16.2%, a difference of 0.080%), Assyrian/Chaldean/Syriac (16.2%, a difference of 0.13%), Maltese (16.2%, a difference of 0.16%), Lithuanian (16.3%, a difference of 0.25%), and Immigrants from Austria (16.3%, a difference of 0.31%).
| Demographics | Rating | Rank | Cognitive Disability |
| Immigrants | Lithuania | 100.0 /100 | #4 | Exceptional 16.0% |
| Immigrants | Hong Kong | 100.0 /100 | #5 | Exceptional 16.0% |
| Thais | 100.0 /100 | #6 | Exceptional 16.1% |
| Immigrants | Ireland | 100.0 /100 | #7 | Exceptional 16.1% |
| Immigrants | Poland | 100.0 /100 | #8 | Exceptional 16.1% |
| Assyrians/Chaldeans/Syriacs | 100.0 /100 | #9 | Exceptional 16.2% |
| Immigrants | Scotland | 100.0 /100 | #10 | Exceptional 16.2% |
| Immigrants | Czechoslovakia | 100.0 /100 | #11 | Exceptional 16.2% |
| Maltese | 100.0 /100 | #12 | Exceptional 16.2% |
| Lithuanians | 100.0 /100 | #13 | Exceptional 16.3% |
| Immigrants | Austria | 100.0 /100 | #14 | Exceptional 16.3% |
| Immigrants | Greece | 100.0 /100 | #15 | Exceptional 16.3% |
| Eastern Europeans | 100.0 /100 | #16 | Exceptional 16.3% |
| Immigrants | North Macedonia | 100.0 /100 | #17 | Exceptional 16.3% |
| Immigrants | Northern Europe | 100.0 /100 | #18 | Exceptional 16.3% |