Immigrants from Lebanon vs Immigrants from Costa Rica Hearing Disability
COMPARE
Immigrants from Lebanon
Immigrants from Costa Rica
Hearing Disability
Hearing Disability Comparison
Immigrants from Lebanon
Immigrants from Costa Rica
2.9%
HEARING DISABILITY
71.5/ 100
METRIC RATING
154th/ 347
METRIC RANK
2.9%
HEARING DISABILITY
84.0/ 100
METRIC RATING
138th/ 347
METRIC RANK
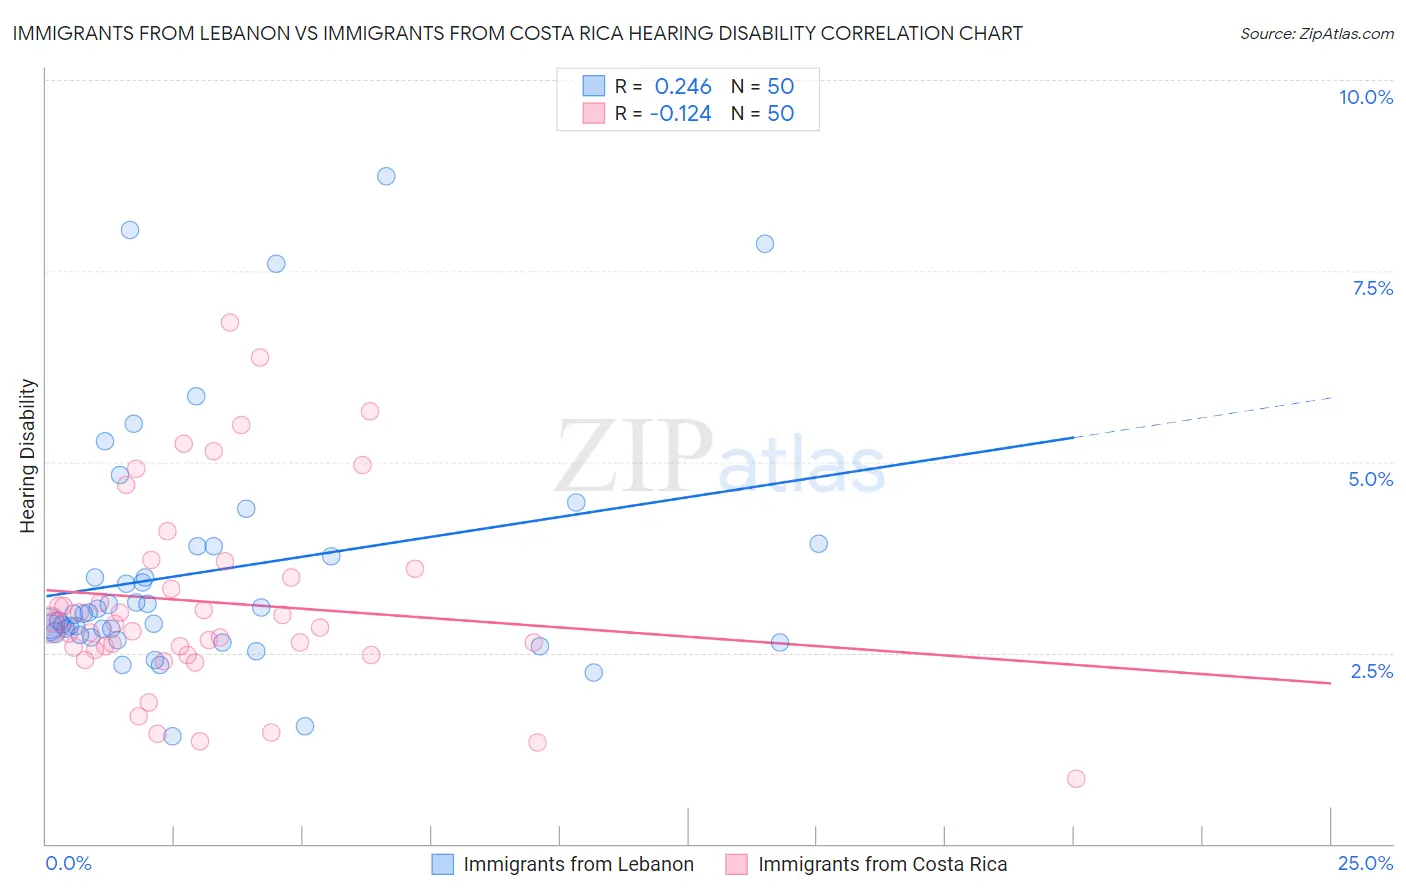
Immigrants from Lebanon vs Immigrants from Costa Rica Hearing Disability Correlation Chart
The statistical analysis conducted on geographies consisting of 217,145,766 people shows a weak positive correlation between the proportion of Immigrants from Lebanon and percentage of population with hearing disability in the United States with a correlation coefficient (R) of 0.246 and weighted average of 2.9%. Similarly, the statistical analysis conducted on geographies consisting of 204,259,714 people shows a poor negative correlation between the proportion of Immigrants from Costa Rica and percentage of population with hearing disability in the United States with a correlation coefficient (R) of -0.124 and weighted average of 2.9%, a difference of 1.8%.
Hearing Disability Correlation Summary
| Measurement | Immigrants from Lebanon | Immigrants from Costa Rica |
| Minimum | 1.4% | 0.86% |
| Maximum | 8.7% | 6.8% |
| Range | 7.3% | 6.0% |
| Mean | 3.6% | 3.2% |
| Median | 3.0% | 2.8% |
| Interquartile 25% (IQ1) | 2.7% | 2.5% |
| Interquartile 75% (IQ3) | 3.9% | 3.6% |
| Interquartile Range (IQR) | 1.2% | 1.1% |
| Standard Deviation (Sample) | 1.6% | 1.3% |
| Standard Deviation (Population) | 1.6% | 1.3% |
Demographics Similar to Immigrants from Lebanon and Immigrants from Costa Rica by Hearing Disability
In terms of hearing disability, the demographic groups most similar to Immigrants from Lebanon are Costa Rican (2.9%, a difference of 0.010%), Sudanese (2.9%, a difference of 0.070%), Immigrants from Poland (2.9%, a difference of 0.15%), Immigrants from Lithuania (2.9%, a difference of 0.18%), and Immigrants from France (2.9%, a difference of 0.19%). Similarly, the demographic groups most similar to Immigrants from Costa Rica are Sri Lankan (2.9%, a difference of 0.010%), Bermudan (2.9%, a difference of 0.050%), Immigrants from Jordan (2.9%, a difference of 0.060%), Immigrants from Brazil (2.9%, a difference of 0.10%), and Subsaharan African (2.9%, a difference of 0.13%).
| Demographics | Rating | Rank | Hearing Disability |
| Immigrants | Brazil | 84.6 /100 | #136 | Excellent 2.9% |
| Sri Lankans | 84.1 /100 | #137 | Excellent 2.9% |
| Immigrants | Costa Rica | 84.0 /100 | #138 | Excellent 2.9% |
| Bermudans | 83.8 /100 | #139 | Excellent 2.9% |
| Immigrants | Jordan | 83.7 /100 | #140 | Excellent 2.9% |
| Sub-Saharan Africans | 83.3 /100 | #141 | Excellent 2.9% |
| Laotians | 81.1 /100 | #142 | Excellent 2.9% |
| Immigrants | Bahamas | 80.9 /100 | #143 | Excellent 2.9% |
| Immigrants | Bulgaria | 79.2 /100 | #144 | Good 2.9% |
| Immigrants | Congo | 78.9 /100 | #145 | Good 2.9% |
| Brazilians | 78.7 /100 | #146 | Good 2.9% |
| Tongans | 78.6 /100 | #147 | Good 2.9% |
| Immigrants | Russia | 77.7 /100 | #148 | Good 2.9% |
| Immigrants | Panama | 76.9 /100 | #149 | Good 2.9% |
| Palestinians | 73.6 /100 | #150 | Good 2.9% |
| Immigrants | France | 73.1 /100 | #151 | Good 2.9% |
| Immigrants | Lithuania | 73.0 /100 | #152 | Good 2.9% |
| Sudanese | 72.1 /100 | #153 | Good 2.9% |
| Immigrants | Lebanon | 71.5 /100 | #154 | Good 2.9% |
| Costa Ricans | 71.4 /100 | #155 | Good 2.9% |
| Immigrants | Poland | 70.2 /100 | #156 | Good 2.9% |