Prosperity, WV
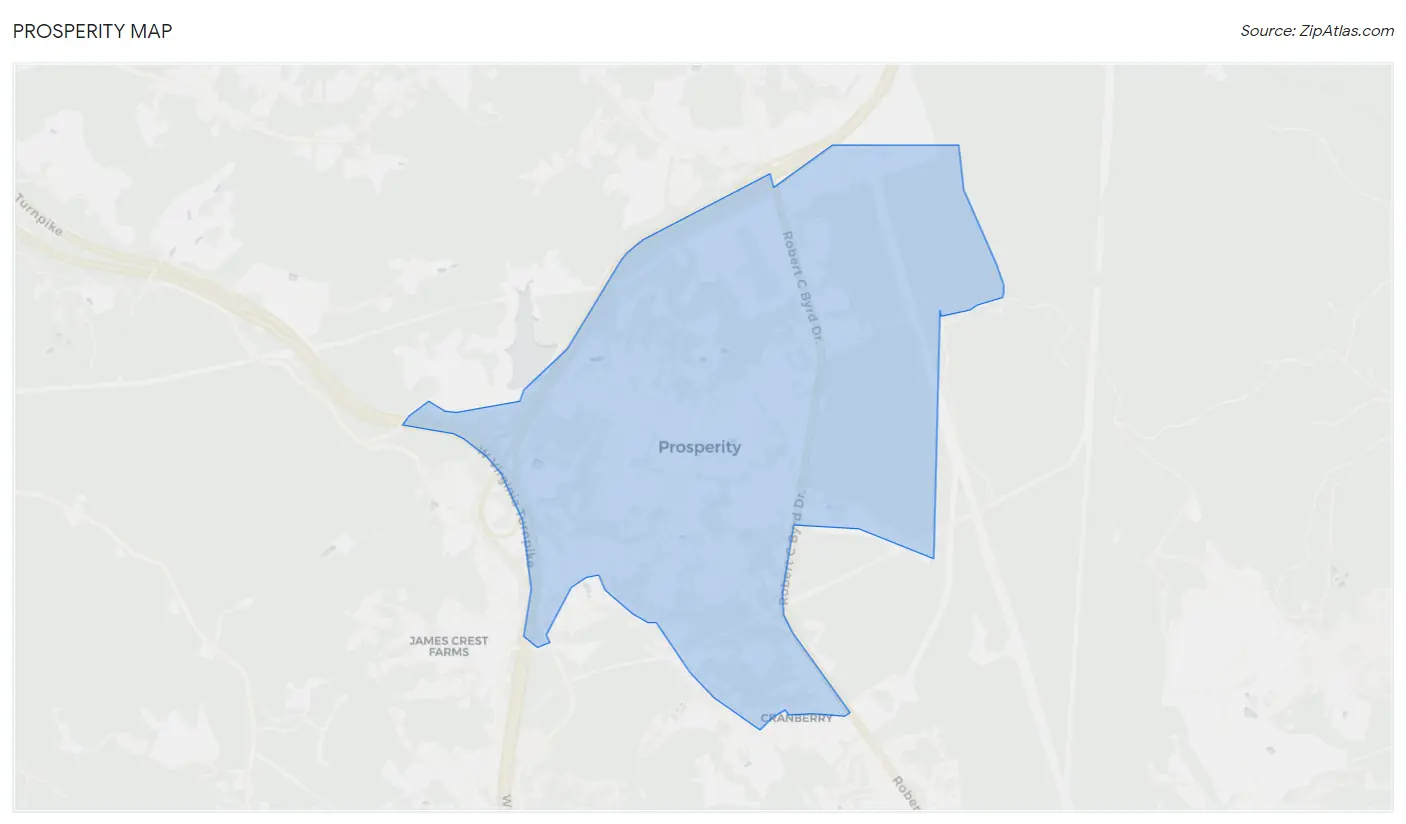
Prosperity Map
Prosperity Overview
1,531
TOTAL POPULATION
854
MALE POPULATION
677
FEMALE POPULATION
126.14
MALES / 100 FEMALES
79.27
FEMALES / 100 MALES
41.3
MEDIAN AGE
3.1
AVG FAMILY SIZE
3.2
AVG HOUSEHOLD SIZE
$24,408
PER CAPITA INCOME
$68,333
AVG FAMILY INCOME
$66,905
AVG HOUSEHOLD INCOME
0.34
INEQUALITY / GINI INDEX
732
LABOR FORCE [ PEOPLE ]
58.3%
PERCENT IN LABOR FORCE
16.8%
UNEMPLOYMENT RATE
Prosperity Zip Codes
Prosperity Area Codes
Race in Prosperity
The most populous races in Prosperity are White / Caucasian (1,131 | 73.9%), Black / African American (251 | 16.4%), and Two or more Races (149 | 9.7%).
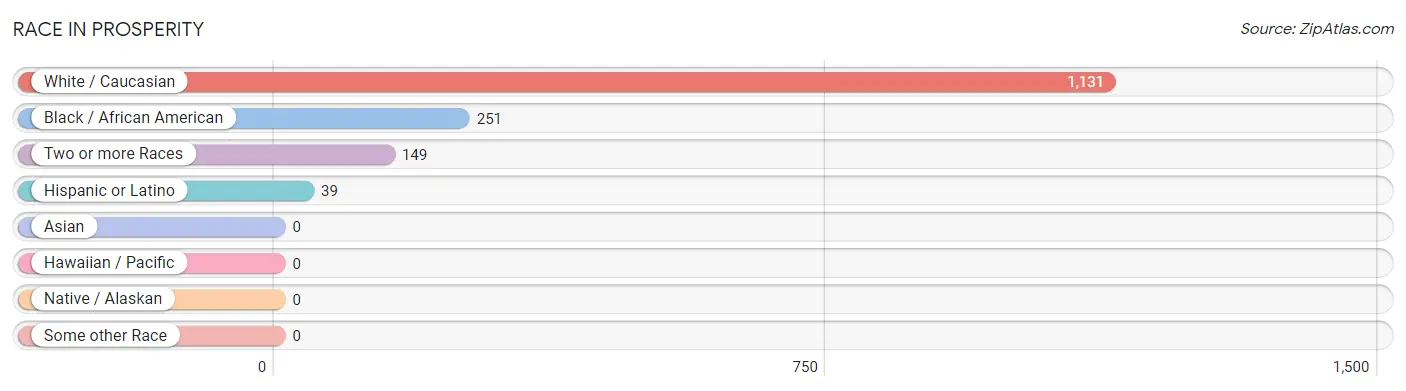
| Race | # Population | % Population |
| Asian | 0 | 0.0% |
| Black / African American | 251 | 16.4% |
| Hawaiian / Pacific | 0 | 0.0% |
| Hispanic or Latino | 39 | 2.5% |
| Native / Alaskan | 0 | 0.0% |
| White / Caucasian | 1,131 | 73.9% |
| Two or more Races | 149 | 9.7% |
| Some other Race | 0 | 0.0% |
| Total | 1,531 | 100.0% |
Ancestry in Prosperity
The most populous ancestries reported in Prosperity are Irish (400 | 26.1%), English (228 | 14.9%), American (110 | 7.2%), German (92 | 6.0%), and Italian (55 | 3.6%), together accounting for 57.8% of all Prosperity residents.
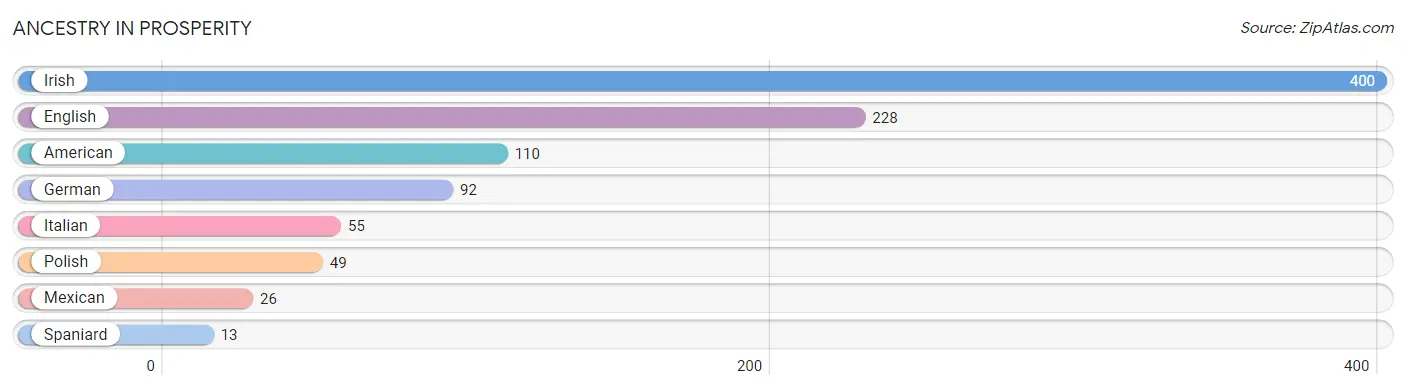
| Ancestry | # Population | % Population |
| American | 110 | 7.2% |
| English | 228 | 14.9% |
| German | 92 | 6.0% |
| Irish | 400 | 26.1% |
| Italian | 55 | 3.6% |
| Mexican | 26 | 1.7% |
| Polish | 49 | 3.2% |
| Spaniard | 13 | 0.9% | View All 8 Rows |
Immigrants in Prosperity
The most numerous immigrant groups reported in Prosperity came from Brazil (13 | 0.9%), Latin America (13 | 0.9%), and South America (13 | 0.9%), together accounting for 2.6% of all Prosperity residents.
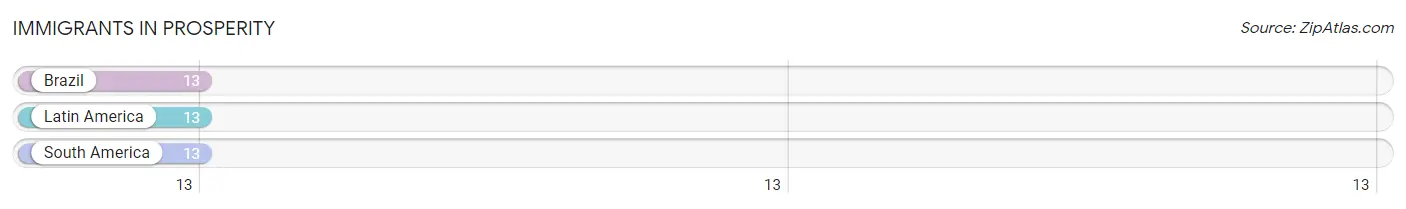
| Immigration Origin | # Population | % Population |
| Brazil | 13 | 0.9% |
| Latin America | 13 | 0.9% |
| South America | 13 | 0.9% | View All 3 Rows |
Sex and Age in Prosperity
Sex and Age in Prosperity
The most populous age groups in Prosperity are 35 to 39 Years (186 | 21.8%) for men and 60 to 64 Years (172 | 25.4%) for women.
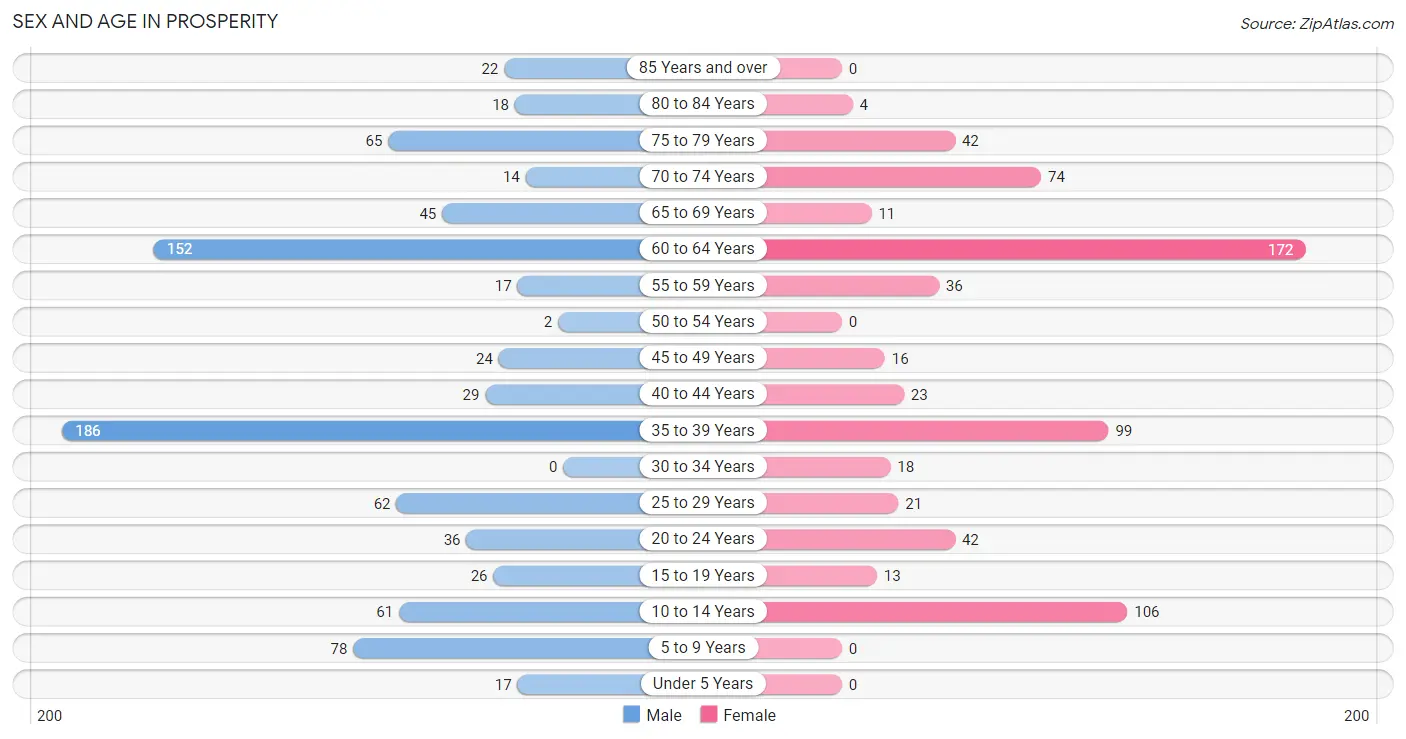
| Age Bracket | Male | Female |
| Under 5 Years | 17 (2.0%) | 0 (0.0%) |
| 5 to 9 Years | 78 (9.1%) | 0 (0.0%) |
| 10 to 14 Years | 61 (7.1%) | 106 (15.7%) |
| 15 to 19 Years | 26 (3.0%) | 13 (1.9%) |
| 20 to 24 Years | 36 (4.2%) | 42 (6.2%) |
| 25 to 29 Years | 62 (7.3%) | 21 (3.1%) |
| 30 to 34 Years | 0 (0.0%) | 18 (2.7%) |
| 35 to 39 Years | 186 (21.8%) | 99 (14.6%) |
| 40 to 44 Years | 29 (3.4%) | 23 (3.4%) |
| 45 to 49 Years | 24 (2.8%) | 16 (2.4%) |
| 50 to 54 Years | 2 (0.2%) | 0 (0.0%) |
| 55 to 59 Years | 17 (2.0%) | 36 (5.3%) |
| 60 to 64 Years | 152 (17.8%) | 172 (25.4%) |
| 65 to 69 Years | 45 (5.3%) | 11 (1.6%) |
| 70 to 74 Years | 14 (1.6%) | 74 (10.9%) |
| 75 to 79 Years | 65 (7.6%) | 42 (6.2%) |
| 80 to 84 Years | 18 (2.1%) | 4 (0.6%) |
| 85 Years and over | 22 (2.6%) | 0 (0.0%) |
| Total | 854 (100.0%) | 677 (100.0%) |
Families and Households in Prosperity
Median Family Size in Prosperity
The median family size in Prosperity is 3.13 persons per family, with single female/mother families (66 | 15.1%) accounting for the largest median family size of 5.17 persons per family. On the other hand, single male/father families (45 | 10.3%) represent the smallest median family size with 2.20 persons per family.
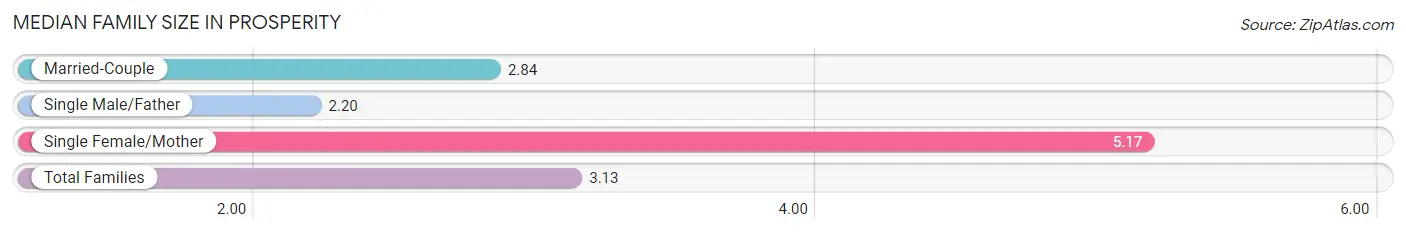
| Family Type | # Families | Family Size |
| Married-Couple | 327 (74.7%) | 2.84 |
| Single Male/Father | 45 (10.3%) | 2.20 |
| Single Female/Mother | 66 (15.1%) | 5.17 |
| Total Families | 438 (100.0%) | 3.13 |
Median Household Size in Prosperity
The median household size in Prosperity is 3.19 persons per household, with single female/mother households (66 | 13.9%) accounting for the largest median household size of 6.29 persons per household. non-family households (38 | 8.0%) represent the smallest median household size with 1.95 persons per household.
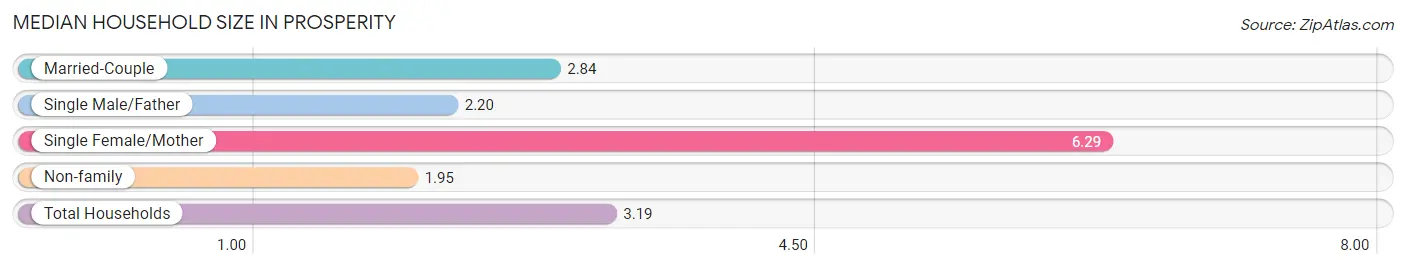
| Household Type | # Households | Household Size |
| Married-Couple | 327 (68.7%) | 2.84 |
| Single Male/Father | 45 (9.5%) | 2.20 |
| Single Female/Mother | 66 (13.9%) | 6.29 |
| Non-family | 38 (8.0%) | 1.95 |
| Total Households | 476 (100.0%) | 3.19 |
Household Size by Marriage Status in Prosperity
Out of a total of 476 households in Prosperity, 438 (92.0%) are family households, while 38 (8.0%) are nonfamily households. The most numerous type of family households are 2-person households, comprising 250, and the most common type of nonfamily households are 2-person households, comprising 25.
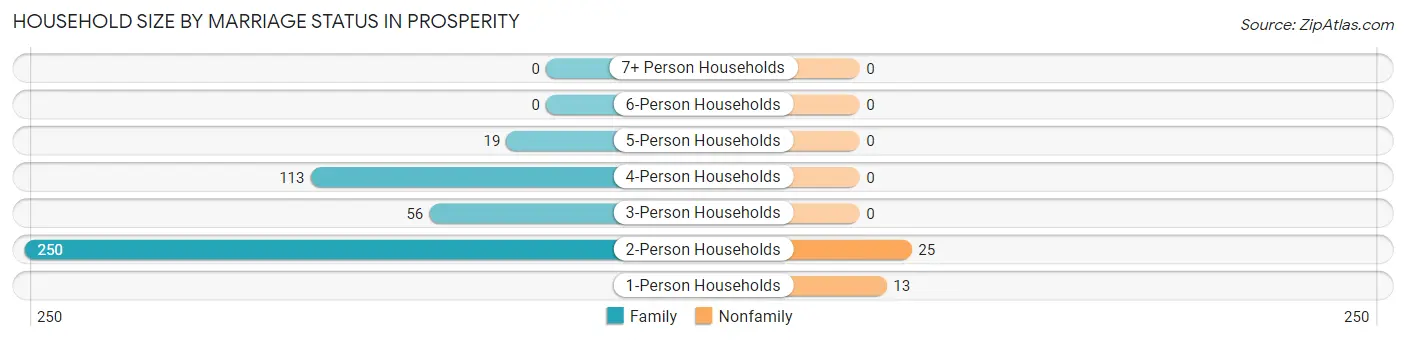
| Household Size | Family Households | Nonfamily Households |
| 1-Person Households | - | 13 (2.7%) |
| 2-Person Households | 250 (52.5%) | 25 (5.2%) |
| 3-Person Households | 56 (11.8%) | 0 (0.0%) |
| 4-Person Households | 113 (23.7%) | 0 (0.0%) |
| 5-Person Households | 19 (4.0%) | 0 (0.0%) |
| 6-Person Households | 0 (0.0%) | 0 (0.0%) |
| 7+ Person Households | 0 (0.0%) | 0 (0.0%) |
| Total | 438 (92.0%) | 38 (8.0%) |
Female Fertility in Prosperity
Fertility by Age in Prosperity
Average fertility rate in Prosperity is 86.0 births per 1,000 women. Women in the age bracket of 20 to 34 years have the highest fertility rate with 247.0 births per 1,000 women. Women in the age bracket of 20 to 34 years acount for 100.0% of all women with births.
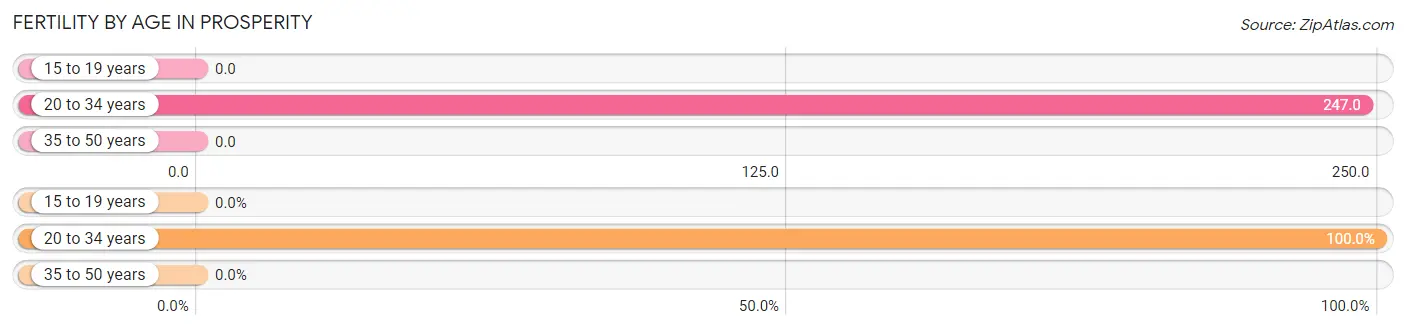
| Age Bracket | Women with Births | Births / 1,000 Women |
| 15 to 19 years | 0 (0.0%) | 0.0 |
| 20 to 34 years | 20 (100.0%) | 247.0 |
| 35 to 50 years | 0 (0.0%) | 0.0 |
| Total | 20 (100.0%) | 86.0 |
Fertility by Age by Marriage Status in Prosperity
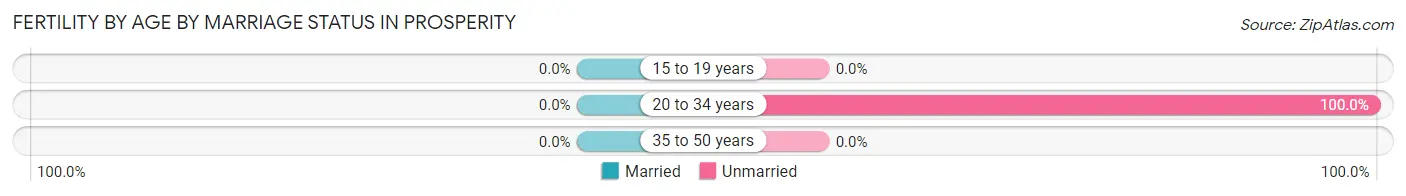
| Age Bracket | Married | Unmarried |
| 15 to 19 years | 0 (0.0%) | 0 (0.0%) |
| 20 to 34 years | 0 (0.0%) | 20 (100.0%) |
| 35 to 50 years | 0 (0.0%) | 0 (0.0%) |
| Total | 0 (0.0%) | 20 (100.0%) |
Fertility by Education in Prosperity
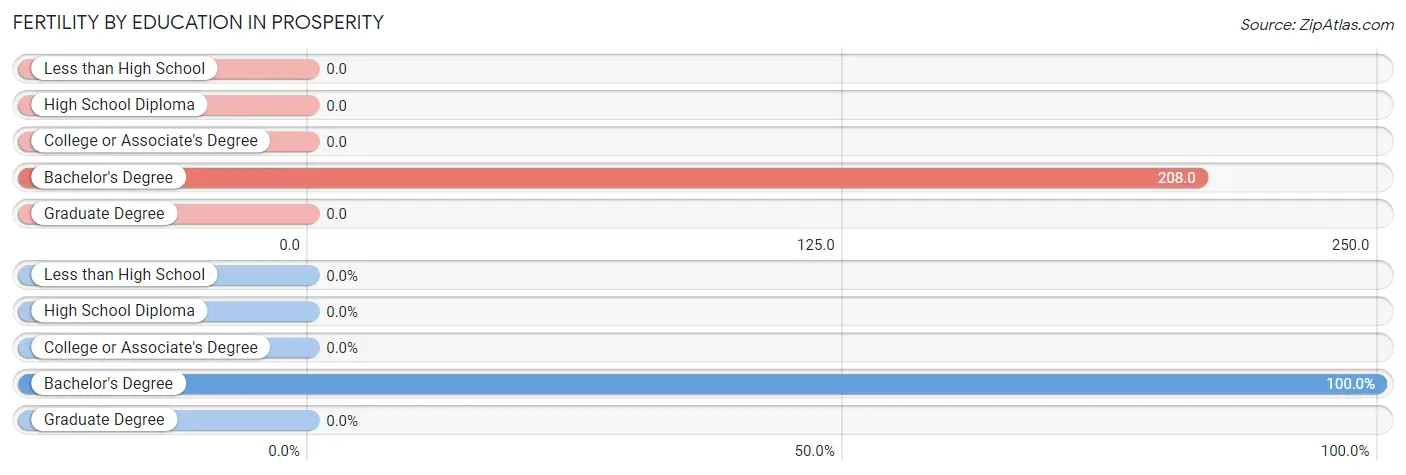
| Educational Attainment | Women with Births | Births / 1,000 Women |
| Less than High School | 0 (0.0%) | 0.0 |
| High School Diploma | 0 (0.0%) | 0.0 |
| College or Associate's Degree | 0 (0.0%) | 0.0 |
| Bachelor's Degree | 20 (100.0%) | 208.0 |
| Graduate Degree | 0 (0.0%) | 0.0 |
| Total | 20 (100.0%) | 86.0 |
Fertility by Education by Marriage Status in Prosperity
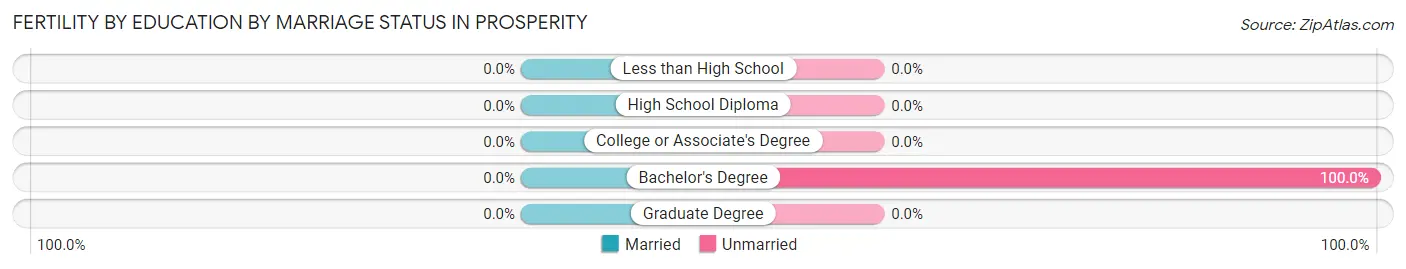
| Educational Attainment | Married | Unmarried |
| Less than High School | 0 (0.0%) | 0 (0.0%) |
| High School Diploma | 0 (0.0%) | 0 (0.0%) |
| College or Associate's Degree | 0 (0.0%) | 0 (0.0%) |
| Bachelor's Degree | 0 (0.0%) | 20 (100.0%) |
| Graduate Degree | 0 (0.0%) | 0 (0.0%) |
| Total | 0 (0.0%) | 20 (100.0%) |
Income in Prosperity
Income Overview in Prosperity
Per Capita Income in Prosperity is $24,408, while median incomes of families and households are $68,333 and $66,905 respectively.
| Characteristic | Number | Measure |
| Per Capita Income | 1,531 | $24,408 |
| Median Family Income | 438 | $68,333 |
| Mean Family Income | 438 | $77,974 |
| Median Household Income | 476 | $66,905 |
| Mean Household Income | 476 | $74,569 |
| Income Deficit | 438 | $0 |
| Wage / Income Gap (%) | 1,531 | 0.00% |
| Wage / Income Gap ($) | 1,531 | 100.00¢ per $1 |
| Gini / Inequality Index | 1,531 | 0.34 |
Earnings by Sex in Prosperity
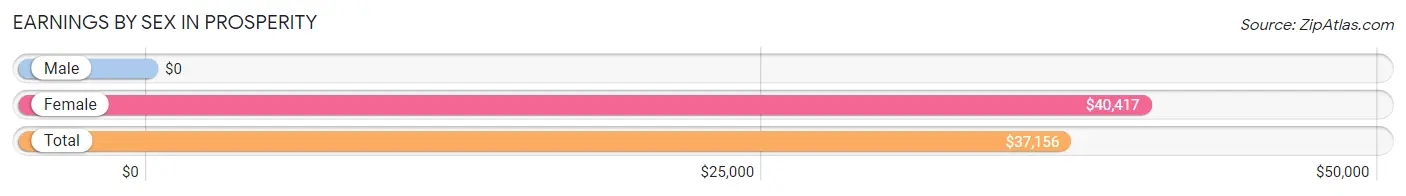
| Sex | Number | Average Earnings |
| Male | 317 (47.5%) | $0 |
| Female | 350 (52.5%) | $40,417 |
| Total | 667 (100.0%) | $37,156 |
Earnings by Sex by Income Bracket in Prosperity
The most common earnings brackets in Prosperity are $55,000 to $64,999 for men (102 | 32.2%) and $40,000 to $44,999 for women (132 | 37.7%).
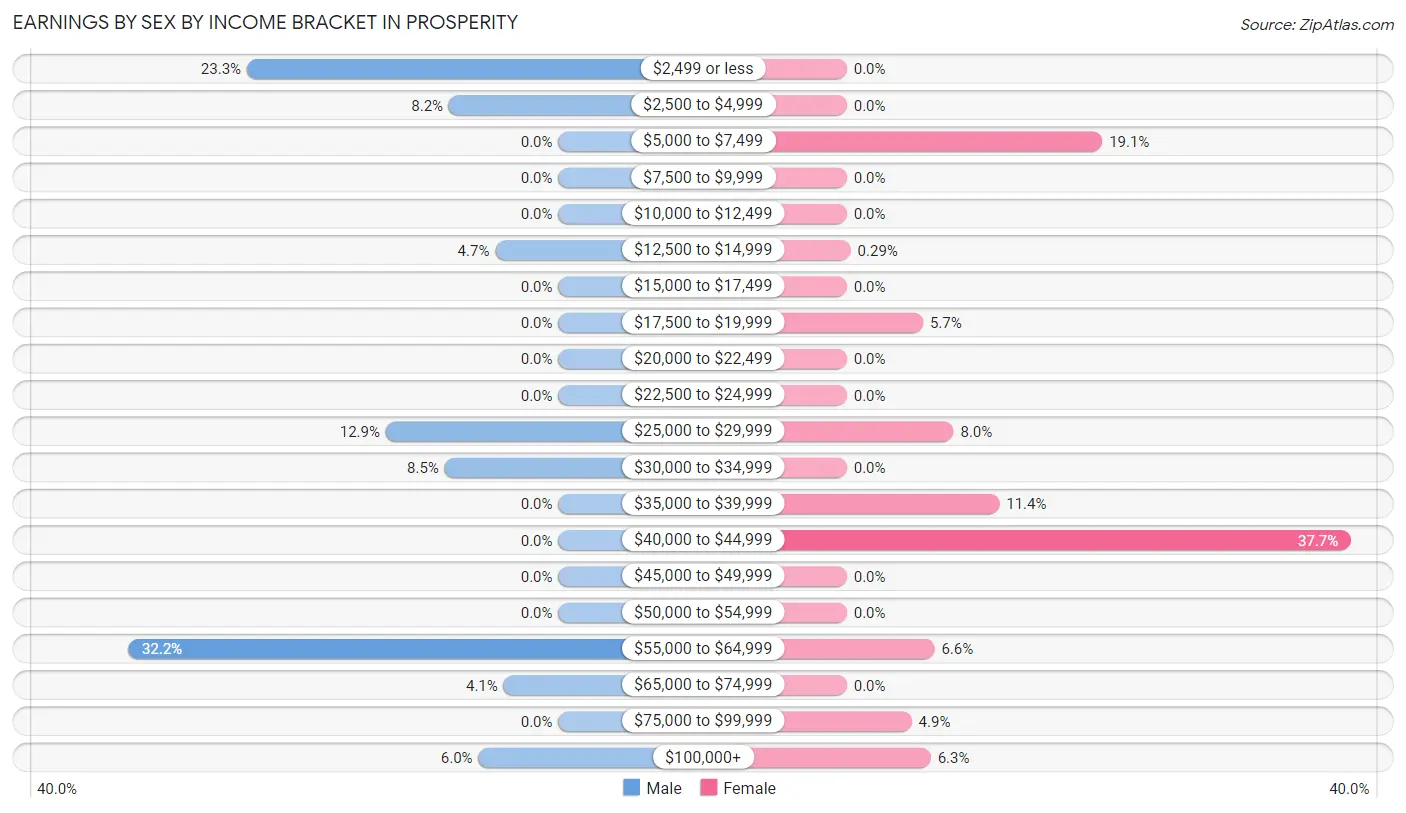
| Income | Male | Female |
| $2,499 or less | 74 (23.3%) | 0 (0.0%) |
| $2,500 to $4,999 | 26 (8.2%) | 0 (0.0%) |
| $5,000 to $7,499 | 0 (0.0%) | 67 (19.1%) |
| $7,500 to $9,999 | 0 (0.0%) | 0 (0.0%) |
| $10,000 to $12,499 | 0 (0.0%) | 0 (0.0%) |
| $12,500 to $14,999 | 15 (4.7%) | 1 (0.3%) |
| $15,000 to $17,499 | 0 (0.0%) | 0 (0.0%) |
| $17,500 to $19,999 | 0 (0.0%) | 20 (5.7%) |
| $20,000 to $22,499 | 0 (0.0%) | 0 (0.0%) |
| $22,500 to $24,999 | 0 (0.0%) | 0 (0.0%) |
| $25,000 to $29,999 | 41 (12.9%) | 28 (8.0%) |
| $30,000 to $34,999 | 27 (8.5%) | 0 (0.0%) |
| $35,000 to $39,999 | 0 (0.0%) | 40 (11.4%) |
| $40,000 to $44,999 | 0 (0.0%) | 132 (37.7%) |
| $45,000 to $49,999 | 0 (0.0%) | 0 (0.0%) |
| $50,000 to $54,999 | 0 (0.0%) | 0 (0.0%) |
| $55,000 to $64,999 | 102 (32.2%) | 23 (6.6%) |
| $65,000 to $74,999 | 13 (4.1%) | 0 (0.0%) |
| $75,000 to $99,999 | 0 (0.0%) | 17 (4.9%) |
| $100,000+ | 19 (6.0%) | 22 (6.3%) |
| Total | 317 (100.0%) | 350 (100.0%) |
Earnings by Sex by Educational Attainment in Prosperity
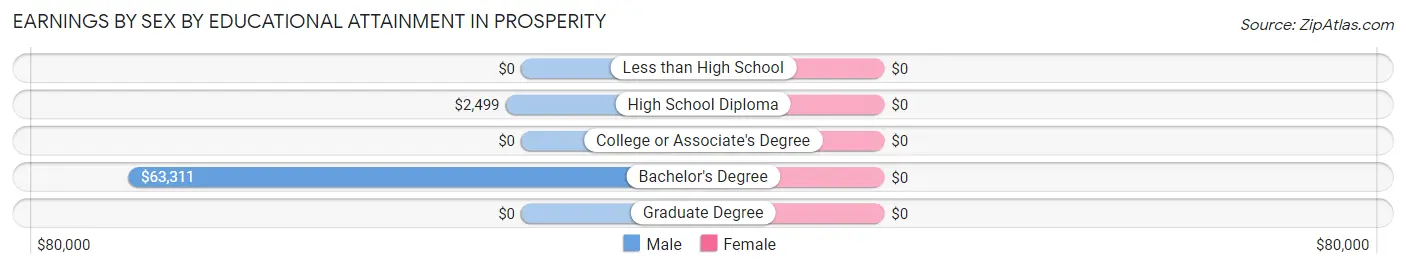
| Educational Attainment | Male Income | Female Income |
| Less than High School | - | - |
| High School Diploma | $2,499 | $0 |
| College or Associate's Degree | - | - |
| Bachelor's Degree | $63,311 | $0 |
| Graduate Degree | - | - |
| Total | - | - |
Family Income in Prosperity
Family Income Brackets in Prosperity
According to the Prosperity family income data, there are 143 families falling into the $100,000 to $149,999 income range, which is the most common income bracket and makes up 32.7% of all families.
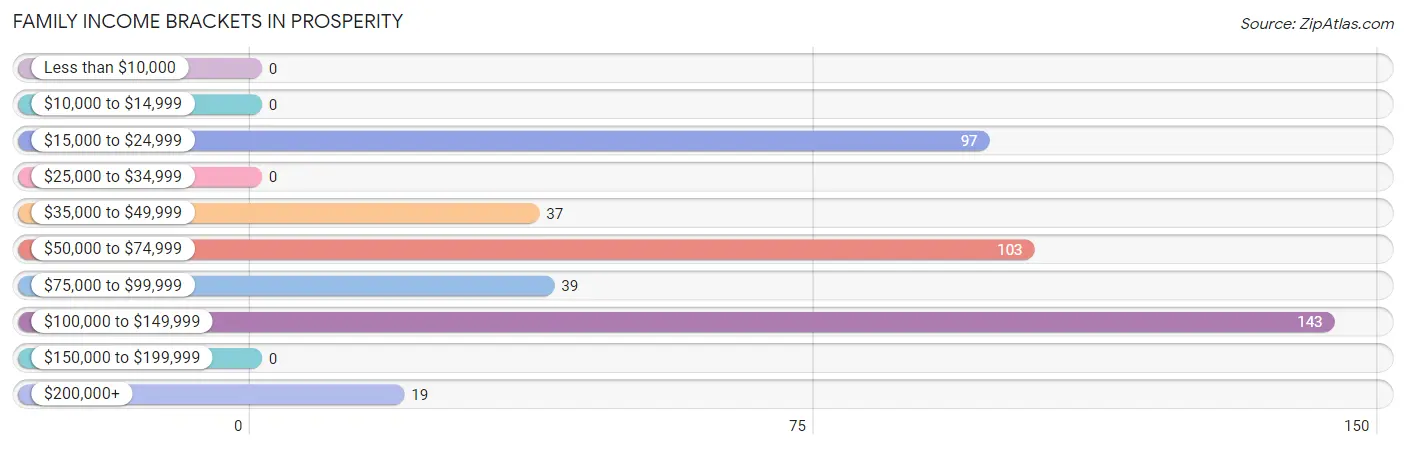
| Income Bracket | # Families | % Families |
| Less than $10,000 | 0 | 0.0% |
| $10,000 to $14,999 | 0 | 0.0% |
| $15,000 to $24,999 | 97 | 22.1% |
| $25,000 to $34,999 | 0 | 0.0% |
| $35,000 to $49,999 | 37 | 8.4% |
| $50,000 to $74,999 | 103 | 23.5% |
| $75,000 to $99,999 | 39 | 8.9% |
| $100,000 to $149,999 | 143 | 32.6% |
| $150,000 to $199,999 | 0 | 0.0% |
| $200,000+ | 19 | 4.3% |
Family Income by Famaliy Size in Prosperity
4-person families (112 | 25.6%) account for the highest median family income in Prosperity with $103,056 per family, while 3-person families (57 | 13.0%) have the highest median income of $31,467 per family member.
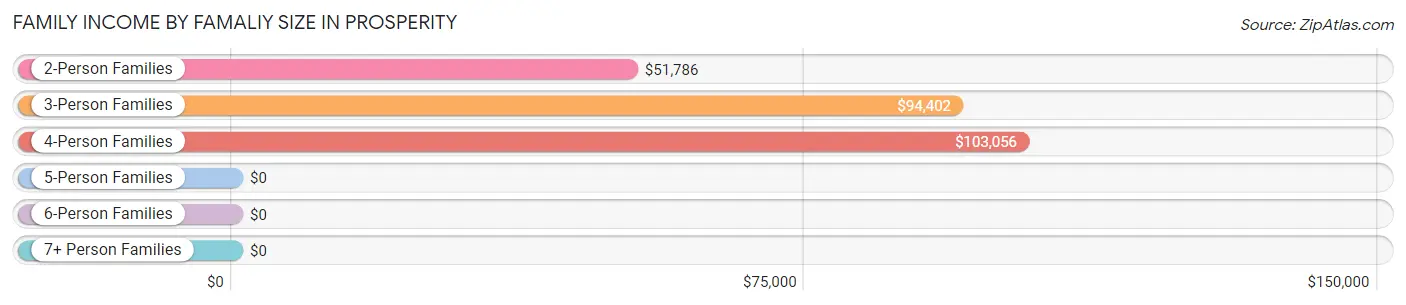
| Income Bracket | # Families | Median Income |
| 2-Person Families | 250 (57.1%) | $51,786 |
| 3-Person Families | 57 (13.0%) | $94,402 |
| 4-Person Families | 112 (25.6%) | $103,056 |
| 5-Person Families | 19 (4.3%) | $0 |
| 6-Person Families | 0 (0.0%) | $0 |
| 7+ Person Families | 0 (0.0%) | $0 |
| Total | 438 (100.0%) | $68,333 |
Family Income by Number of Earners in Prosperity
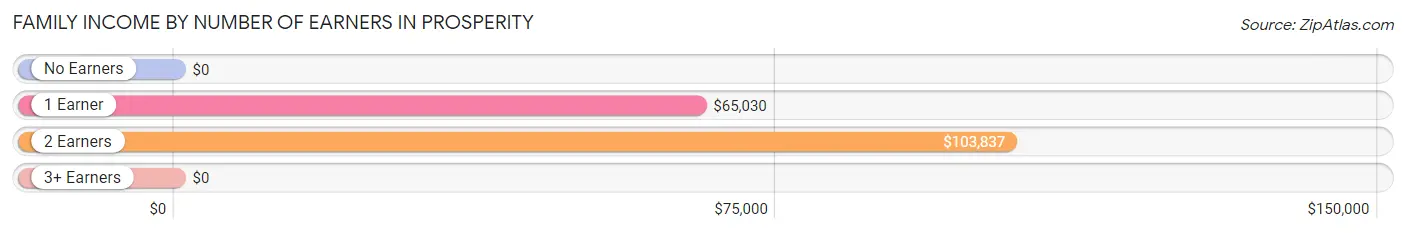
| Number of Earners | # Families | Median Income |
| No Earners | 57 (13.0%) | $0 |
| 1 Earner | 205 (46.8%) | $65,030 |
| 2 Earners | 157 (35.8%) | $103,837 |
| 3+ Earners | 19 (4.3%) | $0 |
| Total | 438 (100.0%) | $68,333 |
Household Income in Prosperity
Household Income Brackets in Prosperity
With 143 households falling in the category, the $100,000 to $149,999 income range is the most frequent in Prosperity, accounting for 30.0% of all households.
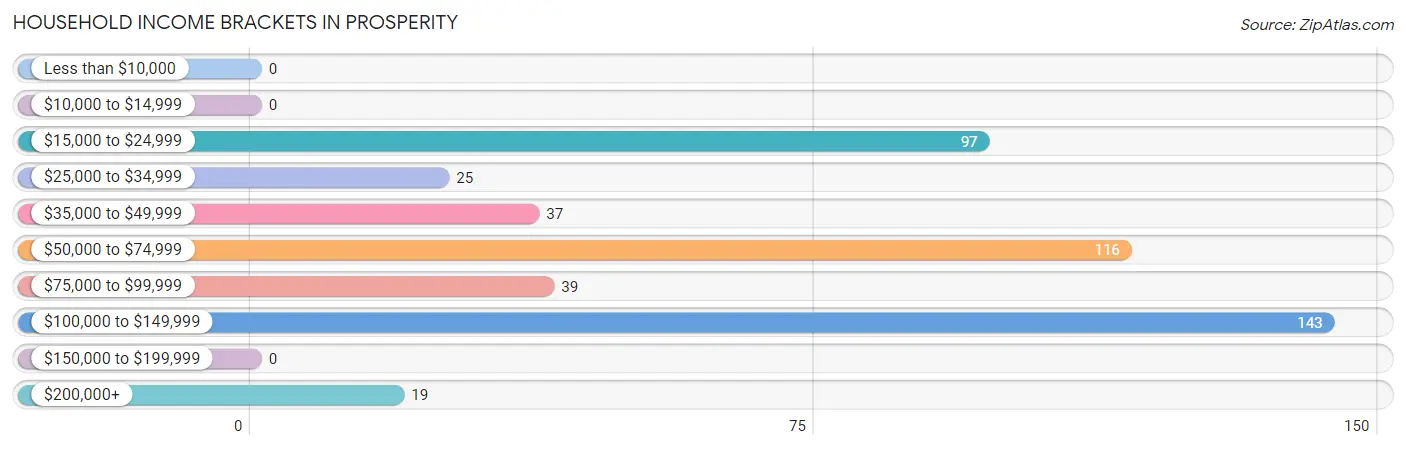
| Income Bracket | # Households | % Households |
| Less than $10,000 | 0 | 0.0% |
| $10,000 to $14,999 | 0 | 0.0% |
| $15,000 to $24,999 | 97 | 20.4% |
| $25,000 to $34,999 | 25 | 5.3% |
| $35,000 to $49,999 | 37 | 7.8% |
| $50,000 to $74,999 | 116 | 24.4% |
| $75,000 to $99,999 | 39 | 8.2% |
| $100,000 to $149,999 | 143 | 30.0% |
| $150,000 to $199,999 | 0 | 0.0% |
| $200,000+ | 19 | 4.0% |
Household Income by Householder Age in Prosperity
The median household income in Prosperity is $66,905, with the highest median household income of $103,316 found in the 25 to 44 years age bracket for the primary householder. A total of 187 households (39.3%) fall into this category.
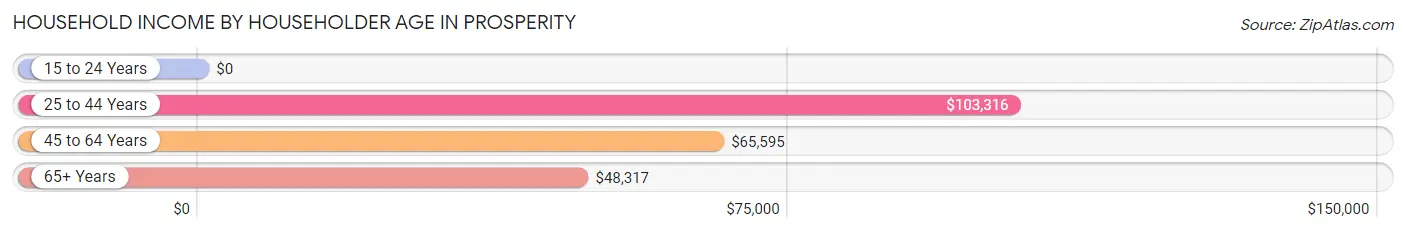
| Income Bracket | # Households | Median Income |
| 15 to 24 Years | 0 (0.0%) | $0 |
| 25 to 44 Years | 187 (39.3%) | $103,316 |
| 45 to 64 Years | 186 (39.1%) | $65,595 |
| 65+ Years | 103 (21.6%) | $48,317 |
| Total | 476 (100.0%) | $66,905 |
Poverty in Prosperity
Income Below Poverty by Sex and Age in Prosperity
With 15.5% poverty level for males and 16.3% for females among the residents of Prosperity, under 5 year old males and 12 to 14 year old females are the most vulnerable to poverty, with 17 males (100.0%) and 16 females (100.0%) in their respective age groups living below the poverty level.
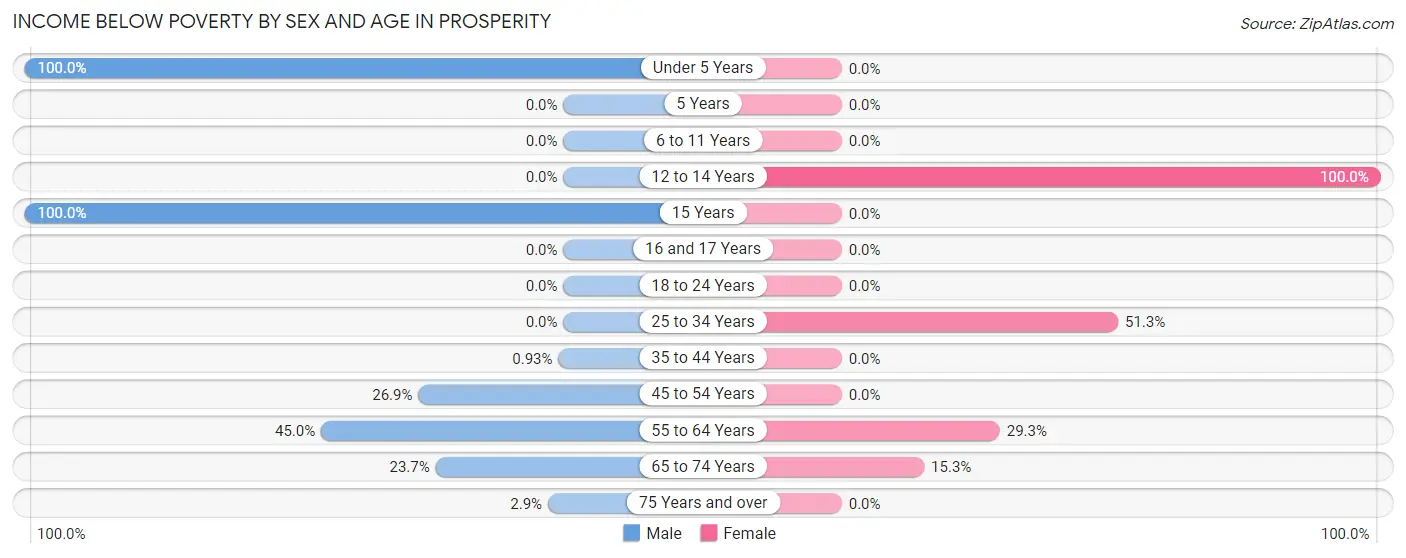
| Age Bracket | Male | Female |
| Under 5 Years | 17 (100.0%) | 0 (0.0%) |
| 5 Years | 0 (0.0%) | 0 (0.0%) |
| 6 to 11 Years | 0 (0.0%) | 0 (0.0%) |
| 12 to 14 Years | 0 (0.0%) | 16 (100.0%) |
| 15 Years | 13 (100.0%) | 0 (0.0%) |
| 16 and 17 Years | 0 (0.0%) | 0 (0.0%) |
| 18 to 24 Years | 0 (0.0%) | 0 (0.0%) |
| 25 to 34 Years | 0 (0.0%) | 20 (51.3%) |
| 35 to 44 Years | 2 (0.9%) | 0 (0.0%) |
| 45 to 54 Years | 7 (26.9%) | 0 (0.0%) |
| 55 to 64 Years | 76 (45.0%) | 61 (29.3%) |
| 65 to 74 Years | 14 (23.7%) | 13 (15.3%) |
| 75 Years and over | 3 (2.9%) | 0 (0.0%) |
| Total | 132 (15.5%) | 110 (16.3%) |
Income Above Poverty by Sex and Age in Prosperity
According to the poverty statistics in Prosperity, males aged 6 to 11 years and females aged 6 to 11 years are the age groups that are most secure financially, with 100.0% of males and 100.0% of females in these age groups living above the poverty line.
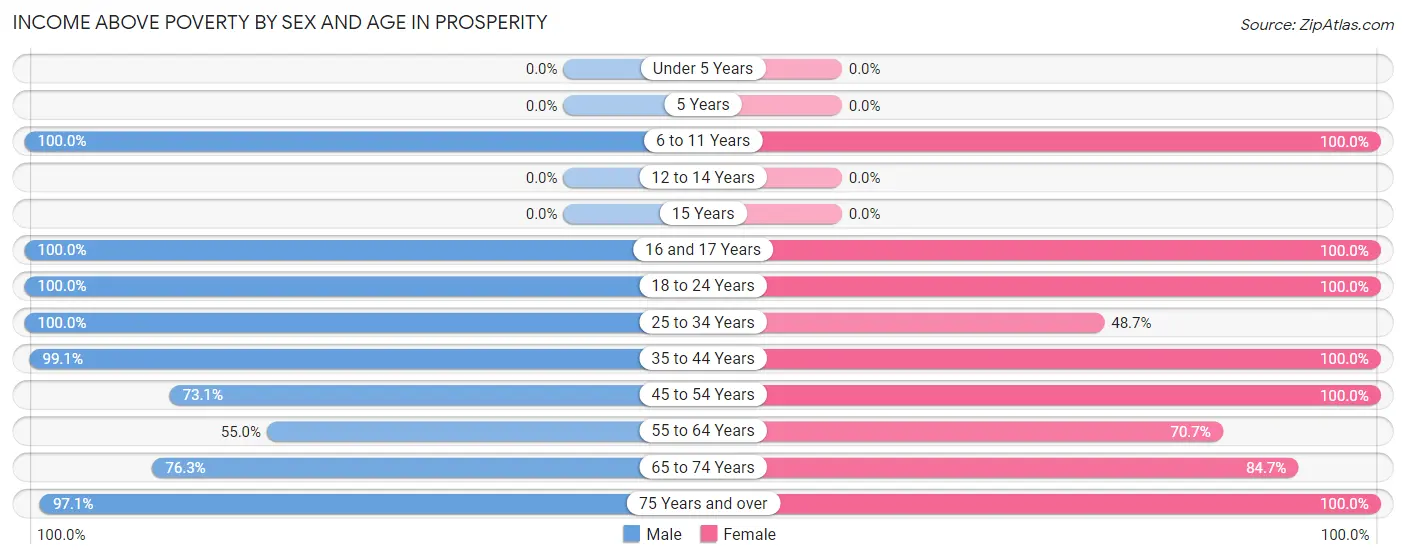
| Age Bracket | Male | Female |
| Under 5 Years | 0 (0.0%) | 0 (0.0%) |
| 5 Years | 0 (0.0%) | 0 (0.0%) |
| 6 to 11 Years | 139 (100.0%) | 90 (100.0%) |
| 12 to 14 Years | 0 (0.0%) | 0 (0.0%) |
| 15 Years | 0 (0.0%) | 0 (0.0%) |
| 16 and 17 Years | 13 (100.0%) | 13 (100.0%) |
| 18 to 24 Years | 36 (100.0%) | 42 (100.0%) |
| 25 to 34 Years | 62 (100.0%) | 19 (48.7%) |
| 35 to 44 Years | 213 (99.1%) | 122 (100.0%) |
| 45 to 54 Years | 19 (73.1%) | 16 (100.0%) |
| 55 to 64 Years | 93 (55.0%) | 147 (70.7%) |
| 65 to 74 Years | 45 (76.3%) | 72 (84.7%) |
| 75 Years and over | 102 (97.1%) | 46 (100.0%) |
| Total | 722 (84.5%) | 567 (83.8%) |
Income Below Poverty Among Married-Couple Families in Prosperity
The poverty statistics for married-couple families in Prosperity show that 4.0% or 13 of the total 327 families live below the poverty line. Families with 1 or 2 children have the highest poverty rate of 10.6%, comprising of 13 families. On the other hand, families with no children have the lowest poverty rate of 0.0%, which includes 0 families.
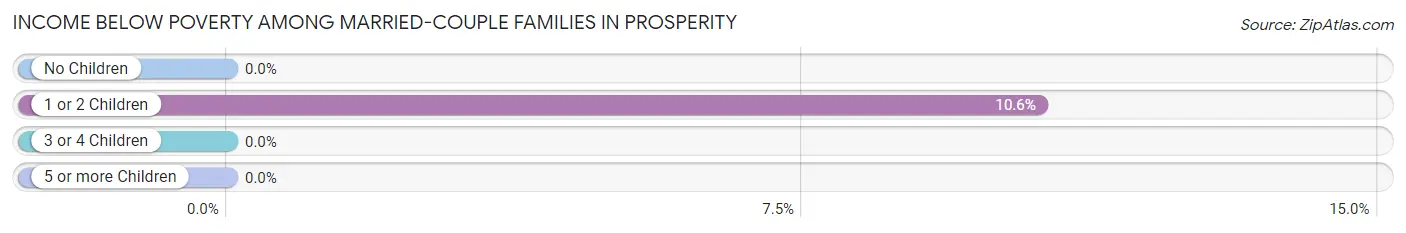
| Children | Above Poverty | Below Poverty |
| No Children | 185 (100.0%) | 0 (0.0%) |
| 1 or 2 Children | 110 (89.4%) | 13 (10.6%) |
| 3 or 4 Children | 19 (100.0%) | 0 (0.0%) |
| 5 or more Children | 0 (0.0%) | 0 (0.0%) |
| Total | 314 (96.0%) | 13 (4.0%) |
Income Below Poverty Among Single-Parent Households in Prosperity
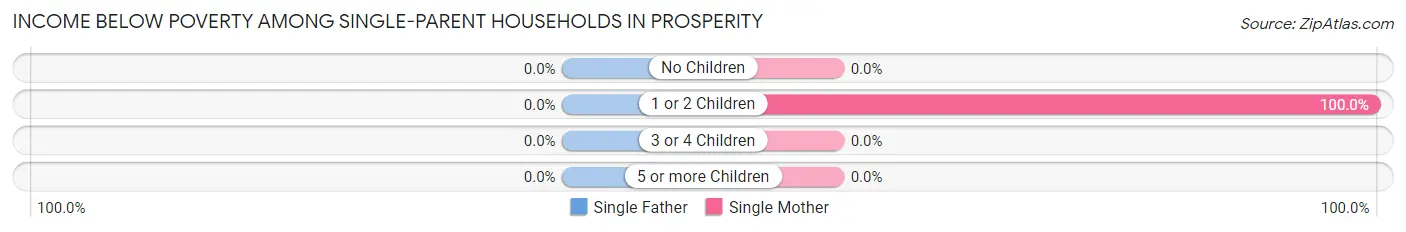
| Children | Single Father | Single Mother |
| No Children | 0 (0.0%) | 0 (0.0%) |
| 1 or 2 Children | 0 (0.0%) | 20 (100.0%) |
| 3 or 4 Children | 0 (0.0%) | 0 (0.0%) |
| 5 or more Children | 0 (0.0%) | 0 (0.0%) |
| Total | 0 (0.0%) | 20 (30.3%) |
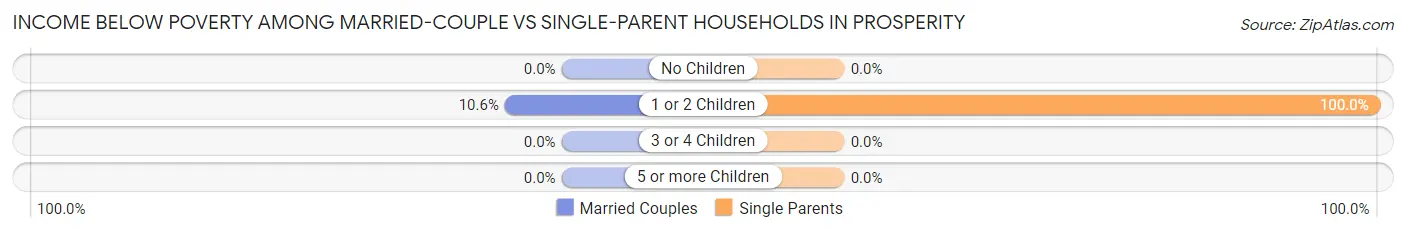
Income Below Poverty Among Married-Couple vs Single-Parent Households in Prosperity
The poverty data for Prosperity shows that 13 of the married-couple family households (4.0%) and 20 of the single-parent households (18.0%) are living below the poverty level. Within the married-couple family households, those with 1 or 2 children have the highest poverty rate, with 13 households (10.6%) falling below the poverty line. Among the single-parent households, those with 1 or 2 children have the highest poverty rate, with 20 household (100.0%) living below poverty.
| Children | Married-Couple Families | Single-Parent Households |
| No Children | 0 (0.0%) | 0 (0.0%) |
| 1 or 2 Children | 13 (10.6%) | 20 (100.0%) |
| 3 or 4 Children | 0 (0.0%) | 0 (0.0%) |
| 5 or more Children | 0 (0.0%) | 0 (0.0%) |
| Total | 13 (4.0%) | 20 (18.0%) |
Employment Characteristics in Prosperity
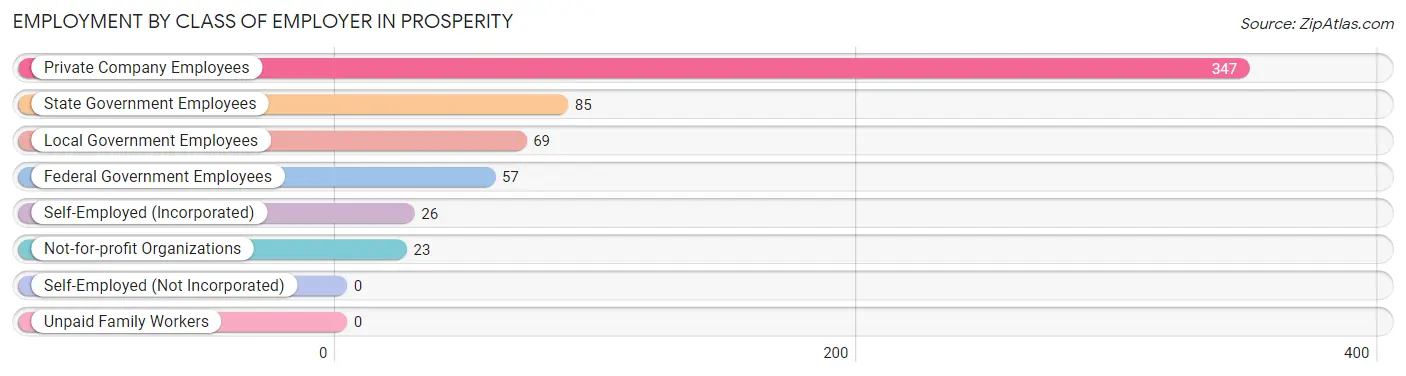
Employment by Class of Employer in Prosperity
Among the 607 employed individuals in Prosperity, private company employees (347 | 57.2%), state government employees (85 | 14.0%), and local government employees (69 | 11.4%) make up the most common classes of employment.
| Employer Class | # Employees | % Employees |
| Private Company Employees | 347 | 57.2% |
| Self-Employed (Incorporated) | 26 | 4.3% |
| Self-Employed (Not Incorporated) | 0 | 0.0% |
| Not-for-profit Organizations | 23 | 3.8% |
| Local Government Employees | 69 | 11.4% |
| State Government Employees | 85 | 14.0% |
| Federal Government Employees | 57 | 9.4% |
| Unpaid Family Workers | 0 | 0.0% |
| Total | 607 | 100.0% |
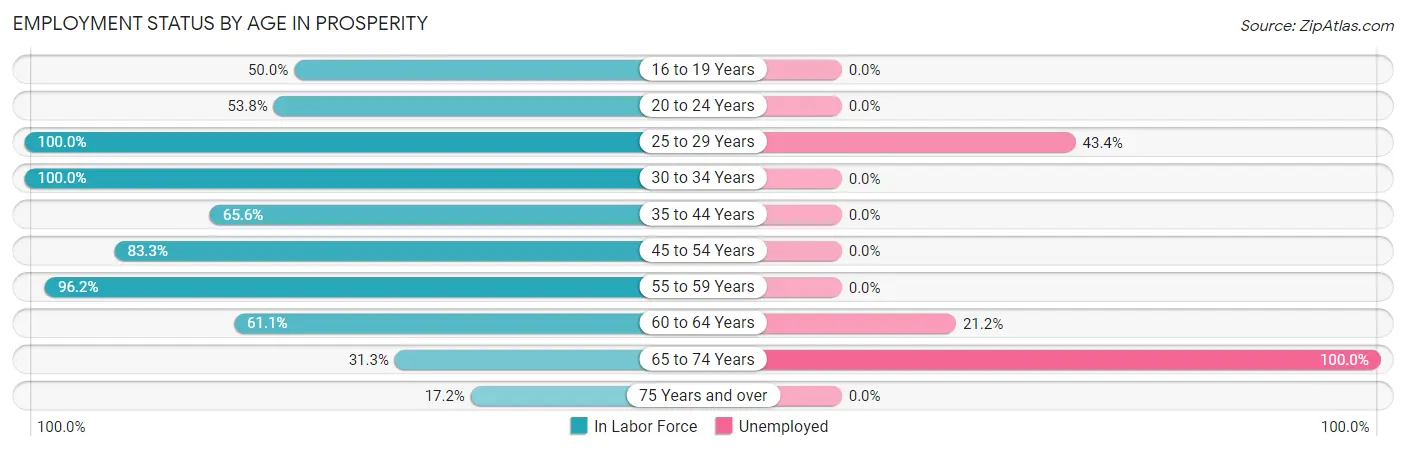
Employment Status by Age in Prosperity
According to the labor force statistics for Prosperity, out of the total population over 16 years of age (1,256), 58.3% or 732 individuals are in the labor force, with 16.8% or 123 of them unemployed. The age group with the highest labor force participation rate is 25 to 29 years, with 100.0% or 83 individuals in the labor force. Within the labor force, the 65 to 74 years age range has the highest percentage of unemployed individuals, with 100.0% or 45 of them being unemployed.
| Age Bracket | In Labor Force | Unemployed |
| 16 to 19 Years | 13 (50.0%) | 0 (0.0%) |
| 20 to 24 Years | 42 (53.8%) | 0 (0.0%) |
| 25 to 29 Years | 83 (100.0%) | 36 (43.4%) |
| 30 to 34 Years | 18 (100.0%) | 0 (0.0%) |
| 35 to 44 Years | 221 (65.6%) | 0 (0.0%) |
| 45 to 54 Years | 35 (83.3%) | 0 (0.0%) |
| 55 to 59 Years | 51 (96.2%) | 0 (0.0%) |
| 60 to 64 Years | 198 (61.1%) | 42 (21.2%) |
| 65 to 74 Years | 45 (31.3%) | 45 (100.0%) |
| 75 Years and over | 26 (17.2%) | 0 (0.0%) |
| Total | 732 (58.3%) | 123 (16.8%) |
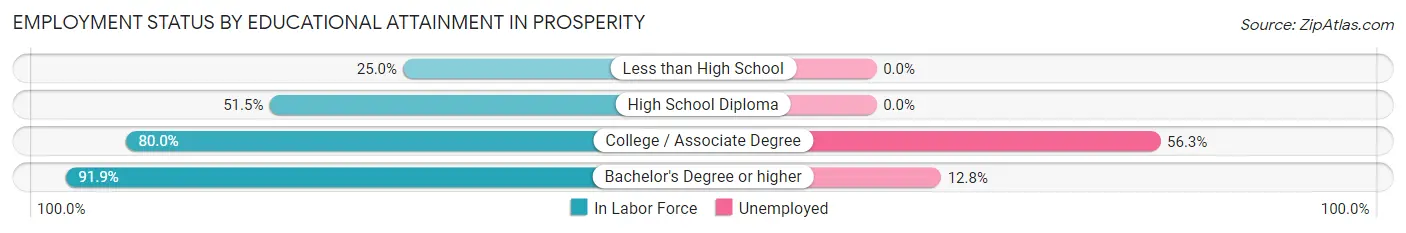
Employment Status by Educational Attainment in Prosperity
According to labor force statistics for Prosperity, 70.7% of individuals (606) out of the total population between 25 and 64 years of age (857) are in the labor force, with 12.9% or 78 of them being unemployed. The group with the highest labor force participation rate are those with the educational attainment of bachelor's degree or higher, with 91.9% or 328 individuals in the labor force. Within the labor force, individuals with college / associate degree education have the highest percentage of unemployment, with 56.3% or 36 of them being unemployed.
| Educational Attainment | In Labor Force | Unemployed |
| Less than High School | 2 (25.0%) | 0 (0.0%) |
| High School Diploma | 212 (51.5%) | 0 (0.0%) |
| College / Associate Degree | 64 (80.0%) | 45 (56.3%) |
| Bachelor's Degree or higher | 328 (91.9%) | 46 (12.8%) |
| Total | 606 (70.7%) | 111 (12.9%) |
Employment Occupations by Sex in Prosperity
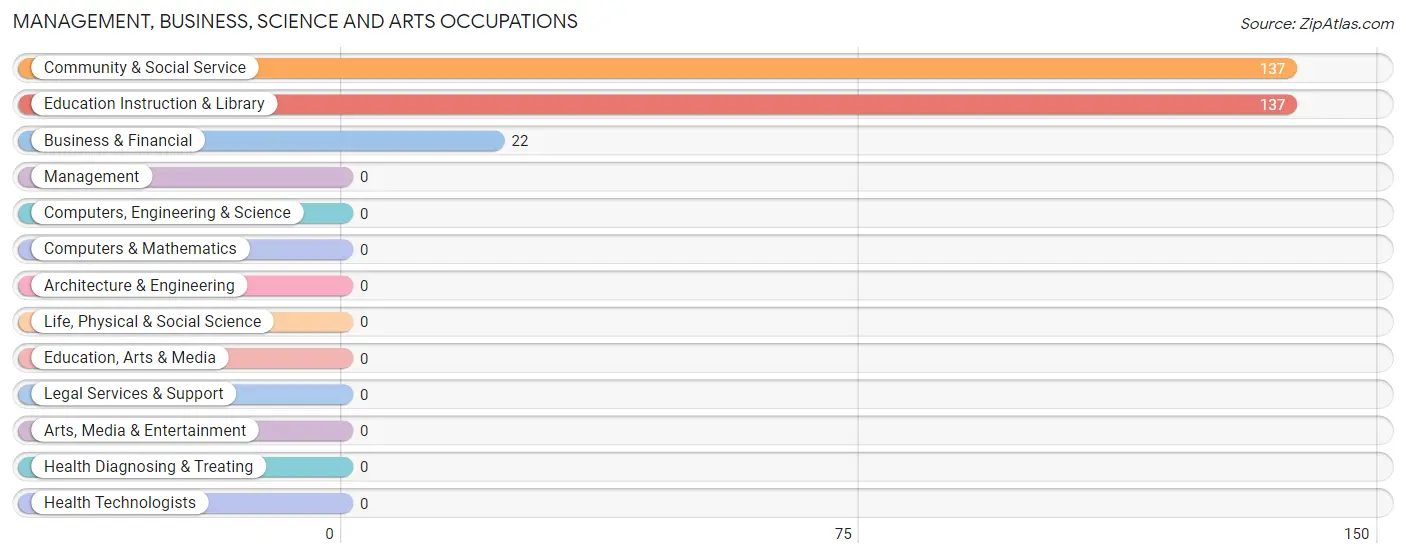
Management, Business, Science and Arts Occupations
The most common Management, Business, Science and Arts occupations in Prosperity are Community & Social Service (137 | 22.5%), Education Instruction & Library (137 | 22.5%), and Business & Financial (22 | 3.6%).
Management, Business, Science and Arts Occupations by Sex
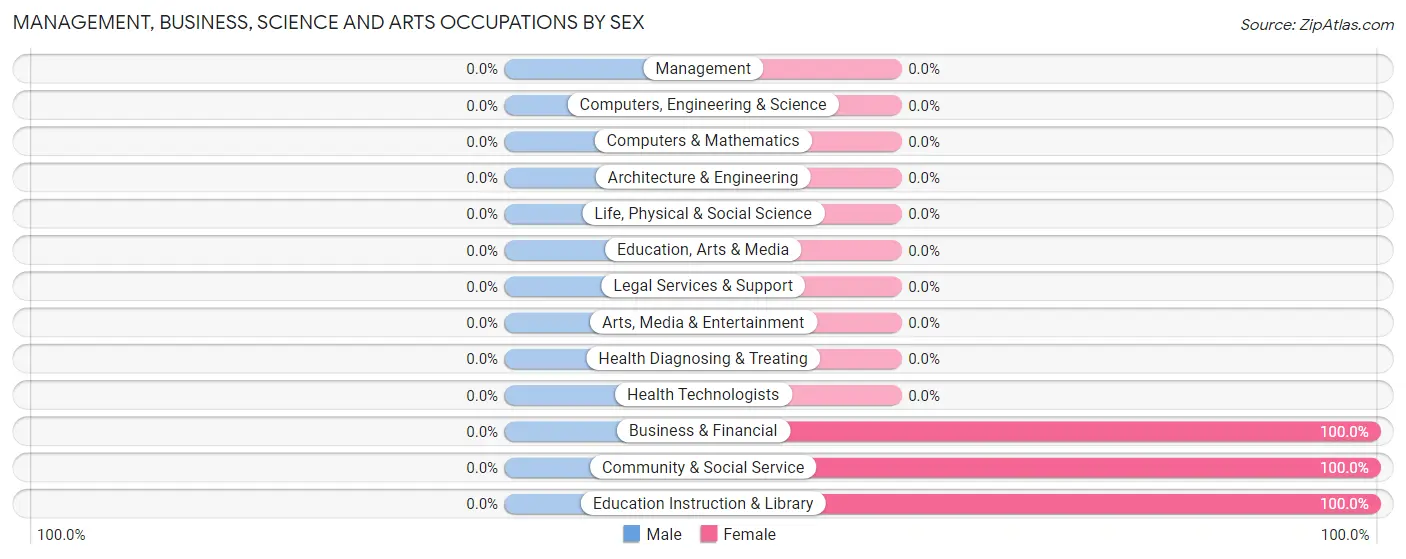
| Occupation | Male | Female |
| Management | 0 (0.0%) | 0 (0.0%) |
| Business & Financial | 0 (0.0%) | 22 (100.0%) |
| Computers, Engineering & Science | 0 (0.0%) | 0 (0.0%) |
| Computers & Mathematics | 0 (0.0%) | 0 (0.0%) |
| Architecture & Engineering | 0 (0.0%) | 0 (0.0%) |
| Life, Physical & Social Science | 0 (0.0%) | 0 (0.0%) |
| Community & Social Service | 0 (0.0%) | 137 (100.0%) |
| Education, Arts & Media | 0 (0.0%) | 0 (0.0%) |
| Legal Services & Support | 0 (0.0%) | 0 (0.0%) |
| Education Instruction & Library | 0 (0.0%) | 137 (100.0%) |
| Arts, Media & Entertainment | 0 (0.0%) | 0 (0.0%) |
| Health Diagnosing & Treating | 0 (0.0%) | 0 (0.0%) |
| Health Technologists | 0 (0.0%) | 0 (0.0%) |
| Total (Category) | 0 (0.0%) | 159 (100.0%) |
| Total (Overall) | 272 (44.7%) | 337 (55.3%) |
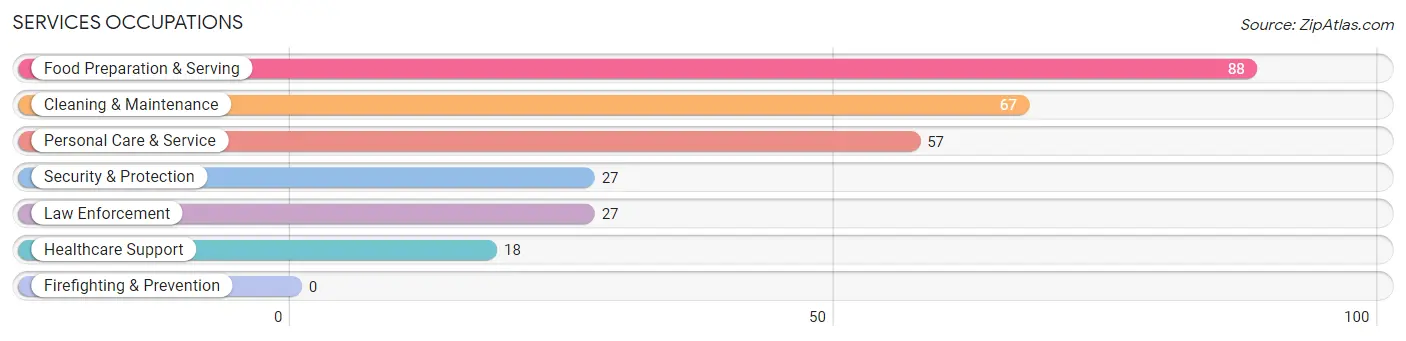
Services Occupations
The most common Services occupations in Prosperity are Food Preparation & Serving (88 | 14.4%), Cleaning & Maintenance (67 | 11.0%), Personal Care & Service (57 | 9.4%), Security & Protection (27 | 4.4%), and Law Enforcement (27 | 4.4%).
Services Occupations by Sex
Within the Services occupations in Prosperity, the most male-oriented occupations are Security & Protection (100.0%), Law Enforcement (100.0%), and Cleaning & Maintenance (100.0%), while the most female-oriented occupations are Healthcare Support (100.0%), and Food Preparation & Serving (85.2%).
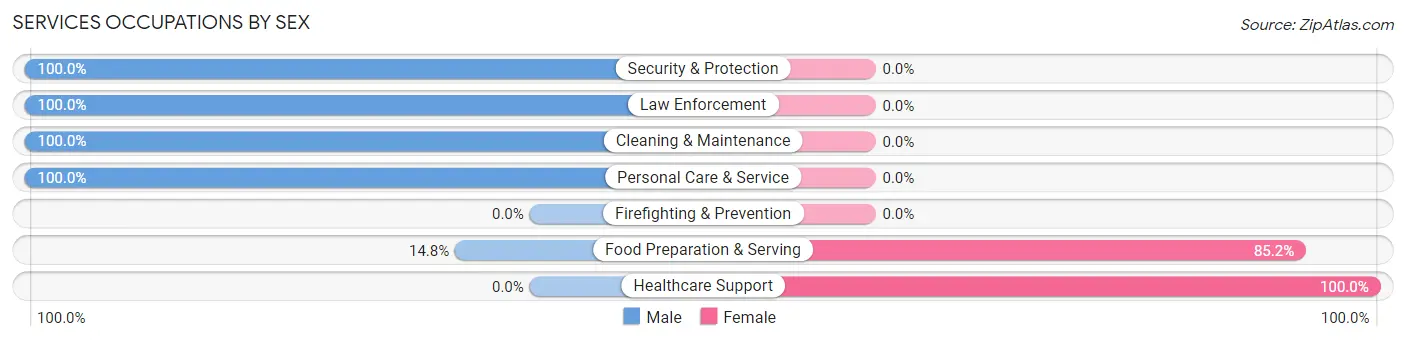
| Occupation | Male | Female |
| Healthcare Support | 0 (0.0%) | 18 (100.0%) |
| Security & Protection | 27 (100.0%) | 0 (0.0%) |
| Firefighting & Prevention | 0 (0.0%) | 0 (0.0%) |
| Law Enforcement | 27 (100.0%) | 0 (0.0%) |
| Food Preparation & Serving | 13 (14.8%) | 75 (85.2%) |
| Cleaning & Maintenance | 67 (100.0%) | 0 (0.0%) |
| Personal Care & Service | 57 (100.0%) | 0 (0.0%) |
| Total (Category) | 164 (63.8%) | 93 (36.2%) |
| Total (Overall) | 272 (44.7%) | 337 (55.3%) |
Sales and Office Occupations
The most common Sales and Office occupations in Prosperity are Sales & Related (91 | 14.9%), and Office & Administration (13 | 2.1%).
Sales and Office Occupations by Sex
| Occupation | Male | Female |
| Sales & Related | 32 (35.2%) | 59 (64.8%) |
| Office & Administration | 0 (0.0%) | 13 (100.0%) |
| Total (Category) | 32 (30.8%) | 72 (69.2%) |
| Total (Overall) | 272 (44.7%) | 337 (55.3%) |
Natural Resources, Construction and Maintenance Occupations
The most common Natural Resources, Construction and Maintenance occupations in Prosperity are , and Construction & Extraction (2 | 0.3%).
Natural Resources, Construction and Maintenance Occupations by Sex
| Occupation | Male | Female |
| Farming, Fishing & Forestry | 0 (0.0%) | 0 (0.0%) |
| Construction & Extraction | 2 (100.0%) | 0 (0.0%) |
| Installation, Maintenance & Repair | 0 (0.0%) | 0 (0.0%) |
| Total (Category) | 2 (100.0%) | 0 (0.0%) |
| Total (Overall) | 272 (44.7%) | 337 (55.3%) |
Production, Transportation and Moving Occupations
The most common Production, Transportation and Moving occupations in Prosperity are Production (74 | 12.1%), and Material Moving (13 | 2.1%).
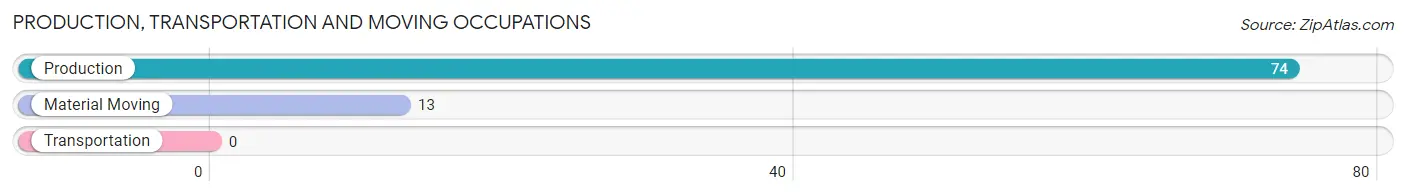
Production, Transportation and Moving Occupations by Sex
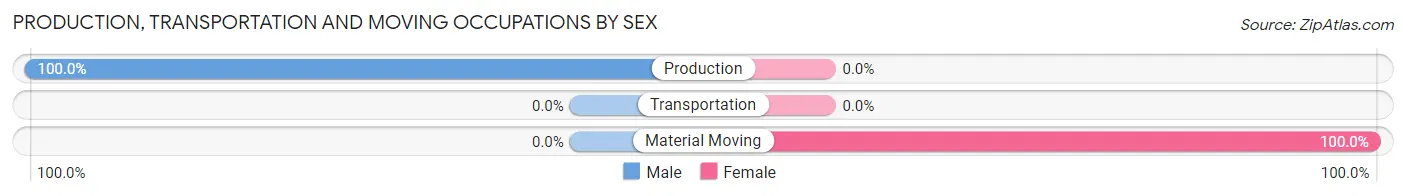
| Occupation | Male | Female |
| Production | 74 (100.0%) | 0 (0.0%) |
| Transportation | 0 (0.0%) | 0 (0.0%) |
| Material Moving | 0 (0.0%) | 13 (100.0%) |
| Total (Category) | 74 (85.1%) | 13 (14.9%) |
| Total (Overall) | 272 (44.7%) | 337 (55.3%) |
Employment Industries by Sex in Prosperity
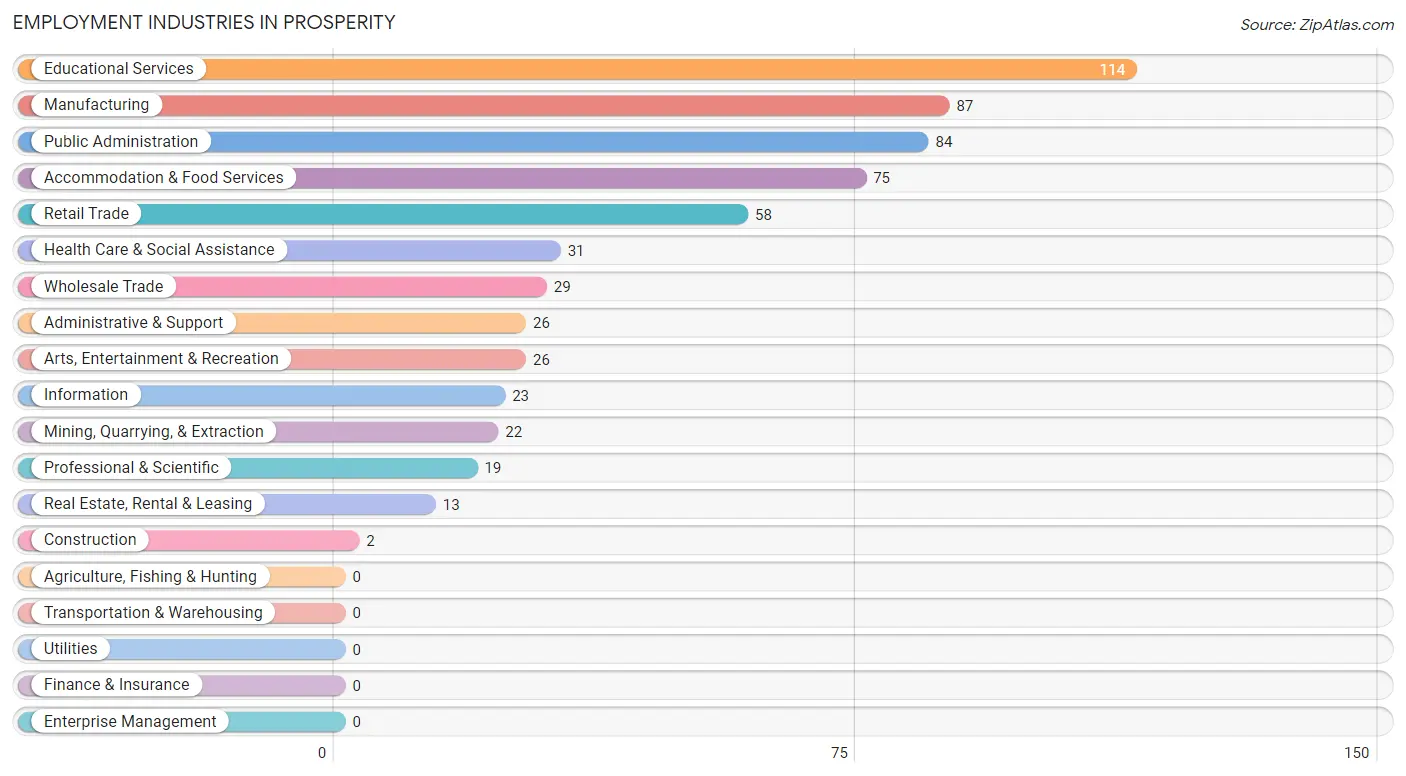
Employment Industries in Prosperity
The major employment industries in Prosperity include Educational Services (114 | 18.7%), Manufacturing (87 | 14.3%), Public Administration (84 | 13.8%), Accommodation & Food Services (75 | 12.3%), and Retail Trade (58 | 9.5%).
Employment Industries by Sex in Prosperity
The Prosperity industries that see more men than women are Construction (100.0%), Real Estate, Rental & Leasing (100.0%), and Professional & Scientific (100.0%), whereas the industries that tend to have a higher number of women are Mining, Quarrying, & Extraction (100.0%), Wholesale Trade (100.0%), and Information (100.0%).
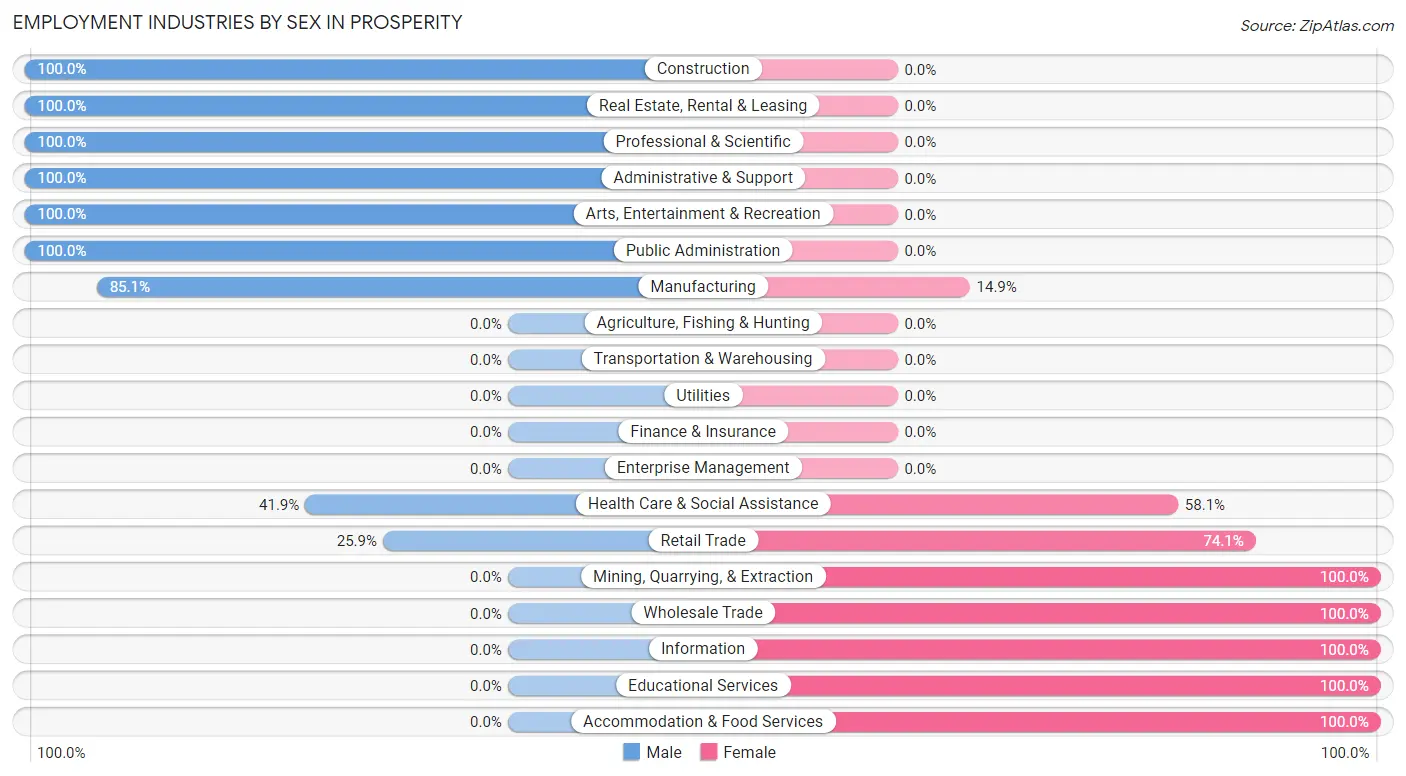
| Industry | Male | Female |
| Agriculture, Fishing & Hunting | 0 (0.0%) | 0 (0.0%) |
| Mining, Quarrying, & Extraction | 0 (0.0%) | 22 (100.0%) |
| Construction | 2 (100.0%) | 0 (0.0%) |
| Manufacturing | 74 (85.1%) | 13 (14.9%) |
| Wholesale Trade | 0 (0.0%) | 29 (100.0%) |
| Retail Trade | 15 (25.9%) | 43 (74.1%) |
| Transportation & Warehousing | 0 (0.0%) | 0 (0.0%) |
| Utilities | 0 (0.0%) | 0 (0.0%) |
| Information | 0 (0.0%) | 23 (100.0%) |
| Finance & Insurance | 0 (0.0%) | 0 (0.0%) |
| Real Estate, Rental & Leasing | 13 (100.0%) | 0 (0.0%) |
| Professional & Scientific | 19 (100.0%) | 0 (0.0%) |
| Enterprise Management | 0 (0.0%) | 0 (0.0%) |
| Administrative & Support | 26 (100.0%) | 0 (0.0%) |
| Educational Services | 0 (0.0%) | 114 (100.0%) |
| Health Care & Social Assistance | 13 (41.9%) | 18 (58.1%) |
| Arts, Entertainment & Recreation | 26 (100.0%) | 0 (0.0%) |
| Accommodation & Food Services | 0 (0.0%) | 75 (100.0%) |
| Public Administration | 84 (100.0%) | 0 (0.0%) |
| Total | 272 (44.7%) | 337 (55.3%) |
Education in Prosperity
School Enrollment in Prosperity
The most common levels of schooling among the 320 students in Prosperity are middle school (167 | 52.2%), elementary school (78 | 24.4%), and high school (39 | 12.2%).
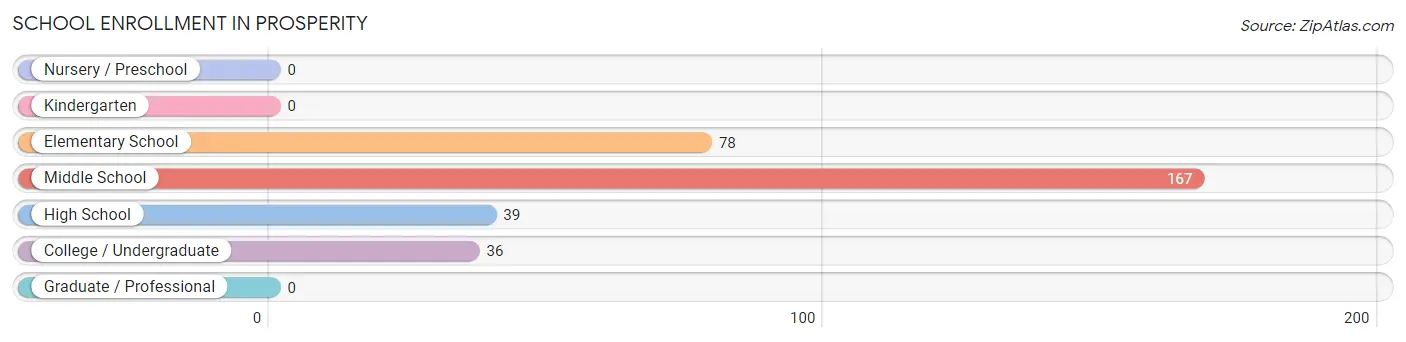
| School Level | # Students | % Students |
| Nursery / Preschool | 0 | 0.0% |
| Kindergarten | 0 | 0.0% |
| Elementary School | 78 | 24.4% |
| Middle School | 167 | 52.2% |
| High School | 39 | 12.2% |
| College / Undergraduate | 36 | 11.3% |
| Graduate / Professional | 0 | 0.0% |
| Total | 320 | 100.0% |
School Enrollment by Age by Funding Source in Prosperity
Out of a total of 320 students who are enrolled in schools in Prosperity, 16 (5.0%) attend a private institution, while the remaining 304 (95.0%) are enrolled in public schools. The age group of 10 to 14 year olds has the highest likelihood of being enrolled in private schools, with 16 (9.6% in the age bracket) enrolled. Conversely, the age group of 5 to 9 year old has the lowest likelihood of being enrolled in a private school, with 78 (100.0% in the age bracket) attending a public institution.
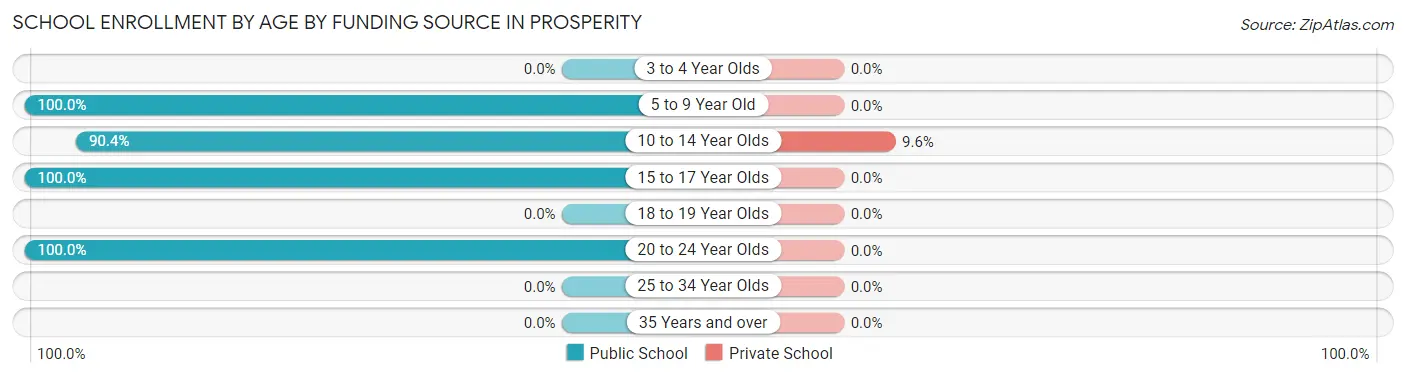
| Age Bracket | Public School | Private School |
| 3 to 4 Year Olds | 0 (0.0%) | 0 (0.0%) |
| 5 to 9 Year Old | 78 (100.0%) | 0 (0.0%) |
| 10 to 14 Year Olds | 151 (90.4%) | 16 (9.6%) |
| 15 to 17 Year Olds | 39 (100.0%) | 0 (0.0%) |
| 18 to 19 Year Olds | 0 (0.0%) | 0 (0.0%) |
| 20 to 24 Year Olds | 36 (100.0%) | 0 (0.0%) |
| 25 to 34 Year Olds | 0 (0.0%) | 0 (0.0%) |
| 35 Years and over | 0 (0.0%) | 0 (0.0%) |
| Total | 304 (95.0%) | 16 (5.0%) |
Educational Attainment by Field of Study in Prosperity
Business (138 | 36.0%), education (76 | 19.8%), bio, nature & agricultural (57 | 14.9%), science & technology (43 | 11.2%), and liberal arts & history (26 | 6.8%) are the most common fields of study among 383 individuals in Prosperity who have obtained a bachelor's degree or higher.
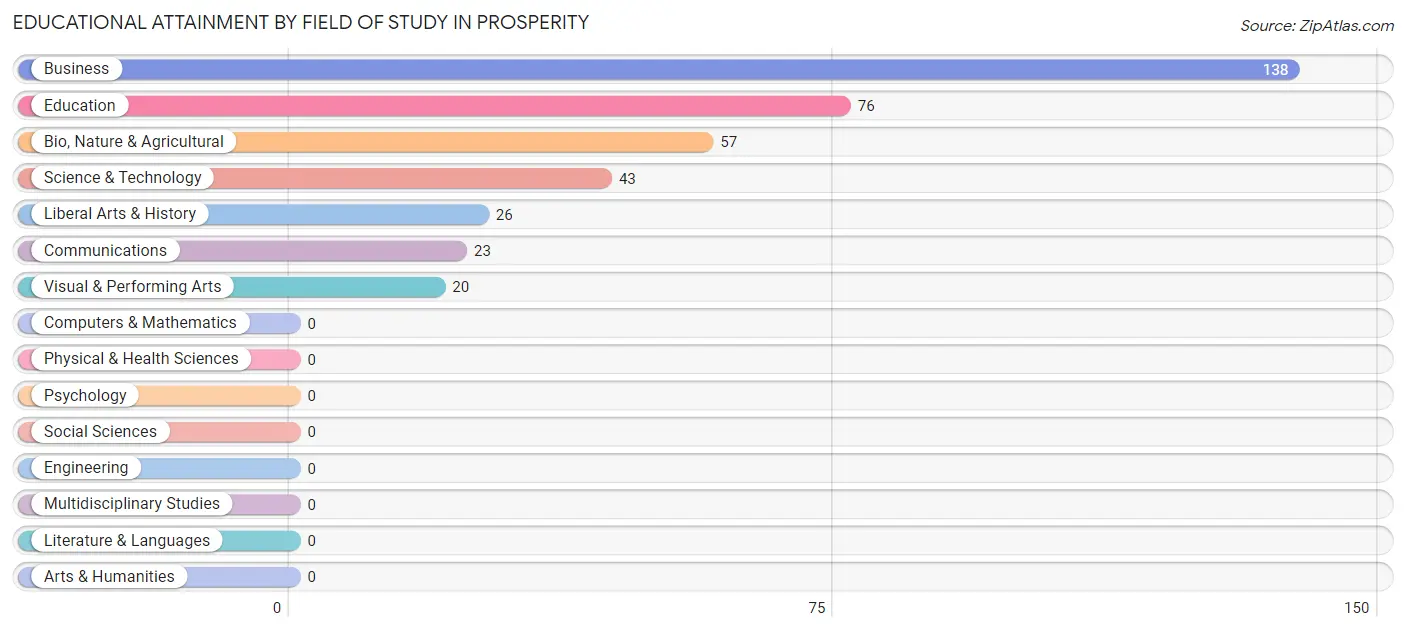
| Field of Study | # Graduates | % Graduates |
| Computers & Mathematics | 0 | 0.0% |
| Bio, Nature & Agricultural | 57 | 14.9% |
| Physical & Health Sciences | 0 | 0.0% |
| Psychology | 0 | 0.0% |
| Social Sciences | 0 | 0.0% |
| Engineering | 0 | 0.0% |
| Multidisciplinary Studies | 0 | 0.0% |
| Science & Technology | 43 | 11.2% |
| Business | 138 | 36.0% |
| Education | 76 | 19.8% |
| Literature & Languages | 0 | 0.0% |
| Liberal Arts & History | 26 | 6.8% |
| Visual & Performing Arts | 20 | 5.2% |
| Communications | 23 | 6.0% |
| Arts & Humanities | 0 | 0.0% |
| Total | 383 | 100.0% |
Transportation & Commute in Prosperity
Vehicle Availability by Sex in Prosperity
The most prevalent vehicle ownership categories in Prosperity are males with 2 vehicles (97, accounting for 35.9%) and females with 2 vehicles (186, making up 28.8%).
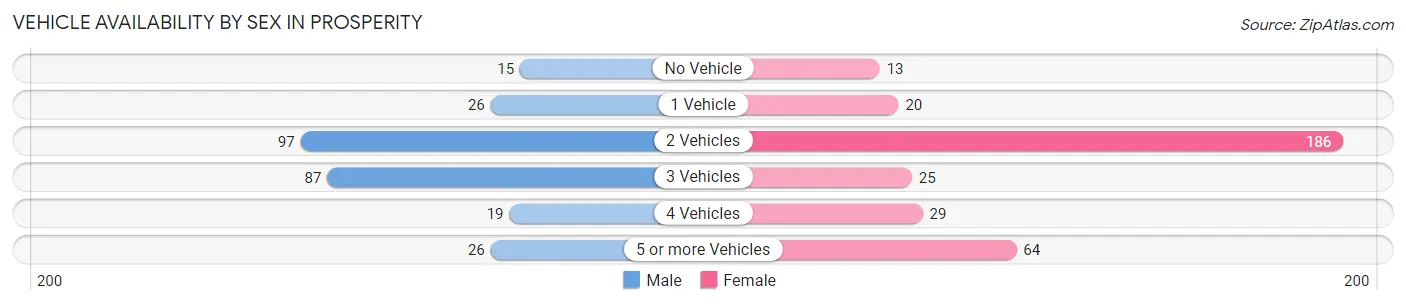
| Vehicles Available | Male | Female |
| No Vehicle | 15 (5.6%) | 13 (3.9%) |
| 1 Vehicle | 26 (9.6%) | 20 (5.9%) |
| 2 Vehicles | 97 (35.9%) | 186 (55.2%) |
| 3 Vehicles | 87 (32.2%) | 25 (7.4%) |
| 4 Vehicles | 19 (7.0%) | 29 (8.6%) |
| 5 or more Vehicles | 26 (9.6%) | 64 (19.0%) |
| Total | 270 (100.0%) | 337 (100.0%) |
Commute Time in Prosperity
The most frequently occuring commute durations in Prosperity are 10 to 14 minutes (180 commuters, 31.0%), 15 to 19 minutes (149 commuters, 25.7%), and 20 to 24 minutes (111 commuters, 19.1%).
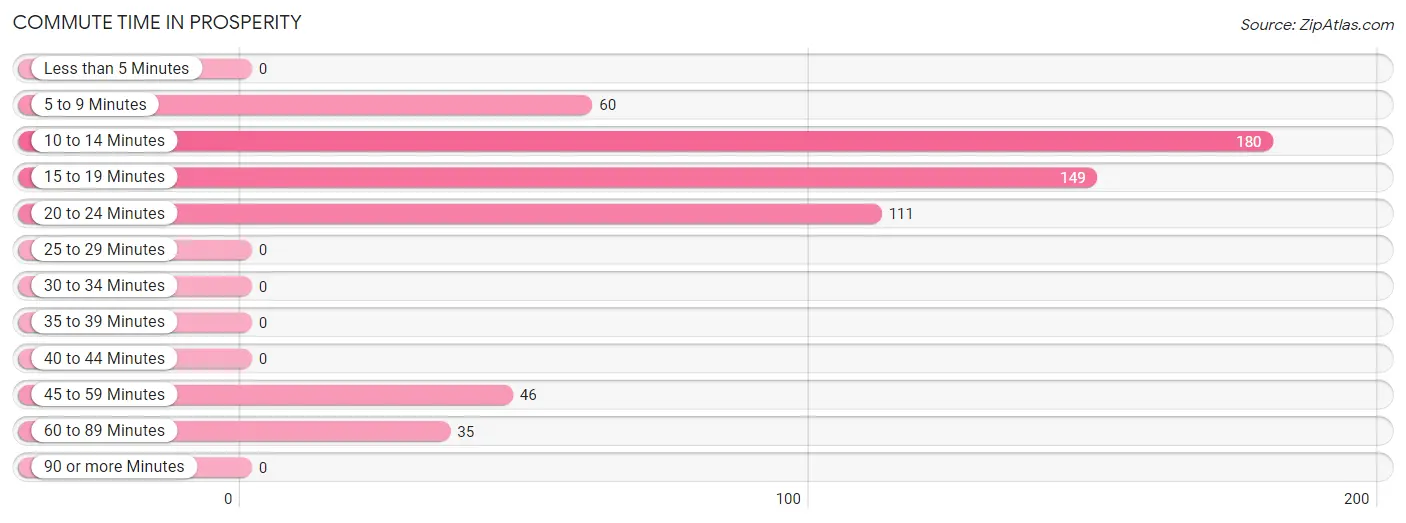
| Commute Time | # Commuters | % Commuters |
| Less than 5 Minutes | 0 | 0.0% |
| 5 to 9 Minutes | 60 | 10.3% |
| 10 to 14 Minutes | 180 | 31.0% |
| 15 to 19 Minutes | 149 | 25.7% |
| 20 to 24 Minutes | 111 | 19.1% |
| 25 to 29 Minutes | 0 | 0.0% |
| 30 to 34 Minutes | 0 | 0.0% |
| 35 to 39 Minutes | 0 | 0.0% |
| 40 to 44 Minutes | 0 | 0.0% |
| 45 to 59 Minutes | 46 | 7.9% |
| 60 to 89 Minutes | 35 | 6.0% |
| 90 or more Minutes | 0 | 0.0% |
Commute Time by Sex in Prosperity
The most common commute times in Prosperity are 10 to 14 minutes (101 commuters, 41.4%) for males and 15 to 19 minutes (92 commuters, 27.3%) for females.
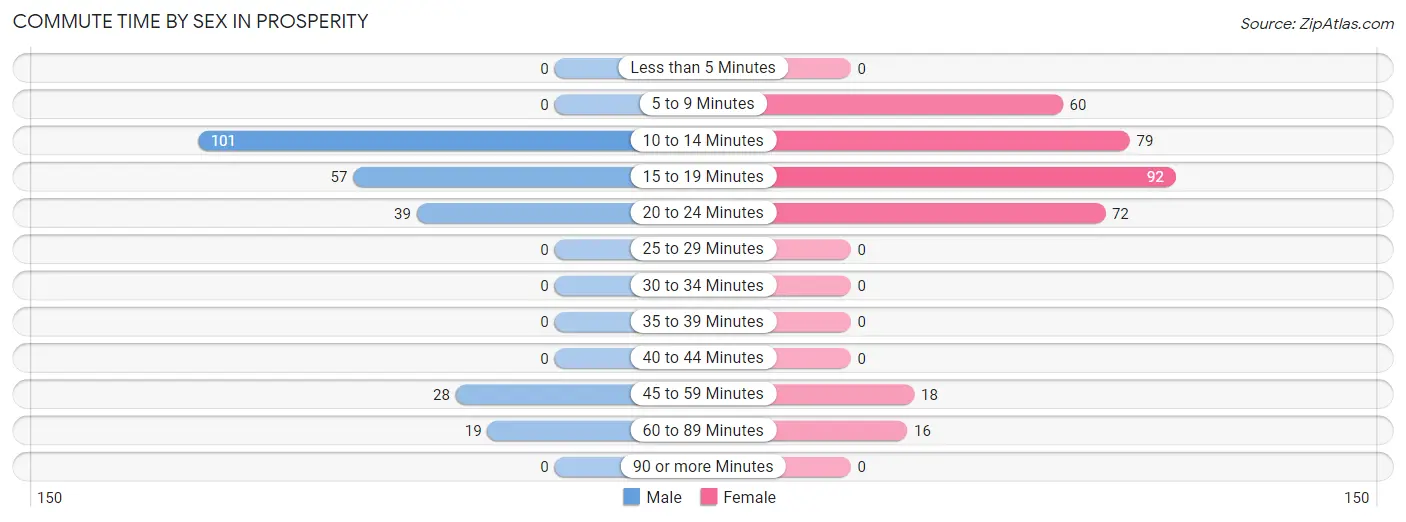
| Commute Time | Male | Female |
| Less than 5 Minutes | 0 (0.0%) | 0 (0.0%) |
| 5 to 9 Minutes | 0 (0.0%) | 60 (17.8%) |
| 10 to 14 Minutes | 101 (41.4%) | 79 (23.4%) |
| 15 to 19 Minutes | 57 (23.4%) | 92 (27.3%) |
| 20 to 24 Minutes | 39 (16.0%) | 72 (21.4%) |
| 25 to 29 Minutes | 0 (0.0%) | 0 (0.0%) |
| 30 to 34 Minutes | 0 (0.0%) | 0 (0.0%) |
| 35 to 39 Minutes | 0 (0.0%) | 0 (0.0%) |
| 40 to 44 Minutes | 0 (0.0%) | 0 (0.0%) |
| 45 to 59 Minutes | 28 (11.5%) | 18 (5.3%) |
| 60 to 89 Minutes | 19 (7.8%) | 16 (4.8%) |
| 90 or more Minutes | 0 (0.0%) | 0 (0.0%) |
Time of Departure to Work by Sex in Prosperity
The most frequent times of departure to work in Prosperity are 6:00 AM to 6:29 AM (74, 30.3%) for males and 7:00 AM to 7:29 AM (111, 32.9%) for females.
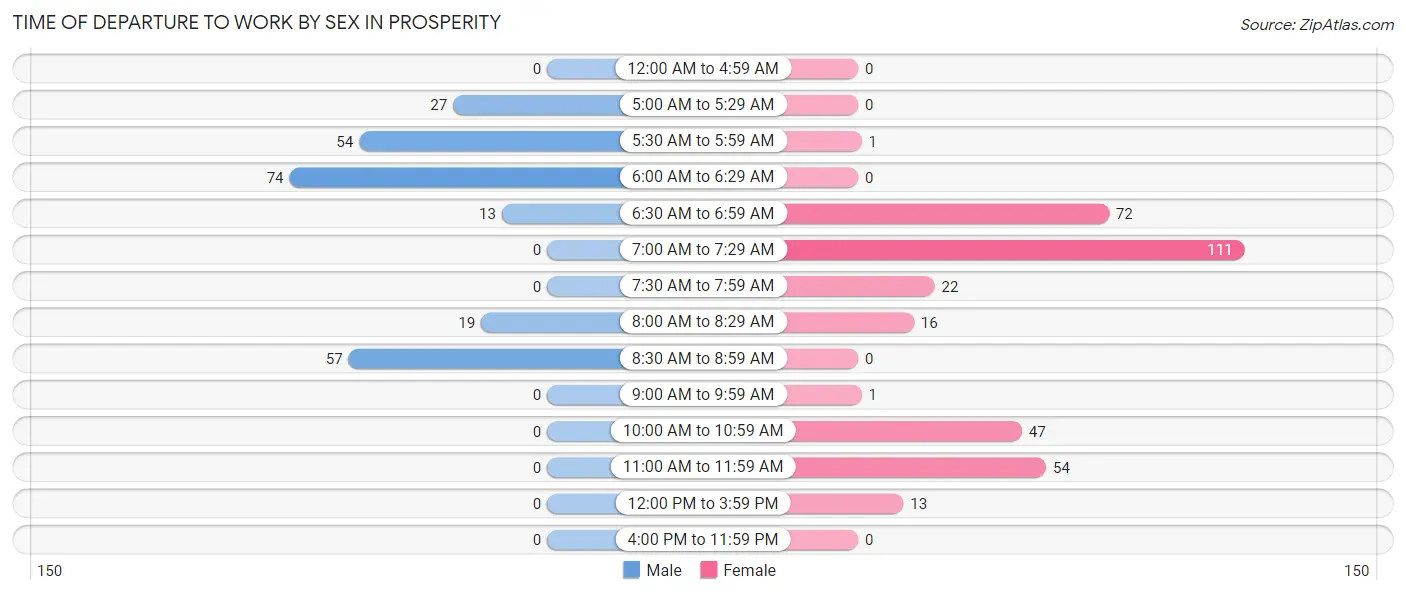
| Time of Departure | Male | Female |
| 12:00 AM to 4:59 AM | 0 (0.0%) | 0 (0.0%) |
| 5:00 AM to 5:29 AM | 27 (11.1%) | 0 (0.0%) |
| 5:30 AM to 5:59 AM | 54 (22.1%) | 1 (0.3%) |
| 6:00 AM to 6:29 AM | 74 (30.3%) | 0 (0.0%) |
| 6:30 AM to 6:59 AM | 13 (5.3%) | 72 (21.4%) |
| 7:00 AM to 7:29 AM | 0 (0.0%) | 111 (32.9%) |
| 7:30 AM to 7:59 AM | 0 (0.0%) | 22 (6.5%) |
| 8:00 AM to 8:29 AM | 19 (7.8%) | 16 (4.8%) |
| 8:30 AM to 8:59 AM | 57 (23.4%) | 0 (0.0%) |
| 9:00 AM to 9:59 AM | 0 (0.0%) | 1 (0.3%) |
| 10:00 AM to 10:59 AM | 0 (0.0%) | 47 (14.0%) |
| 11:00 AM to 11:59 AM | 0 (0.0%) | 54 (16.0%) |
| 12:00 PM to 3:59 PM | 0 (0.0%) | 13 (3.9%) |
| 4:00 PM to 11:59 PM | 0 (0.0%) | 0 (0.0%) |
| Total | 244 (100.0%) | 337 (100.0%) |
Housing Occupancy in Prosperity
Occupancy by Ownership in Prosperity
Of the total 476 dwellings in Prosperity, owner-occupied units account for 375 (78.8%), while renter-occupied units make up 101 (21.2%).
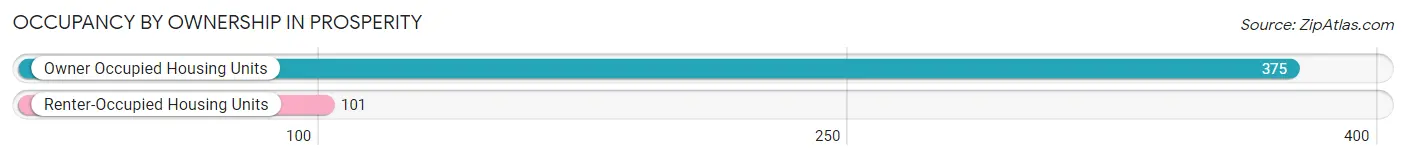
| Occupancy | # Housing Units | % Housing Units |
| Owner Occupied Housing Units | 375 | 78.8% |
| Renter-Occupied Housing Units | 101 | 21.2% |
| Total Occupied Housing Units | 476 | 100.0% |
Occupancy by Household Size in Prosperity
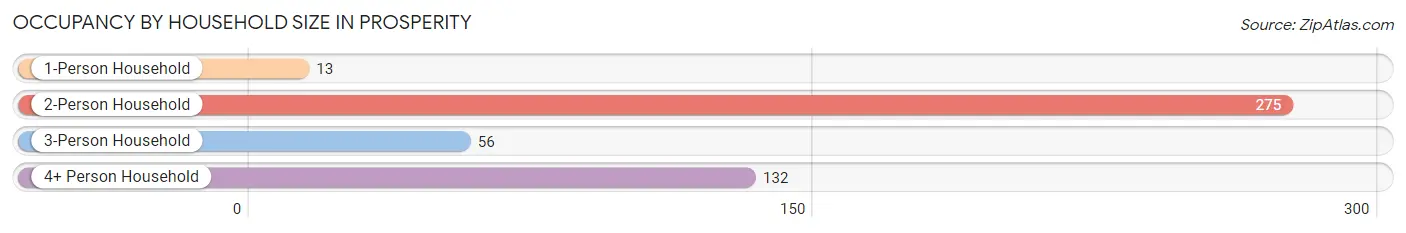
| Household Size | # Housing Units | % Housing Units |
| 1-Person Household | 13 | 2.7% |
| 2-Person Household | 275 | 57.8% |
| 3-Person Household | 56 | 11.8% |
| 4+ Person Household | 132 | 27.7% |
| Total Housing Units | 476 | 100.0% |
Occupancy by Ownership by Household Size in Prosperity
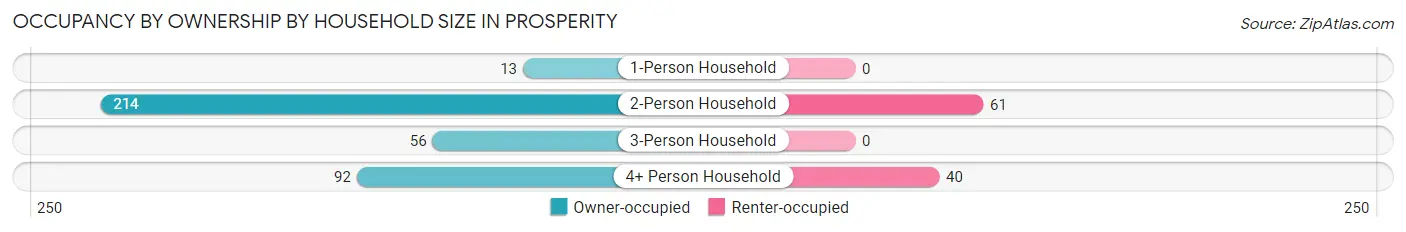
| Household Size | Owner-occupied | Renter-occupied |
| 1-Person Household | 13 (100.0%) | 0 (0.0%) |
| 2-Person Household | 214 (77.8%) | 61 (22.2%) |
| 3-Person Household | 56 (100.0%) | 0 (0.0%) |
| 4+ Person Household | 92 (69.7%) | 40 (30.3%) |
| Total Housing Units | 375 (78.8%) | 101 (21.2%) |
Occupancy by Educational Attainment in Prosperity
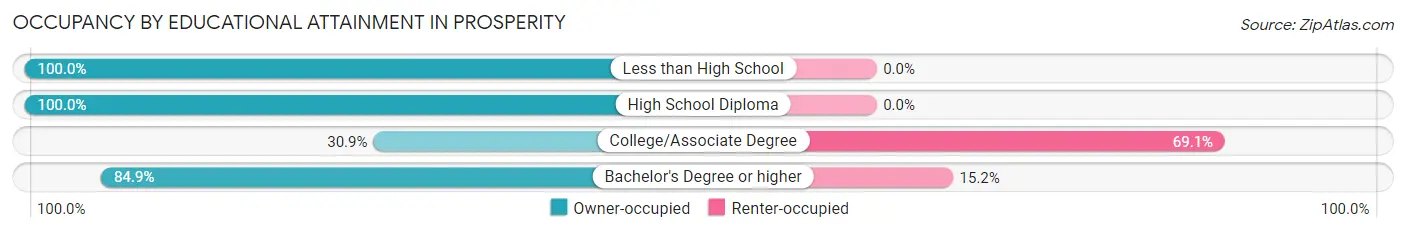
| Household Size | Owner-occupied | Renter-occupied |
| Less than High School | 19 (100.0%) | 0 (0.0%) |
| High School Diploma | 79 (100.0%) | 0 (0.0%) |
| College/Associate Degree | 25 (30.9%) | 56 (69.1%) |
| Bachelor's Degree or higher | 252 (84.9%) | 45 (15.1%) |
Occupancy by Age of Householder in Prosperity
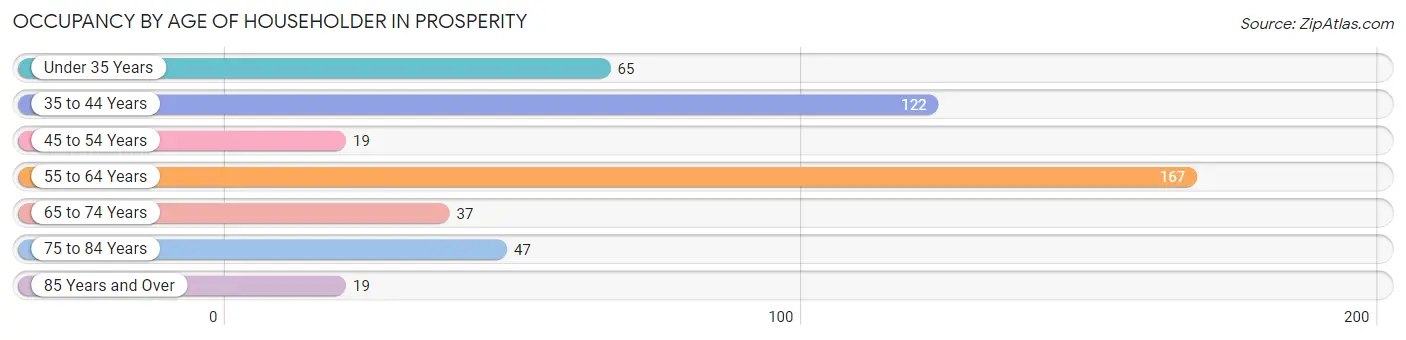
| Age Bracket | # Households | % Households |
| Under 35 Years | 65 | 13.7% |
| 35 to 44 Years | 122 | 25.6% |
| 45 to 54 Years | 19 | 4.0% |
| 55 to 64 Years | 167 | 35.1% |
| 65 to 74 Years | 37 | 7.8% |
| 75 to 84 Years | 47 | 9.9% |
| 85 Years and Over | 19 | 4.0% |
| Total | 476 | 100.0% |
Housing Finances in Prosperity
Median Income by Occupancy in Prosperity
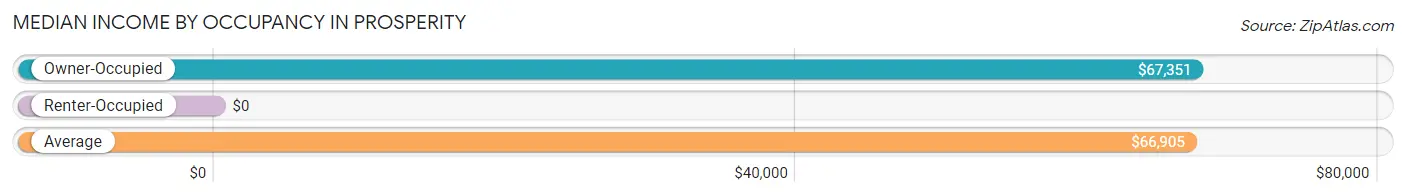
| Occupancy Type | # Households | Median Income |
| Owner-Occupied | 375 (78.8%) | $67,351 |
| Renter-Occupied | 101 (21.2%) | $0 |
| Average | 476 (100.0%) | $66,905 |
Occupancy by Householder Income Bracket in Prosperity
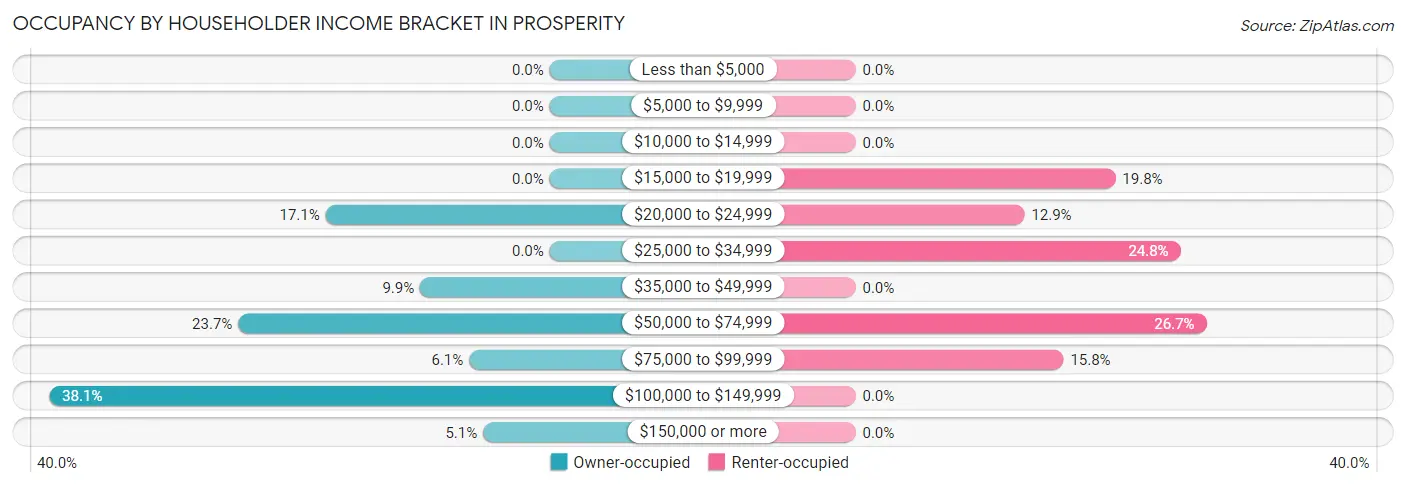
| Income Bracket | Owner-occupied | Renter-occupied |
| Less than $5,000 | 0 (0.0%) | 0 (0.0%) |
| $5,000 to $9,999 | 0 (0.0%) | 0 (0.0%) |
| $10,000 to $14,999 | 0 (0.0%) | 0 (0.0%) |
| $15,000 to $19,999 | 0 (0.0%) | 20 (19.8%) |
| $20,000 to $24,999 | 64 (17.1%) | 13 (12.9%) |
| $25,000 to $34,999 | 0 (0.0%) | 25 (24.7%) |
| $35,000 to $49,999 | 37 (9.9%) | 0 (0.0%) |
| $50,000 to $74,999 | 89 (23.7%) | 27 (26.7%) |
| $75,000 to $99,999 | 23 (6.1%) | 16 (15.8%) |
| $100,000 to $149,999 | 143 (38.1%) | 0 (0.0%) |
| $150,000 or more | 19 (5.1%) | 0 (0.0%) |
| Total | 375 (100.0%) | 101 (100.0%) |
Monthly Housing Cost Tiers in Prosperity
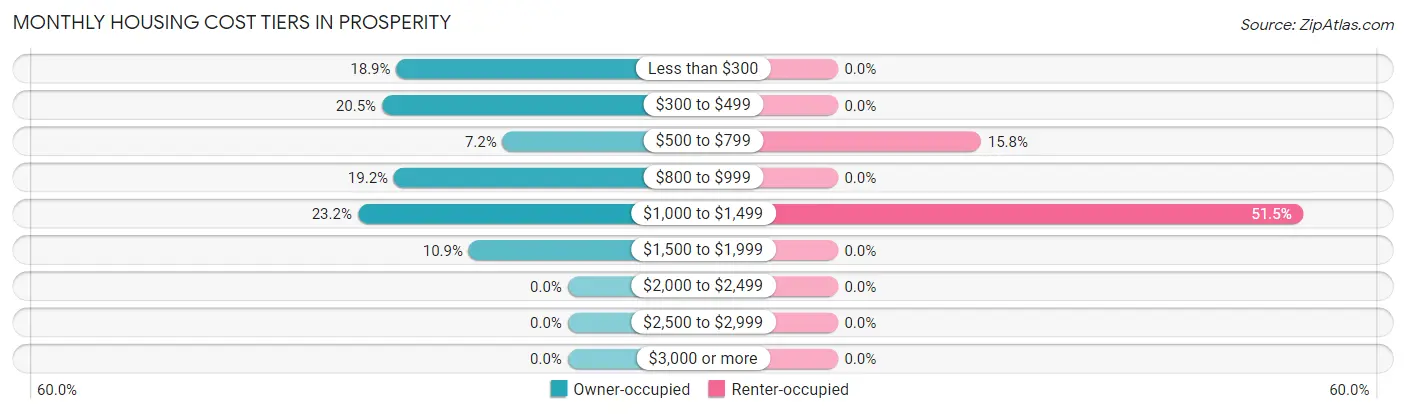
| Monthly Cost | Owner-occupied | Renter-occupied |
| Less than $300 | 71 (18.9%) | 0 (0.0%) |
| $300 to $499 | 77 (20.5%) | 0 (0.0%) |
| $500 to $799 | 27 (7.2%) | 16 (15.8%) |
| $800 to $999 | 72 (19.2%) | 0 (0.0%) |
| $1,000 to $1,499 | 87 (23.2%) | 52 (51.5%) |
| $1,500 to $1,999 | 41 (10.9%) | 0 (0.0%) |
| $2,000 to $2,499 | 0 (0.0%) | 0 (0.0%) |
| $2,500 to $2,999 | 0 (0.0%) | 0 (0.0%) |
| $3,000 or more | 0 (0.0%) | 0 (0.0%) |
| Total | 375 (100.0%) | 101 (100.0%) |
Physical Housing Characteristics in Prosperity
Housing Structures in Prosperity
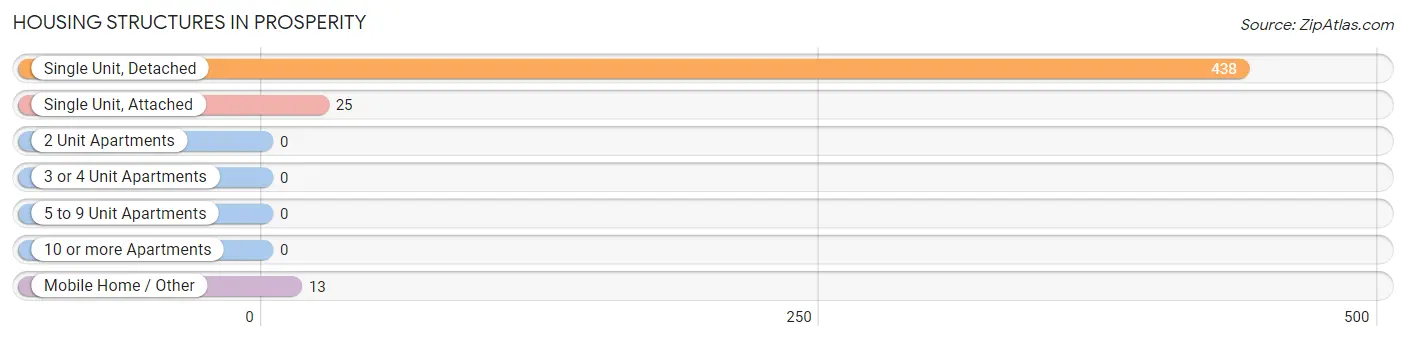
| Structure Type | # Housing Units | % Housing Units |
| Single Unit, Detached | 438 | 92.0% |
| Single Unit, Attached | 25 | 5.2% |
| 2 Unit Apartments | 0 | 0.0% |
| 3 or 4 Unit Apartments | 0 | 0.0% |
| 5 to 9 Unit Apartments | 0 | 0.0% |
| 10 or more Apartments | 0 | 0.0% |
| Mobile Home / Other | 13 | 2.7% |
| Total | 476 | 100.0% |
Housing Structures by Occupancy in Prosperity
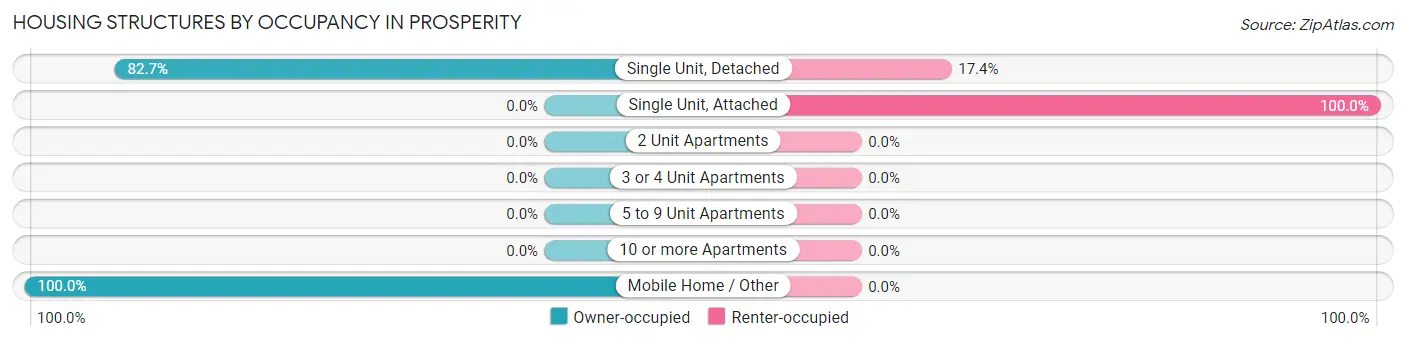
| Structure Type | Owner-occupied | Renter-occupied |
| Single Unit, Detached | 362 (82.7%) | 76 (17.3%) |
| Single Unit, Attached | 0 (0.0%) | 25 (100.0%) |
| 2 Unit Apartments | 0 (0.0%) | 0 (0.0%) |
| 3 or 4 Unit Apartments | 0 (0.0%) | 0 (0.0%) |
| 5 to 9 Unit Apartments | 0 (0.0%) | 0 (0.0%) |
| 10 or more Apartments | 0 (0.0%) | 0 (0.0%) |
| Mobile Home / Other | 13 (100.0%) | 0 (0.0%) |
| Total | 375 (78.8%) | 101 (21.2%) |
Housing Structures by Number of Rooms in Prosperity
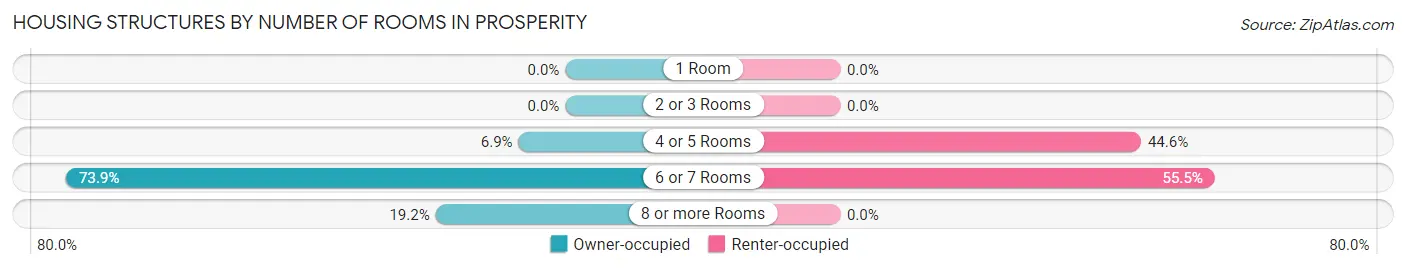
| Number of Rooms | Owner-occupied | Renter-occupied |
| 1 Room | 0 (0.0%) | 0 (0.0%) |
| 2 or 3 Rooms | 0 (0.0%) | 0 (0.0%) |
| 4 or 5 Rooms | 26 (6.9%) | 45 (44.6%) |
| 6 or 7 Rooms | 277 (73.9%) | 56 (55.4%) |
| 8 or more Rooms | 72 (19.2%) | 0 (0.0%) |
| Total | 375 (100.0%) | 101 (100.0%) |
Housing Structure by Heating Type in Prosperity
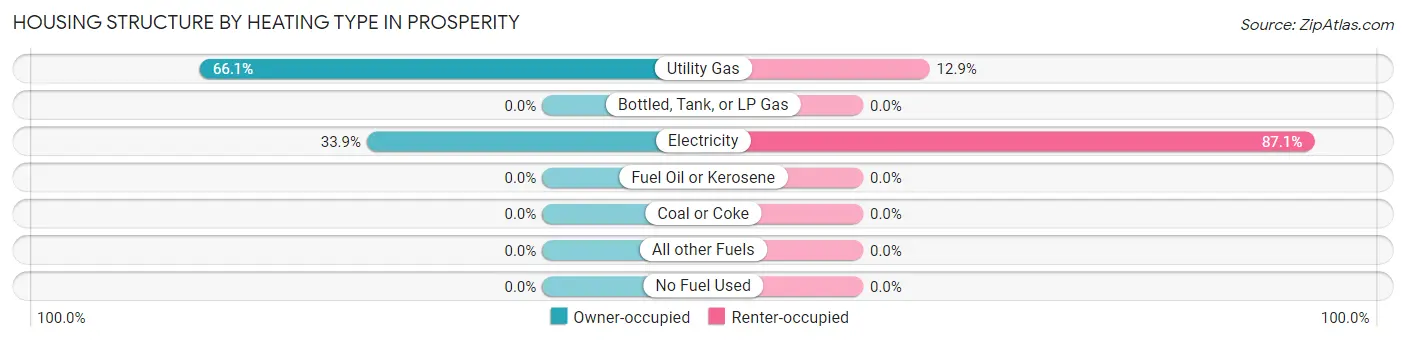
| Heating Type | Owner-occupied | Renter-occupied |
| Utility Gas | 248 (66.1%) | 13 (12.9%) |
| Bottled, Tank, or LP Gas | 0 (0.0%) | 0 (0.0%) |
| Electricity | 127 (33.9%) | 88 (87.1%) |
| Fuel Oil or Kerosene | 0 (0.0%) | 0 (0.0%) |
| Coal or Coke | 0 (0.0%) | 0 (0.0%) |
| All other Fuels | 0 (0.0%) | 0 (0.0%) |
| No Fuel Used | 0 (0.0%) | 0 (0.0%) |
| Total | 375 (100.0%) | 101 (100.0%) |
Household Vehicle Usage in Prosperity
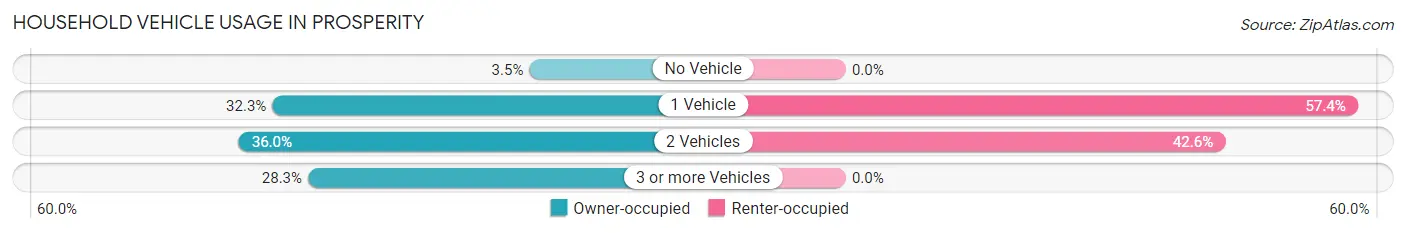
| Vehicles per Household | Owner-occupied | Renter-occupied |
| No Vehicle | 13 (3.5%) | 0 (0.0%) |
| 1 Vehicle | 121 (32.3%) | 58 (57.4%) |
| 2 Vehicles | 135 (36.0%) | 43 (42.6%) |
| 3 or more Vehicles | 106 (28.3%) | 0 (0.0%) |
| Total | 375 (100.0%) | 101 (100.0%) |
Real Estate & Mortgages in Prosperity
Real Estate and Mortgage Overview in Prosperity
| Characteristic | Without Mortgage | With Mortgage |
| Housing Units | 152 | 223 |
| Median Property Value | $101,500 | $124,100 |
| Median Household Income | $47,596 | $19 |
| Monthly Housing Costs | $406 | $0 |
| Real Estate Taxes | $642 | $0 |
Property Value by Mortgage Status in Prosperity
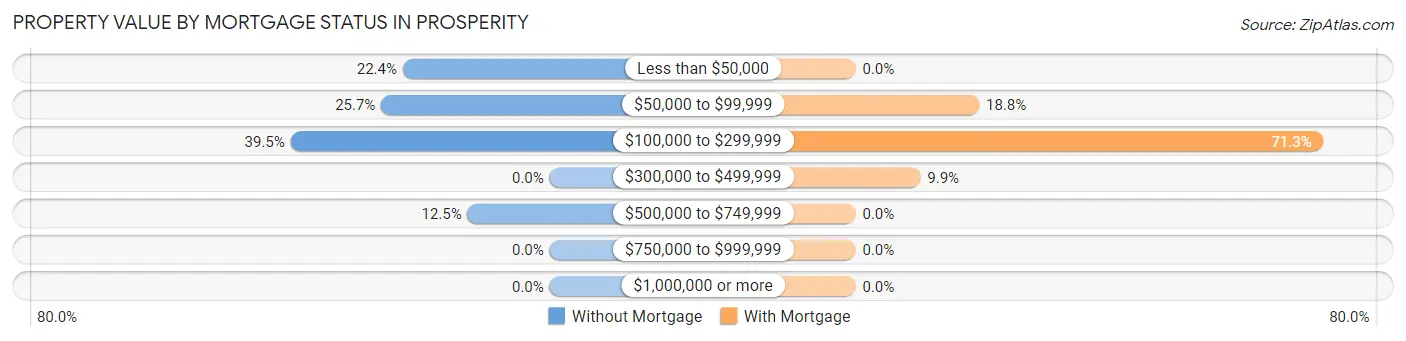
| Property Value | Without Mortgage | With Mortgage |
| Less than $50,000 | 34 (22.4%) | 0 (0.0%) |
| $50,000 to $99,999 | 39 (25.7%) | 42 (18.8%) |
| $100,000 to $299,999 | 60 (39.5%) | 159 (71.3%) |
| $300,000 to $499,999 | 0 (0.0%) | 22 (9.9%) |
| $500,000 to $749,999 | 19 (12.5%) | 0 (0.0%) |
| $750,000 to $999,999 | 0 (0.0%) | 0 (0.0%) |
| $1,000,000 or more | 0 (0.0%) | 0 (0.0%) |
| Total | 152 (100.0%) | 223 (100.0%) |
Household Income by Mortgage Status in Prosperity
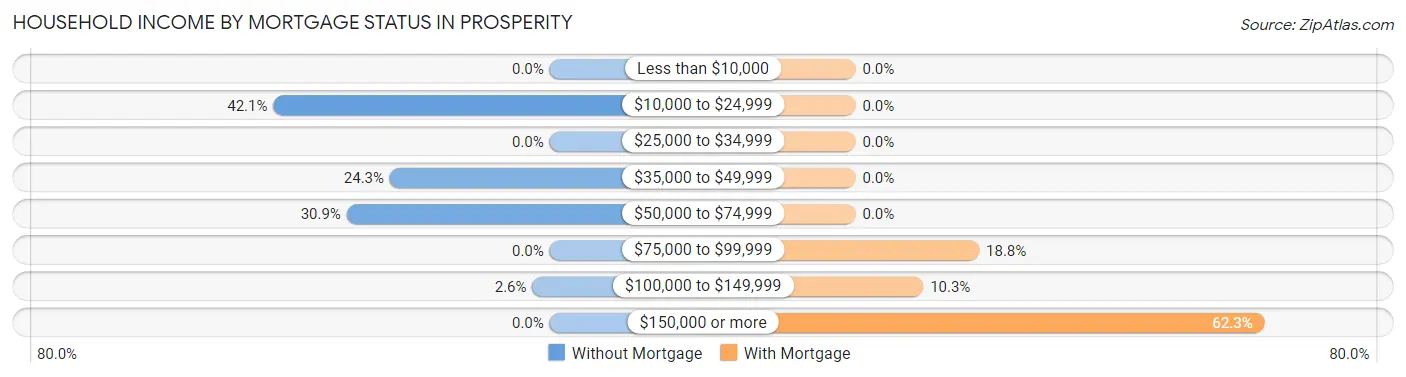
| Household Income | Without Mortgage | With Mortgage |
| Less than $10,000 | 0 (0.0%) | 0 (0.0%) |
| $10,000 to $24,999 | 64 (42.1%) | 0 (0.0%) |
| $25,000 to $34,999 | 0 (0.0%) | 0 (0.0%) |
| $35,000 to $49,999 | 37 (24.3%) | 0 (0.0%) |
| $50,000 to $74,999 | 47 (30.9%) | 0 (0.0%) |
| $75,000 to $99,999 | 0 (0.0%) | 42 (18.8%) |
| $100,000 to $149,999 | 4 (2.6%) | 23 (10.3%) |
| $150,000 or more | 0 (0.0%) | 139 (62.3%) |
| Total | 152 (100.0%) | 223 (100.0%) |
Property Value to Household Income Ratio in Prosperity
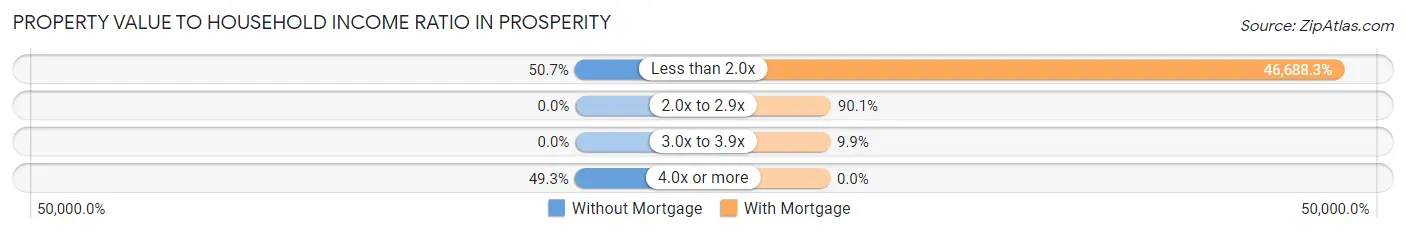
| Value-to-Income Ratio | Without Mortgage | With Mortgage |
| Less than 2.0x | 77 (50.7%) | 104,115 (46,688.3%) |
| 2.0x to 2.9x | 0 (0.0%) | 201 (90.1%) |
| 3.0x to 3.9x | 0 (0.0%) | 22 (9.9%) |
| 4.0x or more | 75 (49.3%) | 0 (0.0%) |
| Total | 152 (100.0%) | 223 (100.0%) |
Real Estate Taxes by Mortgage Status in Prosperity
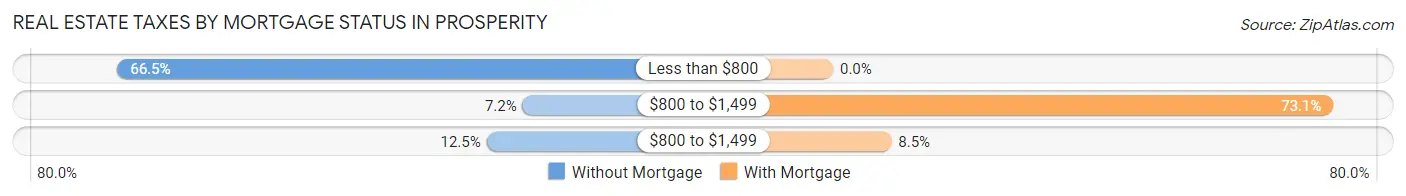
| Property Taxes | Without Mortgage | With Mortgage |
| Less than $800 | 101 (66.4%) | 0 (0.0%) |
| $800 to $1,499 | 11 (7.2%) | 163 (73.1%) |
| $800 to $1,499 | 19 (12.5%) | 19 (8.5%) |
| Total | 152 (100.0%) | 223 (100.0%) |
Health & Disability in Prosperity
Health Insurance Coverage by Age in Prosperity
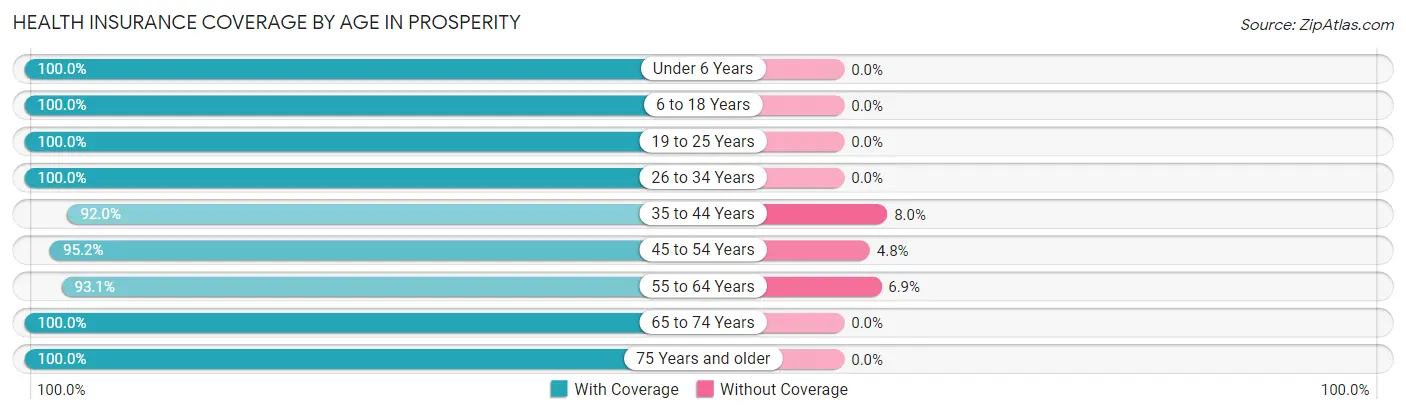
| Age Bracket | With Coverage | Without Coverage |
| Under 6 Years | 17 (100.0%) | 0 (0.0%) |
| 6 to 18 Years | 284 (100.0%) | 0 (0.0%) |
| 19 to 25 Years | 160 (100.0%) | 0 (0.0%) |
| 26 to 34 Years | 19 (100.0%) | 0 (0.0%) |
| 35 to 44 Years | 310 (92.0%) | 27 (8.0%) |
| 45 to 54 Years | 40 (95.2%) | 2 (4.8%) |
| 55 to 64 Years | 351 (93.1%) | 26 (6.9%) |
| 65 to 74 Years | 144 (100.0%) | 0 (0.0%) |
| 75 Years and older | 151 (100.0%) | 0 (0.0%) |
| Total | 1,476 (96.4%) | 55 (3.6%) |
Health Insurance Coverage by Citizenship Status in Prosperity
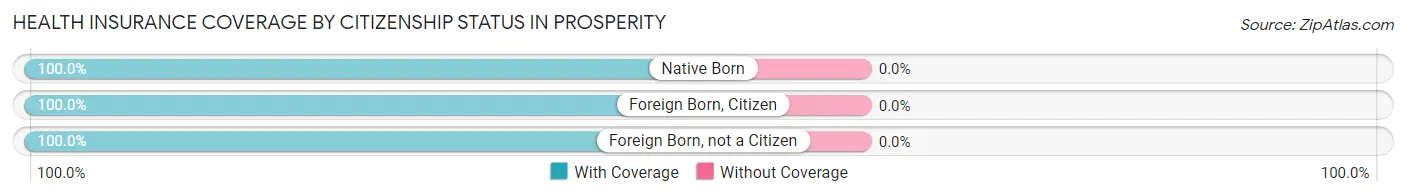
| Citizenship Status | With Coverage | Without Coverage |
| Native Born | 17 (100.0%) | 0 (0.0%) |
| Foreign Born, Citizen | 284 (100.0%) | 0 (0.0%) |
| Foreign Born, not a Citizen | 160 (100.0%) | 0 (0.0%) |
Health Insurance Coverage by Household Income in Prosperity
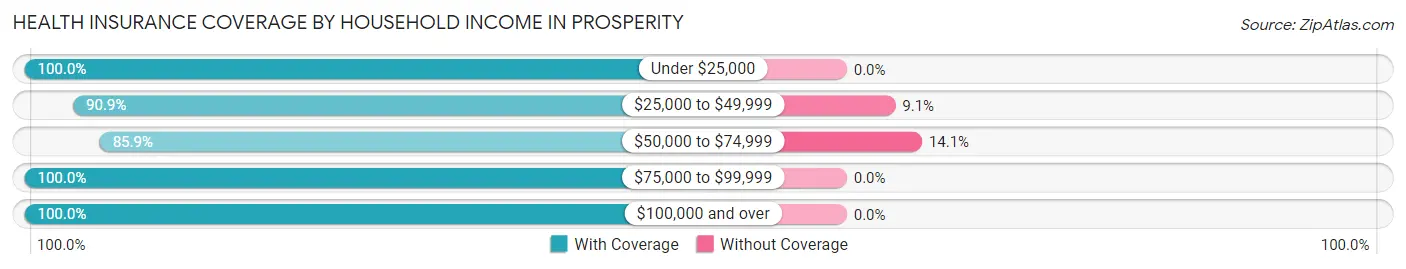
| Household Income | With Coverage | Without Coverage |
| Under $25,000 | 232 (100.0%) | 0 (0.0%) |
| $25,000 to $49,999 | 130 (90.9%) | 13 (9.1%) |
| $50,000 to $74,999 | 244 (85.9%) | 40 (14.1%) |
| $75,000 to $99,999 | 120 (100.0%) | 0 (0.0%) |
| $100,000 and over | 738 (100.0%) | 0 (0.0%) |
Public vs Private Health Insurance Coverage by Age in Prosperity
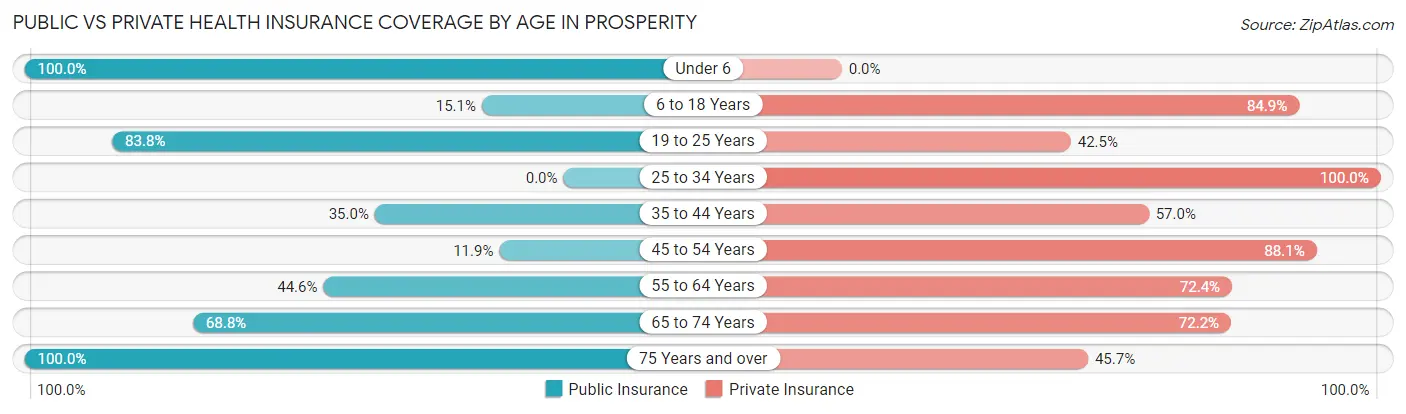
| Age Bracket | Public Insurance | Private Insurance |
| Under 6 | 17 (100.0%) | 0 (0.0%) |
| 6 to 18 Years | 43 (15.1%) | 241 (84.9%) |
| 19 to 25 Years | 134 (83.8%) | 68 (42.5%) |
| 25 to 34 Years | 0 (0.0%) | 19 (100.0%) |
| 35 to 44 Years | 118 (35.0%) | 192 (57.0%) |
| 45 to 54 Years | 5 (11.9%) | 37 (88.1%) |
| 55 to 64 Years | 168 (44.6%) | 273 (72.4%) |
| 65 to 74 Years | 99 (68.8%) | 104 (72.2%) |
| 75 Years and over | 151 (100.0%) | 69 (45.7%) |
| Total | 735 (48.0%) | 1,003 (65.5%) |
Disability Status by Sex by Age in Prosperity
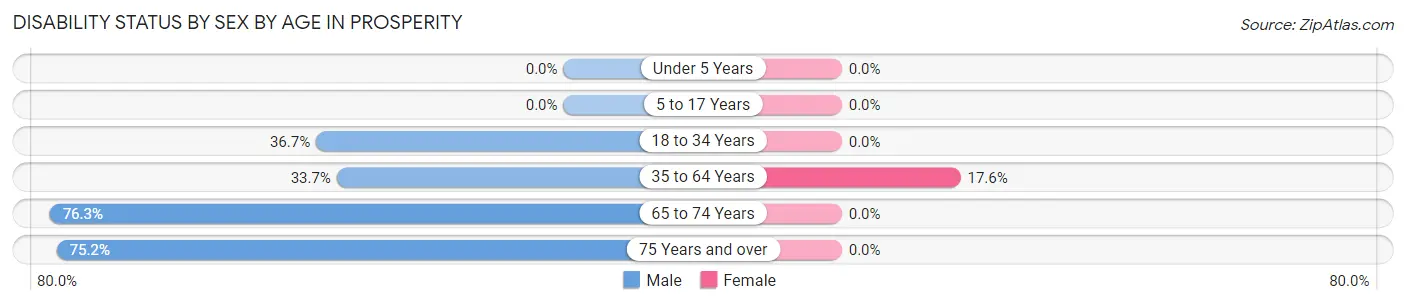
| Age Bracket | Male | Female |
| Under 5 Years | 0 (0.0%) | 0 (0.0%) |
| 5 to 17 Years | 0 (0.0%) | 0 (0.0%) |
| 18 to 34 Years | 36 (36.7%) | 0 (0.0%) |
| 35 to 64 Years | 138 (33.7%) | 61 (17.6%) |
| 65 to 74 Years | 45 (76.3%) | 0 (0.0%) |
| 75 Years and over | 79 (75.2%) | 0 (0.0%) |
Disability Class by Sex by Age in Prosperity
Disability Class: Hearing Difficulty
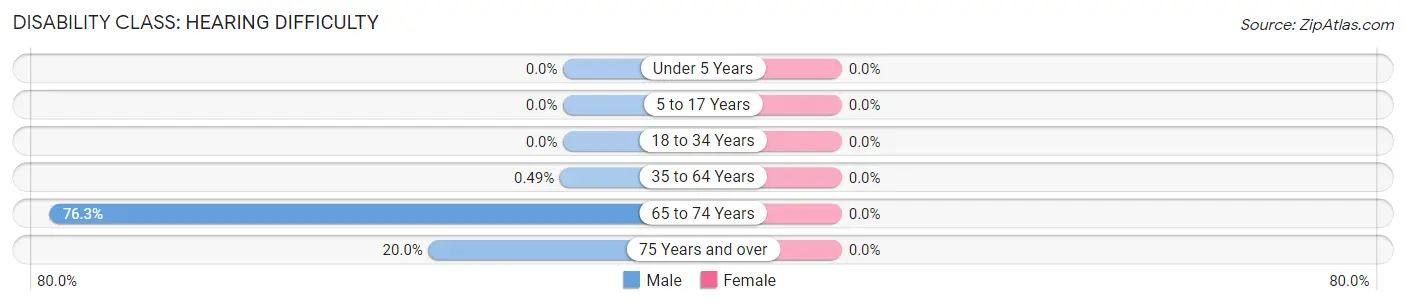
| Age Bracket | Male | Female |
| Under 5 Years | 0 (0.0%) | 0 (0.0%) |
| 5 to 17 Years | 0 (0.0%) | 0 (0.0%) |
| 18 to 34 Years | 0 (0.0%) | 0 (0.0%) |
| 35 to 64 Years | 2 (0.5%) | 0 (0.0%) |
| 65 to 74 Years | 45 (76.3%) | 0 (0.0%) |
| 75 Years and over | 21 (20.0%) | 0 (0.0%) |
Disability Class: Vision Difficulty
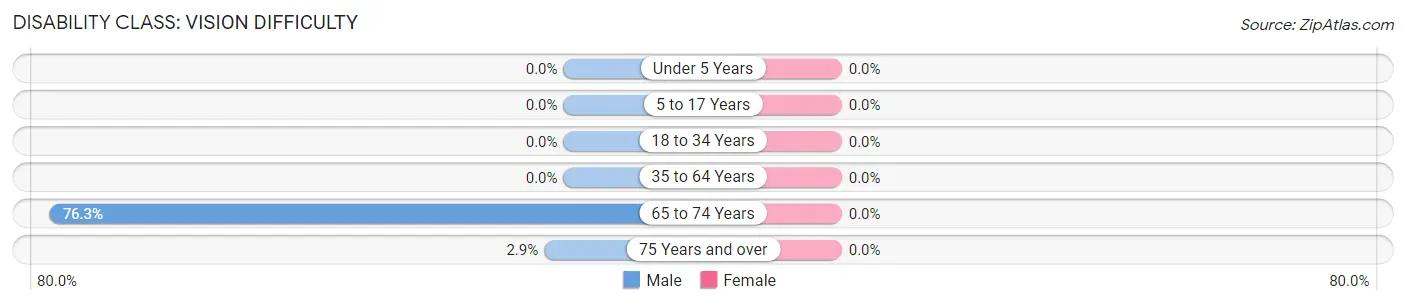
| Age Bracket | Male | Female |
| Under 5 Years | 0 (0.0%) | 0 (0.0%) |
| 5 to 17 Years | 0 (0.0%) | 0 (0.0%) |
| 18 to 34 Years | 0 (0.0%) | 0 (0.0%) |
| 35 to 64 Years | 0 (0.0%) | 0 (0.0%) |
| 65 to 74 Years | 45 (76.3%) | 0 (0.0%) |
| 75 Years and over | 3 (2.9%) | 0 (0.0%) |
Disability Class: Cognitive Difficulty
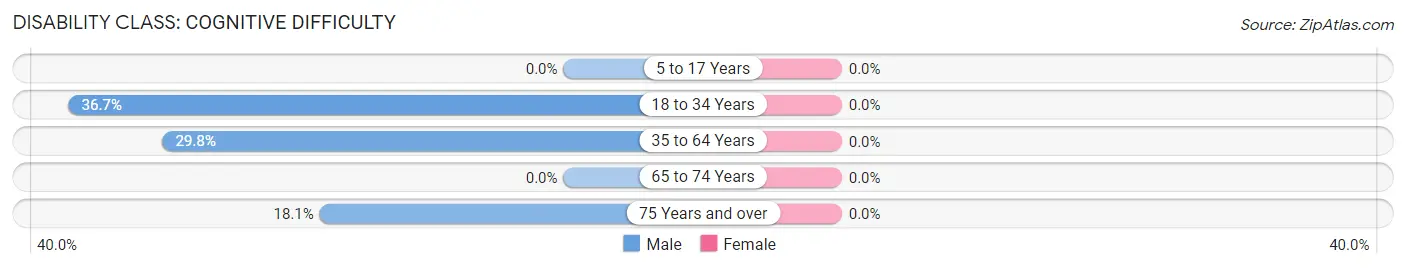
| Age Bracket | Male | Female |
| 5 to 17 Years | 0 (0.0%) | 0 (0.0%) |
| 18 to 34 Years | 36 (36.7%) | 0 (0.0%) |
| 35 to 64 Years | 122 (29.8%) | 0 (0.0%) |
| 65 to 74 Years | 0 (0.0%) | 0 (0.0%) |
| 75 Years and over | 19 (18.1%) | 0 (0.0%) |
Disability Class: Ambulatory Difficulty
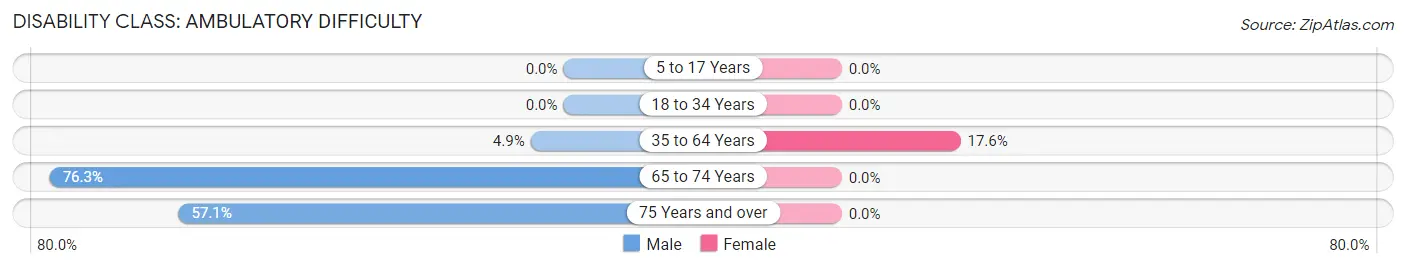
| Age Bracket | Male | Female |
| 5 to 17 Years | 0 (0.0%) | 0 (0.0%) |
| 18 to 34 Years | 0 (0.0%) | 0 (0.0%) |
| 35 to 64 Years | 20 (4.9%) | 61 (17.6%) |
| 65 to 74 Years | 45 (76.3%) | 0 (0.0%) |
| 75 Years and over | 60 (57.1%) | 0 (0.0%) |
Disability Class: Self-Care Difficulty
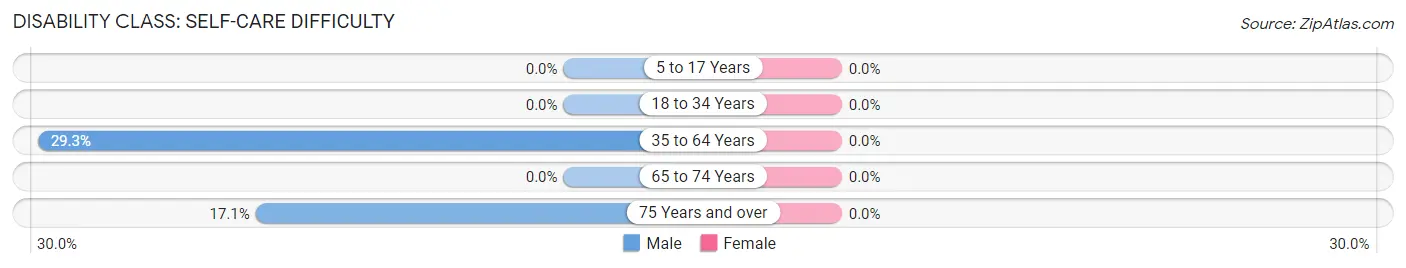
| Age Bracket | Male | Female |
| 5 to 17 Years | 0 (0.0%) | 0 (0.0%) |
| 18 to 34 Years | 0 (0.0%) | 0 (0.0%) |
| 35 to 64 Years | 120 (29.3%) | 0 (0.0%) |
| 65 to 74 Years | 0 (0.0%) | 0 (0.0%) |
| 75 Years and over | 18 (17.1%) | 0 (0.0%) |
Technology Access in Prosperity
Computing Device Access in Prosperity
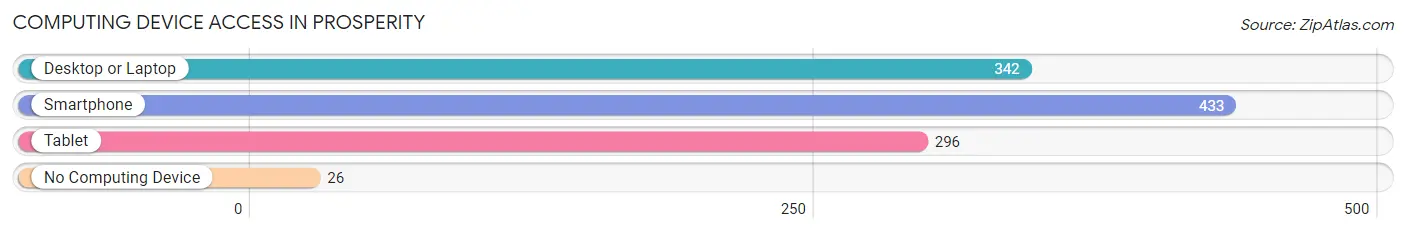
| Device Type | # Households | % Households |
| Desktop or Laptop | 342 | 71.9% |
| Smartphone | 433 | 91.0% |
| Tablet | 296 | 62.2% |
| No Computing Device | 26 | 5.5% |
| Total | 476 | 100.0% |
Internet Access in Prosperity
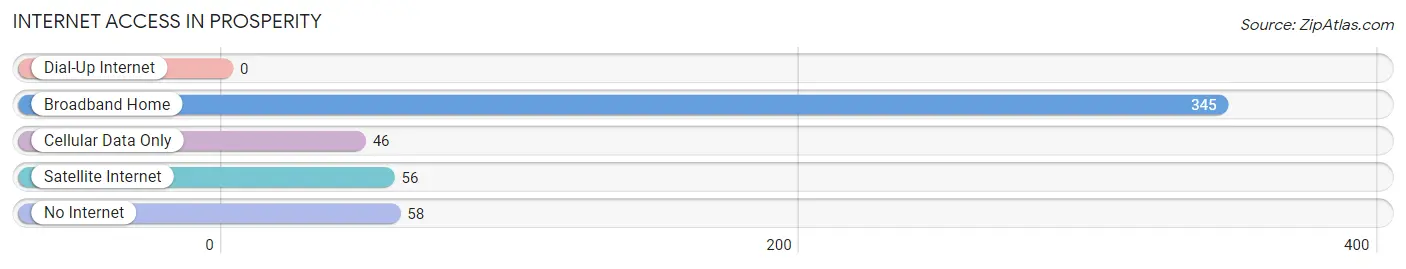
| Internet Type | # Households | % Households |
| Dial-Up Internet | 0 | 0.0% |
| Broadband Home | 345 | 72.5% |
| Cellular Data Only | 46 | 9.7% |
| Satellite Internet | 56 | 11.8% |
| No Internet | 58 | 12.2% |
| Total | 476 | 100.0% |
Prosperity Summary
Prosperity is a small town located in the eastern part of West Virginia, in the Appalachian Mountains. It is situated in the heart of the Monongahela National Forest, and is surrounded by lush forests and rolling hills. The town is located in the county of Preston, and is part of the Morgantown Metropolitan Statistical Area. As of the 2010 census, the population of Prosperity was 1,068.
History
The area that is now Prosperity was first settled in the late 1700s by a group of German immigrants. The town was originally known as “Prosperity”, and was named after the prosperous farms and businesses that were established in the area. The town was officially incorporated in 1891.
In the early 1900s, Prosperity was a thriving community, with a variety of businesses and industries. The town was home to a number of coal mines, as well as a sawmill, a gristmill, and a tannery. The town also had a number of stores, including a general store, a drug store, and a hardware store.
In the 1950s, Prosperity began to decline as the coal industry in the area began to decline. The town’s population began to dwindle, and many of the businesses closed. In the late 1970s, the town was revitalized when the Monongahela National Forest was established. The forest provided a number of recreational opportunities, and the town began to attract tourists and outdoor enthusiasts.
Geography
Prosperity is located in the eastern part of West Virginia, in the Appalachian Mountains. The town is situated in the heart of the Monongahela National Forest, and is surrounded by lush forests and rolling hills. The town is located in the county of Preston, and is part of the Morgantown Metropolitan Statistical Area.
The town is located at an elevation of 1,890 feet, and is situated on the banks of the Cheat River. The town is located approximately 30 miles from Morgantown, and is accessible via US Route 50.
Economy
The economy of Prosperity is largely based on tourism and outdoor recreation. The town is located in the heart of the Monongahela National Forest, and is a popular destination for hikers, campers, and other outdoor enthusiasts. The town is also home to a number of small businesses, including restaurants, shops, and lodging.
The town is also home to a number of coal mines, which provide employment for many of the town’s residents. The town is also home to a number of small farms, which produce a variety of crops, including corn, soybeans, and hay.
Demographics
As of the 2010 census, the population of Prosperity was 1,068. The town has a median age of 41.7 years, and a median household income of $37,917. The town is predominantly white, with 92.3% of the population identifying as white. The town also has a small Hispanic population, with 4.2% of the population identifying as Hispanic or Latino. The town also has a small African American population, with 1.7% of the population identifying as African American.
Conclusion
Prosperity is a small town located in the eastern part of West Virginia, in the Appalachian Mountains. The town is situated in the heart of the Monongahela National Forest, and is surrounded by lush forests and rolling hills. The town is home to a number of small businesses, and is a popular destination for hikers, campers, and other outdoor enthusiasts. The town is also home to a number of coal mines, which provide employment for many of the town’s residents. As of the 2010 census, the population of Prosperity was 1,068.
Common Questions
What is the Total Population of Prosperity?
Total Population of Prosperity is 1,531.
What is the Total Male Population of Prosperity?
Total Male Population of Prosperity is 854.
What is the Total Female Population of Prosperity?
Total Female Population of Prosperity is 677.
What is the Ratio of Males per 100 Females in Prosperity?
There are 126.14 Males per 100 Females in Prosperity.
What is the Ratio of Females per 100 Males in Prosperity?
There are 79.27 Females per 100 Males in Prosperity.
What is the Median Population Age in Prosperity?
Median Population Age in Prosperity is 41.3 Years.
What is the Average Family Size in Prosperity
Average Family Size in Prosperity is 3.1 People.
What is the Average Household Size in Prosperity
Average Household Size in Prosperity is 3.2 People.
What is Per Capita Income in Prosperity?
Per Capita income in Prosperity is $24,408.
What is the Median Family Income in Prosperity?
Median Family Income in Prosperity is $68,333.
What is the Median Household income in Prosperity?
Median Household Income in Prosperity is $66,905.
What is Inequality or Gini Index in Prosperity?
Inequality or Gini Index in Prosperity is 0.34.
How Large is the Labor Force in Prosperity?
There are 732 People in the Labor Forcein in Prosperity.
What is the Percentage of People in the Labor Force in Prosperity?
58.3% of People are in the Labor Force in Prosperity.
What is the Unemployment Rate in Prosperity?
Unemployment Rate in Prosperity is 16.8%.