Cities with the Highest Percentage of Immigrants from Western Europe in Wisconsin
RELATED REPORTS & OPTIONS
Western Europe
Wisconsin
Compare Cities
Map of Cities with the Highest Percentage of Immigrants from Western Europe in Wisconsin
0.00%
10.00%
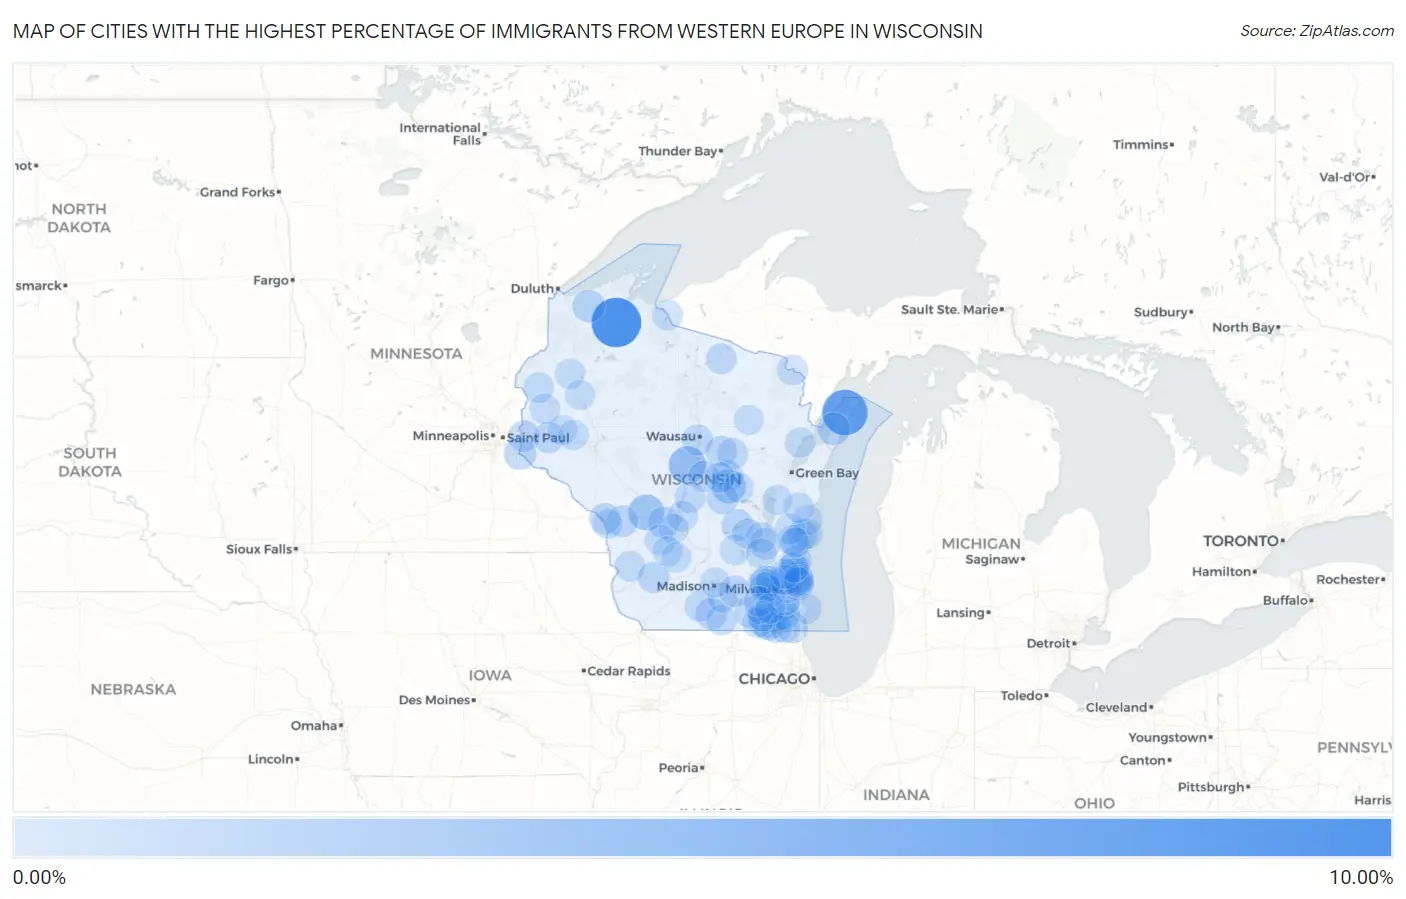
Cities with the Highest Percentage of Immigrants from Western Europe in Wisconsin
| City | Western Europe | vs State | vs National | |
| 1. | Grand View | 9.80% | 0.21%(+9.60)#1 | 0.28%(+9.52)#31 |
| 2. | Ellison Bay | 7.75% | 0.21%(+7.54)#2 | 0.28%(+7.47)#59 |
| 3. | Dekorra | 4.59% | 0.21%(+4.38)#3 | 0.28%(+4.31)#144 |
| 4. | Milladore | 3.86% | 0.21%(+3.65)#4 | 0.28%(+3.58)#175 |
| 5. | Tunnel City | 3.12% | 0.21%(+2.92)#5 | 0.28%(+2.85)#243 |
| 6. | Oconomowoc Lake | 2.75% | 0.21%(+2.54)#6 | 0.28%(+2.47)#300 |
| 7. | King | 2.41% | 0.21%(+2.20)#7 | 0.28%(+2.13)#372 |
| 8. | Como | 1.78% | 0.21%(+1.57)#8 | 0.28%(+1.50)#620 |
| 9. | Lake Geneva | 1.73% | 0.21%(+1.52)#9 | 0.28%(+1.45)#641 |
| 10. | Lyons | 1.70% | 0.21%(+1.50)#10 | 0.28%(+1.42)#655 |
| 11. | Egg Harbor | 1.58% | 0.21%(+1.37)#11 | 0.28%(+1.30)#743 |
| 12. | Harrisville | 1.50% | 0.21%(+1.30)#12 | 0.28%(+1.22)#793 |
| 13. | Brule | 1.50% | 0.21%(+1.29)#13 | 0.28%(+1.22)#796 |
| 14. | Prescott | 1.38% | 0.21%(+1.17)#14 | 0.28%(+1.10)#893 |
| 15. | Green Lake | 1.20% | 0.21%(+0.993)#15 | 0.28%(+0.921)#1,092 |
| 16. | Hustler | 1.19% | 0.21%(+0.983)#16 | 0.28%(+0.911)#1,107 |
| 17. | Albany | 1.18% | 0.21%(+0.974)#17 | 0.28%(+0.901)#1,127 |
| 18. | Bayside | 1.11% | 0.21%(+0.903)#18 | 0.28%(+0.830)#1,226 |
| 19. | Scandinavia | 1.10% | 0.21%(+0.889)#19 | 0.28%(+0.817)#1,248 |
| 20. | Mequon | 1.09% | 0.21%(+0.881)#20 | 0.28%(+0.808)#1,261 |
| 21. | Bangor | 1.06% | 0.21%(+0.856)#21 | 0.28%(+0.784)#1,305 |
| 22. | Hudson | 1.04% | 0.21%(+0.836)#22 | 0.28%(+0.764)#1,343 |
| 23. | Cambridge | 1.04% | 0.21%(+0.833)#23 | 0.28%(+0.761)#1,351 |
| 24. | Muscoda | 1.01% | 0.21%(+0.798)#24 | 0.28%(+0.726)#1,420 |
| 25. | Brice Prairie | 0.98% | 0.21%(+0.770)#25 | 0.28%(+0.698)#1,476 |
| 26. | Brownsville | 0.98% | 0.21%(+0.769)#26 | 0.28%(+0.697)#1,477 |
| 27. | Wild Rose | 0.96% | 0.21%(+0.748)#27 | 0.28%(+0.676)#1,519 |
| 28. | Bristol | 0.95% | 0.21%(+0.741)#28 | 0.28%(+0.669)#1,533 |
| 29. | Elderon | 0.93% | 0.21%(+0.719)#29 | 0.28%(+0.647)#1,584 |
| 30. | Plover | 0.92% | 0.21%(+0.708)#30 | 0.28%(+0.636)#1,615 |
| 31. | Woodville | 0.91% | 0.21%(+0.704)#31 | 0.28%(+0.632)#1,627 |
| 32. | Rib Mountain | 0.89% | 0.21%(+0.687)#32 | 0.28%(+0.615)#1,672 |
| 33. | Tigerton | 0.88% | 0.21%(+0.677)#33 | 0.28%(+0.604)#1,707 |
| 34. | Eagle River | 0.83% | 0.21%(+0.618)#34 | 0.28%(+0.546)#1,848 |
| 35. | Lake Sherwood | 0.79% | 0.21%(+0.587)#35 | 0.28%(+0.514)#1,951 |
| 36. | New Glarus | 0.76% | 0.21%(+0.556)#36 | 0.28%(+0.483)#2,047 |
| 37. | Shorewood | 0.74% | 0.21%(+0.537)#37 | 0.28%(+0.465)#2,101 |
| 38. | Nashotah | 0.74% | 0.21%(+0.533)#38 | 0.28%(+0.461)#2,120 |
| 39. | Oakfield | 0.74% | 0.21%(+0.532)#39 | 0.28%(+0.460)#2,125 |
| 40. | Dellwood | 0.73% | 0.21%(+0.524)#40 | 0.28%(+0.452)#2,155 |
| 41. | Gays Mills | 0.73% | 0.21%(+0.522)#41 | 0.28%(+0.449)#2,175 |
| 42. | Hurley | 0.71% | 0.21%(+0.505)#42 | 0.28%(+0.432)#2,229 |
| 43. | Wind Point | 0.71% | 0.21%(+0.504)#43 | 0.28%(+0.432)#2,230 |
| 44. | Browns Lake | 0.71% | 0.21%(+0.503)#44 | 0.28%(+0.431)#2,236 |
| 45. | Grafton | 0.71% | 0.21%(+0.500)#45 | 0.28%(+0.428)#2,244 |
| 46. | Niagara | 0.70% | 0.21%(+0.496)#46 | 0.28%(+0.423)#2,255 |
| 47. | Hingham | 0.70% | 0.21%(+0.495)#47 | 0.28%(+0.422)#2,258 |
| 48. | Briggsville | 0.69% | 0.21%(+0.483)#49 | 0.28%(+0.410)#2,293 |
| 49. | Lake Lorraine | 0.69% | 0.21%(+0.483)#50 | 0.28%(+0.410)#2,294 |
| 50. | Hillsboro | 0.68% | 0.21%(+0.476)#51 | 0.28%(+0.404)#2,323 |
| 51. | Wind Lake | 0.67% | 0.21%(+0.460)#52 | 0.28%(+0.388)#2,393 |
| 52. | Luck | 0.66% | 0.21%(+0.452)#53 | 0.28%(+0.380)#2,428 |
| 53. | Powers Lake | 0.65% | 0.21%(+0.445)#54 | 0.28%(+0.372)#2,463 |
| 54. | Sheboygan Falls | 0.65% | 0.21%(+0.442)#55 | 0.28%(+0.370)#2,473 |
| 55. | Eagle Lake | 0.63% | 0.21%(+0.422)#56 | 0.28%(+0.350)#2,586 |
| 56. | Salem Lakes | 0.62% | 0.21%(+0.418)#57 | 0.28%(+0.345)#2,610 |
| 57. | Amherst | 0.61% | 0.21%(+0.400)#58 | 0.28%(+0.328)#2,713 |
| 58. | Muskego | 0.60% | 0.21%(+0.395)#59 | 0.28%(+0.323)#2,747 |
| 59. | Randolph | 0.60% | 0.21%(+0.389)#60 | 0.28%(+0.317)#2,771 |
| 60. | Brandon | 0.59% | 0.21%(+0.387)#61 | 0.28%(+0.315)#2,775 |
| 61. | Orfordville | 0.59% | 0.21%(+0.384)#62 | 0.28%(+0.312)#2,787 |
| 62. | Elm Grove | 0.59% | 0.21%(+0.383)#63 | 0.28%(+0.310)#2,794 |
| 63. | Saukville | 0.58% | 0.21%(+0.378)#64 | 0.28%(+0.306)#2,825 |
| 64. | Mayville | 0.58% | 0.21%(+0.373)#65 | 0.28%(+0.300)#2,850 |
| 65. | Sheboygan | 0.57% | 0.21%(+0.359)#66 | 0.28%(+0.287)#2,918 |
| 66. | Shell Lake | 0.54% | 0.21%(+0.334)#67 | 0.28%(+0.262)#3,055 |
| 67. | Tainter Lake | 0.54% | 0.21%(+0.331)#68 | 0.28%(+0.259)#3,079 |
| 68. | Wales | 0.52% | 0.21%(+0.314)#69 | 0.28%(+0.242)#3,184 |
| 69. | Menomonee Falls | 0.52% | 0.21%(+0.314)#70 | 0.28%(+0.241)#3,185 |
| 70. | French Island | 0.52% | 0.21%(+0.309)#71 | 0.28%(+0.236)#3,213 |
| 71. | Delavan Lake | 0.51% | 0.21%(+0.306)#72 | 0.28%(+0.233)#3,233 |
| 72. | Chenequa | 0.51% | 0.21%(+0.304)#73 | 0.28%(+0.232)#3,245 |
| 73. | Mauston | 0.51% | 0.21%(+0.303)#74 | 0.28%(+0.231)#3,249 |
| 74. | Amery | 0.51% | 0.21%(+0.300)#75 | 0.28%(+0.228)#3,280 |
| 75. | Glendale | 0.49% | 0.21%(+0.284)#76 | 0.28%(+0.212)#3,386 |
| 76. | Glenbeulah | 0.49% | 0.21%(+0.282)#77 | 0.28%(+0.210)#3,410 |
| 77. | Weyauwega | 0.48% | 0.21%(+0.278)#78 | 0.28%(+0.205)#3,436 |
| 78. | Fox Point | 0.48% | 0.21%(+0.277)#79 | 0.28%(+0.205)#3,438 |
| 79. | Whitefish Bay | 0.48% | 0.21%(+0.273)#80 | 0.28%(+0.200)#3,477 |
| 80. | Oconomowoc | 0.48% | 0.21%(+0.272)#81 | 0.28%(+0.199)#3,480 |
| 81. | Cleveland | 0.47% | 0.21%(+0.267)#82 | 0.28%(+0.195)#3,512 |
| 82. | Stoughton | 0.47% | 0.21%(+0.267)#83 | 0.28%(+0.194)#3,520 |
| 83. | Summit | 0.47% | 0.21%(+0.261)#84 | 0.28%(+0.189)#3,553 |
| 84. | Boyceville | 0.47% | 0.21%(+0.260)#85 | 0.28%(+0.187)#3,568 |
| 85. | Cascade | 0.46% | 0.21%(+0.255)#86 | 0.28%(+0.182)#3,604 |
| 86. | Oconto | 0.46% | 0.21%(+0.251)#87 | 0.28%(+0.179)#3,629 |
| 87. | Valders | 0.45% | 0.21%(+0.248)#88 | 0.28%(+0.175)#3,652 |
| 88. | Maple Bluff | 0.45% | 0.21%(+0.245)#89 | 0.28%(+0.173)#3,670 |
| 89. | Cedarburg | 0.44% | 0.21%(+0.235)#90 | 0.28%(+0.163)#3,748 |
| 90. | Lauderdale Lakes | 0.44% | 0.21%(+0.235)#91 | 0.28%(+0.163)#3,752 |
| 91. | Sherwood | 0.43% | 0.21%(+0.227)#92 | 0.28%(+0.155)#3,809 |
| 92. | Adell | 0.43% | 0.21%(+0.226)#93 | 0.28%(+0.154)#3,817 |
| 93. | Cazenovia | 0.43% | 0.21%(+0.224)#94 | 0.28%(+0.152)#3,837 |
| 94. | Palmyra | 0.43% | 0.21%(+0.222)#95 | 0.28%(+0.150)#3,851 |
| 95. | Loganville | 0.42% | 0.21%(+0.217)#96 | 0.28%(+0.144)#3,897 |
| 96. | Rice Lake | 0.41% | 0.21%(+0.205)#97 | 0.28%(+0.132)#4,003 |
| 97. | White Lake | 0.41% | 0.21%(+0.203)#98 | 0.28%(+0.131)#4,019 |
| 98. | Elkhorn | 0.41% | 0.21%(+0.203)#99 | 0.28%(+0.130)#4,021 |
| 99. | Germantown | 0.41% | 0.21%(+0.200)#100 | 0.28%(+0.128)#4,050 |
| 100. | East Troy | 0.41% | 0.21%(+0.200)#101 | 0.28%(+0.128)#4,051 |
Common Questions
What are the Top 10 Cities with the Highest Percentage of Immigrants from Western Europe in Wisconsin?
Top 10 Cities with the Highest Percentage of Immigrants from Western Europe in Wisconsin are:
#1
9.80%
#2
7.75%
#3
3.86%
#4
3.12%
#5
2.75%
#6
2.41%
#7
1.78%
#8
1.73%
#9
1.58%
#10
1.50%
What city has the Highest Percentage of Immigrants from Western Europe in Wisconsin?
Grand View has the Highest Percentage of Immigrants from Western Europe in Wisconsin with 9.80%.
What is the Percentage of Immigrants from Western Europe in the State of Wisconsin?
Percentage of Immigrants from Western Europe in Wisconsin is 0.21%.
What is the Percentage of Immigrants from Western Europe in the United States?
Percentage of Immigrants from Western Europe in the United States is 0.28%.