Terrace Heights, WA
Terrace Heights Map
Terrace Heights Overview
9,781
TOTAL POPULATION
5,030
MALE POPULATION
4,751
FEMALE POPULATION
105.87
MALES / 100 FEMALES
94.45
FEMALES / 100 MALES
37.8
MEDIAN AGE
3.0
AVG FAMILY SIZE
2.4
AVG HOUSEHOLD SIZE
$38,173
PER CAPITA INCOME
$100,188
AVG FAMILY INCOME
$79,608
AVG HOUSEHOLD INCOME
42.3%
WAGE / INCOME GAP [ % ]
57.7¢/ $1
WAGE / INCOME GAP [ $ ]
0.39
INEQUALITY / GINI INDEX
4,944
LABOR FORCE [ PEOPLE ]
61.8%
PERCENT IN LABOR FORCE
1.5%
UNEMPLOYMENT RATE
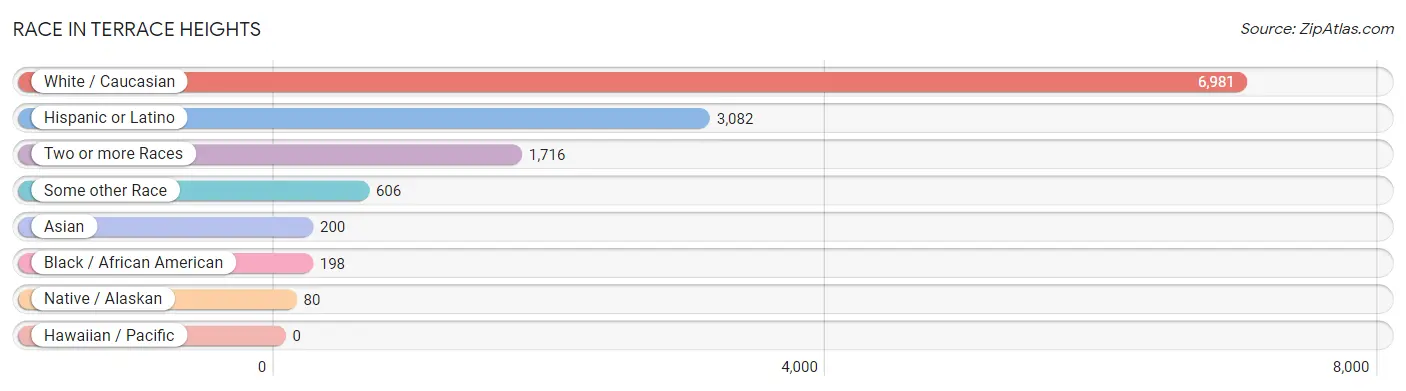
Race in Terrace Heights
The most populous races in Terrace Heights are White / Caucasian (6,981 | 71.4%), Hispanic or Latino (3,082 | 31.5%), and Two or more Races (1,716 | 17.5%).
| Race | # Population | % Population |
| Asian | 200 | 2.0% |
| Black / African American | 198 | 2.0% |
| Hawaiian / Pacific | 0 | 0.0% |
| Hispanic or Latino | 3,082 | 31.5% |
| Native / Alaskan | 80 | 0.8% |
| White / Caucasian | 6,981 | 71.4% |
| Two or more Races | 1,716 | 17.5% |
| Some other Race | 606 | 6.2% |
| Total | 9,781 | 100.0% |
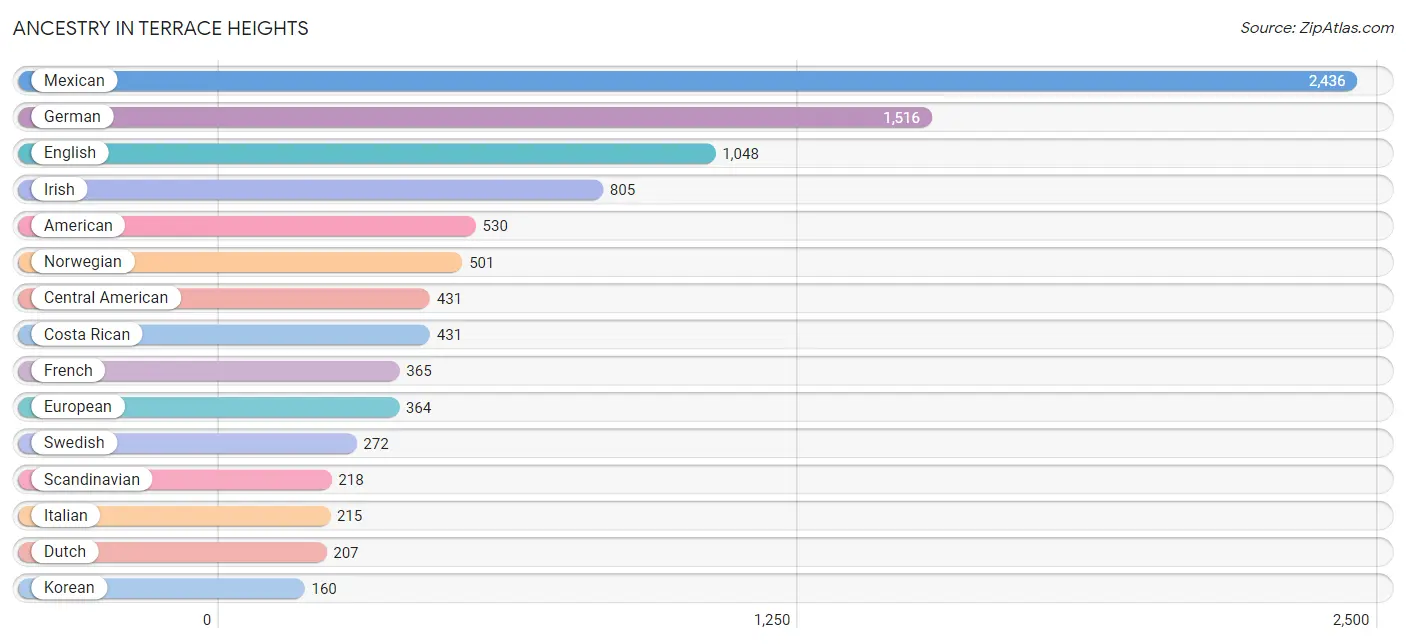
Ancestry in Terrace Heights
The most populous ancestries reported in Terrace Heights are Mexican (2,436 | 24.9%), German (1,516 | 15.5%), English (1,048 | 10.7%), Irish (805 | 8.2%), and American (530 | 5.4%), together accounting for 64.8% of all Terrace Heights residents.
| Ancestry | # Population | % Population |
| African | 13 | 0.1% |
| Albanian | 1 | 0.0% |
| American | 530 | 5.4% |
| Belgian | 14 | 0.1% |
| British | 83 | 0.9% |
| Burmese | 10 | 0.1% |
| Canadian | 32 | 0.3% |
| Central American | 431 | 4.4% |
| Cherokee | 51 | 0.5% |
| Costa Rican | 431 | 4.4% |
| Czech | 8 | 0.1% |
| Danish | 14 | 0.1% |
| Dominican | 116 | 1.2% |
| Dutch | 207 | 2.1% |
| English | 1,048 | 10.7% |
| European | 364 | 3.7% |
| Finnish | 25 | 0.3% |
| French | 365 | 3.7% |
| French American Indian | 1 | 0.0% |
| French Canadian | 70 | 0.7% |
| German | 1,516 | 15.5% |
| Indian (Asian) | 3 | 0.0% |
| Iranian | 29 | 0.3% |
| Irish | 805 | 8.2% |
| Italian | 215 | 2.2% |
| Jamaican | 56 | 0.6% |
| Korean | 160 | 1.6% |
| Latvian | 11 | 0.1% |
| Lithuanian | 12 | 0.1% |
| Luxembourger | 17 | 0.2% |
| Mexican | 2,436 | 24.9% |
| Native Hawaiian | 6 | 0.1% |
| Nigerian | 52 | 0.5% |
| Norwegian | 501 | 5.1% |
| Pennsylvania German | 19 | 0.2% |
| Polish | 110 | 1.1% |
| Portuguese | 13 | 0.1% |
| Puerto Rican | 45 | 0.5% |
| Russian | 21 | 0.2% |
| Scandinavian | 218 | 2.2% |
| Scotch-Irish | 115 | 1.2% |
| Scottish | 62 | 0.6% |
| Slovene | 7 | 0.1% |
| Spaniard | 29 | 0.3% |
| Sri Lankan | 38 | 0.4% |
| Subsaharan African | 65 | 0.7% |
| Swedish | 272 | 2.8% |
| Swiss | 25 | 0.3% |
| Ukrainian | 6 | 0.1% |
| Welsh | 61 | 0.6% |
| Yakama | 80 | 0.8% | View All 51 Rows |
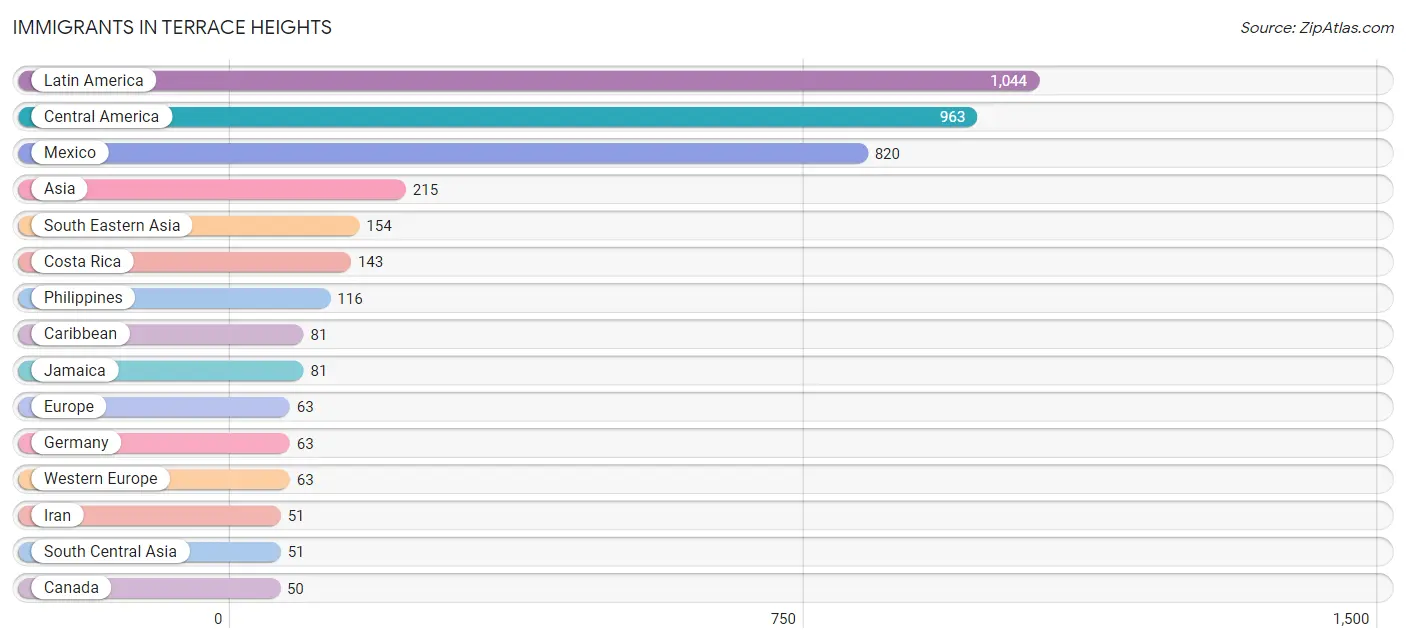
Immigrants in Terrace Heights
The most numerous immigrant groups reported in Terrace Heights came from Latin America (1,044 | 10.7%), Central America (963 | 9.9%), Mexico (820 | 8.4%), Asia (215 | 2.2%), and South Eastern Asia (154 | 1.6%), together accounting for 32.7% of all Terrace Heights residents.
| Immigration Origin | # Population | % Population |
| Africa | 1 | 0.0% |
| Asia | 215 | 2.2% |
| Canada | 50 | 0.5% |
| Caribbean | 81 | 0.8% |
| Central America | 963 | 9.9% |
| Costa Rica | 143 | 1.5% |
| Eastern Asia | 10 | 0.1% |
| Egypt | 1 | 0.0% |
| Europe | 63 | 0.6% |
| Germany | 63 | 0.6% |
| Iran | 51 | 0.5% |
| Jamaica | 81 | 0.8% |
| Korea | 10 | 0.1% |
| Latin America | 1,044 | 10.7% |
| Mexico | 820 | 8.4% |
| Northern Africa | 1 | 0.0% |
| Philippines | 116 | 1.2% |
| South Central Asia | 51 | 0.5% |
| South Eastern Asia | 154 | 1.6% |
| Vietnam | 38 | 0.4% |
| Western Europe | 63 | 0.6% | View All 21 Rows |
Sex and Age in Terrace Heights
Sex and Age in Terrace Heights
The most populous age groups in Terrace Heights are 25 to 29 Years (613 | 12.2%) for men and 60 to 64 Years (428 | 9.0%) for women.
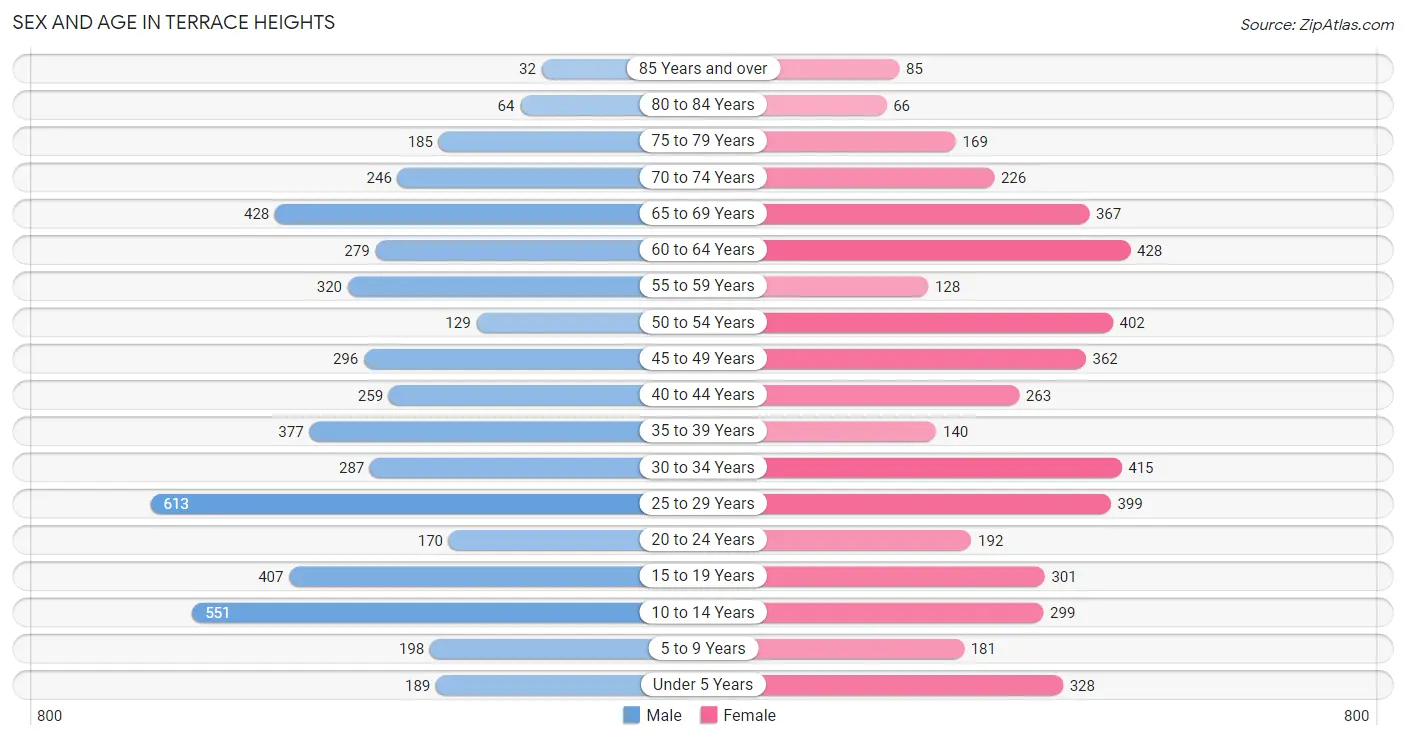
| Age Bracket | Male | Female |
| Under 5 Years | 189 (3.8%) | 328 (6.9%) |
| 5 to 9 Years | 198 (3.9%) | 181 (3.8%) |
| 10 to 14 Years | 551 (11.0%) | 299 (6.3%) |
| 15 to 19 Years | 407 (8.1%) | 301 (6.3%) |
| 20 to 24 Years | 170 (3.4%) | 192 (4.0%) |
| 25 to 29 Years | 613 (12.2%) | 399 (8.4%) |
| 30 to 34 Years | 287 (5.7%) | 415 (8.7%) |
| 35 to 39 Years | 377 (7.5%) | 140 (2.9%) |
| 40 to 44 Years | 259 (5.1%) | 263 (5.5%) |
| 45 to 49 Years | 296 (5.9%) | 362 (7.6%) |
| 50 to 54 Years | 129 (2.6%) | 402 (8.5%) |
| 55 to 59 Years | 320 (6.4%) | 128 (2.7%) |
| 60 to 64 Years | 279 (5.6%) | 428 (9.0%) |
| 65 to 69 Years | 428 (8.5%) | 367 (7.7%) |
| 70 to 74 Years | 246 (4.9%) | 226 (4.8%) |
| 75 to 79 Years | 185 (3.7%) | 169 (3.6%) |
| 80 to 84 Years | 64 (1.3%) | 66 (1.4%) |
| 85 Years and over | 32 (0.6%) | 85 (1.8%) |
| Total | 5,030 (100.0%) | 4,751 (100.0%) |
Families and Households in Terrace Heights
Median Family Size in Terrace Heights
The median family size in Terrace Heights is 2.97 persons per family, with single male/father families (44 | 1.7%) accounting for the largest median family size of 3 persons per family. On the other hand, married-couple families (2,247 | 84.5%) represent the smallest median family size with 2.97 persons per family.
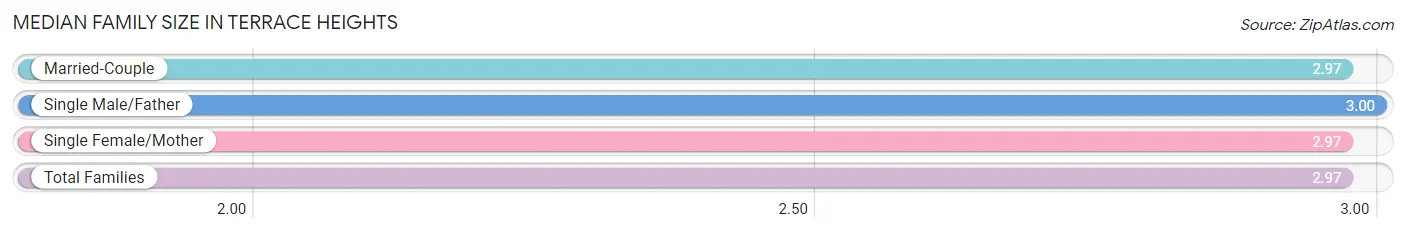
| Family Type | # Families | Family Size |
| Married-Couple | 2,247 (84.5%) | 2.97 |
| Single Male/Father | 44 (1.7%) | 3.00 |
| Single Female/Mother | 368 (13.8%) | 2.97 |
| Total Families | 2,659 (100.0%) | 2.97 |
Median Household Size in Terrace Heights
The median household size in Terrace Heights is 2.44 persons per household, with single male/father households (44 | 1.1%) accounting for the largest median household size of 3.61 persons per household. non-family households (1,345 | 33.6%) represent the smallest median household size with 1.21 persons per household.
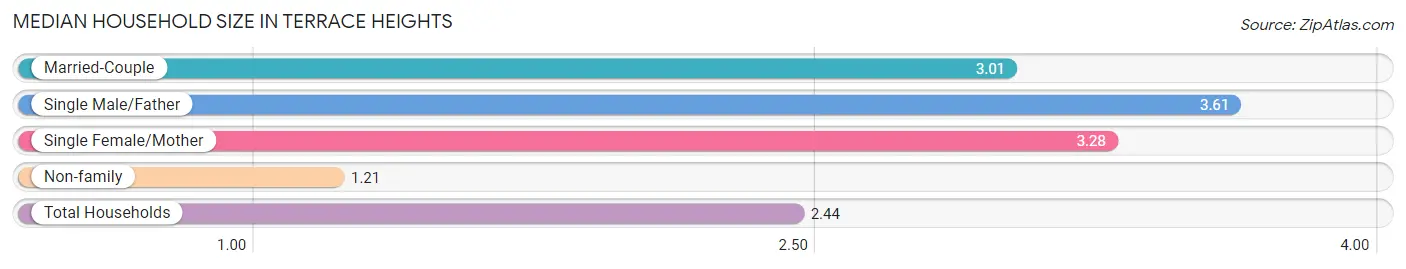
| Household Type | # Households | Household Size |
| Married-Couple | 2,247 (56.1%) | 3.01 |
| Single Male/Father | 44 (1.1%) | 3.61 |
| Single Female/Mother | 368 (9.2%) | 3.28 |
| Non-family | 1,345 (33.6%) | 1.21 |
| Total Households | 4,004 (100.0%) | 2.44 |
Household Size by Marriage Status in Terrace Heights
Out of a total of 4,004 households in Terrace Heights, 2,659 (66.4%) are family households, while 1,345 (33.6%) are nonfamily households. The most numerous type of family households are 2-person households, comprising 1,250, and the most common type of nonfamily households are 1-person households, comprising 1,120.
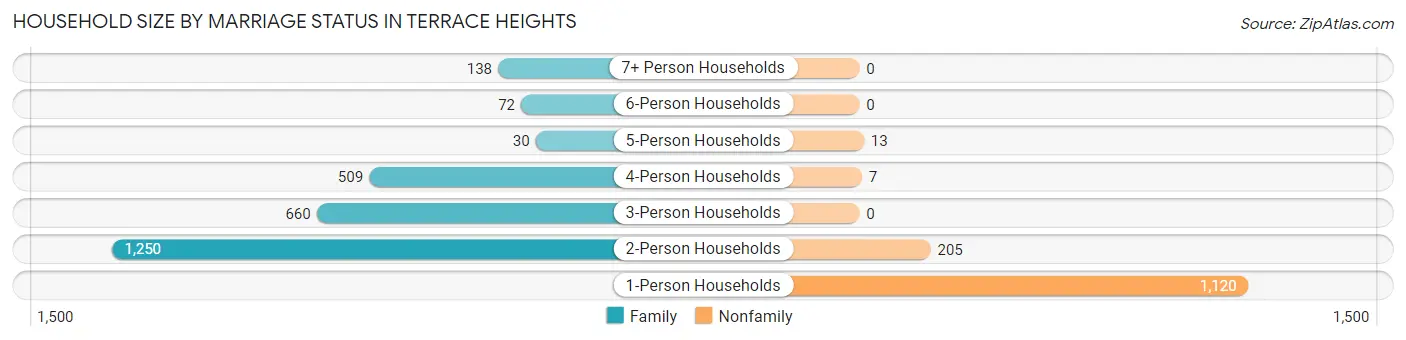
| Household Size | Family Households | Nonfamily Households |
| 1-Person Households | - | 1,120 (28.0%) |
| 2-Person Households | 1,250 (31.2%) | 205 (5.1%) |
| 3-Person Households | 660 (16.5%) | 0 (0.0%) |
| 4-Person Households | 509 (12.7%) | 7 (0.2%) |
| 5-Person Households | 30 (0.7%) | 13 (0.3%) |
| 6-Person Households | 72 (1.8%) | 0 (0.0%) |
| 7+ Person Households | 138 (3.5%) | 0 (0.0%) |
| Total | 2,659 (66.4%) | 1,345 (33.6%) |
Female Fertility in Terrace Heights
Fertility by Age in Terrace Heights
Average fertility rate in Terrace Heights is 56.0 births per 1,000 women. Women in the age bracket of 20 to 34 years have the highest fertility rate with 118.0 births per 1,000 women. Women in the age bracket of 20 to 34 years acount for 100.0% of all women with births.
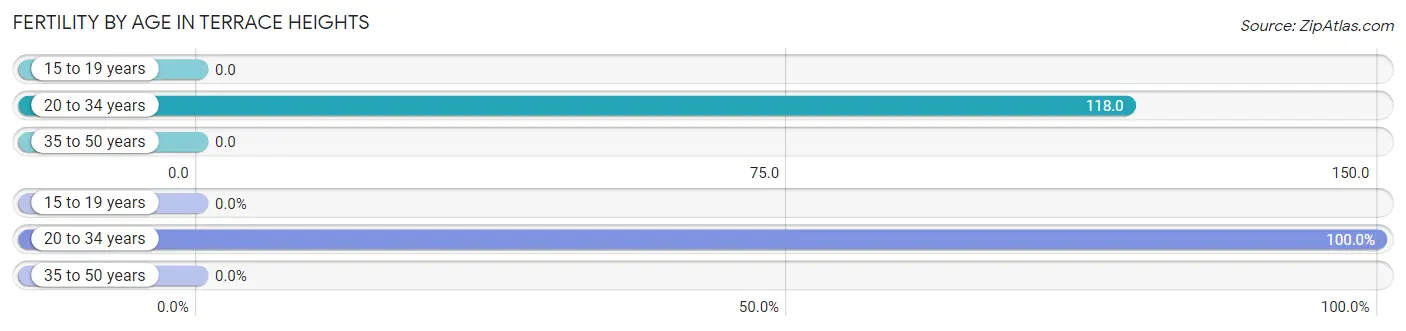
| Age Bracket | Women with Births | Births / 1,000 Women |
| 15 to 19 years | 0 (0.0%) | 0.0 |
| 20 to 34 years | 119 (100.0%) | 118.0 |
| 35 to 50 years | 0 (0.0%) | 0.0 |
| Total | 119 (100.0%) | 56.0 |
Fertility by Age by Marriage Status in Terrace Heights
76.5% of women with births (119) in Terrace Heights are married. The highest percentage of unmarried women with births falls into 20 to 34 years age bracket with 23.5% of them unmarried at the time of birth, while the lowest percentage of unmarried women with births belong to 20 to 34 years age bracket with 23.5% of them unmarried.
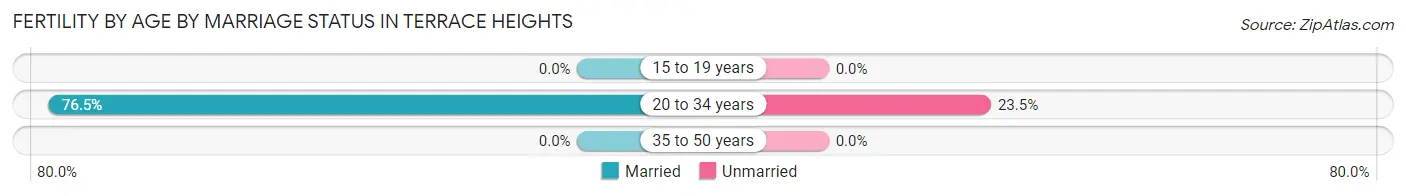
| Age Bracket | Married | Unmarried |
| 15 to 19 years | 0 (0.0%) | 0 (0.0%) |
| 20 to 34 years | 91 (76.5%) | 28 (23.5%) |
| 35 to 50 years | 0 (0.0%) | 0 (0.0%) |
| Total | 91 (76.5%) | 28 (23.5%) |
Fertility by Education in Terrace Heights
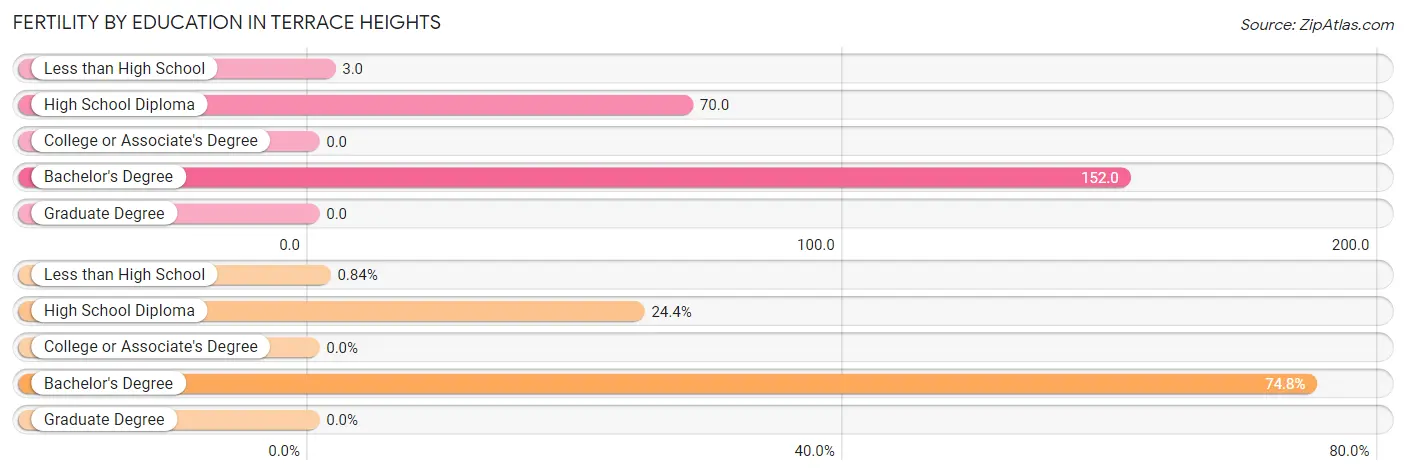
| Educational Attainment | Women with Births | Births / 1,000 Women |
| Less than High School | 1 (0.8%) | 3.0 |
| High School Diploma | 29 (24.4%) | 70.0 |
| College or Associate's Degree | 0 (0.0%) | 0.0 |
| Bachelor's Degree | 89 (74.8%) | 152.0 |
| Graduate Degree | 0 (0.0%) | 0.0 |
| Total | 119 (100.0%) | 56.0 |
Fertility by Education by Marriage Status in Terrace Heights
23.5% of women with births in Terrace Heights are unmarried. Women with the educational attainment of bachelor's degree are most likely to be married with 100.0% of them married at childbirth, while women with the educational attainment of less than high school are least likely to be married with 100.0% of them unmarried at childbirth.
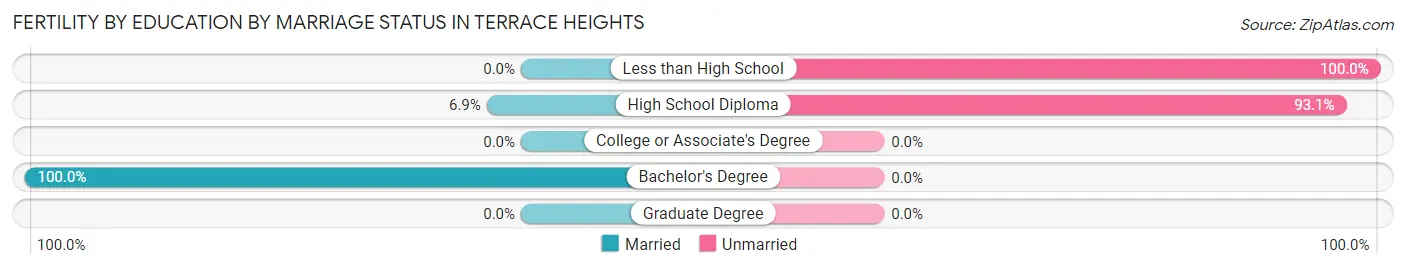
| Educational Attainment | Married | Unmarried |
| Less than High School | 0 (0.0%) | 1 (100.0%) |
| High School Diploma | 2 (6.9%) | 27 (93.1%) |
| College or Associate's Degree | 0 (0.0%) | 0 (0.0%) |
| Bachelor's Degree | 89 (100.0%) | 0 (0.0%) |
| Graduate Degree | 0 (0.0%) | 0 (0.0%) |
| Total | 91 (76.5%) | 28 (23.5%) |
Income in Terrace Heights
Income Overview in Terrace Heights
Per Capita Income in Terrace Heights is $38,173, while median incomes of families and households are $100,188 and $79,608 respectively.
| Characteristic | Number | Measure |
| Per Capita Income | 9,781 | $38,173 |
| Median Family Income | 2,659 | $100,188 |
| Mean Family Income | 2,659 | $114,744 |
| Median Household Income | 4,004 | $79,608 |
| Mean Household Income | 4,004 | $93,717 |
| Income Deficit | 2,659 | $0 |
| Wage / Income Gap (%) | 9,781 | 42.34% |
| Wage / Income Gap ($) | 9,781 | 57.66¢ per $1 |
| Gini / Inequality Index | 9,781 | 0.39 |
Earnings by Sex in Terrace Heights
Average Earnings in Terrace Heights are $42,098, $53,690 for men and $30,958 for women, a difference of 42.3%.
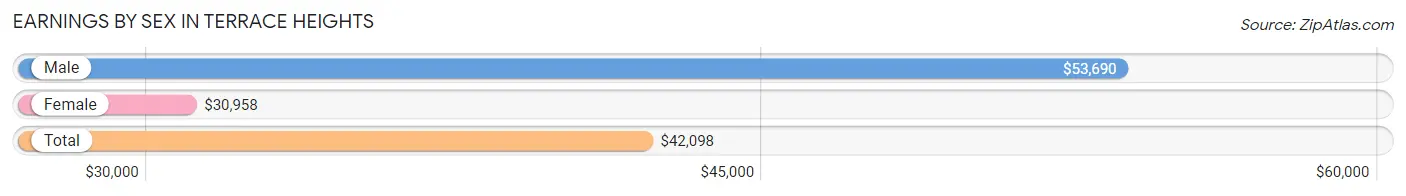
| Sex | Number | Average Earnings |
| Male | 2,605 (49.6%) | $53,690 |
| Female | 2,647 (50.4%) | $30,958 |
| Total | 5,252 (100.0%) | $42,098 |
Earnings by Sex by Income Bracket in Terrace Heights
The most common earnings brackets in Terrace Heights are $75,000 to $99,999 for men (467 | 17.9%) and $75,000 to $99,999 for women (361 | 13.6%).
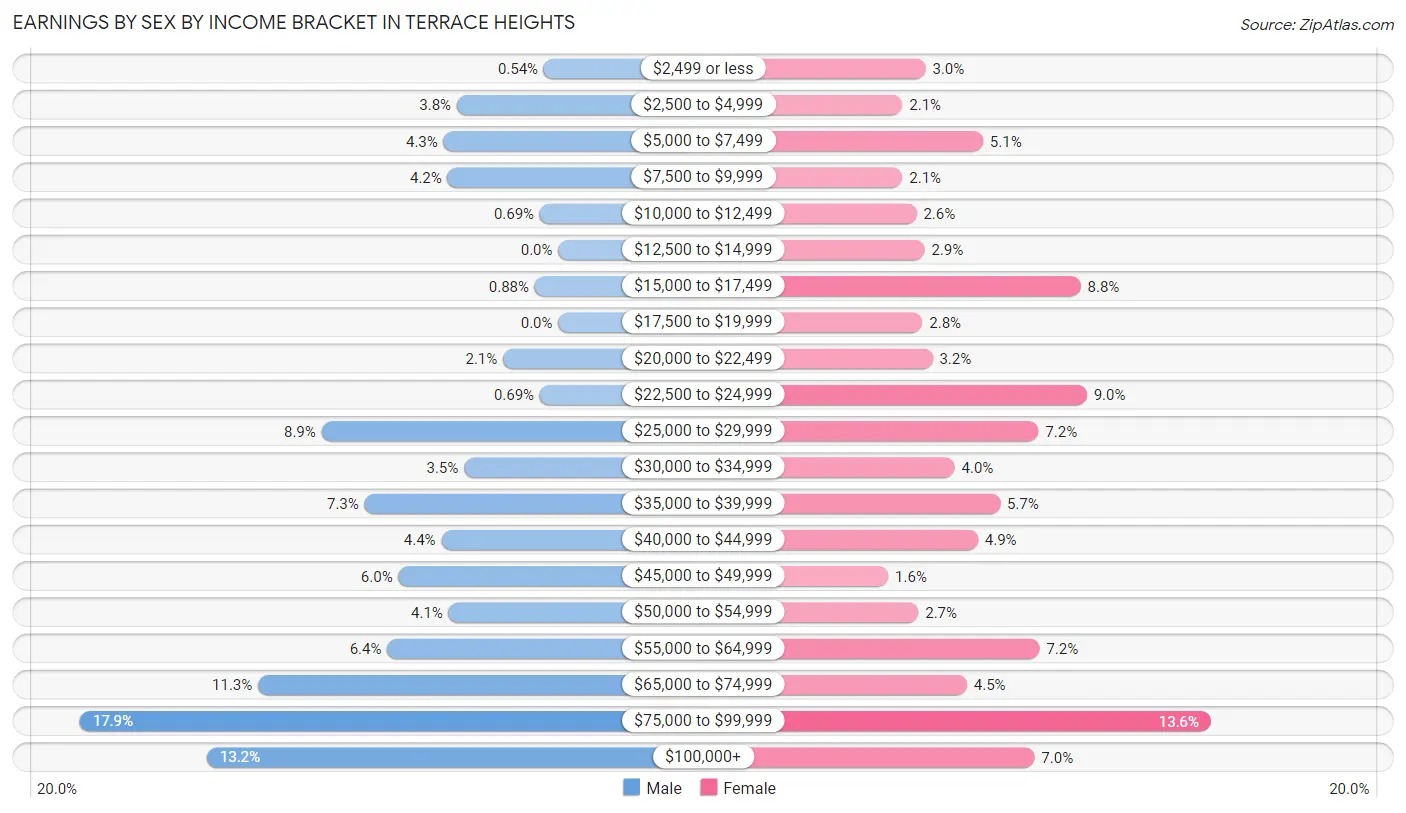
| Income | Male | Female |
| $2,499 or less | 14 (0.5%) | 78 (2.9%) |
| $2,500 to $4,999 | 99 (3.8%) | 55 (2.1%) |
| $5,000 to $7,499 | 112 (4.3%) | 135 (5.1%) |
| $7,500 to $9,999 | 108 (4.2%) | 55 (2.1%) |
| $10,000 to $12,499 | 18 (0.7%) | 69 (2.6%) |
| $12,500 to $14,999 | 0 (0.0%) | 77 (2.9%) |
| $15,000 to $17,499 | 23 (0.9%) | 232 (8.8%) |
| $17,500 to $19,999 | 0 (0.0%) | 75 (2.8%) |
| $20,000 to $22,499 | 54 (2.1%) | 85 (3.2%) |
| $22,500 to $24,999 | 18 (0.7%) | 238 (9.0%) |
| $25,000 to $29,999 | 231 (8.9%) | 190 (7.2%) |
| $30,000 to $34,999 | 92 (3.5%) | 107 (4.0%) |
| $35,000 to $39,999 | 189 (7.3%) | 152 (5.7%) |
| $40,000 to $44,999 | 114 (4.4%) | 130 (4.9%) |
| $45,000 to $49,999 | 156 (6.0%) | 41 (1.5%) |
| $50,000 to $54,999 | 107 (4.1%) | 71 (2.7%) |
| $55,000 to $64,999 | 167 (6.4%) | 191 (7.2%) |
| $65,000 to $74,999 | 293 (11.3%) | 119 (4.5%) |
| $75,000 to $99,999 | 467 (17.9%) | 361 (13.6%) |
| $100,000+ | 343 (13.2%) | 186 (7.0%) |
| Total | 2,605 (100.0%) | 2,647 (100.0%) |
Earnings by Sex by Educational Attainment in Terrace Heights
Average earnings in Terrace Heights are $56,429 for men and $35,806 for women, a difference of 36.5%. Men with an educational attainment of graduate degree enjoy the highest average annual earnings of $130,446, while those with less than high school education earn the least with $43,571. Women with an educational attainment of graduate degree earn the most with the average annual earnings of $73,125, while those with college or associate's degree education have the smallest earnings of $17,221.
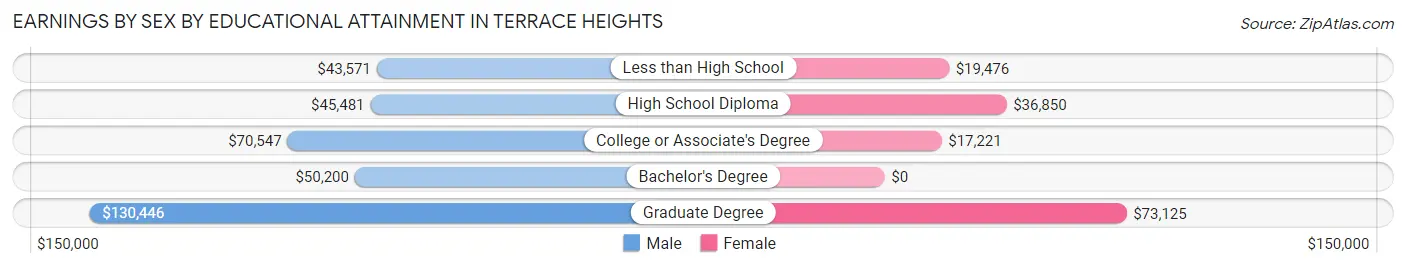
| Educational Attainment | Male Income | Female Income |
| Less than High School | $43,571 | $19,476 |
| High School Diploma | $45,481 | $36,850 |
| College or Associate's Degree | $70,547 | $17,221 |
| Bachelor's Degree | $50,200 | $0 |
| Graduate Degree | $130,446 | $73,125 |
| Total | $56,429 | $35,806 |
Family Income in Terrace Heights
Family Income Brackets in Terrace Heights
According to the Terrace Heights family income data, there are 766 families falling into the $100,000 to $149,999 income range, which is the most common income bracket and makes up 28.8% of all families.
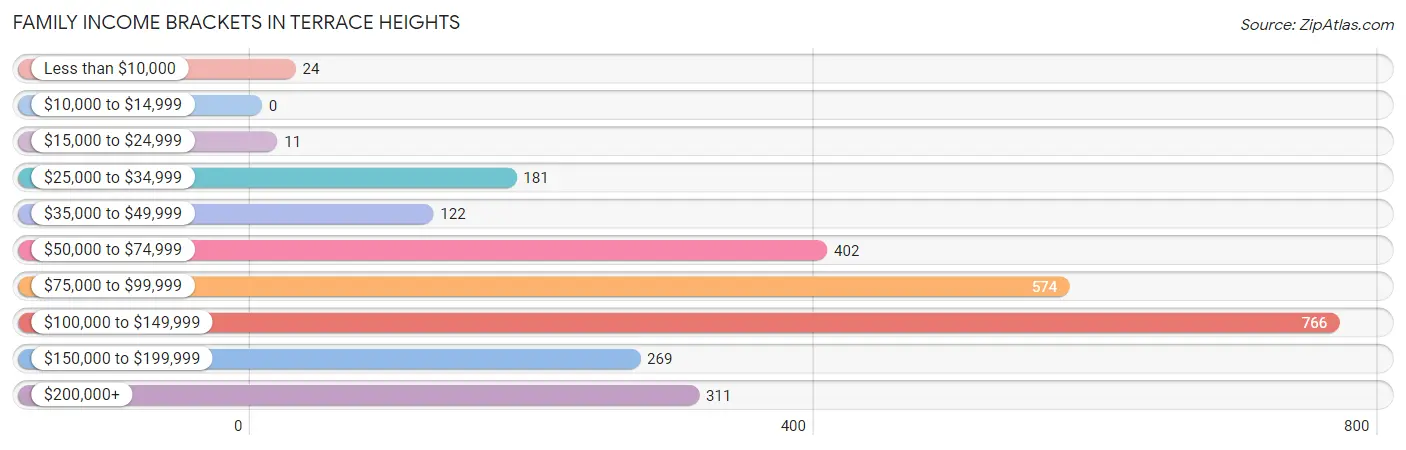
| Income Bracket | # Families | % Families |
| Less than $10,000 | 24 | 0.9% |
| $10,000 to $14,999 | 0 | 0.0% |
| $15,000 to $24,999 | 11 | 0.4% |
| $25,000 to $34,999 | 181 | 6.8% |
| $35,000 to $49,999 | 122 | 4.6% |
| $50,000 to $74,999 | 402 | 15.1% |
| $75,000 to $99,999 | 574 | 21.6% |
| $100,000 to $149,999 | 766 | 28.8% |
| $150,000 to $199,999 | 269 | 10.1% |
| $200,000+ | 311 | 11.7% |
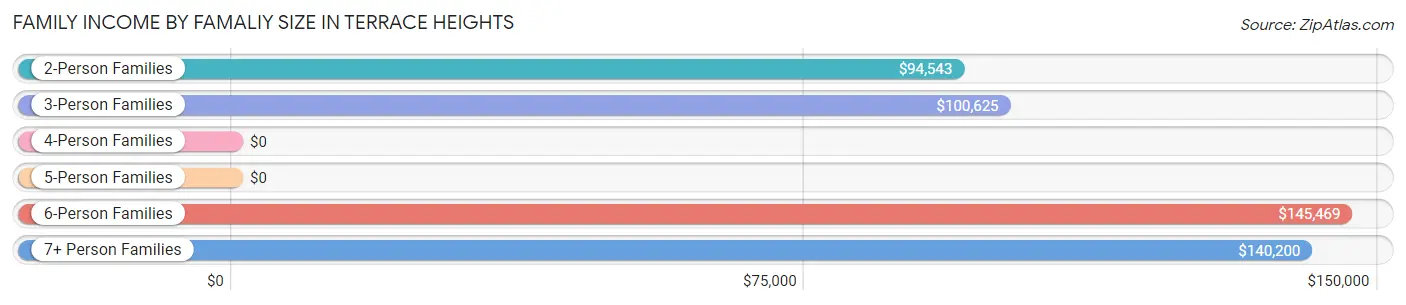
Family Income by Famaliy Size in Terrace Heights
6-person families (72 | 2.7%) account for the highest median family income in Terrace Heights with $145,469 per family, while 2-person families (1,377 | 51.8%) have the highest median income of $47,272 per family member.
| Income Bracket | # Families | Median Income |
| 2-Person Families | 1,377 (51.8%) | $94,543 |
| 3-Person Families | 655 (24.6%) | $100,625 |
| 4-Person Families | 406 (15.3%) | $0 |
| 5-Person Families | 11 (0.4%) | $0 |
| 6-Person Families | 72 (2.7%) | $145,469 |
| 7+ Person Families | 138 (5.2%) | $140,200 |
| Total | 2,659 (100.0%) | $100,188 |
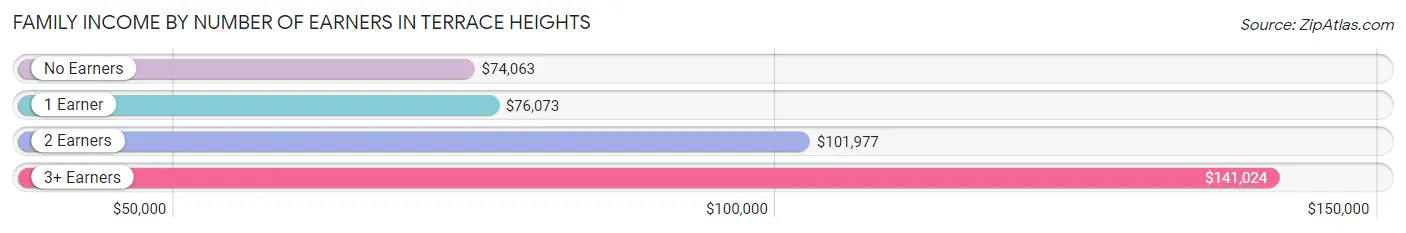
Family Income by Number of Earners in Terrace Heights
The median family income in Terrace Heights is $100,188, with families comprising 3+ earners (305) having the highest median family income of $141,024, while families with no earners (337) have the lowest median family income of $74,063, accounting for 11.5% and 12.7% of families, respectively.
| Number of Earners | # Families | Median Income |
| No Earners | 337 (12.7%) | $74,063 |
| 1 Earner | 767 (28.8%) | $76,073 |
| 2 Earners | 1,250 (47.0%) | $101,977 |
| 3+ Earners | 305 (11.5%) | $141,024 |
| Total | 2,659 (100.0%) | $100,188 |
Household Income in Terrace Heights
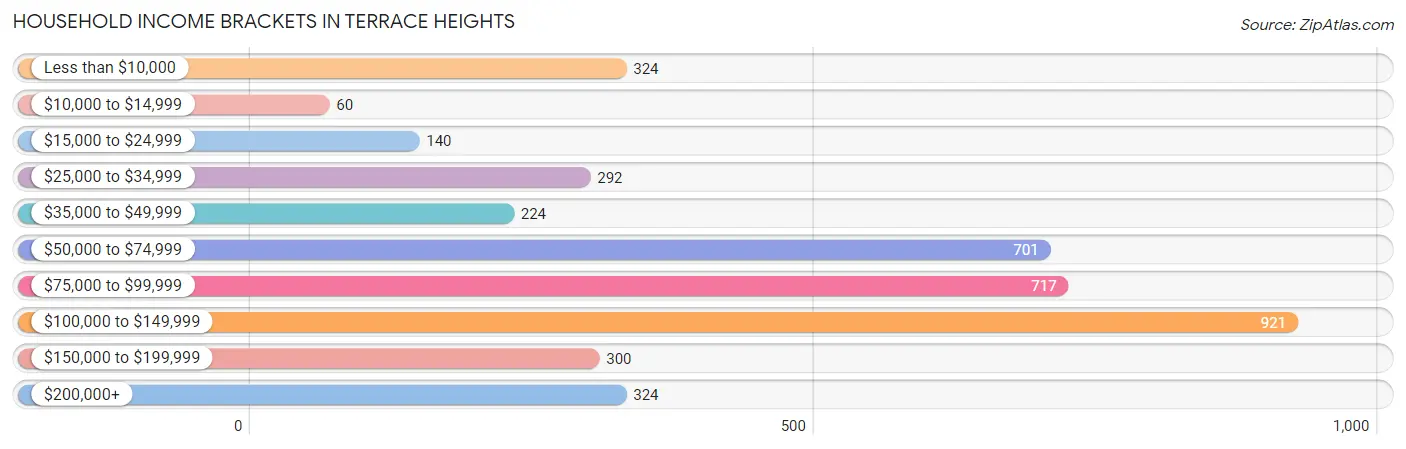
Household Income Brackets in Terrace Heights
With 921 households falling in the category, the $100,000 to $149,999 income range is the most frequent in Terrace Heights, accounting for 23.0% of all households. In contrast, only 60 households (1.5%) fall into the $10,000 to $14,999 income bracket, making it the least populous group.
| Income Bracket | # Households | % Households |
| Less than $10,000 | 324 | 8.1% |
| $10,000 to $14,999 | 60 | 1.5% |
| $15,000 to $24,999 | 140 | 3.5% |
| $25,000 to $34,999 | 292 | 7.3% |
| $35,000 to $49,999 | 224 | 5.6% |
| $50,000 to $74,999 | 701 | 17.5% |
| $75,000 to $99,999 | 717 | 17.9% |
| $100,000 to $149,999 | 921 | 23.0% |
| $150,000 to $199,999 | 300 | 7.5% |
| $200,000+ | 324 | 8.1% |
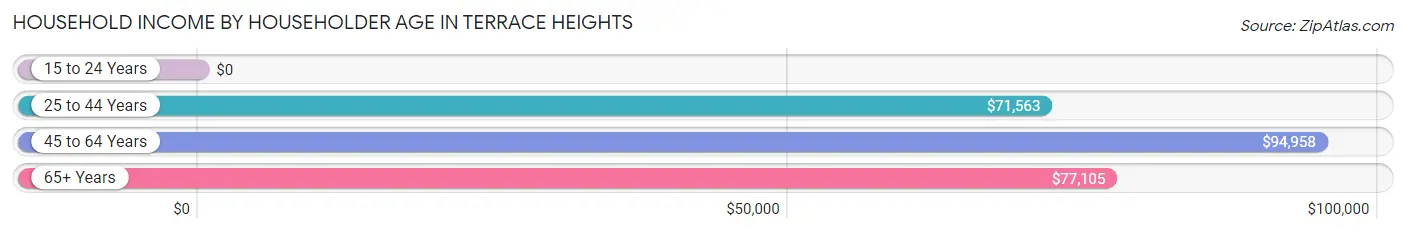
Household Income by Householder Age in Terrace Heights
The median household income in Terrace Heights is $79,608, with the highest median household income of $94,958 found in the 45 to 64 years age bracket for the primary householder. A total of 1,295 households (32.3%) fall into this category. Meanwhile, the 15 to 24 years age bracket for the primary householder has the lowest median household income of $0, with 96 households (2.4%) in this group.
| Income Bracket | # Households | Median Income |
| 15 to 24 Years | 96 (2.4%) | $0 |
| 25 to 44 Years | 1,504 (37.6%) | $71,563 |
| 45 to 64 Years | 1,295 (32.3%) | $94,958 |
| 65+ Years | 1,109 (27.7%) | $77,105 |
| Total | 4,004 (100.0%) | $79,608 |
Poverty in Terrace Heights
Income Below Poverty by Sex and Age in Terrace Heights
With 7.0% poverty level for males and 5.8% for females among the residents of Terrace Heights, 25 to 34 year old males and 18 to 24 year old females are the most vulnerable to poverty, with 264 males (29.3%) and 79 females (28.9%) in their respective age groups living below the poverty level.
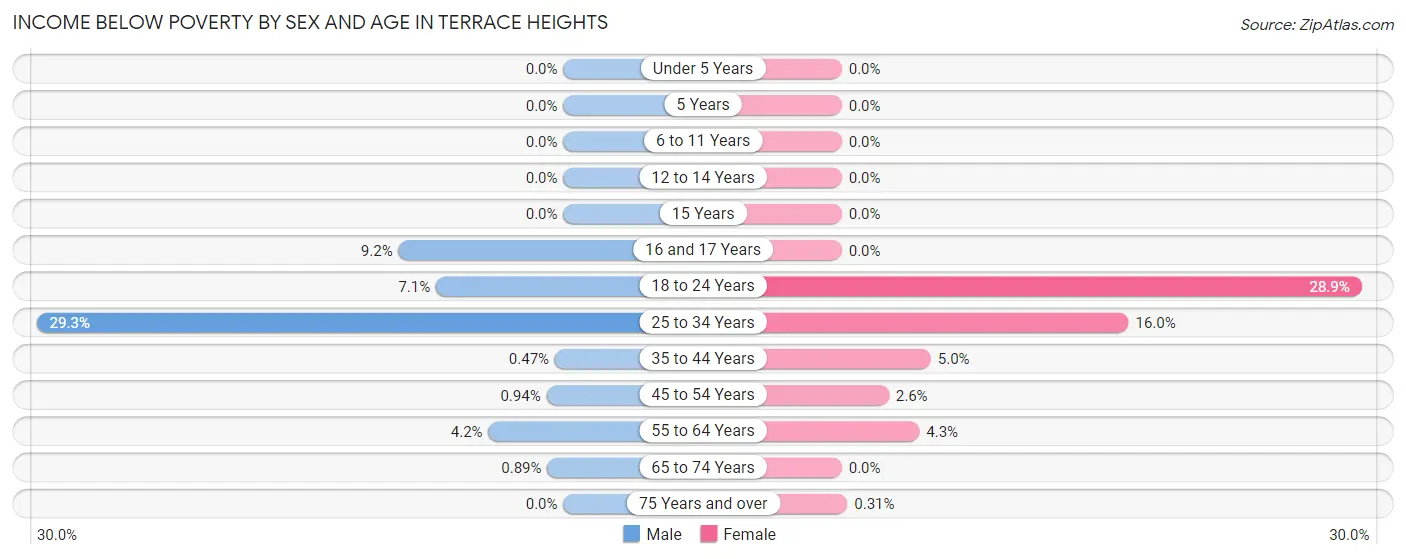
| Age Bracket | Male | Female |
| Under 5 Years | 0 (0.0%) | 0 (0.0%) |
| 5 Years | 0 (0.0%) | 0 (0.0%) |
| 6 to 11 Years | 0 (0.0%) | 0 (0.0%) |
| 12 to 14 Years | 0 (0.0%) | 0 (0.0%) |
| 15 Years | 0 (0.0%) | 0 (0.0%) |
| 16 and 17 Years | 18 (9.2%) | 0 (0.0%) |
| 18 to 24 Years | 27 (7.1%) | 79 (28.9%) |
| 25 to 34 Years | 264 (29.3%) | 130 (16.0%) |
| 35 to 44 Years | 3 (0.5%) | 20 (5.0%) |
| 45 to 54 Years | 4 (0.9%) | 20 (2.6%) |
| 55 to 64 Years | 25 (4.2%) | 24 (4.3%) |
| 65 to 74 Years | 6 (0.9%) | 0 (0.0%) |
| 75 Years and over | 0 (0.0%) | 1 (0.3%) |
| Total | 347 (7.0%) | 274 (5.8%) |
Income Above Poverty by Sex and Age in Terrace Heights
According to the poverty statistics in Terrace Heights, males aged under 5 years and females aged under 5 years are the age groups that are most secure financially, with 100.0% of males and 100.0% of females in these age groups living above the poverty line.
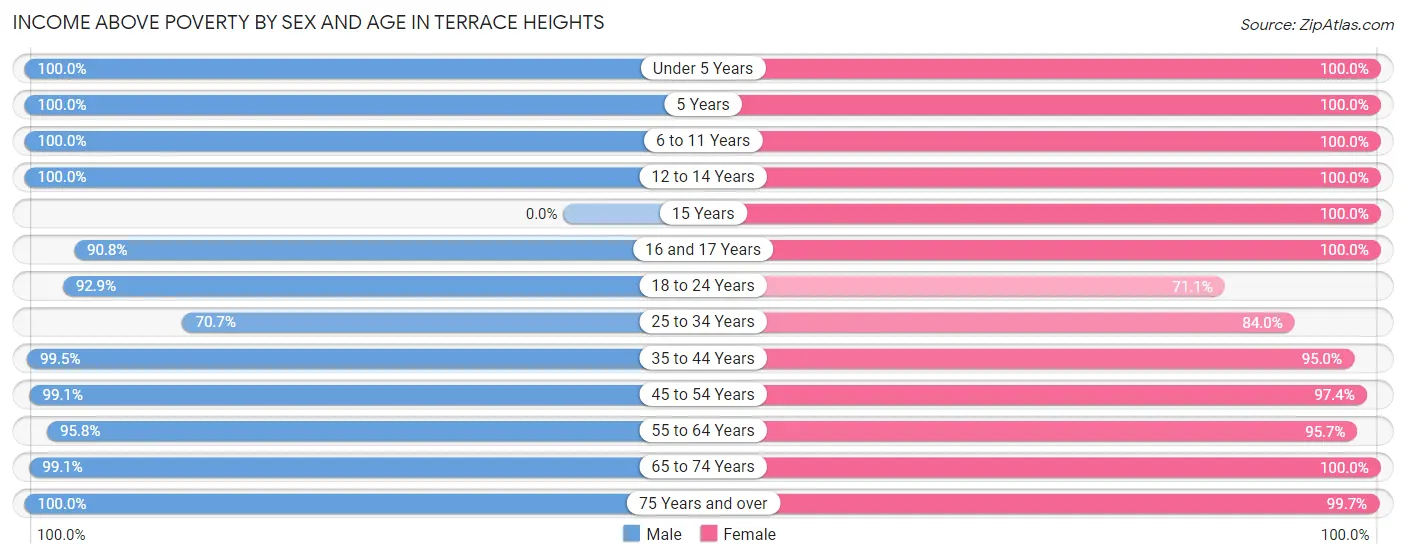
| Age Bracket | Male | Female |
| Under 5 Years | 189 (100.0%) | 328 (100.0%) |
| 5 Years | 35 (100.0%) | 44 (100.0%) |
| 6 to 11 Years | 315 (100.0%) | 306 (100.0%) |
| 12 to 14 Years | 320 (100.0%) | 130 (100.0%) |
| 15 Years | 0 (0.0%) | 35 (100.0%) |
| 16 and 17 Years | 178 (90.8%) | 185 (100.0%) |
| 18 to 24 Years | 354 (92.9%) | 194 (71.1%) |
| 25 to 34 Years | 636 (70.7%) | 684 (84.0%) |
| 35 to 44 Years | 633 (99.5%) | 383 (95.0%) |
| 45 to 54 Years | 421 (99.1%) | 744 (97.4%) |
| 55 to 64 Years | 574 (95.8%) | 532 (95.7%) |
| 65 to 74 Years | 668 (99.1%) | 593 (100.0%) |
| 75 Years and over | 281 (100.0%) | 319 (99.7%) |
| Total | 4,604 (93.0%) | 4,477 (94.2%) |
Income Below Poverty Among Married-Couple Families in Terrace Heights
The poverty statistics for married-couple families in Terrace Heights show that 1.1% or 25 of the total 2,247 families live below the poverty line. Families with no children have the highest poverty rate of 1.8%, comprising of 25 families. On the other hand, families with 1 or 2 children have the lowest poverty rate of 0.0%, which includes 0 families.
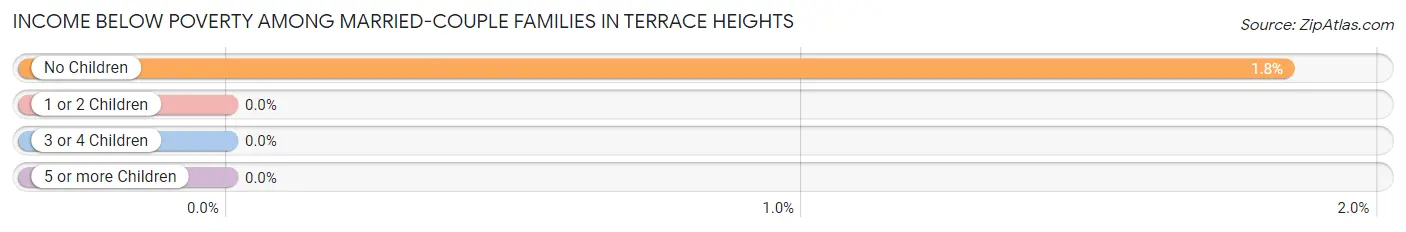
| Children | Above Poverty | Below Poverty |
| No Children | 1,336 (98.2%) | 25 (1.8%) |
| 1 or 2 Children | 834 (100.0%) | 0 (0.0%) |
| 3 or 4 Children | 52 (100.0%) | 0 (0.0%) |
| 5 or more Children | 0 (0.0%) | 0 (0.0%) |
| Total | 2,222 (98.9%) | 25 (1.1%) |
Income Below Poverty Among Single-Parent Households in Terrace Heights
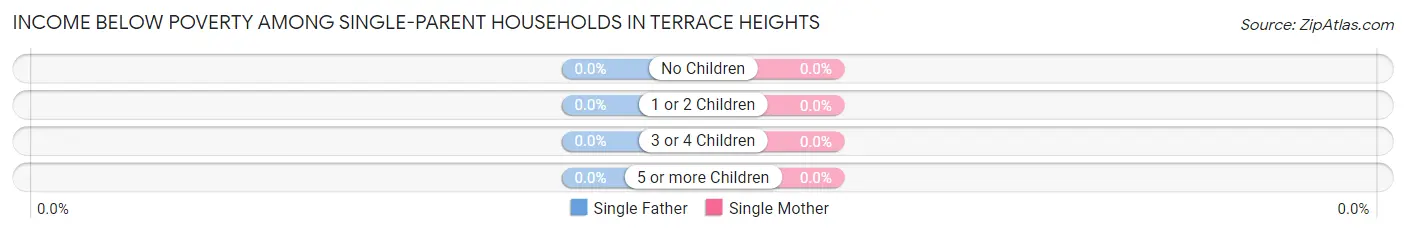
| Children | Single Father | Single Mother |
| No Children | 0 (0.0%) | 0 (0.0%) |
| 1 or 2 Children | 0 (0.0%) | 0 (0.0%) |
| 3 or 4 Children | 0 (0.0%) | 0 (0.0%) |
| 5 or more Children | 0 (0.0%) | 0 (0.0%) |
| Total | 0 (0.0%) | 0 (0.0%) |
Income Below Poverty Among Married-Couple vs Single-Parent Households in Terrace Heights
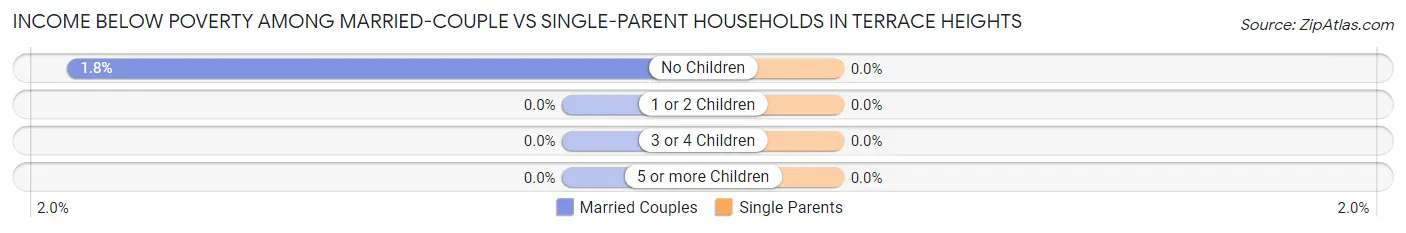
| Children | Married-Couple Families | Single-Parent Households |
| No Children | 25 (1.8%) | 0 (0.0%) |
| 1 or 2 Children | 0 (0.0%) | 0 (0.0%) |
| 3 or 4 Children | 0 (0.0%) | 0 (0.0%) |
| 5 or more Children | 0 (0.0%) | 0 (0.0%) |
| Total | 25 (1.1%) | 0 (0.0%) |
Employment Characteristics in Terrace Heights
Employment by Class of Employer in Terrace Heights
Among the 4,704 employed individuals in Terrace Heights, private company employees (2,591 | 55.1%), not-for-profit organizations (599 | 12.7%), and local government employees (585 | 12.4%) make up the most common classes of employment.
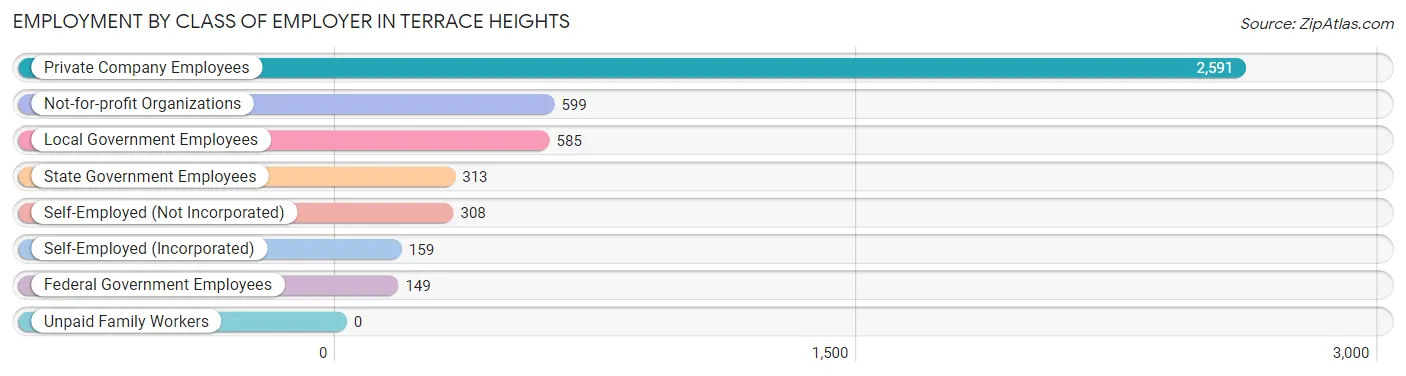
| Employer Class | # Employees | % Employees |
| Private Company Employees | 2,591 | 55.1% |
| Self-Employed (Incorporated) | 159 | 3.4% |
| Self-Employed (Not Incorporated) | 308 | 6.6% |
| Not-for-profit Organizations | 599 | 12.7% |
| Local Government Employees | 585 | 12.4% |
| State Government Employees | 313 | 6.7% |
| Federal Government Employees | 149 | 3.2% |
| Unpaid Family Workers | 0 | 0.0% |
| Total | 4,704 | 100.0% |
Employment Status by Age in Terrace Heights
According to the labor force statistics for Terrace Heights, out of the total population over 16 years of age (8,000), 61.8% or 4,944 individuals are in the labor force, with 1.5% or 74 of them unemployed. The age group with the highest labor force participation rate is 35 to 44 years, with 90.8% or 943 individuals in the labor force. Within the labor force, the 20 to 24 years age range has the highest percentage of unemployed individuals, with 11.5% or 30 of them being unemployed.
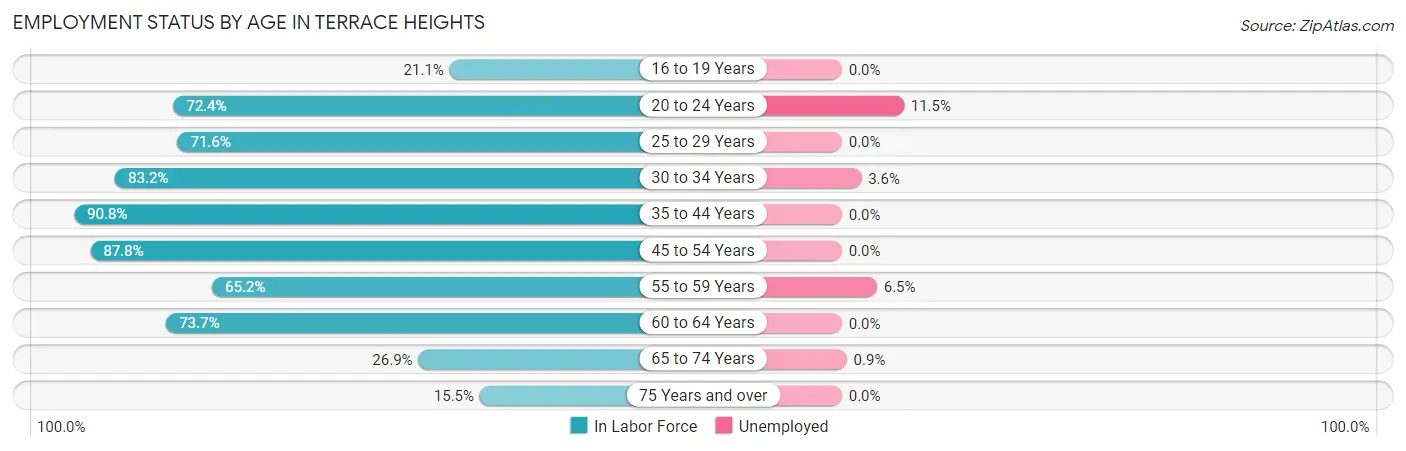
| Age Bracket | In Labor Force | Unemployed |
| 16 to 19 Years | 142 (21.1%) | 0 (0.0%) |
| 20 to 24 Years | 262 (72.4%) | 30 (11.5%) |
| 25 to 29 Years | 725 (71.6%) | 0 (0.0%) |
| 30 to 34 Years | 584 (83.2%) | 21 (3.6%) |
| 35 to 44 Years | 943 (90.8%) | 0 (0.0%) |
| 45 to 54 Years | 1,044 (87.8%) | 0 (0.0%) |
| 55 to 59 Years | 292 (65.2%) | 19 (6.5%) |
| 60 to 64 Years | 521 (73.7%) | 0 (0.0%) |
| 65 to 74 Years | 341 (26.9%) | 3 (0.9%) |
| 75 Years and over | 93 (15.5%) | 0 (0.0%) |
| Total | 4,944 (61.8%) | 74 (1.5%) |
Employment Status by Educational Attainment in Terrace Heights
According to labor force statistics for Terrace Heights, 80.6% of individuals (4,108) out of the total population between 25 and 64 years of age (5,097) are in the labor force, with 1.0% or 41 of them being unemployed. The group with the highest labor force participation rate are those with the educational attainment of college / associate degree, with 84.9% or 1,245 individuals in the labor force. Within the labor force, individuals with college / associate degree education have the highest percentage of unemployment, with 3.2% or 40 of them being unemployed.
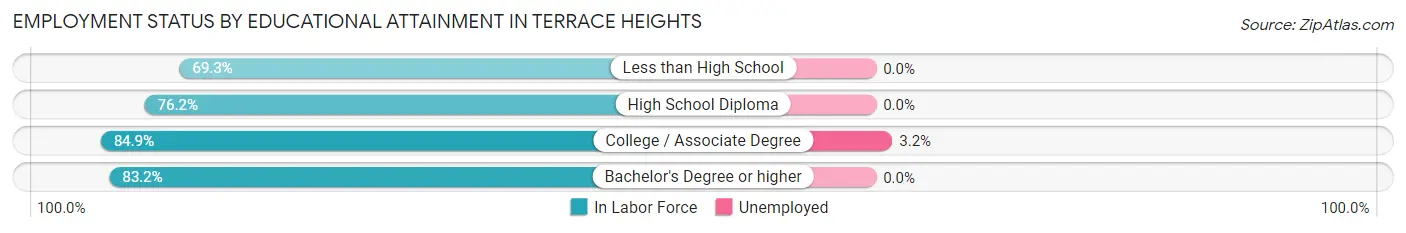
| Educational Attainment | In Labor Force | Unemployed |
| Less than High School | 321 (69.3%) | 0 (0.0%) |
| High School Diploma | 1,005 (76.2%) | 0 (0.0%) |
| College / Associate Degree | 1,245 (84.9%) | 47 (3.2%) |
| Bachelor's Degree or higher | 1,538 (83.2%) | 0 (0.0%) |
| Total | 4,108 (80.6%) | 51 (1.0%) |
Employment Occupations by Sex in Terrace Heights
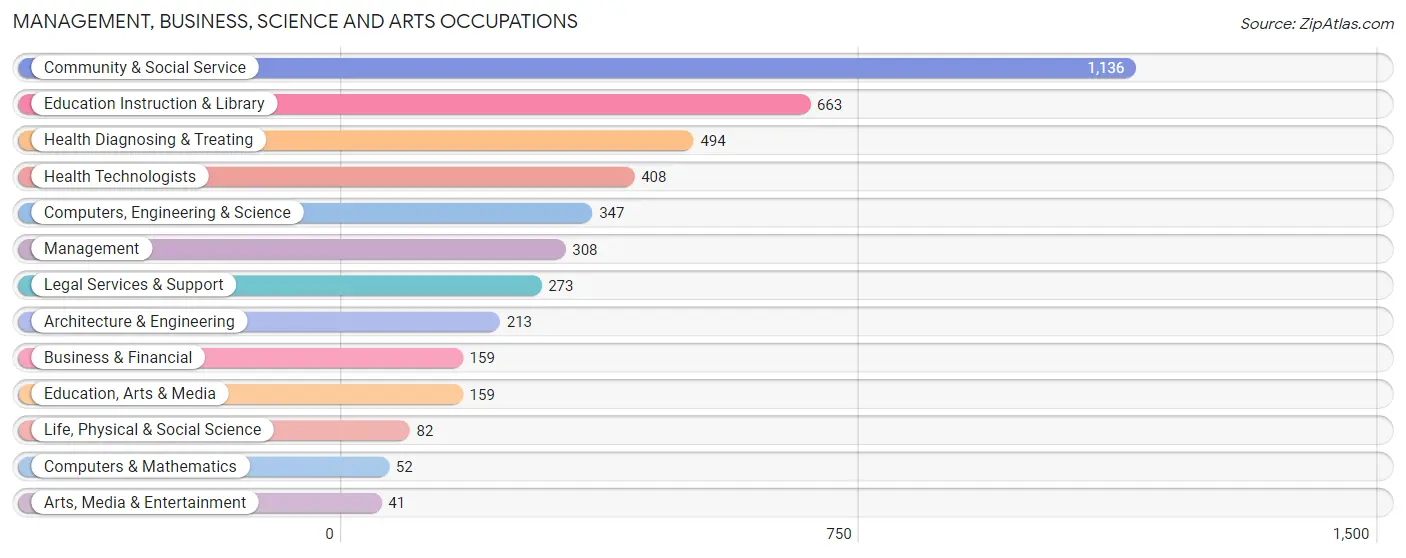
Management, Business, Science and Arts Occupations
The most common Management, Business, Science and Arts occupations in Terrace Heights are Community & Social Service (1,136 | 23.4%), Education Instruction & Library (663 | 13.6%), Health Diagnosing & Treating (494 | 10.2%), Health Technologists (408 | 8.4%), and Computers, Engineering & Science (347 | 7.1%).
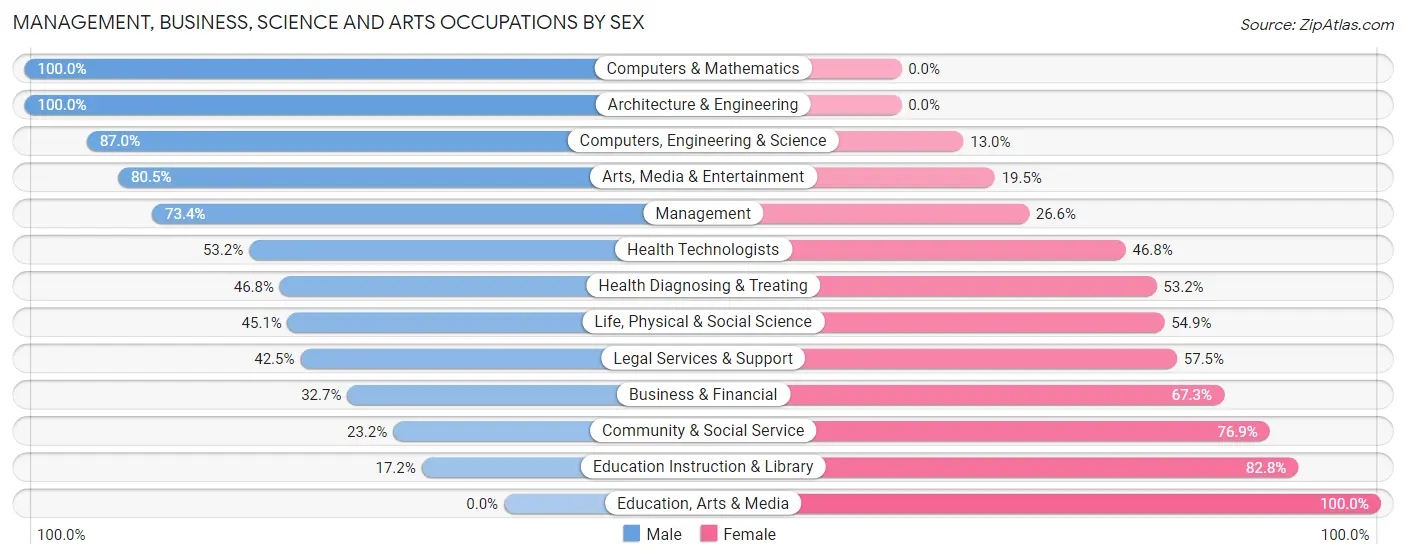
Management, Business, Science and Arts Occupations by Sex
Within the Management, Business, Science and Arts occupations in Terrace Heights, the most male-oriented occupations are Computers & Mathematics (100.0%), Architecture & Engineering (100.0%), and Computers, Engineering & Science (87.0%), while the most female-oriented occupations are Education, Arts & Media (100.0%), Education Instruction & Library (82.8%), and Community & Social Service (76.8%).
| Occupation | Male | Female |
| Management | 226 (73.4%) | 82 (26.6%) |
| Business & Financial | 52 (32.7%) | 107 (67.3%) |
| Computers, Engineering & Science | 302 (87.0%) | 45 (13.0%) |
| Computers & Mathematics | 52 (100.0%) | 0 (0.0%) |
| Architecture & Engineering | 213 (100.0%) | 0 (0.0%) |
| Life, Physical & Social Science | 37 (45.1%) | 45 (54.9%) |
| Community & Social Service | 263 (23.2%) | 873 (76.8%) |
| Education, Arts & Media | 0 (0.0%) | 159 (100.0%) |
| Legal Services & Support | 116 (42.5%) | 157 (57.5%) |
| Education Instruction & Library | 114 (17.2%) | 549 (82.8%) |
| Arts, Media & Entertainment | 33 (80.5%) | 8 (19.5%) |
| Health Diagnosing & Treating | 231 (46.8%) | 263 (53.2%) |
| Health Technologists | 217 (53.2%) | 191 (46.8%) |
| Total (Category) | 1,074 (43.9%) | 1,370 (56.1%) |
| Total (Overall) | 2,380 (48.9%) | 2,482 (51.0%) |
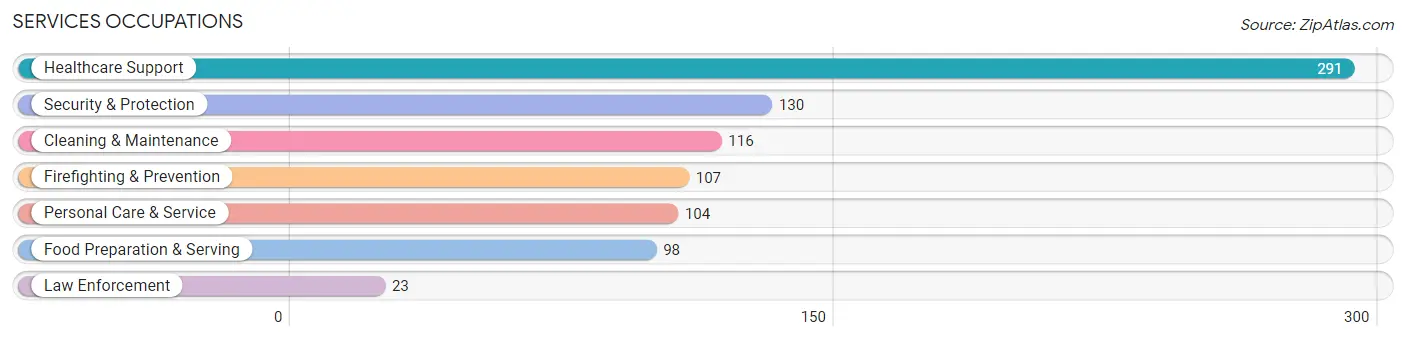
Services Occupations
The most common Services occupations in Terrace Heights are Healthcare Support (291 | 6.0%), Security & Protection (130 | 2.7%), Cleaning & Maintenance (116 | 2.4%), Firefighting & Prevention (107 | 2.2%), and Personal Care & Service (104 | 2.1%).
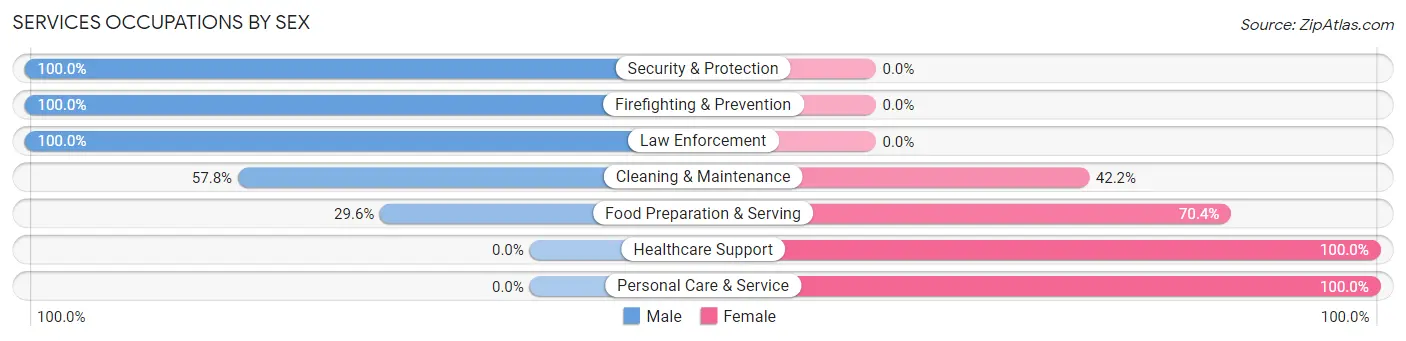
Services Occupations by Sex
Within the Services occupations in Terrace Heights, the most male-oriented occupations are Security & Protection (100.0%), Firefighting & Prevention (100.0%), and Law Enforcement (100.0%), while the most female-oriented occupations are Healthcare Support (100.0%), Personal Care & Service (100.0%), and Food Preparation & Serving (70.4%).
| Occupation | Male | Female |
| Healthcare Support | 0 (0.0%) | 291 (100.0%) |
| Security & Protection | 130 (100.0%) | 0 (0.0%) |
| Firefighting & Prevention | 107 (100.0%) | 0 (0.0%) |
| Law Enforcement | 23 (100.0%) | 0 (0.0%) |
| Food Preparation & Serving | 29 (29.6%) | 69 (70.4%) |
| Cleaning & Maintenance | 67 (57.8%) | 49 (42.2%) |
| Personal Care & Service | 0 (0.0%) | 104 (100.0%) |
| Total (Category) | 226 (30.6%) | 513 (69.4%) |
| Total (Overall) | 2,380 (48.9%) | 2,482 (51.0%) |
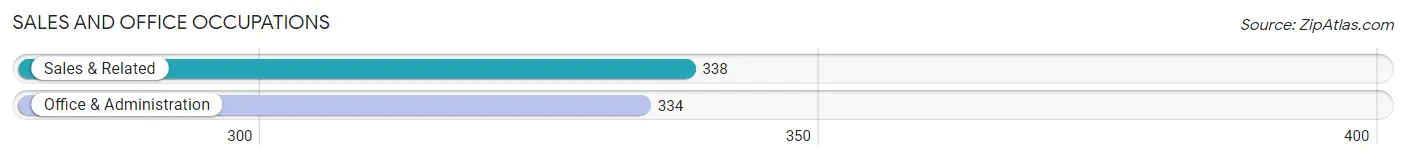
Sales and Office Occupations
The most common Sales and Office occupations in Terrace Heights are Sales & Related (338 | 7.0%), and Office & Administration (334 | 6.9%).
Sales and Office Occupations by Sex
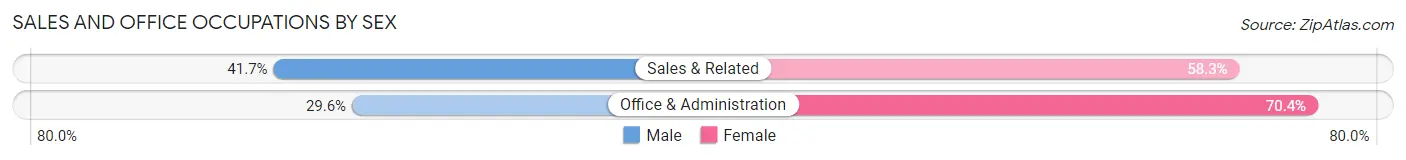
| Occupation | Male | Female |
| Sales & Related | 141 (41.7%) | 197 (58.3%) |
| Office & Administration | 99 (29.6%) | 235 (70.4%) |
| Total (Category) | 240 (35.7%) | 432 (64.3%) |
| Total (Overall) | 2,380 (48.9%) | 2,482 (51.0%) |
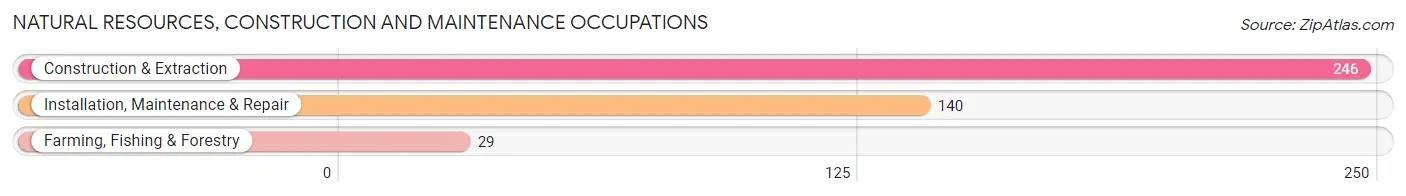
Natural Resources, Construction and Maintenance Occupations
The most common Natural Resources, Construction and Maintenance occupations in Terrace Heights are Construction & Extraction (246 | 5.1%), Installation, Maintenance & Repair (140 | 2.9%), and Farming, Fishing & Forestry (29 | 0.6%).
Natural Resources, Construction and Maintenance Occupations by Sex
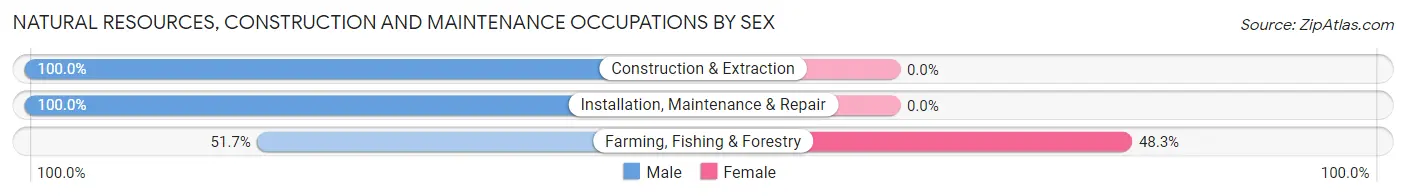
| Occupation | Male | Female |
| Farming, Fishing & Forestry | 15 (51.7%) | 14 (48.3%) |
| Construction & Extraction | 246 (100.0%) | 0 (0.0%) |
| Installation, Maintenance & Repair | 140 (100.0%) | 0 (0.0%) |
| Total (Category) | 401 (96.6%) | 14 (3.4%) |
| Total (Overall) | 2,380 (48.9%) | 2,482 (51.0%) |
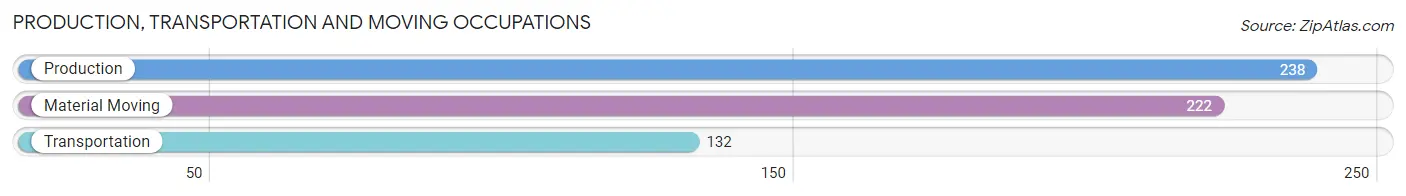
Production, Transportation and Moving Occupations
The most common Production, Transportation and Moving occupations in Terrace Heights are Production (238 | 4.9%), Material Moving (222 | 4.6%), and Transportation (132 | 2.7%).
Production, Transportation and Moving Occupations by Sex

| Occupation | Male | Female |
| Production | 129 (54.2%) | 109 (45.8%) |
| Transportation | 132 (100.0%) | 0 (0.0%) |
| Material Moving | 178 (80.2%) | 44 (19.8%) |
| Total (Category) | 439 (74.2%) | 153 (25.8%) |
| Total (Overall) | 2,380 (48.9%) | 2,482 (51.0%) |
Employment Industries by Sex in Terrace Heights
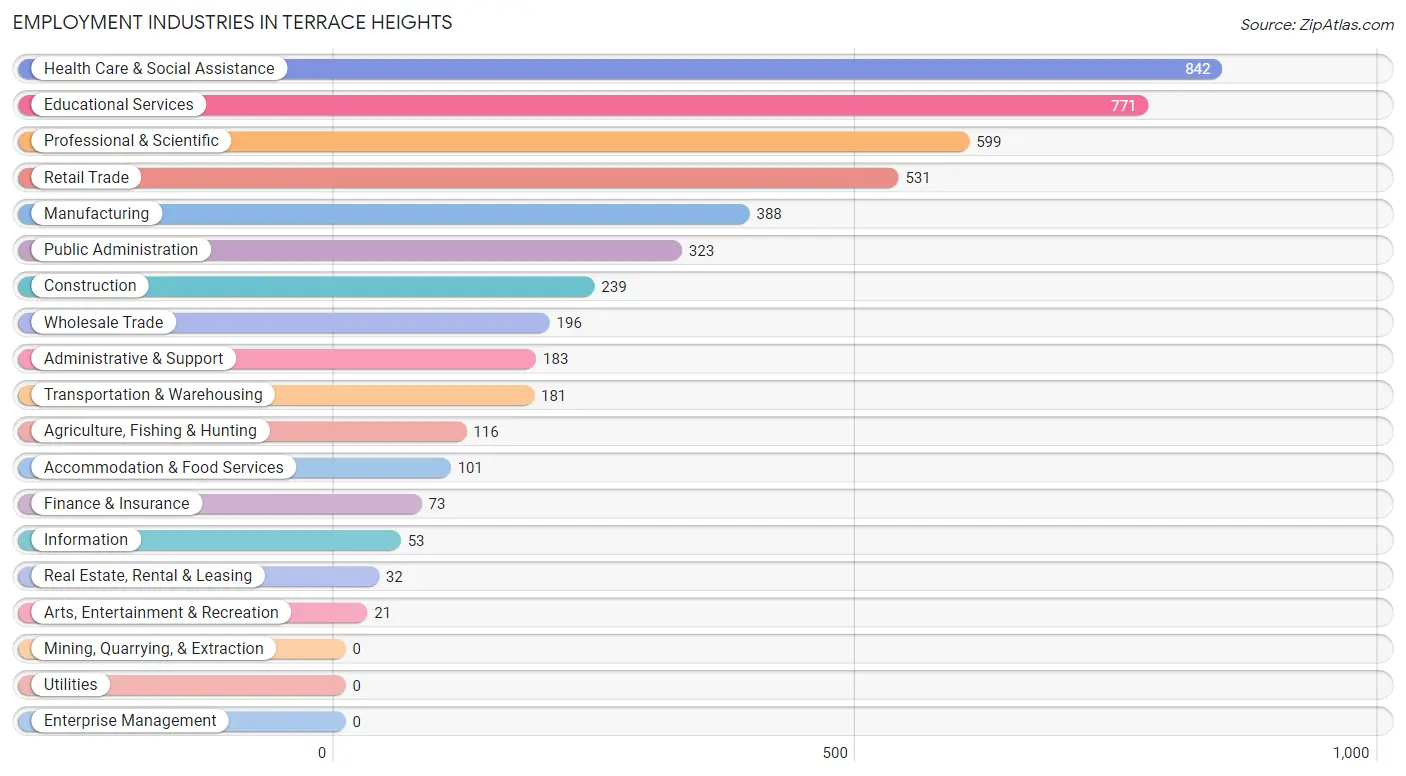
Employment Industries in Terrace Heights
The major employment industries in Terrace Heights include Health Care & Social Assistance (842 | 17.3%), Educational Services (771 | 15.9%), Professional & Scientific (599 | 12.3%), Retail Trade (531 | 10.9%), and Manufacturing (388 | 8.0%).
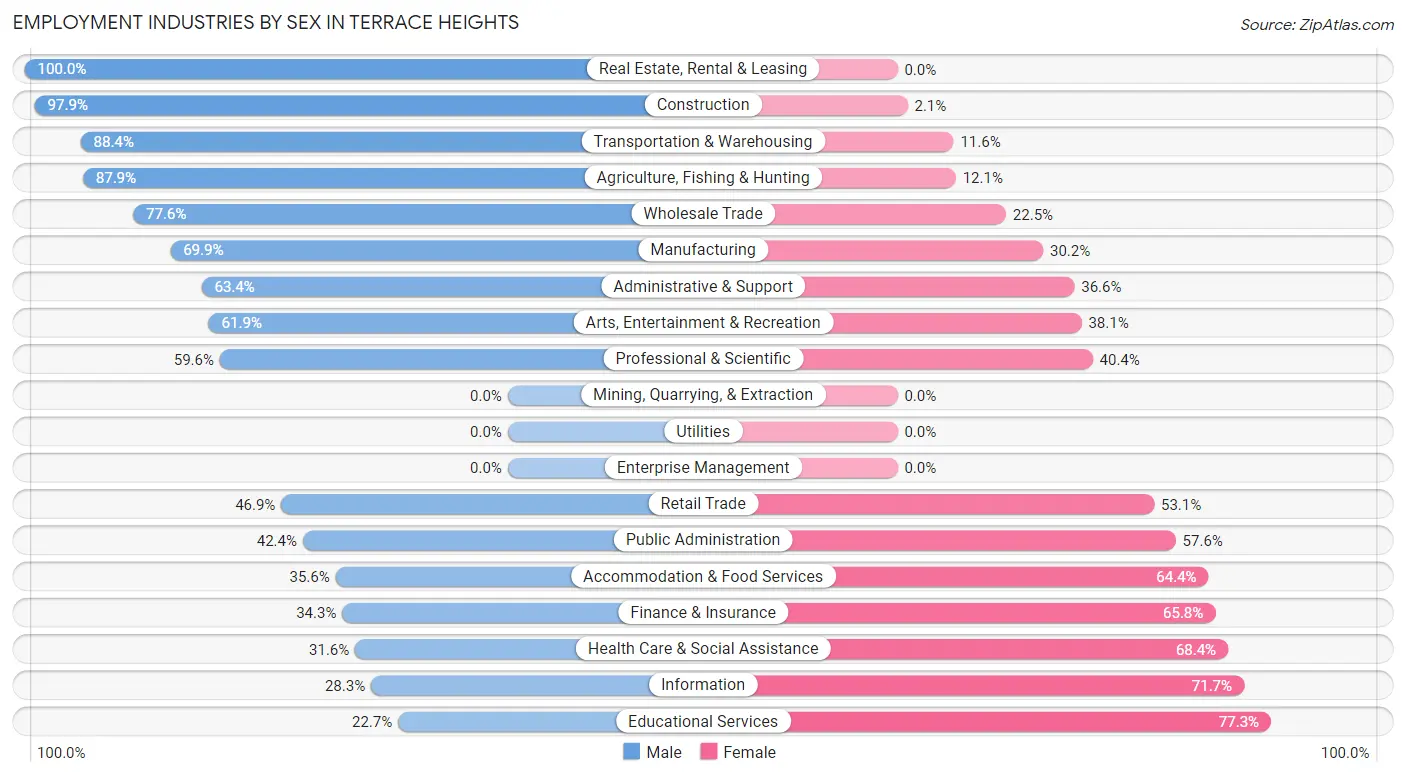
Employment Industries by Sex in Terrace Heights
The Terrace Heights industries that see more men than women are Real Estate, Rental & Leasing (100.0%), Construction (97.9%), and Transportation & Warehousing (88.4%), whereas the industries that tend to have a higher number of women are Educational Services (77.3%), Information (71.7%), and Health Care & Social Assistance (68.4%).
| Industry | Male | Female |
| Agriculture, Fishing & Hunting | 102 (87.9%) | 14 (12.1%) |
| Mining, Quarrying, & Extraction | 0 (0.0%) | 0 (0.0%) |
| Construction | 234 (97.9%) | 5 (2.1%) |
| Manufacturing | 271 (69.9%) | 117 (30.1%) |
| Wholesale Trade | 152 (77.5%) | 44 (22.5%) |
| Retail Trade | 249 (46.9%) | 282 (53.1%) |
| Transportation & Warehousing | 160 (88.4%) | 21 (11.6%) |
| Utilities | 0 (0.0%) | 0 (0.0%) |
| Information | 15 (28.3%) | 38 (71.7%) |
| Finance & Insurance | 25 (34.3%) | 48 (65.7%) |
| Real Estate, Rental & Leasing | 32 (100.0%) | 0 (0.0%) |
| Professional & Scientific | 357 (59.6%) | 242 (40.4%) |
| Enterprise Management | 0 (0.0%) | 0 (0.0%) |
| Administrative & Support | 116 (63.4%) | 67 (36.6%) |
| Educational Services | 175 (22.7%) | 596 (77.3%) |
| Health Care & Social Assistance | 266 (31.6%) | 576 (68.4%) |
| Arts, Entertainment & Recreation | 13 (61.9%) | 8 (38.1%) |
| Accommodation & Food Services | 36 (35.6%) | 65 (64.4%) |
| Public Administration | 137 (42.4%) | 186 (57.6%) |
| Total | 2,380 (48.9%) | 2,482 (51.0%) |
Education in Terrace Heights
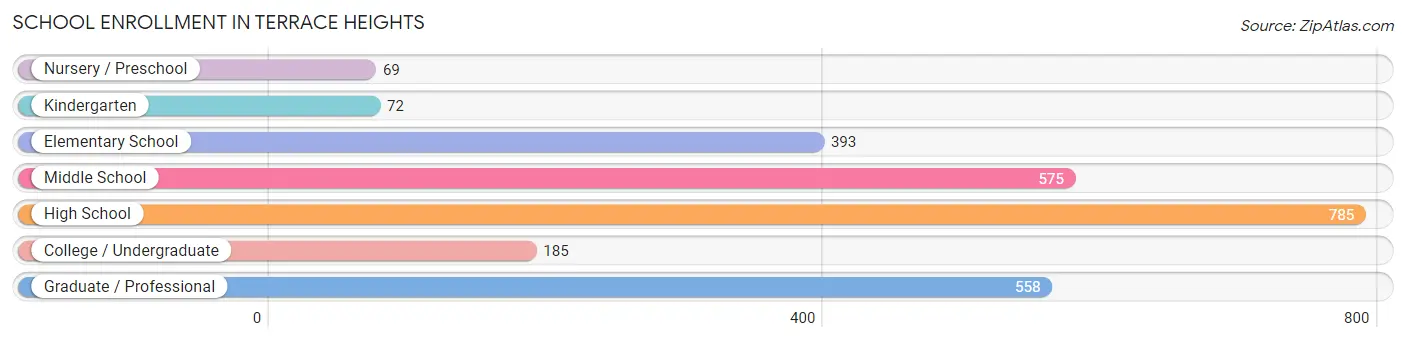
School Enrollment in Terrace Heights
The most common levels of schooling among the 2,637 students in Terrace Heights are high school (785 | 29.8%), middle school (575 | 21.8%), and graduate / professional (558 | 21.2%).
| School Level | # Students | % Students |
| Nursery / Preschool | 69 | 2.6% |
| Kindergarten | 72 | 2.7% |
| Elementary School | 393 | 14.9% |
| Middle School | 575 | 21.8% |
| High School | 785 | 29.8% |
| College / Undergraduate | 185 | 7.0% |
| Graduate / Professional | 558 | 21.2% |
| Total | 2,637 | 100.0% |
School Enrollment by Age by Funding Source in Terrace Heights
Out of a total of 2,637 students who are enrolled in schools in Terrace Heights, 804 (30.5%) attend a private institution, while the remaining 1,833 (69.5%) are enrolled in public schools. The age group of 3 to 4 year olds has the highest likelihood of being enrolled in private schools, with 38 (100.0% in the age bracket) enrolled. Conversely, the age group of 15 to 17 year olds has the lowest likelihood of being enrolled in a private school, with 377 (90.6% in the age bracket) attending a public institution.
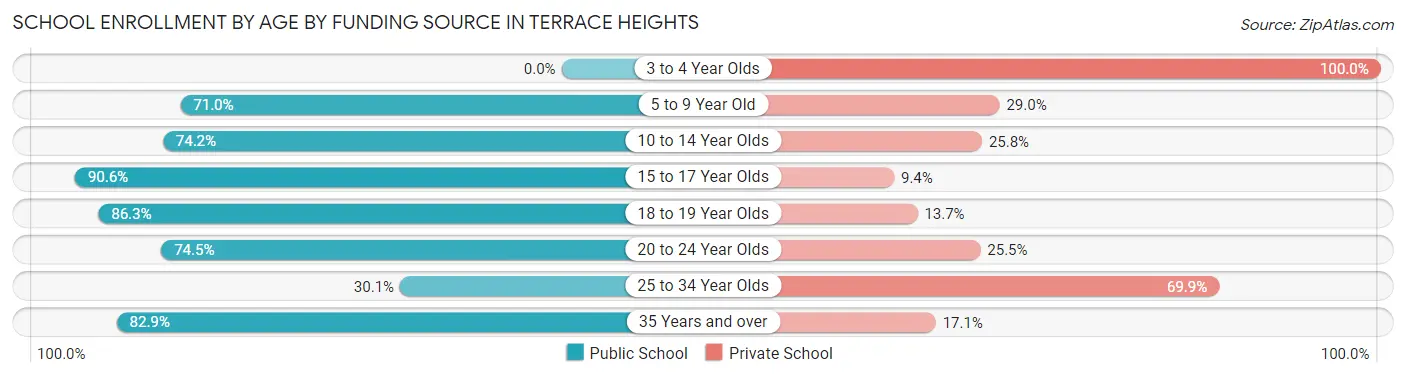
| Age Bracket | Public School | Private School |
| 3 to 4 Year Olds | 0 (0.0%) | 38 (100.0%) |
| 5 to 9 Year Old | 269 (71.0%) | 110 (29.0%) |
| 10 to 14 Year Olds | 631 (74.2%) | 219 (25.8%) |
| 15 to 17 Year Olds | 377 (90.6%) | 39 (9.4%) |
| 18 to 19 Year Olds | 182 (86.3%) | 29 (13.7%) |
| 20 to 24 Year Olds | 161 (74.5%) | 55 (25.5%) |
| 25 to 34 Year Olds | 127 (30.1%) | 295 (69.9%) |
| 35 Years and over | 87 (82.9%) | 18 (17.1%) |
| Total | 1,833 (69.5%) | 804 (30.5%) |
Educational Attainment by Field of Study in Terrace Heights
Education (476 | 18.5%), business (397 | 15.4%), bio, nature & agricultural (390 | 15.1%), science & technology (389 | 15.1%), and arts & humanities (214 | 8.3%) are the most common fields of study among 2,577 individuals in Terrace Heights who have obtained a bachelor's degree or higher.
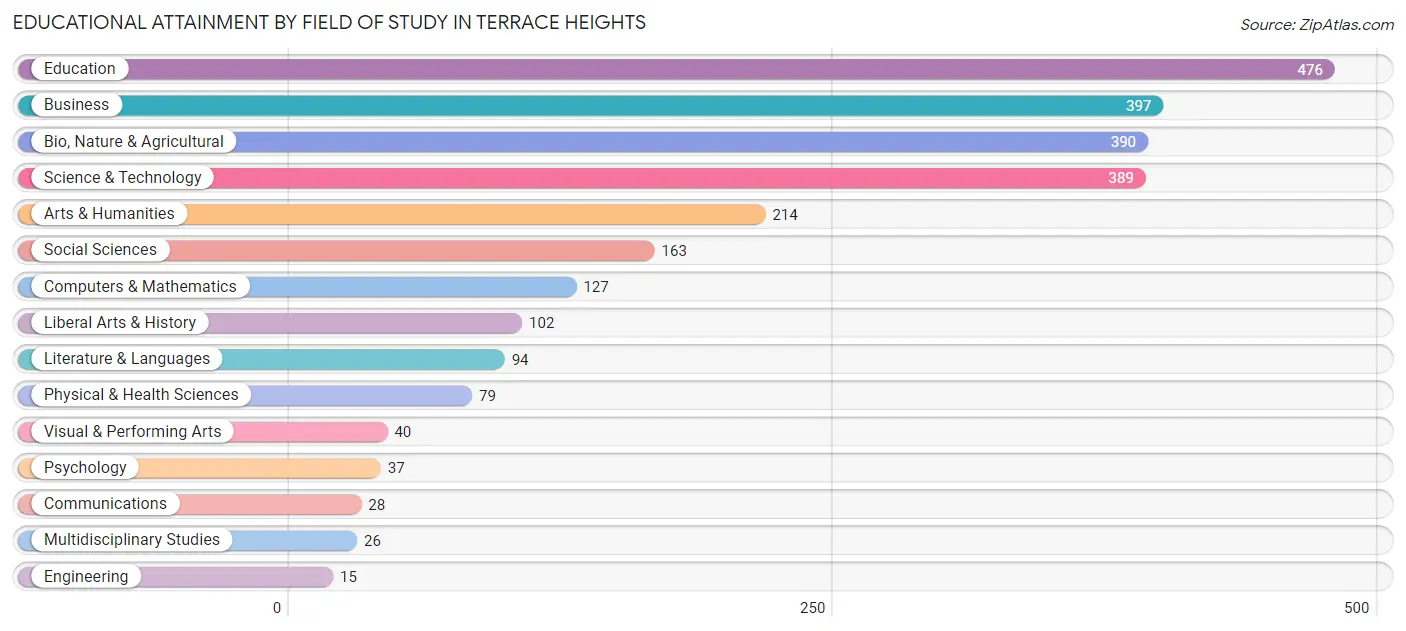
| Field of Study | # Graduates | % Graduates |
| Computers & Mathematics | 127 | 4.9% |
| Bio, Nature & Agricultural | 390 | 15.1% |
| Physical & Health Sciences | 79 | 3.1% |
| Psychology | 37 | 1.4% |
| Social Sciences | 163 | 6.3% |
| Engineering | 15 | 0.6% |
| Multidisciplinary Studies | 26 | 1.0% |
| Science & Technology | 389 | 15.1% |
| Business | 397 | 15.4% |
| Education | 476 | 18.5% |
| Literature & Languages | 94 | 3.6% |
| Liberal Arts & History | 102 | 4.0% |
| Visual & Performing Arts | 40 | 1.5% |
| Communications | 28 | 1.1% |
| Arts & Humanities | 214 | 8.3% |
| Total | 2,577 | 100.0% |
Transportation & Commute in Terrace Heights
Vehicle Availability by Sex in Terrace Heights
The most prevalent vehicle ownership categories in Terrace Heights are males with 2 vehicles (803, accounting for 33.8%) and females with 2 vehicles (846, making up 34.7%).
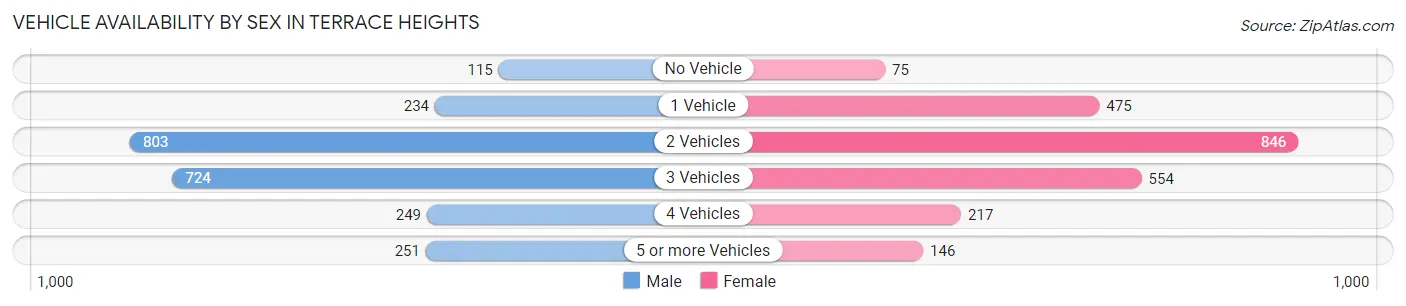
| Vehicles Available | Male | Female |
| No Vehicle | 115 (4.8%) | 75 (3.2%) |
| 1 Vehicle | 234 (9.9%) | 475 (20.5%) |
| 2 Vehicles | 803 (33.8%) | 846 (36.6%) |
| 3 Vehicles | 724 (30.5%) | 554 (23.9%) |
| 4 Vehicles | 249 (10.5%) | 217 (9.4%) |
| 5 or more Vehicles | 251 (10.6%) | 146 (6.3%) |
| Total | 2,376 (100.0%) | 2,313 (100.0%) |
Commute Time in Terrace Heights
The most frequently occuring commute durations in Terrace Heights are 15 to 19 minutes (1,280 commuters, 29.4%), 10 to 14 minutes (1,208 commuters, 27.8%), and 20 to 24 minutes (873 commuters, 20.1%).
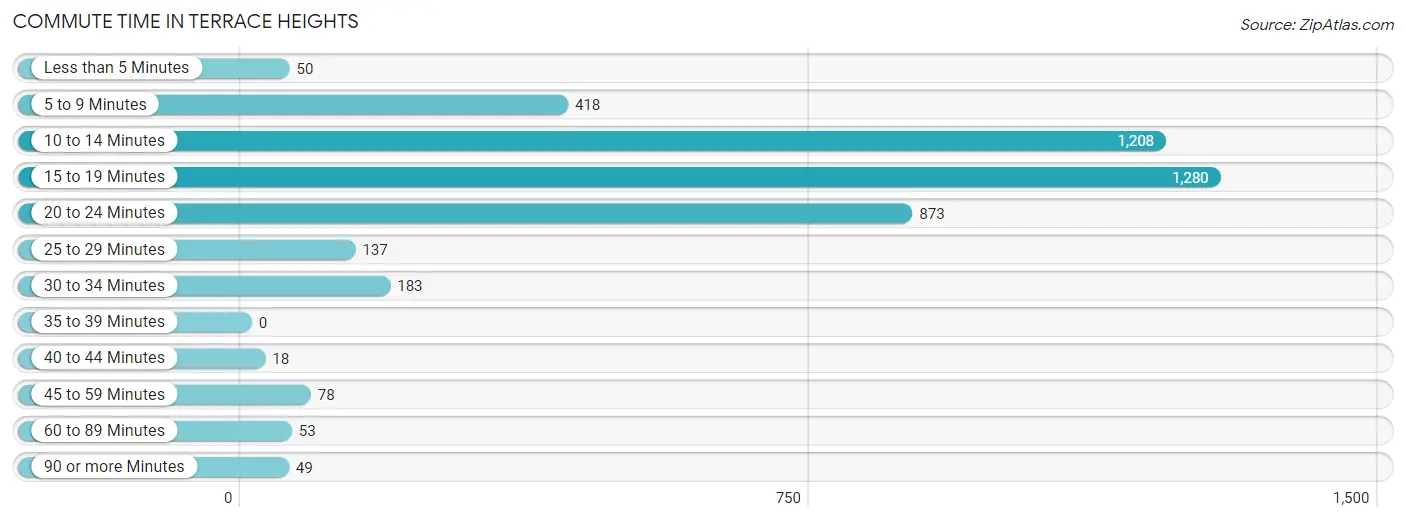
| Commute Time | # Commuters | % Commuters |
| Less than 5 Minutes | 50 | 1.1% |
| 5 to 9 Minutes | 418 | 9.6% |
| 10 to 14 Minutes | 1,208 | 27.8% |
| 15 to 19 Minutes | 1,280 | 29.4% |
| 20 to 24 Minutes | 873 | 20.1% |
| 25 to 29 Minutes | 137 | 3.2% |
| 30 to 34 Minutes | 183 | 4.2% |
| 35 to 39 Minutes | 0 | 0.0% |
| 40 to 44 Minutes | 18 | 0.4% |
| 45 to 59 Minutes | 78 | 1.8% |
| 60 to 89 Minutes | 53 | 1.2% |
| 90 or more Minutes | 49 | 1.1% |
Commute Time by Sex in Terrace Heights
The most common commute times in Terrace Heights are 15 to 19 minutes (631 commuters, 29.4%) for males and 10 to 14 minutes (707 commuters, 32.1%) for females.
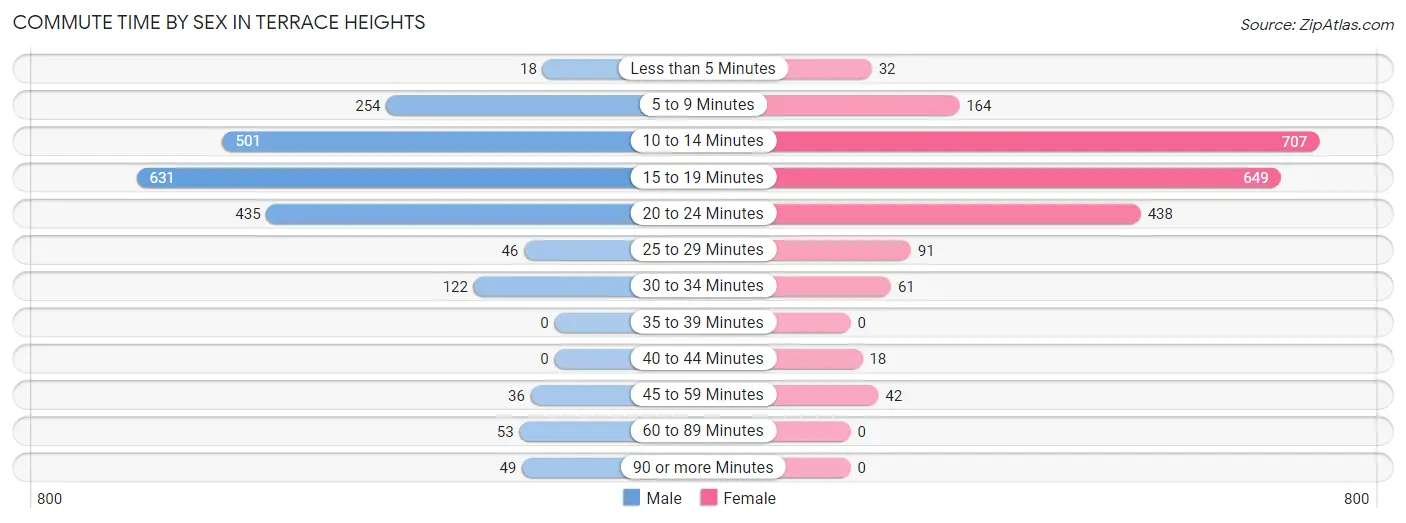
| Commute Time | Male | Female |
| Less than 5 Minutes | 18 (0.8%) | 32 (1.5%) |
| 5 to 9 Minutes | 254 (11.8%) | 164 (7.4%) |
| 10 to 14 Minutes | 501 (23.4%) | 707 (32.1%) |
| 15 to 19 Minutes | 631 (29.4%) | 649 (29.5%) |
| 20 to 24 Minutes | 435 (20.3%) | 438 (19.9%) |
| 25 to 29 Minutes | 46 (2.1%) | 91 (4.1%) |
| 30 to 34 Minutes | 122 (5.7%) | 61 (2.8%) |
| 35 to 39 Minutes | 0 (0.0%) | 0 (0.0%) |
| 40 to 44 Minutes | 0 (0.0%) | 18 (0.8%) |
| 45 to 59 Minutes | 36 (1.7%) | 42 (1.9%) |
| 60 to 89 Minutes | 53 (2.5%) | 0 (0.0%) |
| 90 or more Minutes | 49 (2.3%) | 0 (0.0%) |
Time of Departure to Work by Sex in Terrace Heights
The most frequent times of departure to work in Terrace Heights are 7:30 AM to 7:59 AM (395, 18.4%) for males and 8:30 AM to 8:59 AM (326, 14.8%) for females.
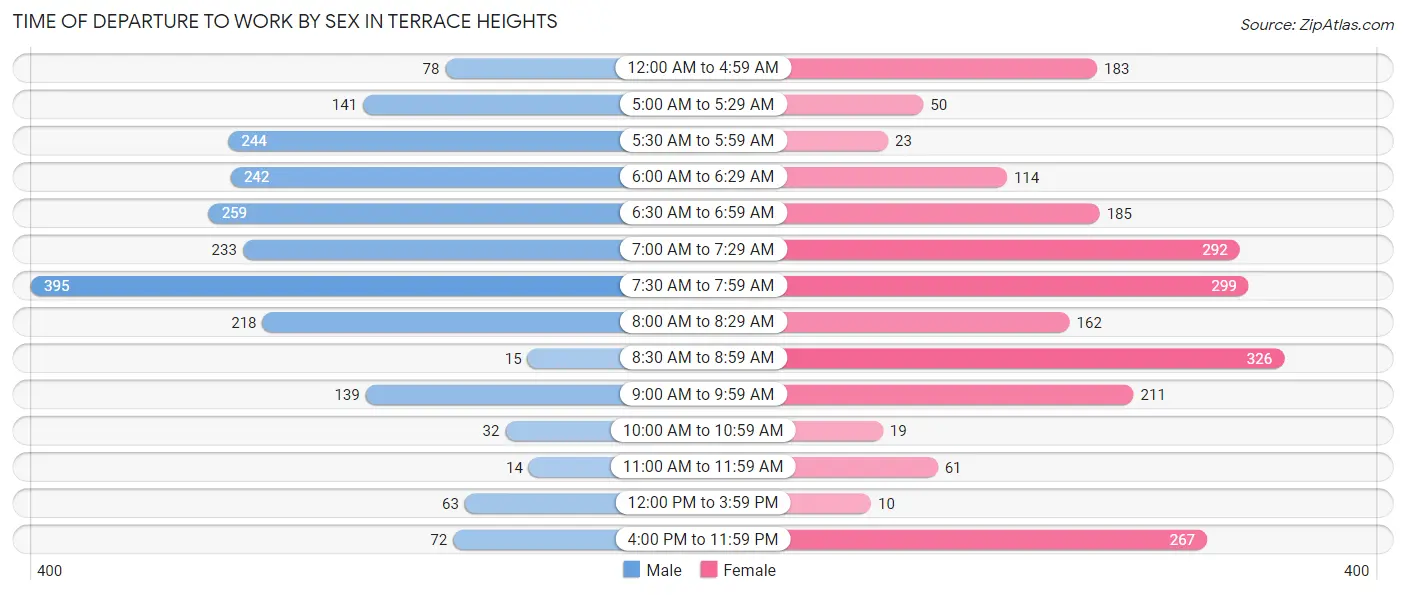
| Time of Departure | Male | Female |
| 12:00 AM to 4:59 AM | 78 (3.6%) | 183 (8.3%) |
| 5:00 AM to 5:29 AM | 141 (6.6%) | 50 (2.3%) |
| 5:30 AM to 5:59 AM | 244 (11.4%) | 23 (1.0%) |
| 6:00 AM to 6:29 AM | 242 (11.3%) | 114 (5.2%) |
| 6:30 AM to 6:59 AM | 259 (12.1%) | 185 (8.4%) |
| 7:00 AM to 7:29 AM | 233 (10.9%) | 292 (13.3%) |
| 7:30 AM to 7:59 AM | 395 (18.4%) | 299 (13.6%) |
| 8:00 AM to 8:29 AM | 218 (10.2%) | 162 (7.4%) |
| 8:30 AM to 8:59 AM | 15 (0.7%) | 326 (14.8%) |
| 9:00 AM to 9:59 AM | 139 (6.5%) | 211 (9.6%) |
| 10:00 AM to 10:59 AM | 32 (1.5%) | 19 (0.9%) |
| 11:00 AM to 11:59 AM | 14 (0.6%) | 61 (2.8%) |
| 12:00 PM to 3:59 PM | 63 (2.9%) | 10 (0.4%) |
| 4:00 PM to 11:59 PM | 72 (3.4%) | 267 (12.1%) |
| Total | 2,145 (100.0%) | 2,202 (100.0%) |
Housing Occupancy in Terrace Heights
Occupancy by Ownership in Terrace Heights
Of the total 4,004 dwellings in Terrace Heights, owner-occupied units account for 2,551 (63.7%), while renter-occupied units make up 1,453 (36.3%).
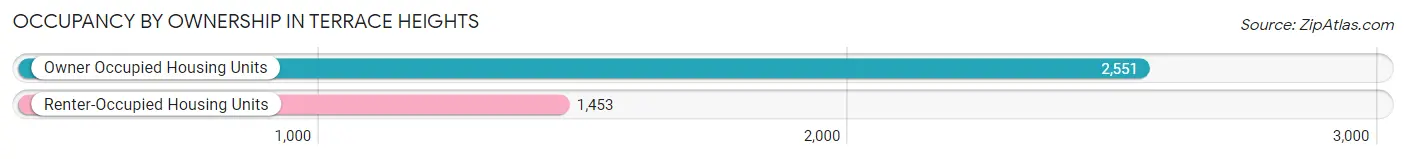
| Occupancy | # Housing Units | % Housing Units |
| Owner Occupied Housing Units | 2,551 | 63.7% |
| Renter-Occupied Housing Units | 1,453 | 36.3% |
| Total Occupied Housing Units | 4,004 | 100.0% |
Occupancy by Household Size in Terrace Heights
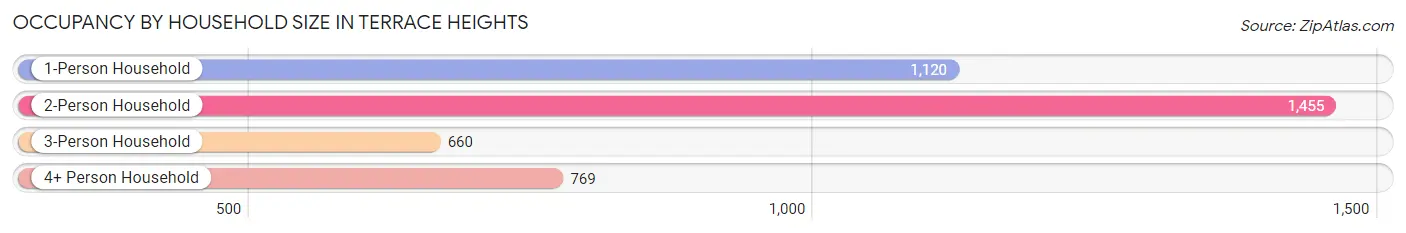
| Household Size | # Housing Units | % Housing Units |
| 1-Person Household | 1,120 | 28.0% |
| 2-Person Household | 1,455 | 36.3% |
| 3-Person Household | 660 | 16.5% |
| 4+ Person Household | 769 | 19.2% |
| Total Housing Units | 4,004 | 100.0% |
Occupancy by Ownership by Household Size in Terrace Heights
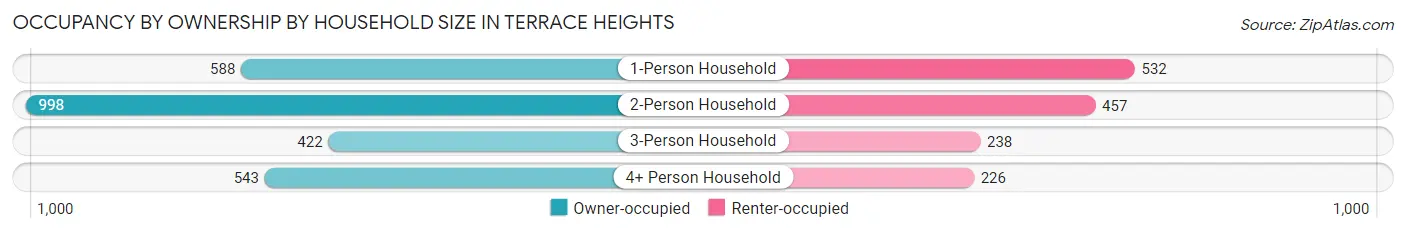
| Household Size | Owner-occupied | Renter-occupied |
| 1-Person Household | 588 (52.5%) | 532 (47.5%) |
| 2-Person Household | 998 (68.6%) | 457 (31.4%) |
| 3-Person Household | 422 (63.9%) | 238 (36.1%) |
| 4+ Person Household | 543 (70.6%) | 226 (29.4%) |
| Total Housing Units | 2,551 (63.7%) | 1,453 (36.3%) |
Occupancy by Educational Attainment in Terrace Heights
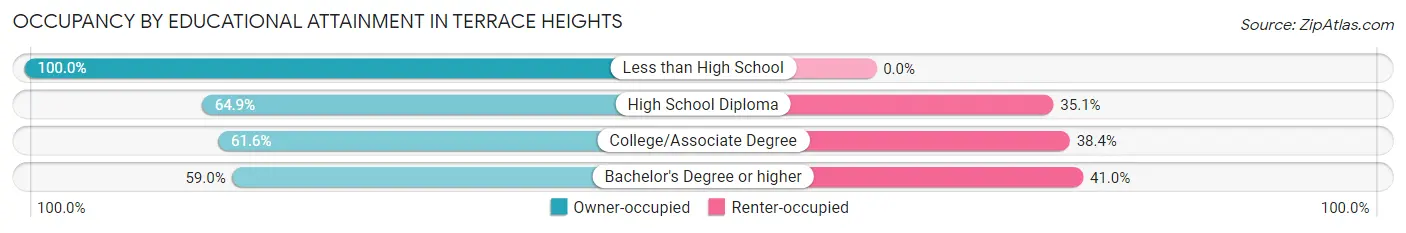
| Household Size | Owner-occupied | Renter-occupied |
| Less than High School | 264 (100.0%) | 0 (0.0%) |
| High School Diploma | 504 (64.9%) | 273 (35.1%) |
| College/Associate Degree | 824 (61.6%) | 513 (38.4%) |
| Bachelor's Degree or higher | 959 (59.0%) | 667 (41.0%) |
Occupancy by Age of Householder in Terrace Heights
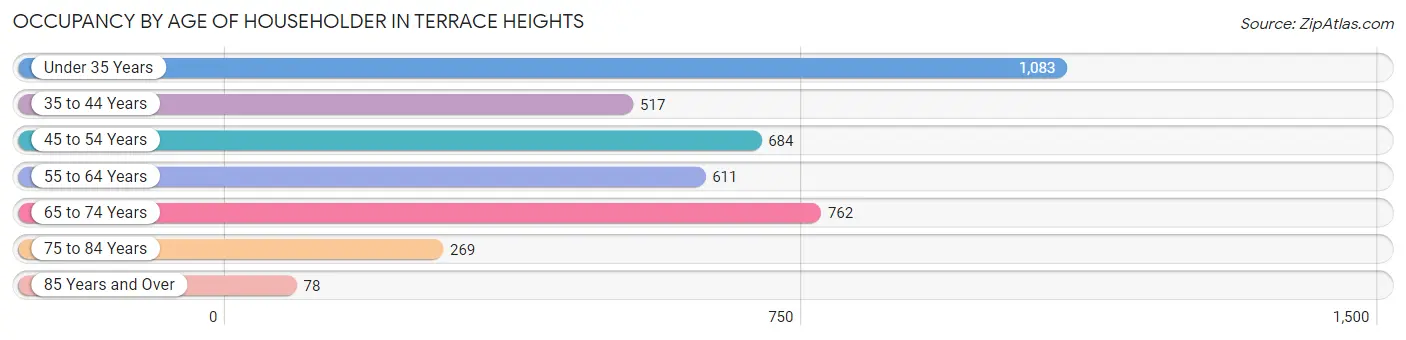
| Age Bracket | # Households | % Households |
| Under 35 Years | 1,083 | 27.1% |
| 35 to 44 Years | 517 | 12.9% |
| 45 to 54 Years | 684 | 17.1% |
| 55 to 64 Years | 611 | 15.3% |
| 65 to 74 Years | 762 | 19.0% |
| 75 to 84 Years | 269 | 6.7% |
| 85 Years and Over | 78 | 1.9% |
| Total | 4,004 | 100.0% |
Housing Finances in Terrace Heights
Median Income by Occupancy in Terrace Heights
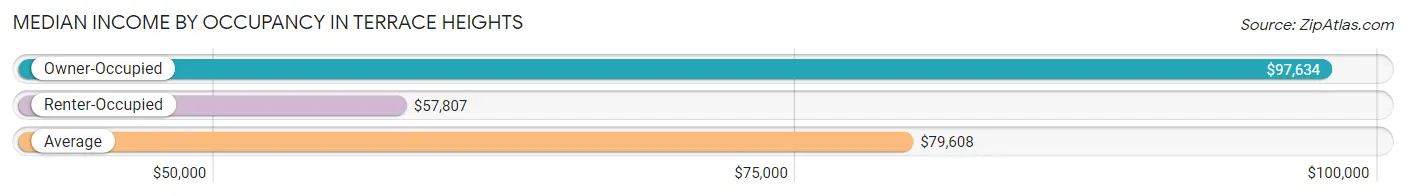
| Occupancy Type | # Households | Median Income |
| Owner-Occupied | 2,551 (63.7%) | $97,634 |
| Renter-Occupied | 1,453 (36.3%) | $57,807 |
| Average | 4,004 (100.0%) | $79,608 |
Occupancy by Householder Income Bracket in Terrace Heights
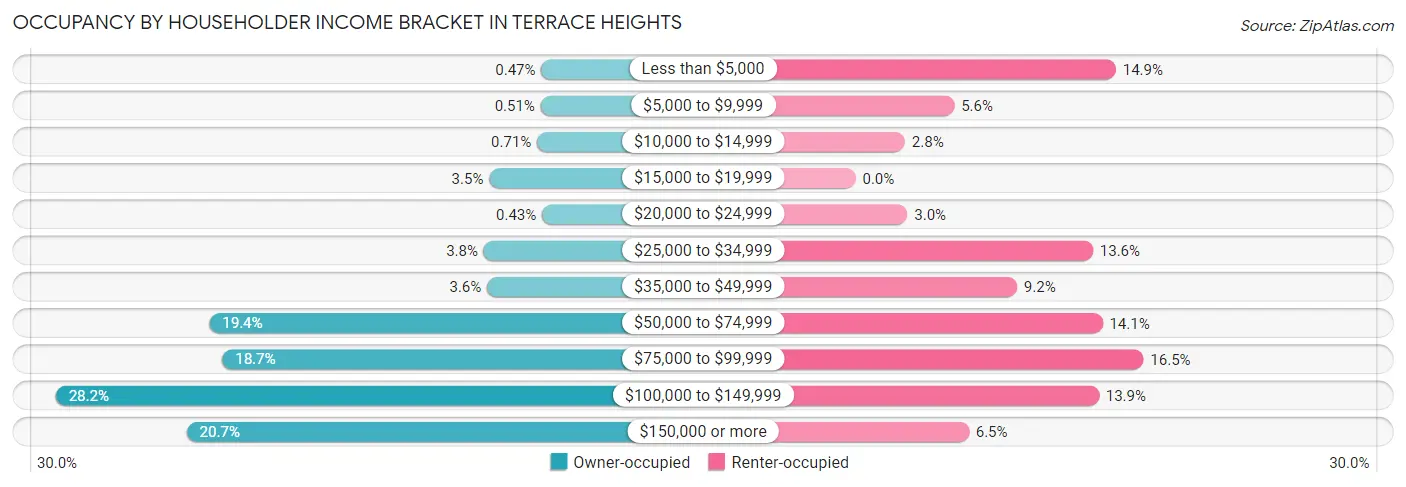
| Income Bracket | Owner-occupied | Renter-occupied |
| Less than $5,000 | 12 (0.5%) | 216 (14.9%) |
| $5,000 to $9,999 | 13 (0.5%) | 82 (5.6%) |
| $10,000 to $14,999 | 18 (0.7%) | 41 (2.8%) |
| $15,000 to $19,999 | 88 (3.5%) | 0 (0.0%) |
| $20,000 to $24,999 | 11 (0.4%) | 43 (3.0%) |
| $25,000 to $34,999 | 96 (3.8%) | 197 (13.6%) |
| $35,000 to $49,999 | 91 (3.6%) | 134 (9.2%) |
| $50,000 to $74,999 | 496 (19.4%) | 205 (14.1%) |
| $75,000 to $99,999 | 477 (18.7%) | 239 (16.5%) |
| $100,000 to $149,999 | 720 (28.2%) | 202 (13.9%) |
| $150,000 or more | 529 (20.7%) | 94 (6.5%) |
| Total | 2,551 (100.0%) | 1,453 (100.0%) |
Monthly Housing Cost Tiers in Terrace Heights
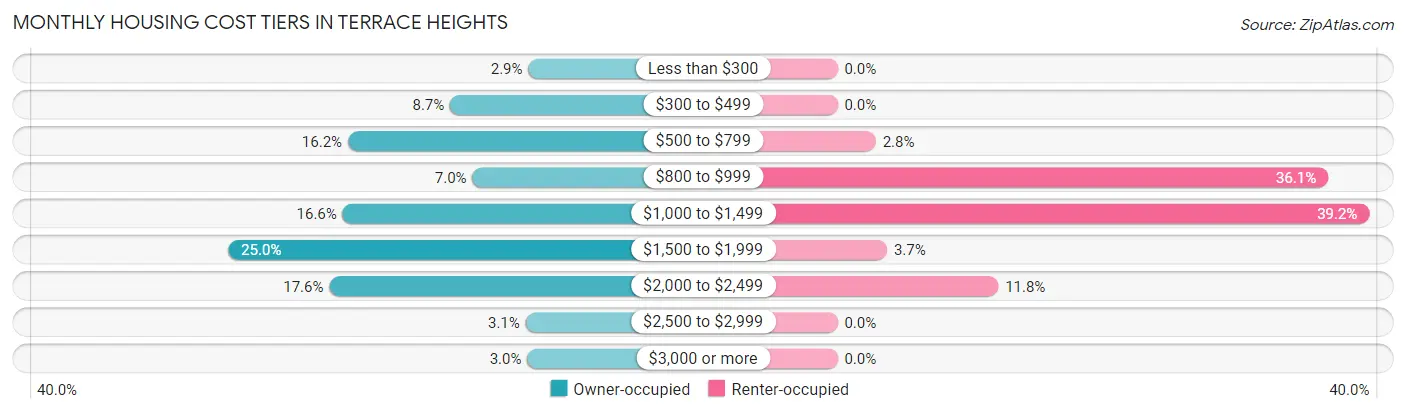
| Monthly Cost | Owner-occupied | Renter-occupied |
| Less than $300 | 74 (2.9%) | 0 (0.0%) |
| $300 to $499 | 221 (8.7%) | 0 (0.0%) |
| $500 to $799 | 413 (16.2%) | 41 (2.8%) |
| $800 to $999 | 179 (7.0%) | 525 (36.1%) |
| $1,000 to $1,499 | 423 (16.6%) | 569 (39.2%) |
| $1,500 to $1,999 | 638 (25.0%) | 53 (3.6%) |
| $2,000 to $2,499 | 448 (17.6%) | 172 (11.8%) |
| $2,500 to $2,999 | 79 (3.1%) | 0 (0.0%) |
| $3,000 or more | 76 (3.0%) | 0 (0.0%) |
| Total | 2,551 (100.0%) | 1,453 (100.0%) |
Physical Housing Characteristics in Terrace Heights
Housing Structures in Terrace Heights
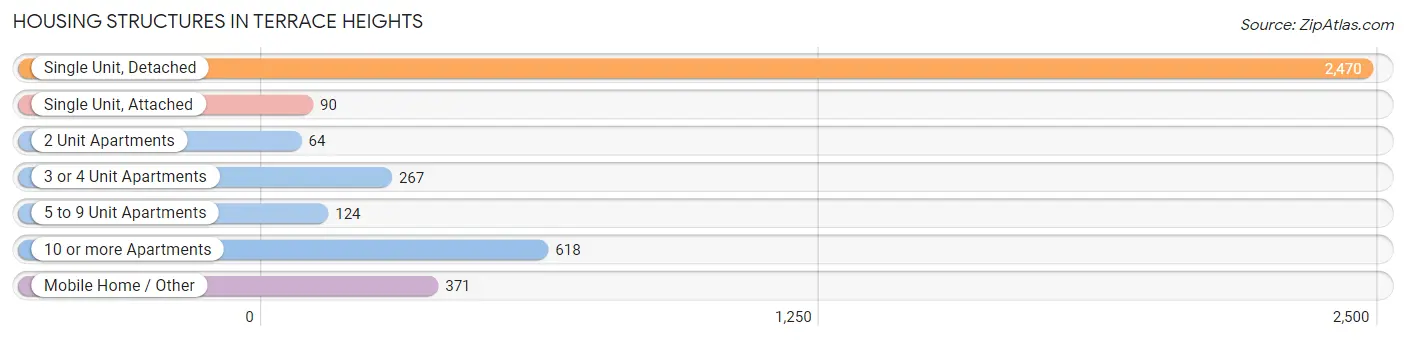
| Structure Type | # Housing Units | % Housing Units |
| Single Unit, Detached | 2,470 | 61.7% |
| Single Unit, Attached | 90 | 2.2% |
| 2 Unit Apartments | 64 | 1.6% |
| 3 or 4 Unit Apartments | 267 | 6.7% |
| 5 to 9 Unit Apartments | 124 | 3.1% |
| 10 or more Apartments | 618 | 15.4% |
| Mobile Home / Other | 371 | 9.3% |
| Total | 4,004 | 100.0% |
Housing Structures by Occupancy in Terrace Heights
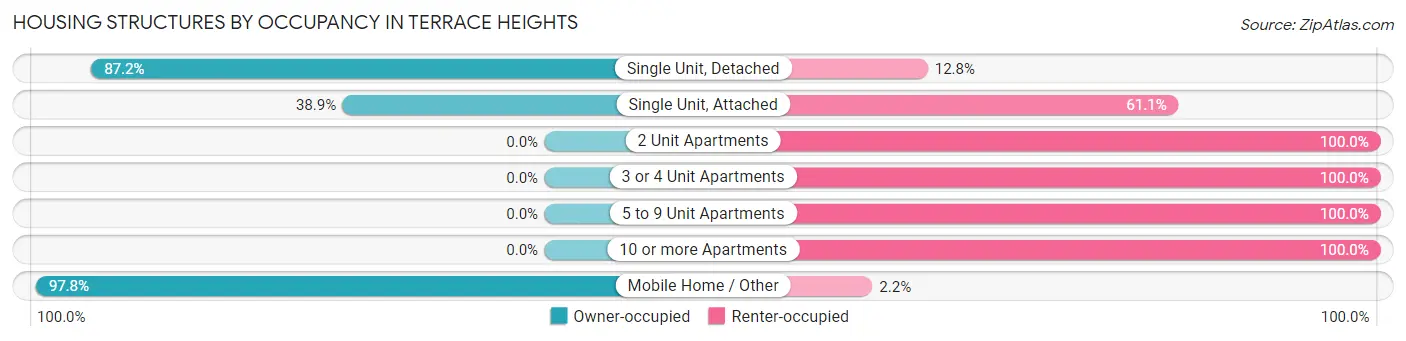
| Structure Type | Owner-occupied | Renter-occupied |
| Single Unit, Detached | 2,153 (87.2%) | 317 (12.8%) |
| Single Unit, Attached | 35 (38.9%) | 55 (61.1%) |
| 2 Unit Apartments | 0 (0.0%) | 64 (100.0%) |
| 3 or 4 Unit Apartments | 0 (0.0%) | 267 (100.0%) |
| 5 to 9 Unit Apartments | 0 (0.0%) | 124 (100.0%) |
| 10 or more Apartments | 0 (0.0%) | 618 (100.0%) |
| Mobile Home / Other | 363 (97.8%) | 8 (2.2%) |
| Total | 2,551 (63.7%) | 1,453 (36.3%) |
Housing Structures by Number of Rooms in Terrace Heights
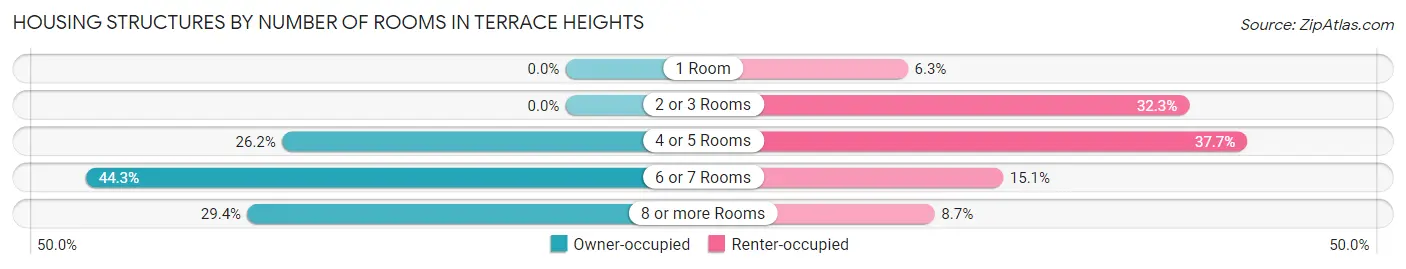
| Number of Rooms | Owner-occupied | Renter-occupied |
| 1 Room | 0 (0.0%) | 91 (6.3%) |
| 2 or 3 Rooms | 0 (0.0%) | 469 (32.3%) |
| 4 or 5 Rooms | 669 (26.2%) | 547 (37.7%) |
| 6 or 7 Rooms | 1,131 (44.3%) | 219 (15.1%) |
| 8 or more Rooms | 751 (29.4%) | 127 (8.7%) |
| Total | 2,551 (100.0%) | 1,453 (100.0%) |
Housing Structure by Heating Type in Terrace Heights
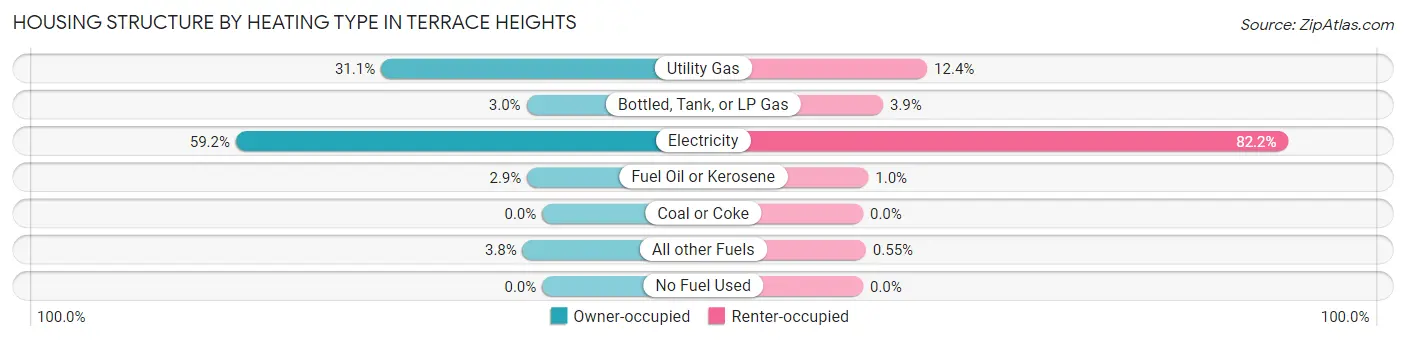
| Heating Type | Owner-occupied | Renter-occupied |
| Utility Gas | 794 (31.1%) | 180 (12.4%) |
| Bottled, Tank, or LP Gas | 77 (3.0%) | 56 (3.8%) |
| Electricity | 1,510 (59.2%) | 1,194 (82.2%) |
| Fuel Oil or Kerosene | 74 (2.9%) | 15 (1.0%) |
| Coal or Coke | 0 (0.0%) | 0 (0.0%) |
| All other Fuels | 96 (3.8%) | 8 (0.5%) |
| No Fuel Used | 0 (0.0%) | 0 (0.0%) |
| Total | 2,551 (100.0%) | 1,453 (100.0%) |
Household Vehicle Usage in Terrace Heights
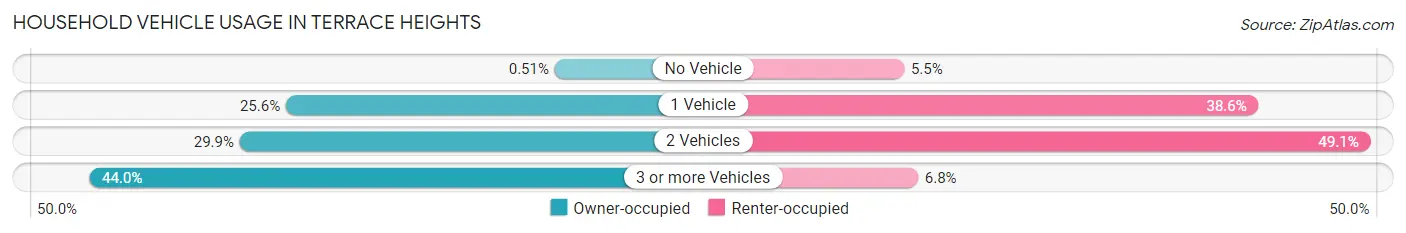
| Vehicles per Household | Owner-occupied | Renter-occupied |
| No Vehicle | 13 (0.5%) | 80 (5.5%) |
| 1 Vehicle | 653 (25.6%) | 561 (38.6%) |
| 2 Vehicles | 763 (29.9%) | 713 (49.1%) |
| 3 or more Vehicles | 1,122 (44.0%) | 99 (6.8%) |
| Total | 2,551 (100.0%) | 1,453 (100.0%) |
Real Estate & Mortgages in Terrace Heights
Real Estate and Mortgage Overview in Terrace Heights
| Characteristic | Without Mortgage | With Mortgage |
| Housing Units | 821 | 1,730 |
| Median Property Value | $310,200 | $310,200 |
| Median Household Income | $91,193 | $338 |
| Monthly Housing Costs | $616 | $76 |
| Real Estate Taxes | $3,080 | $28 |
Property Value by Mortgage Status in Terrace Heights
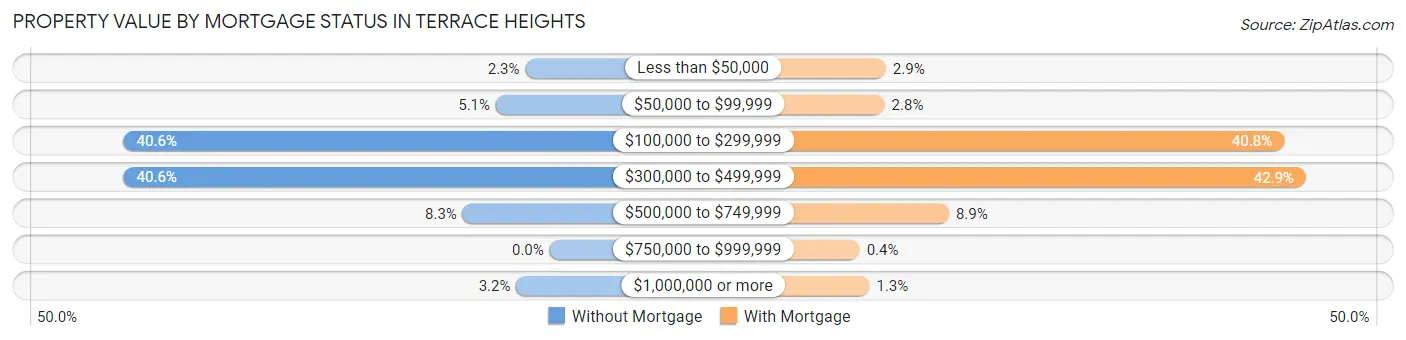
| Property Value | Without Mortgage | With Mortgage |
| Less than $50,000 | 19 (2.3%) | 50 (2.9%) |
| $50,000 to $99,999 | 42 (5.1%) | 48 (2.8%) |
| $100,000 to $299,999 | 333 (40.6%) | 706 (40.8%) |
| $300,000 to $499,999 | 333 (40.6%) | 742 (42.9%) |
| $500,000 to $749,999 | 68 (8.3%) | 154 (8.9%) |
| $750,000 to $999,999 | 0 (0.0%) | 7 (0.4%) |
| $1,000,000 or more | 26 (3.2%) | 23 (1.3%) |
| Total | 821 (100.0%) | 1,730 (100.0%) |
Household Income by Mortgage Status in Terrace Heights
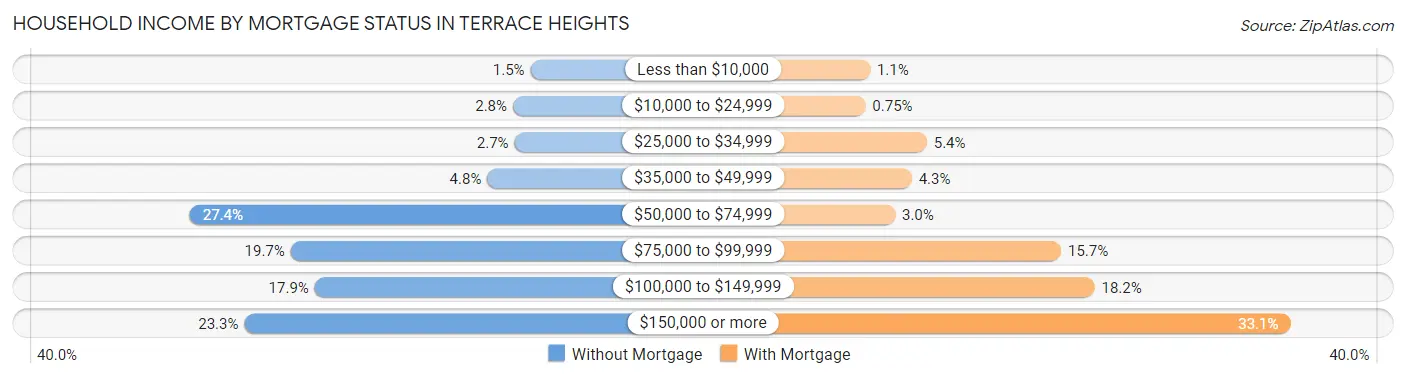
| Household Income | Without Mortgage | With Mortgage |
| Less than $10,000 | 12 (1.5%) | 19 (1.1%) |
| $10,000 to $24,999 | 23 (2.8%) | 13 (0.7%) |
| $25,000 to $34,999 | 22 (2.7%) | 94 (5.4%) |
| $35,000 to $49,999 | 39 (4.8%) | 74 (4.3%) |
| $50,000 to $74,999 | 225 (27.4%) | 52 (3.0%) |
| $75,000 to $99,999 | 162 (19.7%) | 271 (15.7%) |
| $100,000 to $149,999 | 147 (17.9%) | 315 (18.2%) |
| $150,000 or more | 191 (23.3%) | 573 (33.1%) |
| Total | 821 (100.0%) | 1,730 (100.0%) |
Property Value to Household Income Ratio in Terrace Heights
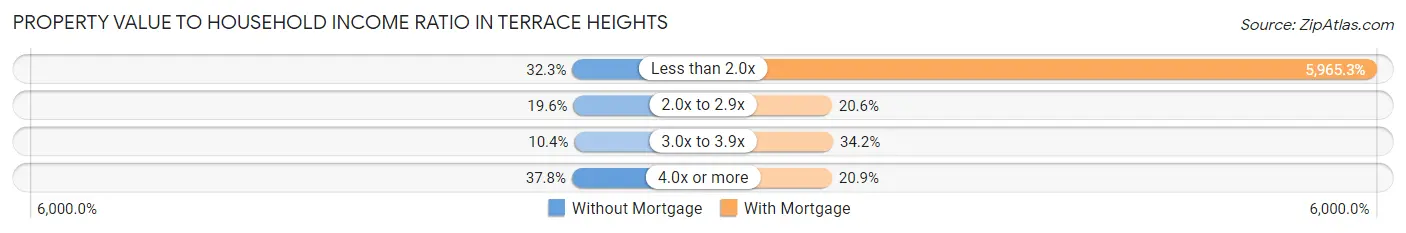
| Value-to-Income Ratio | Without Mortgage | With Mortgage |
| Less than 2.0x | 265 (32.3%) | 103,200 (5,965.3%) |
| 2.0x to 2.9x | 161 (19.6%) | 356 (20.6%) |
| 3.0x to 3.9x | 85 (10.3%) | 592 (34.2%) |
| 4.0x or more | 310 (37.8%) | 362 (20.9%) |
| Total | 821 (100.0%) | 1,730 (100.0%) |
Real Estate Taxes by Mortgage Status in Terrace Heights
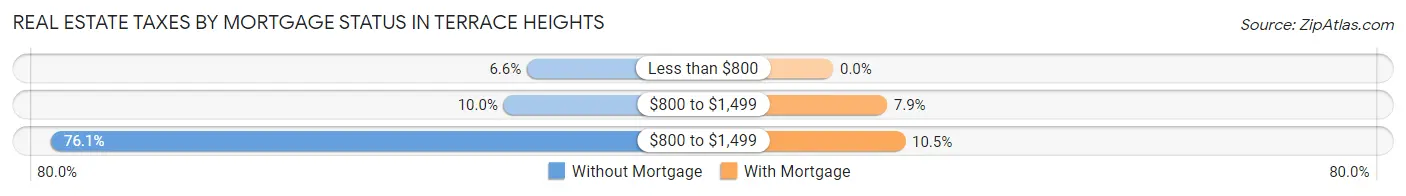
| Property Taxes | Without Mortgage | With Mortgage |
| Less than $800 | 54 (6.6%) | 0 (0.0%) |
| $800 to $1,499 | 82 (10.0%) | 136 (7.9%) |
| $800 to $1,499 | 625 (76.1%) | 182 (10.5%) |
| Total | 821 (100.0%) | 1,730 (100.0%) |
Health & Disability in Terrace Heights
Health Insurance Coverage by Age in Terrace Heights
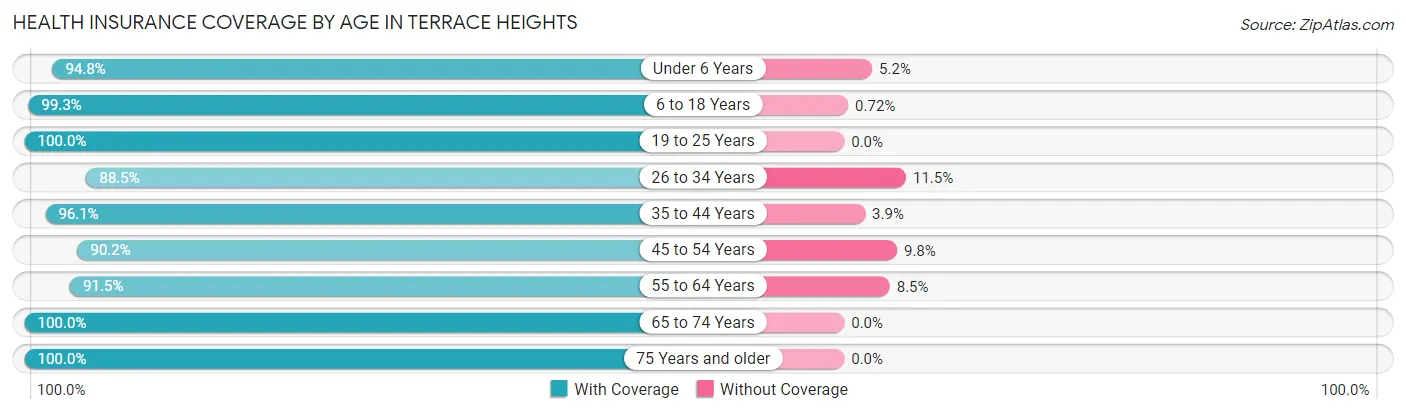
| Age Bracket | With Coverage | Without Coverage |
| Under 6 Years | 565 (94.8%) | 31 (5.2%) |
| 6 to 18 Years | 1,799 (99.3%) | 13 (0.7%) |
| 19 to 25 Years | 645 (100.0%) | 0 (0.0%) |
| 26 to 34 Years | 1,307 (88.5%) | 170 (11.5%) |
| 35 to 44 Years | 987 (96.1%) | 40 (3.9%) |
| 45 to 54 Years | 1,072 (90.2%) | 117 (9.8%) |
| 55 to 64 Years | 1,057 (91.5%) | 98 (8.5%) |
| 65 to 74 Years | 1,267 (100.0%) | 0 (0.0%) |
| 75 Years and older | 601 (100.0%) | 0 (0.0%) |
| Total | 9,300 (95.2%) | 469 (4.8%) |
Health Insurance Coverage by Citizenship Status in Terrace Heights
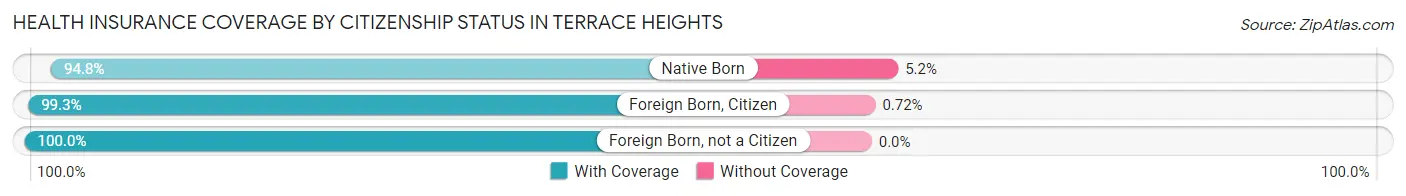
| Citizenship Status | With Coverage | Without Coverage |
| Native Born | 565 (94.8%) | 31 (5.2%) |
| Foreign Born, Citizen | 1,799 (99.3%) | 13 (0.7%) |
| Foreign Born, not a Citizen | 645 (100.0%) | 0 (0.0%) |
Health Insurance Coverage by Household Income in Terrace Heights
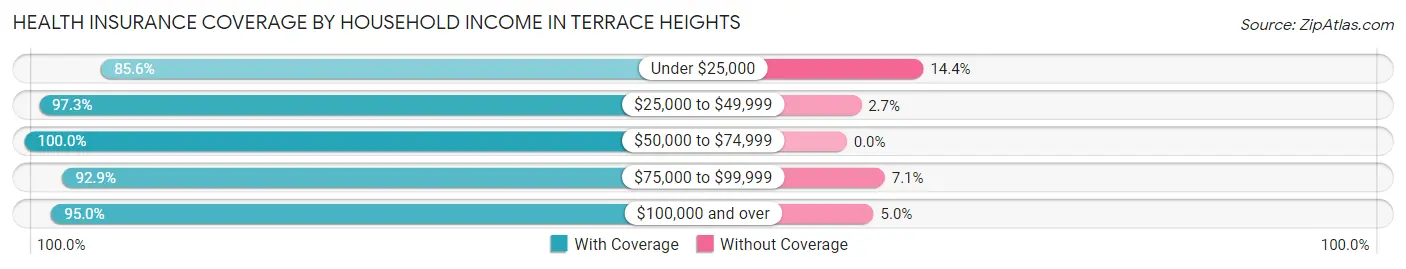
| Household Income | With Coverage | Without Coverage |
| Under $25,000 | 519 (85.6%) | 87 (14.4%) |
| $25,000 to $49,999 | 1,009 (97.3%) | 28 (2.7%) |
| $50,000 to $74,999 | 1,990 (100.0%) | 0 (0.0%) |
| $75,000 to $99,999 | 1,382 (92.9%) | 106 (7.1%) |
| $100,000 and over | 4,388 (95.0%) | 232 (5.0%) |
Public vs Private Health Insurance Coverage by Age in Terrace Heights
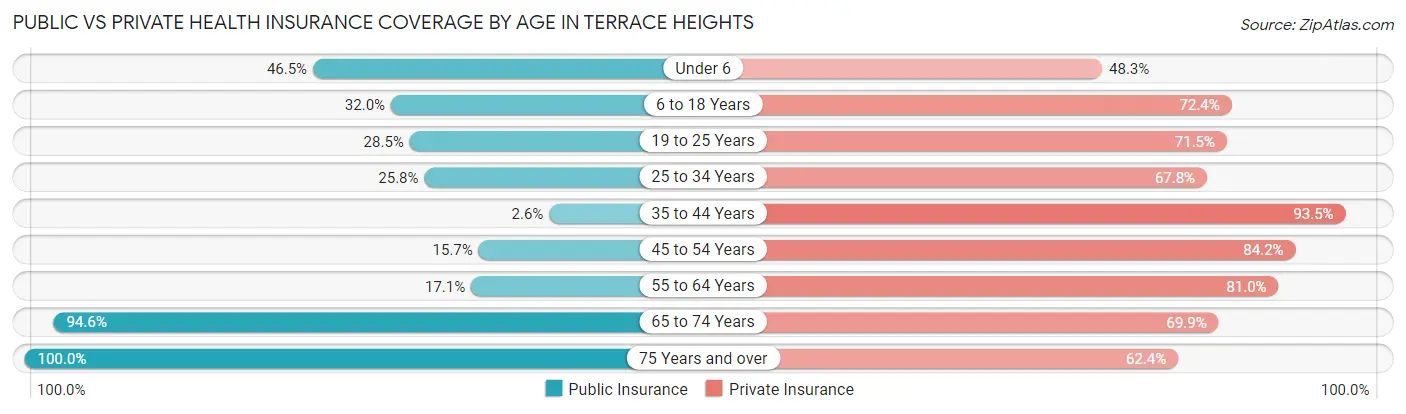
| Age Bracket | Public Insurance | Private Insurance |
| Under 6 | 277 (46.5%) | 288 (48.3%) |
| 6 to 18 Years | 580 (32.0%) | 1,311 (72.4%) |
| 19 to 25 Years | 184 (28.5%) | 461 (71.5%) |
| 25 to 34 Years | 381 (25.8%) | 1,001 (67.8%) |
| 35 to 44 Years | 27 (2.6%) | 960 (93.5%) |
| 45 to 54 Years | 187 (15.7%) | 1,001 (84.2%) |
| 55 to 64 Years | 198 (17.1%) | 936 (81.0%) |
| 65 to 74 Years | 1,199 (94.6%) | 886 (69.9%) |
| 75 Years and over | 601 (100.0%) | 375 (62.4%) |
| Total | 3,634 (37.2%) | 7,219 (73.9%) |
Disability Status by Sex by Age in Terrace Heights
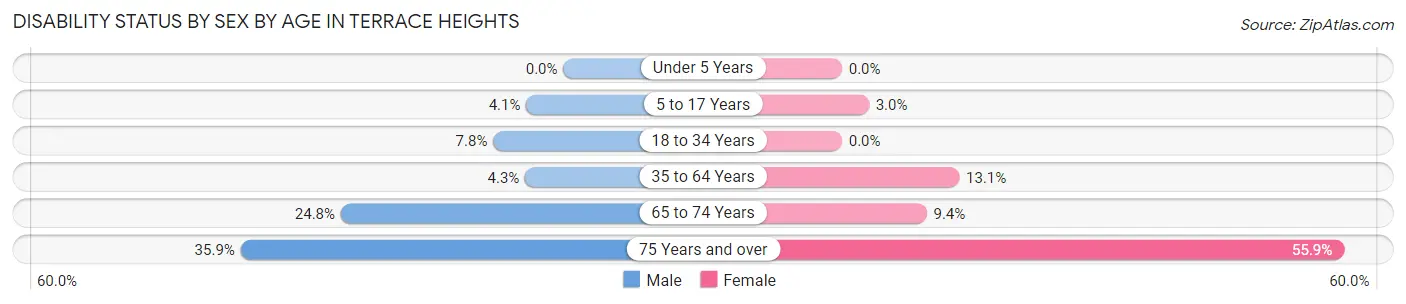
| Age Bracket | Male | Female |
| Under 5 Years | 0 (0.0%) | 0 (0.0%) |
| 5 to 17 Years | 39 (4.1%) | 21 (3.0%) |
| 18 to 34 Years | 100 (7.8%) | 0 (0.0%) |
| 35 to 64 Years | 70 (4.3%) | 225 (13.1%) |
| 65 to 74 Years | 167 (24.8%) | 56 (9.4%) |
| 75 Years and over | 101 (35.9%) | 179 (55.9%) |
Disability Class by Sex by Age in Terrace Heights
Disability Class: Hearing Difficulty
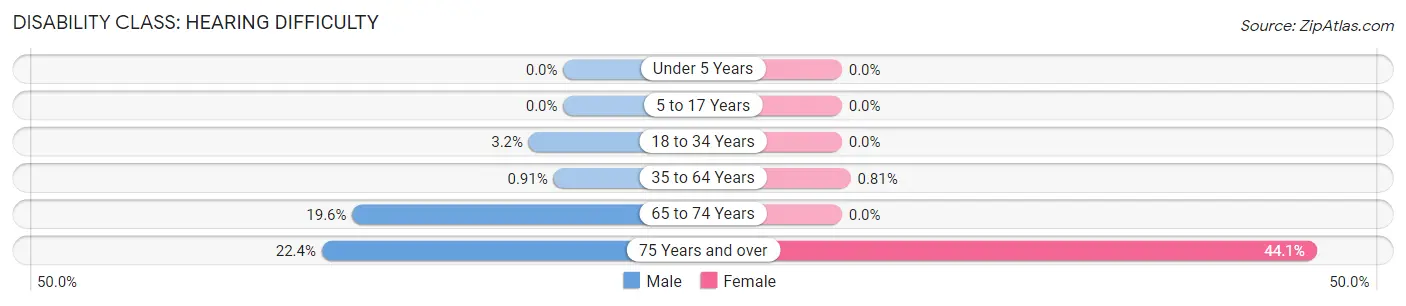
| Age Bracket | Male | Female |
| Under 5 Years | 0 (0.0%) | 0 (0.0%) |
| 5 to 17 Years | 0 (0.0%) | 0 (0.0%) |
| 18 to 34 Years | 41 (3.2%) | 0 (0.0%) |
| 35 to 64 Years | 15 (0.9%) | 14 (0.8%) |
| 65 to 74 Years | 132 (19.6%) | 0 (0.0%) |
| 75 Years and over | 63 (22.4%) | 141 (44.1%) |
Disability Class: Vision Difficulty
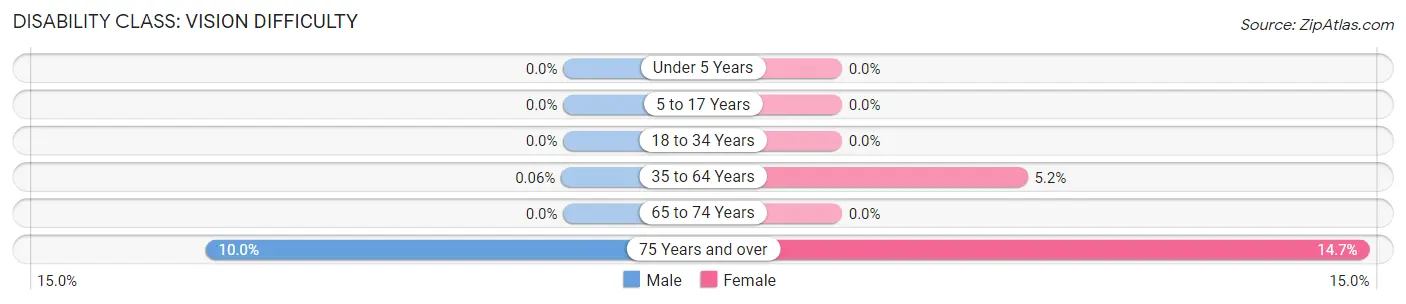
| Age Bracket | Male | Female |
| Under 5 Years | 0 (0.0%) | 0 (0.0%) |
| 5 to 17 Years | 0 (0.0%) | 0 (0.0%) |
| 18 to 34 Years | 0 (0.0%) | 0 (0.0%) |
| 35 to 64 Years | 1 (0.1%) | 89 (5.2%) |
| 65 to 74 Years | 0 (0.0%) | 0 (0.0%) |
| 75 Years and over | 28 (10.0%) | 47 (14.7%) |
Disability Class: Cognitive Difficulty
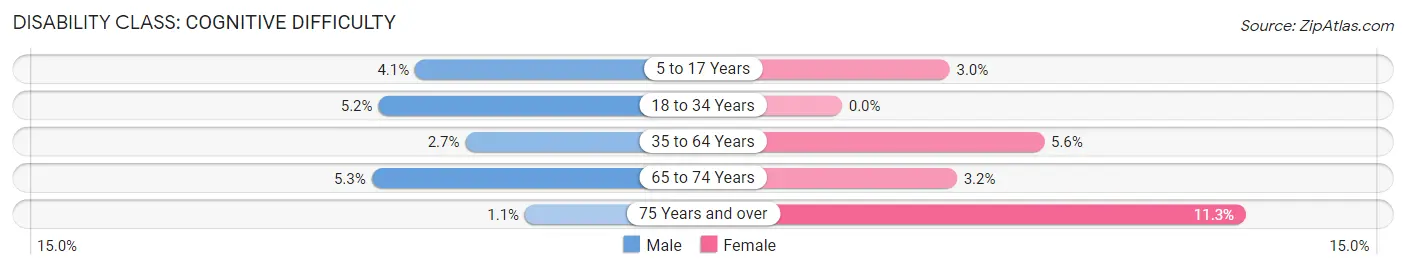
| Age Bracket | Male | Female |
| 5 to 17 Years | 39 (4.1%) | 21 (3.0%) |
| 18 to 34 Years | 66 (5.1%) | 0 (0.0%) |
| 35 to 64 Years | 45 (2.7%) | 97 (5.6%) |
| 65 to 74 Years | 36 (5.3%) | 19 (3.2%) |
| 75 Years and over | 3 (1.1%) | 36 (11.3%) |
Disability Class: Ambulatory Difficulty
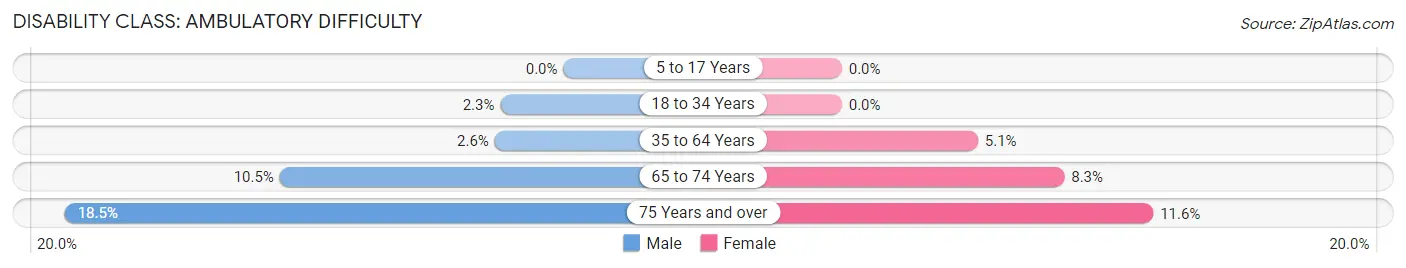
| Age Bracket | Male | Female |
| 5 to 17 Years | 0 (0.0%) | 0 (0.0%) |
| 18 to 34 Years | 30 (2.3%) | 0 (0.0%) |
| 35 to 64 Years | 42 (2.5%) | 87 (5.1%) |
| 65 to 74 Years | 71 (10.5%) | 49 (8.3%) |
| 75 Years and over | 52 (18.5%) | 37 (11.6%) |
Disability Class: Self-Care Difficulty
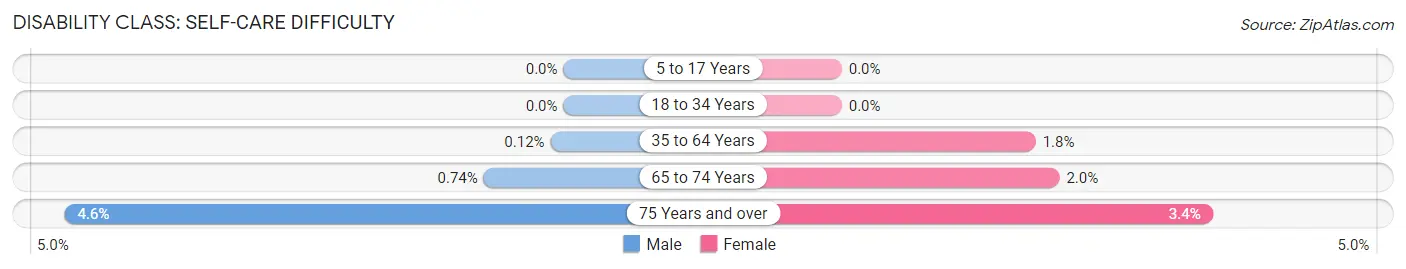
| Age Bracket | Male | Female |
| 5 to 17 Years | 0 (0.0%) | 0 (0.0%) |
| 18 to 34 Years | 0 (0.0%) | 0 (0.0%) |
| 35 to 64 Years | 2 (0.1%) | 31 (1.8%) |
| 65 to 74 Years | 5 (0.7%) | 12 (2.0%) |
| 75 Years and over | 13 (4.6%) | 11 (3.4%) |
Technology Access in Terrace Heights
Computing Device Access in Terrace Heights
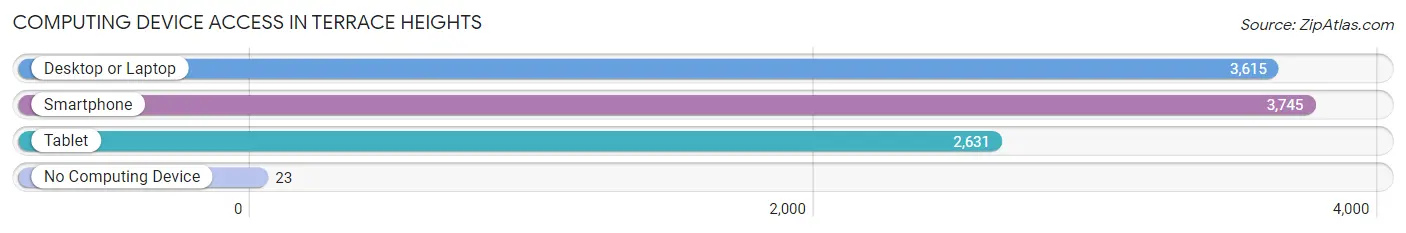
| Device Type | # Households | % Households |
| Desktop or Laptop | 3,615 | 90.3% |
| Smartphone | 3,745 | 93.5% |
| Tablet | 2,631 | 65.7% |
| No Computing Device | 23 | 0.6% |
| Total | 4,004 | 100.0% |
Internet Access in Terrace Heights
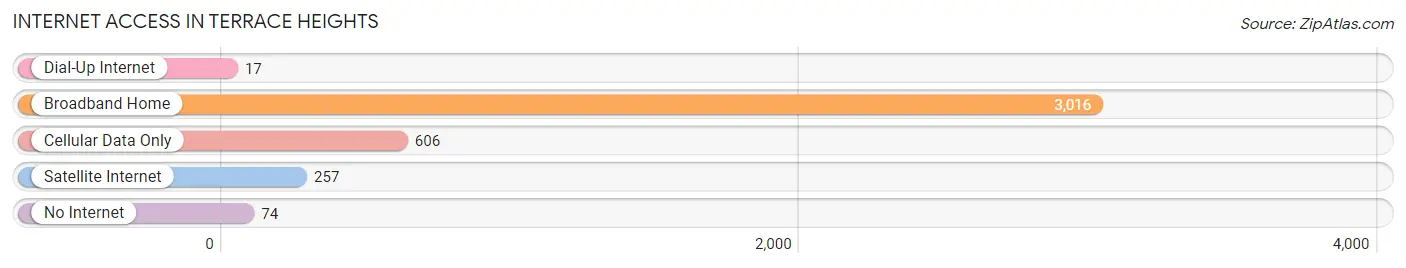
| Internet Type | # Households | % Households |
| Dial-Up Internet | 17 | 0.4% |
| Broadband Home | 3,016 | 75.3% |
| Cellular Data Only | 606 | 15.1% |
| Satellite Internet | 257 | 6.4% |
| No Internet | 74 | 1.8% |
| Total | 4,004 | 100.0% |
Terrace Heights Summary
Terrace Heights is a small unincorporated community located in Yakima County, Washington, United States. It is situated on the east side of the Yakima River, just south of the city of Yakima. The population of Terrace Heights was 1,845 at the 2010 census.
History
Terrace Heights was first settled in the late 1800s by homesteaders who were attracted to the area by its fertile soil and abundant water. The first post office was established in the area in 1891. The community was originally known as "Terrace," but the name was changed to "Terrace Heights" in the early 1900s to avoid confusion with another nearby community.
The area was primarily agricultural until the 1950s, when the construction of Interstate 82 brought an influx of new residents and businesses. The population of Terrace Heights grew rapidly during this period, and the community was incorporated as a town in 1959.
Geography
Terrace Heights is located in the Yakima Valley, a region of rolling hills and fertile farmland. The Yakima River runs through the center of the community, and the area is surrounded by orchards and vineyards. The climate is semi-arid, with hot summers and cold winters.
The terrain of Terrace Heights is mostly flat, with an elevation of 1,400 feet (427 m). The area is located in the rain shadow of the Cascade Mountains, and receives an average of only 8 inches (203 mm) of precipitation per year.
Economy
Terrace Heights is primarily a residential community, with most of its residents commuting to nearby cities for work. The local economy is largely based on agriculture, with orchards and vineyards providing the majority of the jobs in the area.
The town is also home to several small businesses, including a grocery store, a hardware store, and a few restaurants. There are also several wineries in the area, which attract tourists from around the region.
Demographics
As of the 2010 census, the population of Terrace Heights was 1,845. The racial makeup of the town was 87.3% White, 0.7% African American, 0.7% Native American, 0.7% Asian, 0.2% Pacific Islander, 8.2% from other races, and 2.2% from two or more races. Hispanic or Latino of any race were 16.2% of the population.
The median household income in Terrace Heights was $45,938, and the median family income was $50,938. The per capita income was $20,938. About 11.2% of families and 14.2% of the population were below the poverty line, including 19.2% of those under age 18 and 8.2% of those age 65 or over.
Conclusion
Terrace Heights is a small unincorporated community located in Yakima County, Washington. It was first settled in the late 1800s and was incorporated as a town in 1959. The area is primarily agricultural, with orchards and vineyards providing the majority of the jobs in the area. The population of Terrace Heights was 1,845 at the 2010 census, and the median household income was $45,938. The town is a primarily residential community, with most of its residents commuting to nearby cities for work.
Common Questions
What is the Total Population of Terrace Heights?
Total Population of Terrace Heights is 9,781.
What is the Total Male Population of Terrace Heights?
Total Male Population of Terrace Heights is 5,030.
What is the Total Female Population of Terrace Heights?
Total Female Population of Terrace Heights is 4,751.
What is the Ratio of Males per 100 Females in Terrace Heights?
There are 105.87 Males per 100 Females in Terrace Heights.
What is the Ratio of Females per 100 Males in Terrace Heights?
There are 94.45 Females per 100 Males in Terrace Heights.
What is the Median Population Age in Terrace Heights?
Median Population Age in Terrace Heights is 37.8 Years.
What is the Average Family Size in Terrace Heights
Average Family Size in Terrace Heights is 3.0 People.
What is the Average Household Size in Terrace Heights
Average Household Size in Terrace Heights is 2.4 People.
What is Per Capita Income in Terrace Heights?
Per Capita income in Terrace Heights is $38,173.
What is the Median Family Income in Terrace Heights?
Median Family Income in Terrace Heights is $100,188.
What is the Median Household income in Terrace Heights?
Median Household Income in Terrace Heights is $79,608.
What is Income or Wage Gap in Terrace Heights?
Income or Wage Gap in Terrace Heights is 42.3%.
Women in Terrace Heights earn 57.7 cents for every dollar earned by a man.
What is Inequality or Gini Index in Terrace Heights?
Inequality or Gini Index in Terrace Heights is 0.39.
How Large is the Labor Force in Terrace Heights?
There are 4,944 People in the Labor Forcein in Terrace Heights.
What is the Percentage of People in the Labor Force in Terrace Heights?
61.8% of People are in the Labor Force in Terrace Heights.
What is the Unemployment Rate in Terrace Heights?
Unemployment Rate in Terrace Heights is 1.5%.