Romanian vs Immigrants from the Azores Unemployment Among Women with Children Ages 6 to 17 years
COMPARE
Romanian
Immigrants from the Azores
Unemployment Among Women with Children Ages 6 to 17 years
Unemployment Among Women with Children Ages 6 to 17 years Comparison
Romanians
Immigrants from the Azores
8.6%
UNEMPLOYMENT AMONG WOMEN WITH CHILDREN AGES 6 TO 17 YEARS
97.1/ 100
METRIC RATING
112th/ 347
METRIC RANK
9.3%
UNEMPLOYMENT AMONG WOMEN WITH CHILDREN AGES 6 TO 17 YEARS
4.6/ 100
METRIC RATING
226th/ 347
METRIC RANK
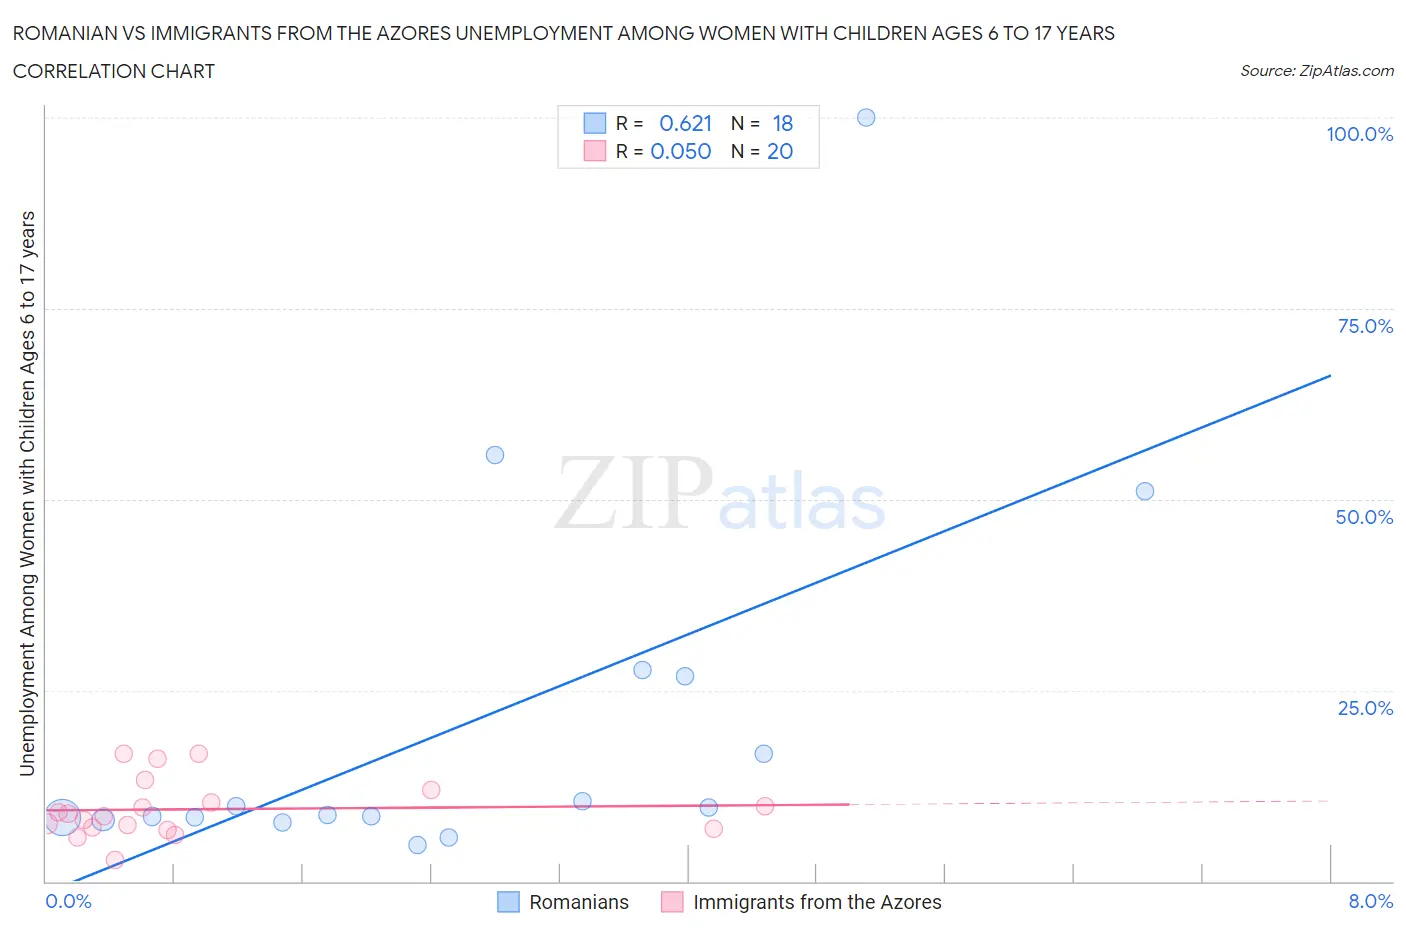
Romanian vs Immigrants from the Azores Unemployment Among Women with Children Ages 6 to 17 years Correlation Chart
The statistical analysis conducted on geographies consisting of 267,762,836 people shows a significant positive correlation between the proportion of Romanians and unemployment rate among women with children between the ages 6 and 17 in the United States with a correlation coefficient (R) of 0.621 and weighted average of 8.6%. Similarly, the statistical analysis conducted on geographies consisting of 39,080,392 people shows no correlation between the proportion of Immigrants from the Azores and unemployment rate among women with children between the ages 6 and 17 in the United States with a correlation coefficient (R) of 0.050 and weighted average of 9.3%, a difference of 7.6%.
Unemployment Among Women with Children Ages 6 to 17 years Correlation Summary
| Measurement | Romanian | Immigrants from the Azores |
| Minimum | 4.8% | 2.7% |
| Maximum | 100.0% | 16.7% |
| Range | 95.2% | 14.0% |
| Mean | 20.9% | 9.4% |
| Median | 9.2% | 8.6% |
| Interquartile 25% (IQ1) | 8.4% | 6.9% |
| Interquartile 75% (IQ3) | 26.8% | 11.1% |
| Interquartile Range (IQR) | 18.5% | 4.2% |
| Standard Deviation (Sample) | 24.8% | 3.8% |
| Standard Deviation (Population) | 24.1% | 3.7% |
Similar Demographics by Unemployment Among Women with Children Ages 6 to 17 years
Demographics Similar to Romanians by Unemployment Among Women with Children Ages 6 to 17 years
In terms of unemployment among women with children ages 6 to 17 years, the demographic groups most similar to Romanians are Immigrants from Ukraine (8.6%, a difference of 0.12%), Latvian (8.6%, a difference of 0.13%), Immigrants from Romania (8.6%, a difference of 0.14%), Eastern European (8.6%, a difference of 0.15%), and Immigrants from Russia (8.6%, a difference of 0.16%).
| Demographics | Rating | Rank | Unemployment Among Women with Children Ages 6 to 17 years |
| Immigrants | Norway | 97.8 /100 | #105 | Exceptional 8.6% |
| Immigrants | Serbia | 97.7 /100 | #106 | Exceptional 8.6% |
| Chickasaw | 97.6 /100 | #107 | Exceptional 8.6% |
| Swedes | 97.6 /100 | #108 | Exceptional 8.6% |
| Immigrants | Romania | 97.5 /100 | #109 | Exceptional 8.6% |
| Latvians | 97.4 /100 | #110 | Exceptional 8.6% |
| Immigrants | Ukraine | 97.4 /100 | #111 | Exceptional 8.6% |
| Romanians | 97.1 /100 | #112 | Exceptional 8.6% |
| Eastern Europeans | 96.8 /100 | #113 | Exceptional 8.6% |
| Immigrants | Russia | 96.7 /100 | #114 | Exceptional 8.6% |
| Argentineans | 96.5 /100 | #115 | Exceptional 8.6% |
| Zimbabweans | 96.3 /100 | #116 | Exceptional 8.6% |
| Albanians | 96.3 /100 | #117 | Exceptional 8.6% |
| Pueblo | 96.2 /100 | #118 | Exceptional 8.6% |
| Immigrants | Grenada | 96.2 /100 | #119 | Exceptional 8.6% |
Demographics Similar to Immigrants from the Azores by Unemployment Among Women with Children Ages 6 to 17 years
In terms of unemployment among women with children ages 6 to 17 years, the demographic groups most similar to Immigrants from the Azores are Panamanian (9.3%, a difference of 0.020%), Estonian (9.3%, a difference of 0.050%), Lumbee (9.3%, a difference of 0.080%), Chinese (9.3%, a difference of 0.14%), and Immigrants from El Salvador (9.3%, a difference of 0.15%).
| Demographics | Rating | Rank | Unemployment Among Women with Children Ages 6 to 17 years |
| Immigrants | Scotland | 6.6 /100 | #219 | Tragic 9.2% |
| Belgians | 6.4 /100 | #220 | Tragic 9.2% |
| Crow | 5.8 /100 | #221 | Tragic 9.2% |
| Immigrants | Southern Europe | 5.8 /100 | #222 | Tragic 9.2% |
| Immigrants | Eritrea | 5.8 /100 | #223 | Tragic 9.2% |
| Immigrants | El Salvador | 5.3 /100 | #224 | Tragic 9.3% |
| Chinese | 5.2 /100 | #225 | Tragic 9.3% |
| Immigrants | Azores | 4.6 /100 | #226 | Tragic 9.3% |
| Panamanians | 4.5 /100 | #227 | Tragic 9.3% |
| Estonians | 4.4 /100 | #228 | Tragic 9.3% |
| Lumbee | 4.3 /100 | #229 | Tragic 9.3% |
| Welsh | 4.0 /100 | #230 | Tragic 9.3% |
| Macedonians | 3.9 /100 | #231 | Tragic 9.3% |
| French American Indians | 3.7 /100 | #232 | Tragic 9.3% |
| Immigrants | St. Vincent and the Grenadines | 3.3 /100 | #233 | Tragic 9.3% |