South Padre Island, TX
South Padre Island Map
South Padre Island Overview
2,386
TOTAL POPULATION
1,373
MALE POPULATION
1,013
FEMALE POPULATION
135.54
MALES / 100 FEMALES
73.78
FEMALES / 100 MALES
58.5
MEDIAN AGE
2.3
AVG FAMILY SIZE
1.9
AVG HOUSEHOLD SIZE
$52,745
PER CAPITA INCOME
$82,701
AVG FAMILY INCOME
$62,557
AVG HOUSEHOLD INCOME
3.1%
WAGE / INCOME GAP [ % ]
96.9¢/ $1
WAGE / INCOME GAP [ $ ]
0.48
INEQUALITY / GINI INDEX
1,416
LABOR FORCE [ PEOPLE ]
65.6%
PERCENT IN LABOR FORCE
3.4%
UNEMPLOYMENT RATE
South Padre Island Zip Codes
South Padre Island Area Codes
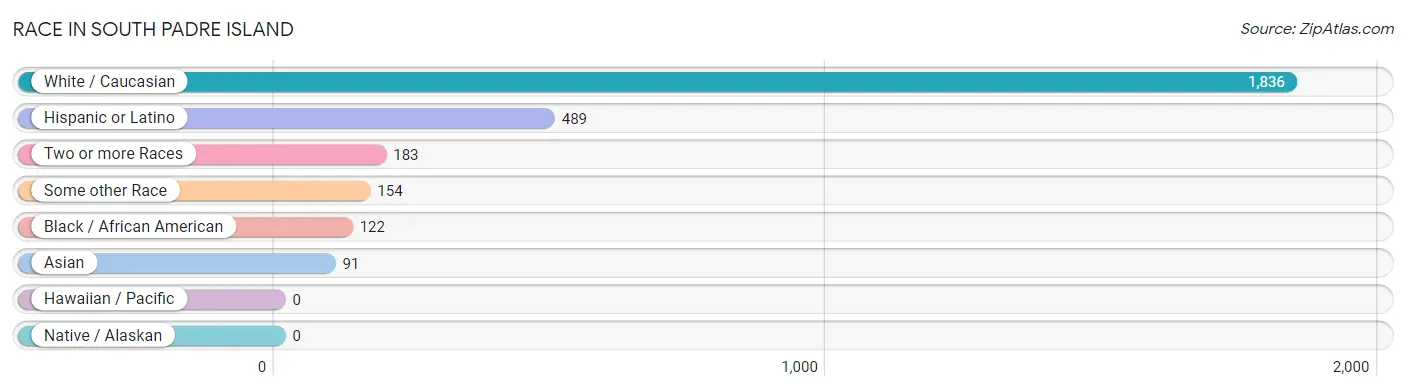
Race in South Padre Island
The most populous races in South Padre Island are White / Caucasian (1,836 | 76.9%), Hispanic or Latino (489 | 20.5%), and Two or more Races (183 | 7.7%).
| Race | # Population | % Population |
| Asian | 91 | 3.8% |
| Black / African American | 122 | 5.1% |
| Hawaiian / Pacific | 0 | 0.0% |
| Hispanic or Latino | 489 | 20.5% |
| Native / Alaskan | 0 | 0.0% |
| White / Caucasian | 1,836 | 76.9% |
| Two or more Races | 183 | 7.7% |
| Some other Race | 154 | 6.5% |
| Total | 2,386 | 100.0% |
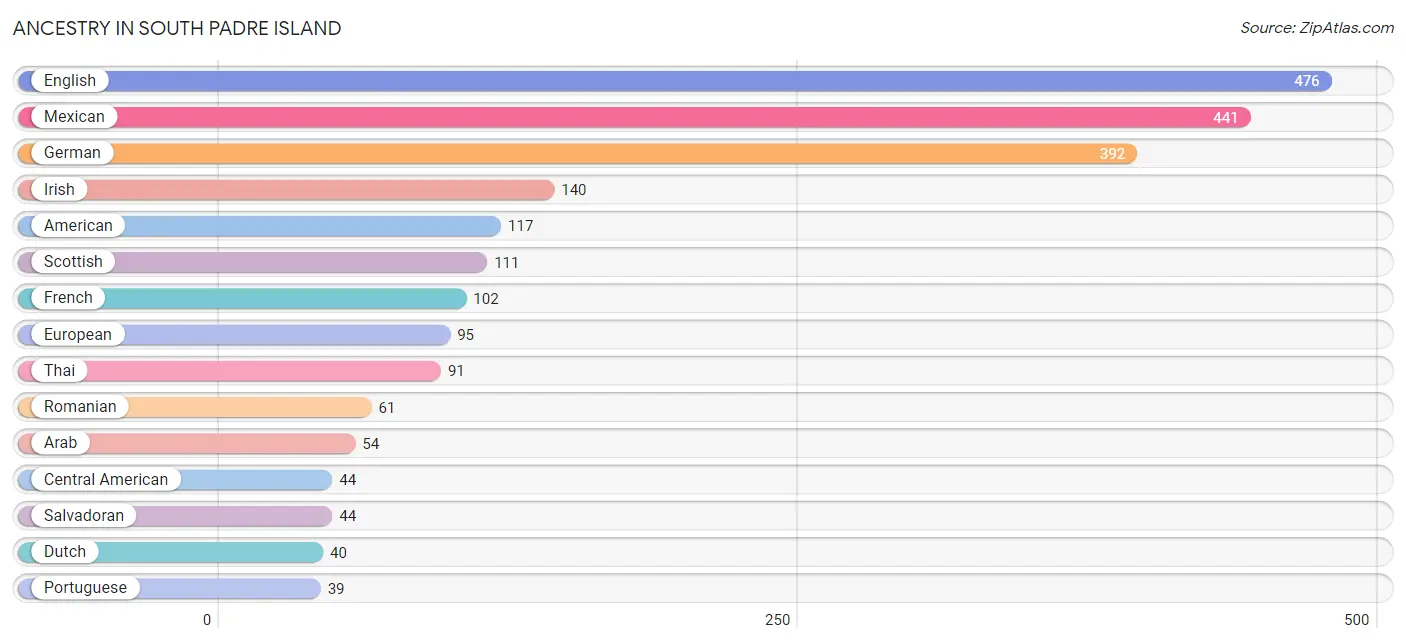
Ancestry in South Padre Island
The most populous ancestries reported in South Padre Island are English (476 | 20.0%), Mexican (441 | 18.5%), German (392 | 16.4%), Irish (140 | 5.9%), and American (117 | 4.9%), together accounting for 65.6% of all South Padre Island residents.
| Ancestry | # Population | % Population |
| American | 117 | 4.9% |
| Arab | 54 | 2.3% |
| Central American | 44 | 1.8% |
| Danish | 10 | 0.4% |
| Dutch | 40 | 1.7% |
| English | 476 | 20.0% |
| European | 95 | 4.0% |
| French | 102 | 4.3% |
| German | 392 | 16.4% |
| Irish | 140 | 5.9% |
| Italian | 10 | 0.4% |
| Mexican | 441 | 18.5% |
| Portuguese | 39 | 1.6% |
| Romanian | 61 | 2.6% |
| Salvadoran | 44 | 1.8% |
| Scottish | 111 | 4.6% |
| Swedish | 33 | 1.4% |
| Thai | 91 | 3.8% |
| Welsh | 10 | 0.4% | View All 19 Rows |
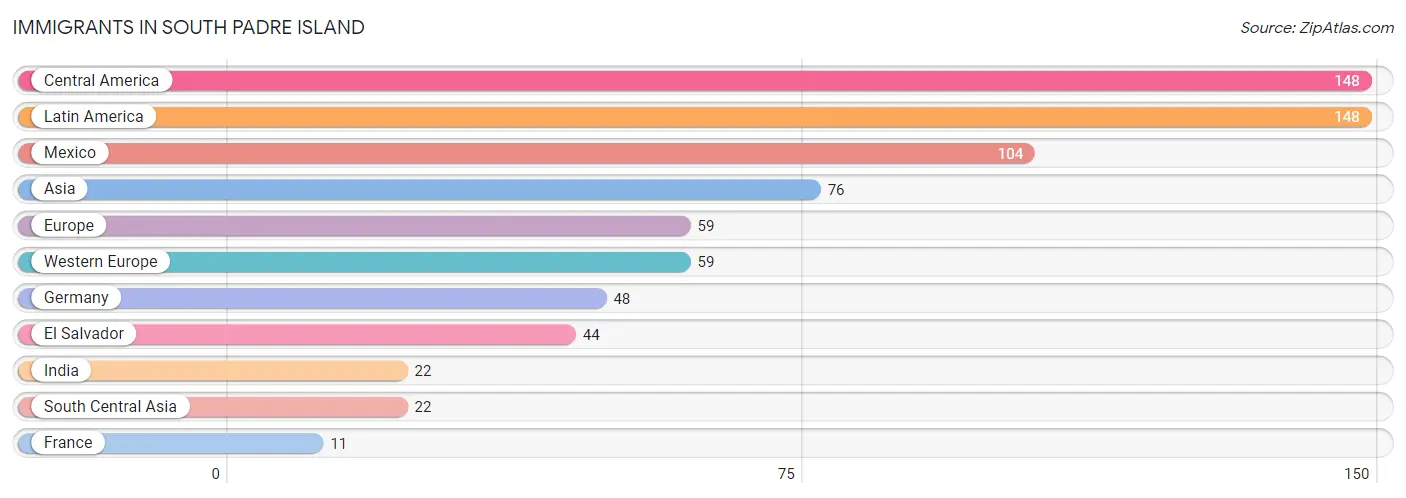
Immigrants in South Padre Island
The most numerous immigrant groups reported in South Padre Island came from Central America (148 | 6.2%), Latin America (148 | 6.2%), Mexico (104 | 4.4%), Asia (76 | 3.2%), and Europe (59 | 2.5%), together accounting for 22.4% of all South Padre Island residents.
| Immigration Origin | # Population | % Population |
| Asia | 76 | 3.2% |
| Central America | 148 | 6.2% |
| El Salvador | 44 | 1.8% |
| Europe | 59 | 2.5% |
| France | 11 | 0.5% |
| Germany | 48 | 2.0% |
| India | 22 | 0.9% |
| Latin America | 148 | 6.2% |
| Mexico | 104 | 4.4% |
| South Central Asia | 22 | 0.9% |
| Western Europe | 59 | 2.5% | View All 11 Rows |
Sex and Age in South Padre Island
Sex and Age in South Padre Island
The most populous age groups in South Padre Island are 55 to 59 Years (241 | 17.5%) for men and 55 to 59 Years (262 | 25.9%) for women.
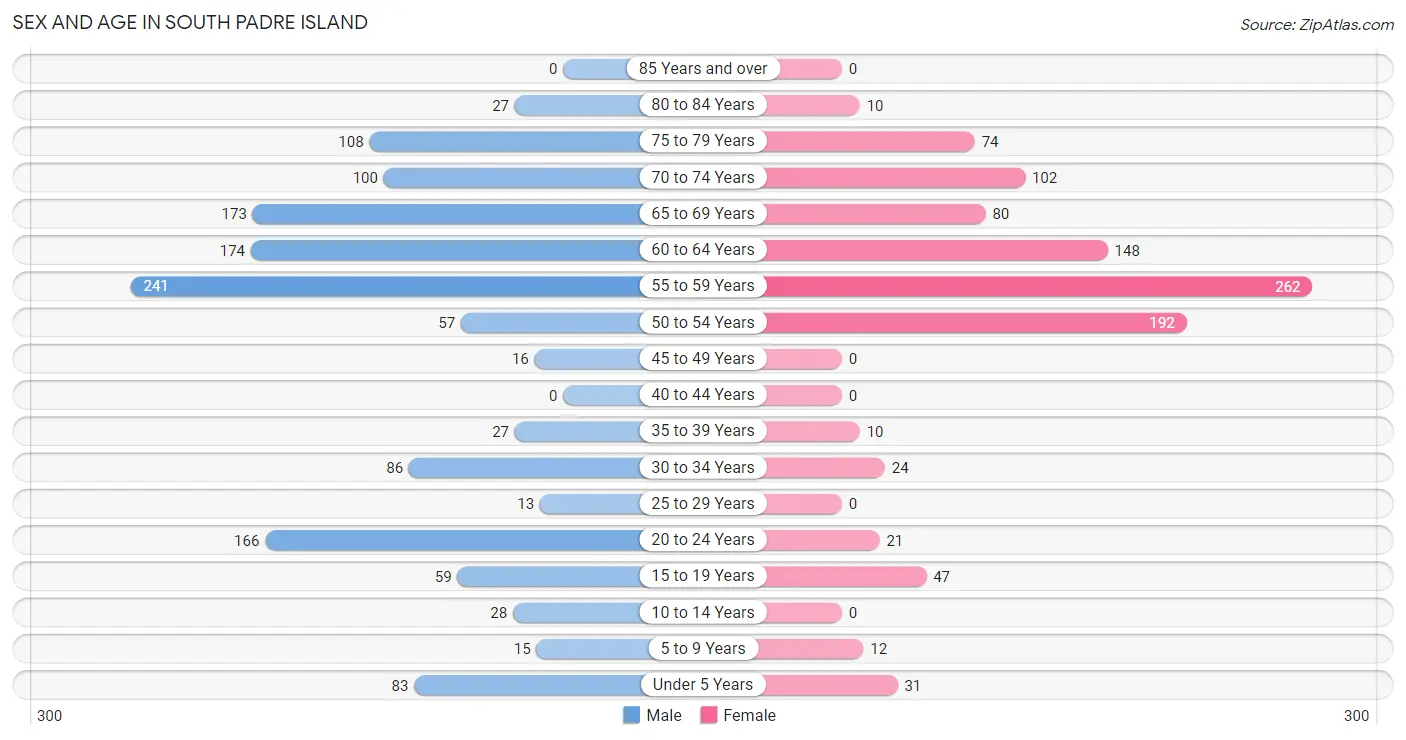
| Age Bracket | Male | Female |
| Under 5 Years | 83 (6.0%) | 31 (3.1%) |
| 5 to 9 Years | 15 (1.1%) | 12 (1.2%) |
| 10 to 14 Years | 28 (2.0%) | 0 (0.0%) |
| 15 to 19 Years | 59 (4.3%) | 47 (4.6%) |
| 20 to 24 Years | 166 (12.1%) | 21 (2.1%) |
| 25 to 29 Years | 13 (0.9%) | 0 (0.0%) |
| 30 to 34 Years | 86 (6.3%) | 24 (2.4%) |
| 35 to 39 Years | 27 (2.0%) | 10 (1.0%) |
| 40 to 44 Years | 0 (0.0%) | 0 (0.0%) |
| 45 to 49 Years | 16 (1.2%) | 0 (0.0%) |
| 50 to 54 Years | 57 (4.2%) | 192 (19.0%) |
| 55 to 59 Years | 241 (17.5%) | 262 (25.9%) |
| 60 to 64 Years | 174 (12.7%) | 148 (14.6%) |
| 65 to 69 Years | 173 (12.6%) | 80 (7.9%) |
| 70 to 74 Years | 100 (7.3%) | 102 (10.1%) |
| 75 to 79 Years | 108 (7.9%) | 74 (7.3%) |
| 80 to 84 Years | 27 (2.0%) | 10 (1.0%) |
| 85 Years and over | 0 (0.0%) | 0 (0.0%) |
| Total | 1,373 (100.0%) | 1,013 (100.0%) |
Families and Households in South Padre Island
Median Family Size in South Padre Island
The median family size in South Padre Island is 2.27 persons per family, with single female/mother families (100 | 13.5%) accounting for the largest median family size of 3.21 persons per family. On the other hand, single male/father families (86 | 11.6%) represent the smallest median family size with 1.51 persons per family.
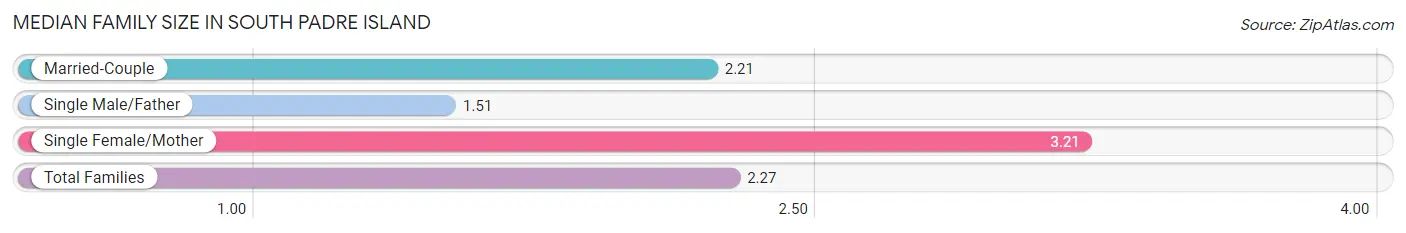
| Family Type | # Families | Family Size |
| Married-Couple | 555 (74.9%) | 2.21 |
| Single Male/Father | 86 (11.6%) | 1.51 |
| Single Female/Mother | 100 (13.5%) | 3.21 |
| Total Families | 741 (100.0%) | 2.27 |
Median Household Size in South Padre Island
The median household size in South Padre Island is 1.93 persons per household, with single female/mother households (100 | 8.1%) accounting for the largest median household size of 3.59 persons per household. non-family households (492 | 39.9%) represent the smallest median household size with 1.04 persons per household.
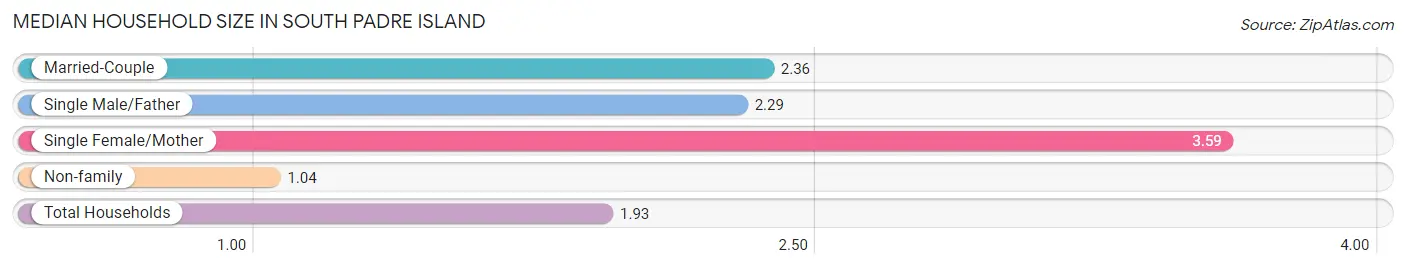
| Household Type | # Households | Household Size |
| Married-Couple | 555 (45.0%) | 2.36 |
| Single Male/Father | 86 (7.0%) | 2.29 |
| Single Female/Mother | 100 (8.1%) | 3.59 |
| Non-family | 492 (39.9%) | 1.04 |
| Total Households | 1,233 (100.0%) | 1.93 |
Household Size by Marriage Status in South Padre Island
Out of a total of 1,233 households in South Padre Island, 741 (60.1%) are family households, while 492 (39.9%) are nonfamily households. The most numerous type of family households are 2-person households, comprising 420, and the most common type of nonfamily households are 1-person households, comprising 467.
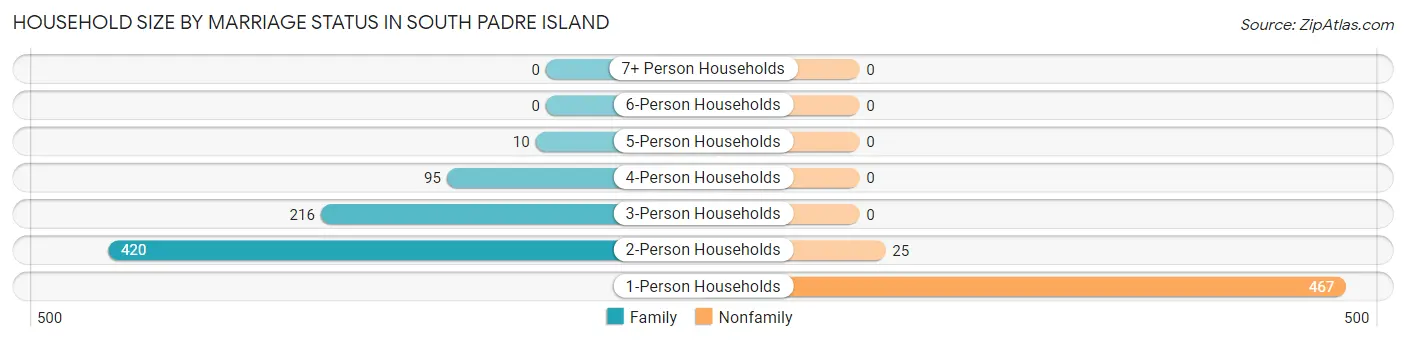
| Household Size | Family Households | Nonfamily Households |
| 1-Person Households | - | 467 (37.9%) |
| 2-Person Households | 420 (34.1%) | 25 (2.0%) |
| 3-Person Households | 216 (17.5%) | 0 (0.0%) |
| 4-Person Households | 95 (7.7%) | 0 (0.0%) |
| 5-Person Households | 10 (0.8%) | 0 (0.0%) |
| 6-Person Households | 0 (0.0%) | 0 (0.0%) |
| 7+ Person Households | 0 (0.0%) | 0 (0.0%) |
| Total | 741 (60.1%) | 492 (39.9%) |
Female Fertility in South Padre Island
Fertility by Age in South Padre Island
Average fertility rate in South Padre Island is 174.0 births per 1,000 women. Women in the age bracket of 20 to 34 years have the highest fertility rate with 533.0 births per 1,000 women. Women in the age bracket of 20 to 34 years acount for 100.0% of all women with births.
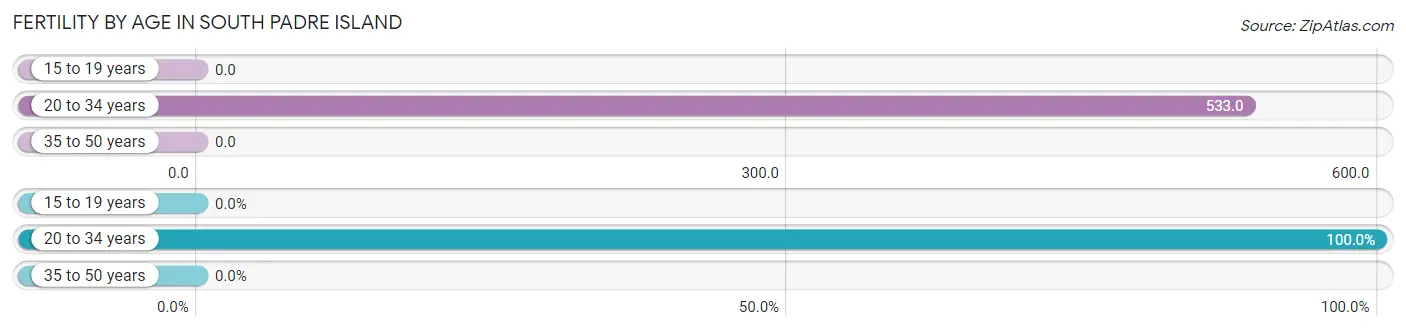
| Age Bracket | Women with Births | Births / 1,000 Women |
| 15 to 19 years | 0 (0.0%) | 0.0 |
| 20 to 34 years | 24 (100.0%) | 533.0 |
| 35 to 50 years | 0 (0.0%) | 0.0 |
| Total | 24 (100.0%) | 174.0 |
Fertility by Age by Marriage Status in South Padre Island
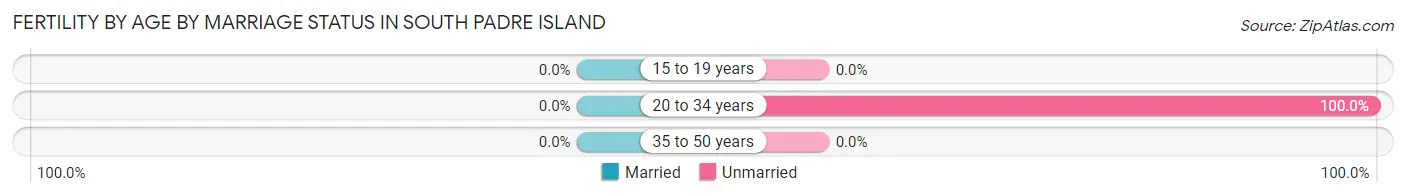
| Age Bracket | Married | Unmarried |
| 15 to 19 years | 0 (0.0%) | 0 (0.0%) |
| 20 to 34 years | 0 (0.0%) | 24 (100.0%) |
| 35 to 50 years | 0 (0.0%) | 0 (0.0%) |
| Total | 0 (0.0%) | 24 (100.0%) |
Fertility by Education in South Padre Island
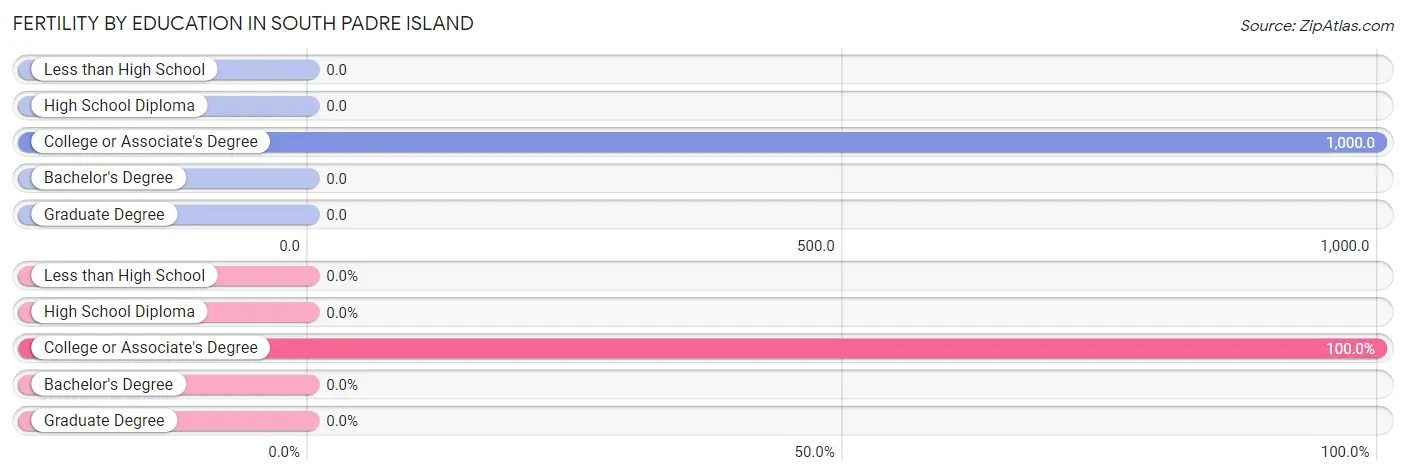
| Educational Attainment | Women with Births | Births / 1,000 Women |
| Less than High School | 0 (0.0%) | 0.0 |
| High School Diploma | 0 (0.0%) | 0.0 |
| College or Associate's Degree | 24 (100.0%) | 1,000.0 |
| Bachelor's Degree | 0 (0.0%) | 0.0 |
| Graduate Degree | 0 (0.0%) | 0.0 |
| Total | 24 (100.0%) | 174.0 |
Fertility by Education by Marriage Status in South Padre Island
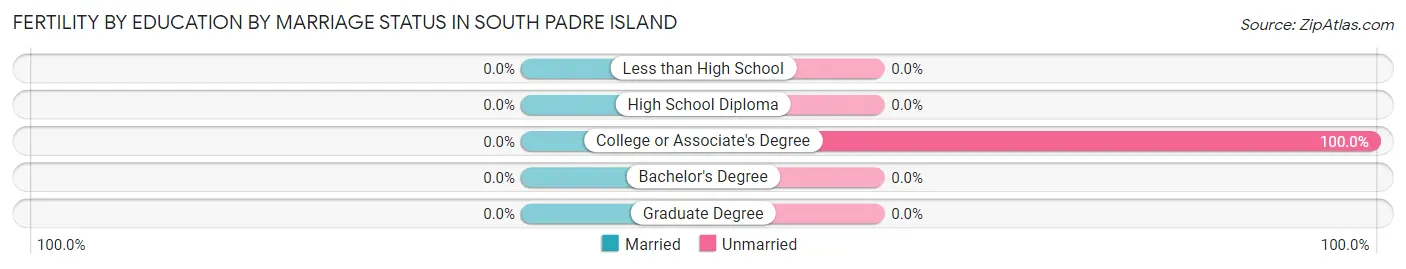
| Educational Attainment | Married | Unmarried |
| Less than High School | 0 (0.0%) | 0 (0.0%) |
| High School Diploma | 0 (0.0%) | 0 (0.0%) |
| College or Associate's Degree | 0 (0.0%) | 24 (100.0%) |
| Bachelor's Degree | 0 (0.0%) | 0 (0.0%) |
| Graduate Degree | 0 (0.0%) | 0 (0.0%) |
| Total | 0 (0.0%) | 24 (100.0%) |
Income in South Padre Island
Income Overview in South Padre Island
Per Capita Income in South Padre Island is $52,745, while median incomes of families and households are $82,701 and $62,557 respectively.
| Characteristic | Number | Measure |
| Per Capita Income | 2,386 | $52,745 |
| Median Family Income | 741 | $82,701 |
| Mean Family Income | 741 | $117,967 |
| Median Household Income | 1,233 | $62,557 |
| Mean Household Income | 1,233 | $103,547 |
| Income Deficit | 741 | $0 |
| Wage / Income Gap (%) | 2,386 | 3.08% |
| Wage / Income Gap ($) | 2,386 | 96.92¢ per $1 |
| Gini / Inequality Index | 2,386 | 0.48 |
Earnings by Sex in South Padre Island
Average Earnings in South Padre Island are $35,914, $34,844 for men and $35,951 for women, a difference of 3.1%.
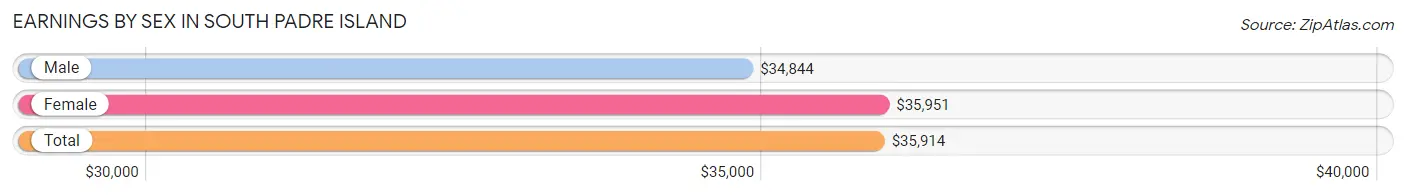
| Sex | Number | Average Earnings |
| Male | 812 (57.6%) | $34,844 |
| Female | 597 (42.4%) | $35,951 |
| Total | 1,409 (100.0%) | $35,914 |
Earnings by Sex by Income Bracket in South Padre Island
The most common earnings brackets in South Padre Island are $2,500 to $4,999 for men (130 | 16.0%) and $100,000+ for women (119 | 19.9%).
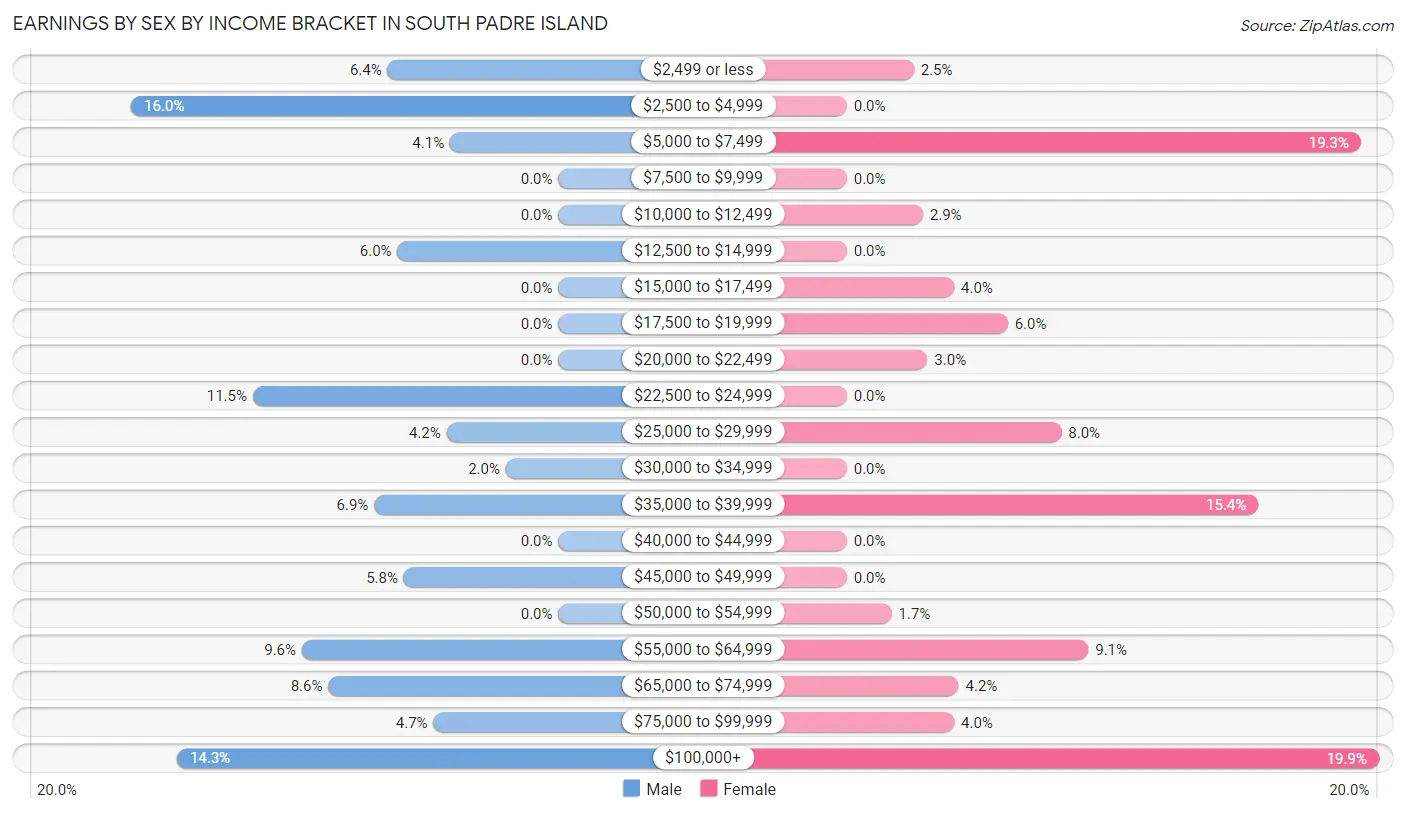
| Income | Male | Female |
| $2,499 or less | 52 (6.4%) | 15 (2.5%) |
| $2,500 to $4,999 | 130 (16.0%) | 0 (0.0%) |
| $5,000 to $7,499 | 33 (4.1%) | 115 (19.3%) |
| $7,500 to $9,999 | 0 (0.0%) | 0 (0.0%) |
| $10,000 to $12,499 | 0 (0.0%) | 17 (2.9%) |
| $12,500 to $14,999 | 49 (6.0%) | 0 (0.0%) |
| $15,000 to $17,499 | 0 (0.0%) | 24 (4.0%) |
| $17,500 to $19,999 | 0 (0.0%) | 36 (6.0%) |
| $20,000 to $22,499 | 0 (0.0%) | 18 (3.0%) |
| $22,500 to $24,999 | 93 (11.5%) | 0 (0.0%) |
| $25,000 to $29,999 | 34 (4.2%) | 48 (8.0%) |
| $30,000 to $34,999 | 16 (2.0%) | 0 (0.0%) |
| $35,000 to $39,999 | 56 (6.9%) | 92 (15.4%) |
| $40,000 to $44,999 | 0 (0.0%) | 0 (0.0%) |
| $45,000 to $49,999 | 47 (5.8%) | 0 (0.0%) |
| $50,000 to $54,999 | 0 (0.0%) | 10 (1.7%) |
| $55,000 to $64,999 | 78 (9.6%) | 54 (9.0%) |
| $65,000 to $74,999 | 70 (8.6%) | 25 (4.2%) |
| $75,000 to $99,999 | 38 (4.7%) | 24 (4.0%) |
| $100,000+ | 116 (14.3%) | 119 (19.9%) |
| Total | 812 (100.0%) | 597 (100.0%) |
Earnings by Sex by Educational Attainment in South Padre Island
Average earnings in South Padre Island are $38,304 for men and $37,146 for women, a difference of 3.0%. Men with an educational attainment of graduate degree enjoy the highest average annual earnings of $221,765, while those with graduate degree education earn the least with $221,765. Women with an educational attainment of graduate degree earn the most with the average annual earnings of $56,927, while those with less than high school education have the smallest earnings of $6,523.
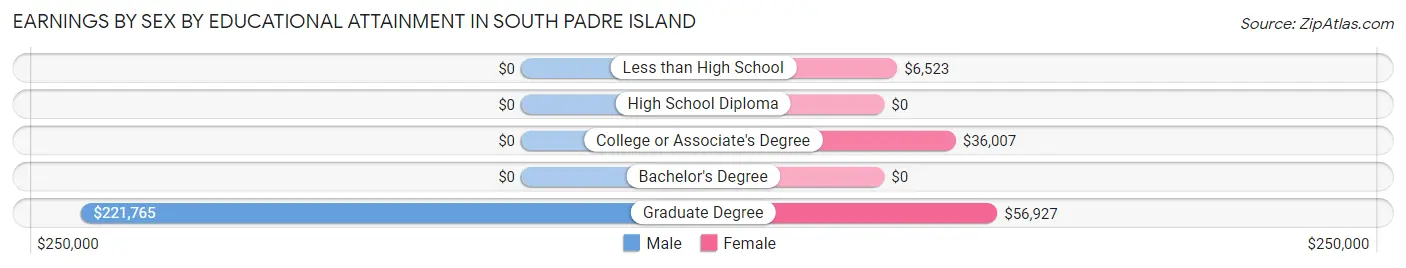
| Educational Attainment | Male Income | Female Income |
| Less than High School | - | - |
| High School Diploma | - | - |
| College or Associate's Degree | - | - |
| Bachelor's Degree | - | - |
| Graduate Degree | $221,765 | $56,927 |
| Total | $38,304 | $37,146 |
Family Income in South Padre Island
Family Income Brackets in South Padre Island
According to the South Padre Island family income data, there are 154 families falling into the $200,000+ income range, which is the most common income bracket and makes up 20.8% of all families.
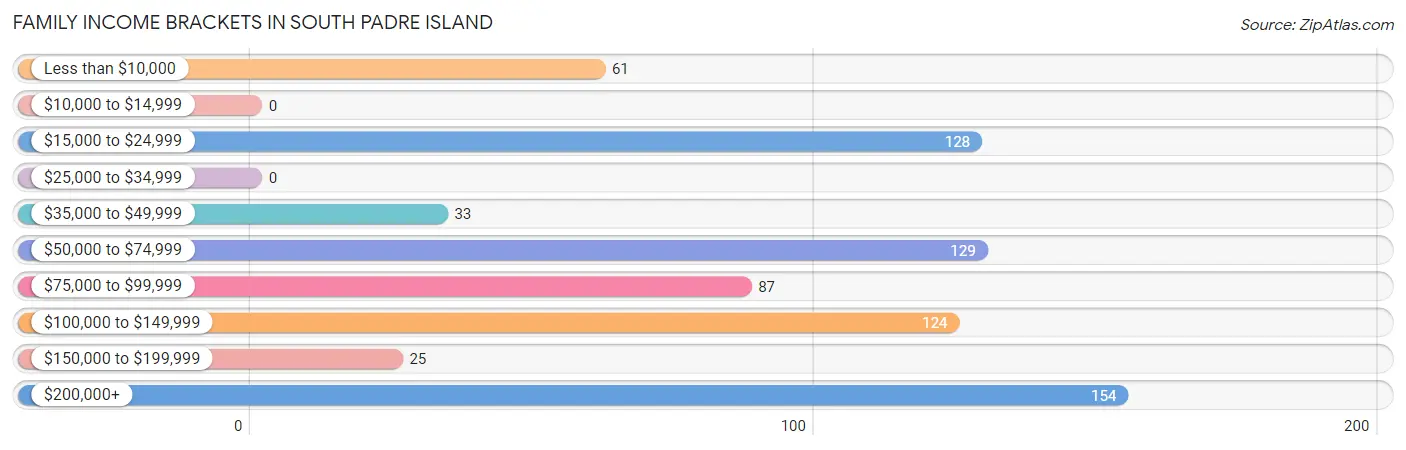
| Income Bracket | # Families | % Families |
| Less than $10,000 | 61 | 8.2% |
| $10,000 to $14,999 | 0 | 0.0% |
| $15,000 to $24,999 | 128 | 17.3% |
| $25,000 to $34,999 | 0 | 0.0% |
| $35,000 to $49,999 | 33 | 4.5% |
| $50,000 to $74,999 | 129 | 17.4% |
| $75,000 to $99,999 | 87 | 11.7% |
| $100,000 to $149,999 | 124 | 16.7% |
| $150,000 to $199,999 | 25 | 3.4% |
| $200,000+ | 154 | 20.8% |
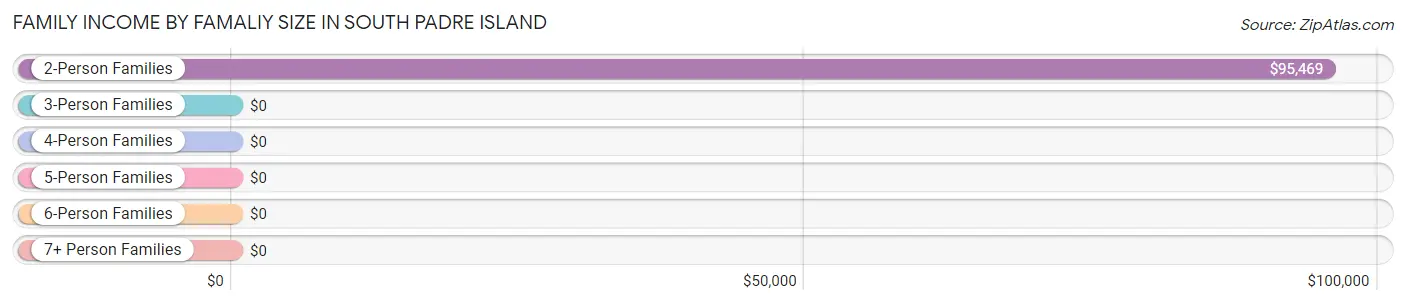
Family Income by Famaliy Size in South Padre Island
2-person families (580 | 78.3%) account for the highest median family income in South Padre Island with $95,469 per family, while 2-person families (580 | 78.3%) have the highest median income of $47,734 per family member.
| Income Bracket | # Families | Median Income |
| 2-Person Families | 580 (78.3%) | $95,469 |
| 3-Person Families | 127 (17.1%) | $0 |
| 4-Person Families | 24 (3.2%) | $0 |
| 5-Person Families | 10 (1.3%) | $0 |
| 6-Person Families | 0 (0.0%) | $0 |
| 7+ Person Families | 0 (0.0%) | $0 |
| Total | 741 (100.0%) | $82,701 |
Family Income by Number of Earners in South Padre Island
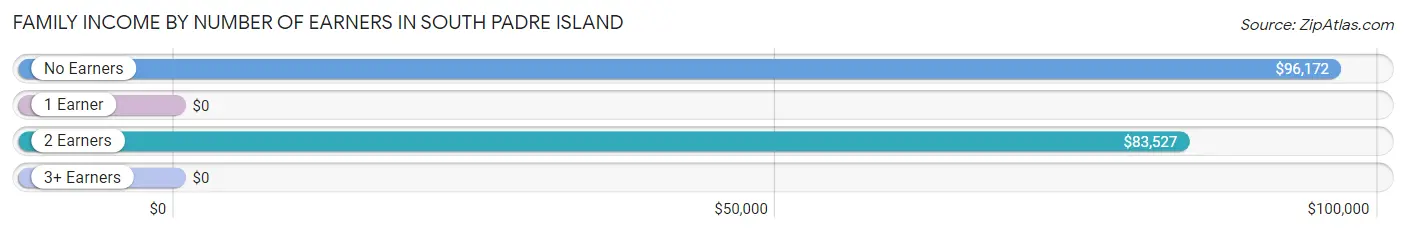
| Number of Earners | # Families | Median Income |
| No Earners | 159 (21.5%) | $96,172 |
| 1 Earner | 238 (32.1%) | $0 |
| 2 Earners | 344 (46.4%) | $83,527 |
| 3+ Earners | 0 (0.0%) | $0 |
| Total | 741 (100.0%) | $82,701 |
Household Income in South Padre Island
Household Income Brackets in South Padre Island
With 358 households falling in the category, the $50,000 to $74,999 income range is the most frequent in South Padre Island, accounting for 29.0% of all households.
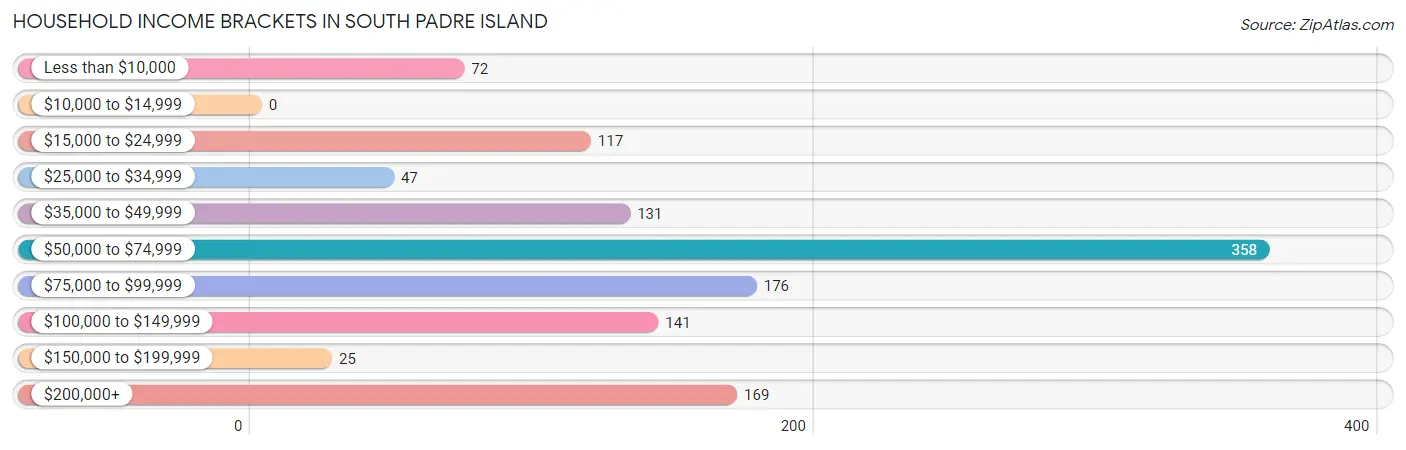
| Income Bracket | # Households | % Households |
| Less than $10,000 | 72 | 5.8% |
| $10,000 to $14,999 | 0 | 0.0% |
| $15,000 to $24,999 | 117 | 9.5% |
| $25,000 to $34,999 | 47 | 3.8% |
| $35,000 to $49,999 | 131 | 10.6% |
| $50,000 to $74,999 | 358 | 29.0% |
| $75,000 to $99,999 | 176 | 14.3% |
| $100,000 to $149,999 | 141 | 11.4% |
| $150,000 to $199,999 | 25 | 2.0% |
| $200,000+ | 169 | 13.7% |
Household Income by Householder Age in South Padre Island
The median household income in South Padre Island is $62,557, with the highest median household income of $88,460 found in the 45 to 64 years age bracket for the primary householder. A total of 603 households (48.9%) fall into this category. Meanwhile, the 15 to 24 years age bracket for the primary householder has the lowest median household income of $0, with 62 households (5.0%) in this group.
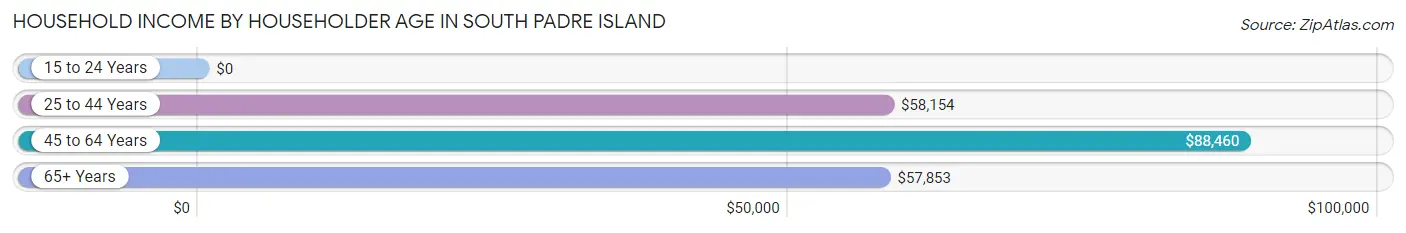
| Income Bracket | # Households | Median Income |
| 15 to 24 Years | 62 (5.0%) | $0 |
| 25 to 44 Years | 147 (11.9%) | $58,154 |
| 45 to 64 Years | 603 (48.9%) | $88,460 |
| 65+ Years | 421 (34.1%) | $57,853 |
| Total | 1,233 (100.0%) | $62,557 |
Poverty in South Padre Island
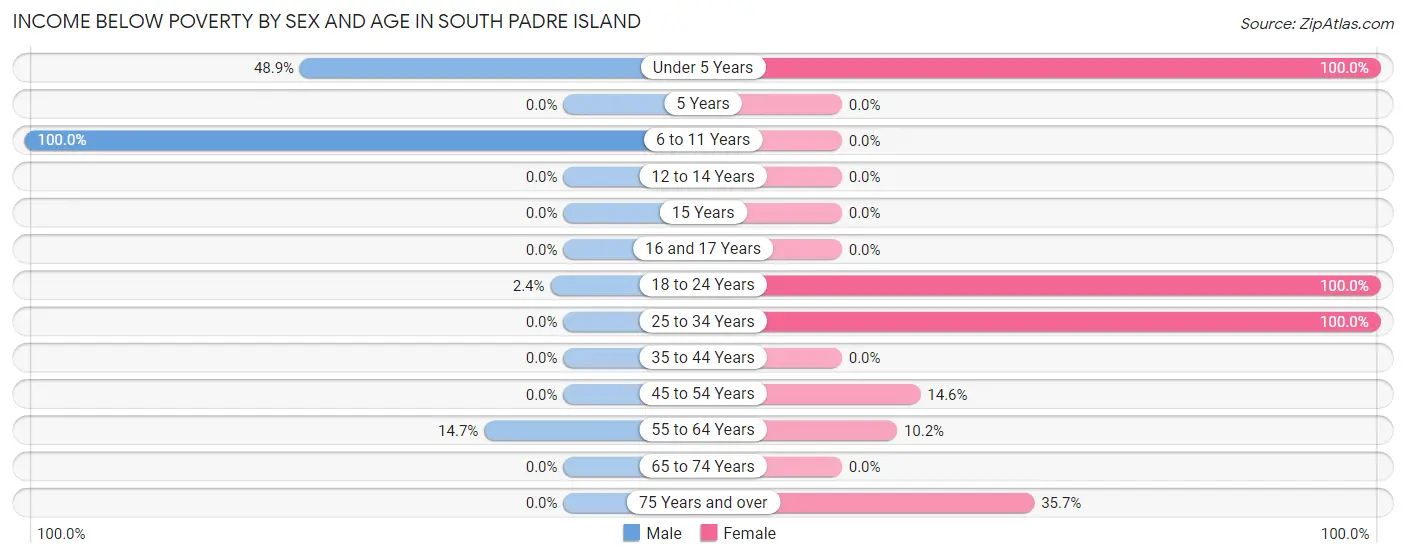
Income Below Poverty by Sex and Age in South Padre Island
With 8.6% poverty level for males and 22.0% for females among the residents of South Padre Island, 6 to 11 year old males and under 5 year old females are the most vulnerable to poverty, with 28 males (100.0%) and 31 females (100.0%) in their respective age groups living below the poverty level.
| Age Bracket | Male | Female |
| Under 5 Years | 22 (48.9%) | 31 (100.0%) |
| 5 Years | 0 (0.0%) | 0 (0.0%) |
| 6 to 11 Years | 28 (100.0%) | 0 (0.0%) |
| 12 to 14 Years | 0 (0.0%) | 0 (0.0%) |
| 15 Years | 0 (0.0%) | 0 (0.0%) |
| 16 and 17 Years | 0 (0.0%) | 0 (0.0%) |
| 18 to 24 Years | 4 (2.4%) | 68 (100.0%) |
| 25 to 34 Years | 0 (0.0%) | 24 (100.0%) |
| 35 to 44 Years | 0 (0.0%) | 0 (0.0%) |
| 45 to 54 Years | 0 (0.0%) | 28 (14.6%) |
| 55 to 64 Years | 61 (14.7%) | 42 (10.2%) |
| 65 to 74 Years | 0 (0.0%) | 0 (0.0%) |
| 75 Years and over | 0 (0.0%) | 30 (35.7%) |
| Total | 115 (8.6%) | 223 (22.0%) |
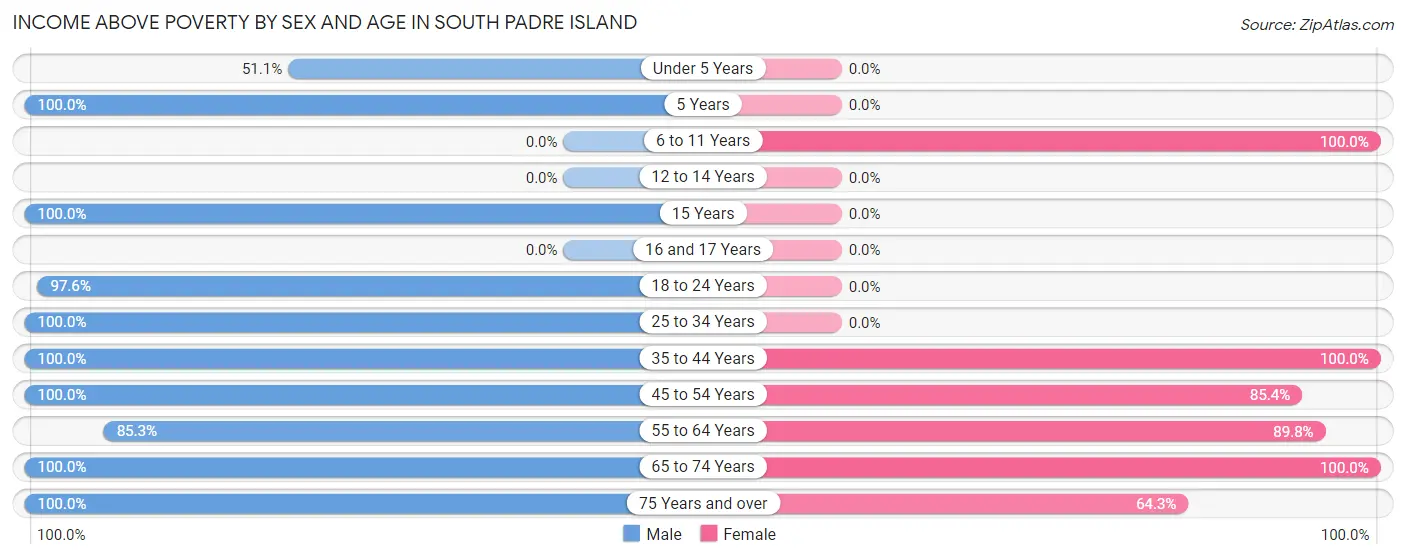
Income Above Poverty by Sex and Age in South Padre Island
According to the poverty statistics in South Padre Island, males aged 5 years and females aged 6 to 11 years are the age groups that are most secure financially, with 100.0% of males and 100.0% of females in these age groups living above the poverty line.
| Age Bracket | Male | Female |
| Under 5 Years | 23 (51.1%) | 0 (0.0%) |
| 5 Years | 15 (100.0%) | 0 (0.0%) |
| 6 to 11 Years | 0 (0.0%) | 12 (100.0%) |
| 12 to 14 Years | 0 (0.0%) | 0 (0.0%) |
| 15 Years | 59 (100.0%) | 0 (0.0%) |
| 16 and 17 Years | 0 (0.0%) | 0 (0.0%) |
| 18 to 24 Years | 162 (97.6%) | 0 (0.0%) |
| 25 to 34 Years | 99 (100.0%) | 0 (0.0%) |
| 35 to 44 Years | 27 (100.0%) | 10 (100.0%) |
| 45 to 54 Years | 73 (100.0%) | 164 (85.4%) |
| 55 to 64 Years | 354 (85.3%) | 368 (89.8%) |
| 65 to 74 Years | 273 (100.0%) | 182 (100.0%) |
| 75 Years and over | 135 (100.0%) | 54 (64.3%) |
| Total | 1,220 (91.4%) | 790 (78.0%) |
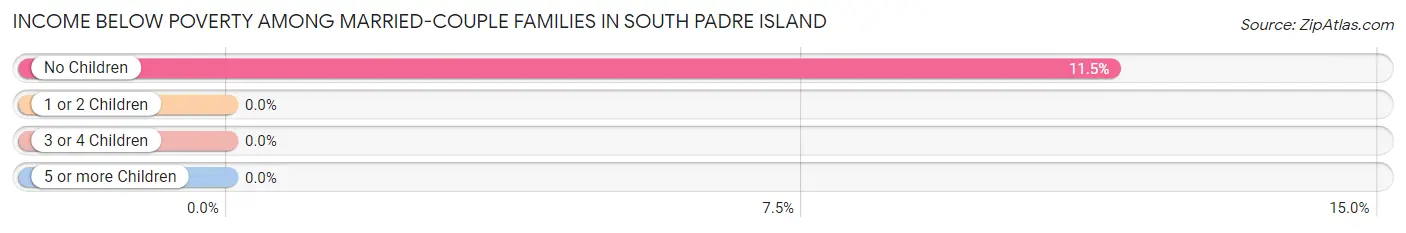
Income Below Poverty Among Married-Couple Families in South Padre Island
The poverty statistics for married-couple families in South Padre Island show that 11.0% or 61 of the total 555 families live below the poverty line. Families with no children have the highest poverty rate of 11.5%, comprising of 61 families. On the other hand, families with 1 or 2 children have the lowest poverty rate of 0.0%, which includes 0 families.
| Children | Above Poverty | Below Poverty |
| No Children | 468 (88.5%) | 61 (11.5%) |
| 1 or 2 Children | 16 (100.0%) | 0 (0.0%) |
| 3 or 4 Children | 10 (100.0%) | 0 (0.0%) |
| 5 or more Children | 0 (0.0%) | 0 (0.0%) |
| Total | 494 (89.0%) | 61 (11.0%) |
Income Below Poverty Among Single-Parent Households in South Padre Island
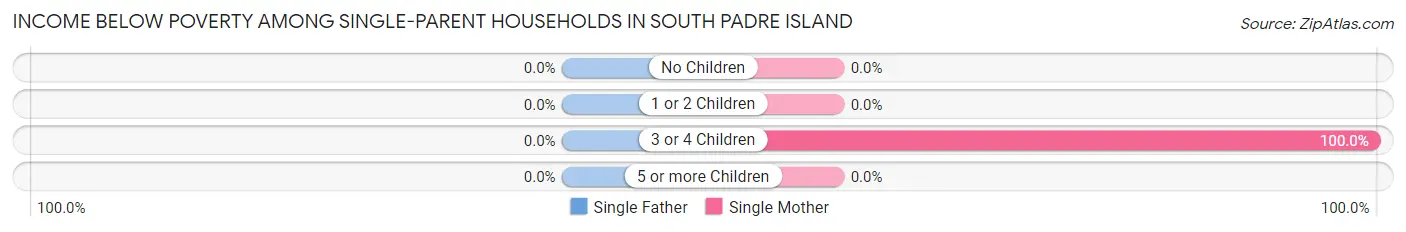
| Children | Single Father | Single Mother |
| No Children | 0 (0.0%) | 0 (0.0%) |
| 1 or 2 Children | 0 (0.0%) | 0 (0.0%) |
| 3 or 4 Children | 0 (0.0%) | 24 (100.0%) |
| 5 or more Children | 0 (0.0%) | 0 (0.0%) |
| Total | 0 (0.0%) | 24 (24.0%) |
Income Below Poverty Among Married-Couple vs Single-Parent Households in South Padre Island
The poverty data for South Padre Island shows that 61 of the married-couple family households (11.0%) and 24 of the single-parent households (12.9%) are living below the poverty level. Within the married-couple family households, those with no children have the highest poverty rate, with 61 households (11.5%) falling below the poverty line. Among the single-parent households, those with 3 or 4 children have the highest poverty rate, with 24 household (100.0%) living below poverty.
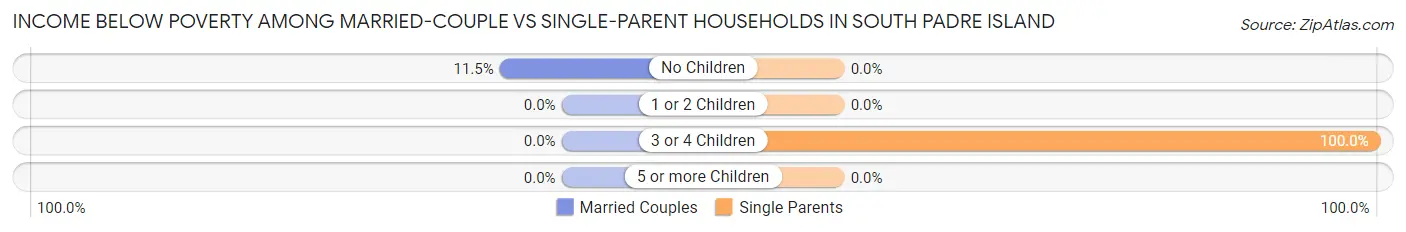
| Children | Married-Couple Families | Single-Parent Households |
| No Children | 61 (11.5%) | 0 (0.0%) |
| 1 or 2 Children | 0 (0.0%) | 0 (0.0%) |
| 3 or 4 Children | 0 (0.0%) | 24 (100.0%) |
| 5 or more Children | 0 (0.0%) | 0 (0.0%) |
| Total | 61 (11.0%) | 24 (12.9%) |
Employment Characteristics in South Padre Island
Employment by Class of Employer in South Padre Island
Among the 1,368 employed individuals in South Padre Island, private company employees (926 | 67.7%), self-employed (not incorporated) (141 | 10.3%), and self-employed (incorporated) (94 | 6.9%) make up the most common classes of employment.
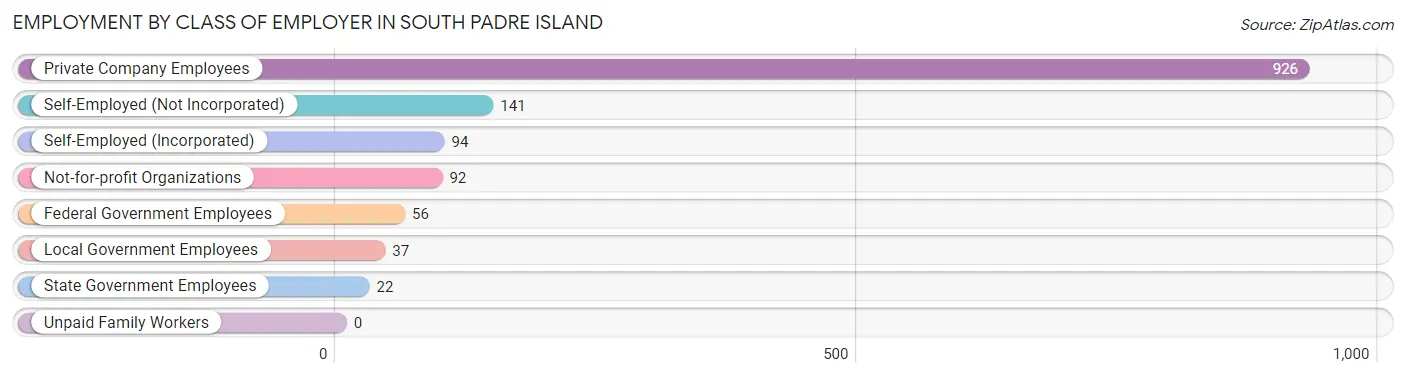
| Employer Class | # Employees | % Employees |
| Private Company Employees | 926 | 67.7% |
| Self-Employed (Incorporated) | 94 | 6.9% |
| Self-Employed (Not Incorporated) | 141 | 10.3% |
| Not-for-profit Organizations | 92 | 6.7% |
| Local Government Employees | 37 | 2.7% |
| State Government Employees | 22 | 1.6% |
| Federal Government Employees | 56 | 4.1% |
| Unpaid Family Workers | 0 | 0.0% |
| Total | 1,368 | 100.0% |
Employment Status by Age in South Padre Island
According to the labor force statistics for South Padre Island, out of the total population over 16 years of age (2,158), 65.6% or 1,416 individuals are in the labor force, with 3.4% or 48 of them unemployed. The age group with the highest labor force participation rate is 16 to 19 years, with 100.0% or 47 individuals in the labor force. Within the labor force, the 25 to 29 years age range has the highest percentage of unemployed individuals, with 100.0% or 13 of them being unemployed.
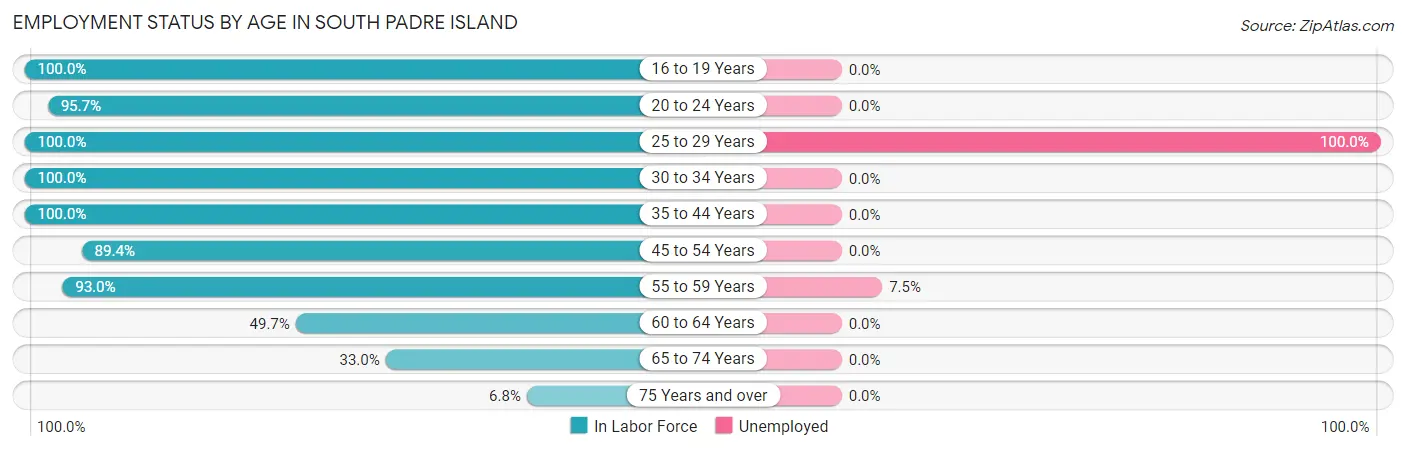
| Age Bracket | In Labor Force | Unemployed |
| 16 to 19 Years | 47 (100.0%) | 0 (0.0%) |
| 20 to 24 Years | 179 (95.7%) | 0 (0.0%) |
| 25 to 29 Years | 13 (100.0%) | 13 (100.0%) |
| 30 to 34 Years | 110 (100.0%) | 0 (0.0%) |
| 35 to 44 Years | 37 (100.0%) | 0 (0.0%) |
| 45 to 54 Years | 237 (89.4%) | 0 (0.0%) |
| 55 to 59 Years | 468 (93.0%) | 35 (7.5%) |
| 60 to 64 Years | 160 (49.7%) | 0 (0.0%) |
| 65 to 74 Years | 150 (33.0%) | 0 (0.0%) |
| 75 Years and over | 15 (6.8%) | 0 (0.0%) |
| Total | 1,416 (65.6%) | 48 (3.4%) |
Employment Status by Educational Attainment in South Padre Island
According to labor force statistics for South Padre Island, 82.0% of individuals (1,025) out of the total population between 25 and 64 years of age (1,250) are in the labor force, with 4.7% or 48 of them being unemployed. The group with the highest labor force participation rate are those with the educational attainment of less than high school, with 100.0% or 70 individuals in the labor force. Within the labor force, individuals with college / associate degree education have the highest percentage of unemployment, with 11.8% or 35 of them being unemployed.
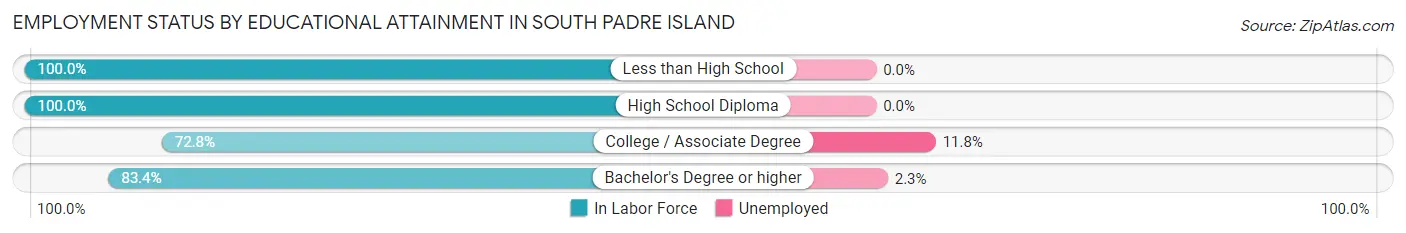
| Educational Attainment | In Labor Force | Unemployed |
| Less than High School | 70 (100.0%) | 0 (0.0%) |
| High School Diploma | 86 (100.0%) | 0 (0.0%) |
| College / Associate Degree | 297 (72.8%) | 48 (11.8%) |
| Bachelor's Degree or higher | 572 (83.4%) | 16 (2.3%) |
| Total | 1,025 (82.0%) | 59 (4.7%) |
Employment Occupations by Sex in South Padre Island
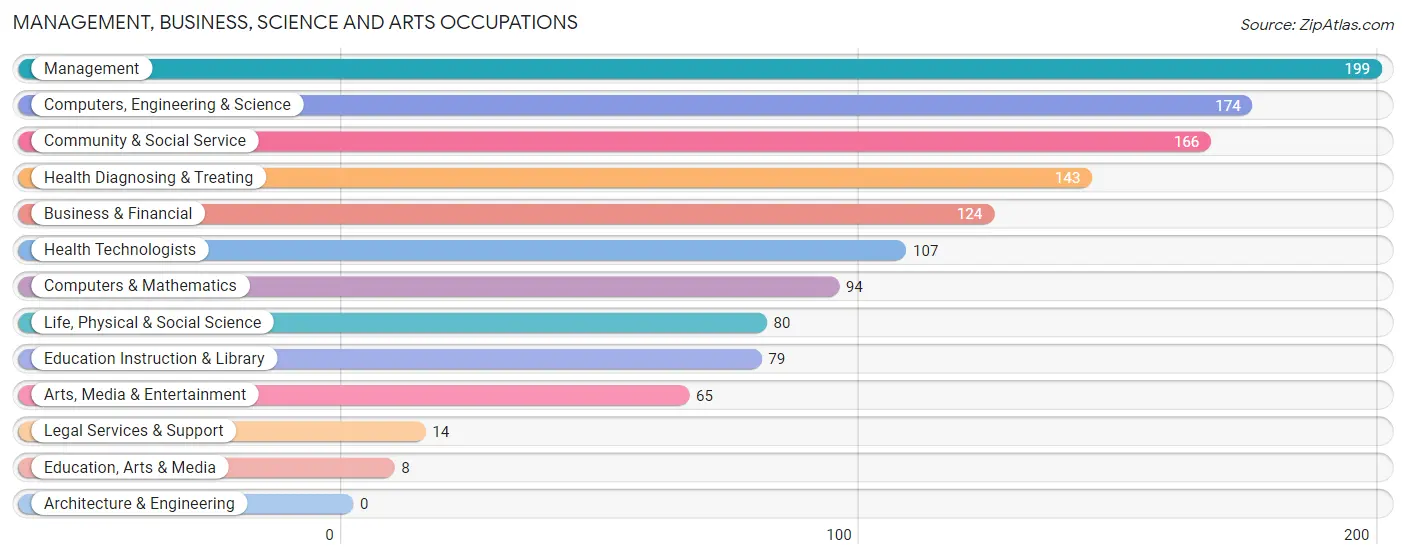
Management, Business, Science and Arts Occupations
The most common Management, Business, Science and Arts occupations in South Padre Island are Management (199 | 14.5%), Computers, Engineering & Science (174 | 12.7%), Community & Social Service (166 | 12.1%), Health Diagnosing & Treating (143 | 10.4%), and Business & Financial (124 | 9.1%).
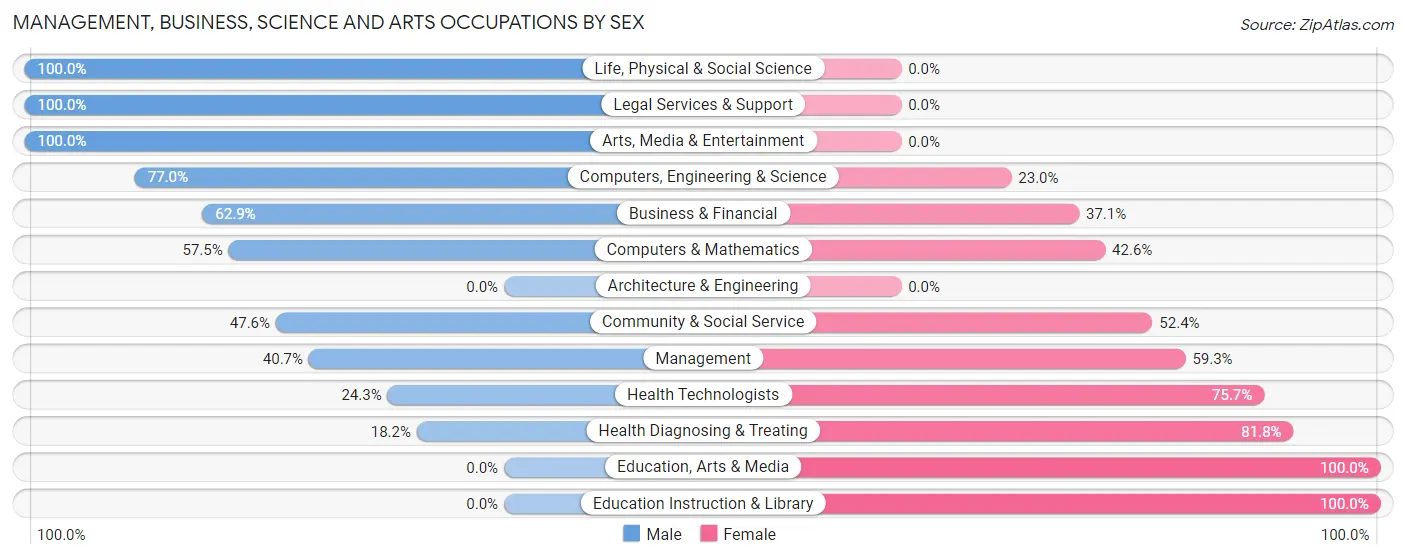
Management, Business, Science and Arts Occupations by Sex
Within the Management, Business, Science and Arts occupations in South Padre Island, the most male-oriented occupations are Life, Physical & Social Science (100.0%), Legal Services & Support (100.0%), and Arts, Media & Entertainment (100.0%), while the most female-oriented occupations are Education, Arts & Media (100.0%), Education Instruction & Library (100.0%), and Health Diagnosing & Treating (81.8%).
| Occupation | Male | Female |
| Management | 81 (40.7%) | 118 (59.3%) |
| Business & Financial | 78 (62.9%) | 46 (37.1%) |
| Computers, Engineering & Science | 134 (77.0%) | 40 (23.0%) |
| Computers & Mathematics | 54 (57.5%) | 40 (42.5%) |
| Architecture & Engineering | 0 (0.0%) | 0 (0.0%) |
| Life, Physical & Social Science | 80 (100.0%) | 0 (0.0%) |
| Community & Social Service | 79 (47.6%) | 87 (52.4%) |
| Education, Arts & Media | 0 (0.0%) | 8 (100.0%) |
| Legal Services & Support | 14 (100.0%) | 0 (0.0%) |
| Education Instruction & Library | 0 (0.0%) | 79 (100.0%) |
| Arts, Media & Entertainment | 65 (100.0%) | 0 (0.0%) |
| Health Diagnosing & Treating | 26 (18.2%) | 117 (81.8%) |
| Health Technologists | 26 (24.3%) | 81 (75.7%) |
| Total (Category) | 398 (49.4%) | 408 (50.6%) |
| Total (Overall) | 784 (57.3%) | 584 (42.7%) |
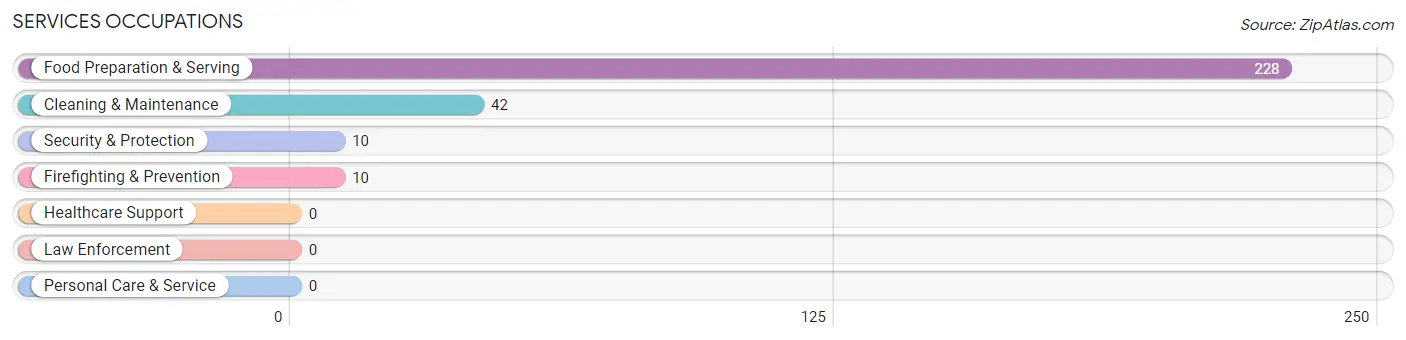
Services Occupations
The most common Services occupations in South Padre Island are Food Preparation & Serving (228 | 16.7%), Cleaning & Maintenance (42 | 3.1%), Security & Protection (10 | 0.7%), and Firefighting & Prevention (10 | 0.7%).
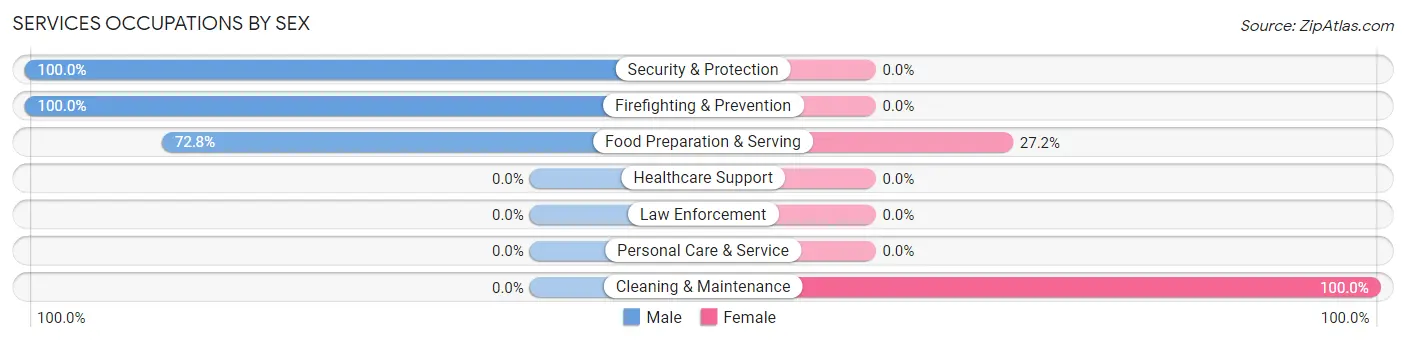
Services Occupations by Sex
Within the Services occupations in South Padre Island, the most male-oriented occupations are Security & Protection (100.0%), Firefighting & Prevention (100.0%), and Food Preparation & Serving (72.8%), while the most female-oriented occupations are Cleaning & Maintenance (100.0%), and Food Preparation & Serving (27.2%).
| Occupation | Male | Female |
| Healthcare Support | 0 (0.0%) | 0 (0.0%) |
| Security & Protection | 10 (100.0%) | 0 (0.0%) |
| Firefighting & Prevention | 10 (100.0%) | 0 (0.0%) |
| Law Enforcement | 0 (0.0%) | 0 (0.0%) |
| Food Preparation & Serving | 166 (72.8%) | 62 (27.2%) |
| Cleaning & Maintenance | 0 (0.0%) | 42 (100.0%) |
| Personal Care & Service | 0 (0.0%) | 0 (0.0%) |
| Total (Category) | 176 (62.9%) | 104 (37.1%) |
| Total (Overall) | 784 (57.3%) | 584 (42.7%) |
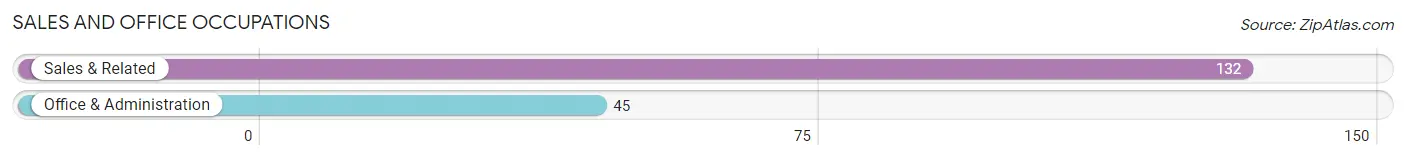
Sales and Office Occupations
The most common Sales and Office occupations in South Padre Island are Sales & Related (132 | 9.7%), and Office & Administration (45 | 3.3%).
Sales and Office Occupations by Sex
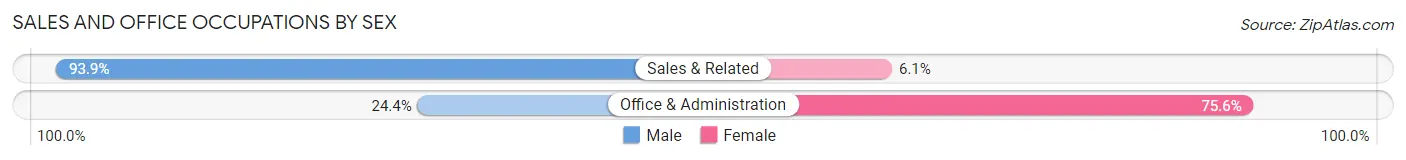
| Occupation | Male | Female |
| Sales & Related | 124 (93.9%) | 8 (6.1%) |
| Office & Administration | 11 (24.4%) | 34 (75.6%) |
| Total (Category) | 135 (76.3%) | 42 (23.7%) |
| Total (Overall) | 784 (57.3%) | 584 (42.7%) |
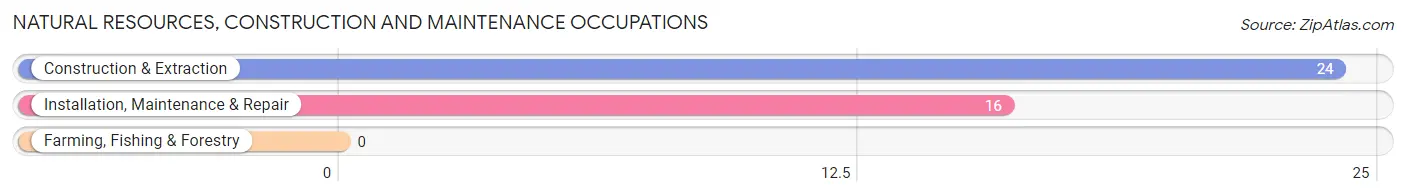
Natural Resources, Construction and Maintenance Occupations
The most common Natural Resources, Construction and Maintenance occupations in South Padre Island are Construction & Extraction (24 | 1.8%), and Installation, Maintenance & Repair (16 | 1.2%).
Natural Resources, Construction and Maintenance Occupations by Sex
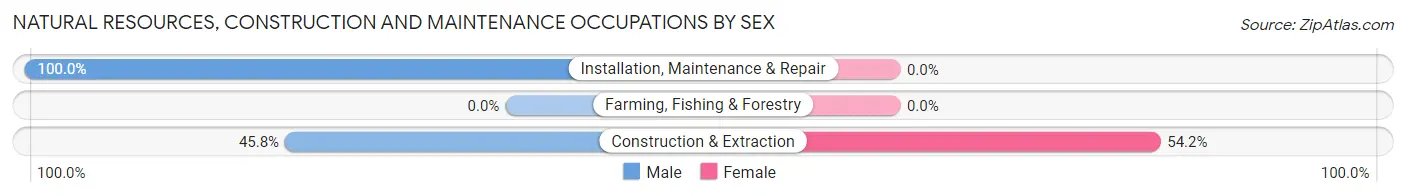
| Occupation | Male | Female |
| Farming, Fishing & Forestry | 0 (0.0%) | 0 (0.0%) |
| Construction & Extraction | 11 (45.8%) | 13 (54.2%) |
| Installation, Maintenance & Repair | 16 (100.0%) | 0 (0.0%) |
| Total (Category) | 27 (67.5%) | 13 (32.5%) |
| Total (Overall) | 784 (57.3%) | 584 (42.7%) |
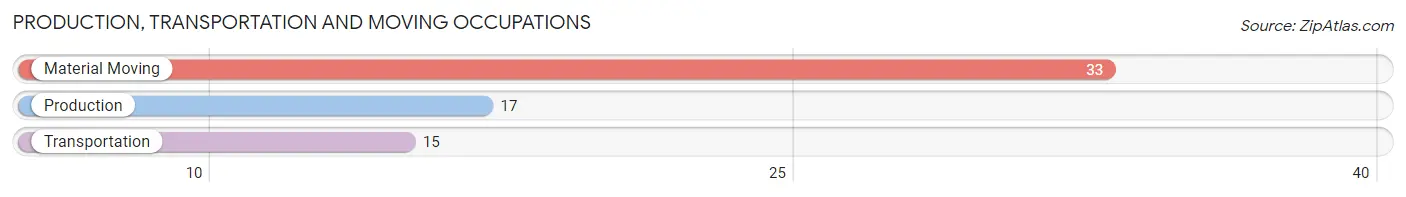
Production, Transportation and Moving Occupations
The most common Production, Transportation and Moving occupations in South Padre Island are Material Moving (33 | 2.4%), Production (17 | 1.2%), and Transportation (15 | 1.1%).
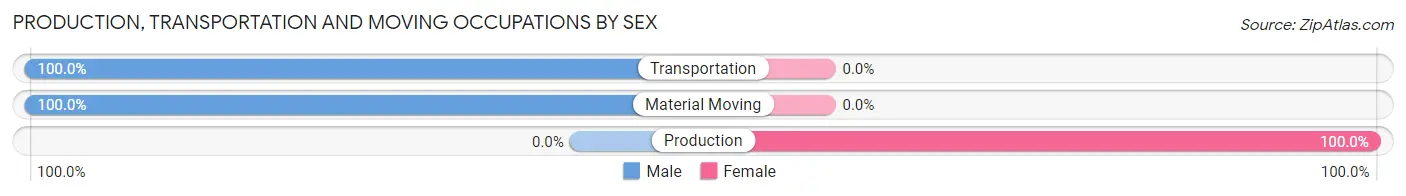
Production, Transportation and Moving Occupations by Sex
| Occupation | Male | Female |
| Production | 0 (0.0%) | 17 (100.0%) |
| Transportation | 15 (100.0%) | 0 (0.0%) |
| Material Moving | 33 (100.0%) | 0 (0.0%) |
| Total (Category) | 48 (73.9%) | 17 (26.2%) |
| Total (Overall) | 784 (57.3%) | 584 (42.7%) |
Employment Industries by Sex in South Padre Island
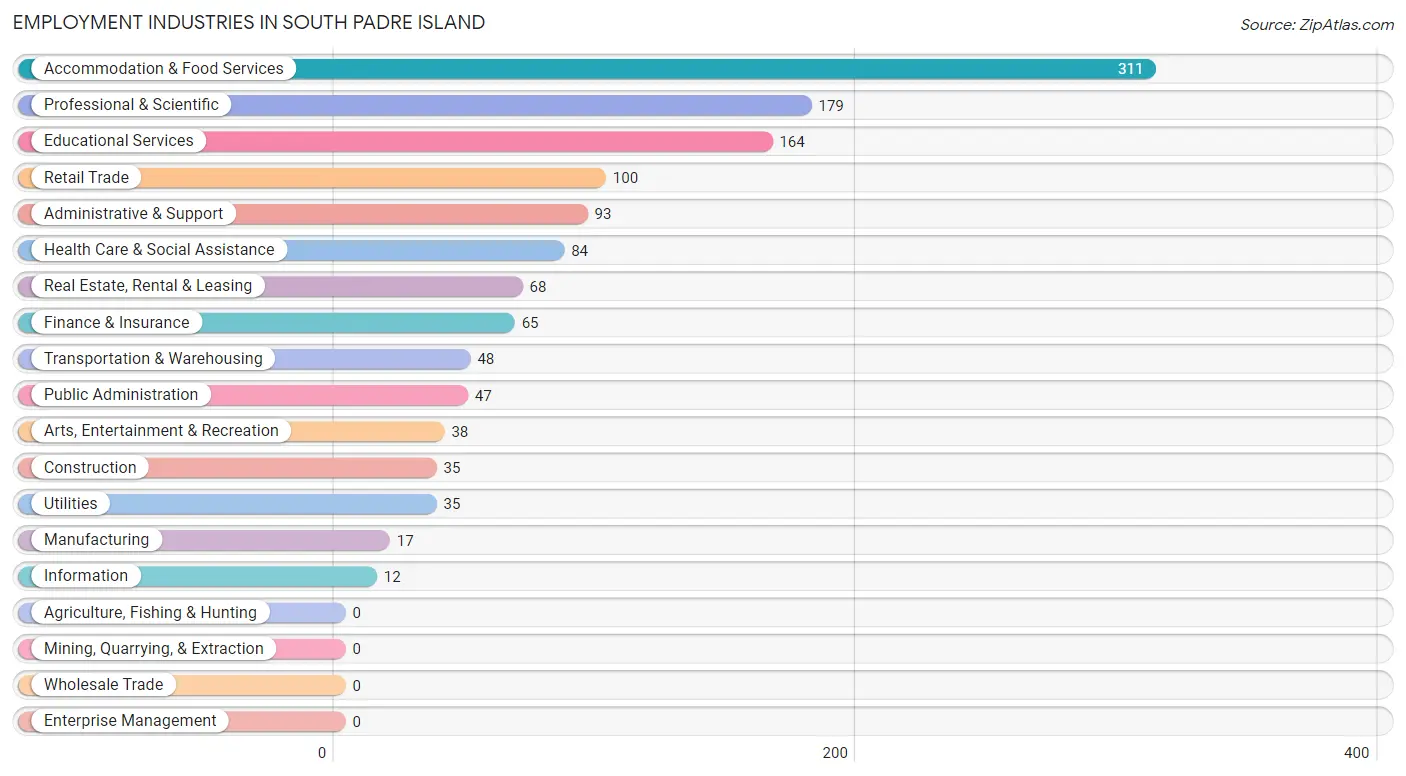
Employment Industries in South Padre Island
The major employment industries in South Padre Island include Accommodation & Food Services (311 | 22.7%), Professional & Scientific (179 | 13.1%), Educational Services (164 | 12.0%), Retail Trade (100 | 7.3%), and Administrative & Support (93 | 6.8%).
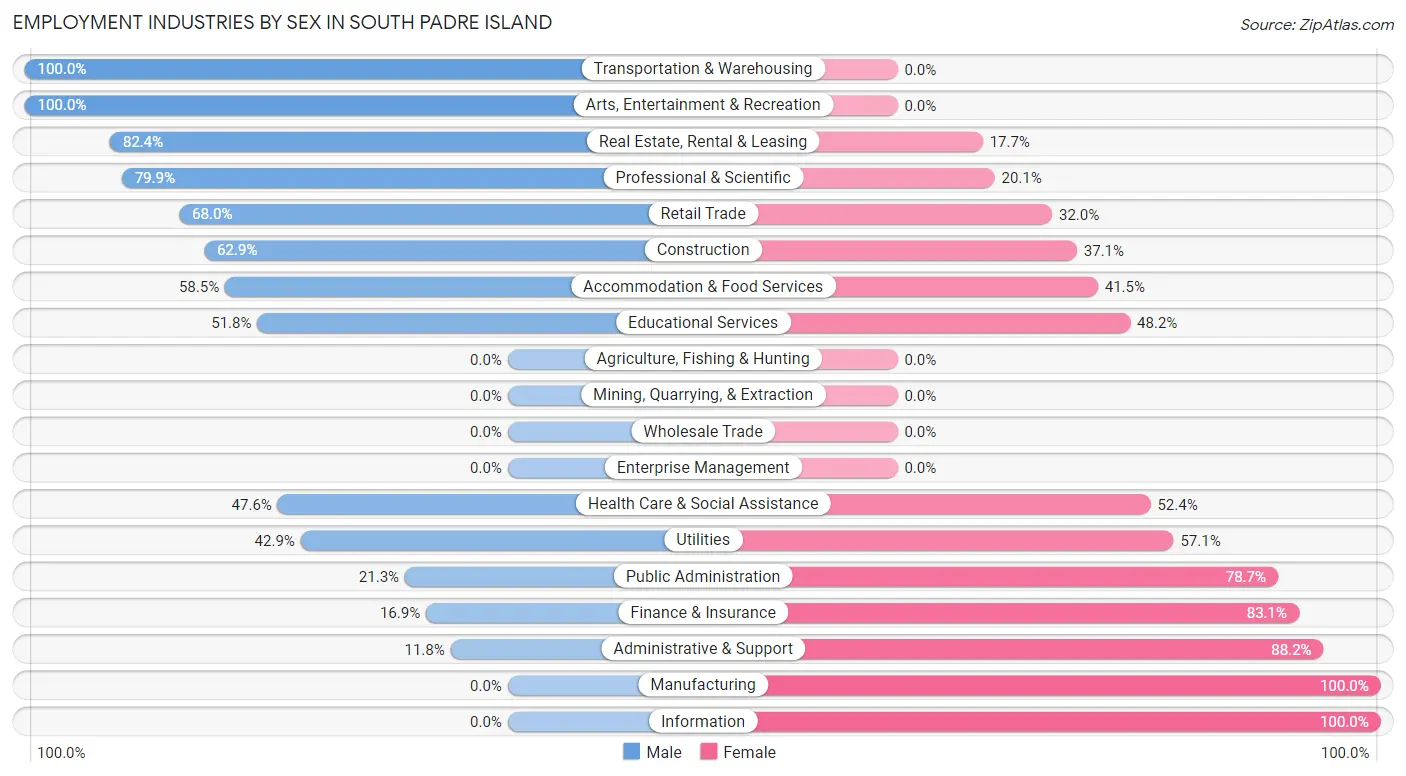
Employment Industries by Sex in South Padre Island
The South Padre Island industries that see more men than women are Transportation & Warehousing (100.0%), Arts, Entertainment & Recreation (100.0%), and Real Estate, Rental & Leasing (82.4%), whereas the industries that tend to have a higher number of women are Manufacturing (100.0%), Information (100.0%), and Administrative & Support (88.2%).
| Industry | Male | Female |
| Agriculture, Fishing & Hunting | 0 (0.0%) | 0 (0.0%) |
| Mining, Quarrying, & Extraction | 0 (0.0%) | 0 (0.0%) |
| Construction | 22 (62.9%) | 13 (37.1%) |
| Manufacturing | 0 (0.0%) | 17 (100.0%) |
| Wholesale Trade | 0 (0.0%) | 0 (0.0%) |
| Retail Trade | 68 (68.0%) | 32 (32.0%) |
| Transportation & Warehousing | 48 (100.0%) | 0 (0.0%) |
| Utilities | 15 (42.9%) | 20 (57.1%) |
| Information | 0 (0.0%) | 12 (100.0%) |
| Finance & Insurance | 11 (16.9%) | 54 (83.1%) |
| Real Estate, Rental & Leasing | 56 (82.4%) | 12 (17.6%) |
| Professional & Scientific | 143 (79.9%) | 36 (20.1%) |
| Enterprise Management | 0 (0.0%) | 0 (0.0%) |
| Administrative & Support | 11 (11.8%) | 82 (88.2%) |
| Educational Services | 85 (51.8%) | 79 (48.2%) |
| Health Care & Social Assistance | 40 (47.6%) | 44 (52.4%) |
| Arts, Entertainment & Recreation | 38 (100.0%) | 0 (0.0%) |
| Accommodation & Food Services | 182 (58.5%) | 129 (41.5%) |
| Public Administration | 10 (21.3%) | 37 (78.7%) |
| Total | 784 (57.3%) | 584 (42.7%) |
Education in South Padre Island
School Enrollment in South Padre Island
The most common levels of schooling among the 261 students in South Padre Island are graduate / professional (93 | 35.6%), high school (59 | 22.6%), and nursery / preschool (38 | 14.6%).
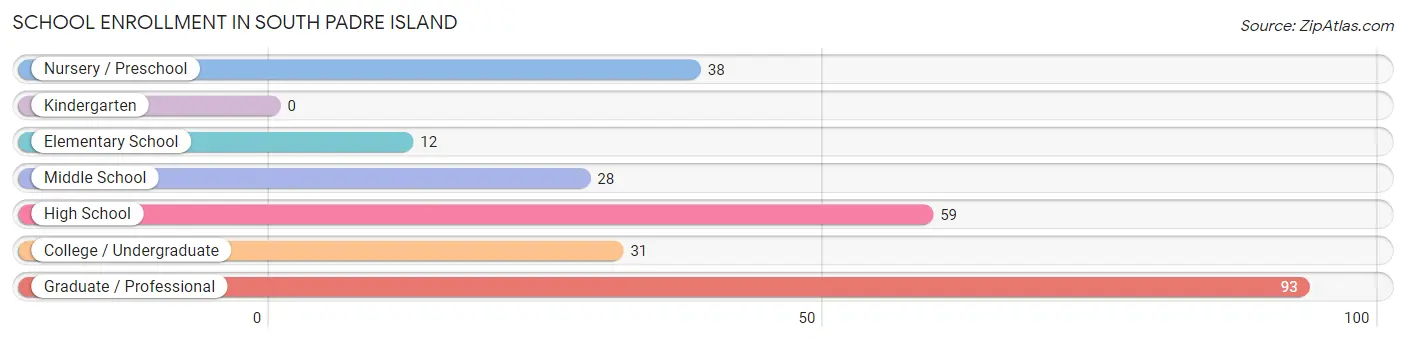
| School Level | # Students | % Students |
| Nursery / Preschool | 38 | 14.6% |
| Kindergarten | 0 | 0.0% |
| Elementary School | 12 | 4.6% |
| Middle School | 28 | 10.7% |
| High School | 59 | 22.6% |
| College / Undergraduate | 31 | 11.9% |
| Graduate / Professional | 93 | 35.6% |
| Total | 261 | 100.0% |
School Enrollment by Age by Funding Source in South Padre Island
Out of a total of 261 students who are enrolled in schools in South Padre Island, 42 (16.1%) attend a private institution, while the remaining 219 (83.9%) are enrolled in public schools. The age group of 35 years and over has the highest likelihood of being enrolled in private schools, with 11 (100.0% in the age bracket) enrolled. Conversely, the age group of 3 to 4 year olds has the lowest likelihood of being enrolled in a private school, with 23 (100.0% in the age bracket) attending a public institution.
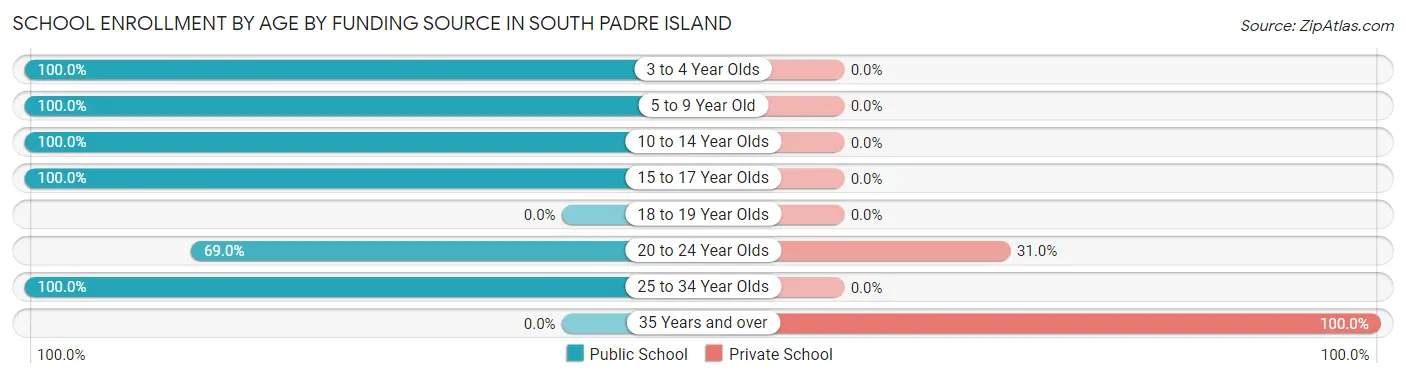
| Age Bracket | Public School | Private School |
| 3 to 4 Year Olds | 23 (100.0%) | 0 (0.0%) |
| 5 to 9 Year Old | 27 (100.0%) | 0 (0.0%) |
| 10 to 14 Year Olds | 28 (100.0%) | 0 (0.0%) |
| 15 to 17 Year Olds | 59 (100.0%) | 0 (0.0%) |
| 18 to 19 Year Olds | 0 (0.0%) | 0 (0.0%) |
| 20 to 24 Year Olds | 69 (69.0%) | 31 (31.0%) |
| 25 to 34 Year Olds | 13 (100.0%) | 0 (0.0%) |
| 35 Years and over | 0 (0.0%) | 11 (100.0%) |
| Total | 219 (83.9%) | 42 (16.1%) |
Educational Attainment by Field of Study in South Padre Island
Business (272 | 24.7%), education (143 | 13.0%), engineering (131 | 11.9%), science & technology (120 | 10.9%), and social sciences (104 | 9.5%) are the most common fields of study among 1,100 individuals in South Padre Island who have obtained a bachelor's degree or higher.
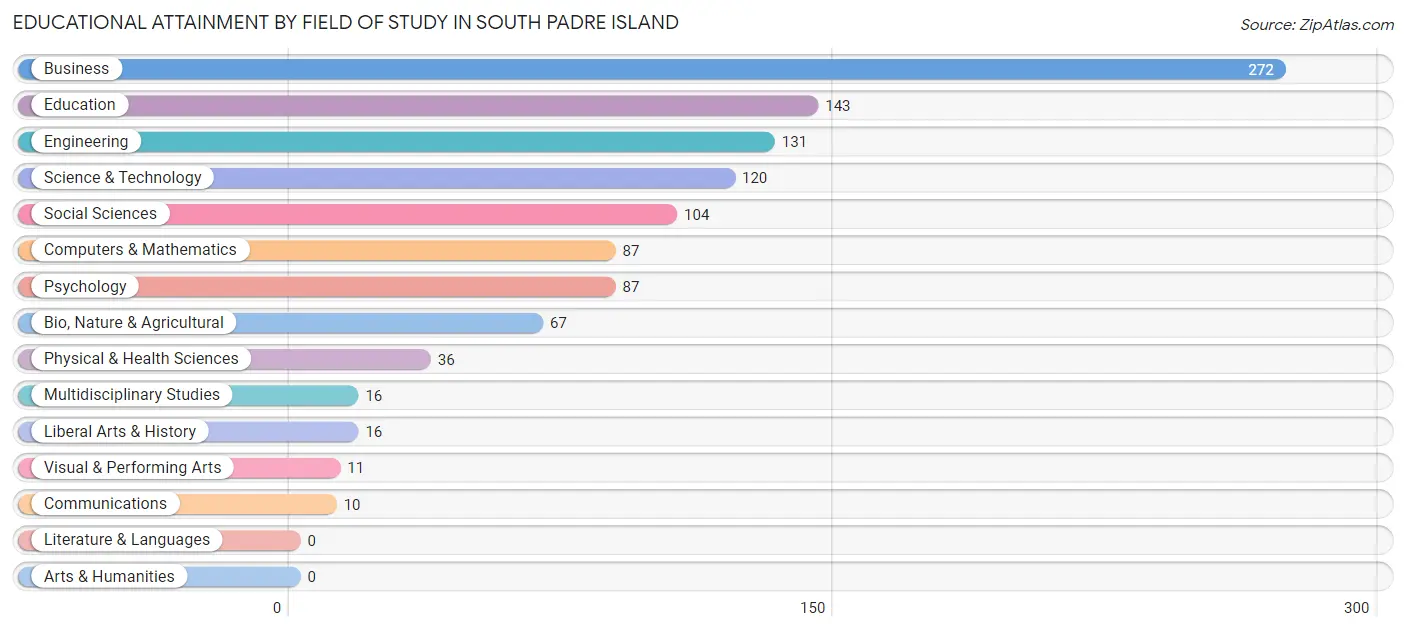
| Field of Study | # Graduates | % Graduates |
| Computers & Mathematics | 87 | 7.9% |
| Bio, Nature & Agricultural | 67 | 6.1% |
| Physical & Health Sciences | 36 | 3.3% |
| Psychology | 87 | 7.9% |
| Social Sciences | 104 | 9.5% |
| Engineering | 131 | 11.9% |
| Multidisciplinary Studies | 16 | 1.5% |
| Science & Technology | 120 | 10.9% |
| Business | 272 | 24.7% |
| Education | 143 | 13.0% |
| Literature & Languages | 0 | 0.0% |
| Liberal Arts & History | 16 | 1.5% |
| Visual & Performing Arts | 11 | 1.0% |
| Communications | 10 | 0.9% |
| Arts & Humanities | 0 | 0.0% |
| Total | 1,100 | 100.0% |
Transportation & Commute in South Padre Island
Vehicle Availability by Sex in South Padre Island
The most prevalent vehicle ownership categories in South Padre Island are males with 2 vehicles (379, accounting for 48.3%) and females with 2 vehicles (280, making up 64.9%).
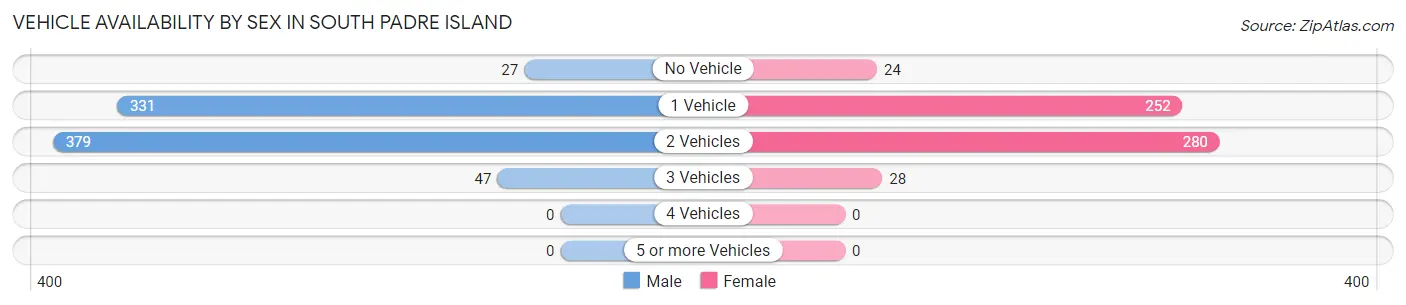
| Vehicles Available | Male | Female |
| No Vehicle | 27 (3.4%) | 24 (4.1%) |
| 1 Vehicle | 331 (42.2%) | 252 (43.1%) |
| 2 Vehicles | 379 (48.3%) | 280 (47.9%) |
| 3 Vehicles | 47 (6.0%) | 28 (4.8%) |
| 4 Vehicles | 0 (0.0%) | 0 (0.0%) |
| 5 or more Vehicles | 0 (0.0%) | 0 (0.0%) |
| Total | 784 (100.0%) | 584 (100.0%) |
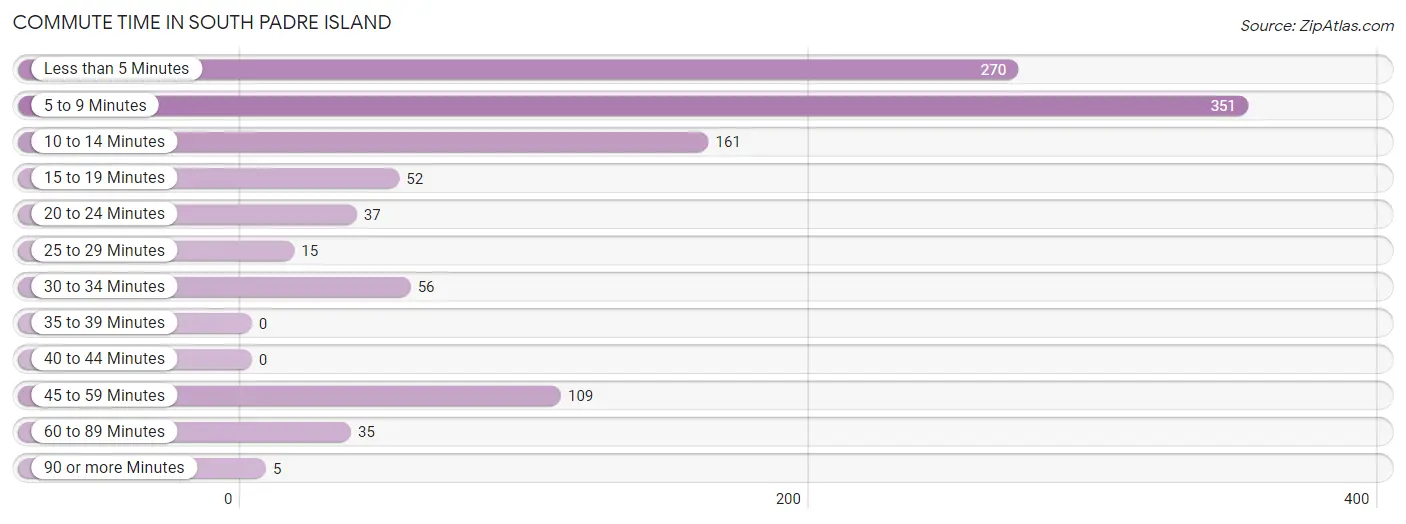
Commute Time in South Padre Island
The most frequently occuring commute durations in South Padre Island are 5 to 9 minutes (351 commuters, 32.2%), less than 5 minutes (270 commuters, 24.7%), and 10 to 14 minutes (161 commuters, 14.8%).
| Commute Time | # Commuters | % Commuters |
| Less than 5 Minutes | 270 | 24.7% |
| 5 to 9 Minutes | 351 | 32.2% |
| 10 to 14 Minutes | 161 | 14.8% |
| 15 to 19 Minutes | 52 | 4.8% |
| 20 to 24 Minutes | 37 | 3.4% |
| 25 to 29 Minutes | 15 | 1.4% |
| 30 to 34 Minutes | 56 | 5.1% |
| 35 to 39 Minutes | 0 | 0.0% |
| 40 to 44 Minutes | 0 | 0.0% |
| 45 to 59 Minutes | 109 | 10.0% |
| 60 to 89 Minutes | 35 | 3.2% |
| 90 or more Minutes | 5 | 0.5% |
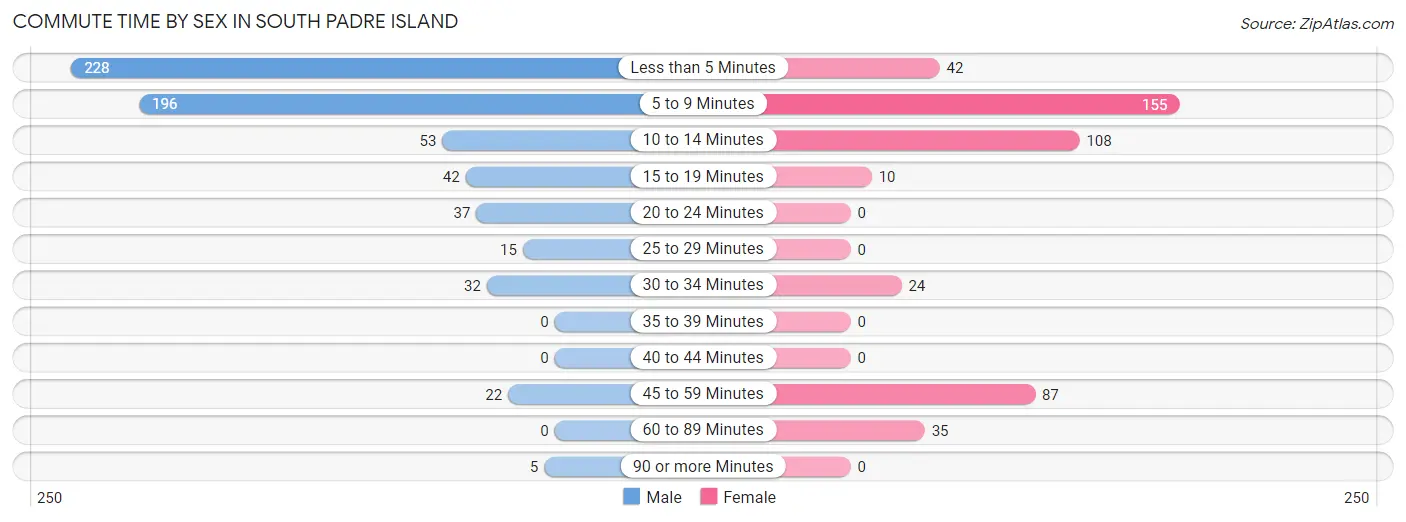
Commute Time by Sex in South Padre Island
The most common commute times in South Padre Island are less than 5 minutes (228 commuters, 36.2%) for males and 5 to 9 minutes (155 commuters, 33.6%) for females.
| Commute Time | Male | Female |
| Less than 5 Minutes | 228 (36.2%) | 42 (9.1%) |
| 5 to 9 Minutes | 196 (31.1%) | 155 (33.6%) |
| 10 to 14 Minutes | 53 (8.4%) | 108 (23.4%) |
| 15 to 19 Minutes | 42 (6.7%) | 10 (2.2%) |
| 20 to 24 Minutes | 37 (5.9%) | 0 (0.0%) |
| 25 to 29 Minutes | 15 (2.4%) | 0 (0.0%) |
| 30 to 34 Minutes | 32 (5.1%) | 24 (5.2%) |
| 35 to 39 Minutes | 0 (0.0%) | 0 (0.0%) |
| 40 to 44 Minutes | 0 (0.0%) | 0 (0.0%) |
| 45 to 59 Minutes | 22 (3.5%) | 87 (18.9%) |
| 60 to 89 Minutes | 0 (0.0%) | 35 (7.6%) |
| 90 or more Minutes | 5 (0.8%) | 0 (0.0%) |
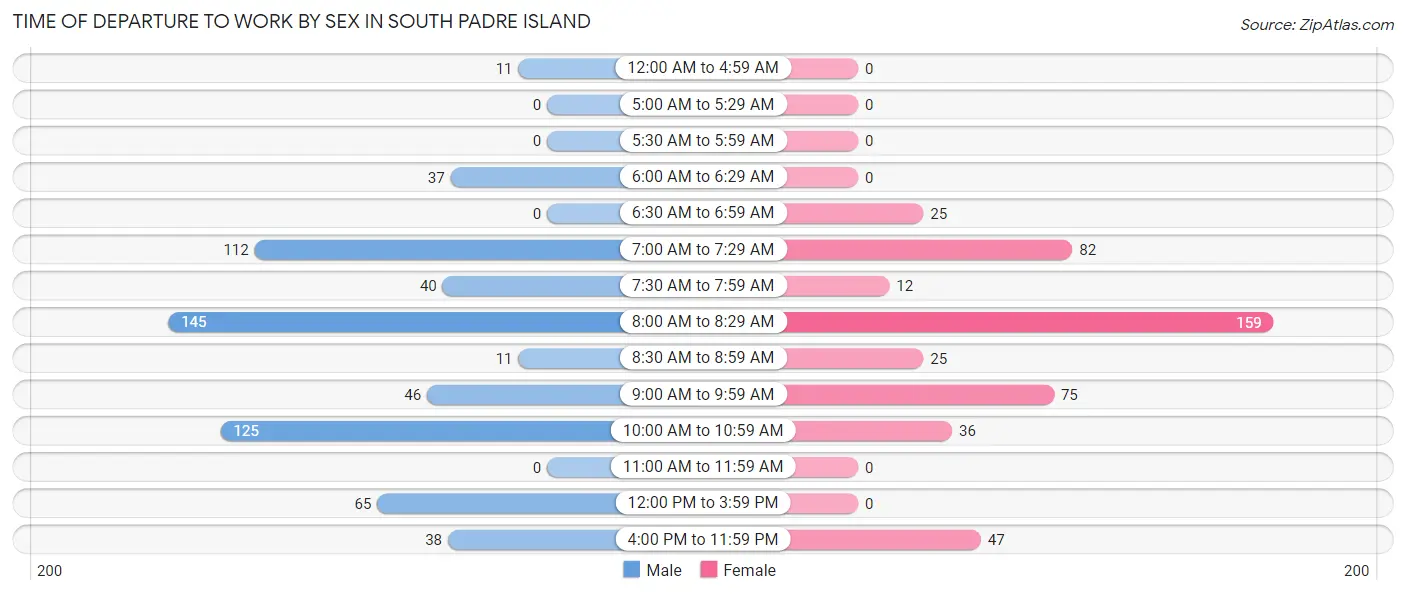
Time of Departure to Work by Sex in South Padre Island
The most frequent times of departure to work in South Padre Island are 8:00 AM to 8:29 AM (145, 23.0%) for males and 8:00 AM to 8:29 AM (159, 34.5%) for females.
| Time of Departure | Male | Female |
| 12:00 AM to 4:59 AM | 11 (1.8%) | 0 (0.0%) |
| 5:00 AM to 5:29 AM | 0 (0.0%) | 0 (0.0%) |
| 5:30 AM to 5:59 AM | 0 (0.0%) | 0 (0.0%) |
| 6:00 AM to 6:29 AM | 37 (5.9%) | 0 (0.0%) |
| 6:30 AM to 6:59 AM | 0 (0.0%) | 25 (5.4%) |
| 7:00 AM to 7:29 AM | 112 (17.8%) | 82 (17.8%) |
| 7:30 AM to 7:59 AM | 40 (6.4%) | 12 (2.6%) |
| 8:00 AM to 8:29 AM | 145 (23.0%) | 159 (34.5%) |
| 8:30 AM to 8:59 AM | 11 (1.8%) | 25 (5.4%) |
| 9:00 AM to 9:59 AM | 46 (7.3%) | 75 (16.3%) |
| 10:00 AM to 10:59 AM | 125 (19.8%) | 36 (7.8%) |
| 11:00 AM to 11:59 AM | 0 (0.0%) | 0 (0.0%) |
| 12:00 PM to 3:59 PM | 65 (10.3%) | 0 (0.0%) |
| 4:00 PM to 11:59 PM | 38 (6.0%) | 47 (10.2%) |
| Total | 630 (100.0%) | 461 (100.0%) |
Housing Occupancy in South Padre Island
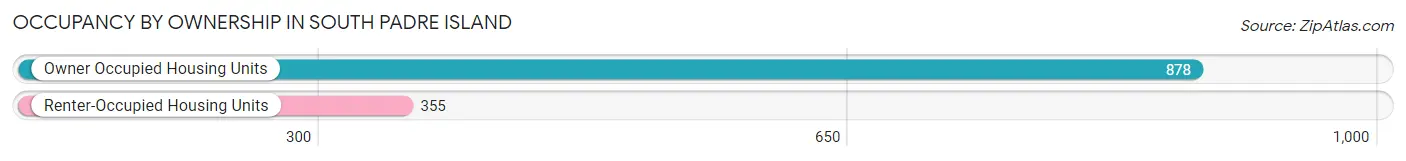
Occupancy by Ownership in South Padre Island
Of the total 1,233 dwellings in South Padre Island, owner-occupied units account for 878 (71.2%), while renter-occupied units make up 355 (28.8%).
| Occupancy | # Housing Units | % Housing Units |
| Owner Occupied Housing Units | 878 | 71.2% |
| Renter-Occupied Housing Units | 355 | 28.8% |
| Total Occupied Housing Units | 1,233 | 100.0% |
Occupancy by Household Size in South Padre Island
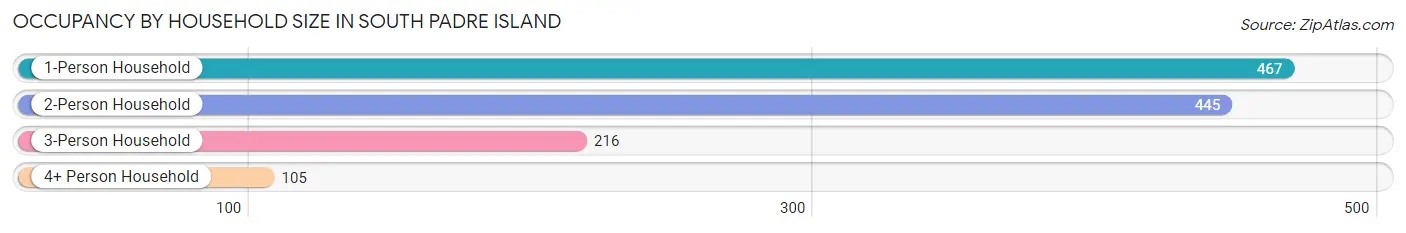
| Household Size | # Housing Units | % Housing Units |
| 1-Person Household | 467 | 37.9% |
| 2-Person Household | 445 | 36.1% |
| 3-Person Household | 216 | 17.5% |
| 4+ Person Household | 105 | 8.5% |
| Total Housing Units | 1,233 | 100.0% |
Occupancy by Ownership by Household Size in South Padre Island
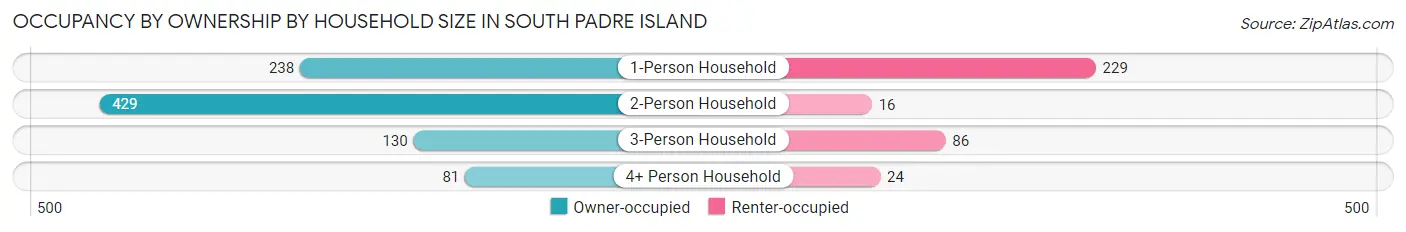
| Household Size | Owner-occupied | Renter-occupied |
| 1-Person Household | 238 (51.0%) | 229 (49.0%) |
| 2-Person Household | 429 (96.4%) | 16 (3.6%) |
| 3-Person Household | 130 (60.2%) | 86 (39.8%) |
| 4+ Person Household | 81 (77.1%) | 24 (22.9%) |
| Total Housing Units | 878 (71.2%) | 355 (28.8%) |
Occupancy by Educational Attainment in South Padre Island
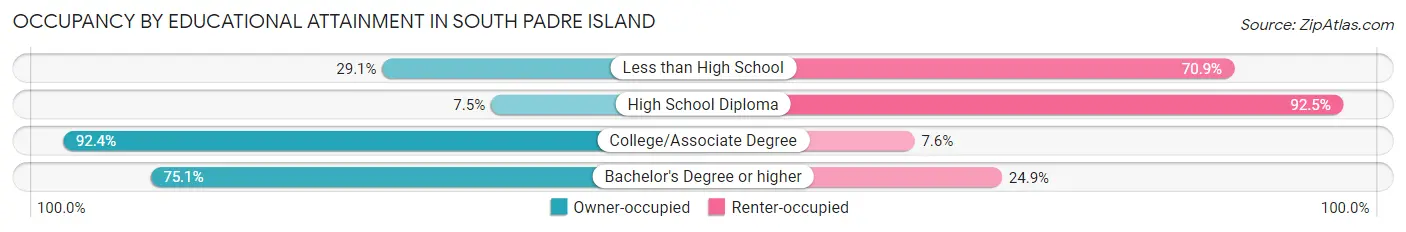
| Household Size | Owner-occupied | Renter-occupied |
| Less than High School | 25 (29.1%) | 61 (70.9%) |
| High School Diploma | 7 (7.5%) | 86 (92.5%) |
| College/Associate Degree | 292 (92.4%) | 24 (7.6%) |
| Bachelor's Degree or higher | 554 (75.1%) | 184 (24.9%) |
Occupancy by Age of Householder in South Padre Island
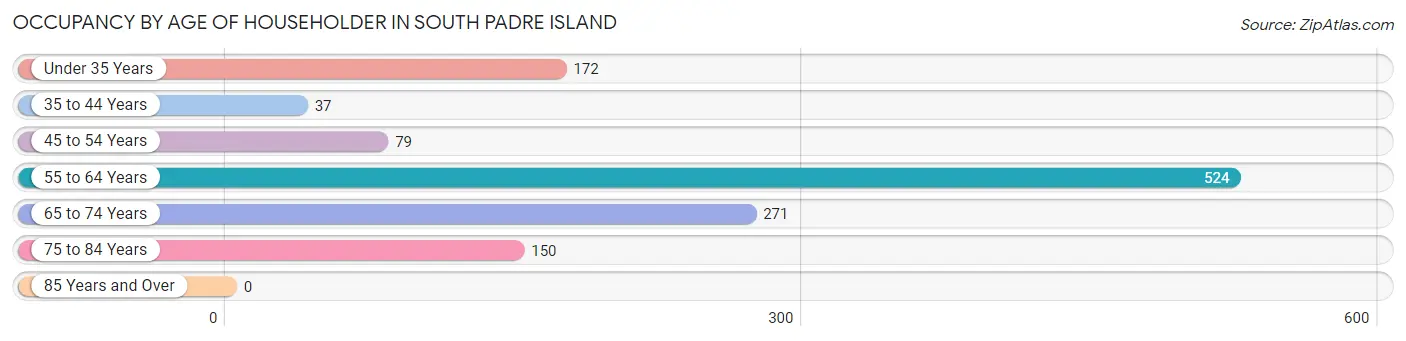
| Age Bracket | # Households | % Households |
| Under 35 Years | 172 | 14.0% |
| 35 to 44 Years | 37 | 3.0% |
| 45 to 54 Years | 79 | 6.4% |
| 55 to 64 Years | 524 | 42.5% |
| 65 to 74 Years | 271 | 22.0% |
| 75 to 84 Years | 150 | 12.2% |
| 85 Years and Over | 0 | 0.0% |
| Total | 1,233 | 100.0% |
Housing Finances in South Padre Island
Median Income by Occupancy in South Padre Island
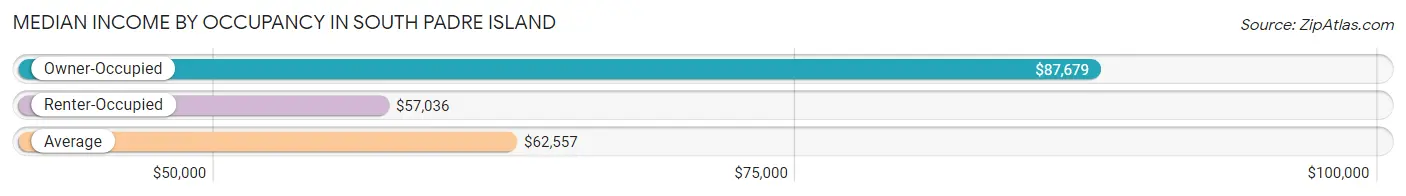
| Occupancy Type | # Households | Median Income |
| Owner-Occupied | 878 (71.2%) | $87,679 |
| Renter-Occupied | 355 (28.8%) | $57,036 |
| Average | 1,233 (100.0%) | $62,557 |
Occupancy by Householder Income Bracket in South Padre Island
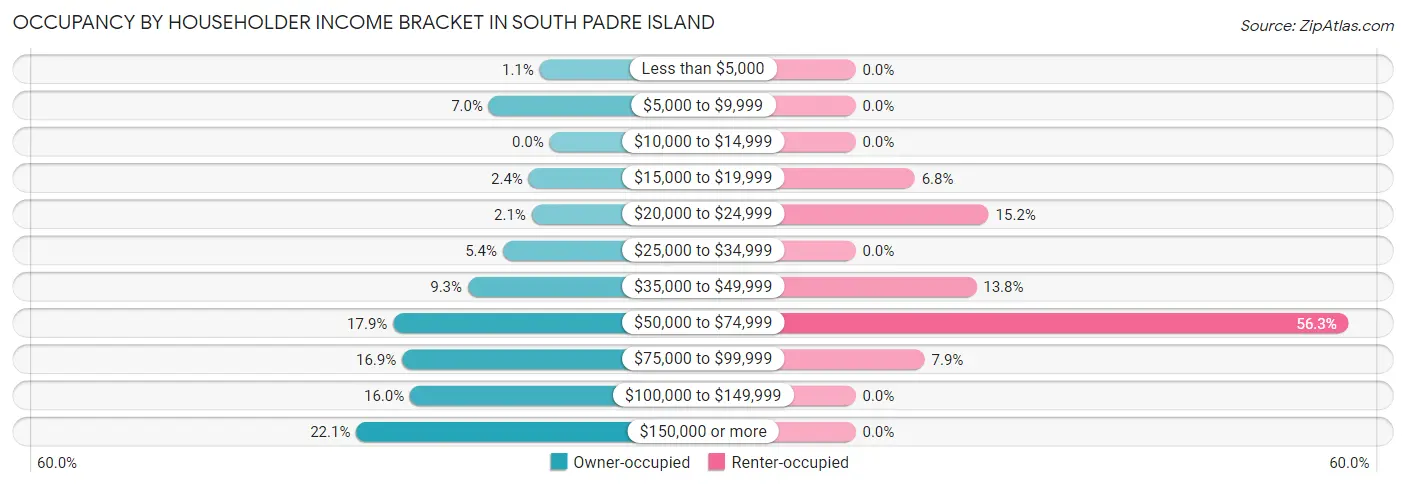
| Income Bracket | Owner-occupied | Renter-occupied |
| Less than $5,000 | 10 (1.1%) | 0 (0.0%) |
| $5,000 to $9,999 | 61 (7.0%) | 0 (0.0%) |
| $10,000 to $14,999 | 0 (0.0%) | 0 (0.0%) |
| $15,000 to $19,999 | 21 (2.4%) | 24 (6.8%) |
| $20,000 to $24,999 | 18 (2.1%) | 54 (15.2%) |
| $25,000 to $34,999 | 47 (5.3%) | 0 (0.0%) |
| $35,000 to $49,999 | 82 (9.3%) | 49 (13.8%) |
| $50,000 to $74,999 | 157 (17.9%) | 200 (56.3%) |
| $75,000 to $99,999 | 148 (16.9%) | 28 (7.9%) |
| $100,000 to $149,999 | 140 (16.0%) | 0 (0.0%) |
| $150,000 or more | 194 (22.1%) | 0 (0.0%) |
| Total | 878 (100.0%) | 355 (100.0%) |
Monthly Housing Cost Tiers in South Padre Island

| Monthly Cost | Owner-occupied | Renter-occupied |
| Less than $300 | 38 (4.3%) | 0 (0.0%) |
| $300 to $499 | 0 (0.0%) | 0 (0.0%) |
| $500 to $799 | 34 (3.9%) | 0 (0.0%) |
| $800 to $999 | 93 (10.6%) | 54 (15.2%) |
| $1,000 to $1,499 | 273 (31.1%) | 159 (44.8%) |
| $1,500 to $1,999 | 145 (16.5%) | 75 (21.1%) |
| $2,000 to $2,499 | 79 (9.0%) | 0 (0.0%) |
| $2,500 to $2,999 | 36 (4.1%) | 0 (0.0%) |
| $3,000 or more | 180 (20.5%) | 16 (4.5%) |
| Total | 878 (100.0%) | 355 (100.0%) |
Physical Housing Characteristics in South Padre Island
Housing Structures in South Padre Island
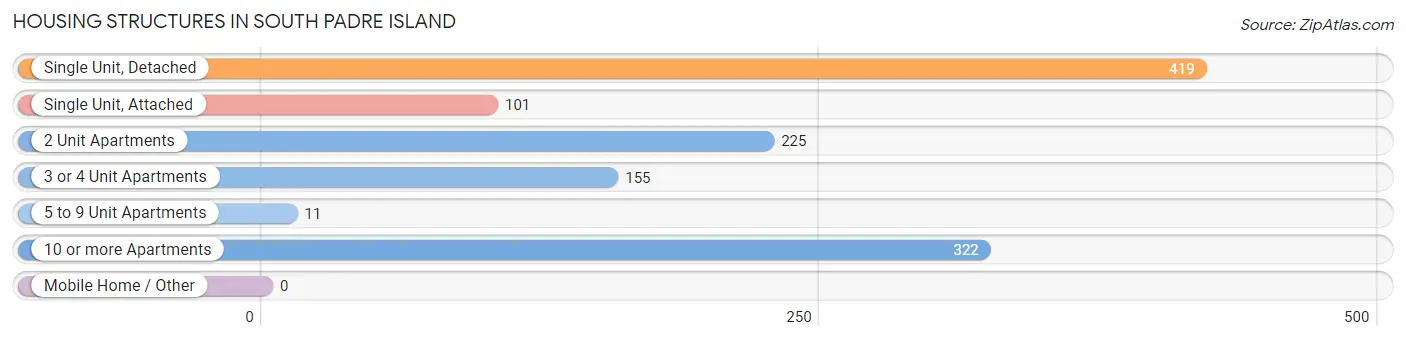
| Structure Type | # Housing Units | % Housing Units |
| Single Unit, Detached | 419 | 34.0% |
| Single Unit, Attached | 101 | 8.2% |
| 2 Unit Apartments | 225 | 18.2% |
| 3 or 4 Unit Apartments | 155 | 12.6% |
| 5 to 9 Unit Apartments | 11 | 0.9% |
| 10 or more Apartments | 322 | 26.1% |
| Mobile Home / Other | 0 | 0.0% |
| Total | 1,233 | 100.0% |
Housing Structures by Occupancy in South Padre Island
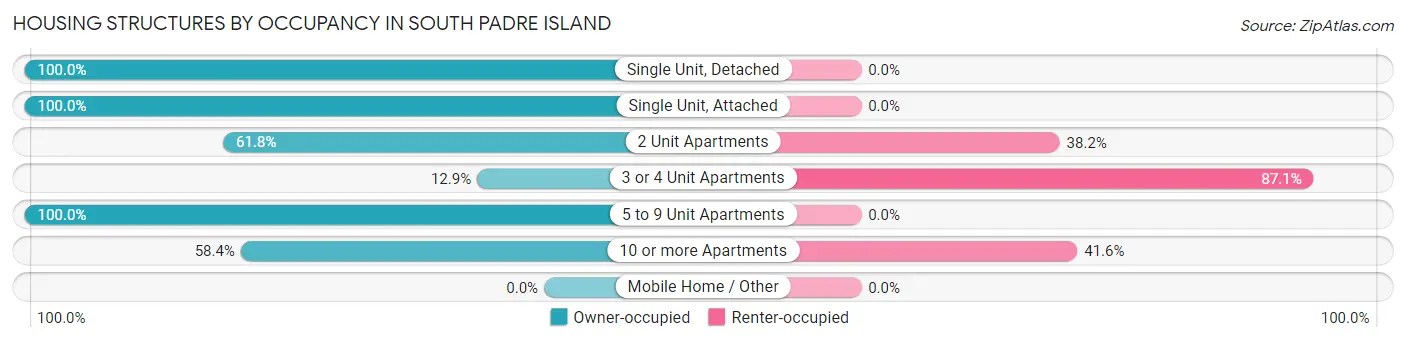
| Structure Type | Owner-occupied | Renter-occupied |
| Single Unit, Detached | 419 (100.0%) | 0 (0.0%) |
| Single Unit, Attached | 101 (100.0%) | 0 (0.0%) |
| 2 Unit Apartments | 139 (61.8%) | 86 (38.2%) |
| 3 or 4 Unit Apartments | 20 (12.9%) | 135 (87.1%) |
| 5 to 9 Unit Apartments | 11 (100.0%) | 0 (0.0%) |
| 10 or more Apartments | 188 (58.4%) | 134 (41.6%) |
| Mobile Home / Other | 0 (0.0%) | 0 (0.0%) |
| Total | 878 (71.2%) | 355 (28.8%) |
Housing Structures by Number of Rooms in South Padre Island
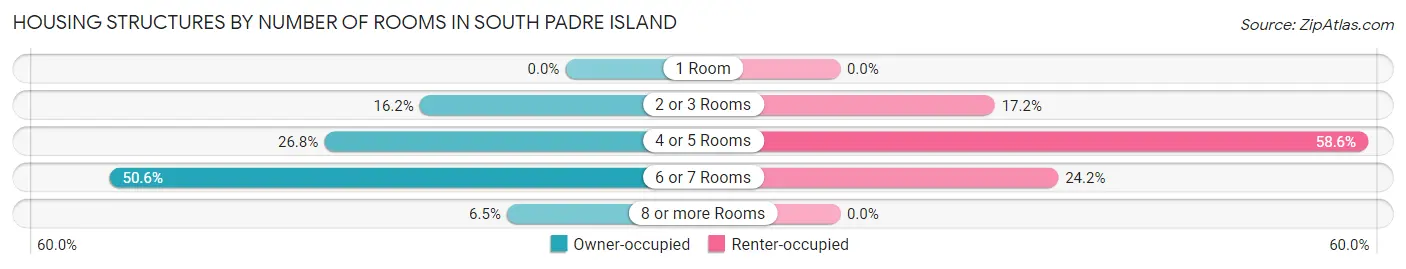
| Number of Rooms | Owner-occupied | Renter-occupied |
| 1 Room | 0 (0.0%) | 0 (0.0%) |
| 2 or 3 Rooms | 142 (16.2%) | 61 (17.2%) |
| 4 or 5 Rooms | 235 (26.8%) | 208 (58.6%) |
| 6 or 7 Rooms | 444 (50.6%) | 86 (24.2%) |
| 8 or more Rooms | 57 (6.5%) | 0 (0.0%) |
| Total | 878 (100.0%) | 355 (100.0%) |
Housing Structure by Heating Type in South Padre Island
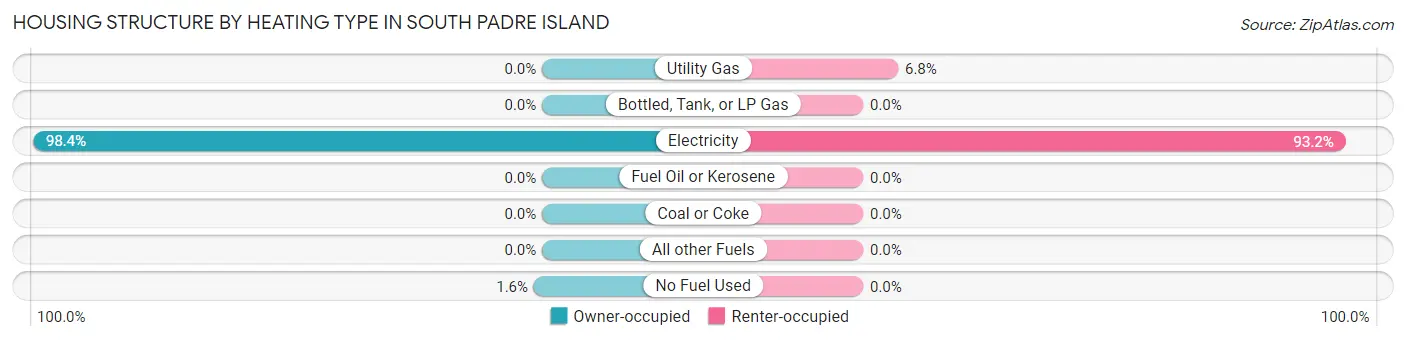
| Heating Type | Owner-occupied | Renter-occupied |
| Utility Gas | 0 (0.0%) | 24 (6.8%) |
| Bottled, Tank, or LP Gas | 0 (0.0%) | 0 (0.0%) |
| Electricity | 864 (98.4%) | 331 (93.2%) |
| Fuel Oil or Kerosene | 0 (0.0%) | 0 (0.0%) |
| Coal or Coke | 0 (0.0%) | 0 (0.0%) |
| All other Fuels | 0 (0.0%) | 0 (0.0%) |
| No Fuel Used | 14 (1.6%) | 0 (0.0%) |
| Total | 878 (100.0%) | 355 (100.0%) |
Household Vehicle Usage in South Padre Island
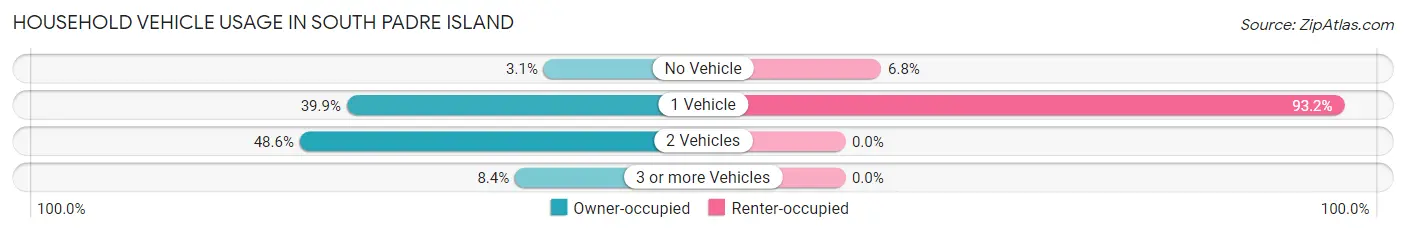
| Vehicles per Household | Owner-occupied | Renter-occupied |
| No Vehicle | 27 (3.1%) | 24 (6.8%) |
| 1 Vehicle | 350 (39.9%) | 331 (93.2%) |
| 2 Vehicles | 427 (48.6%) | 0 (0.0%) |
| 3 or more Vehicles | 74 (8.4%) | 0 (0.0%) |
| Total | 878 (100.0%) | 355 (100.0%) |
Real Estate & Mortgages in South Padre Island
Real Estate and Mortgage Overview in South Padre Island
| Characteristic | Without Mortgage | With Mortgage |
| Housing Units | 489 | 389 |
| Median Property Value | $420,100 | $368,000 |
| Median Household Income | $58,234 | $155 |
| Monthly Housing Costs | $1,066 | $180 |
| Real Estate Taxes | $7,700 | $0 |
Property Value by Mortgage Status in South Padre Island
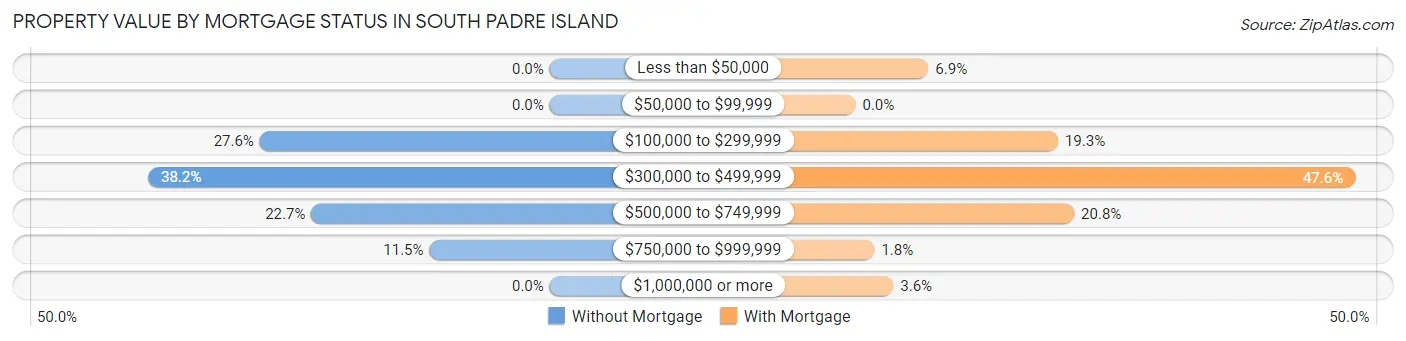
| Property Value | Without Mortgage | With Mortgage |
| Less than $50,000 | 0 (0.0%) | 27 (6.9%) |
| $50,000 to $99,999 | 0 (0.0%) | 0 (0.0%) |
| $100,000 to $299,999 | 135 (27.6%) | 75 (19.3%) |
| $300,000 to $499,999 | 187 (38.2%) | 185 (47.6%) |
| $500,000 to $749,999 | 111 (22.7%) | 81 (20.8%) |
| $750,000 to $999,999 | 56 (11.5%) | 7 (1.8%) |
| $1,000,000 or more | 0 (0.0%) | 14 (3.6%) |
| Total | 489 (100.0%) | 389 (100.0%) |
Household Income by Mortgage Status in South Padre Island
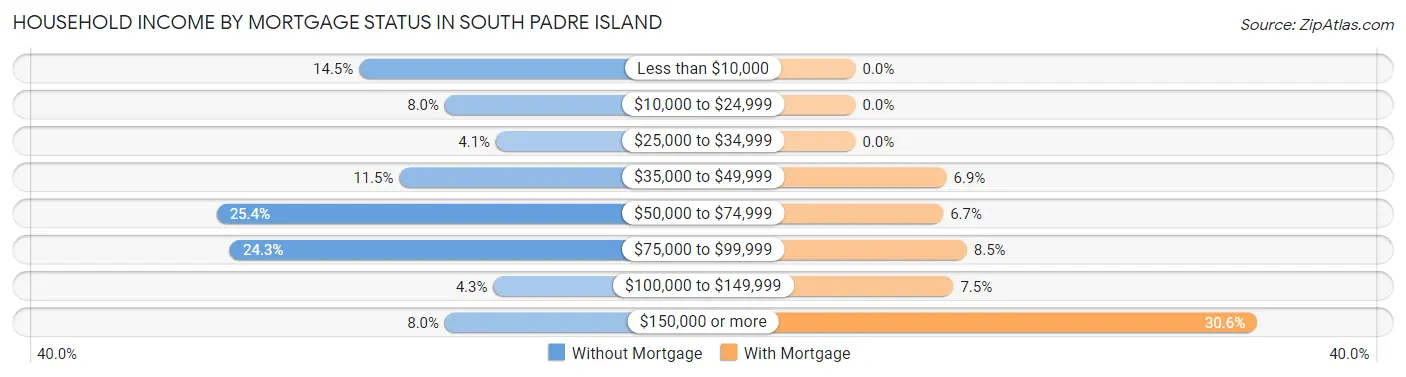
| Household Income | Without Mortgage | With Mortgage |
| Less than $10,000 | 71 (14.5%) | 0 (0.0%) |
| $10,000 to $24,999 | 39 (8.0%) | 0 (0.0%) |
| $25,000 to $34,999 | 20 (4.1%) | 0 (0.0%) |
| $35,000 to $49,999 | 56 (11.5%) | 27 (6.9%) |
| $50,000 to $74,999 | 124 (25.4%) | 26 (6.7%) |
| $75,000 to $99,999 | 119 (24.3%) | 33 (8.5%) |
| $100,000 to $149,999 | 21 (4.3%) | 29 (7.5%) |
| $150,000 or more | 39 (8.0%) | 119 (30.6%) |
| Total | 489 (100.0%) | 389 (100.0%) |
Property Value to Household Income Ratio in South Padre Island
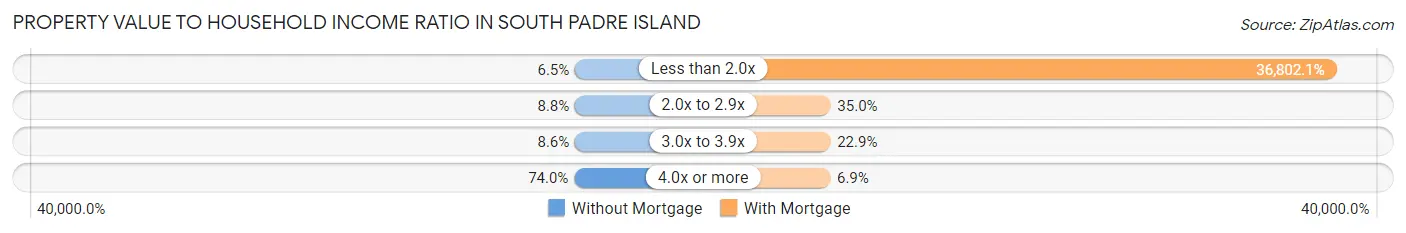
| Value-to-Income Ratio | Without Mortgage | With Mortgage |
| Less than 2.0x | 32 (6.5%) | 143,160 (36,802.1%) |
| 2.0x to 2.9x | 43 (8.8%) | 136 (35.0%) |
| 3.0x to 3.9x | 42 (8.6%) | 89 (22.9%) |
| 4.0x or more | 362 (74.0%) | 27 (6.9%) |
| Total | 489 (100.0%) | 389 (100.0%) |
Real Estate Taxes by Mortgage Status in South Padre Island
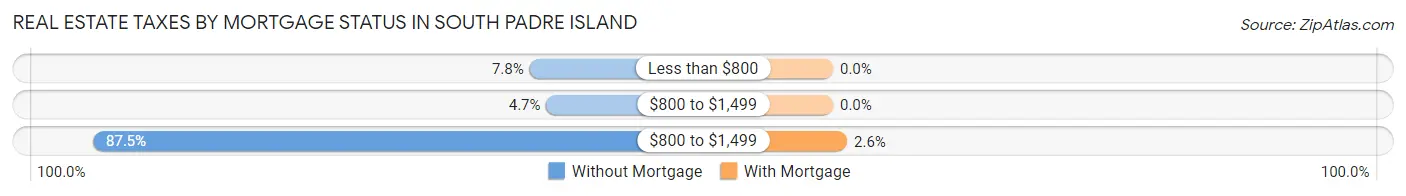
| Property Taxes | Without Mortgage | With Mortgage |
| Less than $800 | 38 (7.8%) | 0 (0.0%) |
| $800 to $1,499 | 23 (4.7%) | 0 (0.0%) |
| $800 to $1,499 | 428 (87.5%) | 10 (2.6%) |
| Total | 489 (100.0%) | 389 (100.0%) |
Health & Disability in South Padre Island
Health Insurance Coverage by Age in South Padre Island
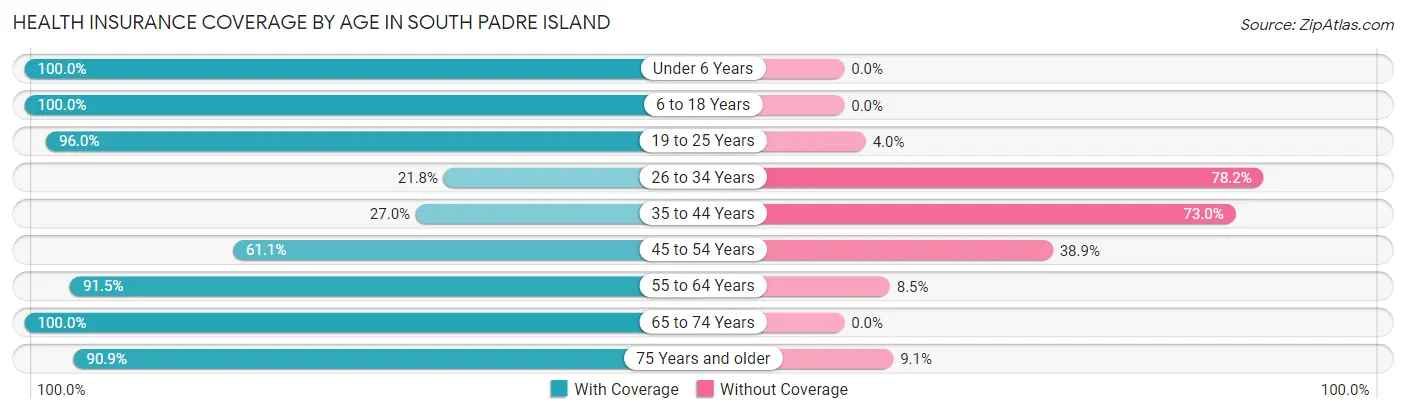
| Age Bracket | With Coverage | Without Coverage |
| Under 6 Years | 129 (100.0%) | 0 (0.0%) |
| 6 to 18 Years | 146 (100.0%) | 0 (0.0%) |
| 19 to 25 Years | 192 (96.0%) | 8 (4.0%) |
| 26 to 34 Years | 24 (21.8%) | 86 (78.2%) |
| 35 to 44 Years | 10 (27.0%) | 27 (73.0%) |
| 45 to 54 Years | 162 (61.1%) | 103 (38.9%) |
| 55 to 64 Years | 755 (91.5%) | 70 (8.5%) |
| 65 to 74 Years | 455 (100.0%) | 0 (0.0%) |
| 75 Years and older | 199 (90.9%) | 20 (9.1%) |
| Total | 2,072 (86.8%) | 314 (13.2%) |
Health Insurance Coverage by Citizenship Status in South Padre Island
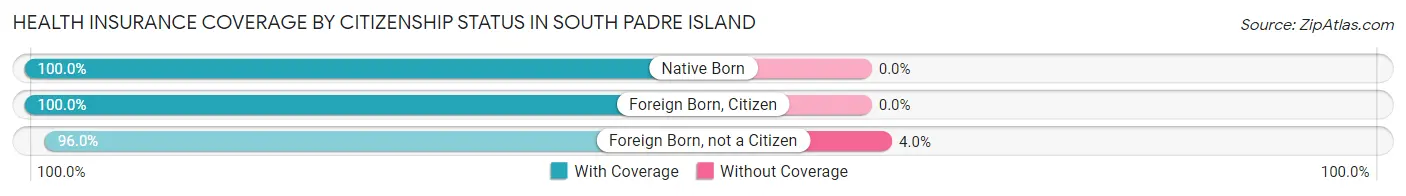
| Citizenship Status | With Coverage | Without Coverage |
| Native Born | 129 (100.0%) | 0 (0.0%) |
| Foreign Born, Citizen | 146 (100.0%) | 0 (0.0%) |
| Foreign Born, not a Citizen | 192 (96.0%) | 8 (4.0%) |
Health Insurance Coverage by Household Income in South Padre Island
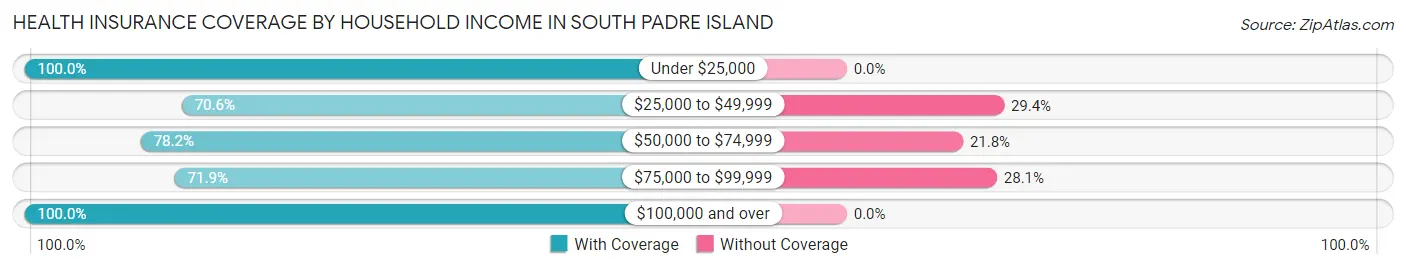
| Household Income | With Coverage | Without Coverage |
| Under $25,000 | 413 (100.0%) | 0 (0.0%) |
| $25,000 to $49,999 | 151 (70.6%) | 63 (29.4%) |
| $50,000 to $74,999 | 550 (78.2%) | 153 (21.8%) |
| $75,000 to $99,999 | 230 (71.9%) | 90 (28.1%) |
| $100,000 and over | 728 (100.0%) | 0 (0.0%) |
Public vs Private Health Insurance Coverage by Age in South Padre Island
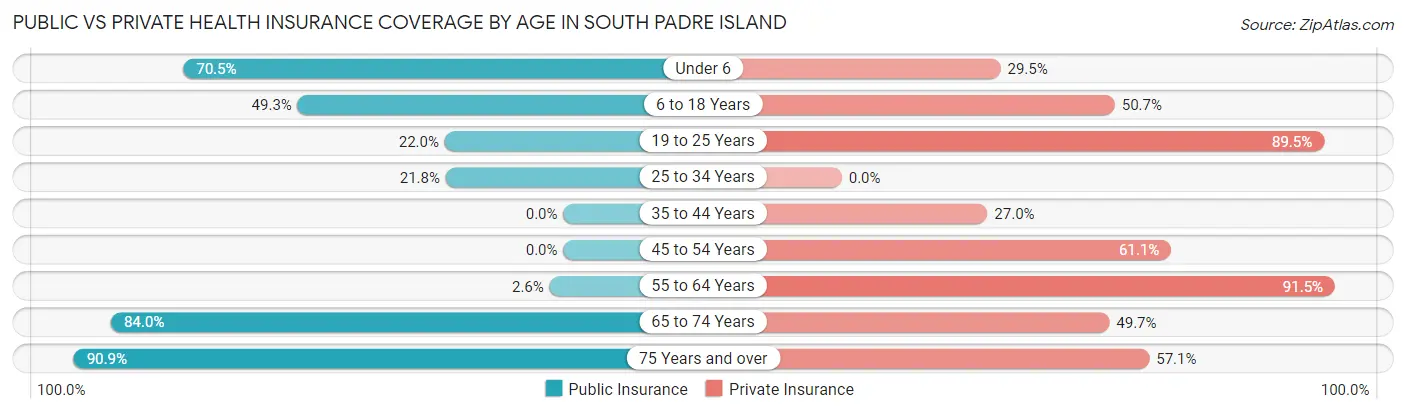
| Age Bracket | Public Insurance | Private Insurance |
| Under 6 | 91 (70.5%) | 38 (29.5%) |
| 6 to 18 Years | 72 (49.3%) | 74 (50.7%) |
| 19 to 25 Years | 44 (22.0%) | 179 (89.5%) |
| 25 to 34 Years | 24 (21.8%) | 0 (0.0%) |
| 35 to 44 Years | 0 (0.0%) | 10 (27.0%) |
| 45 to 54 Years | 0 (0.0%) | 162 (61.1%) |
| 55 to 64 Years | 21 (2.5%) | 755 (91.5%) |
| 65 to 74 Years | 382 (84.0%) | 226 (49.7%) |
| 75 Years and over | 199 (90.9%) | 125 (57.1%) |
| Total | 833 (34.9%) | 1,569 (65.8%) |
Disability Status by Sex by Age in South Padre Island
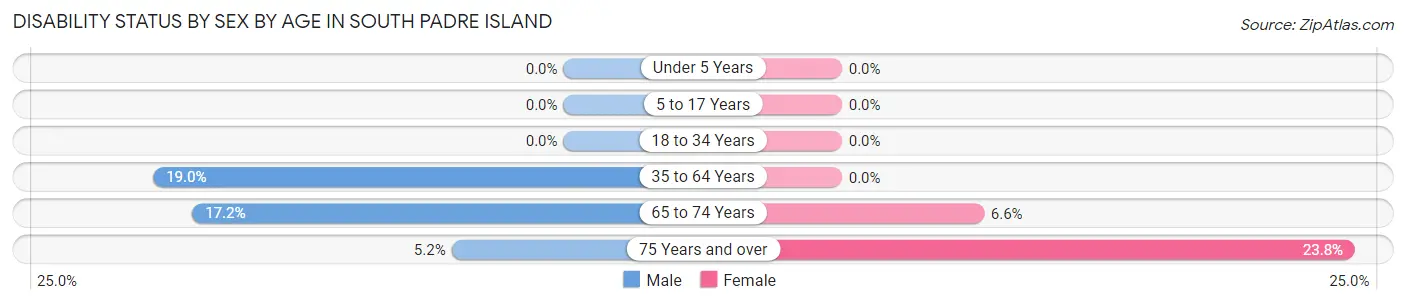
| Age Bracket | Male | Female |
| Under 5 Years | 0 (0.0%) | 0 (0.0%) |
| 5 to 17 Years | 0 (0.0%) | 0 (0.0%) |
| 18 to 34 Years | 0 (0.0%) | 0 (0.0%) |
| 35 to 64 Years | 98 (19.0%) | 0 (0.0%) |
| 65 to 74 Years | 47 (17.2%) | 12 (6.6%) |
| 75 Years and over | 7 (5.2%) | 20 (23.8%) |
Disability Class by Sex by Age in South Padre Island
Disability Class: Hearing Difficulty
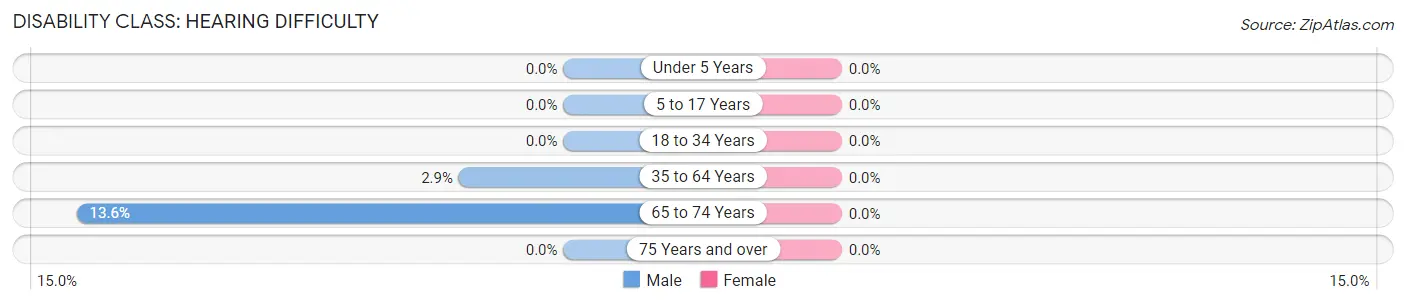
| Age Bracket | Male | Female |
| Under 5 Years | 0 (0.0%) | 0 (0.0%) |
| 5 to 17 Years | 0 (0.0%) | 0 (0.0%) |
| 18 to 34 Years | 0 (0.0%) | 0 (0.0%) |
| 35 to 64 Years | 15 (2.9%) | 0 (0.0%) |
| 65 to 74 Years | 37 (13.6%) | 0 (0.0%) |
| 75 Years and over | 0 (0.0%) | 0 (0.0%) |
Disability Class: Vision Difficulty
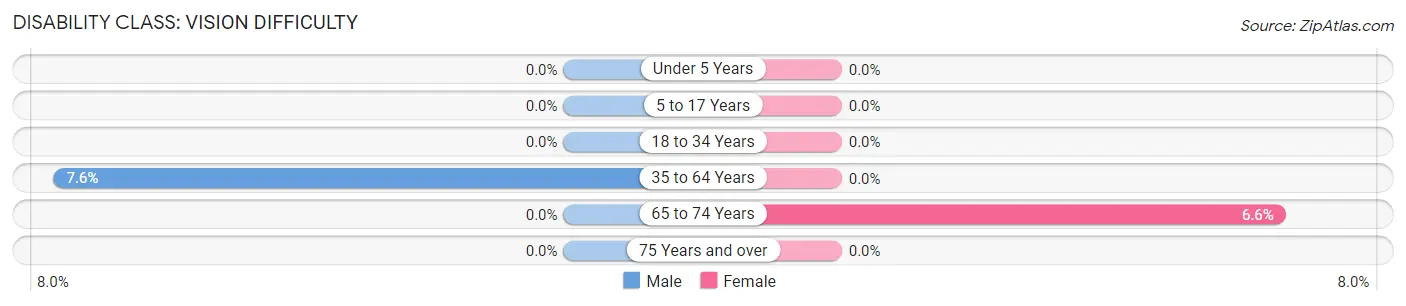
| Age Bracket | Male | Female |
| Under 5 Years | 0 (0.0%) | 0 (0.0%) |
| 5 to 17 Years | 0 (0.0%) | 0 (0.0%) |
| 18 to 34 Years | 0 (0.0%) | 0 (0.0%) |
| 35 to 64 Years | 39 (7.6%) | 0 (0.0%) |
| 65 to 74 Years | 0 (0.0%) | 12 (6.6%) |
| 75 Years and over | 0 (0.0%) | 0 (0.0%) |
Disability Class: Cognitive Difficulty
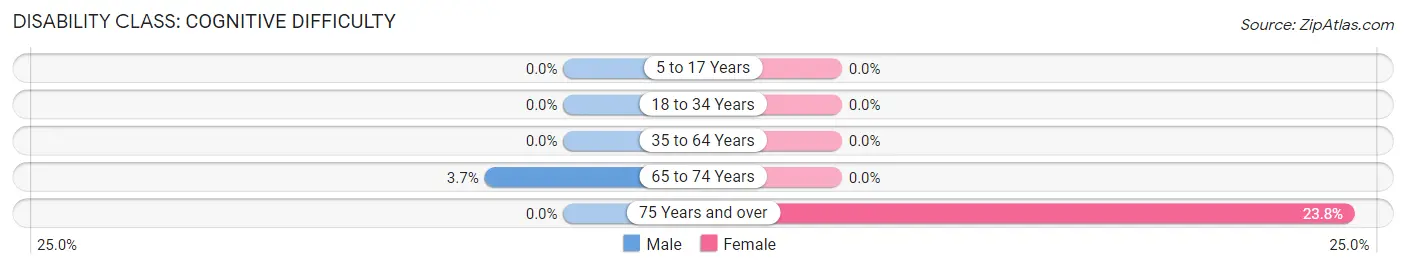
| Age Bracket | Male | Female |
| 5 to 17 Years | 0 (0.0%) | 0 (0.0%) |
| 18 to 34 Years | 0 (0.0%) | 0 (0.0%) |
| 35 to 64 Years | 0 (0.0%) | 0 (0.0%) |
| 65 to 74 Years | 10 (3.7%) | 0 (0.0%) |
| 75 Years and over | 0 (0.0%) | 20 (23.8%) |
Disability Class: Ambulatory Difficulty
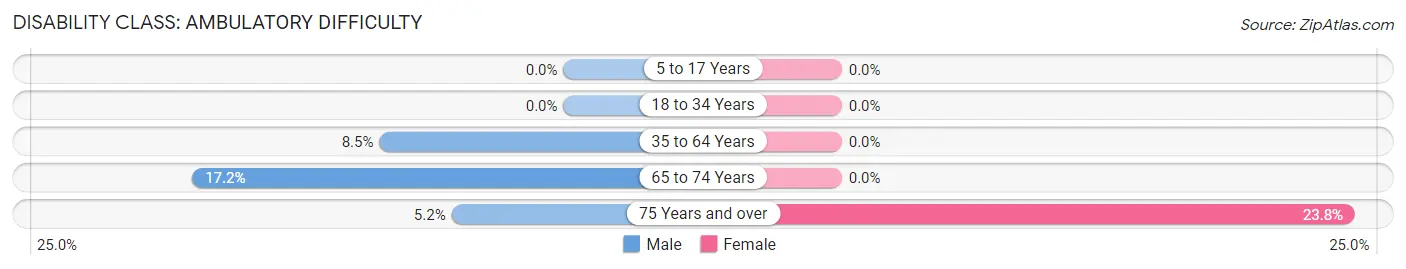
| Age Bracket | Male | Female |
| 5 to 17 Years | 0 (0.0%) | 0 (0.0%) |
| 18 to 34 Years | 0 (0.0%) | 0 (0.0%) |
| 35 to 64 Years | 44 (8.5%) | 0 (0.0%) |
| 65 to 74 Years | 47 (17.2%) | 0 (0.0%) |
| 75 Years and over | 7 (5.2%) | 20 (23.8%) |
Disability Class: Self-Care Difficulty
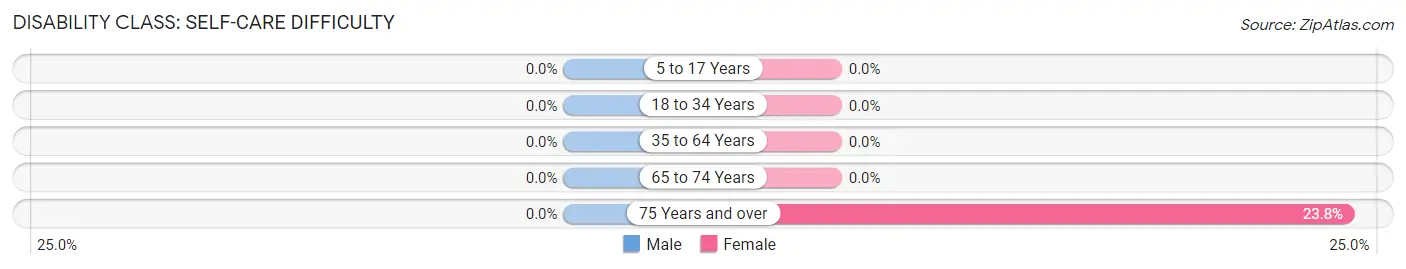
| Age Bracket | Male | Female |
| 5 to 17 Years | 0 (0.0%) | 0 (0.0%) |
| 18 to 34 Years | 0 (0.0%) | 0 (0.0%) |
| 35 to 64 Years | 0 (0.0%) | 0 (0.0%) |
| 65 to 74 Years | 0 (0.0%) | 0 (0.0%) |
| 75 Years and over | 0 (0.0%) | 20 (23.8%) |
Technology Access in South Padre Island
Computing Device Access in South Padre Island
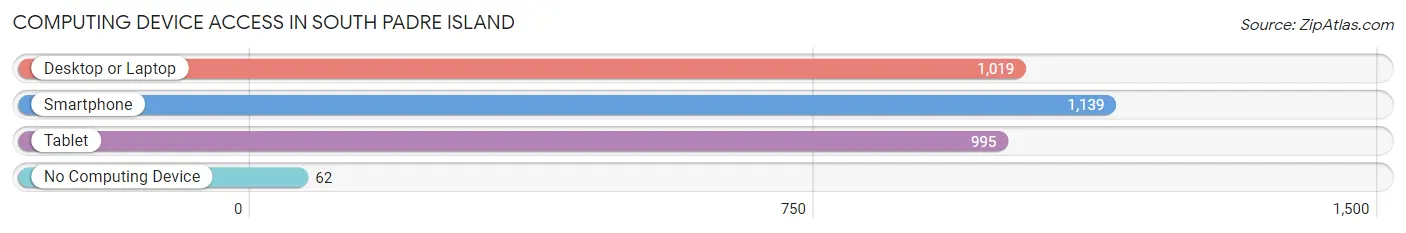
| Device Type | # Households | % Households |
| Desktop or Laptop | 1,019 | 82.6% |
| Smartphone | 1,139 | 92.4% |
| Tablet | 995 | 80.7% |
| No Computing Device | 62 | 5.0% |
| Total | 1,233 | 100.0% |
Internet Access in South Padre Island
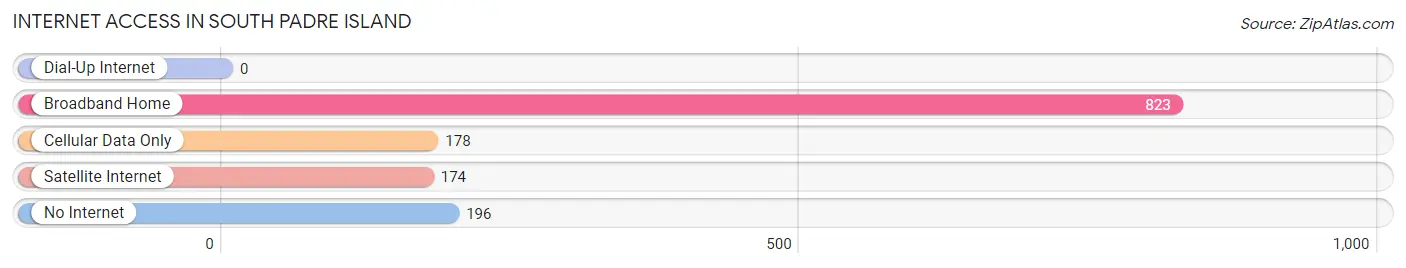
| Internet Type | # Households | % Households |
| Dial-Up Internet | 0 | 0.0% |
| Broadband Home | 823 | 66.7% |
| Cellular Data Only | 178 | 14.4% |
| Satellite Internet | 174 | 14.1% |
| No Internet | 196 | 15.9% |
| Total | 1,233 | 100.0% |
South Padre Island Summary
Padre Island is a barrier island located off the coast of South Texas in the Gulf of Mexico. It is the longest barrier island in the world, stretching over 130 miles from the mouth of the Rio Grande to the northern tip of Mustang Island. The island is divided into two distinct regions: North Padre Island and South Padre Island. South Padre Island is a popular tourist destination, known for its white sand beaches, warm waters, and vibrant nightlife.
History
The history of South Padre Island dates back to the 16th century when Spanish explorers first arrived in the area. The island was originally inhabited by the Karankawa Indians, who were later displaced by Spanish settlers. The island was used as a base for Spanish exploration and colonization of the region. In the 19th century, the island was used as a base for smuggling and piracy.
In the early 20th century, the island was developed as a resort destination. The first hotel was built in the 1920s, and the island quickly became a popular destination for vacationers. In the 1950s, the island was developed further with the construction of a bridge connecting it to the mainland.
Geography
South Padre Island is located in the Gulf of Mexico, off the coast of South Texas. It is the longest barrier island in the world, stretching over 130 miles from the mouth of the Rio Grande to the northern tip of Mustang Island. The island is divided into two distinct regions: North Padre Island and South Padre Island.
The island is characterized by its white sand beaches, warm waters, and lush vegetation. The island is home to a variety of wildlife, including sea turtles, dolphins, and a variety of birds. The island is also home to a number of state parks, including the Padre Island National Seashore.
Economy
The economy of South Padre Island is largely driven by tourism. The island is a popular destination for vacationers, with its white sand beaches, warm waters, and vibrant nightlife. The island is also home to a number of resorts, hotels, restaurants, and other businesses catering to tourists.
The island is also home to a number of fishing and shrimping operations. The island is also home to a number of oil and gas production facilities.
Demographics
As of the 2010 census, the population of South Padre Island was 2,816. The population is largely composed of vacationers and seasonal residents. The island is also home to a number of permanent residents, many of whom are employed in the tourism and fishing industries. The median age of the population is 37.7 years, and the median household income is $45,890. The majority of the population is white (83.3%), followed by Hispanic (14.2%) and African American (1.5%).
Common Questions
What is the Total Population of South Padre Island?
Total Population of South Padre Island is 2,386.
What is the Total Male Population of South Padre Island?
Total Male Population of South Padre Island is 1,373.
What is the Total Female Population of South Padre Island?
Total Female Population of South Padre Island is 1,013.
What is the Ratio of Males per 100 Females in South Padre Island?
There are 135.54 Males per 100 Females in South Padre Island.
What is the Ratio of Females per 100 Males in South Padre Island?
There are 73.78 Females per 100 Males in South Padre Island.
What is the Median Population Age in South Padre Island?
Median Population Age in South Padre Island is 58.5 Years.
What is the Average Family Size in South Padre Island
Average Family Size in South Padre Island is 2.3 People.
What is the Average Household Size in South Padre Island
Average Household Size in South Padre Island is 1.9 People.
What is Per Capita Income in South Padre Island?
Per Capita income in South Padre Island is $52,745.
What is the Median Family Income in South Padre Island?
Median Family Income in South Padre Island is $82,701.
What is the Median Household income in South Padre Island?
Median Household Income in South Padre Island is $62,557.
What is Income or Wage Gap in South Padre Island?
Income or Wage Gap in South Padre Island is 3.1%.
Women in South Padre Island earn 96.9 cents for every dollar earned by a man.
What is Inequality or Gini Index in South Padre Island?
Inequality or Gini Index in South Padre Island is 0.48.
How Large is the Labor Force in South Padre Island?
There are 1,416 People in the Labor Forcein in South Padre Island.
What is the Percentage of People in the Labor Force in South Padre Island?
65.6% of People are in the Labor Force in South Padre Island.
What is the Unemployment Rate in South Padre Island?
Unemployment Rate in South Padre Island is 3.4%.