Shadybrook, TX
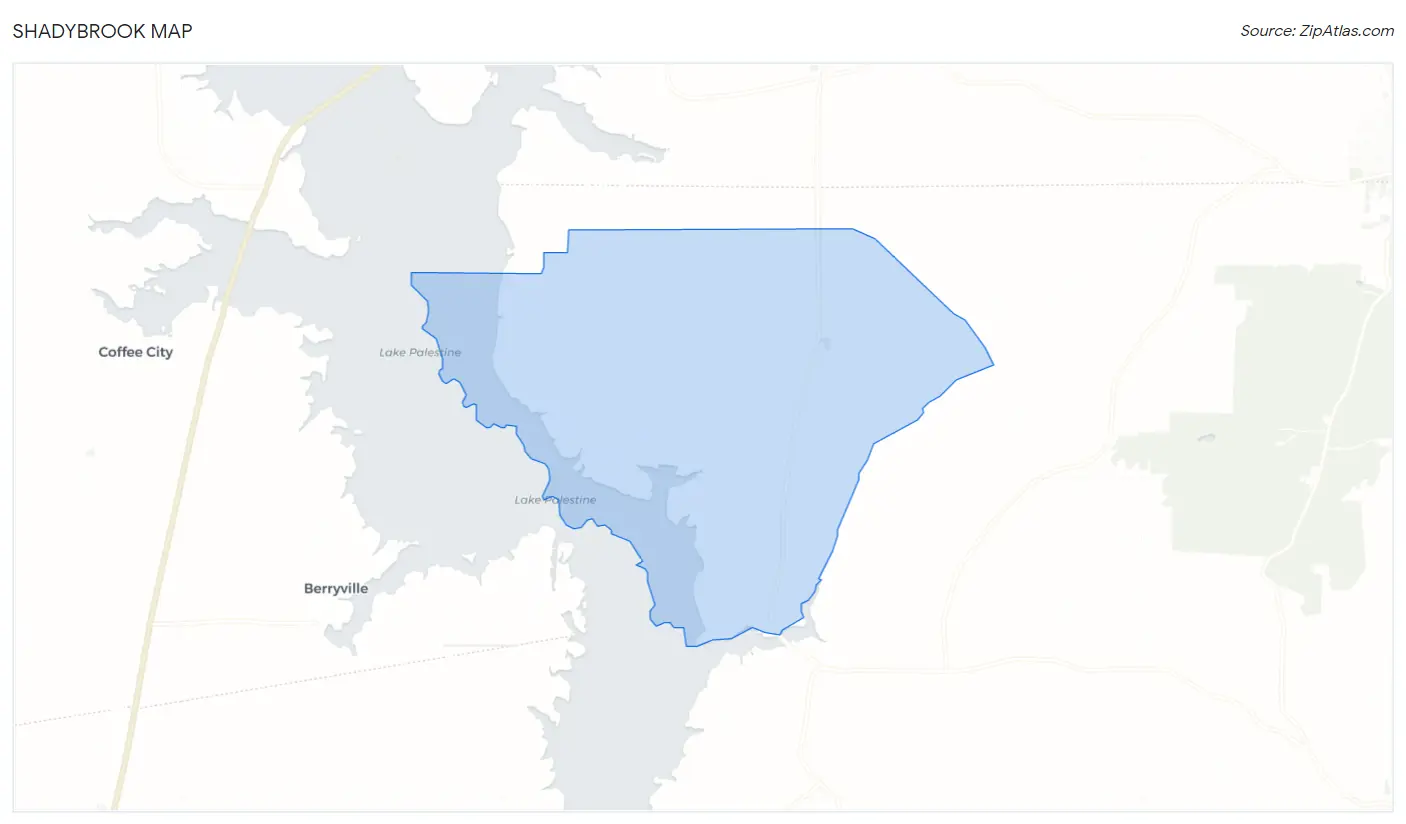
Shadybrook Map
Shadybrook Overview
2,315
TOTAL POPULATION
1,095
MALE POPULATION
1,220
FEMALE POPULATION
89.75
MALES / 100 FEMALES
111.42
FEMALES / 100 MALES
48.2
MEDIAN AGE
2.8
AVG FAMILY SIZE
2.6
AVG HOUSEHOLD SIZE
$32,183
PER CAPITA INCOME
$72,656
AVG FAMILY INCOME
$64,798
AVG HOUSEHOLD INCOME
10.6%
WAGE / INCOME GAP [ % ]
89.4¢/ $1
WAGE / INCOME GAP [ $ ]
0.41
INEQUALITY / GINI INDEX
1,003
LABOR FORCE [ PEOPLE ]
54.8%
PERCENT IN LABOR FORCE
Race in Shadybrook
The most populous races in Shadybrook are White / Caucasian (2,165 | 93.5%), Hispanic or Latino (272 | 11.7%), and Two or more Races (136 | 5.9%).
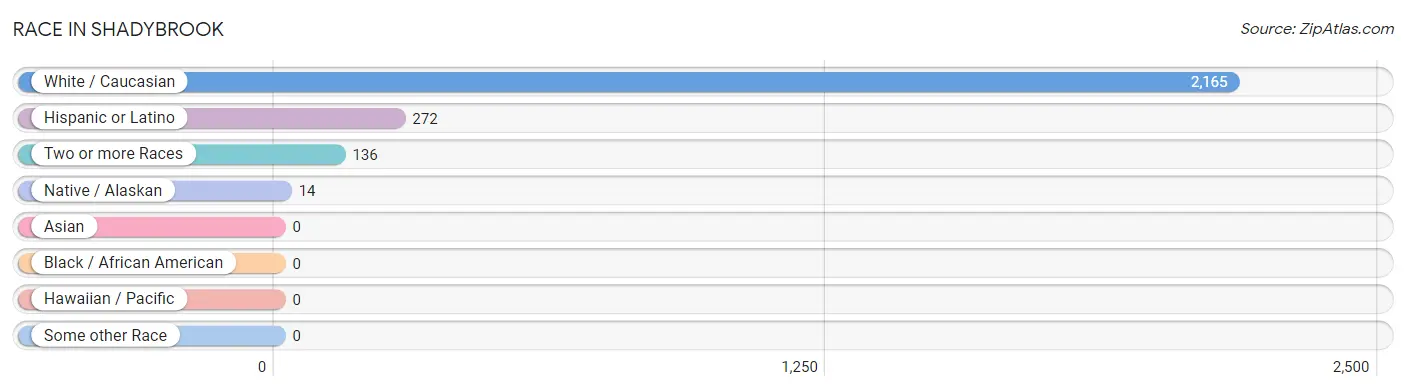
| Race | # Population | % Population |
| Asian | 0 | 0.0% |
| Black / African American | 0 | 0.0% |
| Hawaiian / Pacific | 0 | 0.0% |
| Hispanic or Latino | 272 | 11.7% |
| Native / Alaskan | 14 | 0.6% |
| White / Caucasian | 2,165 | 93.5% |
| Two or more Races | 136 | 5.9% |
| Some other Race | 0 | 0.0% |
| Total | 2,315 | 100.0% |
Ancestry in Shadybrook
The most populous ancestries reported in Shadybrook are English (366 | 15.8%), German (331 | 14.3%), Mexican (272 | 11.7%), Irish (230 | 9.9%), and Scottish (180 | 7.8%), together accounting for 59.6% of all Shadybrook residents.
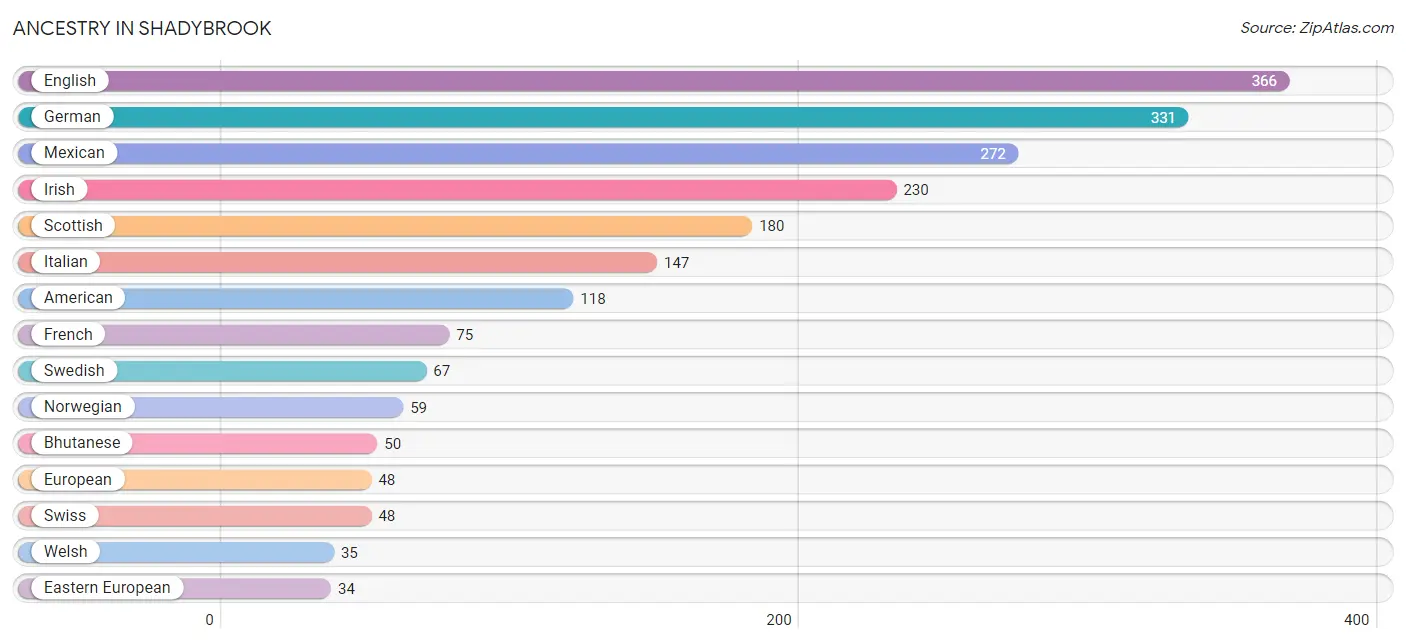
| Ancestry | # Population | % Population |
| American | 118 | 5.1% |
| Bhutanese | 50 | 2.2% |
| British | 14 | 0.6% |
| Czechoslovakian | 27 | 1.2% |
| Dutch | 29 | 1.3% |
| Eastern European | 34 | 1.5% |
| English | 366 | 15.8% |
| European | 48 | 2.1% |
| French | 75 | 3.2% |
| French Canadian | 14 | 0.6% |
| German | 331 | 14.3% |
| Irish | 230 | 9.9% |
| Italian | 147 | 6.4% |
| Korean | 22 | 0.9% |
| Mexican | 272 | 11.7% |
| Norwegian | 59 | 2.5% |
| Polish | 21 | 0.9% |
| Scotch-Irish | 13 | 0.6% |
| Scottish | 180 | 7.8% |
| Swedish | 67 | 2.9% |
| Swiss | 48 | 2.1% |
| Welsh | 35 | 1.5% | View All 22 Rows |
Immigrants in Shadybrook
The most numerous immigrant groups reported in Shadybrook came from Central America (111 | 4.8%), Latin America (111 | 4.8%), Mexico (111 | 4.8%), Canada (35 | 1.5%), and Asia (24 | 1.0%), together accounting for 16.9% of all Shadybrook residents.
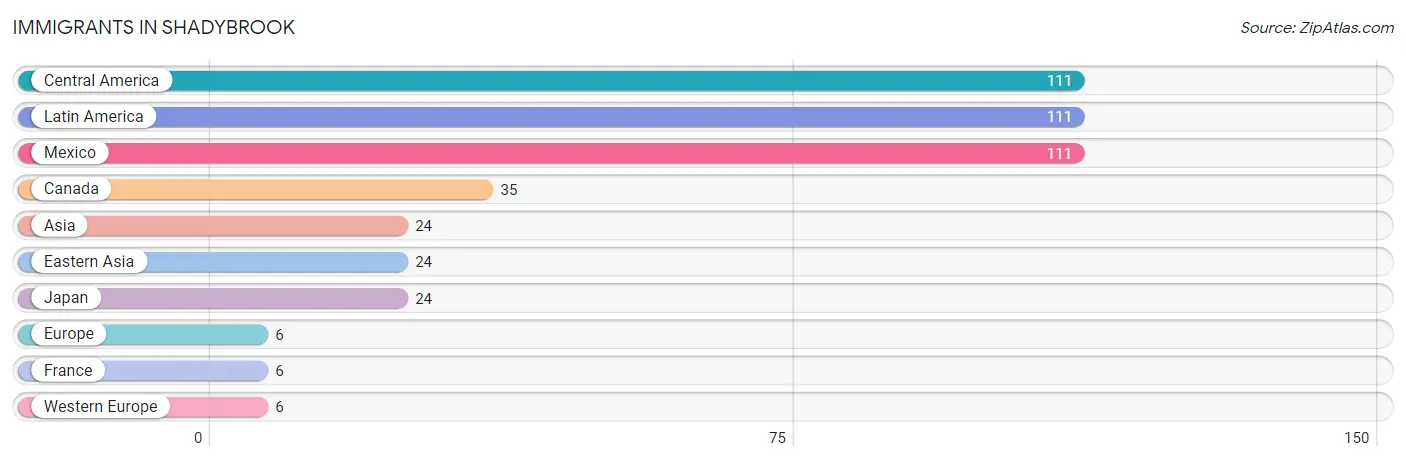
| Immigration Origin | # Population | % Population |
| Asia | 24 | 1.0% |
| Canada | 35 | 1.5% |
| Central America | 111 | 4.8% |
| Eastern Asia | 24 | 1.0% |
| Europe | 6 | 0.3% |
| France | 6 | 0.3% |
| Japan | 24 | 1.0% |
| Latin America | 111 | 4.8% |
| Mexico | 111 | 4.8% |
| Western Europe | 6 | 0.3% | View All 10 Rows |
Sex and Age in Shadybrook
Sex and Age in Shadybrook
The most populous age groups in Shadybrook are 60 to 64 Years (128 | 11.7%) for men and 60 to 64 Years (187 | 15.3%) for women.
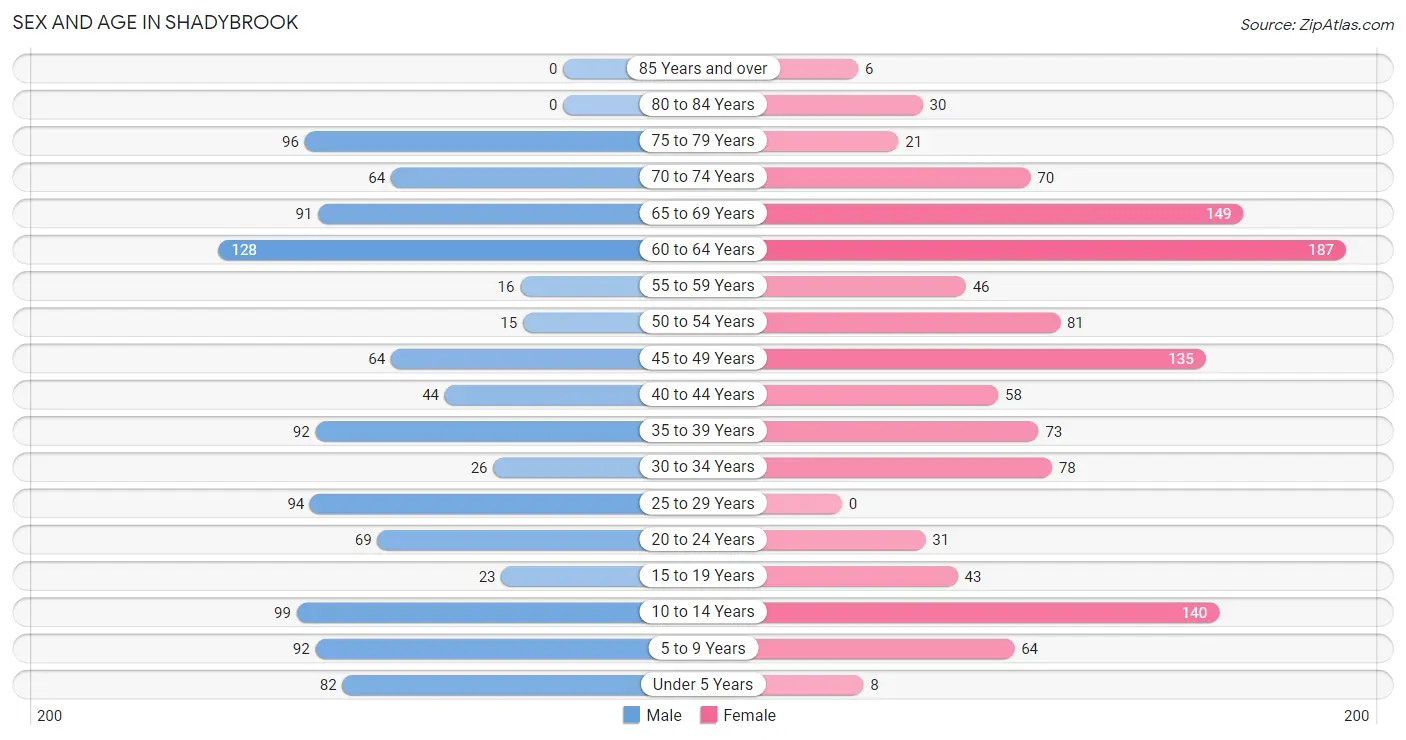
| Age Bracket | Male | Female |
| Under 5 Years | 82 (7.5%) | 8 (0.7%) |
| 5 to 9 Years | 92 (8.4%) | 64 (5.2%) |
| 10 to 14 Years | 99 (9.0%) | 140 (11.5%) |
| 15 to 19 Years | 23 (2.1%) | 43 (3.5%) |
| 20 to 24 Years | 69 (6.3%) | 31 (2.5%) |
| 25 to 29 Years | 94 (8.6%) | 0 (0.0%) |
| 30 to 34 Years | 26 (2.4%) | 78 (6.4%) |
| 35 to 39 Years | 92 (8.4%) | 73 (6.0%) |
| 40 to 44 Years | 44 (4.0%) | 58 (4.8%) |
| 45 to 49 Years | 64 (5.8%) | 135 (11.1%) |
| 50 to 54 Years | 15 (1.4%) | 81 (6.6%) |
| 55 to 59 Years | 16 (1.5%) | 46 (3.8%) |
| 60 to 64 Years | 128 (11.7%) | 187 (15.3%) |
| 65 to 69 Years | 91 (8.3%) | 149 (12.2%) |
| 70 to 74 Years | 64 (5.8%) | 70 (5.7%) |
| 75 to 79 Years | 96 (8.8%) | 21 (1.7%) |
| 80 to 84 Years | 0 (0.0%) | 30 (2.5%) |
| 85 Years and over | 0 (0.0%) | 6 (0.5%) |
| Total | 1,095 (100.0%) | 1,220 (100.0%) |
Families and Households in Shadybrook
Median Family Size in Shadybrook
The median family size in Shadybrook is 2.84 persons per family, with married-couple families (451 | 66.0%) accounting for the largest median family size of 3.15 persons per family. On the other hand, single male/father families (107 | 15.7%) represent the smallest median family size with 1.73 persons per family.
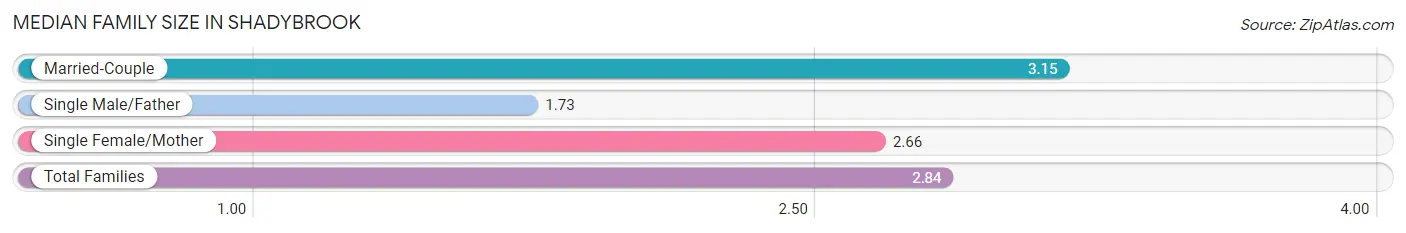
| Family Type | # Families | Family Size |
| Married-Couple | 451 (66.0%) | 3.15 |
| Single Male/Father | 107 (15.7%) | 1.73 |
| Single Female/Mother | 125 (18.3%) | 2.66 |
| Total Families | 683 (100.0%) | 2.84 |
Median Household Size in Shadybrook
The median household size in Shadybrook is 2.56 persons per household, with married-couple households (451 | 49.9%) accounting for the largest median household size of 3.15 persons per household. non-family households (221 | 24.4%) represent the smallest median household size with 1.45 persons per household.
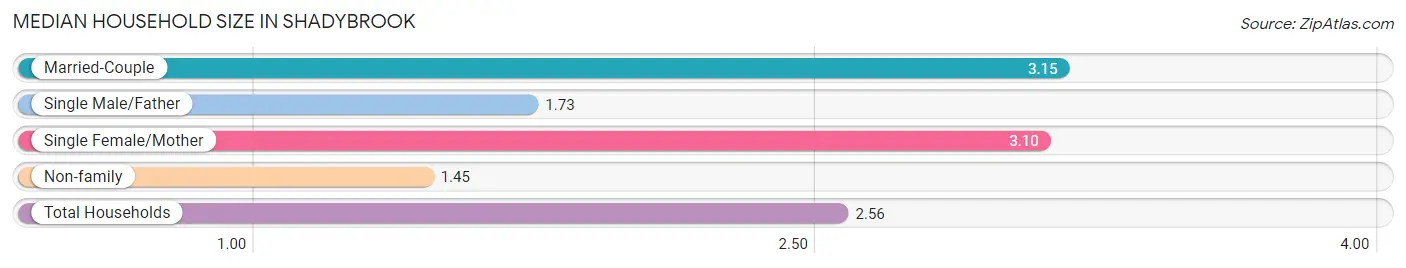
| Household Type | # Households | Household Size |
| Married-Couple | 451 (49.9%) | 3.15 |
| Single Male/Father | 107 (11.8%) | 1.73 |
| Single Female/Mother | 125 (13.8%) | 3.10 |
| Non-family | 221 (24.4%) | 1.45 |
| Total Households | 904 (100.0%) | 2.56 |
Household Size by Marriage Status in Shadybrook
Out of a total of 904 households in Shadybrook, 683 (75.5%) are family households, while 221 (24.4%) are nonfamily households. The most numerous type of family households are 2-person households, comprising 347, and the most common type of nonfamily households are 1-person households, comprising 144.
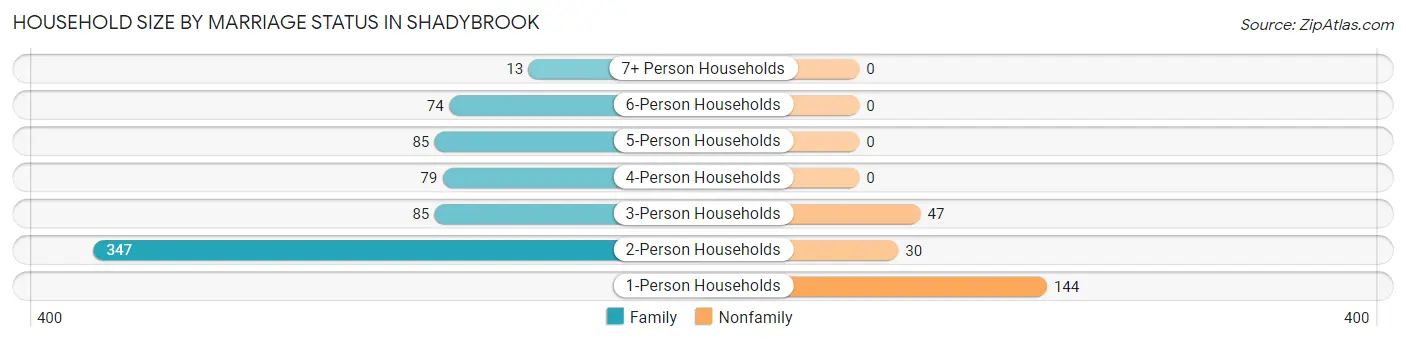
| Household Size | Family Households | Nonfamily Households |
| 1-Person Households | - | 144 (15.9%) |
| 2-Person Households | 347 (38.4%) | 30 (3.3%) |
| 3-Person Households | 85 (9.4%) | 47 (5.2%) |
| 4-Person Households | 79 (8.7%) | 0 (0.0%) |
| 5-Person Households | 85 (9.4%) | 0 (0.0%) |
| 6-Person Households | 74 (8.2%) | 0 (0.0%) |
| 7+ Person Households | 13 (1.4%) | 0 (0.0%) |
| Total | 683 (75.5%) | 221 (24.4%) |
Female Fertility in Shadybrook
Fertility by Age in Shadybrook
Average fertility rate in Shadybrook is 29.0 births per 1,000 women. Women in the age bracket of 20 to 34 years have the highest fertility rate with 110.0 births per 1,000 women. Women in the age bracket of 20 to 34 years acount for 100.0% of all women with births.
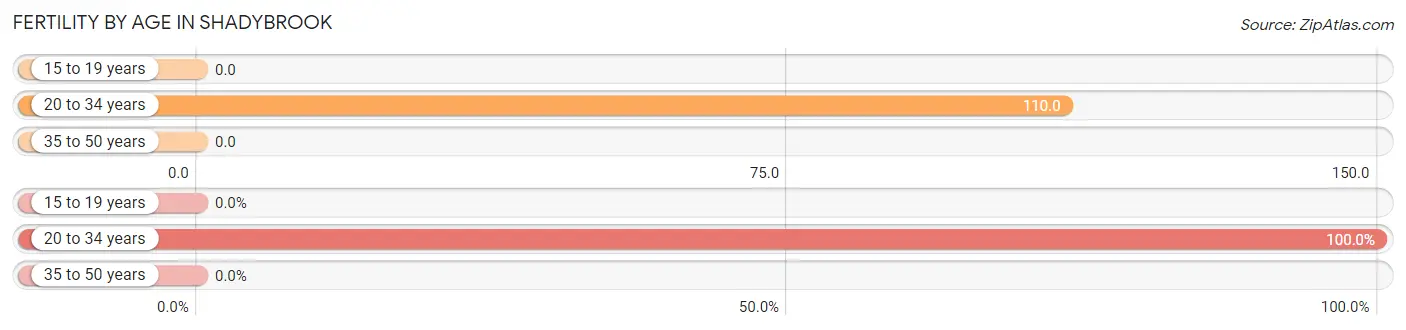
| Age Bracket | Women with Births | Births / 1,000 Women |
| 15 to 19 years | 0 (0.0%) | 0.0 |
| 20 to 34 years | 12 (100.0%) | 110.0 |
| 35 to 50 years | 0 (0.0%) | 0.0 |
| Total | 12 (100.0%) | 29.0 |
Fertility by Age by Marriage Status in Shadybrook
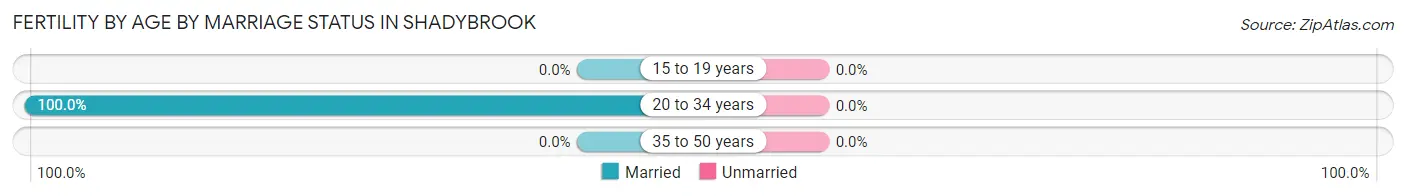
| Age Bracket | Married | Unmarried |
| 15 to 19 years | 0 (0.0%) | 0 (0.0%) |
| 20 to 34 years | 12 (100.0%) | 0 (0.0%) |
| 35 to 50 years | 0 (0.0%) | 0 (0.0%) |
| Total | 12 (100.0%) | 0 (0.0%) |
Fertility by Education in Shadybrook
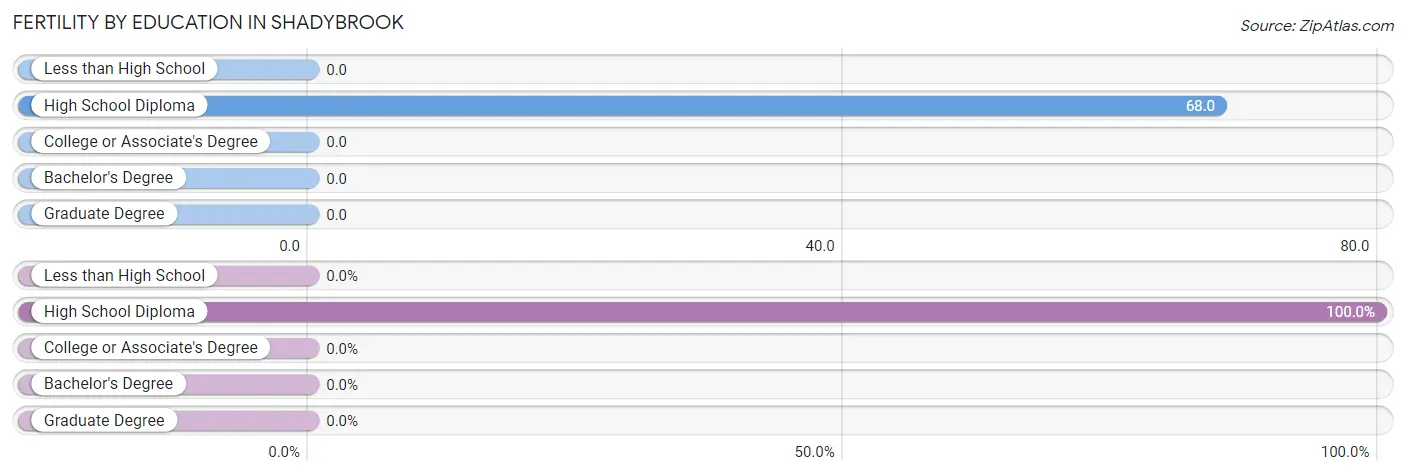
| Educational Attainment | Women with Births | Births / 1,000 Women |
| Less than High School | 0 (0.0%) | 0.0 |
| High School Diploma | 12 (100.0%) | 68.0 |
| College or Associate's Degree | 0 (0.0%) | 0.0 |
| Bachelor's Degree | 0 (0.0%) | 0.0 |
| Graduate Degree | 0 (0.0%) | 0.0 |
| Total | 12 (100.0%) | 29.0 |
Fertility by Education by Marriage Status in Shadybrook
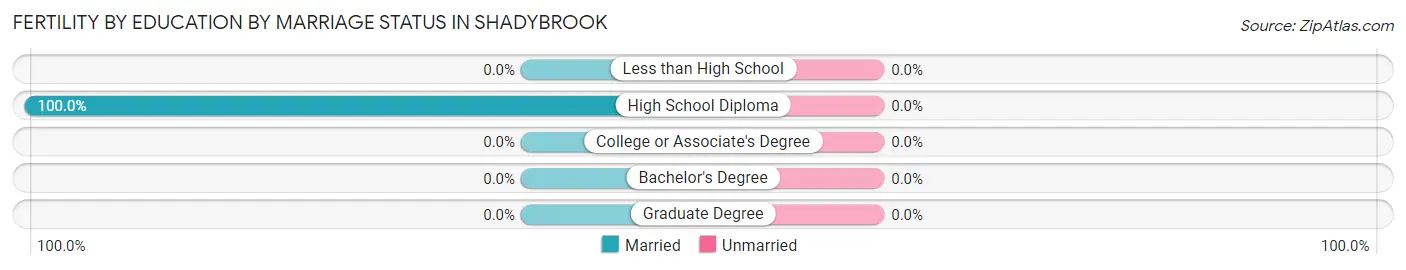
| Educational Attainment | Married | Unmarried |
| Less than High School | 0 (0.0%) | 0 (0.0%) |
| High School Diploma | 12 (100.0%) | 0 (0.0%) |
| College or Associate's Degree | 0 (0.0%) | 0 (0.0%) |
| Bachelor's Degree | 0 (0.0%) | 0 (0.0%) |
| Graduate Degree | 0 (0.0%) | 0 (0.0%) |
| Total | 12 (100.0%) | 0 (0.0%) |
Income in Shadybrook
Income Overview in Shadybrook
Per Capita Income in Shadybrook is $32,183, while median incomes of families and households are $72,656 and $64,798 respectively.
| Characteristic | Number | Measure |
| Per Capita Income | 2,315 | $32,183 |
| Median Family Income | 683 | $72,656 |
| Mean Family Income | 683 | $95,001 |
| Median Household Income | 904 | $64,798 |
| Mean Household Income | 904 | $84,522 |
| Income Deficit | 683 | $0 |
| Wage / Income Gap (%) | 2,315 | 10.64% |
| Wage / Income Gap ($) | 2,315 | 89.36¢ per $1 |
| Gini / Inequality Index | 2,315 | 0.41 |
Earnings by Sex in Shadybrook
Average Earnings in Shadybrook are $31,791, $32,399 for men and $28,953 for women, a difference of 10.6%.
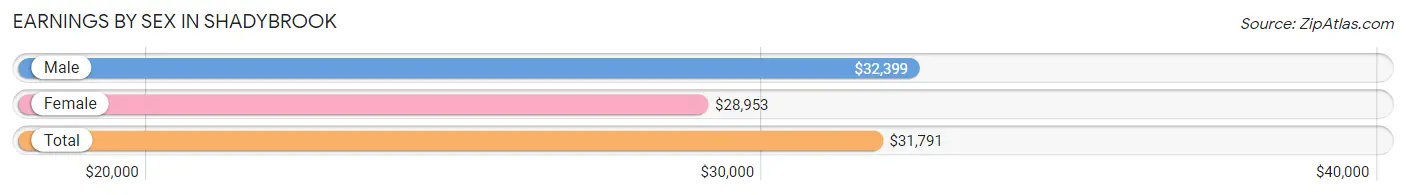
| Sex | Number | Average Earnings |
| Male | 490 (44.6%) | $32,399 |
| Female | 608 (55.4%) | $28,953 |
| Total | 1,098 (100.0%) | $31,791 |
Earnings by Sex by Income Bracket in Shadybrook
The most common earnings brackets in Shadybrook are $65,000 to $74,999 for men (76 | 15.5%) and $15,000 to $17,499 for women (108 | 17.8%).
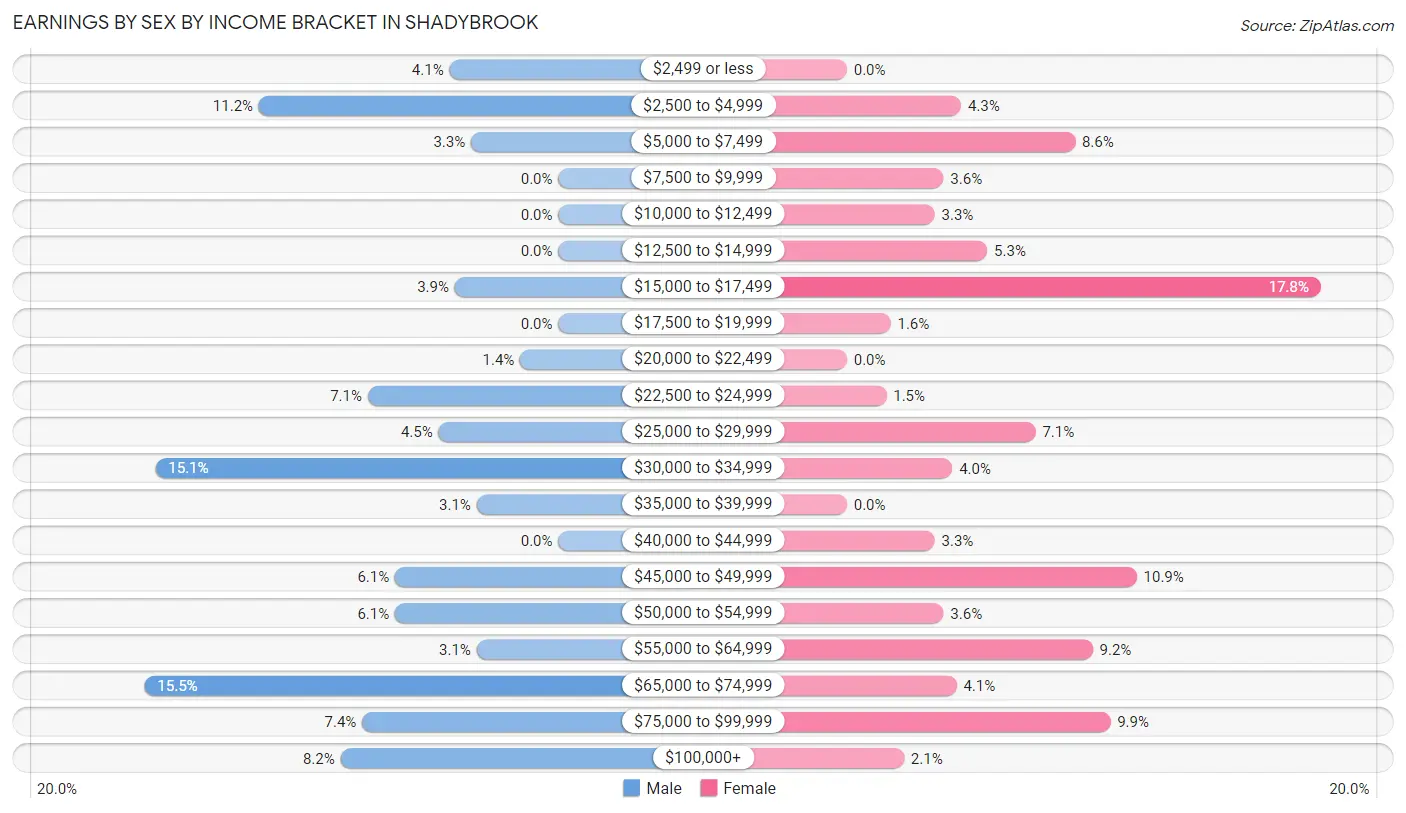
| Income | Male | Female |
| $2,499 or less | 20 (4.1%) | 0 (0.0%) |
| $2,500 to $4,999 | 55 (11.2%) | 26 (4.3%) |
| $5,000 to $7,499 | 16 (3.3%) | 52 (8.6%) |
| $7,500 to $9,999 | 0 (0.0%) | 22 (3.6%) |
| $10,000 to $12,499 | 0 (0.0%) | 20 (3.3%) |
| $12,500 to $14,999 | 0 (0.0%) | 32 (5.3%) |
| $15,000 to $17,499 | 19 (3.9%) | 108 (17.8%) |
| $17,500 to $19,999 | 0 (0.0%) | 10 (1.6%) |
| $20,000 to $22,499 | 7 (1.4%) | 0 (0.0%) |
| $22,500 to $24,999 | 35 (7.1%) | 9 (1.5%) |
| $25,000 to $29,999 | 22 (4.5%) | 43 (7.1%) |
| $30,000 to $34,999 | 74 (15.1%) | 24 (4.0%) |
| $35,000 to $39,999 | 15 (3.1%) | 0 (0.0%) |
| $40,000 to $44,999 | 0 (0.0%) | 20 (3.3%) |
| $45,000 to $49,999 | 30 (6.1%) | 66 (10.9%) |
| $50,000 to $54,999 | 30 (6.1%) | 22 (3.6%) |
| $55,000 to $64,999 | 15 (3.1%) | 56 (9.2%) |
| $65,000 to $74,999 | 76 (15.5%) | 25 (4.1%) |
| $75,000 to $99,999 | 36 (7.3%) | 60 (9.9%) |
| $100,000+ | 40 (8.2%) | 13 (2.1%) |
| Total | 490 (100.0%) | 608 (100.0%) |
Earnings by Sex by Educational Attainment in Shadybrook
Average earnings in Shadybrook are $37,417 for men and $29,855 for women, a difference of 20.2%. Men with an educational attainment of less than high school enjoy the highest average annual earnings of $68,306, while those with high school diploma education earn the least with $31,216. Women with an educational attainment of graduate degree earn the most with the average annual earnings of $88,714, while those with college or associate's degree education have the smallest earnings of $15,194.
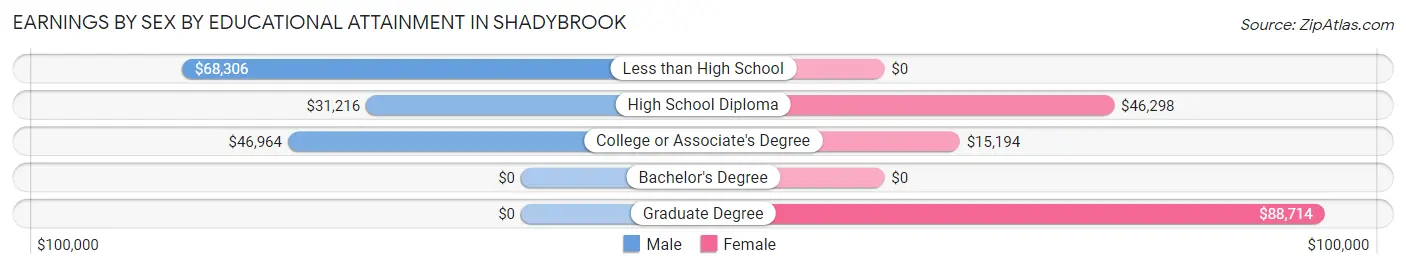
| Educational Attainment | Male Income | Female Income |
| Less than High School | $68,306 | $0 |
| High School Diploma | $31,216 | $46,298 |
| College or Associate's Degree | $46,964 | $15,194 |
| Bachelor's Degree | - | - |
| Graduate Degree | - | - |
| Total | $37,417 | $29,855 |
Family Income in Shadybrook
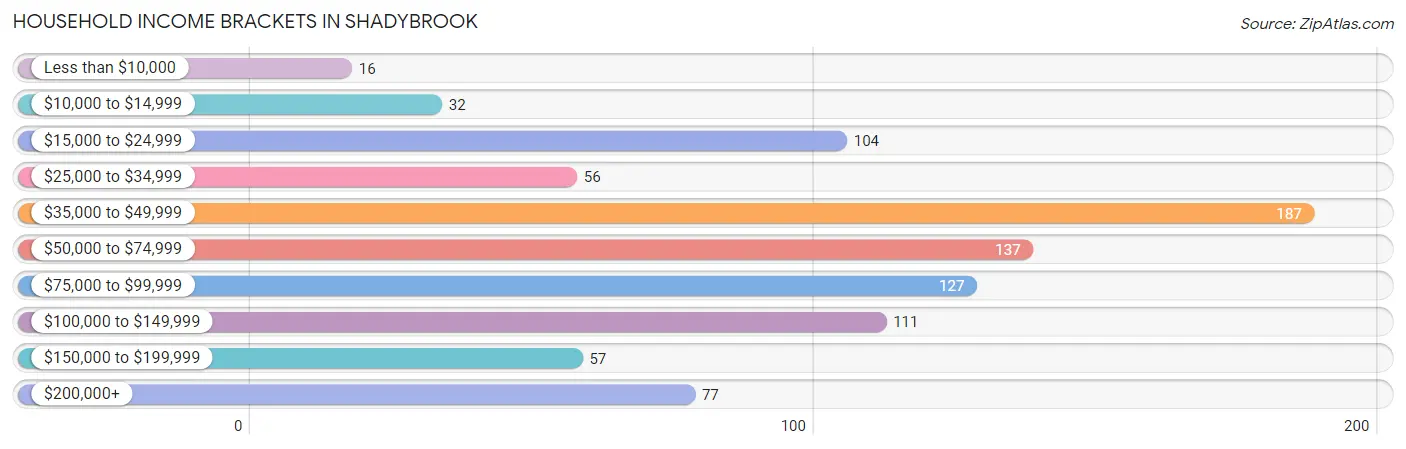
Family Income Brackets in Shadybrook
According to the Shadybrook family income data, there are 157 families falling into the $50,000 to $74,999 income range, which is the most common income bracket and makes up 23.0% of all families. Conversely, the less than $10,000 income bracket is the least frequent group with only 13 families (1.9%) belonging to this category.
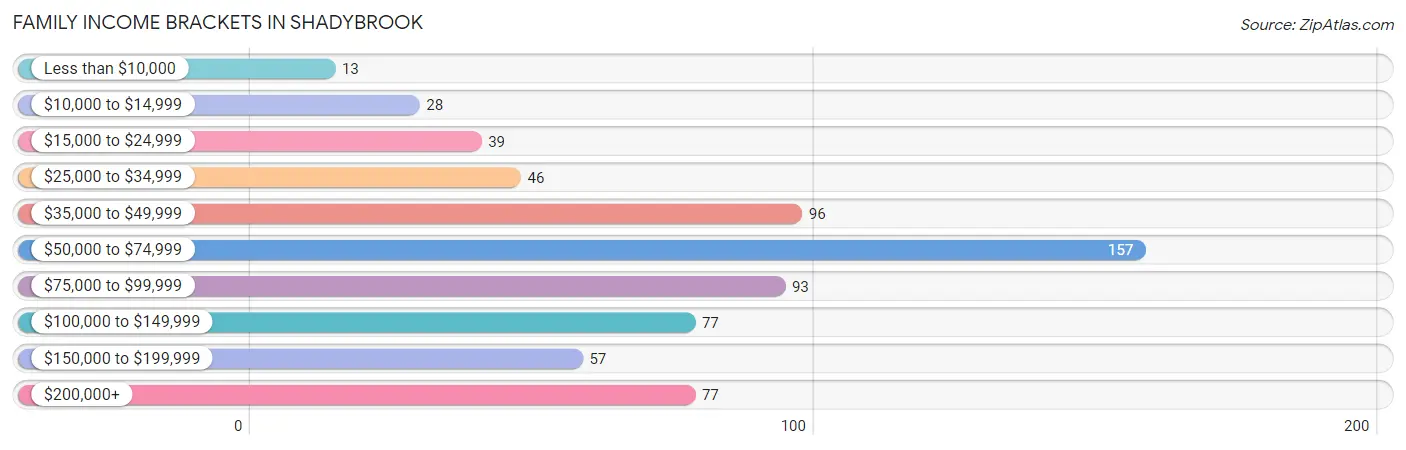
| Income Bracket | # Families | % Families |
| Less than $10,000 | 13 | 1.9% |
| $10,000 to $14,999 | 28 | 4.1% |
| $15,000 to $24,999 | 39 | 5.7% |
| $25,000 to $34,999 | 46 | 6.7% |
| $35,000 to $49,999 | 96 | 14.1% |
| $50,000 to $74,999 | 157 | 23.0% |
| $75,000 to $99,999 | 93 | 13.6% |
| $100,000 to $149,999 | 77 | 11.3% |
| $150,000 to $199,999 | 57 | 8.3% |
| $200,000+ | 77 | 11.3% |
Family Income by Famaliy Size in Shadybrook
2-person families (375 | 54.9%) account for the highest median family income in Shadybrook with $74,875 per family, while 2-person families (375 | 54.9%) have the highest median income of $37,438 per family member.
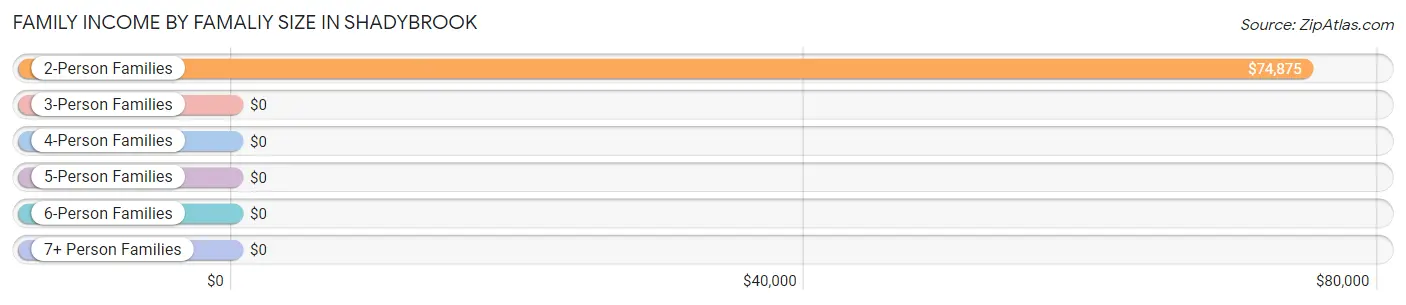
| Income Bracket | # Families | Median Income |
| 2-Person Families | 375 (54.9%) | $74,875 |
| 3-Person Families | 77 (11.3%) | $0 |
| 4-Person Families | 59 (8.6%) | $0 |
| 5-Person Families | 85 (12.4%) | $0 |
| 6-Person Families | 87 (12.7%) | $0 |
| 7+ Person Families | 0 (0.0%) | $0 |
| Total | 683 (100.0%) | $72,656 |
Family Income by Number of Earners in Shadybrook
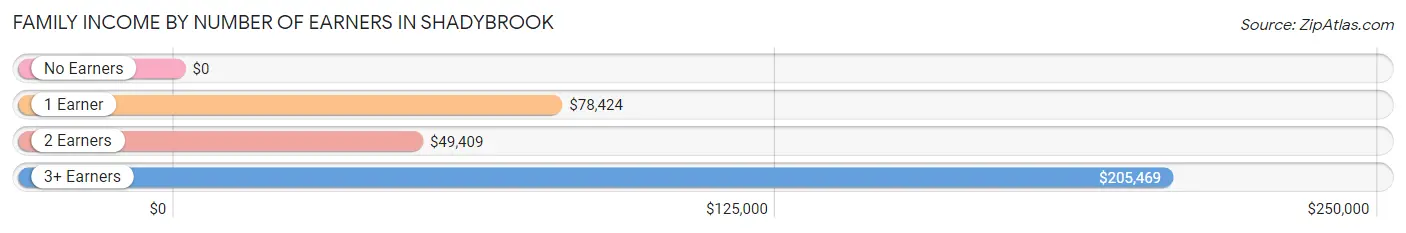
| Number of Earners | # Families | Median Income |
| No Earners | 90 (13.2%) | $0 |
| 1 Earner | 287 (42.0%) | $78,424 |
| 2 Earners | 241 (35.3%) | $49,409 |
| 3+ Earners | 65 (9.5%) | $205,469 |
| Total | 683 (100.0%) | $72,656 |
Household Income in Shadybrook
Household Income Brackets in Shadybrook
With 187 households falling in the category, the $35,000 to $49,999 income range is the most frequent in Shadybrook, accounting for 20.7% of all households. In contrast, only 16 households (1.8%) fall into the less than $10,000 income bracket, making it the least populous group.
| Income Bracket | # Households | % Households |
| Less than $10,000 | 16 | 1.8% |
| $10,000 to $14,999 | 32 | 3.5% |
| $15,000 to $24,999 | 104 | 11.5% |
| $25,000 to $34,999 | 56 | 6.2% |
| $35,000 to $49,999 | 187 | 20.7% |
| $50,000 to $74,999 | 137 | 15.2% |
| $75,000 to $99,999 | 127 | 14.0% |
| $100,000 to $149,999 | 111 | 12.3% |
| $150,000 to $199,999 | 57 | 6.3% |
| $200,000+ | 77 | 8.5% |
Household Income by Householder Age in Shadybrook
The median household income in Shadybrook is $64,798, with the highest median household income of $74,688 found in the 45 to 64 years age bracket for the primary householder. A total of 364 households (40.3%) fall into this category.
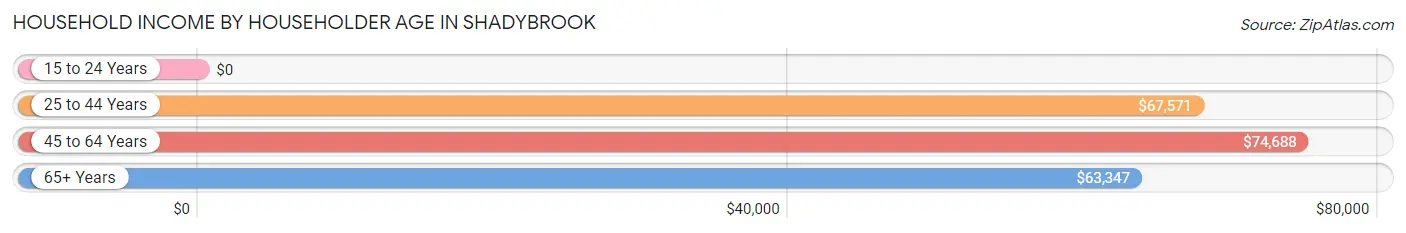
| Income Bracket | # Households | Median Income |
| 15 to 24 Years | 0 (0.0%) | $0 |
| 25 to 44 Years | 220 (24.3%) | $67,571 |
| 45 to 64 Years | 364 (40.3%) | $74,688 |
| 65+ Years | 320 (35.4%) | $63,347 |
| Total | 904 (100.0%) | $64,798 |
Poverty in Shadybrook
Income Below Poverty by Sex and Age in Shadybrook
With 11.6% poverty level for males and 10.5% for females among the residents of Shadybrook, 12 to 14 year old males and 6 to 11 year old females are the most vulnerable to poverty, with 48 males (100.0%) and 40 females (40.0%) in their respective age groups living below the poverty level.
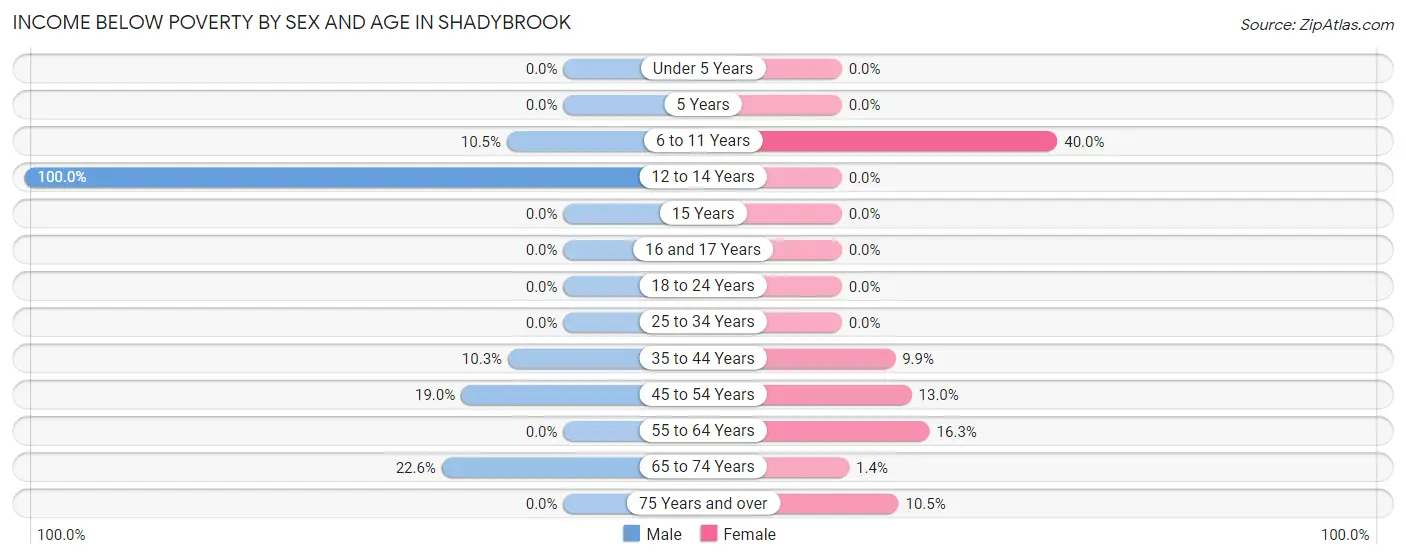
| Age Bracket | Male | Female |
| Under 5 Years | 0 (0.0%) | 0 (0.0%) |
| 5 Years | 0 (0.0%) | 0 (0.0%) |
| 6 to 11 Years | 15 (10.5%) | 40 (40.0%) |
| 12 to 14 Years | 48 (100.0%) | 0 (0.0%) |
| 15 Years | 0 (0.0%) | 0 (0.0%) |
| 16 and 17 Years | 0 (0.0%) | 0 (0.0%) |
| 18 to 24 Years | 0 (0.0%) | 0 (0.0%) |
| 25 to 34 Years | 0 (0.0%) | 0 (0.0%) |
| 35 to 44 Years | 14 (10.3%) | 13 (9.9%) |
| 45 to 54 Years | 15 (19.0%) | 28 (13.0%) |
| 55 to 64 Years | 0 (0.0%) | 38 (16.3%) |
| 65 to 74 Years | 35 (22.6%) | 3 (1.4%) |
| 75 Years and over | 0 (0.0%) | 6 (10.5%) |
| Total | 127 (11.6%) | 128 (10.5%) |
Income Above Poverty by Sex and Age in Shadybrook
According to the poverty statistics in Shadybrook, males aged under 5 years and females aged under 5 years are the age groups that are most secure financially, with 100.0% of males and 100.0% of females in these age groups living above the poverty line.
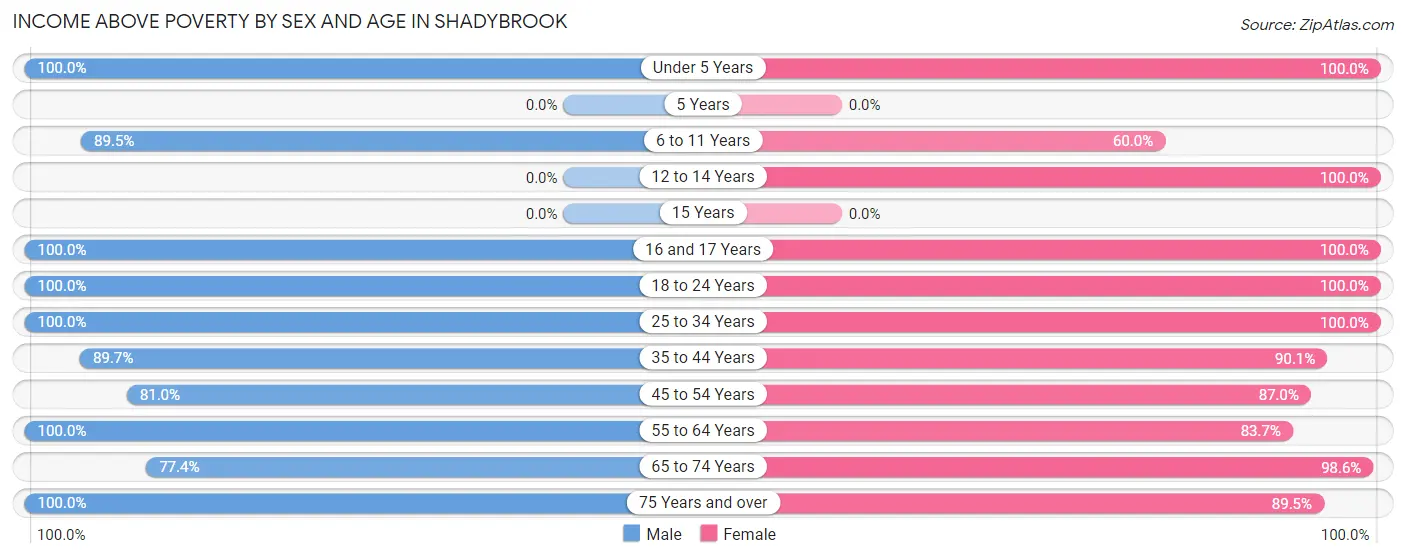
| Age Bracket | Male | Female |
| Under 5 Years | 82 (100.0%) | 8 (100.0%) |
| 5 Years | 0 (0.0%) | 0 (0.0%) |
| 6 to 11 Years | 128 (89.5%) | 60 (60.0%) |
| 12 to 14 Years | 0 (0.0%) | 104 (100.0%) |
| 15 Years | 0 (0.0%) | 0 (0.0%) |
| 16 and 17 Years | 23 (100.0%) | 43 (100.0%) |
| 18 to 24 Years | 69 (100.0%) | 31 (100.0%) |
| 25 to 34 Years | 120 (100.0%) | 78 (100.0%) |
| 35 to 44 Years | 122 (89.7%) | 118 (90.1%) |
| 45 to 54 Years | 64 (81.0%) | 188 (87.0%) |
| 55 to 64 Years | 144 (100.0%) | 195 (83.7%) |
| 65 to 74 Years | 120 (77.4%) | 216 (98.6%) |
| 75 Years and over | 96 (100.0%) | 51 (89.5%) |
| Total | 968 (88.4%) | 1,092 (89.5%) |
Income Below Poverty Among Married-Couple Families in Shadybrook
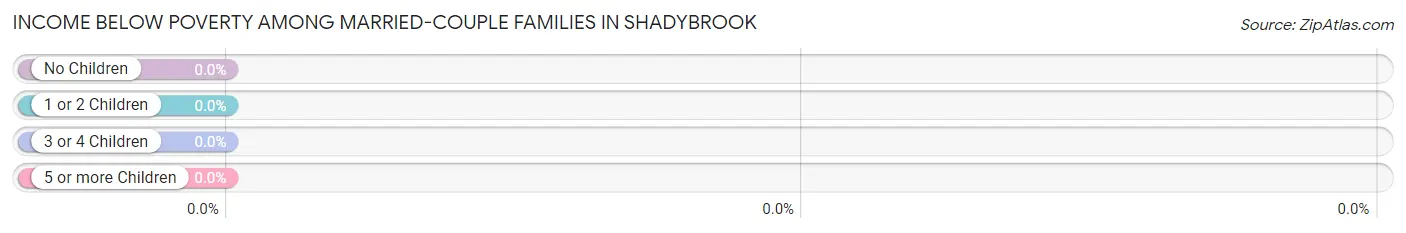
| Children | Above Poverty | Below Poverty |
| No Children | 243 (100.0%) | 0 (0.0%) |
| 1 or 2 Children | 89 (100.0%) | 0 (0.0%) |
| 3 or 4 Children | 119 (100.0%) | 0 (0.0%) |
| 5 or more Children | 0 (0.0%) | 0 (0.0%) |
| Total | 451 (100.0%) | 0 (0.0%) |
Income Below Poverty Among Single-Parent Households in Shadybrook
According to the poverty data in Shadybrook, 14.0% or 15 single-father households and 32.8% or 41 single-mother households are living below the poverty line. Among single-father households, those with no children have the highest poverty rate, with 15 households (14.0%) experiencing poverty. Likewise, among single-mother households, those with 5 or more children have the highest poverty rate, with 13 households (100.0%) falling below the poverty line.
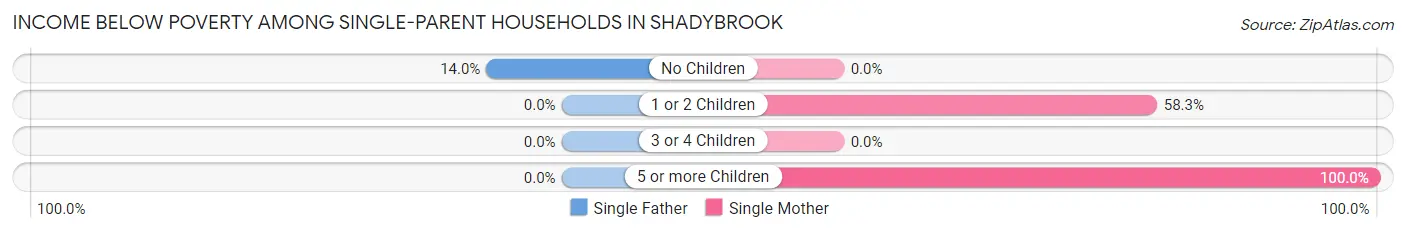
| Children | Single Father | Single Mother |
| No Children | 15 (14.0%) | 0 (0.0%) |
| 1 or 2 Children | 0 (0.0%) | 28 (58.3%) |
| 3 or 4 Children | 0 (0.0%) | 0 (0.0%) |
| 5 or more Children | 0 (0.0%) | 13 (100.0%) |
| Total | 15 (14.0%) | 41 (32.8%) |
Income Below Poverty Among Married-Couple vs Single-Parent Households in Shadybrook
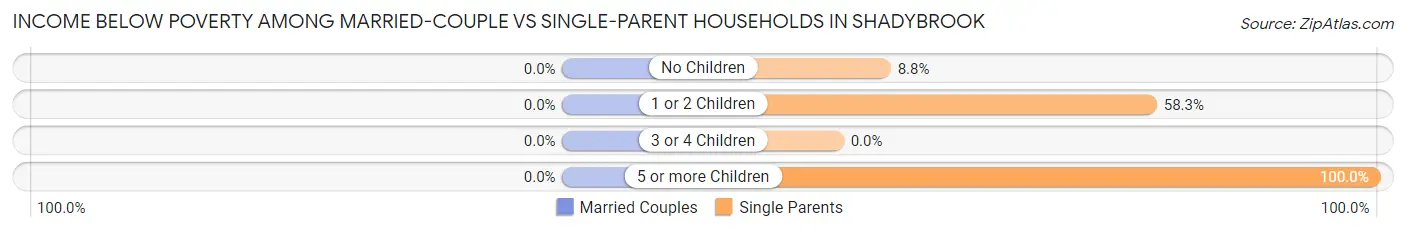
| Children | Married-Couple Families | Single-Parent Households |
| No Children | 0 (0.0%) | 15 (8.8%) |
| 1 or 2 Children | 0 (0.0%) | 28 (58.3%) |
| 3 or 4 Children | 0 (0.0%) | 0 (0.0%) |
| 5 or more Children | 0 (0.0%) | 13 (100.0%) |
| Total | 0 (0.0%) | 56 (24.1%) |
Employment Characteristics in Shadybrook
Employment by Class of Employer in Shadybrook
Among the 941 employed individuals in Shadybrook, private company employees (464 | 49.3%), self-employed (not incorporated) (176 | 18.7%), and not-for-profit organizations (120 | 12.8%) make up the most common classes of employment.
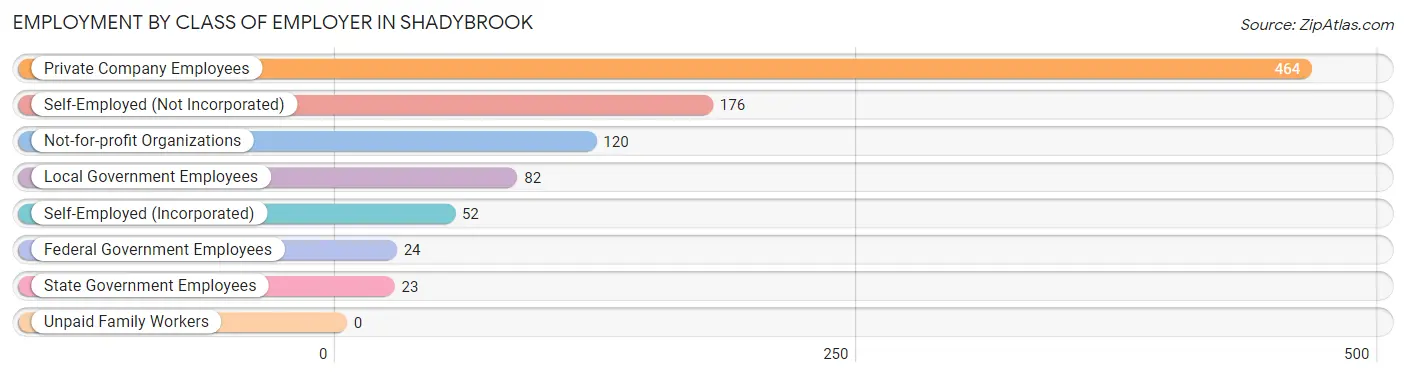
| Employer Class | # Employees | % Employees |
| Private Company Employees | 464 | 49.3% |
| Self-Employed (Incorporated) | 52 | 5.5% |
| Self-Employed (Not Incorporated) | 176 | 18.7% |
| Not-for-profit Organizations | 120 | 12.8% |
| Local Government Employees | 82 | 8.7% |
| State Government Employees | 23 | 2.4% |
| Federal Government Employees | 24 | 2.5% |
| Unpaid Family Workers | 0 | 0.0% |
| Total | 941 | 100.0% |
Employment Status by Age in Shadybrook
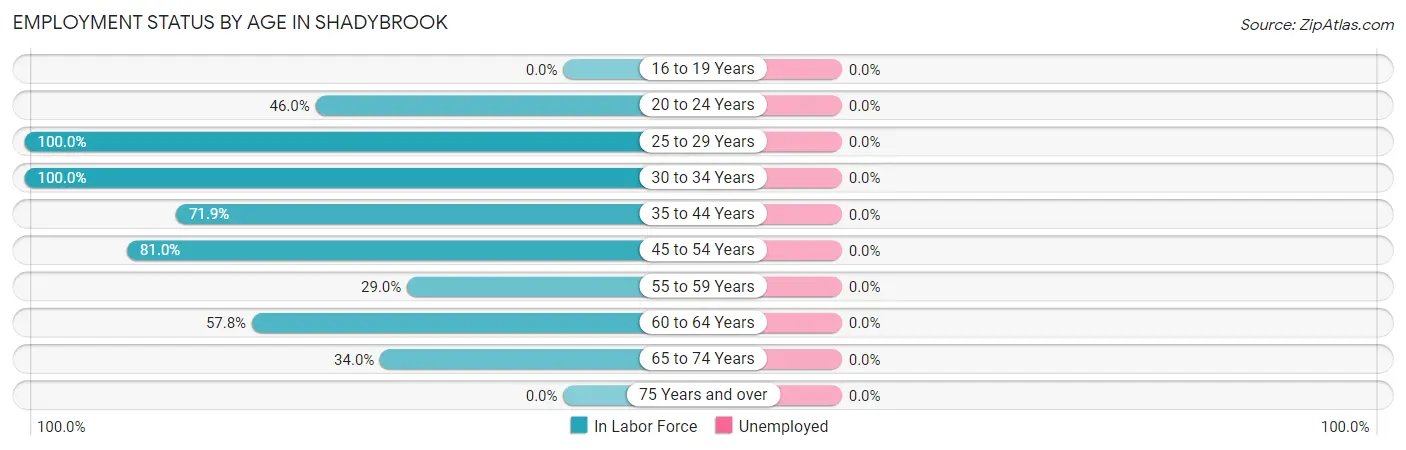
| Age Bracket | In Labor Force | Unemployed |
| 16 to 19 Years | 0 (0.0%) | 0 (0.0%) |
| 20 to 24 Years | 46 (46.0%) | 0 (0.0%) |
| 25 to 29 Years | 94 (100.0%) | 0 (0.0%) |
| 30 to 34 Years | 104 (100.0%) | 0 (0.0%) |
| 35 to 44 Years | 192 (71.9%) | 0 (0.0%) |
| 45 to 54 Years | 239 (81.0%) | 0 (0.0%) |
| 55 to 59 Years | 18 (29.0%) | 0 (0.0%) |
| 60 to 64 Years | 182 (57.8%) | 0 (0.0%) |
| 65 to 74 Years | 127 (34.0%) | 0 (0.0%) |
| 75 Years and over | 0 (0.0%) | 0 (0.0%) |
| Total | 1,003 (54.8%) | 0 (0.0%) |
Employment Status by Educational Attainment in Shadybrook
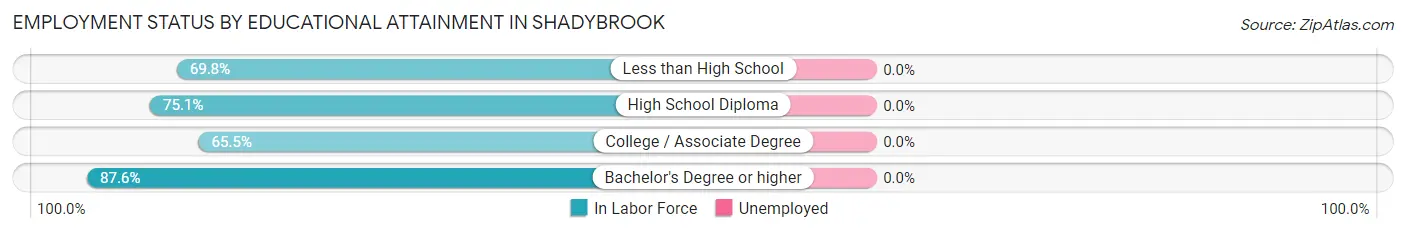
| Educational Attainment | In Labor Force | Unemployed |
| Less than High School | 120 (69.8%) | 0 (0.0%) |
| High School Diploma | 323 (75.1%) | 0 (0.0%) |
| College / Associate Degree | 245 (65.5%) | 0 (0.0%) |
| Bachelor's Degree or higher | 141 (87.6%) | 0 (0.0%) |
| Total | 829 (72.9%) | 0 (0.0%) |
Employment Occupations by Sex in Shadybrook
Management, Business, Science and Arts Occupations
The most common Management, Business, Science and Arts occupations in Shadybrook are Management (112 | 11.2%), Community & Social Service (98 | 9.8%), Education, Arts & Media (75 | 7.5%), Health Diagnosing & Treating (42 | 4.2%), and Business & Financial (38 | 3.8%).
Management, Business, Science and Arts Occupations by Sex
Within the Management, Business, Science and Arts occupations in Shadybrook, the most male-oriented occupations are Computers, Engineering & Science (100.0%), Life, Physical & Social Science (100.0%), and Education, Arts & Media (53.3%), while the most female-oriented occupations are Management (100.0%), Business & Financial (100.0%), and Education Instruction & Library (100.0%).
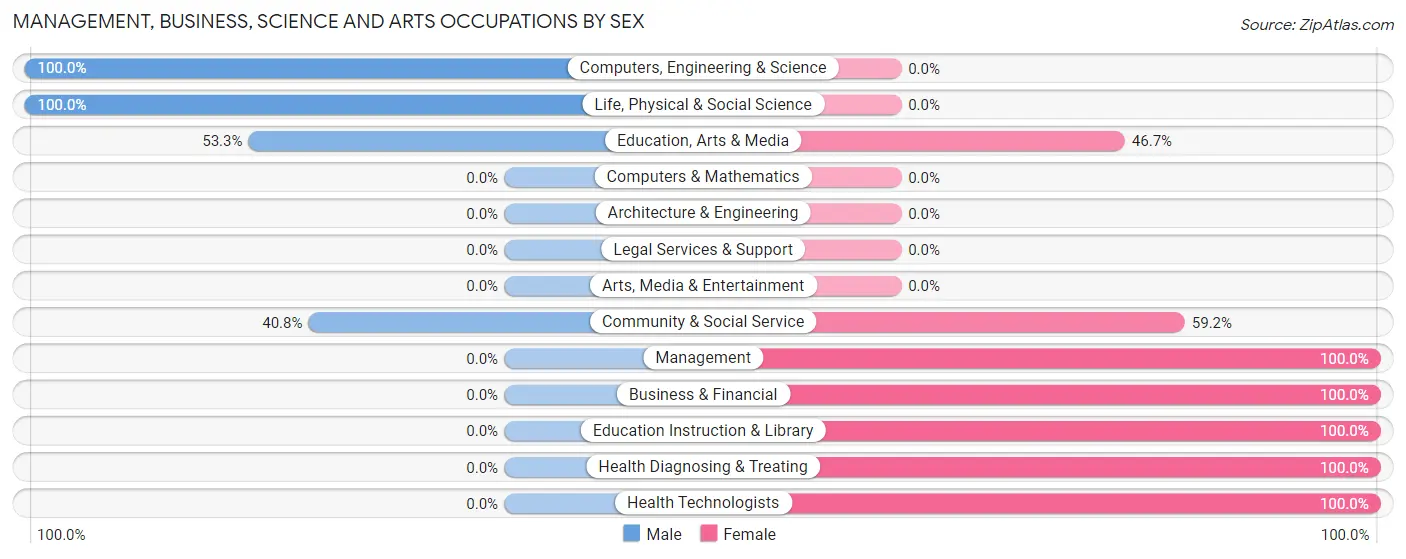
| Occupation | Male | Female |
| Management | 0 (0.0%) | 112 (100.0%) |
| Business & Financial | 0 (0.0%) | 38 (100.0%) |
| Computers, Engineering & Science | 15 (100.0%) | 0 (0.0%) |
| Computers & Mathematics | 0 (0.0%) | 0 (0.0%) |
| Architecture & Engineering | 0 (0.0%) | 0 (0.0%) |
| Life, Physical & Social Science | 15 (100.0%) | 0 (0.0%) |
| Community & Social Service | 40 (40.8%) | 58 (59.2%) |
| Education, Arts & Media | 40 (53.3%) | 35 (46.7%) |
| Legal Services & Support | 0 (0.0%) | 0 (0.0%) |
| Education Instruction & Library | 0 (0.0%) | 23 (100.0%) |
| Arts, Media & Entertainment | 0 (0.0%) | 0 (0.0%) |
| Health Diagnosing & Treating | 0 (0.0%) | 42 (100.0%) |
| Health Technologists | 0 (0.0%) | 20 (100.0%) |
| Total (Category) | 55 (18.0%) | 250 (82.0%) |
| Total (Overall) | 422 (42.1%) | 580 (57.9%) |
Services Occupations
The most common Services occupations in Shadybrook are Food Preparation & Serving (123 | 12.3%), Cleaning & Maintenance (82 | 8.2%), Personal Care & Service (54 | 5.4%), Security & Protection (30 | 3.0%), and Law Enforcement (30 | 3.0%).
Services Occupations by Sex
Within the Services occupations in Shadybrook, the most male-oriented occupations are Security & Protection (100.0%), Law Enforcement (100.0%), and Food Preparation & Serving (90.2%), while the most female-oriented occupations are Personal Care & Service (100.0%), Cleaning & Maintenance (29.3%), and Food Preparation & Serving (9.8%).
| Occupation | Male | Female |
| Healthcare Support | 0 (0.0%) | 0 (0.0%) |
| Security & Protection | 30 (100.0%) | 0 (0.0%) |
| Firefighting & Prevention | 0 (0.0%) | 0 (0.0%) |
| Law Enforcement | 30 (100.0%) | 0 (0.0%) |
| Food Preparation & Serving | 111 (90.2%) | 12 (9.8%) |
| Cleaning & Maintenance | 58 (70.7%) | 24 (29.3%) |
| Personal Care & Service | 0 (0.0%) | 54 (100.0%) |
| Total (Category) | 199 (68.9%) | 90 (31.1%) |
| Total (Overall) | 422 (42.1%) | 580 (57.9%) |
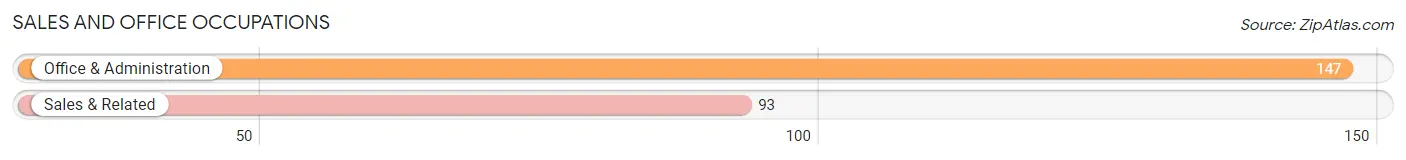
Sales and Office Occupations
The most common Sales and Office occupations in Shadybrook are Office & Administration (147 | 14.7%), and Sales & Related (93 | 9.3%).
Sales and Office Occupations by Sex
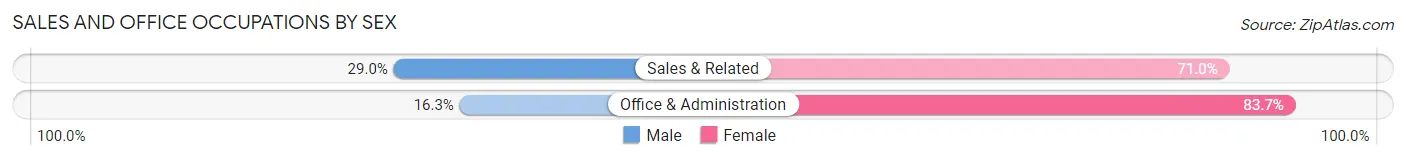
| Occupation | Male | Female |
| Sales & Related | 27 (29.0%) | 66 (71.0%) |
| Office & Administration | 24 (16.3%) | 123 (83.7%) |
| Total (Category) | 51 (21.2%) | 189 (78.7%) |
| Total (Overall) | 422 (42.1%) | 580 (57.9%) |
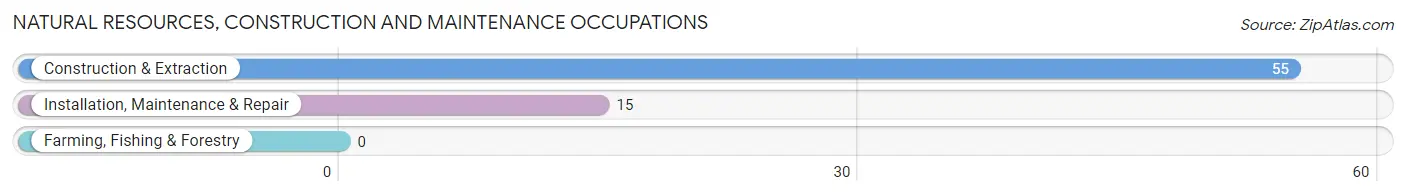
Natural Resources, Construction and Maintenance Occupations
The most common Natural Resources, Construction and Maintenance occupations in Shadybrook are Construction & Extraction (55 | 5.5%), and Installation, Maintenance & Repair (15 | 1.5%).
Natural Resources, Construction and Maintenance Occupations by Sex
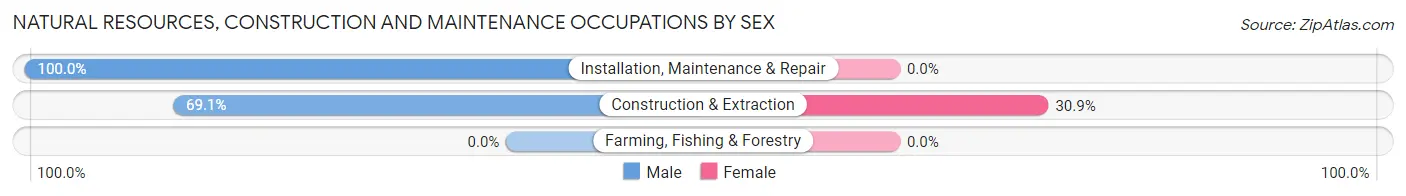
| Occupation | Male | Female |
| Farming, Fishing & Forestry | 0 (0.0%) | 0 (0.0%) |
| Construction & Extraction | 38 (69.1%) | 17 (30.9%) |
| Installation, Maintenance & Repair | 15 (100.0%) | 0 (0.0%) |
| Total (Category) | 53 (75.7%) | 17 (24.3%) |
| Total (Overall) | 422 (42.1%) | 580 (57.9%) |
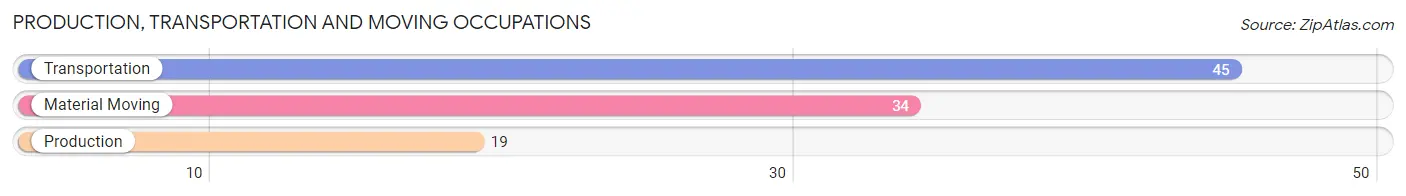
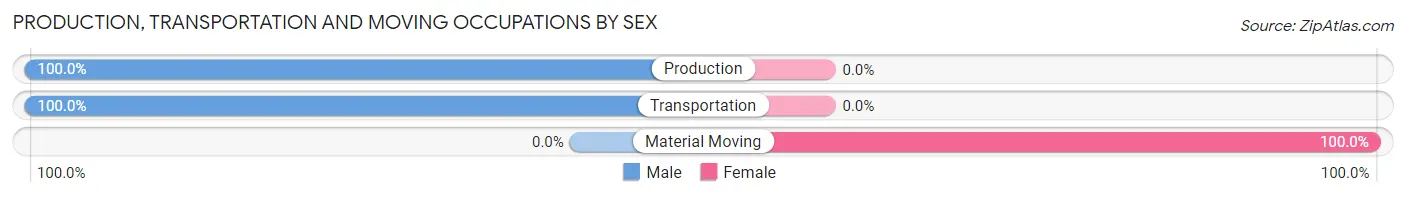
Production, Transportation and Moving Occupations
The most common Production, Transportation and Moving occupations in Shadybrook are Transportation (45 | 4.5%), Material Moving (34 | 3.4%), and Production (19 | 1.9%).
Production, Transportation and Moving Occupations by Sex
| Occupation | Male | Female |
| Production | 19 (100.0%) | 0 (0.0%) |
| Transportation | 45 (100.0%) | 0 (0.0%) |
| Material Moving | 0 (0.0%) | 34 (100.0%) |
| Total (Category) | 64 (65.3%) | 34 (34.7%) |
| Total (Overall) | 422 (42.1%) | 580 (57.9%) |
Employment Industries by Sex in Shadybrook
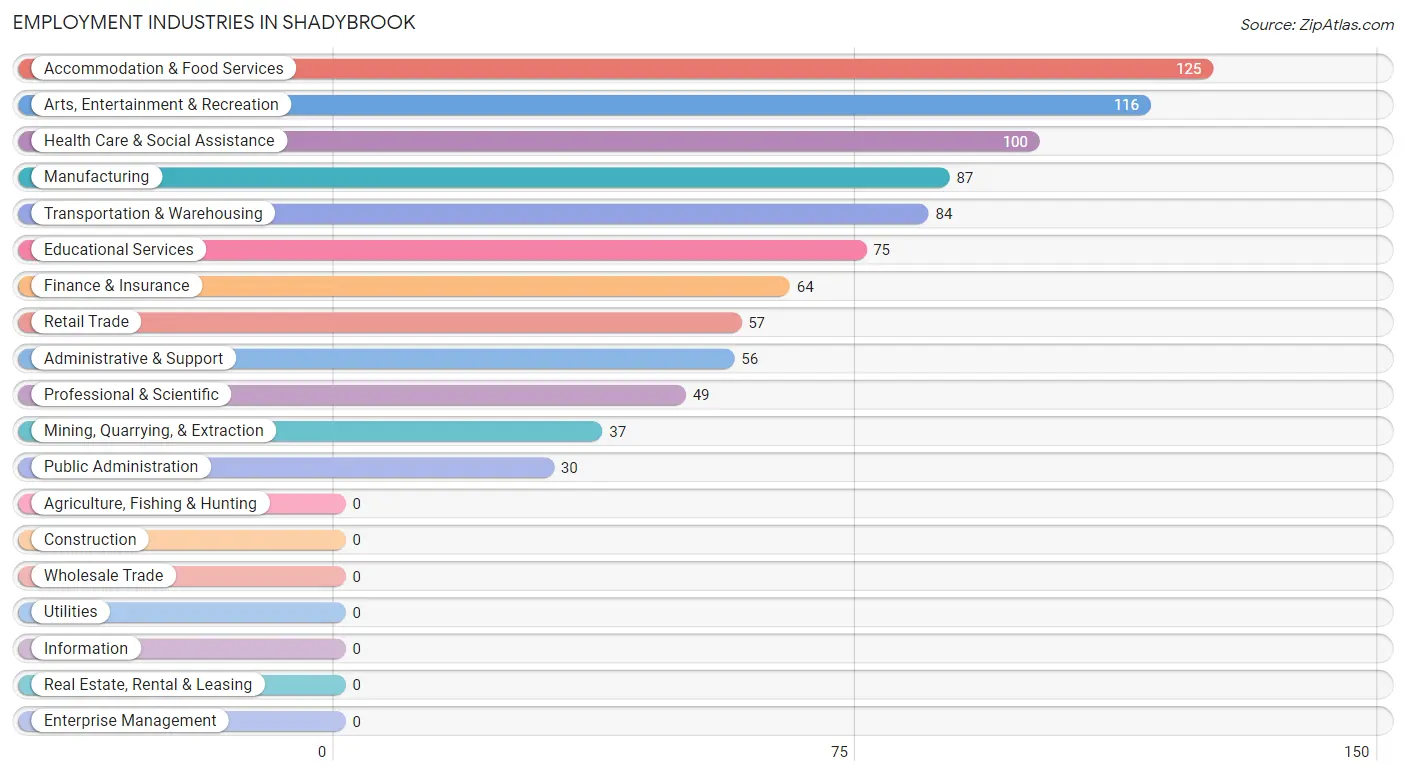
Employment Industries in Shadybrook
The major employment industries in Shadybrook include Accommodation & Food Services (125 | 12.5%), Arts, Entertainment & Recreation (116 | 11.6%), Health Care & Social Assistance (100 | 10.0%), Manufacturing (87 | 8.7%), and Transportation & Warehousing (84 | 8.4%).
Employment Industries by Sex in Shadybrook
The Shadybrook industries that see more men than women are Administrative & Support (100.0%), Public Administration (100.0%), and Mining, Quarrying, & Extraction (70.3%), whereas the industries that tend to have a higher number of women are Finance & Insurance (100.0%), Professional & Scientific (100.0%), and Educational Services (100.0%).
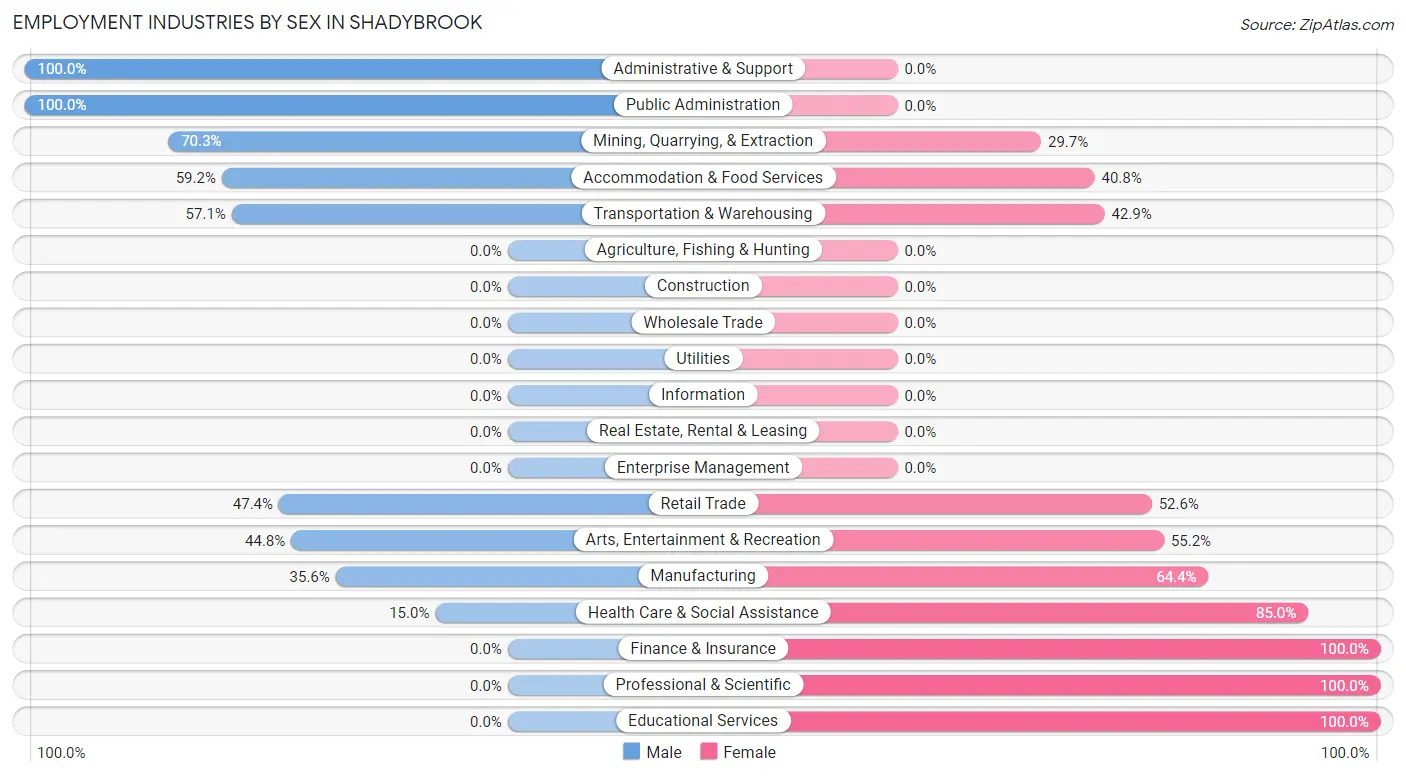
| Industry | Male | Female |
| Agriculture, Fishing & Hunting | 0 (0.0%) | 0 (0.0%) |
| Mining, Quarrying, & Extraction | 26 (70.3%) | 11 (29.7%) |
| Construction | 0 (0.0%) | 0 (0.0%) |
| Manufacturing | 31 (35.6%) | 56 (64.4%) |
| Wholesale Trade | 0 (0.0%) | 0 (0.0%) |
| Retail Trade | 27 (47.4%) | 30 (52.6%) |
| Transportation & Warehousing | 48 (57.1%) | 36 (42.9%) |
| Utilities | 0 (0.0%) | 0 (0.0%) |
| Information | 0 (0.0%) | 0 (0.0%) |
| Finance & Insurance | 0 (0.0%) | 64 (100.0%) |
| Real Estate, Rental & Leasing | 0 (0.0%) | 0 (0.0%) |
| Professional & Scientific | 0 (0.0%) | 49 (100.0%) |
| Enterprise Management | 0 (0.0%) | 0 (0.0%) |
| Administrative & Support | 56 (100.0%) | 0 (0.0%) |
| Educational Services | 0 (0.0%) | 75 (100.0%) |
| Health Care & Social Assistance | 15 (15.0%) | 85 (85.0%) |
| Arts, Entertainment & Recreation | 52 (44.8%) | 64 (55.2%) |
| Accommodation & Food Services | 74 (59.2%) | 51 (40.8%) |
| Public Administration | 30 (100.0%) | 0 (0.0%) |
| Total | 422 (42.1%) | 580 (57.9%) |
Education in Shadybrook
School Enrollment in Shadybrook
The most common levels of schooling among the 588 students in Shadybrook are middle school (219 | 37.2%), elementary school (104 | 17.7%), and high school (86 | 14.6%).
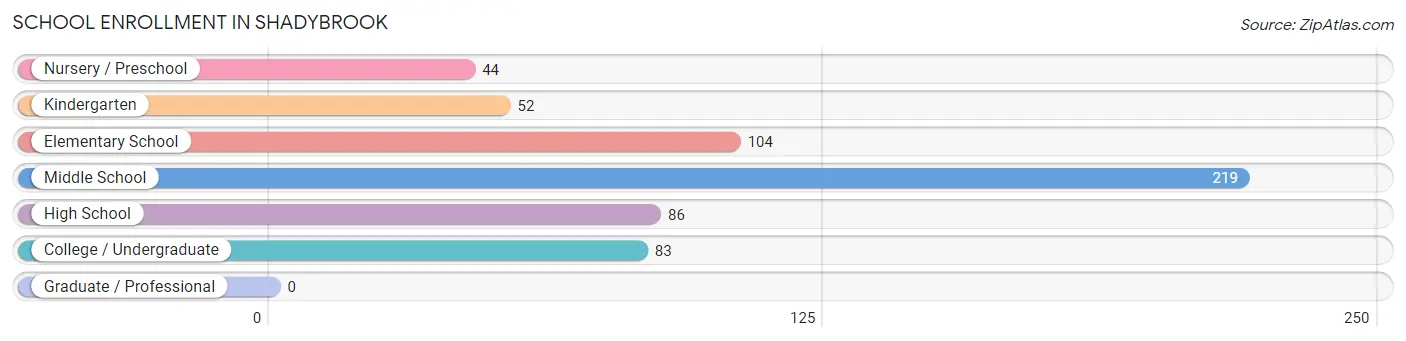
| School Level | # Students | % Students |
| Nursery / Preschool | 44 | 7.5% |
| Kindergarten | 52 | 8.8% |
| Elementary School | 104 | 17.7% |
| Middle School | 219 | 37.2% |
| High School | 86 | 14.6% |
| College / Undergraduate | 83 | 14.1% |
| Graduate / Professional | 0 | 0.0% |
| Total | 588 | 100.0% |
School Enrollment by Age by Funding Source in Shadybrook
Out of a total of 588 students who are enrolled in schools in Shadybrook, 33 (5.6%) attend a private institution, while the remaining 555 (94.4%) are enrolled in public schools. The age group of 10 to 14 year olds has the highest likelihood of being enrolled in private schools, with 33 (13.8% in the age bracket) enrolled. Conversely, the age group of 3 to 4 year olds has the lowest likelihood of being enrolled in a private school, with 44 (100.0% in the age bracket) attending a public institution.
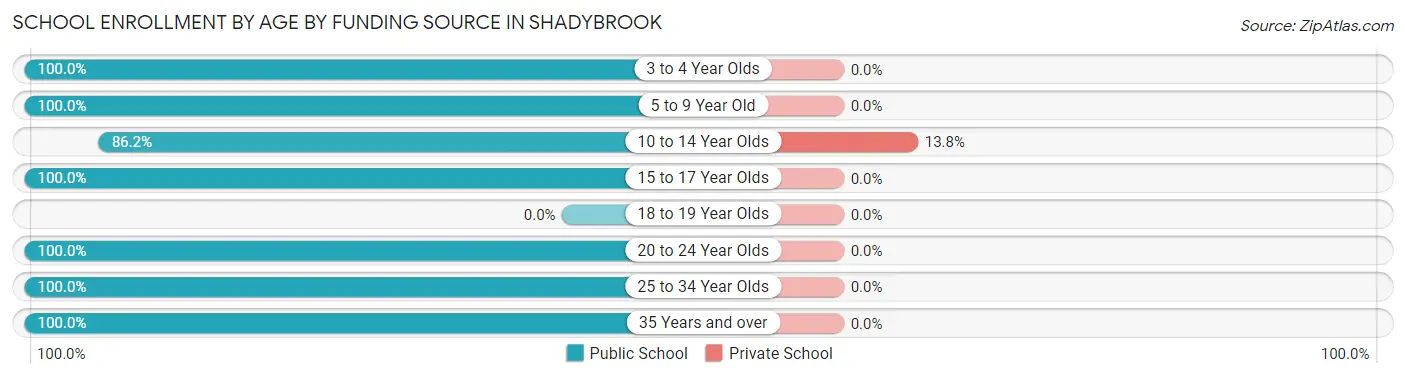
| Age Bracket | Public School | Private School |
| 3 to 4 Year Olds | 44 (100.0%) | 0 (0.0%) |
| 5 to 9 Year Old | 156 (100.0%) | 0 (0.0%) |
| 10 to 14 Year Olds | 206 (86.2%) | 33 (13.8%) |
| 15 to 17 Year Olds | 66 (100.0%) | 0 (0.0%) |
| 18 to 19 Year Olds | 0 (0.0%) | 0 (0.0%) |
| 20 to 24 Year Olds | 35 (100.0%) | 0 (0.0%) |
| 25 to 34 Year Olds | 7 (100.0%) | 0 (0.0%) |
| 35 Years and over | 41 (100.0%) | 0 (0.0%) |
| Total | 555 (94.4%) | 33 (5.6%) |
Educational Attainment by Field of Study in Shadybrook
Liberal arts & history (75 | 29.1%), education (53 | 20.5%), business (40 | 15.5%), psychology (39 | 15.1%), and computers & mathematics (15 | 5.8%) are the most common fields of study among 258 individuals in Shadybrook who have obtained a bachelor's degree or higher.
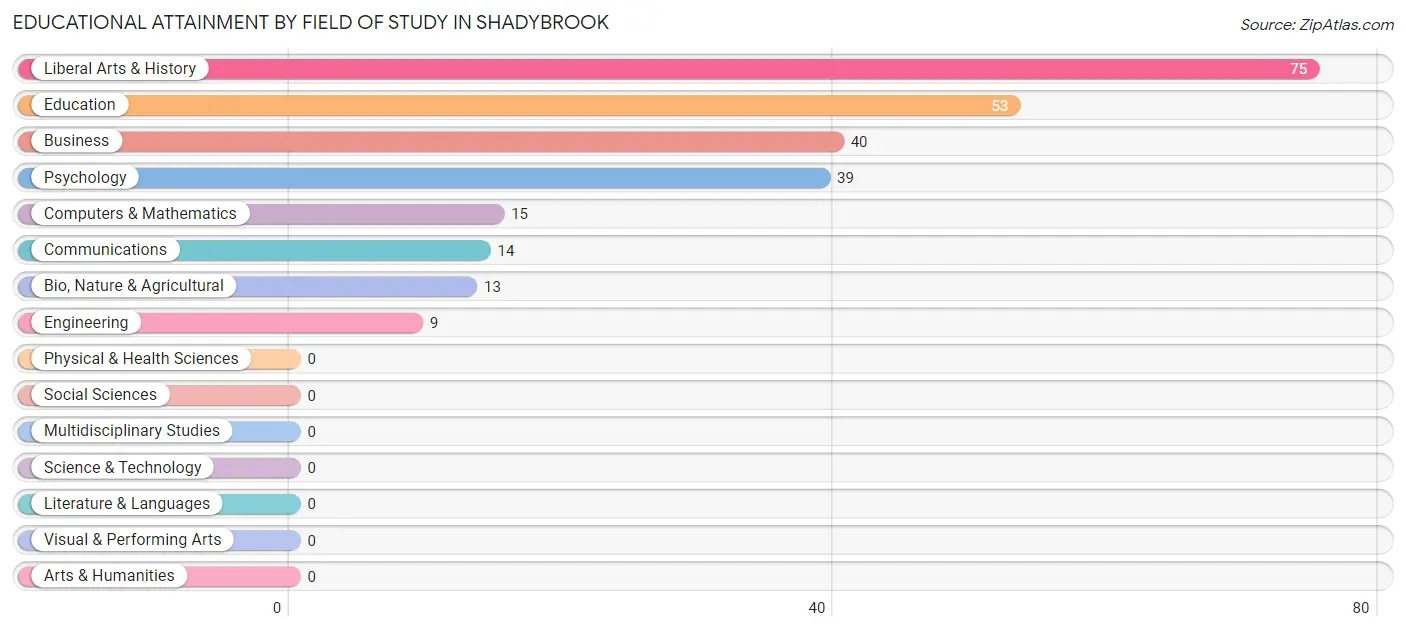
| Field of Study | # Graduates | % Graduates |
| Computers & Mathematics | 15 | 5.8% |
| Bio, Nature & Agricultural | 13 | 5.0% |
| Physical & Health Sciences | 0 | 0.0% |
| Psychology | 39 | 15.1% |
| Social Sciences | 0 | 0.0% |
| Engineering | 9 | 3.5% |
| Multidisciplinary Studies | 0 | 0.0% |
| Science & Technology | 0 | 0.0% |
| Business | 40 | 15.5% |
| Education | 53 | 20.5% |
| Literature & Languages | 0 | 0.0% |
| Liberal Arts & History | 75 | 29.1% |
| Visual & Performing Arts | 0 | 0.0% |
| Communications | 14 | 5.4% |
| Arts & Humanities | 0 | 0.0% |
| Total | 258 | 100.0% |
Transportation & Commute in Shadybrook
Vehicle Availability by Sex in Shadybrook
The most prevalent vehicle ownership categories in Shadybrook are males with 3 vehicles (207, accounting for 52.3%) and females with 3 vehicles (170, making up 38.0%).
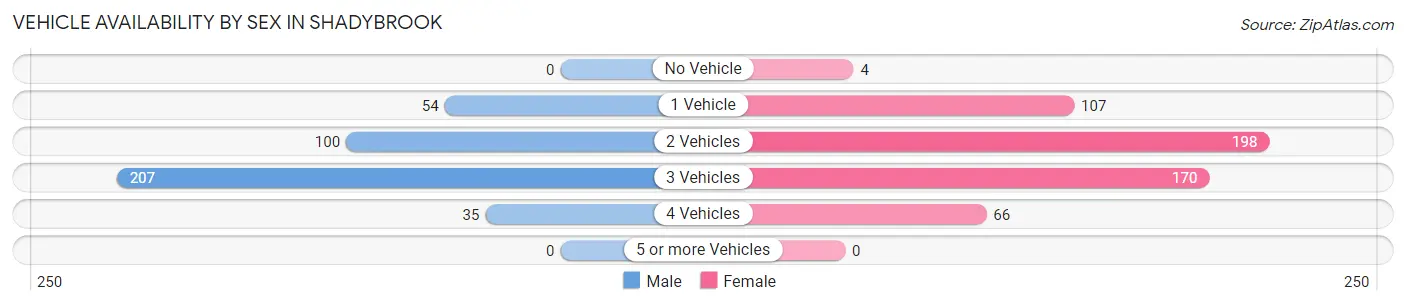
| Vehicles Available | Male | Female |
| No Vehicle | 0 (0.0%) | 4 (0.7%) |
| 1 Vehicle | 54 (13.6%) | 107 (19.6%) |
| 2 Vehicles | 100 (25.3%) | 198 (36.3%) |
| 3 Vehicles | 207 (52.3%) | 170 (31.2%) |
| 4 Vehicles | 35 (8.8%) | 66 (12.1%) |
| 5 or more Vehicles | 0 (0.0%) | 0 (0.0%) |
| Total | 396 (100.0%) | 545 (100.0%) |
Commute Time in Shadybrook
The most frequently occuring commute durations in Shadybrook are 20 to 24 minutes (207 commuters, 27.0%), 30 to 34 minutes (161 commuters, 21.0%), and 15 to 19 minutes (117 commuters, 15.3%).
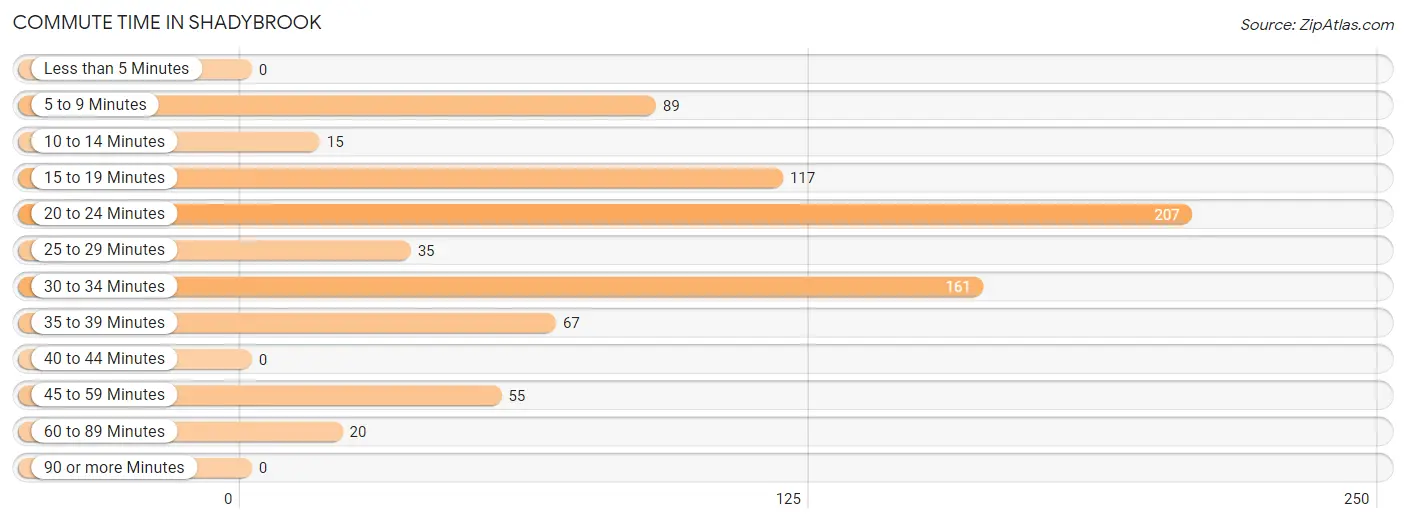
| Commute Time | # Commuters | % Commuters |
| Less than 5 Minutes | 0 | 0.0% |
| 5 to 9 Minutes | 89 | 11.6% |
| 10 to 14 Minutes | 15 | 2.0% |
| 15 to 19 Minutes | 117 | 15.3% |
| 20 to 24 Minutes | 207 | 27.0% |
| 25 to 29 Minutes | 35 | 4.6% |
| 30 to 34 Minutes | 161 | 21.0% |
| 35 to 39 Minutes | 67 | 8.7% |
| 40 to 44 Minutes | 0 | 0.0% |
| 45 to 59 Minutes | 55 | 7.2% |
| 60 to 89 Minutes | 20 | 2.6% |
| 90 or more Minutes | 0 | 0.0% |
Commute Time by Sex in Shadybrook
The most common commute times in Shadybrook are 20 to 24 minutes (163 commuters, 41.2%) for males and 30 to 34 minutes (139 commuters, 37.6%) for females.
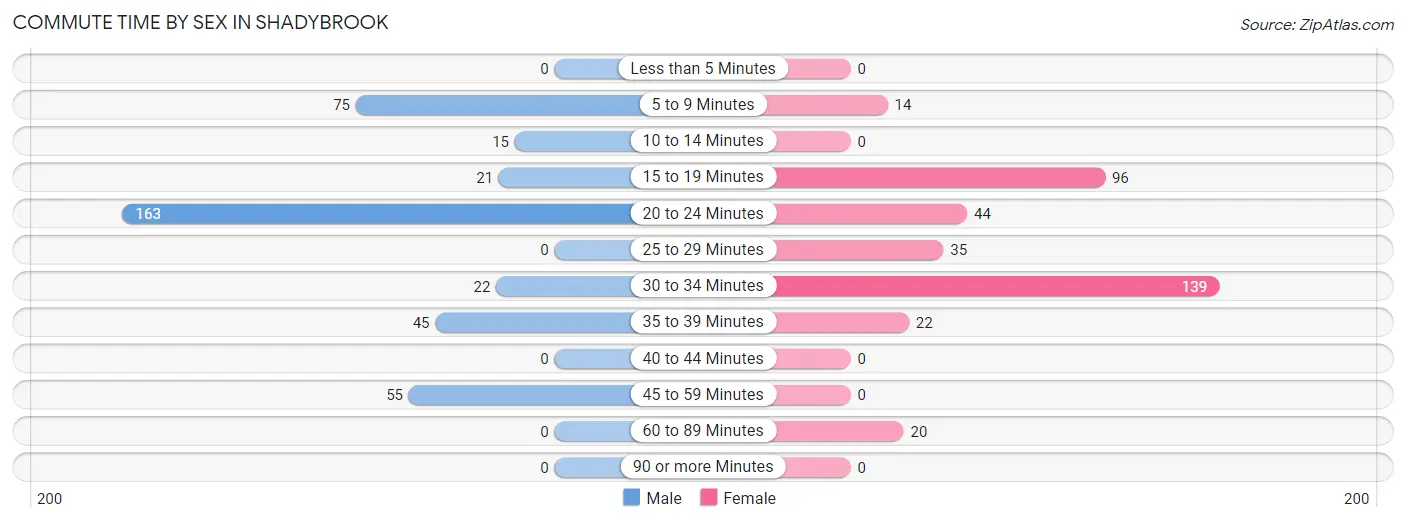
| Commute Time | Male | Female |
| Less than 5 Minutes | 0 (0.0%) | 0 (0.0%) |
| 5 to 9 Minutes | 75 (18.9%) | 14 (3.8%) |
| 10 to 14 Minutes | 15 (3.8%) | 0 (0.0%) |
| 15 to 19 Minutes | 21 (5.3%) | 96 (26.0%) |
| 20 to 24 Minutes | 163 (41.2%) | 44 (11.9%) |
| 25 to 29 Minutes | 0 (0.0%) | 35 (9.5%) |
| 30 to 34 Minutes | 22 (5.6%) | 139 (37.6%) |
| 35 to 39 Minutes | 45 (11.4%) | 22 (5.9%) |
| 40 to 44 Minutes | 0 (0.0%) | 0 (0.0%) |
| 45 to 59 Minutes | 55 (13.9%) | 0 (0.0%) |
| 60 to 89 Minutes | 0 (0.0%) | 20 (5.4%) |
| 90 or more Minutes | 0 (0.0%) | 0 (0.0%) |
Time of Departure to Work by Sex in Shadybrook
The most frequent times of departure to work in Shadybrook are 8:00 AM to 8:29 AM (89, 22.5%) for males and 8:30 AM to 8:59 AM (92, 24.9%) for females.
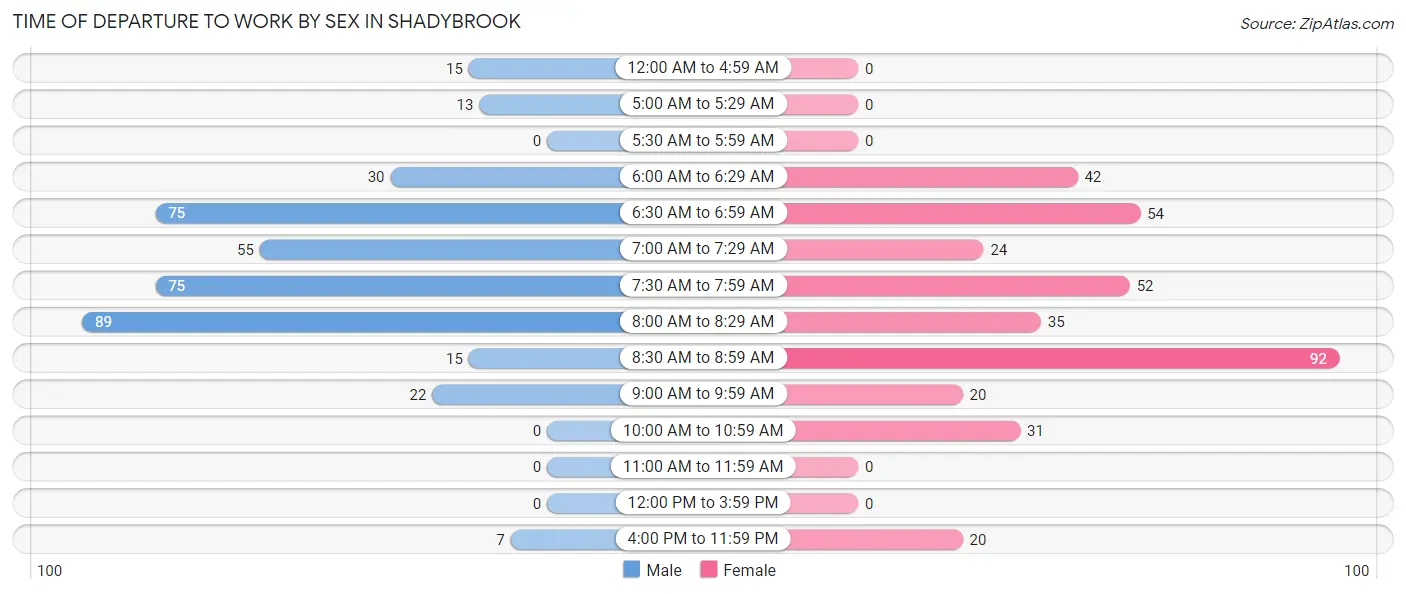
| Time of Departure | Male | Female |
| 12:00 AM to 4:59 AM | 15 (3.8%) | 0 (0.0%) |
| 5:00 AM to 5:29 AM | 13 (3.3%) | 0 (0.0%) |
| 5:30 AM to 5:59 AM | 0 (0.0%) | 0 (0.0%) |
| 6:00 AM to 6:29 AM | 30 (7.6%) | 42 (11.4%) |
| 6:30 AM to 6:59 AM | 75 (18.9%) | 54 (14.6%) |
| 7:00 AM to 7:29 AM | 55 (13.9%) | 24 (6.5%) |
| 7:30 AM to 7:59 AM | 75 (18.9%) | 52 (14.1%) |
| 8:00 AM to 8:29 AM | 89 (22.5%) | 35 (9.5%) |
| 8:30 AM to 8:59 AM | 15 (3.8%) | 92 (24.9%) |
| 9:00 AM to 9:59 AM | 22 (5.6%) | 20 (5.4%) |
| 10:00 AM to 10:59 AM | 0 (0.0%) | 31 (8.4%) |
| 11:00 AM to 11:59 AM | 0 (0.0%) | 0 (0.0%) |
| 12:00 PM to 3:59 PM | 0 (0.0%) | 0 (0.0%) |
| 4:00 PM to 11:59 PM | 7 (1.8%) | 20 (5.4%) |
| Total | 396 (100.0%) | 370 (100.0%) |
Housing Occupancy in Shadybrook
Occupancy by Ownership in Shadybrook
Of the total 904 dwellings in Shadybrook, owner-occupied units account for 688 (76.1%), while renter-occupied units make up 216 (23.9%).
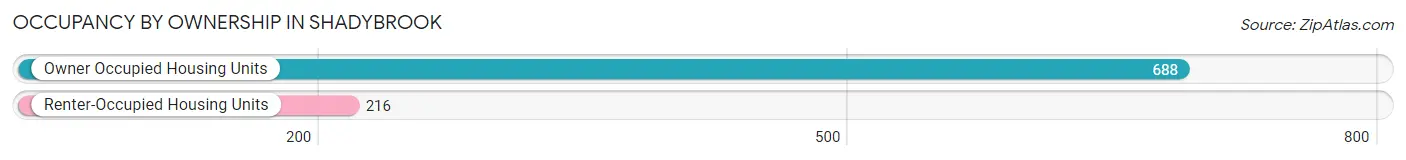
| Occupancy | # Housing Units | % Housing Units |
| Owner Occupied Housing Units | 688 | 76.1% |
| Renter-Occupied Housing Units | 216 | 23.9% |
| Total Occupied Housing Units | 904 | 100.0% |
Occupancy by Household Size in Shadybrook
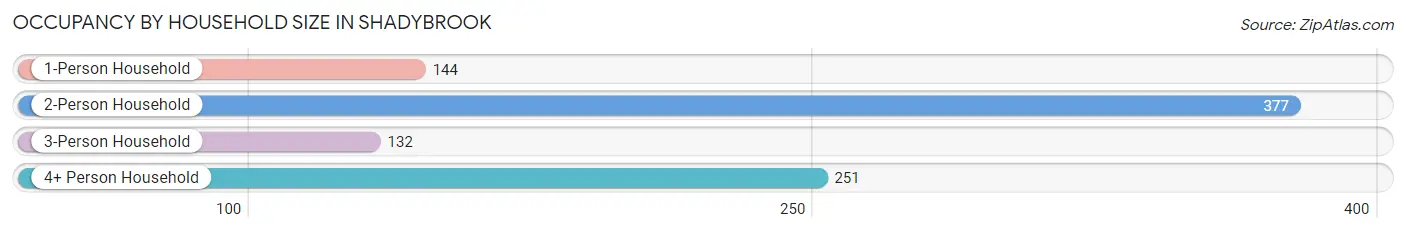
| Household Size | # Housing Units | % Housing Units |
| 1-Person Household | 144 | 15.9% |
| 2-Person Household | 377 | 41.7% |
| 3-Person Household | 132 | 14.6% |
| 4+ Person Household | 251 | 27.8% |
| Total Housing Units | 904 | 100.0% |
Occupancy by Ownership by Household Size in Shadybrook
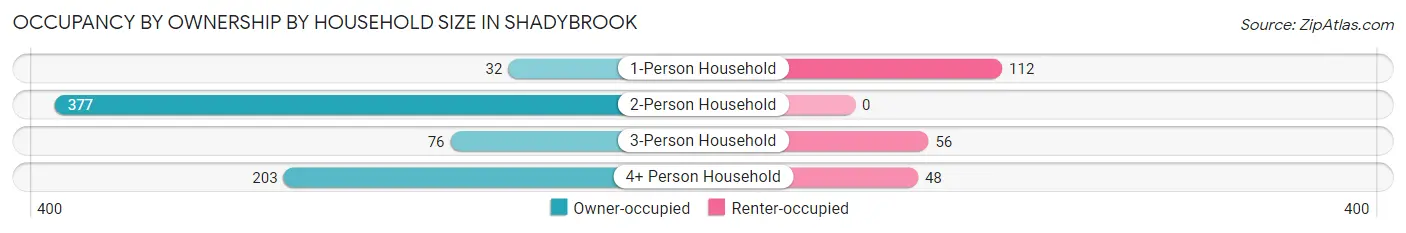
| Household Size | Owner-occupied | Renter-occupied |
| 1-Person Household | 32 (22.2%) | 112 (77.8%) |
| 2-Person Household | 377 (100.0%) | 0 (0.0%) |
| 3-Person Household | 76 (57.6%) | 56 (42.4%) |
| 4+ Person Household | 203 (80.9%) | 48 (19.1%) |
| Total Housing Units | 688 (76.1%) | 216 (23.9%) |
Occupancy by Educational Attainment in Shadybrook
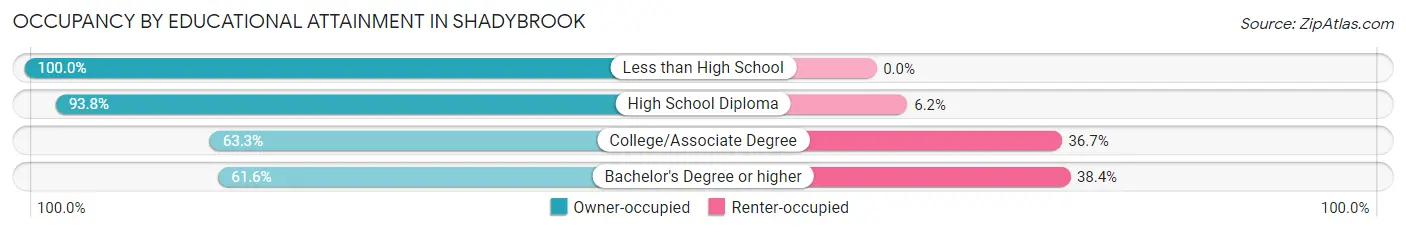
| Household Size | Owner-occupied | Renter-occupied |
| Less than High School | 122 (100.0%) | 0 (0.0%) |
| High School Diploma | 228 (93.8%) | 15 (6.2%) |
| College/Associate Degree | 229 (63.3%) | 133 (36.7%) |
| Bachelor's Degree or higher | 109 (61.6%) | 68 (38.4%) |
Occupancy by Age of Householder in Shadybrook
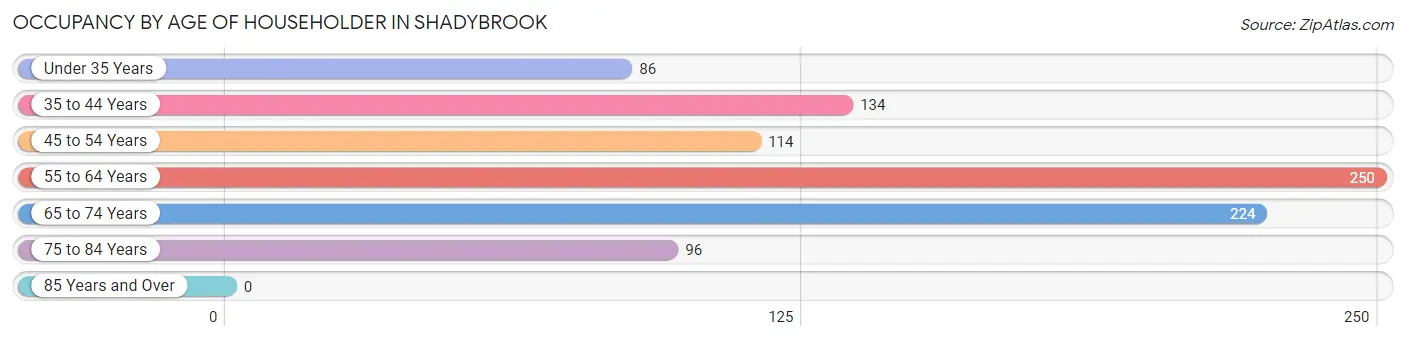
| Age Bracket | # Households | % Households |
| Under 35 Years | 86 | 9.5% |
| 35 to 44 Years | 134 | 14.8% |
| 45 to 54 Years | 114 | 12.6% |
| 55 to 64 Years | 250 | 27.7% |
| 65 to 74 Years | 224 | 24.8% |
| 75 to 84 Years | 96 | 10.6% |
| 85 Years and Over | 0 | 0.0% |
| Total | 904 | 100.0% |
Housing Finances in Shadybrook
Median Income by Occupancy in Shadybrook
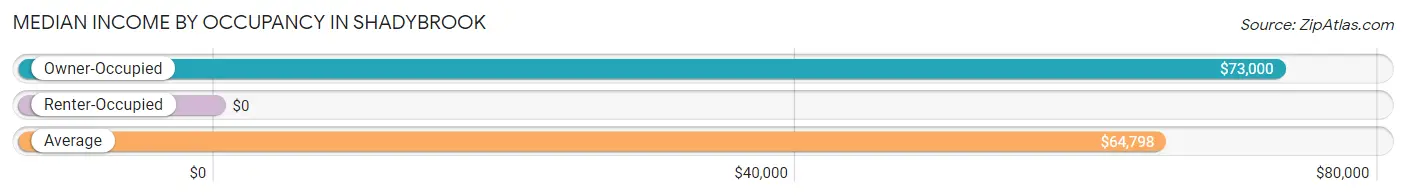
| Occupancy Type | # Households | Median Income |
| Owner-Occupied | 688 (76.1%) | $73,000 |
| Renter-Occupied | 216 (23.9%) | $0 |
| Average | 904 (100.0%) | $64,798 |
Occupancy by Householder Income Bracket in Shadybrook
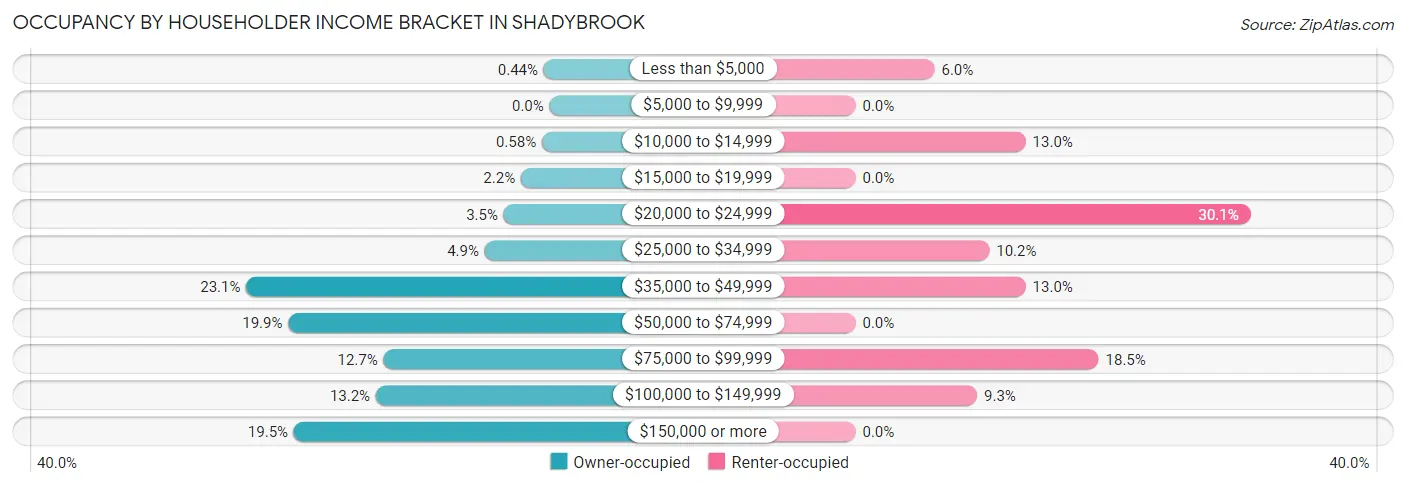
| Income Bracket | Owner-occupied | Renter-occupied |
| Less than $5,000 | 3 (0.4%) | 13 (6.0%) |
| $5,000 to $9,999 | 0 (0.0%) | 0 (0.0%) |
| $10,000 to $14,999 | 4 (0.6%) | 28 (13.0%) |
| $15,000 to $19,999 | 15 (2.2%) | 0 (0.0%) |
| $20,000 to $24,999 | 24 (3.5%) | 65 (30.1%) |
| $25,000 to $34,999 | 34 (4.9%) | 22 (10.2%) |
| $35,000 to $49,999 | 159 (23.1%) | 28 (13.0%) |
| $50,000 to $74,999 | 137 (19.9%) | 0 (0.0%) |
| $75,000 to $99,999 | 87 (12.7%) | 40 (18.5%) |
| $100,000 to $149,999 | 91 (13.2%) | 20 (9.3%) |
| $150,000 or more | 134 (19.5%) | 0 (0.0%) |
| Total | 688 (100.0%) | 216 (100.0%) |
Monthly Housing Cost Tiers in Shadybrook
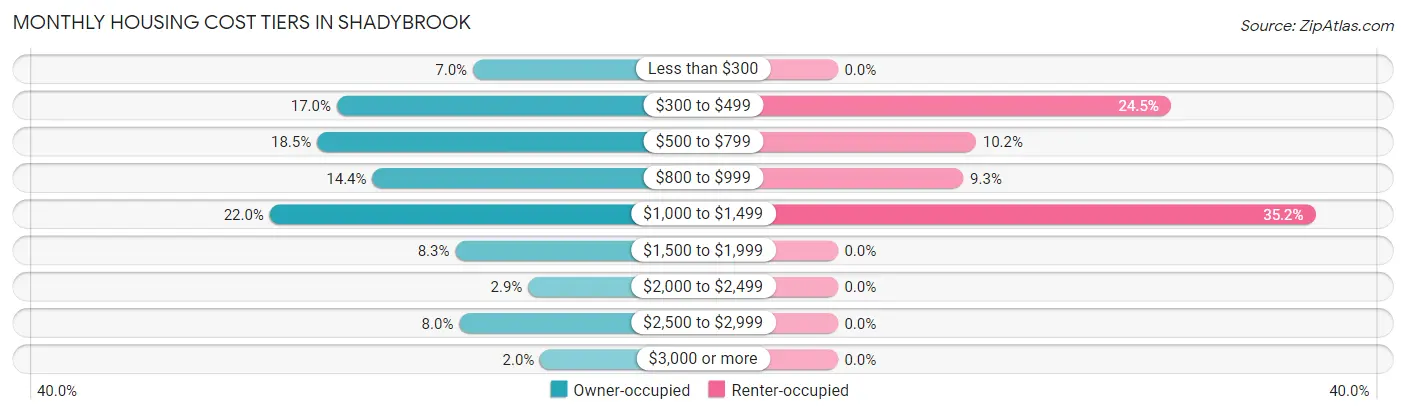
| Monthly Cost | Owner-occupied | Renter-occupied |
| Less than $300 | 48 (7.0%) | 0 (0.0%) |
| $300 to $499 | 117 (17.0%) | 53 (24.5%) |
| $500 to $799 | 127 (18.5%) | 22 (10.2%) |
| $800 to $999 | 99 (14.4%) | 20 (9.3%) |
| $1,000 to $1,499 | 151 (22.0%) | 76 (35.2%) |
| $1,500 to $1,999 | 57 (8.3%) | 0 (0.0%) |
| $2,000 to $2,499 | 20 (2.9%) | 0 (0.0%) |
| $2,500 to $2,999 | 55 (8.0%) | 0 (0.0%) |
| $3,000 or more | 14 (2.0%) | 0 (0.0%) |
| Total | 688 (100.0%) | 216 (100.0%) |
Physical Housing Characteristics in Shadybrook
Housing Structures in Shadybrook
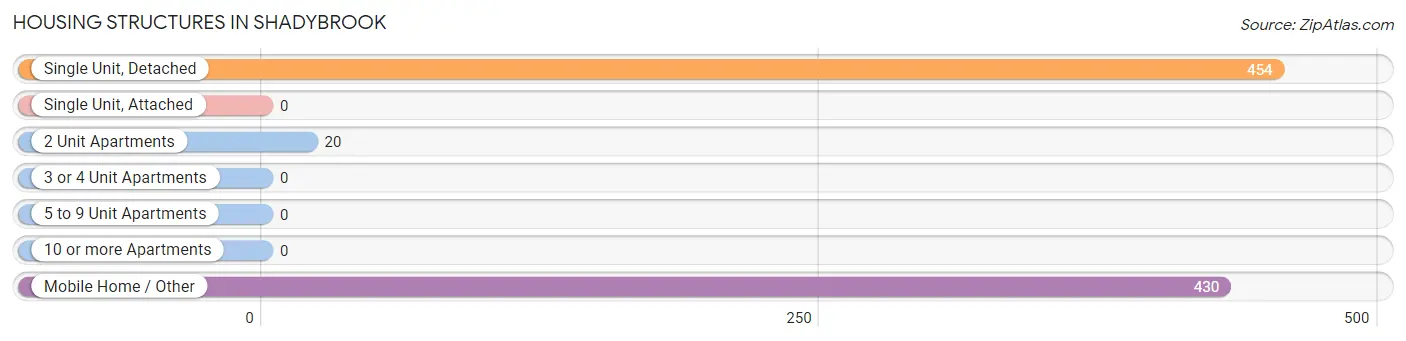
| Structure Type | # Housing Units | % Housing Units |
| Single Unit, Detached | 454 | 50.2% |
| Single Unit, Attached | 0 | 0.0% |
| 2 Unit Apartments | 20 | 2.2% |
| 3 or 4 Unit Apartments | 0 | 0.0% |
| 5 to 9 Unit Apartments | 0 | 0.0% |
| 10 or more Apartments | 0 | 0.0% |
| Mobile Home / Other | 430 | 47.6% |
| Total | 904 | 100.0% |
Housing Structures by Occupancy in Shadybrook
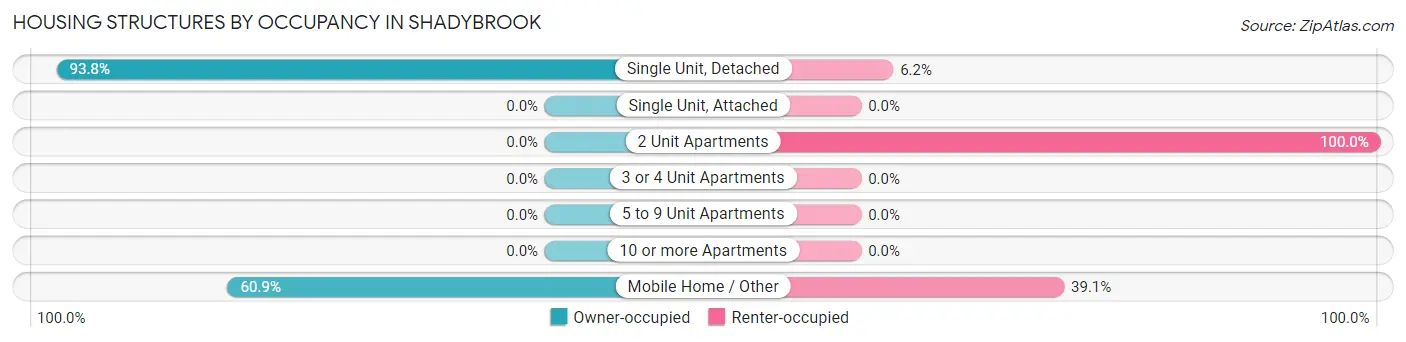
| Structure Type | Owner-occupied | Renter-occupied |
| Single Unit, Detached | 426 (93.8%) | 28 (6.2%) |
| Single Unit, Attached | 0 (0.0%) | 0 (0.0%) |
| 2 Unit Apartments | 0 (0.0%) | 20 (100.0%) |
| 3 or 4 Unit Apartments | 0 (0.0%) | 0 (0.0%) |
| 5 to 9 Unit Apartments | 0 (0.0%) | 0 (0.0%) |
| 10 or more Apartments | 0 (0.0%) | 0 (0.0%) |
| Mobile Home / Other | 262 (60.9%) | 168 (39.1%) |
| Total | 688 (76.1%) | 216 (23.9%) |
Housing Structures by Number of Rooms in Shadybrook
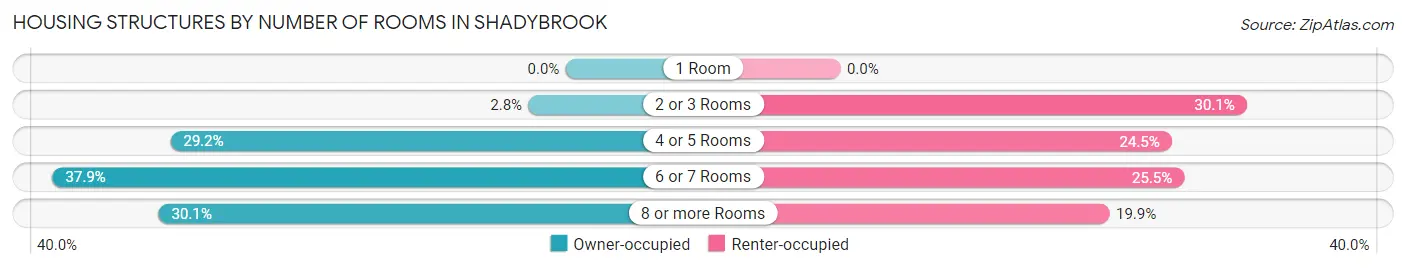
| Number of Rooms | Owner-occupied | Renter-occupied |
| 1 Room | 0 (0.0%) | 0 (0.0%) |
| 2 or 3 Rooms | 19 (2.8%) | 65 (30.1%) |
| 4 or 5 Rooms | 201 (29.2%) | 53 (24.5%) |
| 6 or 7 Rooms | 261 (37.9%) | 55 (25.5%) |
| 8 or more Rooms | 207 (30.1%) | 43 (19.9%) |
| Total | 688 (100.0%) | 216 (100.0%) |
Housing Structure by Heating Type in Shadybrook
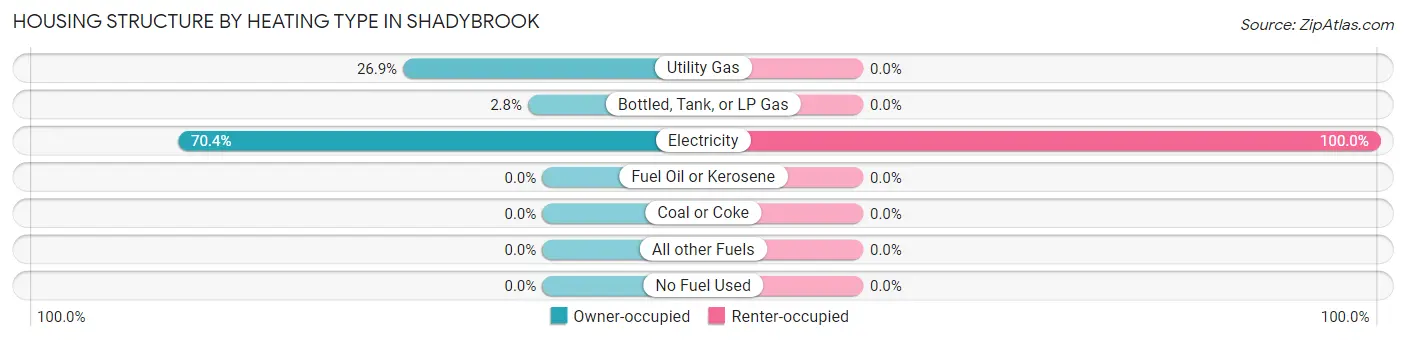
| Heating Type | Owner-occupied | Renter-occupied |
| Utility Gas | 185 (26.9%) | 0 (0.0%) |
| Bottled, Tank, or LP Gas | 19 (2.8%) | 0 (0.0%) |
| Electricity | 484 (70.4%) | 216 (100.0%) |
| Fuel Oil or Kerosene | 0 (0.0%) | 0 (0.0%) |
| Coal or Coke | 0 (0.0%) | 0 (0.0%) |
| All other Fuels | 0 (0.0%) | 0 (0.0%) |
| No Fuel Used | 0 (0.0%) | 0 (0.0%) |
| Total | 688 (100.0%) | 216 (100.0%) |
Household Vehicle Usage in Shadybrook
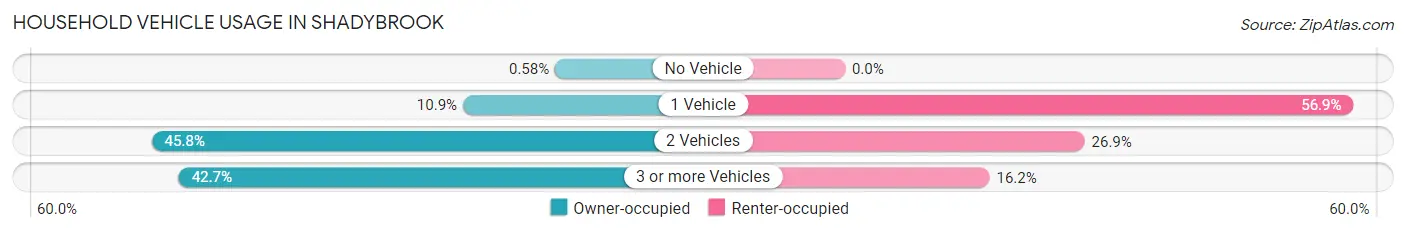
| Vehicles per Household | Owner-occupied | Renter-occupied |
| No Vehicle | 4 (0.6%) | 0 (0.0%) |
| 1 Vehicle | 75 (10.9%) | 123 (56.9%) |
| 2 Vehicles | 315 (45.8%) | 58 (26.9%) |
| 3 or more Vehicles | 294 (42.7%) | 35 (16.2%) |
| Total | 688 (100.0%) | 216 (100.0%) |
Real Estate & Mortgages in Shadybrook
Real Estate and Mortgage Overview in Shadybrook
| Characteristic | Without Mortgage | With Mortgage |
| Housing Units | 372 | 316 |
| Median Property Value | $78,500 | $258,900 |
| Median Household Income | $74,750 | $69 |
| Monthly Housing Costs | $532 | $14 |
| Real Estate Taxes | $1,082 | $34 |
Property Value by Mortgage Status in Shadybrook
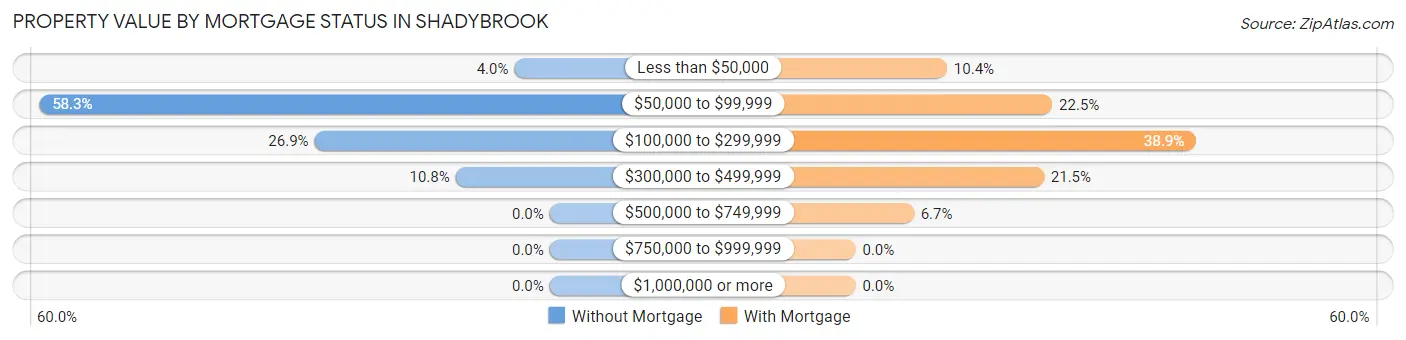
| Property Value | Without Mortgage | With Mortgage |
| Less than $50,000 | 15 (4.0%) | 33 (10.4%) |
| $50,000 to $99,999 | 217 (58.3%) | 71 (22.5%) |
| $100,000 to $299,999 | 100 (26.9%) | 123 (38.9%) |
| $300,000 to $499,999 | 40 (10.7%) | 68 (21.5%) |
| $500,000 to $749,999 | 0 (0.0%) | 21 (6.7%) |
| $750,000 to $999,999 | 0 (0.0%) | 0 (0.0%) |
| $1,000,000 or more | 0 (0.0%) | 0 (0.0%) |
| Total | 372 (100.0%) | 316 (100.0%) |
Household Income by Mortgage Status in Shadybrook
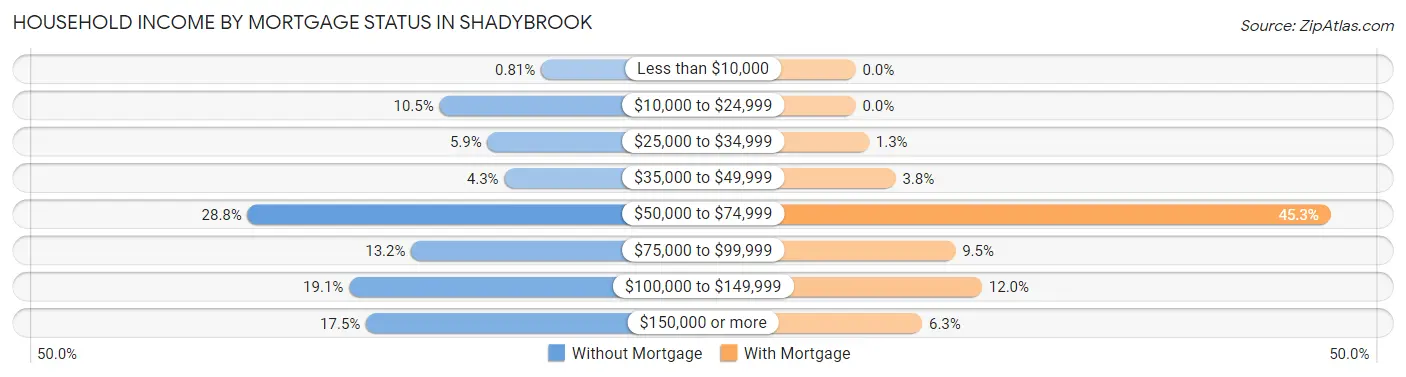
| Household Income | Without Mortgage | With Mortgage |
| Less than $10,000 | 3 (0.8%) | 0 (0.0%) |
| $10,000 to $24,999 | 39 (10.5%) | 0 (0.0%) |
| $25,000 to $34,999 | 22 (5.9%) | 4 (1.3%) |
| $35,000 to $49,999 | 16 (4.3%) | 12 (3.8%) |
| $50,000 to $74,999 | 107 (28.8%) | 143 (45.3%) |
| $75,000 to $99,999 | 49 (13.2%) | 30 (9.5%) |
| $100,000 to $149,999 | 71 (19.1%) | 38 (12.0%) |
| $150,000 or more | 65 (17.5%) | 20 (6.3%) |
| Total | 372 (100.0%) | 316 (100.0%) |
Property Value to Household Income Ratio in Shadybrook
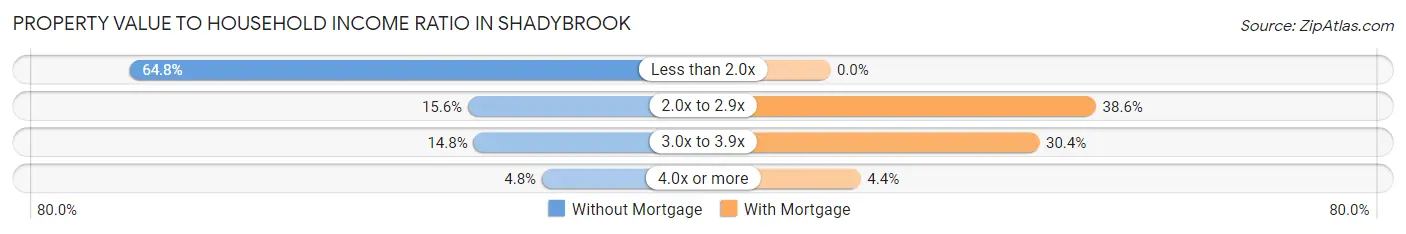
| Value-to-Income Ratio | Without Mortgage | With Mortgage |
| Less than 2.0x | 241 (64.8%) | 0 (0.0%) |
| 2.0x to 2.9x | 58 (15.6%) | 122 (38.6%) |
| 3.0x to 3.9x | 55 (14.8%) | 96 (30.4%) |
| 4.0x or more | 18 (4.8%) | 14 (4.4%) |
| Total | 372 (100.0%) | 316 (100.0%) |
Real Estate Taxes by Mortgage Status in Shadybrook
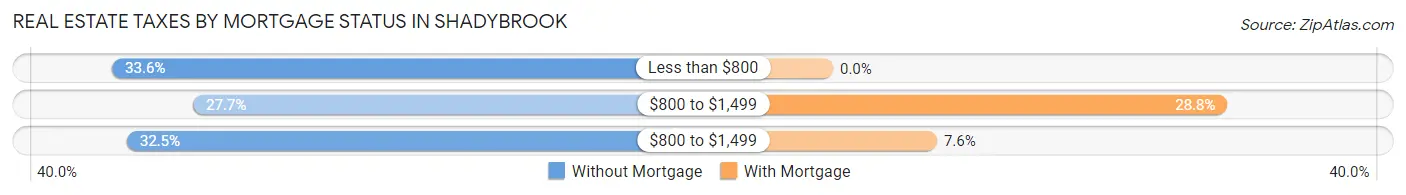
| Property Taxes | Without Mortgage | With Mortgage |
| Less than $800 | 125 (33.6%) | 0 (0.0%) |
| $800 to $1,499 | 103 (27.7%) | 91 (28.8%) |
| $800 to $1,499 | 121 (32.5%) | 24 (7.6%) |
| Total | 372 (100.0%) | 316 (100.0%) |
Health & Disability in Shadybrook
Health Insurance Coverage by Age in Shadybrook
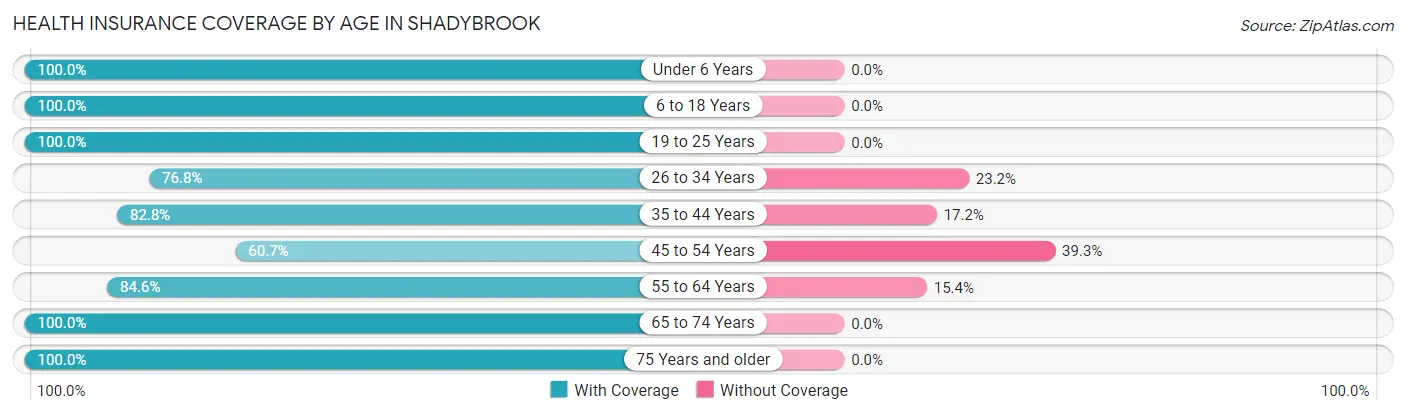
| Age Bracket | With Coverage | Without Coverage |
| Under 6 Years | 90 (100.0%) | 0 (0.0%) |
| 6 to 18 Years | 461 (100.0%) | 0 (0.0%) |
| 19 to 25 Years | 100 (100.0%) | 0 (0.0%) |
| 26 to 34 Years | 152 (76.8%) | 46 (23.2%) |
| 35 to 44 Years | 221 (82.8%) | 46 (17.2%) |
| 45 to 54 Years | 179 (60.7%) | 116 (39.3%) |
| 55 to 64 Years | 319 (84.6%) | 58 (15.4%) |
| 65 to 74 Years | 374 (100.0%) | 0 (0.0%) |
| 75 Years and older | 153 (100.0%) | 0 (0.0%) |
| Total | 2,049 (88.5%) | 266 (11.5%) |
Health Insurance Coverage by Citizenship Status in Shadybrook
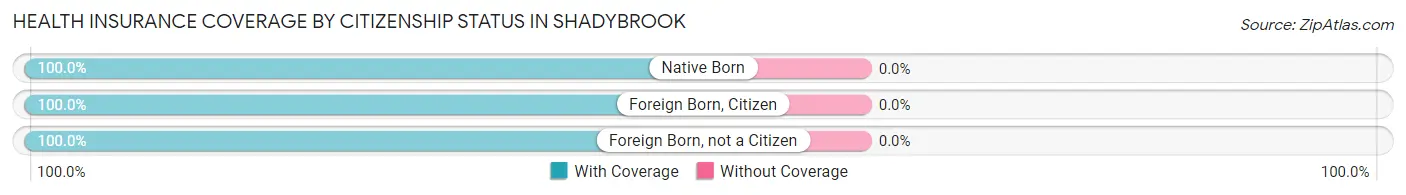
| Citizenship Status | With Coverage | Without Coverage |
| Native Born | 90 (100.0%) | 0 (0.0%) |
| Foreign Born, Citizen | 461 (100.0%) | 0 (0.0%) |
| Foreign Born, not a Citizen | 100 (100.0%) | 0 (0.0%) |
Health Insurance Coverage by Household Income in Shadybrook
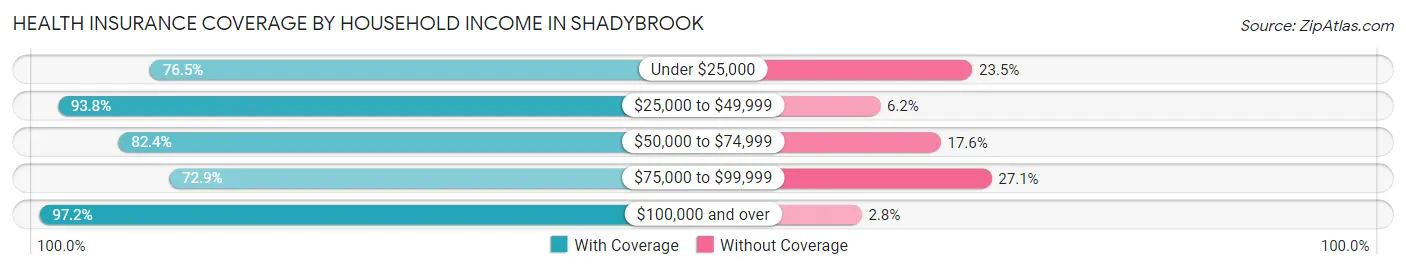
| Household Income | With Coverage | Without Coverage |
| Under $25,000 | 228 (76.5%) | 70 (23.5%) |
| $25,000 to $49,999 | 573 (93.8%) | 38 (6.2%) |
| $50,000 to $74,999 | 324 (82.4%) | 69 (17.6%) |
| $75,000 to $99,999 | 183 (72.9%) | 68 (27.1%) |
| $100,000 and over | 741 (97.2%) | 21 (2.8%) |
Public vs Private Health Insurance Coverage by Age in Shadybrook
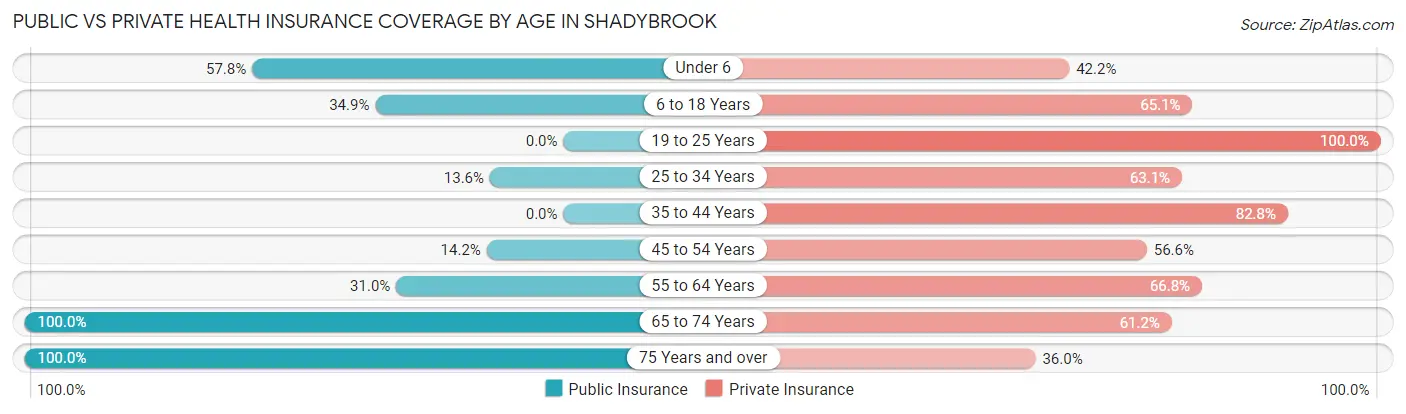
| Age Bracket | Public Insurance | Private Insurance |
| Under 6 | 52 (57.8%) | 38 (42.2%) |
| 6 to 18 Years | 161 (34.9%) | 300 (65.1%) |
| 19 to 25 Years | 0 (0.0%) | 100 (100.0%) |
| 25 to 34 Years | 27 (13.6%) | 125 (63.1%) |
| 35 to 44 Years | 0 (0.0%) | 221 (82.8%) |
| 45 to 54 Years | 42 (14.2%) | 167 (56.6%) |
| 55 to 64 Years | 117 (31.0%) | 252 (66.8%) |
| 65 to 74 Years | 374 (100.0%) | 229 (61.2%) |
| 75 Years and over | 153 (100.0%) | 55 (35.9%) |
| Total | 926 (40.0%) | 1,487 (64.2%) |
Disability Status by Sex by Age in Shadybrook
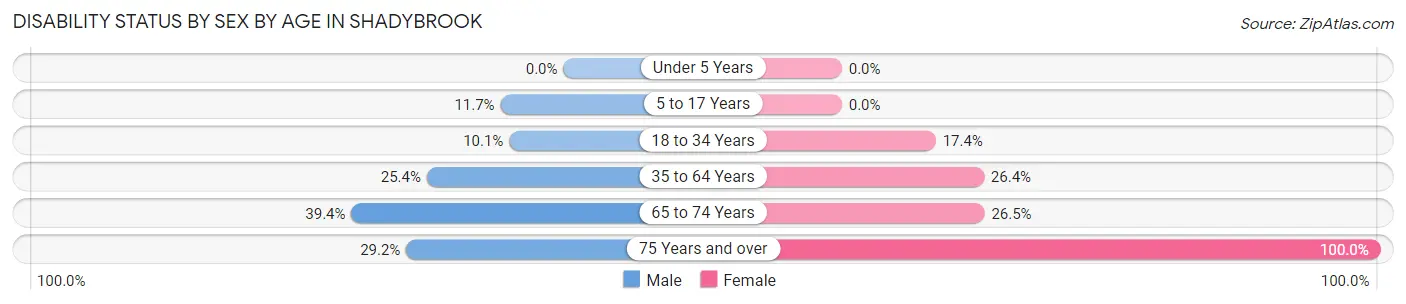
| Age Bracket | Male | Female |
| Under 5 Years | 0 (0.0%) | 0 (0.0%) |
| 5 to 17 Years | 25 (11.7%) | 0 (0.0%) |
| 18 to 34 Years | 19 (10.1%) | 19 (17.4%) |
| 35 to 64 Years | 91 (25.4%) | 153 (26.4%) |
| 65 to 74 Years | 61 (39.4%) | 58 (26.5%) |
| 75 Years and over | 28 (29.2%) | 57 (100.0%) |
Disability Class by Sex by Age in Shadybrook
Disability Class: Hearing Difficulty
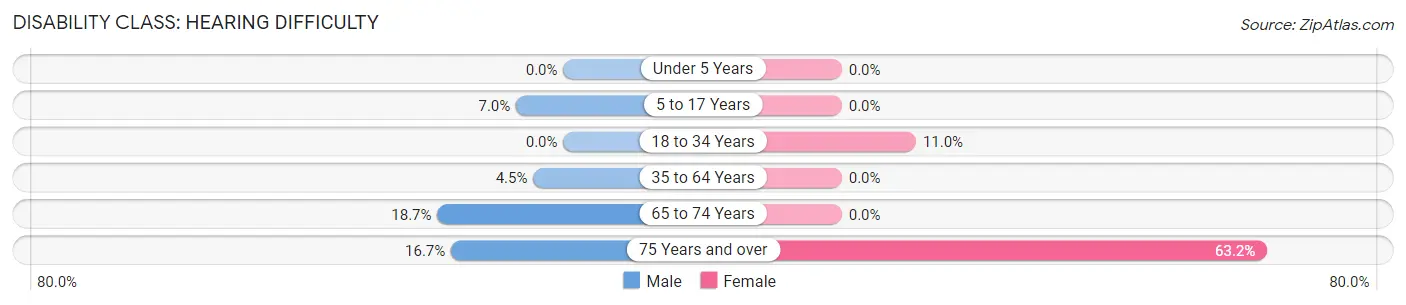
| Age Bracket | Male | Female |
| Under 5 Years | 0 (0.0%) | 0 (0.0%) |
| 5 to 17 Years | 15 (7.0%) | 0 (0.0%) |
| 18 to 34 Years | 0 (0.0%) | 12 (11.0%) |
| 35 to 64 Years | 16 (4.5%) | 0 (0.0%) |
| 65 to 74 Years | 29 (18.7%) | 0 (0.0%) |
| 75 Years and over | 16 (16.7%) | 36 (63.2%) |
Disability Class: Vision Difficulty
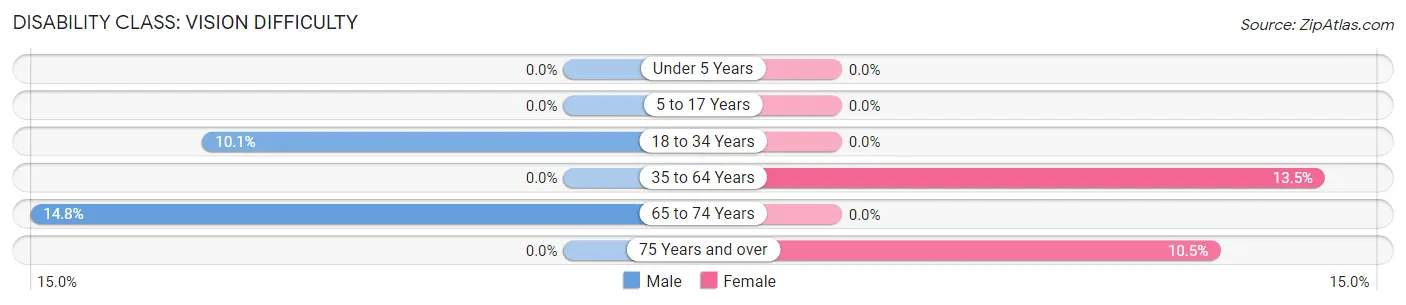
| Age Bracket | Male | Female |
| Under 5 Years | 0 (0.0%) | 0 (0.0%) |
| 5 to 17 Years | 0 (0.0%) | 0 (0.0%) |
| 18 to 34 Years | 19 (10.1%) | 0 (0.0%) |
| 35 to 64 Years | 0 (0.0%) | 78 (13.5%) |
| 65 to 74 Years | 23 (14.8%) | 0 (0.0%) |
| 75 Years and over | 0 (0.0%) | 6 (10.5%) |
Disability Class: Cognitive Difficulty
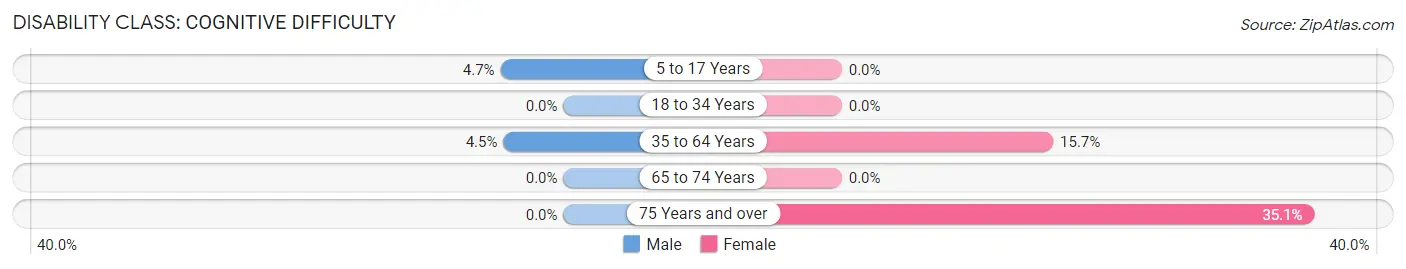
| Age Bracket | Male | Female |
| 5 to 17 Years | 10 (4.7%) | 0 (0.0%) |
| 18 to 34 Years | 0 (0.0%) | 0 (0.0%) |
| 35 to 64 Years | 16 (4.5%) | 91 (15.7%) |
| 65 to 74 Years | 0 (0.0%) | 0 (0.0%) |
| 75 Years and over | 0 (0.0%) | 20 (35.1%) |
Disability Class: Ambulatory Difficulty
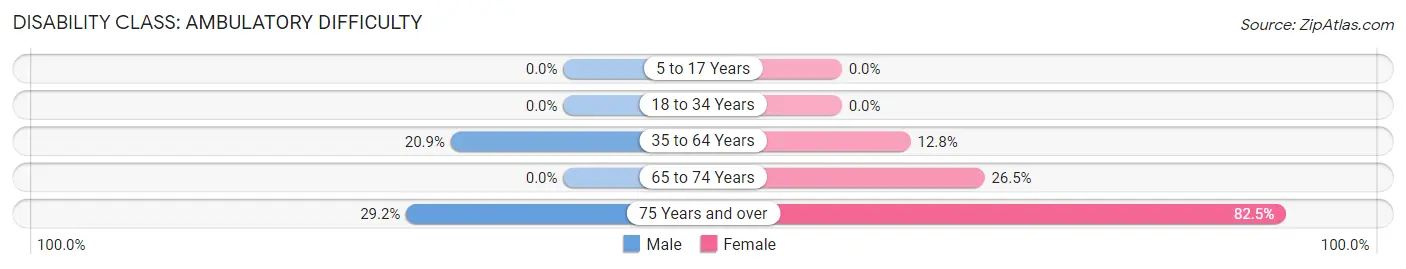
| Age Bracket | Male | Female |
| 5 to 17 Years | 0 (0.0%) | 0 (0.0%) |
| 18 to 34 Years | 0 (0.0%) | 0 (0.0%) |
| 35 to 64 Years | 75 (20.9%) | 74 (12.8%) |
| 65 to 74 Years | 0 (0.0%) | 58 (26.5%) |
| 75 Years and over | 28 (29.2%) | 47 (82.5%) |
Disability Class: Self-Care Difficulty
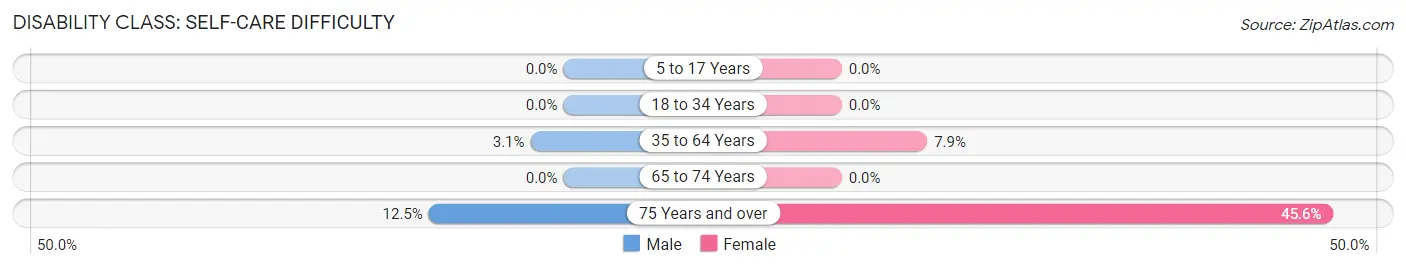
| Age Bracket | Male | Female |
| 5 to 17 Years | 0 (0.0%) | 0 (0.0%) |
| 18 to 34 Years | 0 (0.0%) | 0 (0.0%) |
| 35 to 64 Years | 11 (3.1%) | 46 (7.9%) |
| 65 to 74 Years | 0 (0.0%) | 0 (0.0%) |
| 75 Years and over | 12 (12.5%) | 26 (45.6%) |
Technology Access in Shadybrook
Computing Device Access in Shadybrook
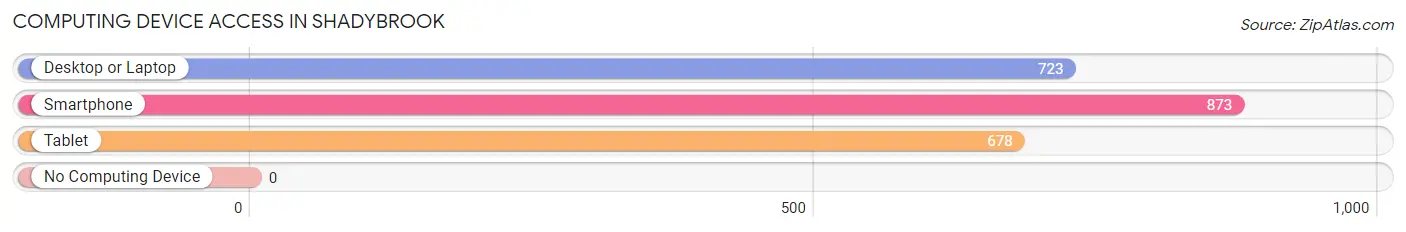
| Device Type | # Households | % Households |
| Desktop or Laptop | 723 | 80.0% |
| Smartphone | 873 | 96.6% |
| Tablet | 678 | 75.0% |
| No Computing Device | 0 | 0.0% |
| Total | 904 | 100.0% |
Internet Access in Shadybrook
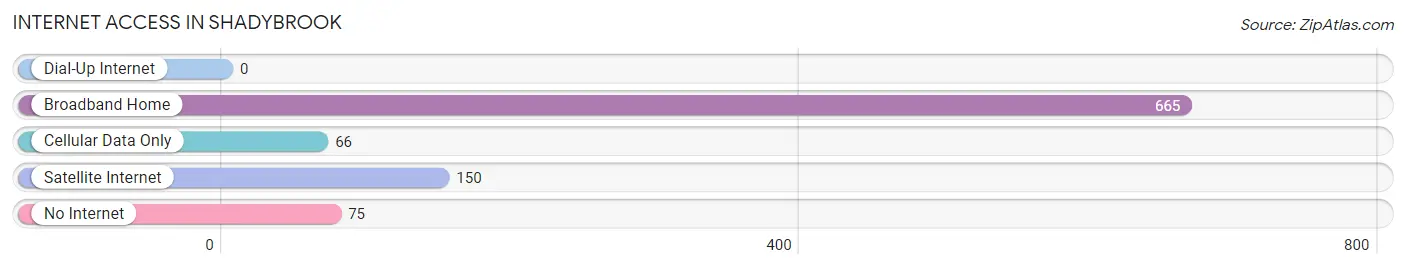
| Internet Type | # Households | % Households |
| Dial-Up Internet | 0 | 0.0% |
| Broadband Home | 665 | 73.6% |
| Cellular Data Only | 66 | 7.3% |
| Satellite Internet | 150 | 16.6% |
| No Internet | 75 | 8.3% |
| Total | 904 | 100.0% |
Shadybrook Summary
Shadybrook is a small town located in the state of Texas, in the United States. It is situated in the southeastern part of the state, in the county of Brazoria. The town has a population of approximately 1,500 people, and is located about 30 miles south of Houston.
History
Shadybrook was founded in 1845 by a group of settlers from the nearby town of Brazoria. The settlers were looking for a place to settle and start a new life, and they chose the area around Shadybrook because of its abundant natural resources. The town was originally called “Shadybrook Settlement”, and was later changed to its current name.
The town was initially a farming community, and the settlers grew cotton, corn, and other crops. The town also had a small sawmill, which was used to produce lumber for the local area. In the late 1800s, the town began to grow and develop, and by the early 1900s, it had become a thriving community.
Geography
Shadybrook is located in the southeastern part of Texas, in the county of Brazoria. The town is situated on the banks of the Brazos River, and is surrounded by rolling hills and lush forests. The town is located about 30 miles south of Houston, and is close to the Gulf of Mexico.
The climate in Shadybrook is generally warm and humid, with temperatures ranging from the mid-70s in the summer to the mid-50s in the winter. The town receives an average of about 40 inches of rain per year, and is prone to occasional flooding.
Economy
The economy of Shadybrook is largely based on agriculture and tourism. The town is home to several farms, which produce a variety of crops, including cotton, corn, and soybeans. The town also has a small sawmill, which produces lumber for the local area.
In addition to agriculture, tourism is an important part of the local economy. The town is home to several attractions, including a historic courthouse, a museum, and a number of parks and recreational areas. The town also hosts several festivals and events throughout the year, which attract visitors from all over the state.
Demographics
As of the 2010 census, the population of Shadybrook was 1,500. The town is predominantly white, with about 75% of the population being Caucasian. The remaining 25% of the population is made up of African Americans, Hispanics, and other ethnicities.
The median household income in Shadybrook is $45,000, and the median home value is $150,000. The town has a low unemployment rate, and the majority of the population is employed in the agricultural and tourism industries.
Shadybrook is a small town with a rich history and a vibrant economy. The town is home to a diverse population, and offers a variety of attractions and activities for visitors and residents alike. With its close proximity to Houston and the Gulf of Mexico, Shadybrook is an ideal place to live, work, and play.
Common Questions
What is the Total Population of Shadybrook?
Total Population of Shadybrook is 2,315.
What is the Total Male Population of Shadybrook?
Total Male Population of Shadybrook is 1,095.
What is the Total Female Population of Shadybrook?
Total Female Population of Shadybrook is 1,220.
What is the Ratio of Males per 100 Females in Shadybrook?
There are 89.75 Males per 100 Females in Shadybrook.
What is the Ratio of Females per 100 Males in Shadybrook?
There are 111.42 Females per 100 Males in Shadybrook.
What is the Median Population Age in Shadybrook?
Median Population Age in Shadybrook is 48.2 Years.
What is the Average Family Size in Shadybrook
Average Family Size in Shadybrook is 2.8 People.
What is the Average Household Size in Shadybrook
Average Household Size in Shadybrook is 2.6 People.
What is Per Capita Income in Shadybrook?
Per Capita income in Shadybrook is $32,183.
What is the Median Family Income in Shadybrook?
Median Family Income in Shadybrook is $72,656.
What is the Median Household income in Shadybrook?
Median Household Income in Shadybrook is $64,798.
What is Income or Wage Gap in Shadybrook?
Income or Wage Gap in Shadybrook is 10.6%.
Women in Shadybrook earn 89.4 cents for every dollar earned by a man.
What is Inequality or Gini Index in Shadybrook?
Inequality or Gini Index in Shadybrook is 0.41.
How Large is the Labor Force in Shadybrook?
There are 1,003 People in the Labor Forcein in Shadybrook.
What is the Percentage of People in the Labor Force in Shadybrook?
54.8% of People are in the Labor Force in Shadybrook.