Oak Valley, TX
Oak Valley Map
Oak Valley Overview
505
TOTAL POPULATION
256
MALE POPULATION
249
FEMALE POPULATION
102.81
MALES / 100 FEMALES
97.27
FEMALES / 100 MALES
42.8
MEDIAN AGE
3.0
AVG FAMILY SIZE
2.8
AVG HOUSEHOLD SIZE
$31,574
PER CAPITA INCOME
$81,875
AVG FAMILY INCOME
$77,000
AVG HOUSEHOLD INCOME
49.6%
WAGE / INCOME GAP [ % ]
50.4¢/ $1
WAGE / INCOME GAP [ $ ]
0.36
INEQUALITY / GINI INDEX
233
LABOR FORCE [ PEOPLE ]
56.8%
PERCENT IN LABOR FORCE
8.6%
UNEMPLOYMENT RATE
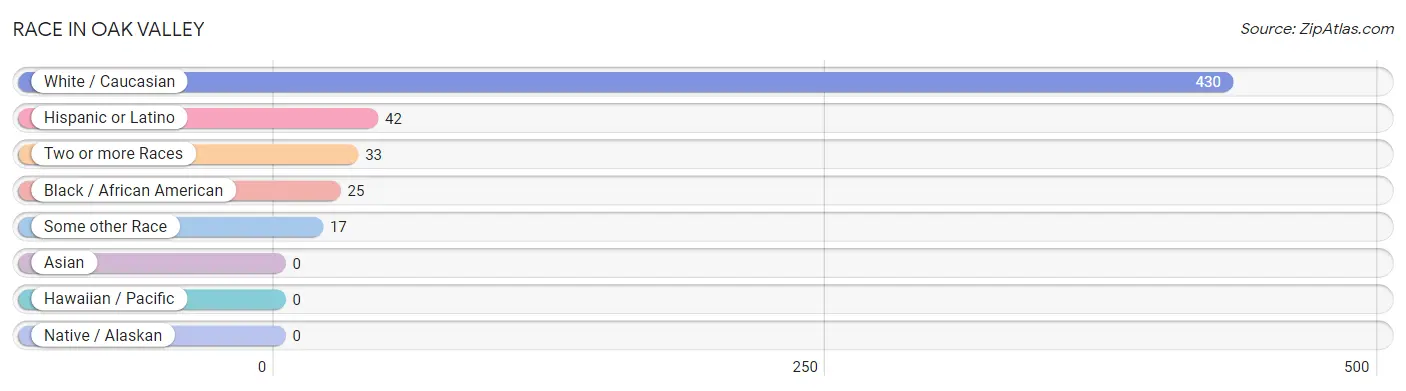
Race in Oak Valley
The most populous races in Oak Valley are White / Caucasian (430 | 85.2%), Hispanic or Latino (42 | 8.3%), and Two or more Races (33 | 6.5%).
| Race | # Population | % Population |
| Asian | 0 | 0.0% |
| Black / African American | 25 | 5.0% |
| Hawaiian / Pacific | 0 | 0.0% |
| Hispanic or Latino | 42 | 8.3% |
| Native / Alaskan | 0 | 0.0% |
| White / Caucasian | 430 | 85.2% |
| Two or more Races | 33 | 6.5% |
| Some other Race | 17 | 3.4% |
| Total | 505 | 100.0% |
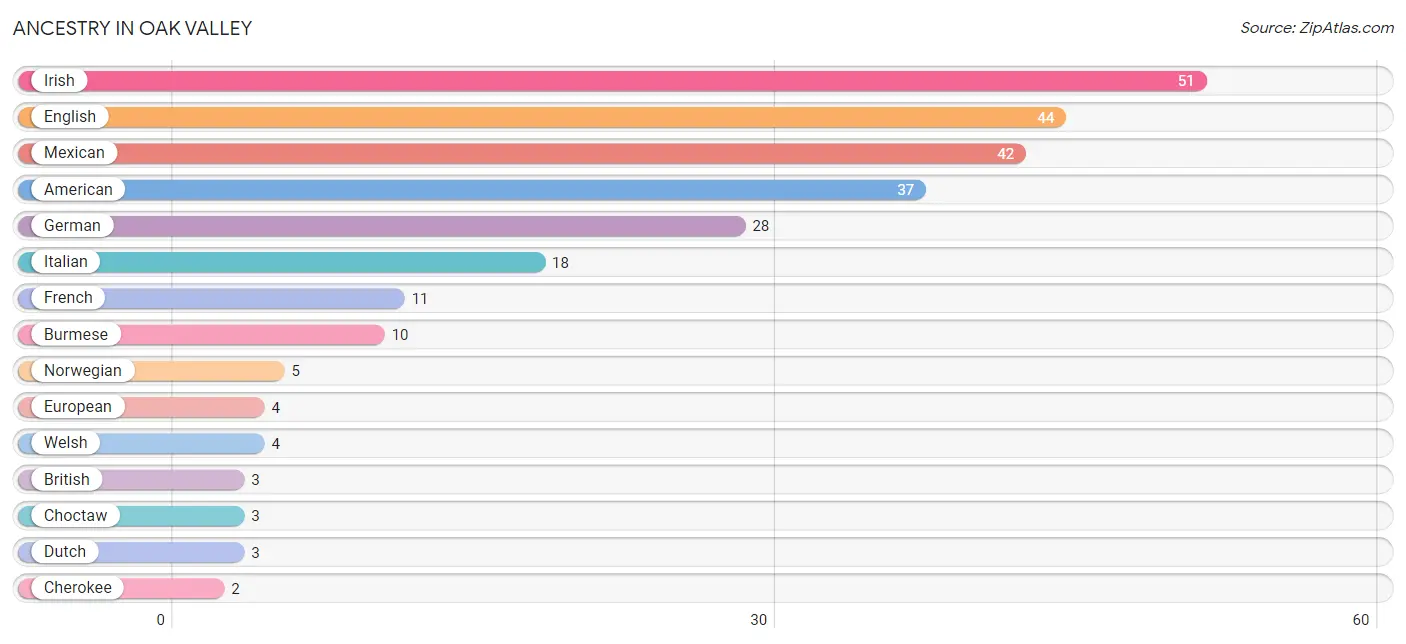
Ancestry in Oak Valley
The most populous ancestries reported in Oak Valley are Irish (51 | 10.1%), English (44 | 8.7%), Mexican (42 | 8.3%), American (37 | 7.3%), and German (28 | 5.5%), together accounting for 40.0% of all Oak Valley residents.
| Ancestry | # Population | % Population |
| American | 37 | 7.3% |
| British | 3 | 0.6% |
| Burmese | 10 | 2.0% |
| Cherokee | 2 | 0.4% |
| Choctaw | 3 | 0.6% |
| Dutch | 3 | 0.6% |
| English | 44 | 8.7% |
| European | 4 | 0.8% |
| French | 11 | 2.2% |
| German | 28 | 5.5% |
| Irish | 51 | 10.1% |
| Italian | 18 | 3.6% |
| Mexican | 42 | 8.3% |
| Mexican American Indian | 2 | 0.4% |
| Norwegian | 5 | 1.0% |
| Swedish | 1 | 0.2% |
| Welsh | 4 | 0.8% | View All 17 Rows |
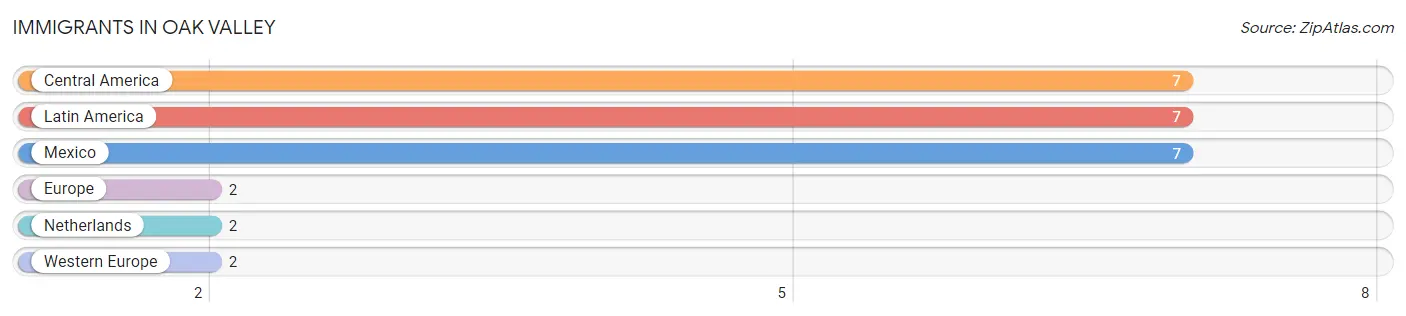
Immigrants in Oak Valley
The most numerous immigrant groups reported in Oak Valley came from Central America (7 | 1.4%), Latin America (7 | 1.4%), Mexico (7 | 1.4%), Europe (2 | 0.4%), and Netherlands (2 | 0.4%), together accounting for 5.0% of all Oak Valley residents.
| Immigration Origin | # Population | % Population |
| Central America | 7 | 1.4% |
| Europe | 2 | 0.4% |
| Latin America | 7 | 1.4% |
| Mexico | 7 | 1.4% |
| Netherlands | 2 | 0.4% |
| Western Europe | 2 | 0.4% | View All 6 Rows |
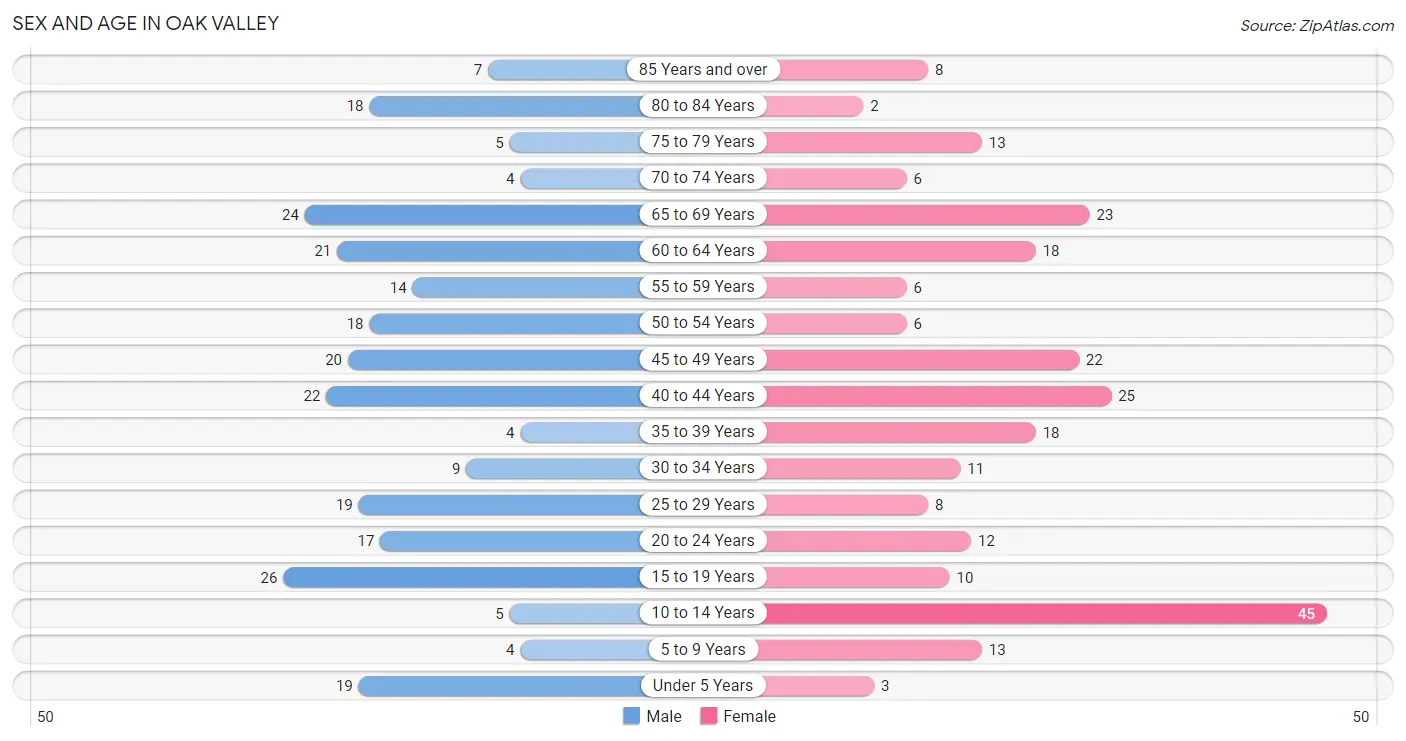
Sex and Age in Oak Valley
Sex and Age in Oak Valley
The most populous age groups in Oak Valley are 15 to 19 Years (26 | 10.2%) for men and 10 to 14 Years (45 | 18.1%) for women.
| Age Bracket | Male | Female |
| Under 5 Years | 19 (7.4%) | 3 (1.2%) |
| 5 to 9 Years | 4 (1.6%) | 13 (5.2%) |
| 10 to 14 Years | 5 (1.9%) | 45 (18.1%) |
| 15 to 19 Years | 26 (10.2%) | 10 (4.0%) |
| 20 to 24 Years | 17 (6.6%) | 12 (4.8%) |
| 25 to 29 Years | 19 (7.4%) | 8 (3.2%) |
| 30 to 34 Years | 9 (3.5%) | 11 (4.4%) |
| 35 to 39 Years | 4 (1.6%) | 18 (7.2%) |
| 40 to 44 Years | 22 (8.6%) | 25 (10.0%) |
| 45 to 49 Years | 20 (7.8%) | 22 (8.8%) |
| 50 to 54 Years | 18 (7.0%) | 6 (2.4%) |
| 55 to 59 Years | 14 (5.5%) | 6 (2.4%) |
| 60 to 64 Years | 21 (8.2%) | 18 (7.2%) |
| 65 to 69 Years | 24 (9.4%) | 23 (9.2%) |
| 70 to 74 Years | 4 (1.6%) | 6 (2.4%) |
| 75 to 79 Years | 5 (1.9%) | 13 (5.2%) |
| 80 to 84 Years | 18 (7.0%) | 2 (0.8%) |
| 85 Years and over | 7 (2.7%) | 8 (3.2%) |
| Total | 256 (100.0%) | 249 (100.0%) |
Families and Households in Oak Valley
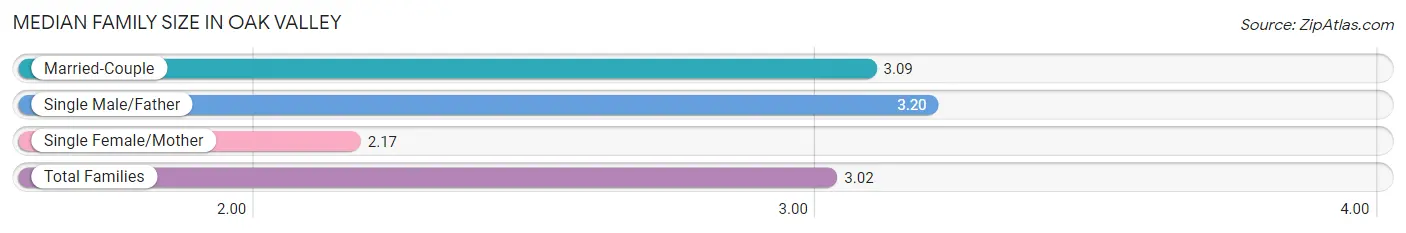
Median Family Size in Oak Valley
The median family size in Oak Valley is 3.02 persons per family, with single male/father families (15 | 10.6%) accounting for the largest median family size of 3.2 persons per family. On the other hand, single female/mother families (12 | 8.5%) represent the smallest median family size with 2.17 persons per family.
| Family Type | # Families | Family Size |
| Married-Couple | 114 (80.8%) | 3.09 |
| Single Male/Father | 15 (10.6%) | 3.20 |
| Single Female/Mother | 12 (8.5%) | 2.17 |
| Total Families | 141 (100.0%) | 3.02 |
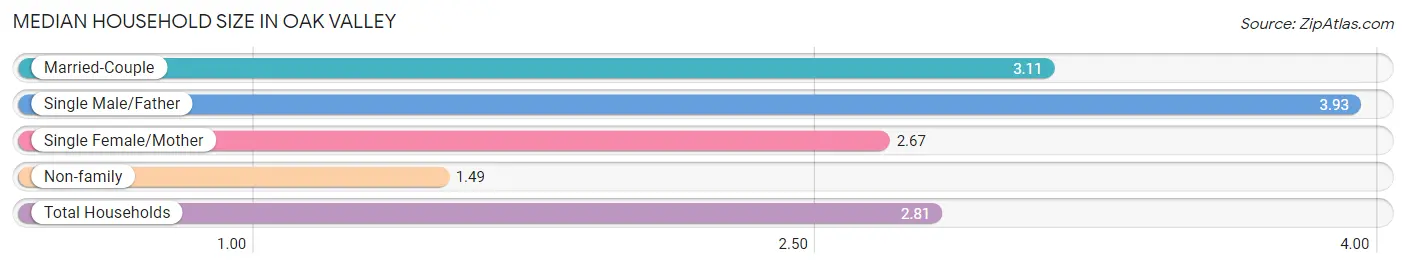
Median Household Size in Oak Valley
The median household size in Oak Valley is 2.81 persons per household, with single male/father households (15 | 8.4%) accounting for the largest median household size of 3.93 persons per household. non-family households (37 | 20.8%) represent the smallest median household size with 1.49 persons per household.
| Household Type | # Households | Household Size |
| Married-Couple | 114 (64.0%) | 3.11 |
| Single Male/Father | 15 (8.4%) | 3.93 |
| Single Female/Mother | 12 (6.7%) | 2.67 |
| Non-family | 37 (20.8%) | 1.49 |
| Total Households | 178 (100.0%) | 2.81 |
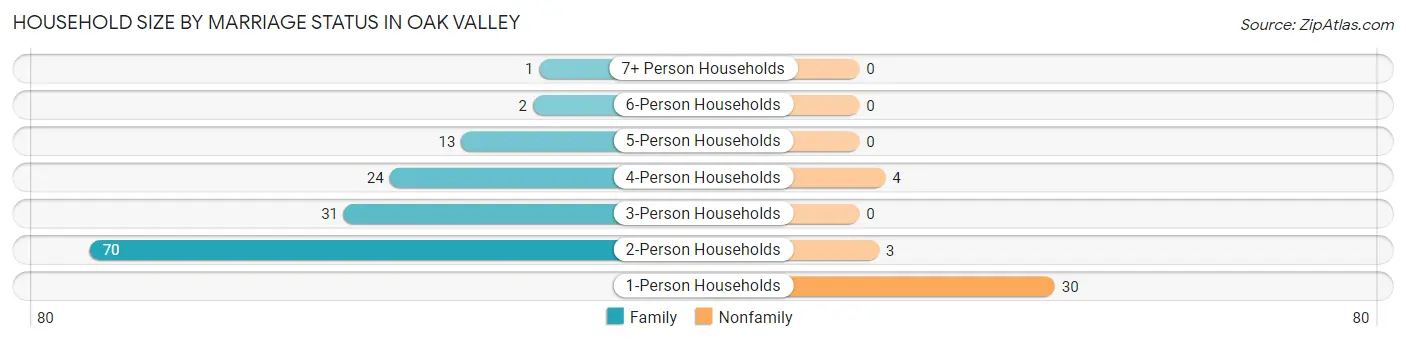
Household Size by Marriage Status in Oak Valley
Out of a total of 178 households in Oak Valley, 141 (79.2%) are family households, while 37 (20.8%) are nonfamily households. The most numerous type of family households are 2-person households, comprising 70, and the most common type of nonfamily households are 1-person households, comprising 30.
| Household Size | Family Households | Nonfamily Households |
| 1-Person Households | - | 30 (16.9%) |
| 2-Person Households | 70 (39.3%) | 3 (1.7%) |
| 3-Person Households | 31 (17.4%) | 0 (0.0%) |
| 4-Person Households | 24 (13.5%) | 4 (2.2%) |
| 5-Person Households | 13 (7.3%) | 0 (0.0%) |
| 6-Person Households | 2 (1.1%) | 0 (0.0%) |
| 7+ Person Households | 1 (0.6%) | 0 (0.0%) |
| Total | 141 (79.2%) | 37 (20.8%) |
Female Fertility in Oak Valley
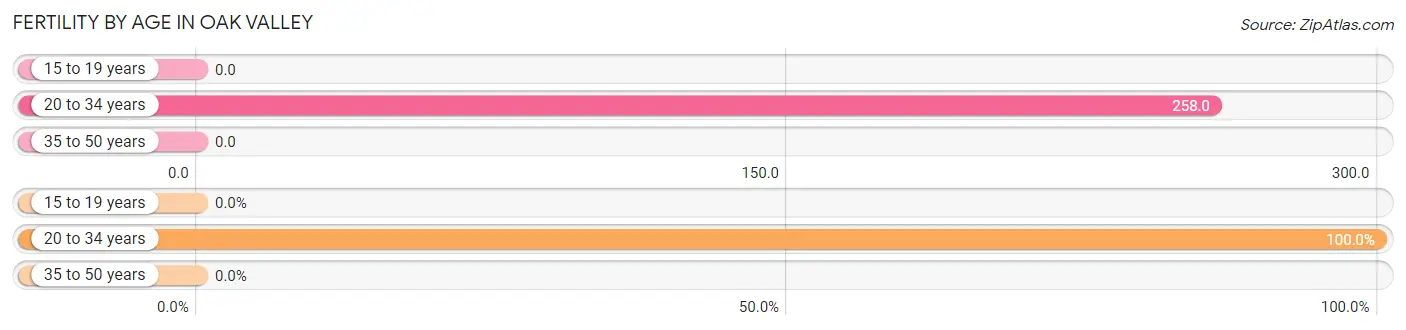
Fertility by Age in Oak Valley
Average fertility rate in Oak Valley is 75.0 births per 1,000 women. Women in the age bracket of 20 to 34 years have the highest fertility rate with 258.0 births per 1,000 women. Women in the age bracket of 20 to 34 years acount for 100.0% of all women with births.
| Age Bracket | Women with Births | Births / 1,000 Women |
| 15 to 19 years | 0 (0.0%) | 0.0 |
| 20 to 34 years | 8 (100.0%) | 258.0 |
| 35 to 50 years | 0 (0.0%) | 0.0 |
| Total | 8 (100.0%) | 75.0 |
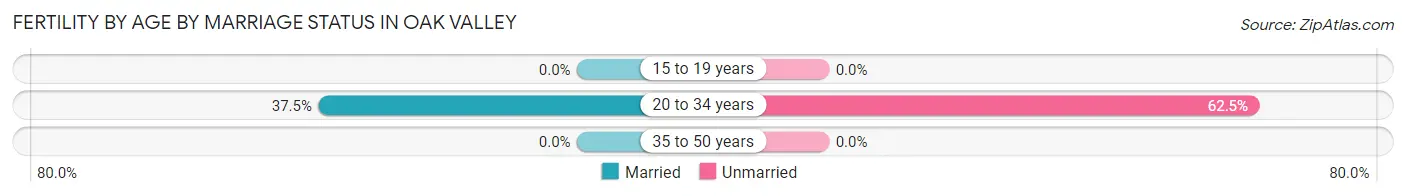
Fertility by Age by Marriage Status in Oak Valley
37.5% of women with births (8) in Oak Valley are married. The highest percentage of unmarried women with births falls into 20 to 34 years age bracket with 62.5% of them unmarried at the time of birth, while the lowest percentage of unmarried women with births belong to 20 to 34 years age bracket with 62.5% of them unmarried.
| Age Bracket | Married | Unmarried |
| 15 to 19 years | 0 (0.0%) | 0 (0.0%) |
| 20 to 34 years | 3 (37.5%) | 5 (62.5%) |
| 35 to 50 years | 0 (0.0%) | 0 (0.0%) |
| Total | 3 (37.5%) | 5 (62.5%) |
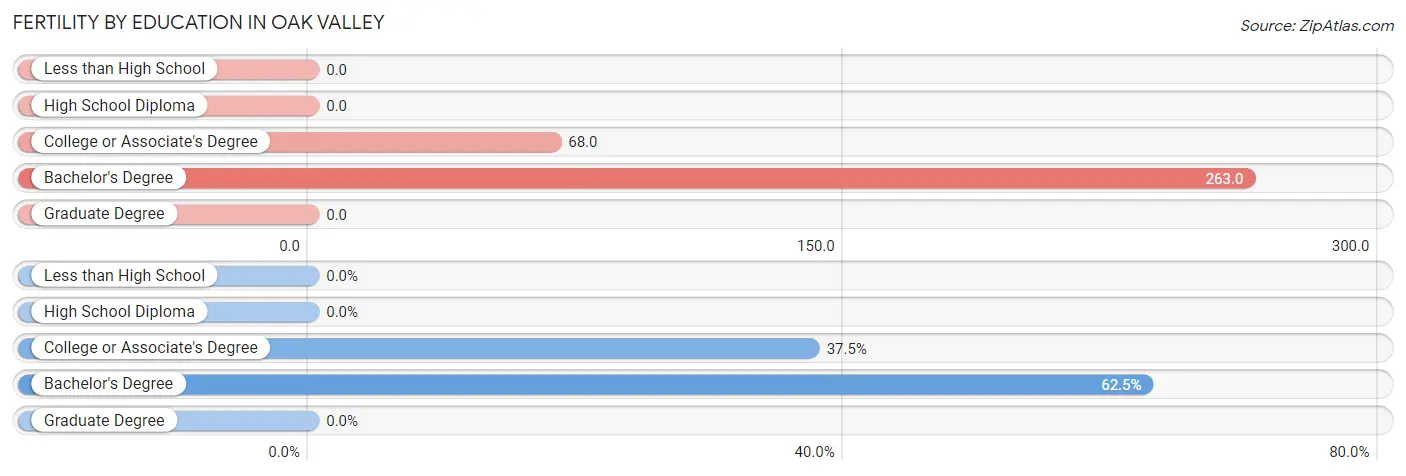
Fertility by Education in Oak Valley
| Educational Attainment | Women with Births | Births / 1,000 Women |
| Less than High School | 0 (0.0%) | 0.0 |
| High School Diploma | 0 (0.0%) | 0.0 |
| College or Associate's Degree | 3 (37.5%) | 68.0 |
| Bachelor's Degree | 5 (62.5%) | 263.0 |
| Graduate Degree | 0 (0.0%) | 0.0 |
| Total | 8 (100.0%) | 75.0 |
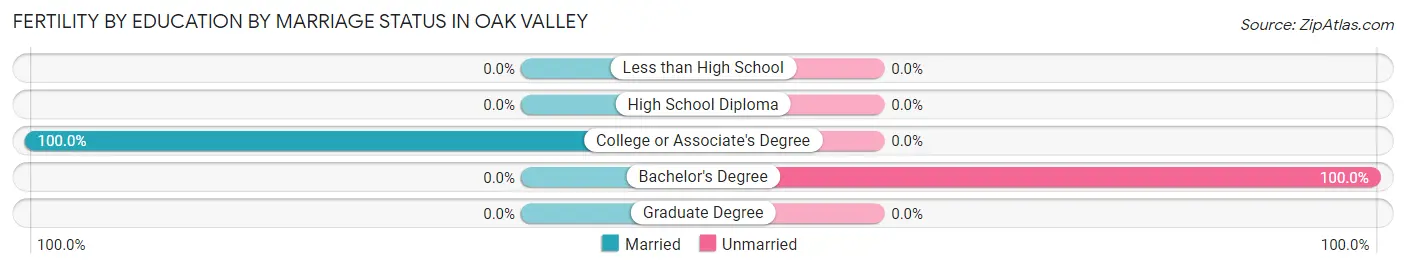
Fertility by Education by Marriage Status in Oak Valley
62.5% of women with births in Oak Valley are unmarried. Women with the educational attainment of college or associate's degree are most likely to be married with 100.0% of them married at childbirth, while women with the educational attainment of bachelor's degree are least likely to be married with 100.0% of them unmarried at childbirth.
| Educational Attainment | Married | Unmarried |
| Less than High School | 0 (0.0%) | 0 (0.0%) |
| High School Diploma | 0 (0.0%) | 0 (0.0%) |
| College or Associate's Degree | 3 (100.0%) | 0 (0.0%) |
| Bachelor's Degree | 0 (0.0%) | 5 (100.0%) |
| Graduate Degree | 0 (0.0%) | 0 (0.0%) |
| Total | 3 (37.5%) | 5 (62.5%) |
Income in Oak Valley
Income Overview in Oak Valley
Per Capita Income in Oak Valley is $31,574, while median incomes of families and households are $81,875 and $77,000 respectively.
| Characteristic | Number | Measure |
| Per Capita Income | 505 | $31,574 |
| Median Family Income | 141 | $81,875 |
| Mean Family Income | 141 | $95,489 |
| Median Household Income | 178 | $77,000 |
| Mean Household Income | 178 | $89,117 |
| Income Deficit | 141 | $0 |
| Wage / Income Gap (%) | 505 | 49.57% |
| Wage / Income Gap ($) | 505 | 50.43¢ per $1 |
| Gini / Inequality Index | 505 | 0.36 |
Earnings by Sex in Oak Valley
Average Earnings in Oak Valley are $36,250, $51,500 for men and $25,972 for women, a difference of 49.6%.
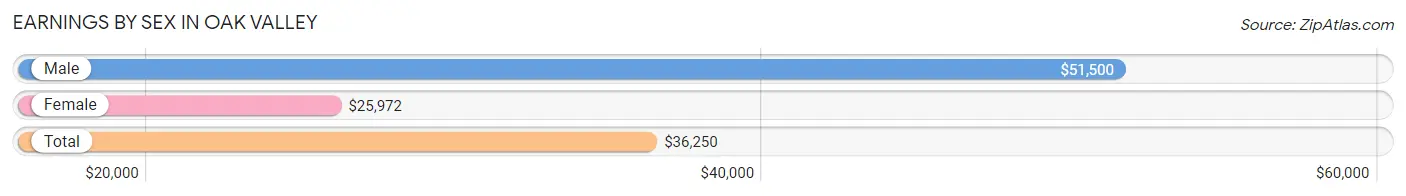
| Sex | Number | Average Earnings |
| Male | 132 (53.0%) | $51,500 |
| Female | 117 (47.0%) | $25,972 |
| Total | 249 (100.0%) | $36,250 |
Earnings by Sex by Income Bracket in Oak Valley
The most common earnings brackets in Oak Valley are $55,000 to $64,999 for men (20 | 15.1%) and $22,500 to $24,999 for women (17 | 14.5%).
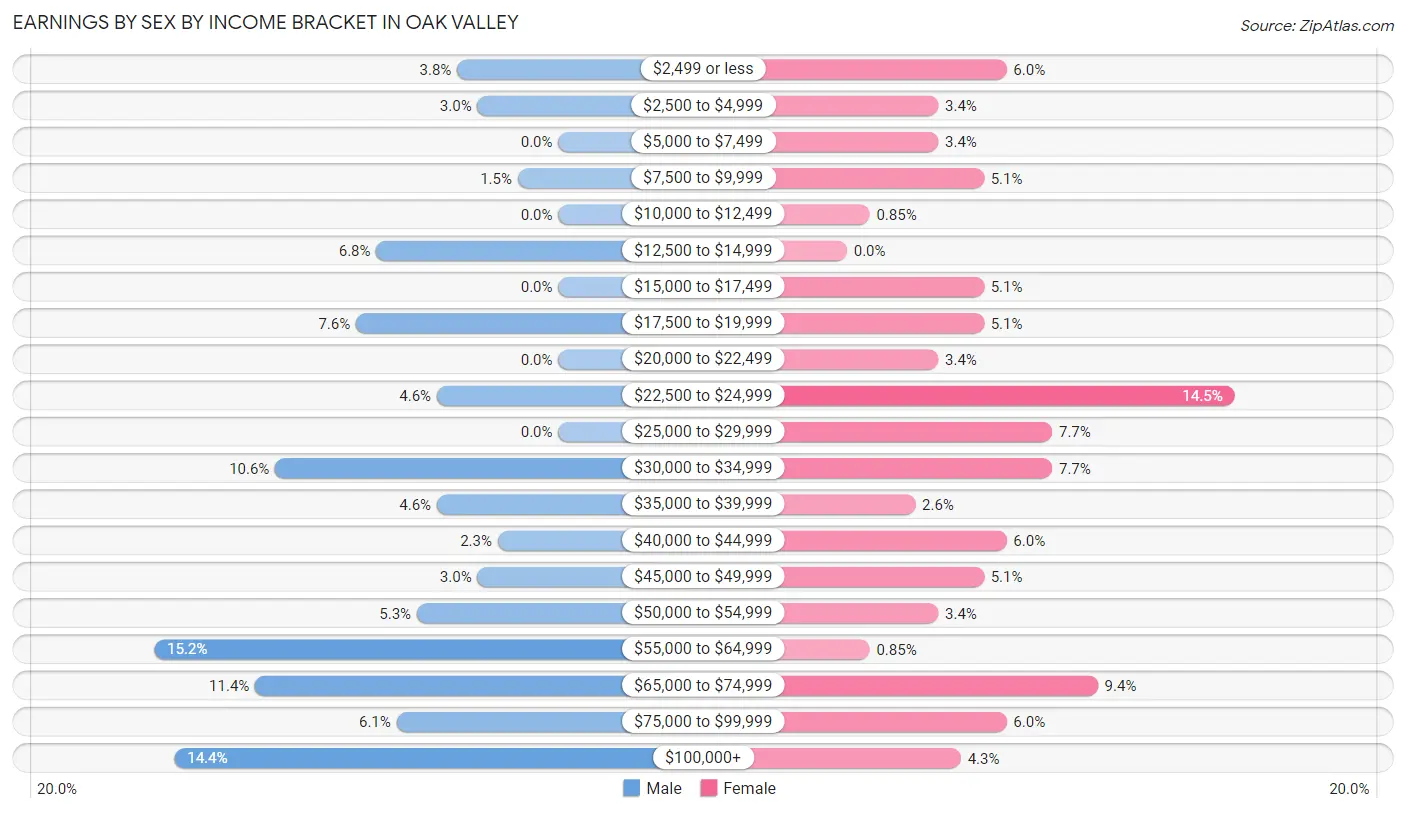
| Income | Male | Female |
| $2,499 or less | 5 (3.8%) | 7 (6.0%) |
| $2,500 to $4,999 | 4 (3.0%) | 4 (3.4%) |
| $5,000 to $7,499 | 0 (0.0%) | 4 (3.4%) |
| $7,500 to $9,999 | 2 (1.5%) | 6 (5.1%) |
| $10,000 to $12,499 | 0 (0.0%) | 1 (0.9%) |
| $12,500 to $14,999 | 9 (6.8%) | 0 (0.0%) |
| $15,000 to $17,499 | 0 (0.0%) | 6 (5.1%) |
| $17,500 to $19,999 | 10 (7.6%) | 6 (5.1%) |
| $20,000 to $22,499 | 0 (0.0%) | 4 (3.4%) |
| $22,500 to $24,999 | 6 (4.5%) | 17 (14.5%) |
| $25,000 to $29,999 | 0 (0.0%) | 9 (7.7%) |
| $30,000 to $34,999 | 14 (10.6%) | 9 (7.7%) |
| $35,000 to $39,999 | 6 (4.5%) | 3 (2.6%) |
| $40,000 to $44,999 | 3 (2.3%) | 7 (6.0%) |
| $45,000 to $49,999 | 4 (3.0%) | 6 (5.1%) |
| $50,000 to $54,999 | 7 (5.3%) | 4 (3.4%) |
| $55,000 to $64,999 | 20 (15.1%) | 1 (0.9%) |
| $65,000 to $74,999 | 15 (11.4%) | 11 (9.4%) |
| $75,000 to $99,999 | 8 (6.1%) | 7 (6.0%) |
| $100,000+ | 19 (14.4%) | 5 (4.3%) |
| Total | 132 (100.0%) | 117 (100.0%) |
Earnings by Sex by Educational Attainment in Oak Valley
Average earnings in Oak Valley are $59,167 for men and $27,222 for women, a difference of 54.0%. Men with an educational attainment of less than high school enjoy the highest average annual earnings of $110,536, while those with high school diploma education earn the least with $53,750. Women with an educational attainment of graduate degree earn the most with the average annual earnings of $74,063, while those with high school diploma education have the smallest earnings of $19,167.
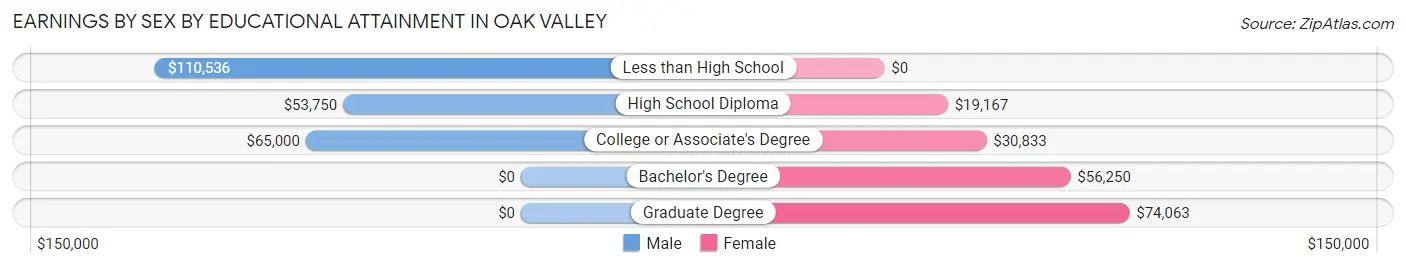
| Educational Attainment | Male Income | Female Income |
| Less than High School | $110,536 | $0 |
| High School Diploma | $53,750 | $19,167 |
| College or Associate's Degree | $65,000 | $30,833 |
| Bachelor's Degree | - | - |
| Graduate Degree | - | - |
| Total | $59,167 | $27,222 |
Family Income in Oak Valley
Family Income Brackets in Oak Valley
According to the Oak Valley family income data, there are 37 families falling into the $100,000 to $149,999 income range, which is the most common income bracket and makes up 26.2% of all families.
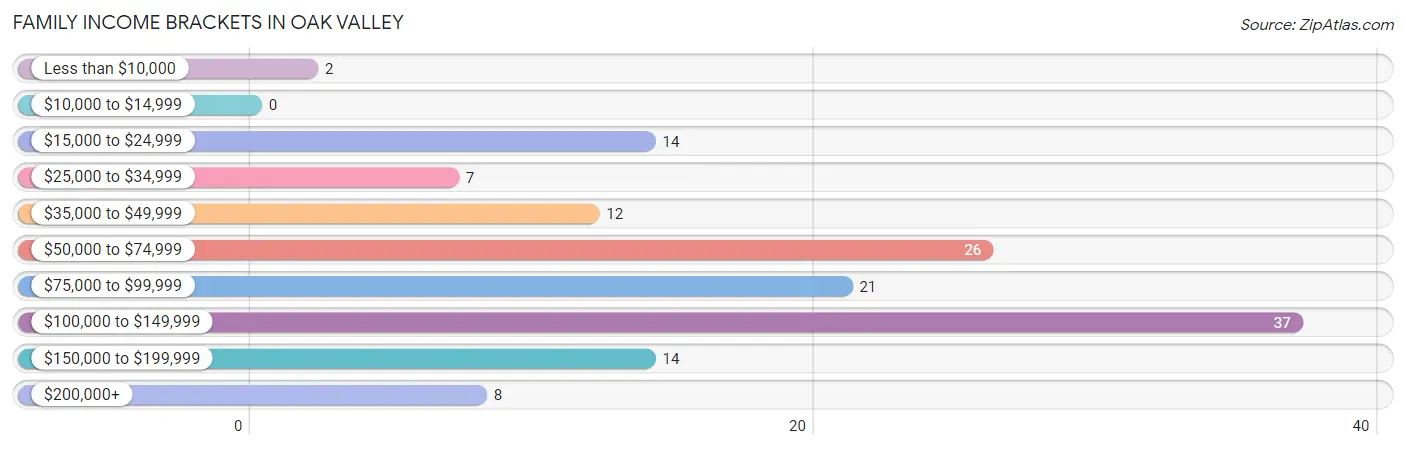
| Income Bracket | # Families | % Families |
| Less than $10,000 | 2 | 1.4% |
| $10,000 to $14,999 | 0 | 0.0% |
| $15,000 to $24,999 | 14 | 9.9% |
| $25,000 to $34,999 | 7 | 5.0% |
| $35,000 to $49,999 | 12 | 8.5% |
| $50,000 to $74,999 | 26 | 18.4% |
| $75,000 to $99,999 | 21 | 14.9% |
| $100,000 to $149,999 | 37 | 26.2% |
| $150,000 to $199,999 | 14 | 9.9% |
| $200,000+ | 8 | 5.7% |
Family Income by Famaliy Size in Oak Valley
5-person families (13 | 9.2%) account for the highest median family income in Oak Valley with $158,125 per family, while 4-person families (18 | 12.8%) have the highest median income of $34,822 per family member.
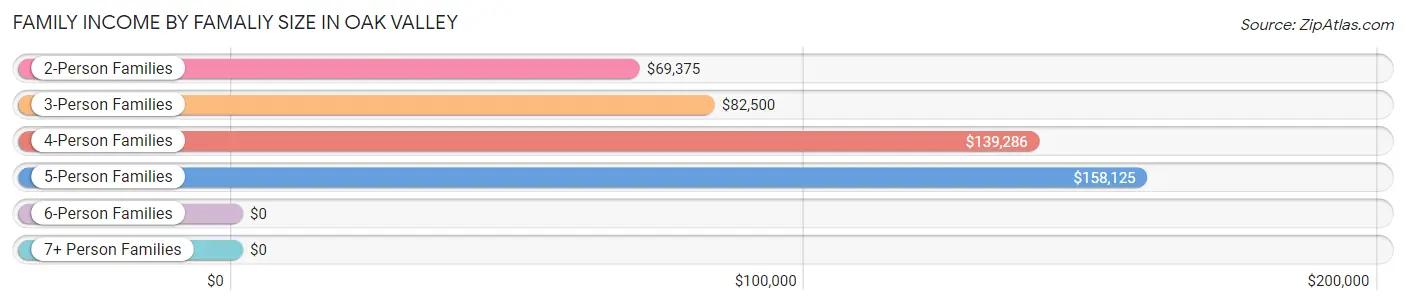
| Income Bracket | # Families | Median Income |
| 2-Person Families | 79 (56.0%) | $69,375 |
| 3-Person Families | 28 (19.9%) | $82,500 |
| 4-Person Families | 18 (12.8%) | $139,286 |
| 5-Person Families | 13 (9.2%) | $158,125 |
| 6-Person Families | 2 (1.4%) | $0 |
| 7+ Person Families | 1 (0.7%) | $0 |
| Total | 141 (100.0%) | $81,875 |
Family Income by Number of Earners in Oak Valley
The median family income in Oak Valley is $81,875, with families comprising 3+ earners (17) having the highest median family income of $175,625, while families with no earners (35) have the lowest median family income of $45,313, accounting for 12.1% and 24.8% of families, respectively.
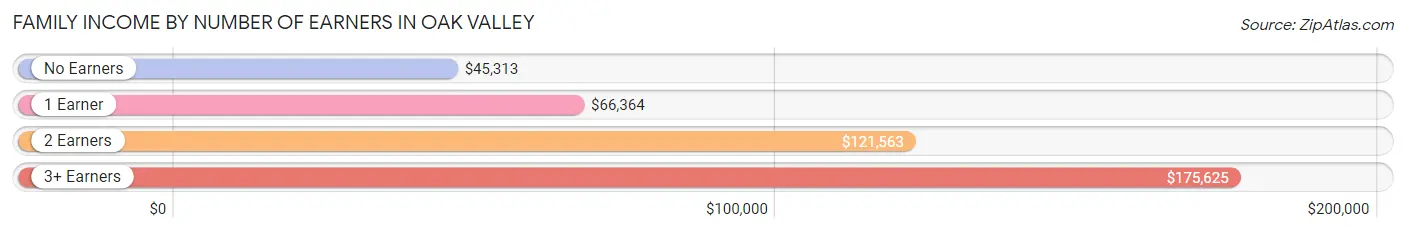
| Number of Earners | # Families | Median Income |
| No Earners | 35 (24.8%) | $45,313 |
| 1 Earner | 36 (25.5%) | $66,364 |
| 2 Earners | 53 (37.6%) | $121,563 |
| 3+ Earners | 17 (12.1%) | $175,625 |
| Total | 141 (100.0%) | $81,875 |
Household Income in Oak Valley
Household Income Brackets in Oak Valley
With 42 households falling in the category, the $100,000 to $149,999 income range is the most frequent in Oak Valley, accounting for 23.6% of all households. In contrast, only 2 households (1.1%) fall into the less than $10,000 income bracket, making it the least populous group.
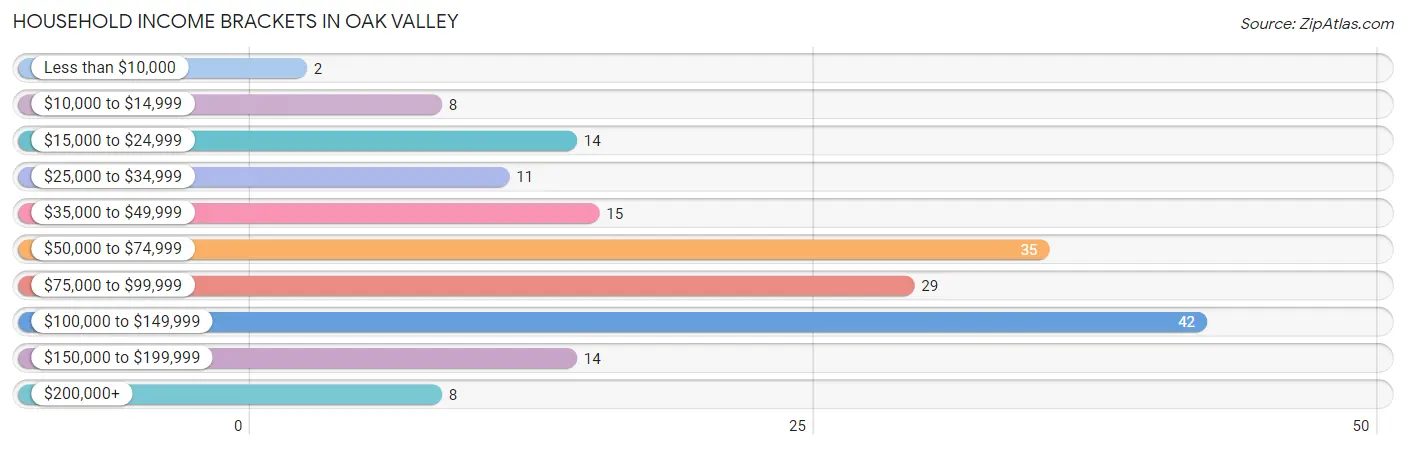
| Income Bracket | # Households | % Households |
| Less than $10,000 | 2 | 1.1% |
| $10,000 to $14,999 | 8 | 4.5% |
| $15,000 to $24,999 | 14 | 7.9% |
| $25,000 to $34,999 | 11 | 6.2% |
| $35,000 to $49,999 | 15 | 8.4% |
| $50,000 to $74,999 | 35 | 19.7% |
| $75,000 to $99,999 | 29 | 16.3% |
| $100,000 to $149,999 | 42 | 23.6% |
| $150,000 to $199,999 | 14 | 7.9% |
| $200,000+ | 8 | 4.5% |
Household Income by Householder Age in Oak Valley
The median household income in Oak Valley is $77,000, with the highest median household income of $121,042 found in the 25 to 44 years age bracket for the primary householder. A total of 37 households (20.8%) fall into this category. Meanwhile, the 15 to 24 years age bracket for the primary householder has the lowest median household income of $0, with 5 households (2.8%) in this group.
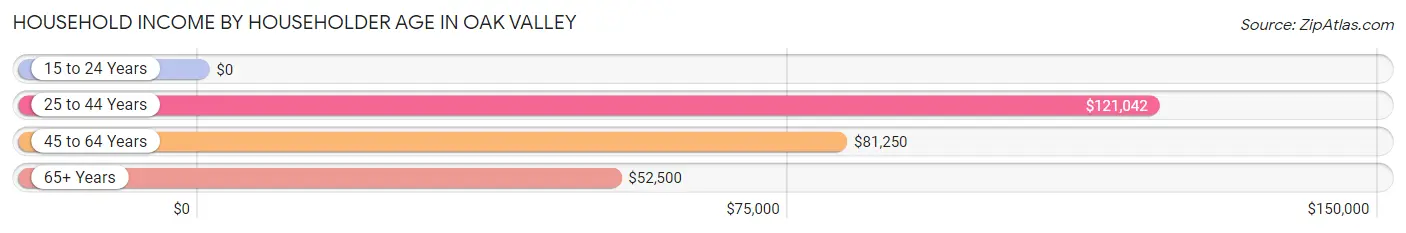
| Income Bracket | # Households | Median Income |
| 15 to 24 Years | 5 (2.8%) | $0 |
| 25 to 44 Years | 37 (20.8%) | $121,042 |
| 45 to 64 Years | 72 (40.5%) | $81,250 |
| 65+ Years | 64 (36.0%) | $52,500 |
| Total | 178 (100.0%) | $77,000 |
Poverty in Oak Valley
Income Below Poverty by Sex and Age in Oak Valley
With 5.1% poverty level for males and 11.7% for females among the residents of Oak Valley, 16 and 17 year old males and 75 year old and over females are the most vulnerable to poverty, with 3 males (33.3%) and 8 females (34.8%) in their respective age groups living below the poverty level.
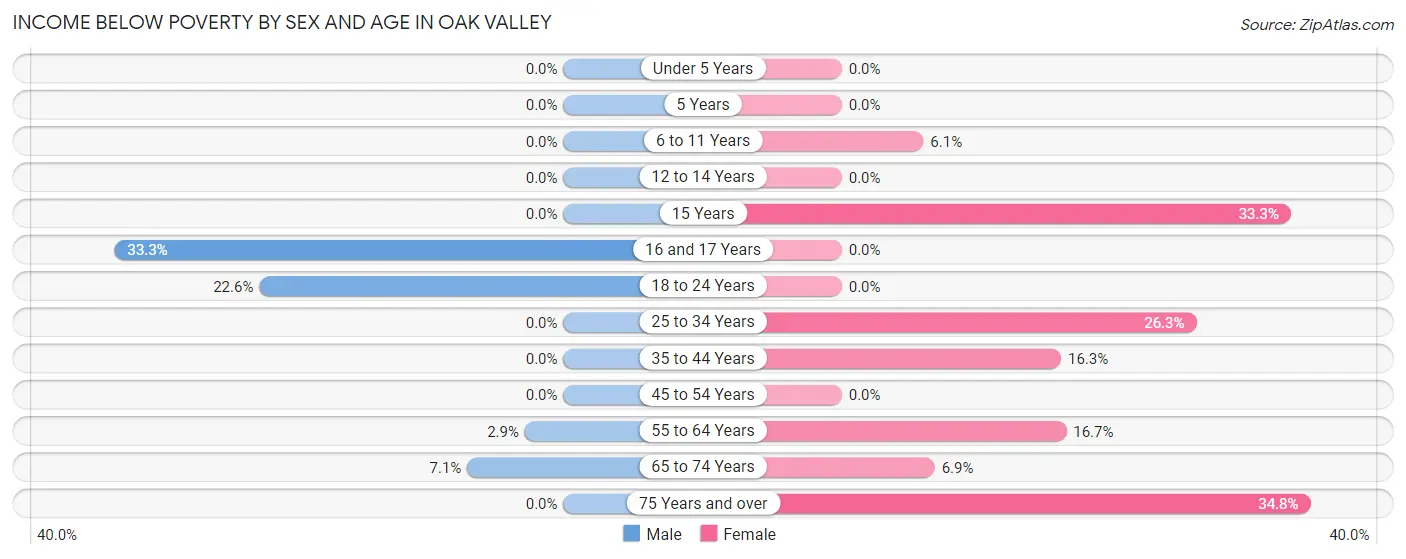
| Age Bracket | Male | Female |
| Under 5 Years | 0 (0.0%) | 0 (0.0%) |
| 5 Years | 0 (0.0%) | 0 (0.0%) |
| 6 to 11 Years | 0 (0.0%) | 2 (6.1%) |
| 12 to 14 Years | 0 (0.0%) | 0 (0.0%) |
| 15 Years | 0 (0.0%) | 1 (33.3%) |
| 16 and 17 Years | 3 (33.3%) | 0 (0.0%) |
| 18 to 24 Years | 7 (22.6%) | 0 (0.0%) |
| 25 to 34 Years | 0 (0.0%) | 5 (26.3%) |
| 35 to 44 Years | 0 (0.0%) | 7 (16.3%) |
| 45 to 54 Years | 0 (0.0%) | 0 (0.0%) |
| 55 to 64 Years | 1 (2.9%) | 4 (16.7%) |
| 65 to 74 Years | 2 (7.1%) | 2 (6.9%) |
| 75 Years and over | 0 (0.0%) | 8 (34.8%) |
| Total | 13 (5.1%) | 29 (11.7%) |
Income Above Poverty by Sex and Age in Oak Valley
According to the poverty statistics in Oak Valley, males aged under 5 years and females aged under 5 years are the age groups that are most secure financially, with 100.0% of males and 100.0% of females in these age groups living above the poverty line.
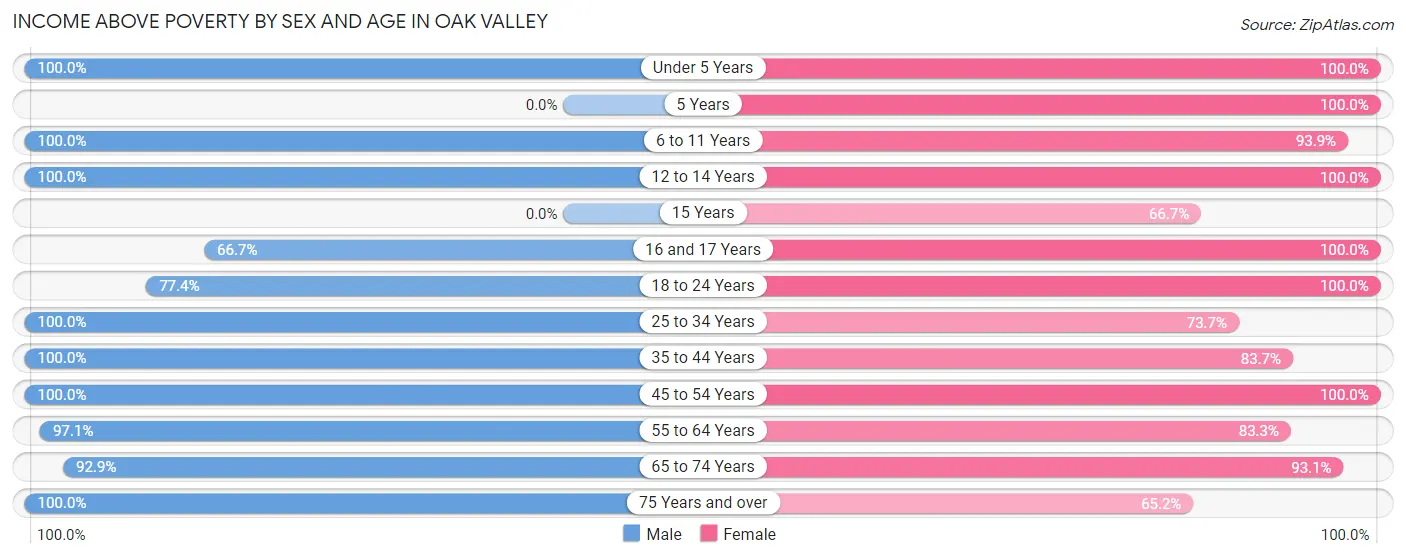
| Age Bracket | Male | Female |
| Under 5 Years | 19 (100.0%) | 2 (100.0%) |
| 5 Years | 0 (0.0%) | 4 (100.0%) |
| 6 to 11 Years | 7 (100.0%) | 31 (93.9%) |
| 12 to 14 Years | 2 (100.0%) | 20 (100.0%) |
| 15 Years | 0 (0.0%) | 2 (66.7%) |
| 16 and 17 Years | 6 (66.7%) | 7 (100.0%) |
| 18 to 24 Years | 24 (77.4%) | 12 (100.0%) |
| 25 to 34 Years | 28 (100.0%) | 14 (73.7%) |
| 35 to 44 Years | 26 (100.0%) | 36 (83.7%) |
| 45 to 54 Years | 38 (100.0%) | 28 (100.0%) |
| 55 to 64 Years | 34 (97.1%) | 20 (83.3%) |
| 65 to 74 Years | 26 (92.9%) | 27 (93.1%) |
| 75 Years and over | 30 (100.0%) | 15 (65.2%) |
| Total | 240 (94.9%) | 218 (88.3%) |
Income Below Poverty Among Married-Couple Families in Oak Valley
The poverty statistics for married-couple families in Oak Valley show that 1.8% or 2 of the total 114 families live below the poverty line. Families with no children have the highest poverty rate of 2.9%, comprising of 2 families. On the other hand, families with 1 or 2 children have the lowest poverty rate of 0.0%, which includes 0 families.
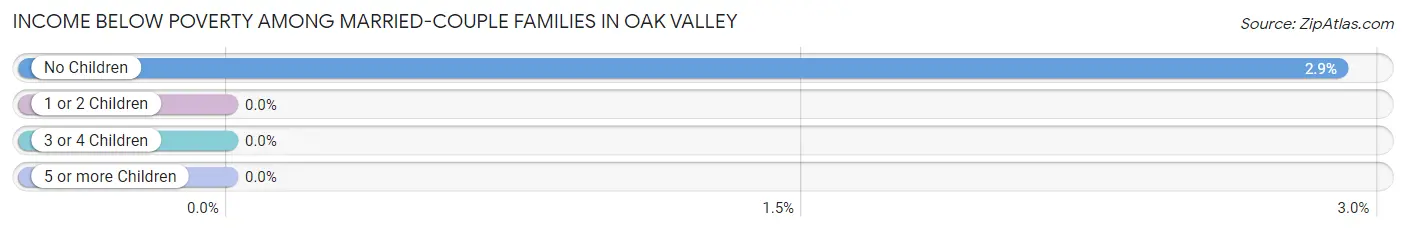
| Children | Above Poverty | Below Poverty |
| No Children | 67 (97.1%) | 2 (2.9%) |
| 1 or 2 Children | 36 (100.0%) | 0 (0.0%) |
| 3 or 4 Children | 8 (100.0%) | 0 (0.0%) |
| 5 or more Children | 1 (100.0%) | 0 (0.0%) |
| Total | 112 (98.3%) | 2 (1.8%) |
Income Below Poverty Among Single-Parent Households in Oak Valley
According to the poverty data in Oak Valley, 6.7% or 1 single-father households and 58.3% or 7 single-mother households are living below the poverty line. Among single-father households, those with no children have the highest poverty rate, with 1 households (6.7%) experiencing poverty. Likewise, among single-mother households, those with no children have the highest poverty rate, with 4 households (100.0%) falling below the poverty line.
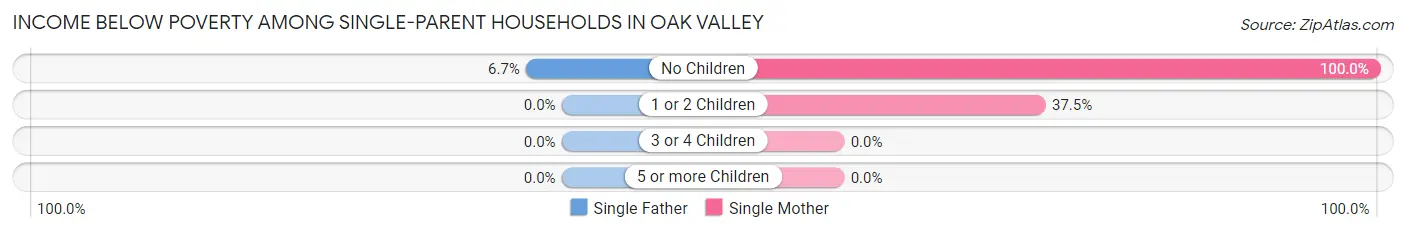
| Children | Single Father | Single Mother |
| No Children | 1 (6.7%) | 4 (100.0%) |
| 1 or 2 Children | 0 (0.0%) | 3 (37.5%) |
| 3 or 4 Children | 0 (0.0%) | 0 (0.0%) |
| 5 or more Children | 0 (0.0%) | 0 (0.0%) |
| Total | 1 (6.7%) | 7 (58.3%) |
Income Below Poverty Among Married-Couple vs Single-Parent Households in Oak Valley
The poverty data for Oak Valley shows that 2 of the married-couple family households (1.8%) and 8 of the single-parent households (29.6%) are living below the poverty level. Within the married-couple family households, those with no children have the highest poverty rate, with 2 households (2.9%) falling below the poverty line. Among the single-parent households, those with 1 or 2 children have the highest poverty rate, with 3 household (37.5%) living below poverty.
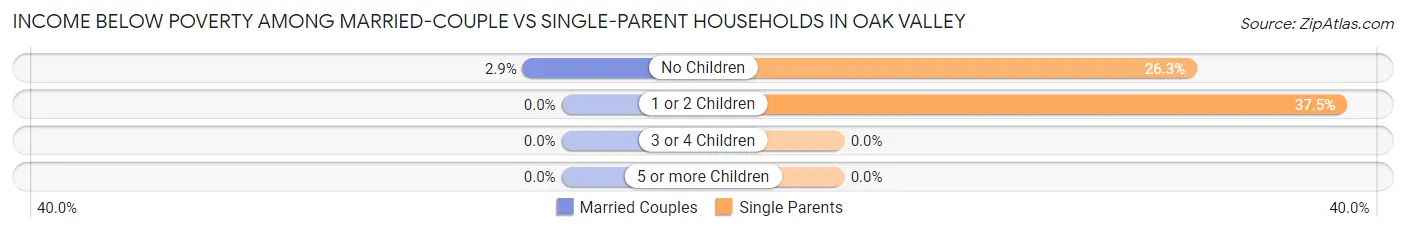
| Children | Married-Couple Families | Single-Parent Households |
| No Children | 2 (2.9%) | 5 (26.3%) |
| 1 or 2 Children | 0 (0.0%) | 3 (37.5%) |
| 3 or 4 Children | 0 (0.0%) | 0 (0.0%) |
| 5 or more Children | 0 (0.0%) | 0 (0.0%) |
| Total | 2 (1.8%) | 8 (29.6%) |
Employment Characteristics in Oak Valley
Employment by Class of Employer in Oak Valley
Among the 210 employed individuals in Oak Valley, private company employees (124 | 59.1%), not-for-profit organizations (25 | 11.9%), and local government employees (16 | 7.6%) make up the most common classes of employment.
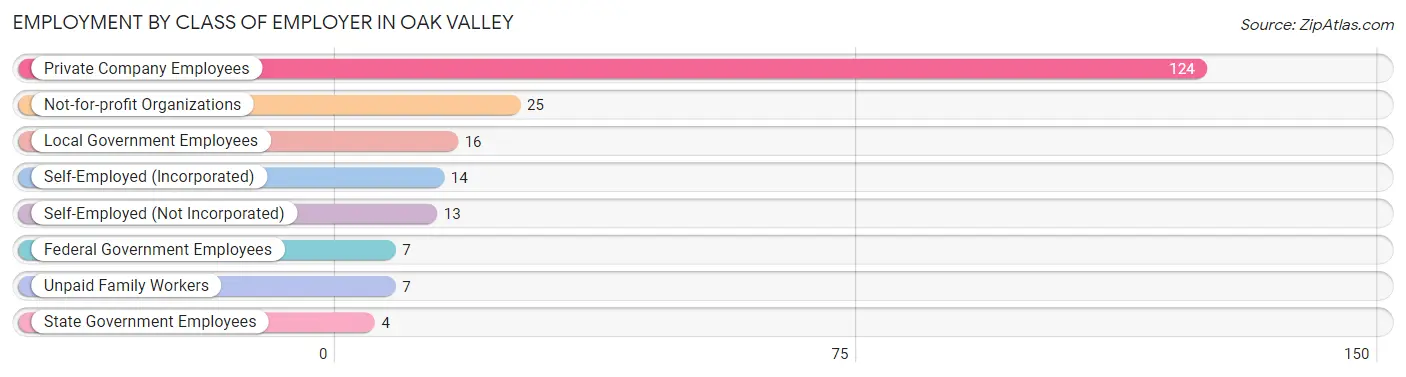
| Employer Class | # Employees | % Employees |
| Private Company Employees | 124 | 59.1% |
| Self-Employed (Incorporated) | 14 | 6.7% |
| Self-Employed (Not Incorporated) | 13 | 6.2% |
| Not-for-profit Organizations | 25 | 11.9% |
| Local Government Employees | 16 | 7.6% |
| State Government Employees | 4 | 1.9% |
| Federal Government Employees | 7 | 3.3% |
| Unpaid Family Workers | 7 | 3.3% |
| Total | 210 | 100.0% |
Employment Status by Age in Oak Valley
According to the labor force statistics for Oak Valley, out of the total population over 16 years of age (410), 56.8% or 233 individuals are in the labor force, with 8.6% or 20 of them unemployed. The age group with the highest labor force participation rate is 45 to 54 years, with 80.3% or 53 individuals in the labor force. Within the labor force, the 55 to 59 years age range has the highest percentage of unemployed individuals, with 25.0% or 3 of them being unemployed.
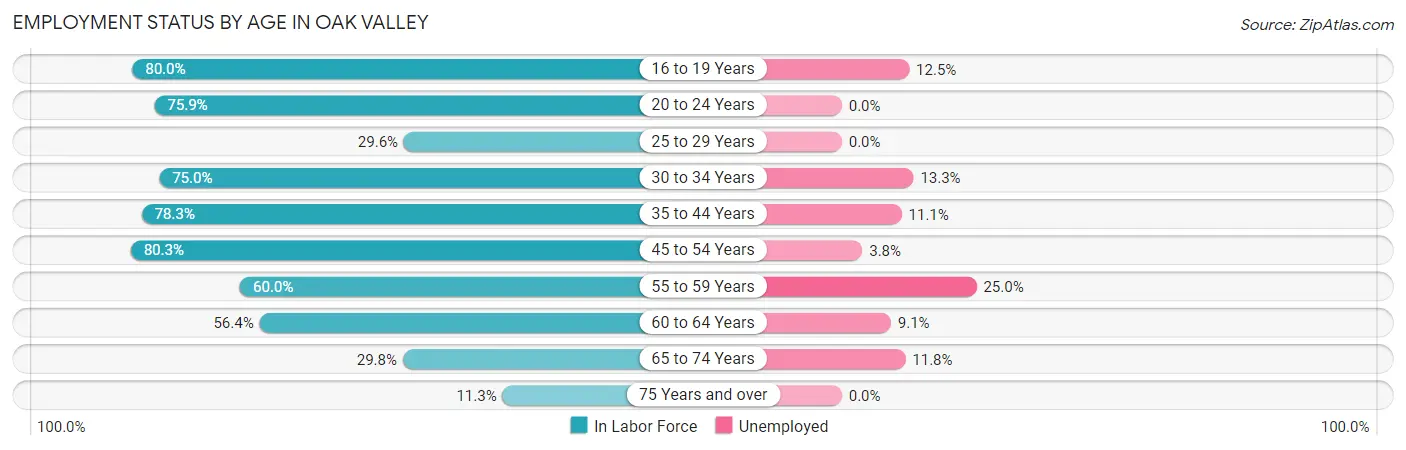
| Age Bracket | In Labor Force | Unemployed |
| 16 to 19 Years | 24 (80.0%) | 3 (12.5%) |
| 20 to 24 Years | 22 (75.9%) | 0 (0.0%) |
| 25 to 29 Years | 8 (29.6%) | 0 (0.0%) |
| 30 to 34 Years | 15 (75.0%) | 2 (13.3%) |
| 35 to 44 Years | 54 (78.3%) | 6 (11.1%) |
| 45 to 54 Years | 53 (80.3%) | 2 (3.8%) |
| 55 to 59 Years | 12 (60.0%) | 3 (25.0%) |
| 60 to 64 Years | 22 (56.4%) | 2 (9.1%) |
| 65 to 74 Years | 17 (29.8%) | 2 (11.8%) |
| 75 Years and over | 6 (11.3%) | 0 (0.0%) |
| Total | 233 (56.8%) | 20 (8.6%) |
Employment Status by Educational Attainment in Oak Valley
According to labor force statistics for Oak Valley, 68.0% of individuals (164) out of the total population between 25 and 64 years of age (241) are in the labor force, with 9.1% or 15 of them being unemployed. The group with the highest labor force participation rate are those with the educational attainment of bachelor's degree or higher, with 75.6% or 31 individuals in the labor force. Within the labor force, individuals with high school diploma education have the highest percentage of unemployment, with 15.4% or 6 of them being unemployed.
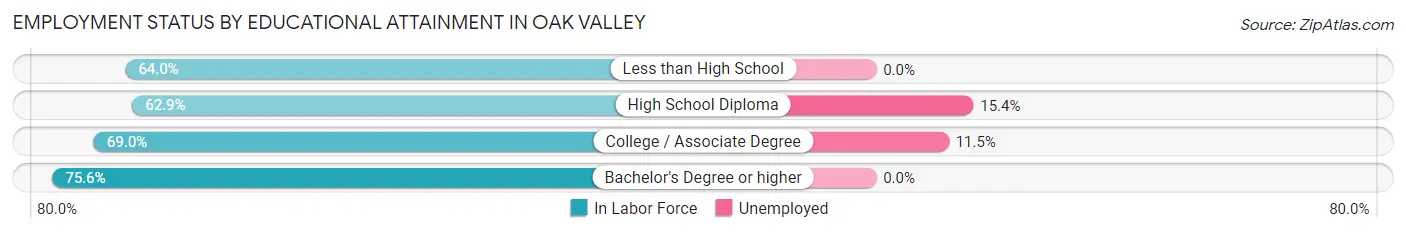
| Educational Attainment | In Labor Force | Unemployed |
| Less than High School | 16 (64.0%) | 0 (0.0%) |
| High School Diploma | 39 (62.9%) | 10 (15.4%) |
| College / Associate Degree | 78 (69.0%) | 13 (11.5%) |
| Bachelor's Degree or higher | 31 (75.6%) | 0 (0.0%) |
| Total | 164 (68.0%) | 22 (9.1%) |
Employment Occupations by Sex in Oak Valley
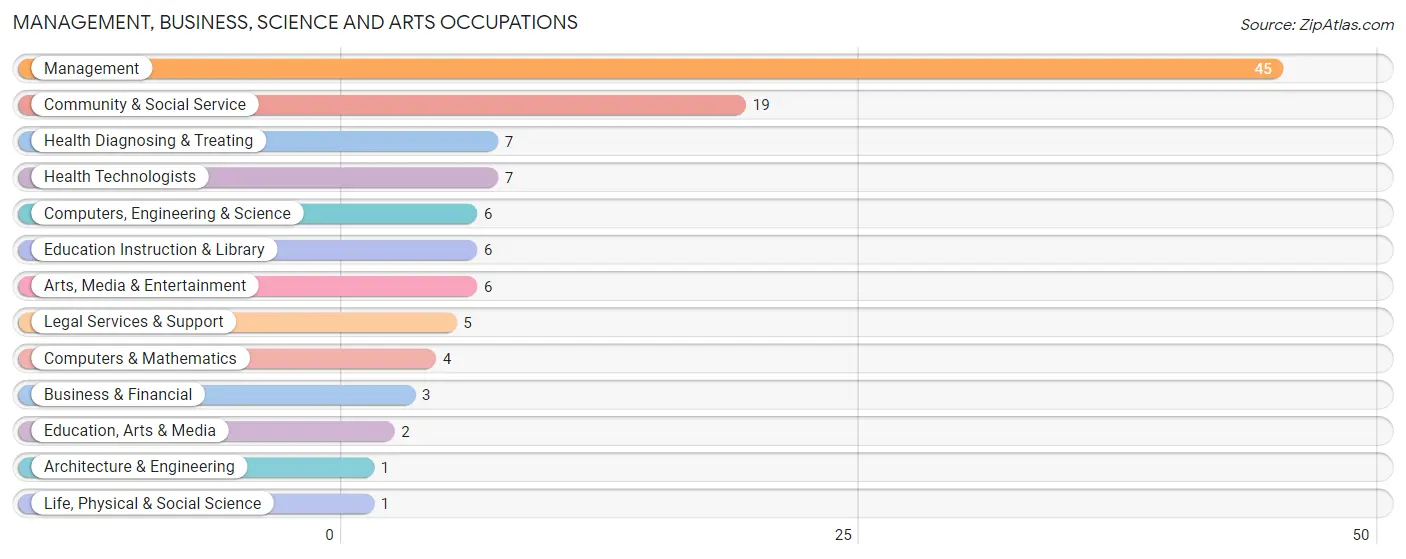
Management, Business, Science and Arts Occupations
The most common Management, Business, Science and Arts occupations in Oak Valley are Management (45 | 21.1%), Community & Social Service (19 | 8.9%), Health Diagnosing & Treating (7 | 3.3%), Health Technologists (7 | 3.3%), and Computers, Engineering & Science (6 | 2.8%).
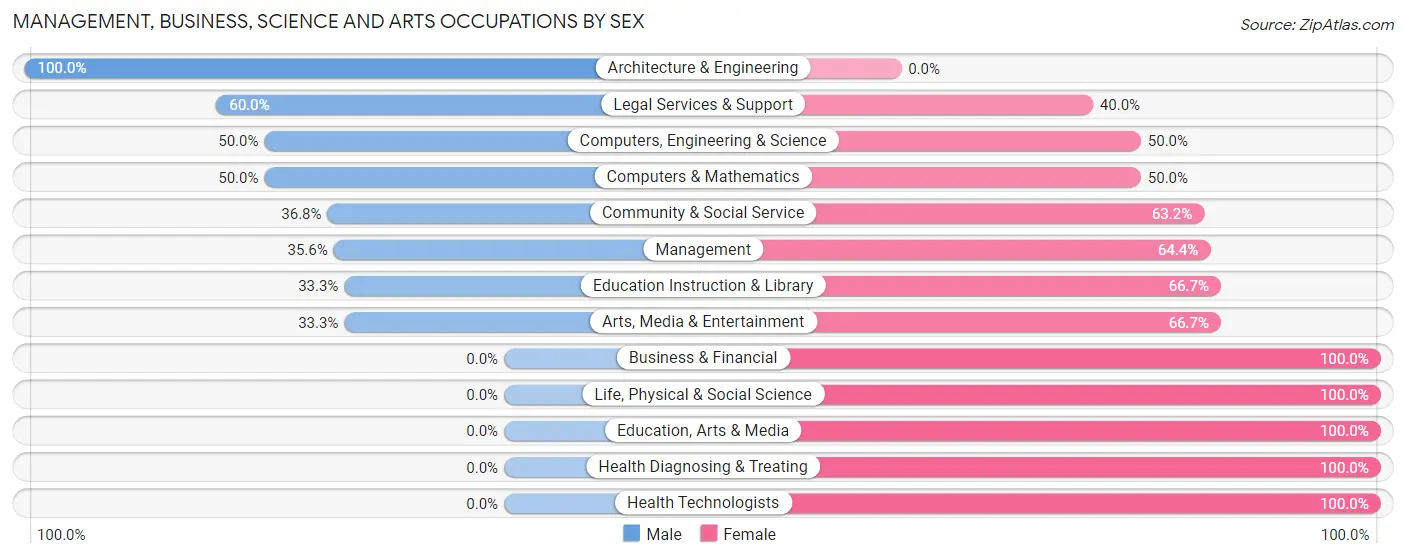
Management, Business, Science and Arts Occupations by Sex
Within the Management, Business, Science and Arts occupations in Oak Valley, the most male-oriented occupations are Architecture & Engineering (100.0%), Legal Services & Support (60.0%), and Computers, Engineering & Science (50.0%), while the most female-oriented occupations are Business & Financial (100.0%), Life, Physical & Social Science (100.0%), and Education, Arts & Media (100.0%).
| Occupation | Male | Female |
| Management | 16 (35.6%) | 29 (64.4%) |
| Business & Financial | 0 (0.0%) | 3 (100.0%) |
| Computers, Engineering & Science | 3 (50.0%) | 3 (50.0%) |
| Computers & Mathematics | 2 (50.0%) | 2 (50.0%) |
| Architecture & Engineering | 1 (100.0%) | 0 (0.0%) |
| Life, Physical & Social Science | 0 (0.0%) | 1 (100.0%) |
| Community & Social Service | 7 (36.8%) | 12 (63.2%) |
| Education, Arts & Media | 0 (0.0%) | 2 (100.0%) |
| Legal Services & Support | 3 (60.0%) | 2 (40.0%) |
| Education Instruction & Library | 2 (33.3%) | 4 (66.7%) |
| Arts, Media & Entertainment | 2 (33.3%) | 4 (66.7%) |
| Health Diagnosing & Treating | 0 (0.0%) | 7 (100.0%) |
| Health Technologists | 0 (0.0%) | 7 (100.0%) |
| Total (Category) | 26 (32.5%) | 54 (67.5%) |
| Total (Overall) | 111 (52.1%) | 102 (47.9%) |
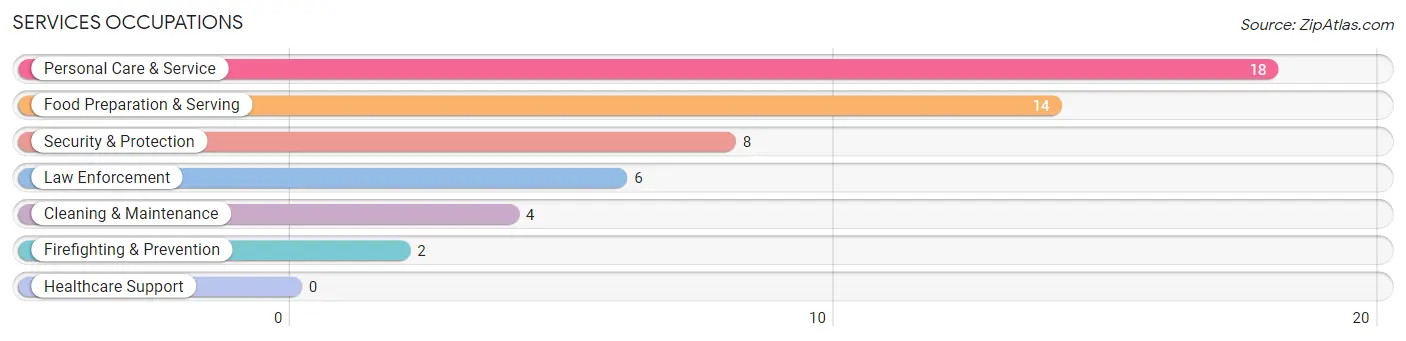
Services Occupations
The most common Services occupations in Oak Valley are Personal Care & Service (18 | 8.5%), Food Preparation & Serving (14 | 6.6%), Security & Protection (8 | 3.8%), Law Enforcement (6 | 2.8%), and Cleaning & Maintenance (4 | 1.9%).
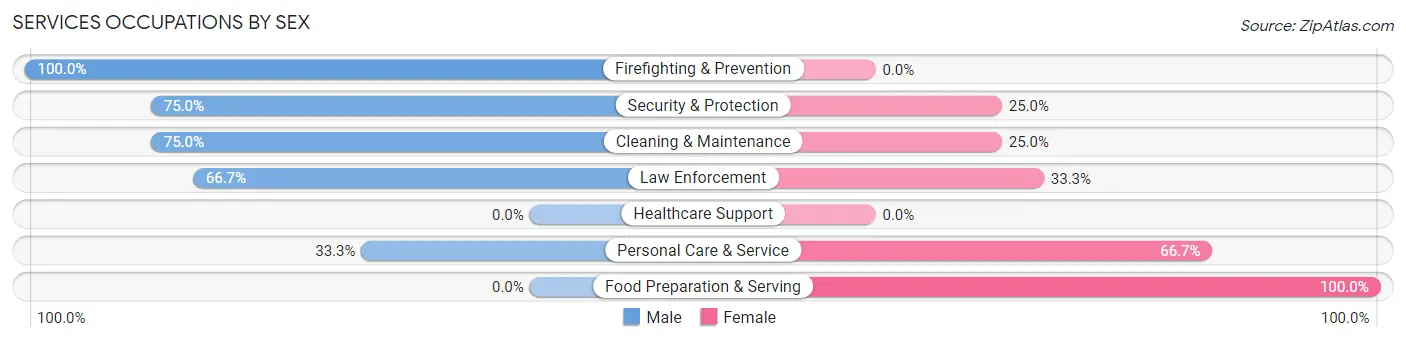
Services Occupations by Sex
Within the Services occupations in Oak Valley, the most male-oriented occupations are Firefighting & Prevention (100.0%), Security & Protection (75.0%), and Cleaning & Maintenance (75.0%), while the most female-oriented occupations are Food Preparation & Serving (100.0%), Personal Care & Service (66.7%), and Law Enforcement (33.3%).
| Occupation | Male | Female |
| Healthcare Support | 0 (0.0%) | 0 (0.0%) |
| Security & Protection | 6 (75.0%) | 2 (25.0%) |
| Firefighting & Prevention | 2 (100.0%) | 0 (0.0%) |
| Law Enforcement | 4 (66.7%) | 2 (33.3%) |
| Food Preparation & Serving | 0 (0.0%) | 14 (100.0%) |
| Cleaning & Maintenance | 3 (75.0%) | 1 (25.0%) |
| Personal Care & Service | 6 (33.3%) | 12 (66.7%) |
| Total (Category) | 15 (34.1%) | 29 (65.9%) |
| Total (Overall) | 111 (52.1%) | 102 (47.9%) |
Sales and Office Occupations
The most common Sales and Office occupations in Oak Valley are Sales & Related (26 | 12.2%), and Office & Administration (18 | 8.5%).

Sales and Office Occupations by Sex
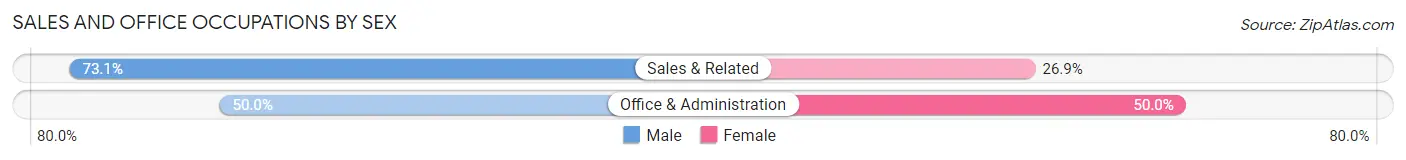
| Occupation | Male | Female |
| Sales & Related | 19 (73.1%) | 7 (26.9%) |
| Office & Administration | 9 (50.0%) | 9 (50.0%) |
| Total (Category) | 28 (63.6%) | 16 (36.4%) |
| Total (Overall) | 111 (52.1%) | 102 (47.9%) |
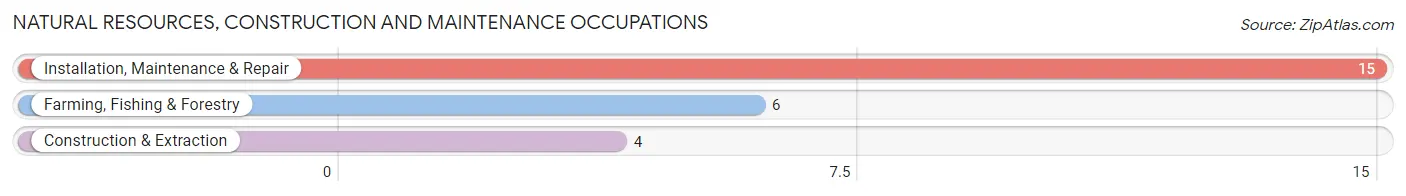
Natural Resources, Construction and Maintenance Occupations
The most common Natural Resources, Construction and Maintenance occupations in Oak Valley are Installation, Maintenance & Repair (15 | 7.0%), Farming, Fishing & Forestry (6 | 2.8%), and Construction & Extraction (4 | 1.9%).
Natural Resources, Construction and Maintenance Occupations by Sex
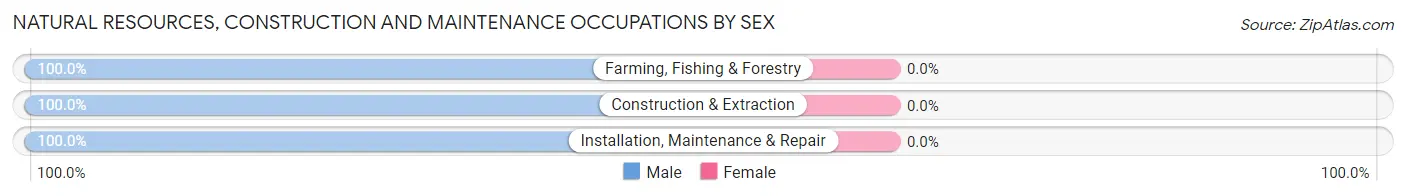
| Occupation | Male | Female |
| Farming, Fishing & Forestry | 6 (100.0%) | 0 (0.0%) |
| Construction & Extraction | 4 (100.0%) | 0 (0.0%) |
| Installation, Maintenance & Repair | 15 (100.0%) | 0 (0.0%) |
| Total (Category) | 25 (100.0%) | 0 (0.0%) |
| Total (Overall) | 111 (52.1%) | 102 (47.9%) |
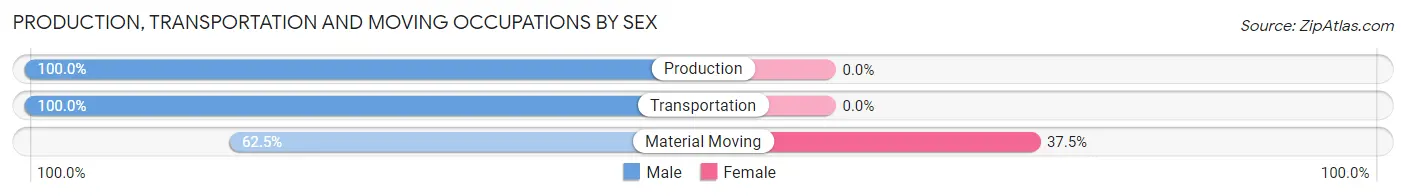
Production, Transportation and Moving Occupations
The most common Production, Transportation and Moving occupations in Oak Valley are Material Moving (8 | 3.8%), Production (7 | 3.3%), and Transportation (5 | 2.4%).
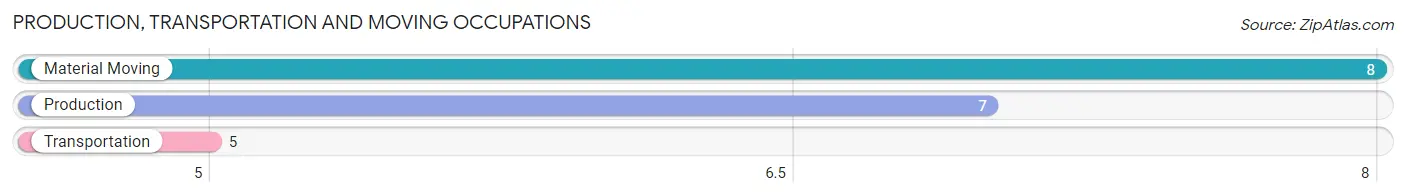
Production, Transportation and Moving Occupations by Sex
| Occupation | Male | Female |
| Production | 7 (100.0%) | 0 (0.0%) |
| Transportation | 5 (100.0%) | 0 (0.0%) |
| Material Moving | 5 (62.5%) | 3 (37.5%) |
| Total (Category) | 17 (85.0%) | 3 (15.0%) |
| Total (Overall) | 111 (52.1%) | 102 (47.9%) |
Employment Industries by Sex in Oak Valley
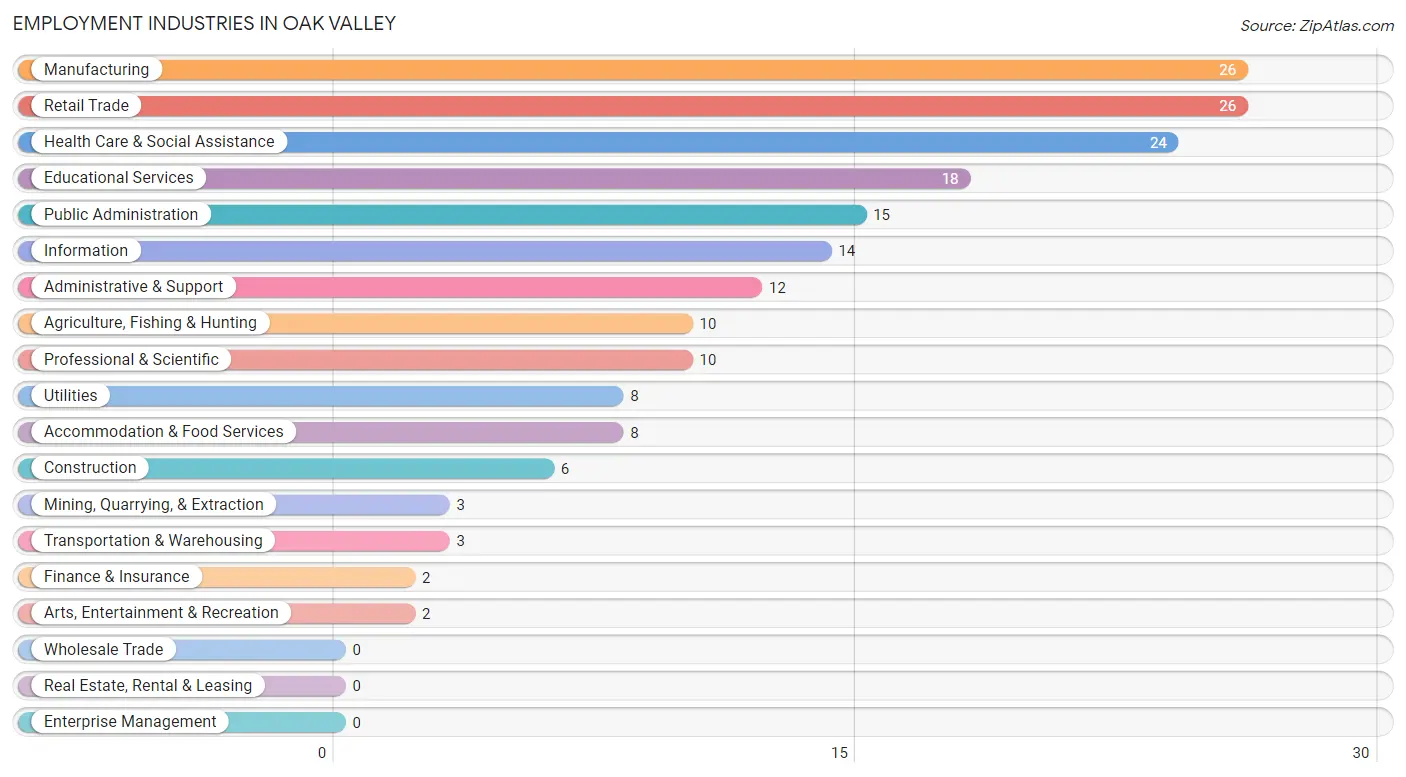
Employment Industries in Oak Valley
The major employment industries in Oak Valley include Manufacturing (26 | 12.2%), Retail Trade (26 | 12.2%), Health Care & Social Assistance (24 | 11.3%), Educational Services (18 | 8.5%), and Public Administration (15 | 7.0%).
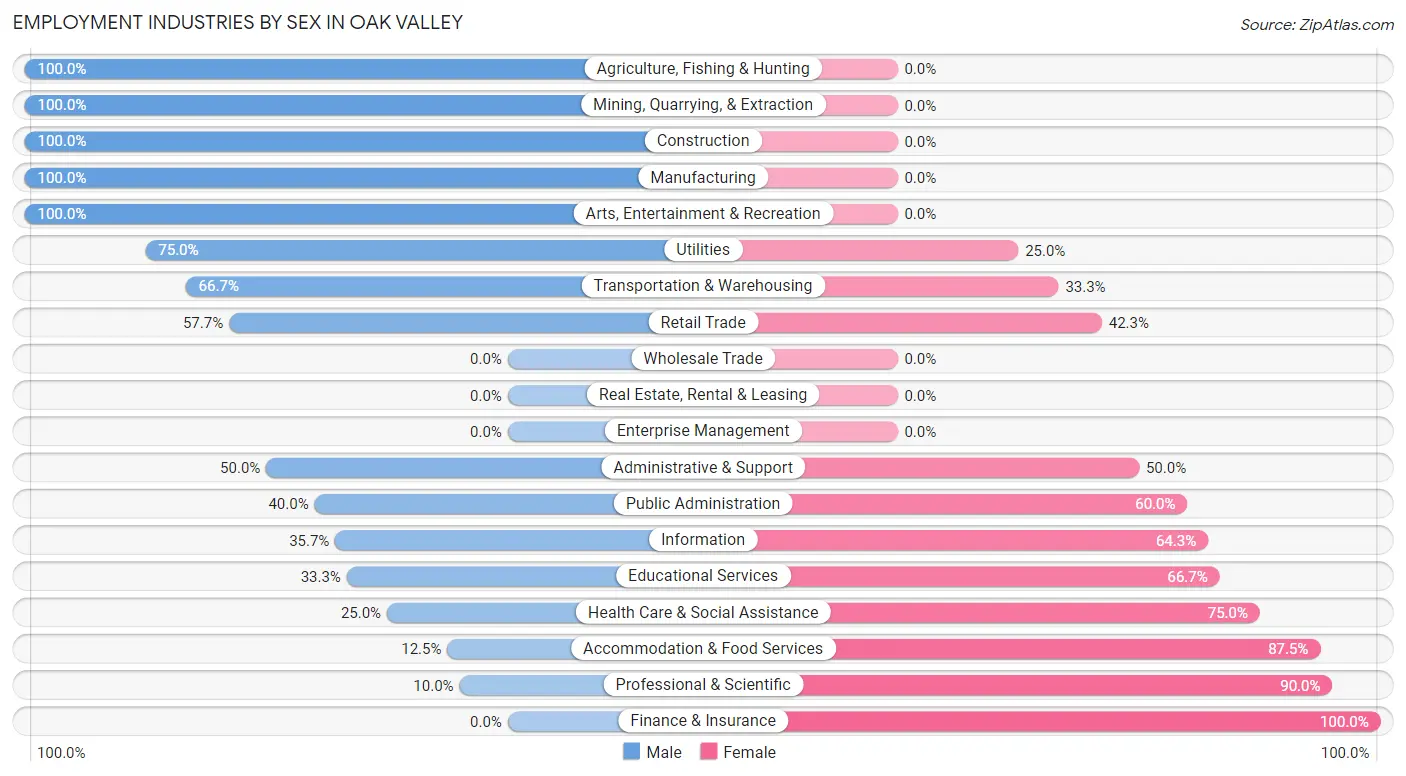
Employment Industries by Sex in Oak Valley
The Oak Valley industries that see more men than women are Agriculture, Fishing & Hunting (100.0%), Mining, Quarrying, & Extraction (100.0%), and Construction (100.0%), whereas the industries that tend to have a higher number of women are Finance & Insurance (100.0%), Professional & Scientific (90.0%), and Accommodation & Food Services (87.5%).
| Industry | Male | Female |
| Agriculture, Fishing & Hunting | 10 (100.0%) | 0 (0.0%) |
| Mining, Quarrying, & Extraction | 3 (100.0%) | 0 (0.0%) |
| Construction | 6 (100.0%) | 0 (0.0%) |
| Manufacturing | 26 (100.0%) | 0 (0.0%) |
| Wholesale Trade | 0 (0.0%) | 0 (0.0%) |
| Retail Trade | 15 (57.7%) | 11 (42.3%) |
| Transportation & Warehousing | 2 (66.7%) | 1 (33.3%) |
| Utilities | 6 (75.0%) | 2 (25.0%) |
| Information | 5 (35.7%) | 9 (64.3%) |
| Finance & Insurance | 0 (0.0%) | 2 (100.0%) |
| Real Estate, Rental & Leasing | 0 (0.0%) | 0 (0.0%) |
| Professional & Scientific | 1 (10.0%) | 9 (90.0%) |
| Enterprise Management | 0 (0.0%) | 0 (0.0%) |
| Administrative & Support | 6 (50.0%) | 6 (50.0%) |
| Educational Services | 6 (33.3%) | 12 (66.7%) |
| Health Care & Social Assistance | 6 (25.0%) | 18 (75.0%) |
| Arts, Entertainment & Recreation | 2 (100.0%) | 0 (0.0%) |
| Accommodation & Food Services | 1 (12.5%) | 7 (87.5%) |
| Public Administration | 6 (40.0%) | 9 (60.0%) |
| Total | 111 (52.1%) | 102 (47.9%) |
Education in Oak Valley
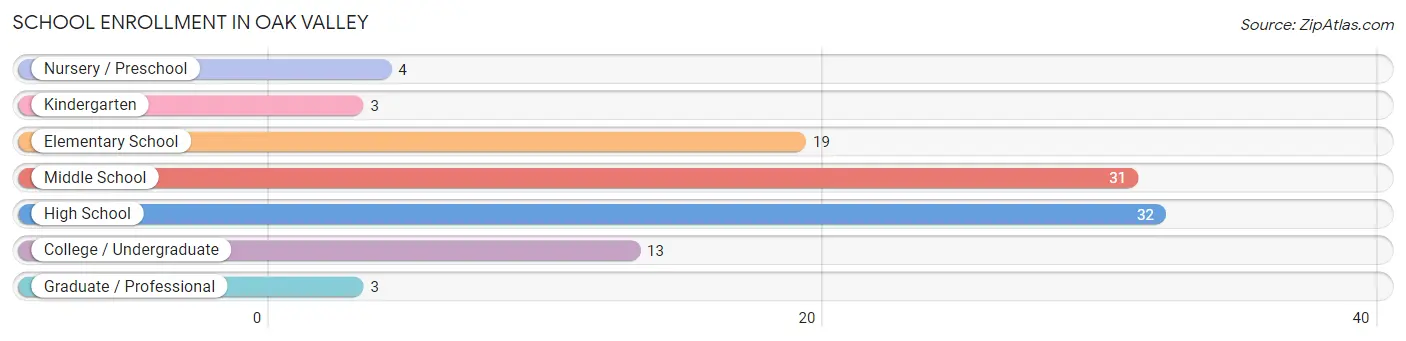
School Enrollment in Oak Valley
The most common levels of schooling among the 105 students in Oak Valley are high school (32 | 30.5%), middle school (31 | 29.5%), and elementary school (19 | 18.1%).
| School Level | # Students | % Students |
| Nursery / Preschool | 4 | 3.8% |
| Kindergarten | 3 | 2.9% |
| Elementary School | 19 | 18.1% |
| Middle School | 31 | 29.5% |
| High School | 32 | 30.5% |
| College / Undergraduate | 13 | 12.4% |
| Graduate / Professional | 3 | 2.9% |
| Total | 105 | 100.0% |
School Enrollment by Age by Funding Source in Oak Valley
Out of a total of 105 students who are enrolled in schools in Oak Valley, 22 (21.0%) attend a private institution, while the remaining 83 (79.0%) are enrolled in public schools. The age group of 3 to 4 year olds has the highest likelihood of being enrolled in private schools, with 4 (100.0% in the age bracket) enrolled. Conversely, the age group of 35 years and over has the lowest likelihood of being enrolled in a private school, with 3 (100.0% in the age bracket) attending a public institution.
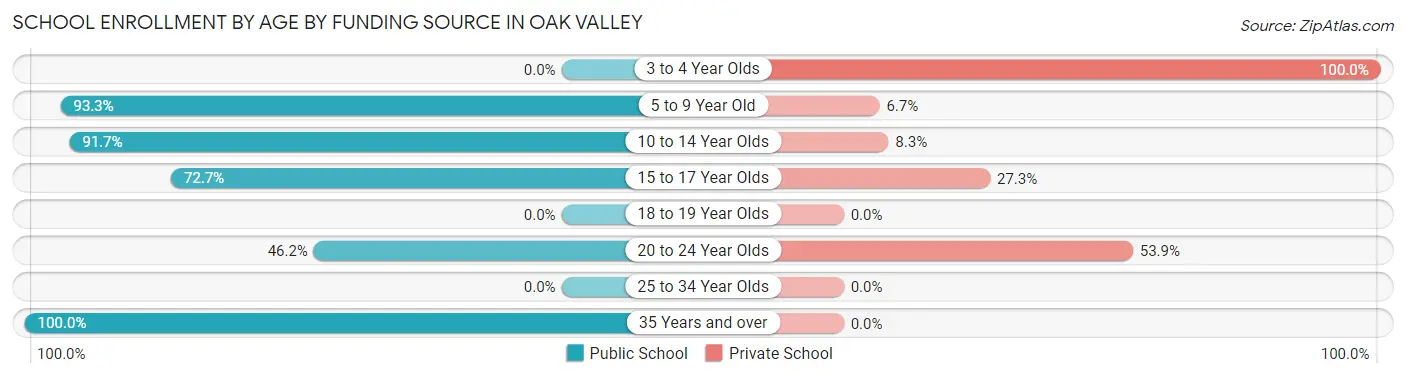
| Age Bracket | Public School | Private School |
| 3 to 4 Year Olds | 0 (0.0%) | 4 (100.0%) |
| 5 to 9 Year Old | 14 (93.3%) | 1 (6.7%) |
| 10 to 14 Year Olds | 44 (91.7%) | 4 (8.3%) |
| 15 to 17 Year Olds | 16 (72.7%) | 6 (27.3%) |
| 18 to 19 Year Olds | 0 (0.0%) | 0 (0.0%) |
| 20 to 24 Year Olds | 6 (46.2%) | 7 (53.8%) |
| 25 to 34 Year Olds | 0 (0.0%) | 0 (0.0%) |
| 35 Years and over | 3 (100.0%) | 0 (0.0%) |
| Total | 83 (79.0%) | 22 (21.0%) |
Educational Attainment by Field of Study in Oak Valley
Education (21 | 28.0%), social sciences (13 | 17.3%), science & technology (12 | 16.0%), arts & humanities (11 | 14.7%), and computers & mathematics (9 | 12.0%) are the most common fields of study among 75 individuals in Oak Valley who have obtained a bachelor's degree or higher.
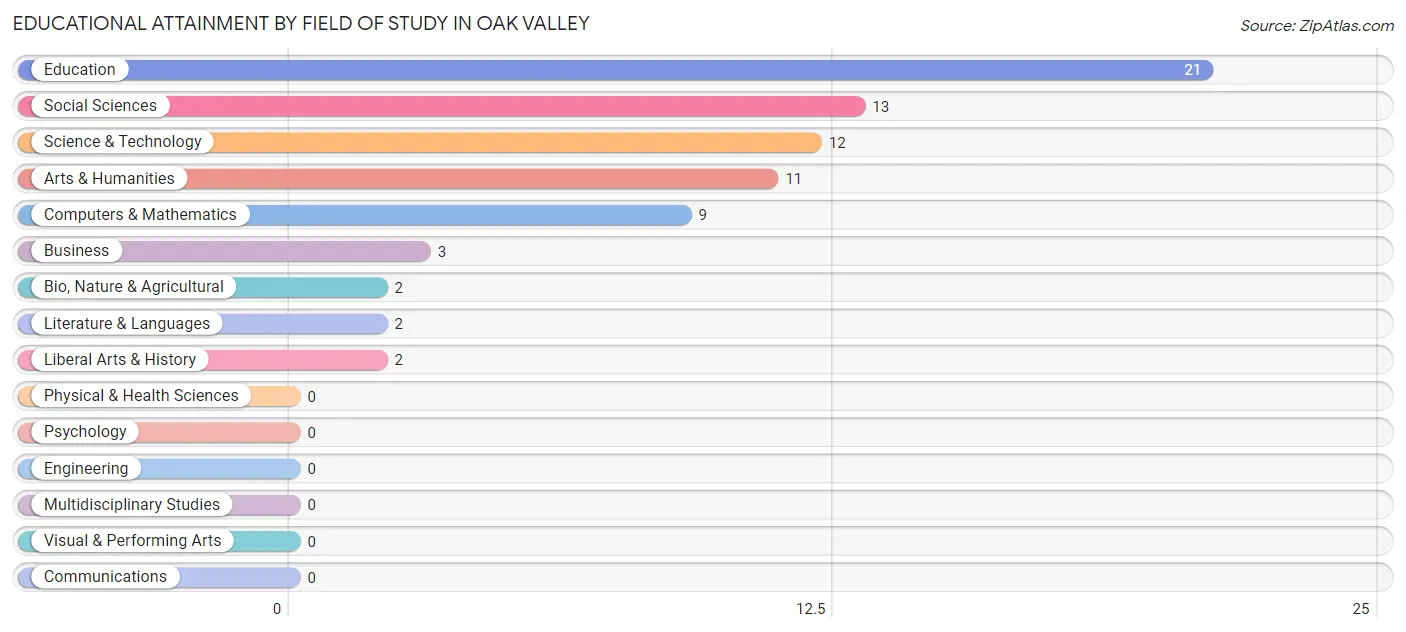
| Field of Study | # Graduates | % Graduates |
| Computers & Mathematics | 9 | 12.0% |
| Bio, Nature & Agricultural | 2 | 2.7% |
| Physical & Health Sciences | 0 | 0.0% |
| Psychology | 0 | 0.0% |
| Social Sciences | 13 | 17.3% |
| Engineering | 0 | 0.0% |
| Multidisciplinary Studies | 0 | 0.0% |
| Science & Technology | 12 | 16.0% |
| Business | 3 | 4.0% |
| Education | 21 | 28.0% |
| Literature & Languages | 2 | 2.7% |
| Liberal Arts & History | 2 | 2.7% |
| Visual & Performing Arts | 0 | 0.0% |
| Communications | 0 | 0.0% |
| Arts & Humanities | 11 | 14.7% |
| Total | 75 | 100.0% |
Transportation & Commute in Oak Valley
Vehicle Availability by Sex in Oak Valley
The most prevalent vehicle ownership categories in Oak Valley are males with 2 vehicles (32, accounting for 29.6%) and females with 2 vehicles (33, making up 31.4%).
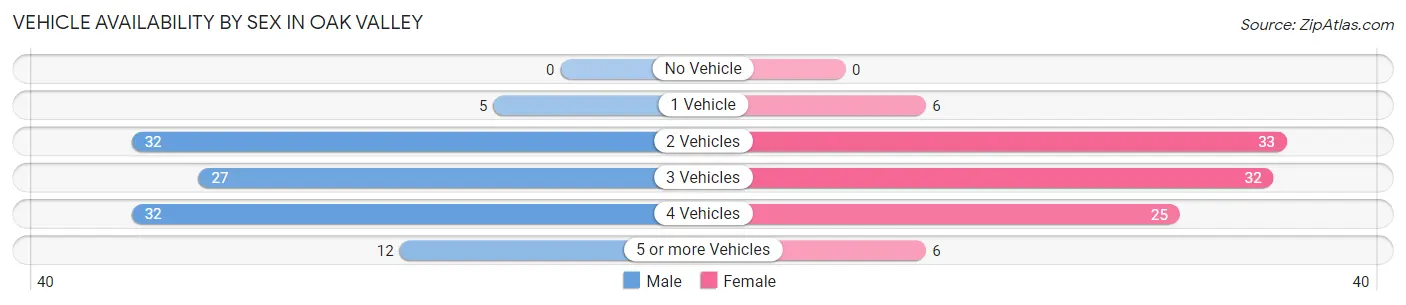
| Vehicles Available | Male | Female |
| No Vehicle | 0 (0.0%) | 0 (0.0%) |
| 1 Vehicle | 5 (4.6%) | 6 (5.9%) |
| 2 Vehicles | 32 (29.6%) | 33 (32.4%) |
| 3 Vehicles | 27 (25.0%) | 32 (31.4%) |
| 4 Vehicles | 32 (29.6%) | 25 (24.5%) |
| 5 or more Vehicles | 12 (11.1%) | 6 (5.9%) |
| Total | 108 (100.0%) | 102 (100.0%) |
Commute Time in Oak Valley
The most frequently occuring commute durations in Oak Valley are 15 to 19 minutes (59 commuters, 30.3%), 10 to 14 minutes (48 commuters, 24.6%), and 20 to 24 minutes (22 commuters, 11.3%).
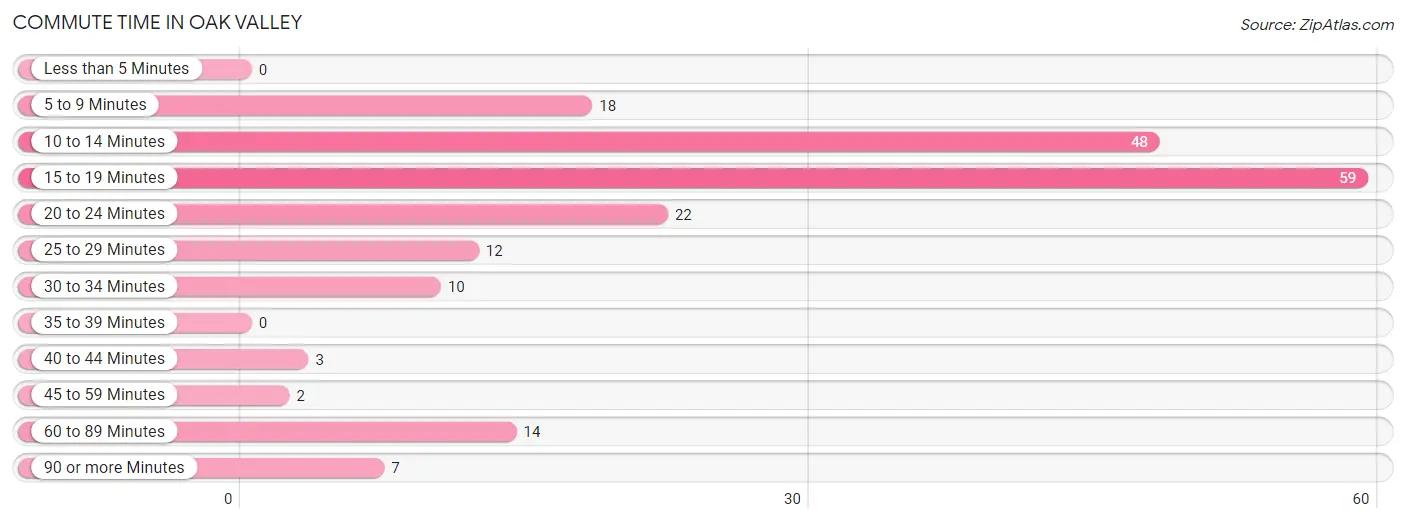
| Commute Time | # Commuters | % Commuters |
| Less than 5 Minutes | 0 | 0.0% |
| 5 to 9 Minutes | 18 | 9.2% |
| 10 to 14 Minutes | 48 | 24.6% |
| 15 to 19 Minutes | 59 | 30.3% |
| 20 to 24 Minutes | 22 | 11.3% |
| 25 to 29 Minutes | 12 | 6.1% |
| 30 to 34 Minutes | 10 | 5.1% |
| 35 to 39 Minutes | 0 | 0.0% |
| 40 to 44 Minutes | 3 | 1.5% |
| 45 to 59 Minutes | 2 | 1.0% |
| 60 to 89 Minutes | 14 | 7.2% |
| 90 or more Minutes | 7 | 3.6% |
Commute Time by Sex in Oak Valley
The most common commute times in Oak Valley are 15 to 19 minutes (23 commuters, 23.0%) for males and 15 to 19 minutes (36 commuters, 37.9%) for females.
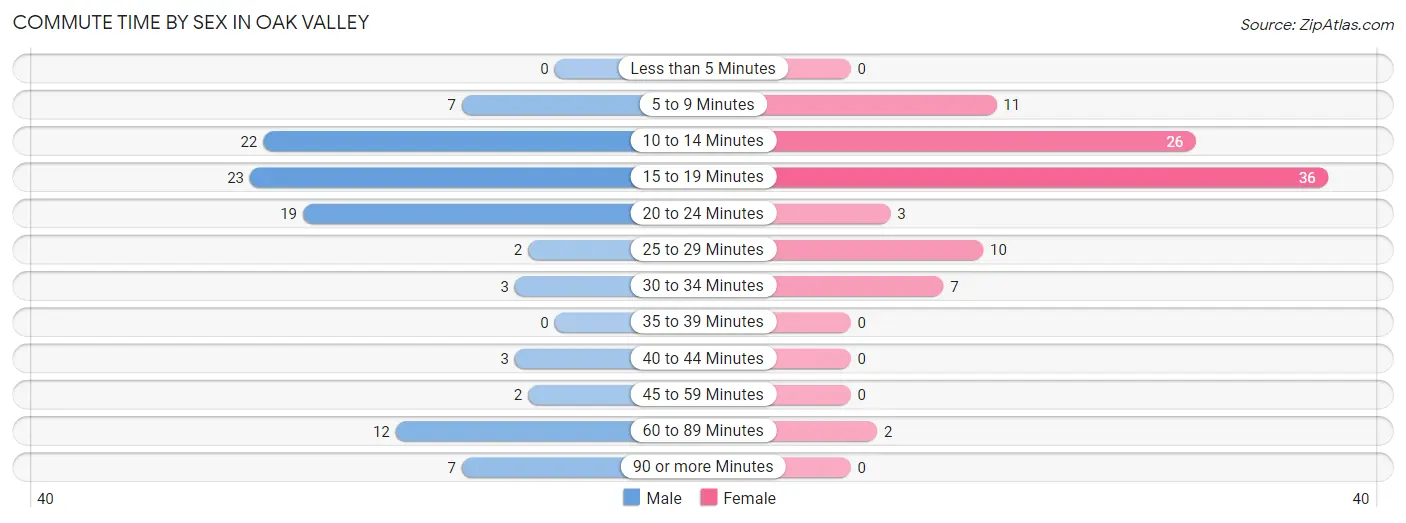
| Commute Time | Male | Female |
| Less than 5 Minutes | 0 (0.0%) | 0 (0.0%) |
| 5 to 9 Minutes | 7 (7.0%) | 11 (11.6%) |
| 10 to 14 Minutes | 22 (22.0%) | 26 (27.4%) |
| 15 to 19 Minutes | 23 (23.0%) | 36 (37.9%) |
| 20 to 24 Minutes | 19 (19.0%) | 3 (3.2%) |
| 25 to 29 Minutes | 2 (2.0%) | 10 (10.5%) |
| 30 to 34 Minutes | 3 (3.0%) | 7 (7.4%) |
| 35 to 39 Minutes | 0 (0.0%) | 0 (0.0%) |
| 40 to 44 Minutes | 3 (3.0%) | 0 (0.0%) |
| 45 to 59 Minutes | 2 (2.0%) | 0 (0.0%) |
| 60 to 89 Minutes | 12 (12.0%) | 2 (2.1%) |
| 90 or more Minutes | 7 (7.0%) | 0 (0.0%) |
Time of Departure to Work by Sex in Oak Valley
The most frequent times of departure to work in Oak Valley are 7:00 AM to 7:29 AM (33, 33.0%) for males and 7:00 AM to 7:29 AM (22, 23.2%) for females.
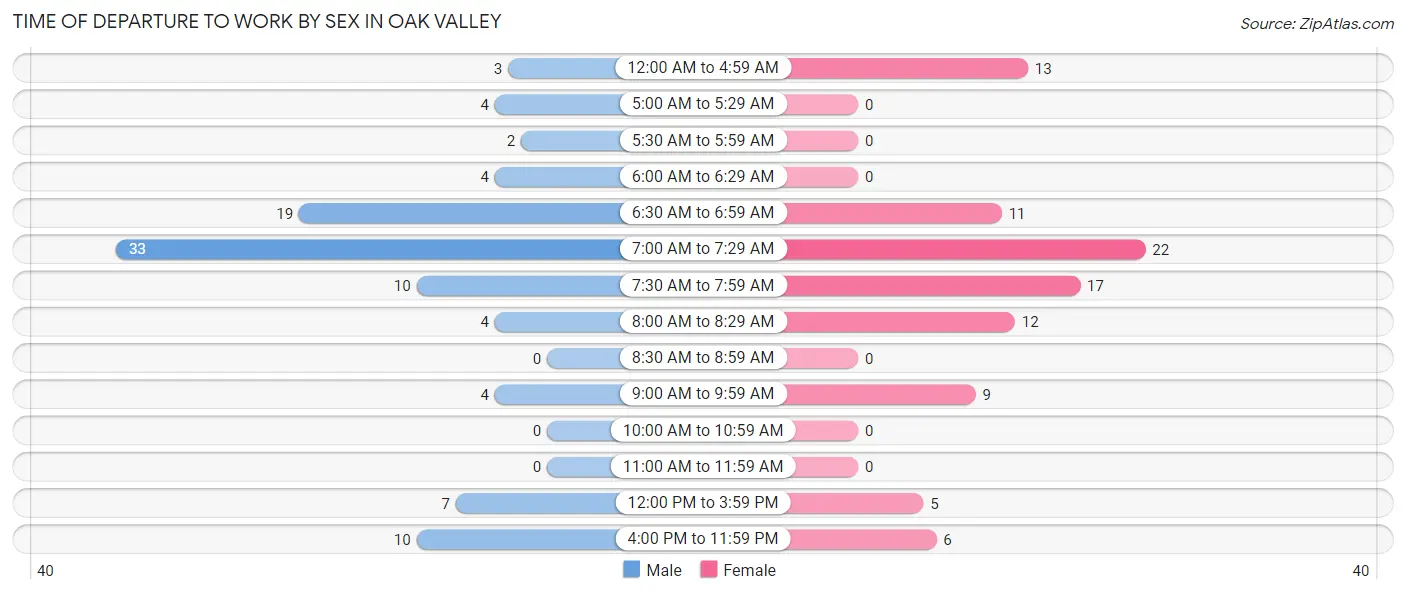
| Time of Departure | Male | Female |
| 12:00 AM to 4:59 AM | 3 (3.0%) | 13 (13.7%) |
| 5:00 AM to 5:29 AM | 4 (4.0%) | 0 (0.0%) |
| 5:30 AM to 5:59 AM | 2 (2.0%) | 0 (0.0%) |
| 6:00 AM to 6:29 AM | 4 (4.0%) | 0 (0.0%) |
| 6:30 AM to 6:59 AM | 19 (19.0%) | 11 (11.6%) |
| 7:00 AM to 7:29 AM | 33 (33.0%) | 22 (23.2%) |
| 7:30 AM to 7:59 AM | 10 (10.0%) | 17 (17.9%) |
| 8:00 AM to 8:29 AM | 4 (4.0%) | 12 (12.6%) |
| 8:30 AM to 8:59 AM | 0 (0.0%) | 0 (0.0%) |
| 9:00 AM to 9:59 AM | 4 (4.0%) | 9 (9.5%) |
| 10:00 AM to 10:59 AM | 0 (0.0%) | 0 (0.0%) |
| 11:00 AM to 11:59 AM | 0 (0.0%) | 0 (0.0%) |
| 12:00 PM to 3:59 PM | 7 (7.0%) | 5 (5.3%) |
| 4:00 PM to 11:59 PM | 10 (10.0%) | 6 (6.3%) |
| Total | 100 (100.0%) | 95 (100.0%) |
Housing Occupancy in Oak Valley
Occupancy by Ownership in Oak Valley
Of the total 178 dwellings in Oak Valley, owner-occupied units account for 160 (89.9%), while renter-occupied units make up 18 (10.1%).
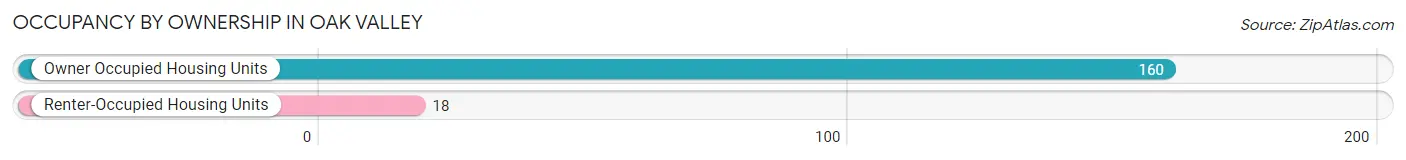
| Occupancy | # Housing Units | % Housing Units |
| Owner Occupied Housing Units | 160 | 89.9% |
| Renter-Occupied Housing Units | 18 | 10.1% |
| Total Occupied Housing Units | 178 | 100.0% |
Occupancy by Household Size in Oak Valley
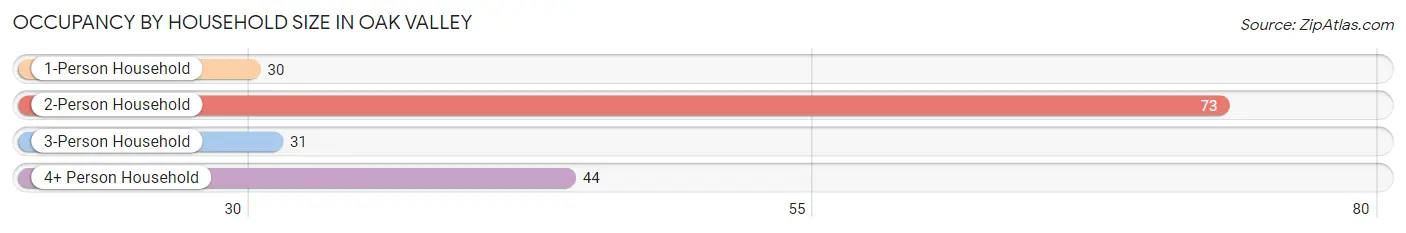
| Household Size | # Housing Units | % Housing Units |
| 1-Person Household | 30 | 16.9% |
| 2-Person Household | 73 | 41.0% |
| 3-Person Household | 31 | 17.4% |
| 4+ Person Household | 44 | 24.7% |
| Total Housing Units | 178 | 100.0% |
Occupancy by Ownership by Household Size in Oak Valley
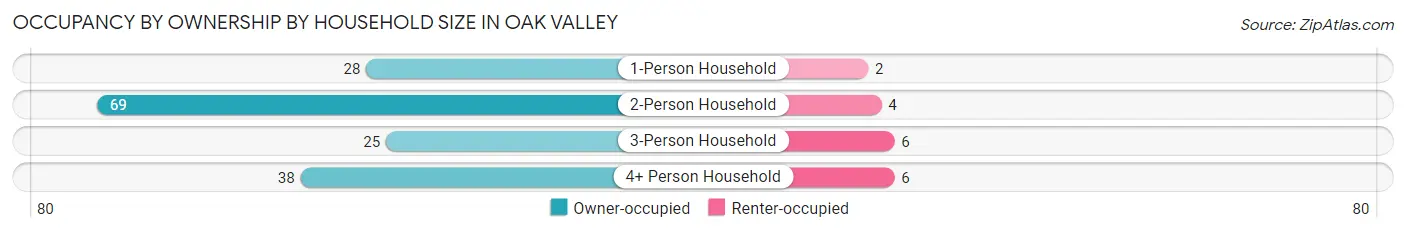
| Household Size | Owner-occupied | Renter-occupied |
| 1-Person Household | 28 (93.3%) | 2 (6.7%) |
| 2-Person Household | 69 (94.5%) | 4 (5.5%) |
| 3-Person Household | 25 (80.6%) | 6 (19.4%) |
| 4+ Person Household | 38 (86.4%) | 6 (13.6%) |
| Total Housing Units | 160 (89.9%) | 18 (10.1%) |
Occupancy by Educational Attainment in Oak Valley
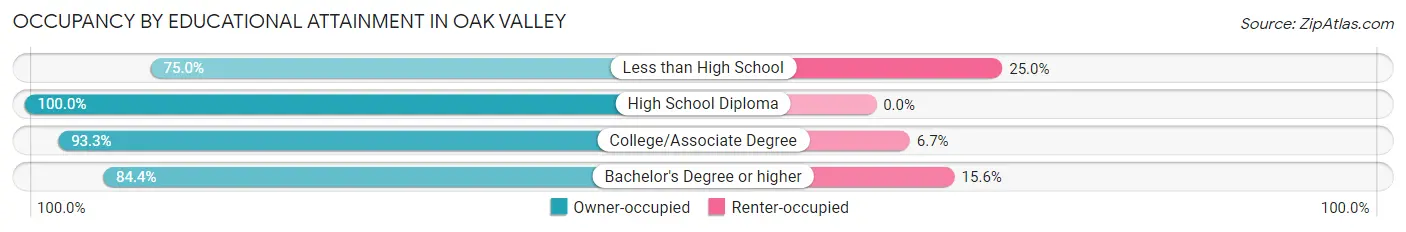
| Household Size | Owner-occupied | Renter-occupied |
| Less than High School | 21 (75.0%) | 7 (25.0%) |
| High School Diploma | 45 (100.0%) | 0 (0.0%) |
| College/Associate Degree | 56 (93.3%) | 4 (6.7%) |
| Bachelor's Degree or higher | 38 (84.4%) | 7 (15.6%) |
Occupancy by Age of Householder in Oak Valley
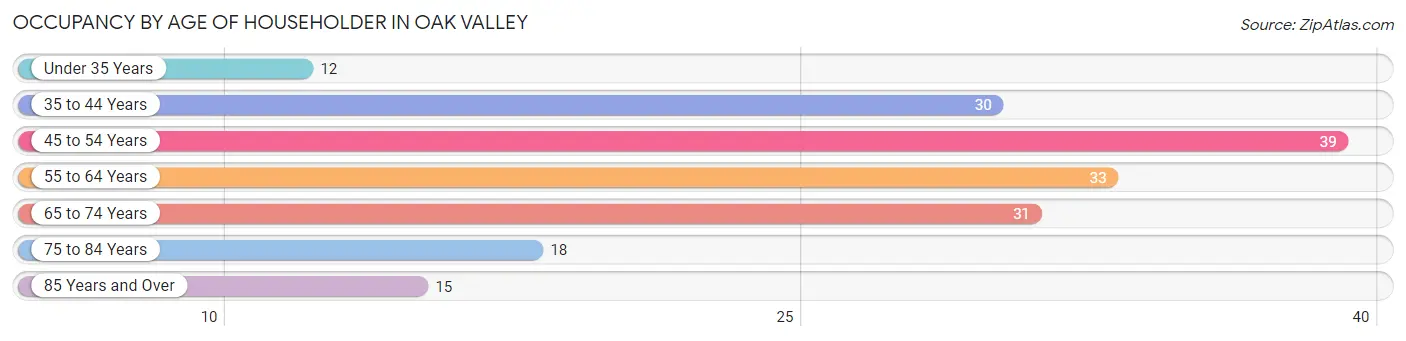
| Age Bracket | # Households | % Households |
| Under 35 Years | 12 | 6.7% |
| 35 to 44 Years | 30 | 16.9% |
| 45 to 54 Years | 39 | 21.9% |
| 55 to 64 Years | 33 | 18.5% |
| 65 to 74 Years | 31 | 17.4% |
| 75 to 84 Years | 18 | 10.1% |
| 85 Years and Over | 15 | 8.4% |
| Total | 178 | 100.0% |
Housing Finances in Oak Valley
Median Income by Occupancy in Oak Valley
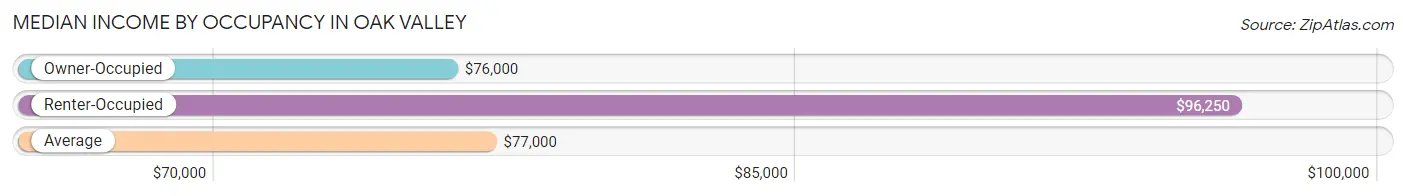
| Occupancy Type | # Households | Median Income |
| Owner-Occupied | 160 (89.9%) | $76,000 |
| Renter-Occupied | 18 (10.1%) | $96,250 |
| Average | 178 (100.0%) | $77,000 |
Occupancy by Householder Income Bracket in Oak Valley
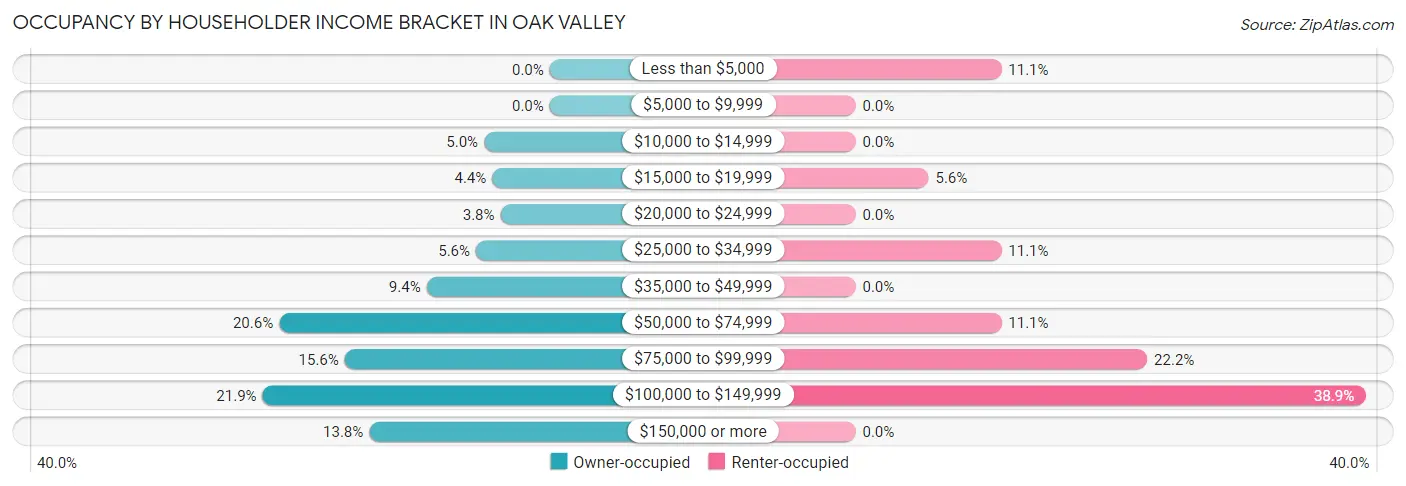
| Income Bracket | Owner-occupied | Renter-occupied |
| Less than $5,000 | 0 (0.0%) | 2 (11.1%) |
| $5,000 to $9,999 | 0 (0.0%) | 0 (0.0%) |
| $10,000 to $14,999 | 8 (5.0%) | 0 (0.0%) |
| $15,000 to $19,999 | 7 (4.4%) | 1 (5.6%) |
| $20,000 to $24,999 | 6 (3.7%) | 0 (0.0%) |
| $25,000 to $34,999 | 9 (5.6%) | 2 (11.1%) |
| $35,000 to $49,999 | 15 (9.4%) | 0 (0.0%) |
| $50,000 to $74,999 | 33 (20.6%) | 2 (11.1%) |
| $75,000 to $99,999 | 25 (15.6%) | 4 (22.2%) |
| $100,000 to $149,999 | 35 (21.9%) | 7 (38.9%) |
| $150,000 or more | 22 (13.8%) | 0 (0.0%) |
| Total | 160 (100.0%) | 18 (100.0%) |
Monthly Housing Cost Tiers in Oak Valley
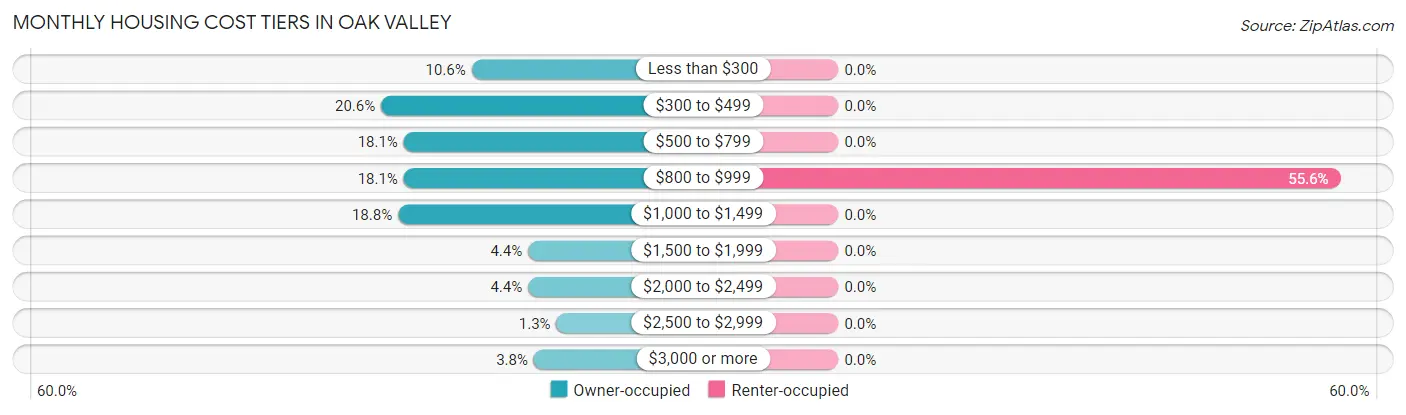
| Monthly Cost | Owner-occupied | Renter-occupied |
| Less than $300 | 17 (10.6%) | 0 (0.0%) |
| $300 to $499 | 33 (20.6%) | 0 (0.0%) |
| $500 to $799 | 29 (18.1%) | 0 (0.0%) |
| $800 to $999 | 29 (18.1%) | 10 (55.6%) |
| $1,000 to $1,499 | 30 (18.8%) | 0 (0.0%) |
| $1,500 to $1,999 | 7 (4.4%) | 0 (0.0%) |
| $2,000 to $2,499 | 7 (4.4%) | 0 (0.0%) |
| $2,500 to $2,999 | 2 (1.3%) | 0 (0.0%) |
| $3,000 or more | 6 (3.7%) | 0 (0.0%) |
| Total | 160 (100.0%) | 18 (100.0%) |
Physical Housing Characteristics in Oak Valley
Housing Structures in Oak Valley
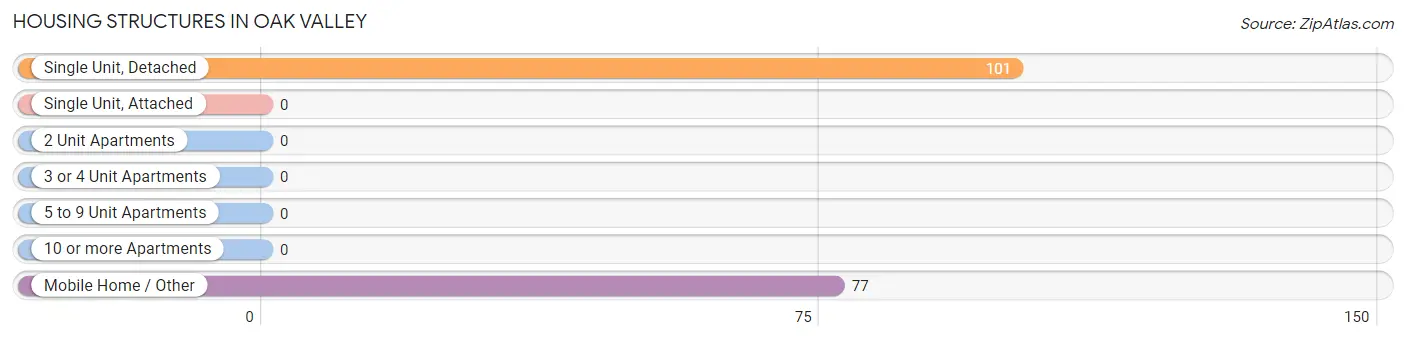
| Structure Type | # Housing Units | % Housing Units |
| Single Unit, Detached | 101 | 56.7% |
| Single Unit, Attached | 0 | 0.0% |
| 2 Unit Apartments | 0 | 0.0% |
| 3 or 4 Unit Apartments | 0 | 0.0% |
| 5 to 9 Unit Apartments | 0 | 0.0% |
| 10 or more Apartments | 0 | 0.0% |
| Mobile Home / Other | 77 | 43.3% |
| Total | 178 | 100.0% |
Housing Structures by Occupancy in Oak Valley
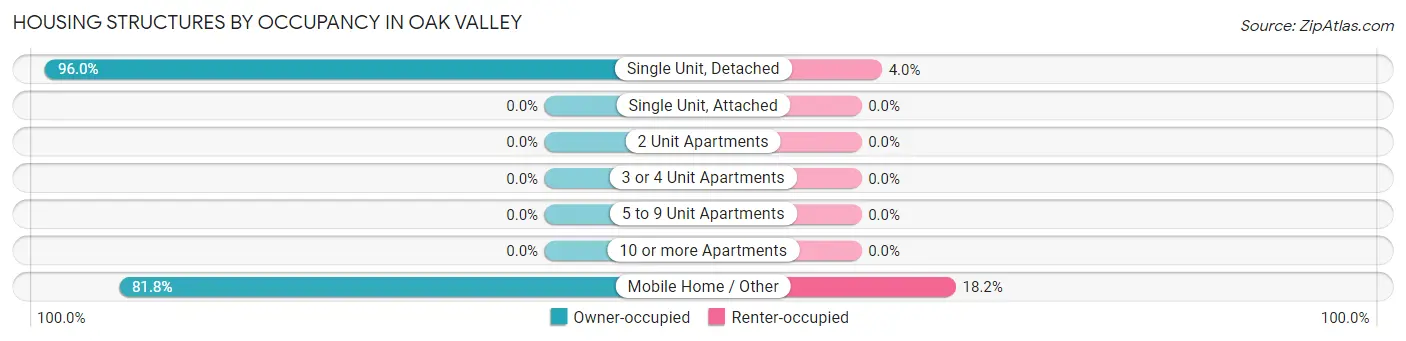
| Structure Type | Owner-occupied | Renter-occupied |
| Single Unit, Detached | 97 (96.0%) | 4 (4.0%) |
| Single Unit, Attached | 0 (0.0%) | 0 (0.0%) |
| 2 Unit Apartments | 0 (0.0%) | 0 (0.0%) |
| 3 or 4 Unit Apartments | 0 (0.0%) | 0 (0.0%) |
| 5 to 9 Unit Apartments | 0 (0.0%) | 0 (0.0%) |
| 10 or more Apartments | 0 (0.0%) | 0 (0.0%) |
| Mobile Home / Other | 63 (81.8%) | 14 (18.2%) |
| Total | 160 (89.9%) | 18 (10.1%) |
Housing Structures by Number of Rooms in Oak Valley
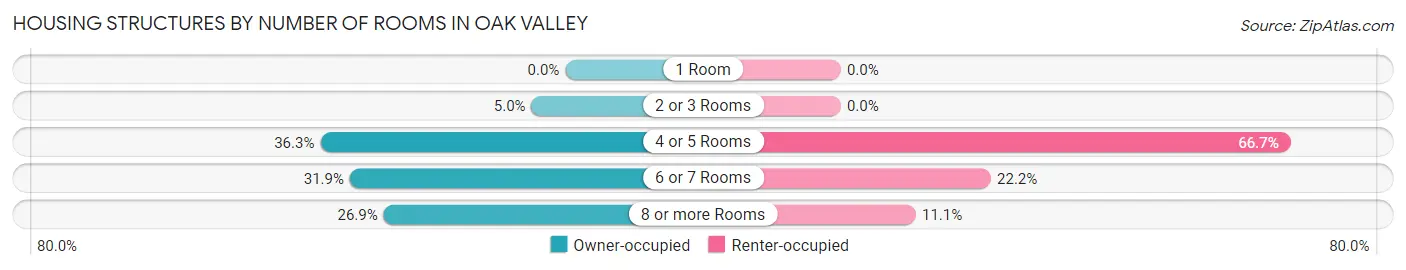
| Number of Rooms | Owner-occupied | Renter-occupied |
| 1 Room | 0 (0.0%) | 0 (0.0%) |
| 2 or 3 Rooms | 8 (5.0%) | 0 (0.0%) |
| 4 or 5 Rooms | 58 (36.2%) | 12 (66.7%) |
| 6 or 7 Rooms | 51 (31.9%) | 4 (22.2%) |
| 8 or more Rooms | 43 (26.9%) | 2 (11.1%) |
| Total | 160 (100.0%) | 18 (100.0%) |
Housing Structure by Heating Type in Oak Valley
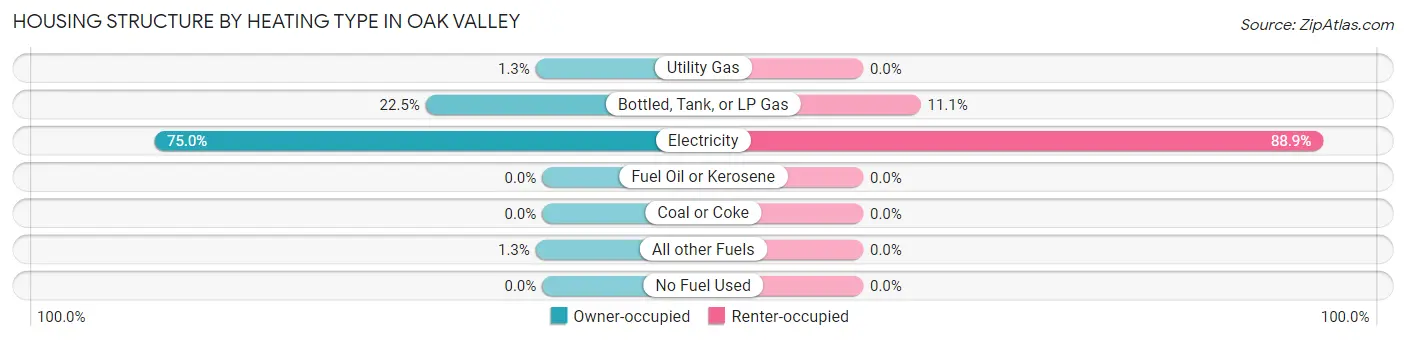
| Heating Type | Owner-occupied | Renter-occupied |
| Utility Gas | 2 (1.3%) | 0 (0.0%) |
| Bottled, Tank, or LP Gas | 36 (22.5%) | 2 (11.1%) |
| Electricity | 120 (75.0%) | 16 (88.9%) |
| Fuel Oil or Kerosene | 0 (0.0%) | 0 (0.0%) |
| Coal or Coke | 0 (0.0%) | 0 (0.0%) |
| All other Fuels | 2 (1.3%) | 0 (0.0%) |
| No Fuel Used | 0 (0.0%) | 0 (0.0%) |
| Total | 160 (100.0%) | 18 (100.0%) |
Household Vehicle Usage in Oak Valley
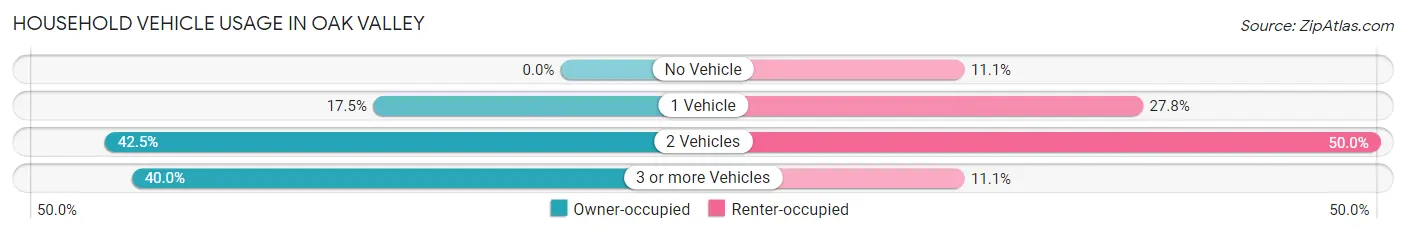
| Vehicles per Household | Owner-occupied | Renter-occupied |
| No Vehicle | 0 (0.0%) | 2 (11.1%) |
| 1 Vehicle | 28 (17.5%) | 5 (27.8%) |
| 2 Vehicles | 68 (42.5%) | 9 (50.0%) |
| 3 or more Vehicles | 64 (40.0%) | 2 (11.1%) |
| Total | 160 (100.0%) | 18 (100.0%) |
Real Estate & Mortgages in Oak Valley
Real Estate and Mortgage Overview in Oak Valley
| Characteristic | Without Mortgage | With Mortgage |
| Housing Units | 102 | 58 |
| Median Property Value | $95,700 | $153,600 |
| Median Household Income | $65,000 | $16 |
| Monthly Housing Costs | $510 | $6 |
| Real Estate Taxes | $1,250 | $6 |
Property Value by Mortgage Status in Oak Valley
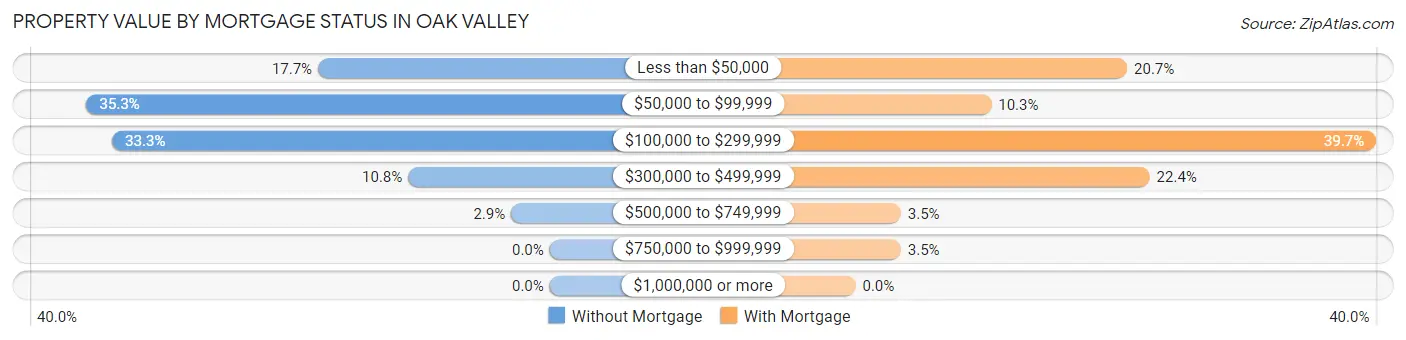
| Property Value | Without Mortgage | With Mortgage |
| Less than $50,000 | 18 (17.6%) | 12 (20.7%) |
| $50,000 to $99,999 | 36 (35.3%) | 6 (10.3%) |
| $100,000 to $299,999 | 34 (33.3%) | 23 (39.7%) |
| $300,000 to $499,999 | 11 (10.8%) | 13 (22.4%) |
| $500,000 to $749,999 | 3 (2.9%) | 2 (3.5%) |
| $750,000 to $999,999 | 0 (0.0%) | 2 (3.5%) |
| $1,000,000 or more | 0 (0.0%) | 0 (0.0%) |
| Total | 102 (100.0%) | 58 (100.0%) |
Household Income by Mortgage Status in Oak Valley
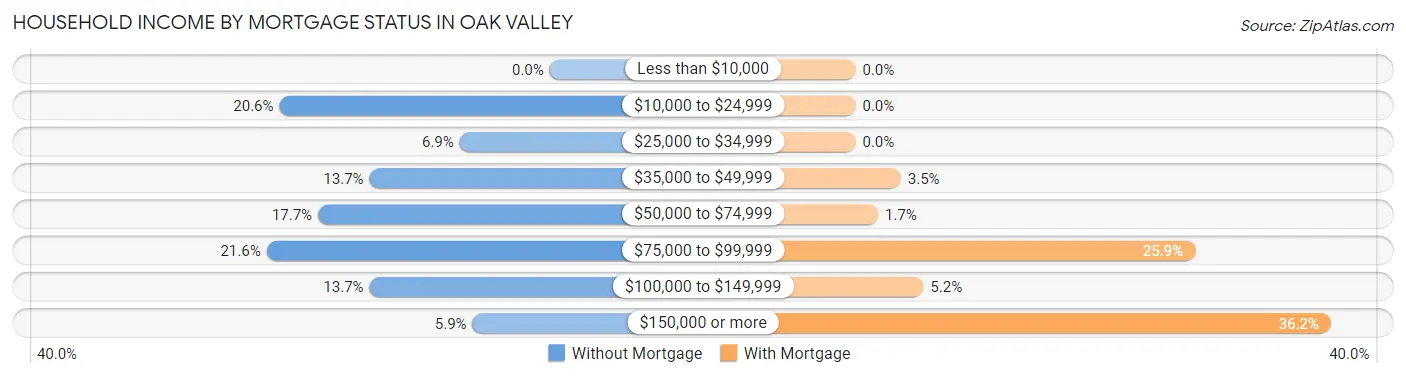
| Household Income | Without Mortgage | With Mortgage |
| Less than $10,000 | 0 (0.0%) | 0 (0.0%) |
| $10,000 to $24,999 | 21 (20.6%) | 0 (0.0%) |
| $25,000 to $34,999 | 7 (6.9%) | 0 (0.0%) |
| $35,000 to $49,999 | 14 (13.7%) | 2 (3.5%) |
| $50,000 to $74,999 | 18 (17.6%) | 1 (1.7%) |
| $75,000 to $99,999 | 22 (21.6%) | 15 (25.9%) |
| $100,000 to $149,999 | 14 (13.7%) | 3 (5.2%) |
| $150,000 or more | 6 (5.9%) | 21 (36.2%) |
| Total | 102 (100.0%) | 58 (100.0%) |
Property Value to Household Income Ratio in Oak Valley
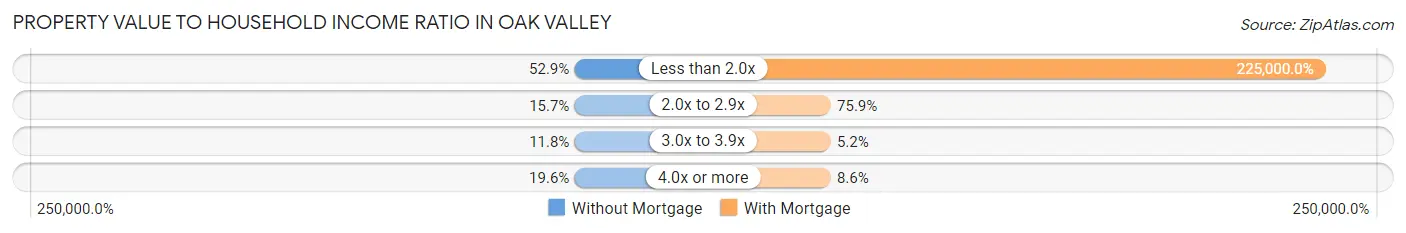
| Value-to-Income Ratio | Without Mortgage | With Mortgage |
| Less than 2.0x | 54 (52.9%) | 130,500 (225,000.0%) |
| 2.0x to 2.9x | 16 (15.7%) | 44 (75.9%) |
| 3.0x to 3.9x | 12 (11.8%) | 3 (5.2%) |
| 4.0x or more | 20 (19.6%) | 5 (8.6%) |
| Total | 102 (100.0%) | 58 (100.0%) |
Real Estate Taxes by Mortgage Status in Oak Valley
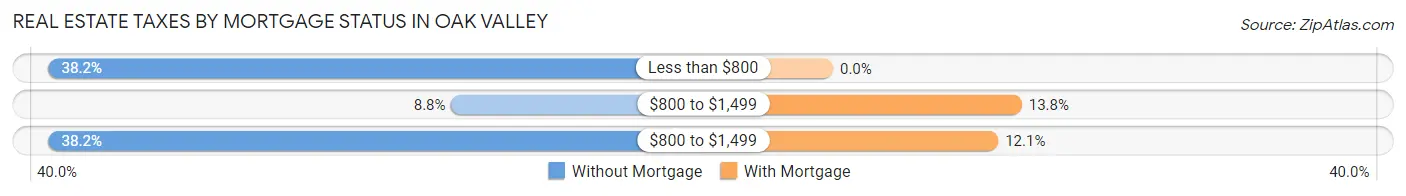
| Property Taxes | Without Mortgage | With Mortgage |
| Less than $800 | 39 (38.2%) | 0 (0.0%) |
| $800 to $1,499 | 9 (8.8%) | 8 (13.8%) |
| $800 to $1,499 | 39 (38.2%) | 7 (12.1%) |
| Total | 102 (100.0%) | 58 (100.0%) |
Health & Disability in Oak Valley
Health Insurance Coverage by Age in Oak Valley

| Age Bracket | With Coverage | Without Coverage |
| Under 6 Years | 23 (92.0%) | 2 (8.0%) |
| 6 to 18 Years | 72 (88.9%) | 9 (11.1%) |
| 19 to 25 Years | 39 (90.7%) | 4 (9.3%) |
| 26 to 34 Years | 22 (46.8%) | 25 (53.2%) |
| 35 to 44 Years | 54 (78.3%) | 15 (21.7%) |
| 45 to 54 Years | 47 (71.2%) | 19 (28.8%) |
| 55 to 64 Years | 55 (93.2%) | 4 (6.8%) |
| 65 to 74 Years | 57 (100.0%) | 0 (0.0%) |
| 75 Years and older | 53 (100.0%) | 0 (0.0%) |
| Total | 422 (84.4%) | 78 (15.6%) |
Health Insurance Coverage by Citizenship Status in Oak Valley
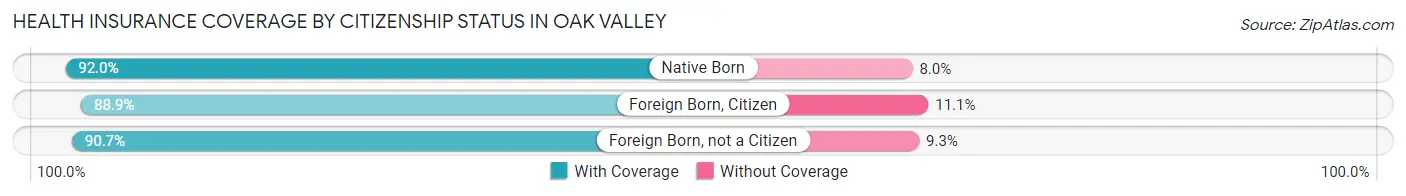
| Citizenship Status | With Coverage | Without Coverage |
| Native Born | 23 (92.0%) | 2 (8.0%) |
| Foreign Born, Citizen | 72 (88.9%) | 9 (11.1%) |
| Foreign Born, not a Citizen | 39 (90.7%) | 4 (9.3%) |
Health Insurance Coverage by Household Income in Oak Valley
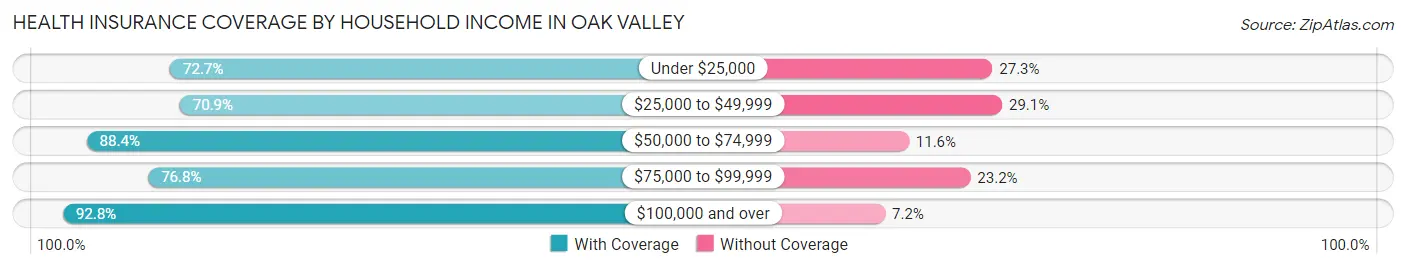
| Household Income | With Coverage | Without Coverage |
| Under $25,000 | 40 (72.7%) | 15 (27.3%) |
| $25,000 to $49,999 | 39 (70.9%) | 16 (29.1%) |
| $50,000 to $74,999 | 76 (88.4%) | 10 (11.6%) |
| $75,000 to $99,999 | 73 (76.8%) | 22 (23.2%) |
| $100,000 and over | 194 (92.8%) | 15 (7.2%) |
Public vs Private Health Insurance Coverage by Age in Oak Valley
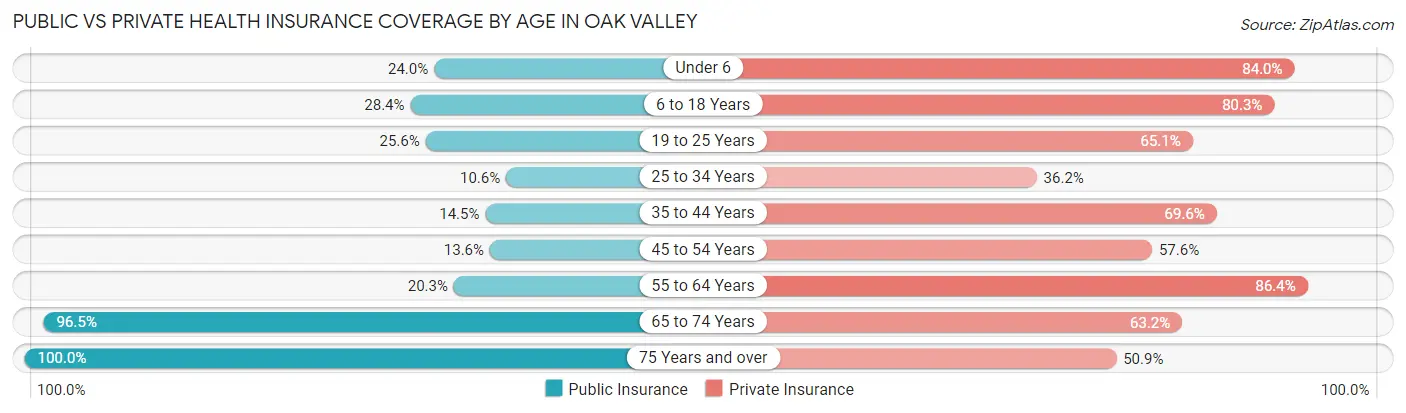
| Age Bracket | Public Insurance | Private Insurance |
| Under 6 | 6 (24.0%) | 21 (84.0%) |
| 6 to 18 Years | 23 (28.4%) | 65 (80.2%) |
| 19 to 25 Years | 11 (25.6%) | 28 (65.1%) |
| 25 to 34 Years | 5 (10.6%) | 17 (36.2%) |
| 35 to 44 Years | 10 (14.5%) | 48 (69.6%) |
| 45 to 54 Years | 9 (13.6%) | 38 (57.6%) |
| 55 to 64 Years | 12 (20.3%) | 51 (86.4%) |
| 65 to 74 Years | 55 (96.5%) | 36 (63.2%) |
| 75 Years and over | 53 (100.0%) | 27 (50.9%) |
| Total | 184 (36.8%) | 331 (66.2%) |
Disability Status by Sex by Age in Oak Valley
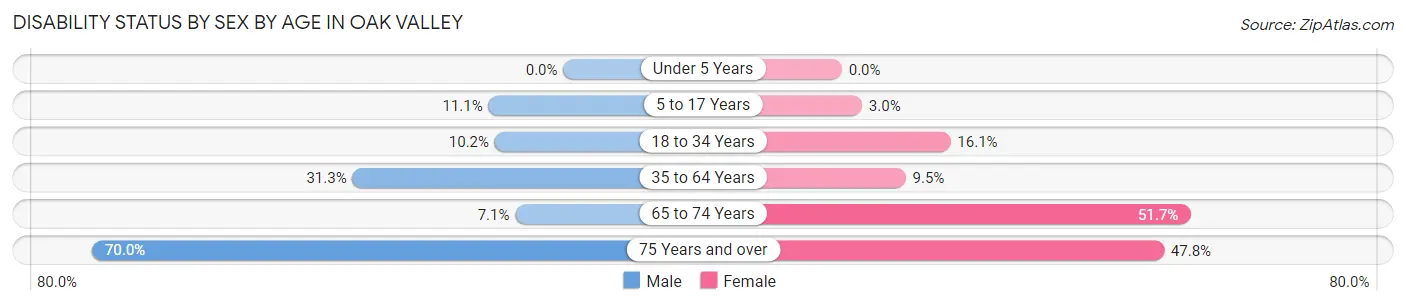
| Age Bracket | Male | Female |
| Under 5 Years | 0 (0.0%) | 0 (0.0%) |
| 5 to 17 Years | 2 (11.1%) | 2 (3.0%) |
| 18 to 34 Years | 6 (10.2%) | 5 (16.1%) |
| 35 to 64 Years | 31 (31.3%) | 9 (9.5%) |
| 65 to 74 Years | 2 (7.1%) | 15 (51.7%) |
| 75 Years and over | 21 (70.0%) | 11 (47.8%) |
Disability Class by Sex by Age in Oak Valley
Disability Class: Hearing Difficulty
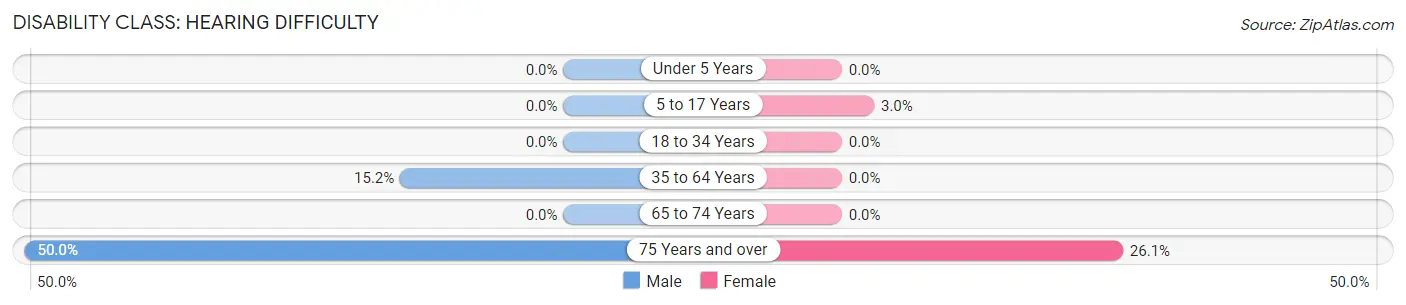
| Age Bracket | Male | Female |
| Under 5 Years | 0 (0.0%) | 0 (0.0%) |
| 5 to 17 Years | 0 (0.0%) | 2 (3.0%) |
| 18 to 34 Years | 0 (0.0%) | 0 (0.0%) |
| 35 to 64 Years | 15 (15.1%) | 0 (0.0%) |
| 65 to 74 Years | 0 (0.0%) | 0 (0.0%) |
| 75 Years and over | 15 (50.0%) | 6 (26.1%) |
Disability Class: Vision Difficulty
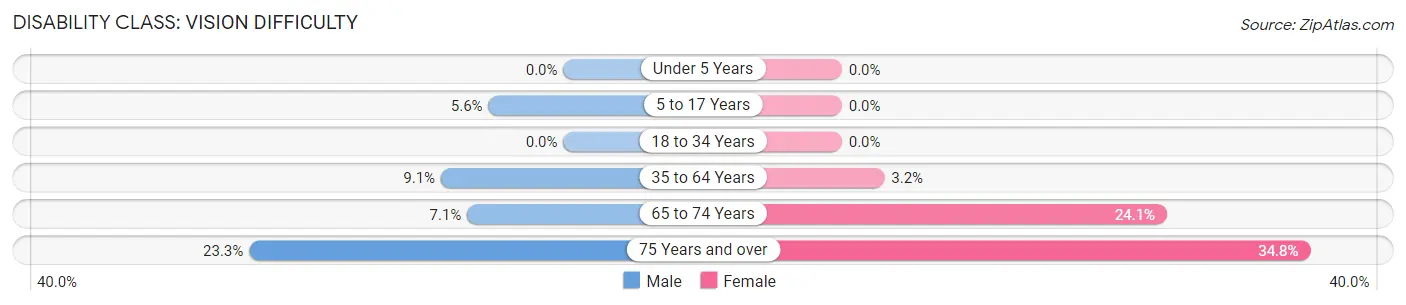
| Age Bracket | Male | Female |
| Under 5 Years | 0 (0.0%) | 0 (0.0%) |
| 5 to 17 Years | 1 (5.6%) | 0 (0.0%) |
| 18 to 34 Years | 0 (0.0%) | 0 (0.0%) |
| 35 to 64 Years | 9 (9.1%) | 3 (3.2%) |
| 65 to 74 Years | 2 (7.1%) | 7 (24.1%) |
| 75 Years and over | 7 (23.3%) | 8 (34.8%) |
Disability Class: Cognitive Difficulty
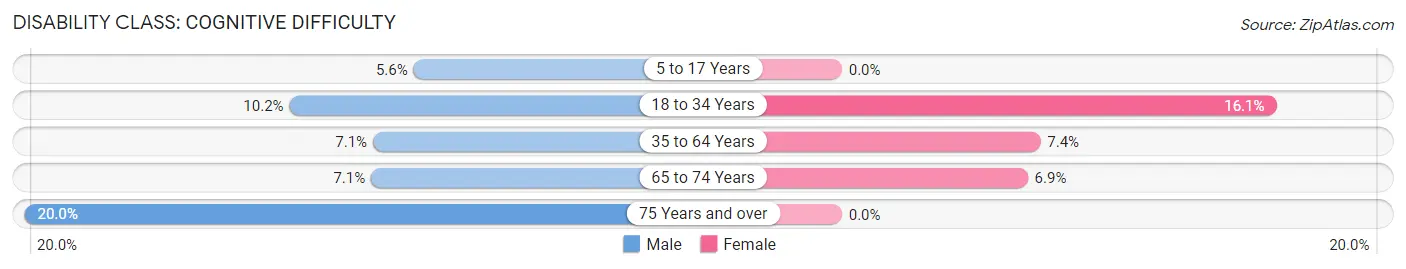
| Age Bracket | Male | Female |
| 5 to 17 Years | 1 (5.6%) | 0 (0.0%) |
| 18 to 34 Years | 6 (10.2%) | 5 (16.1%) |
| 35 to 64 Years | 7 (7.1%) | 7 (7.4%) |
| 65 to 74 Years | 2 (7.1%) | 2 (6.9%) |
| 75 Years and over | 6 (20.0%) | 0 (0.0%) |
Disability Class: Ambulatory Difficulty
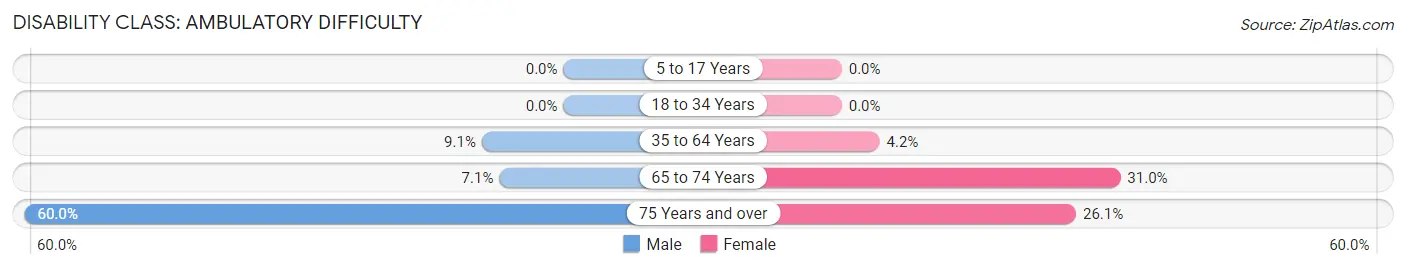
| Age Bracket | Male | Female |
| 5 to 17 Years | 0 (0.0%) | 0 (0.0%) |
| 18 to 34 Years | 0 (0.0%) | 0 (0.0%) |
| 35 to 64 Years | 9 (9.1%) | 4 (4.2%) |
| 65 to 74 Years | 2 (7.1%) | 9 (31.0%) |
| 75 Years and over | 18 (60.0%) | 6 (26.1%) |
Disability Class: Self-Care Difficulty
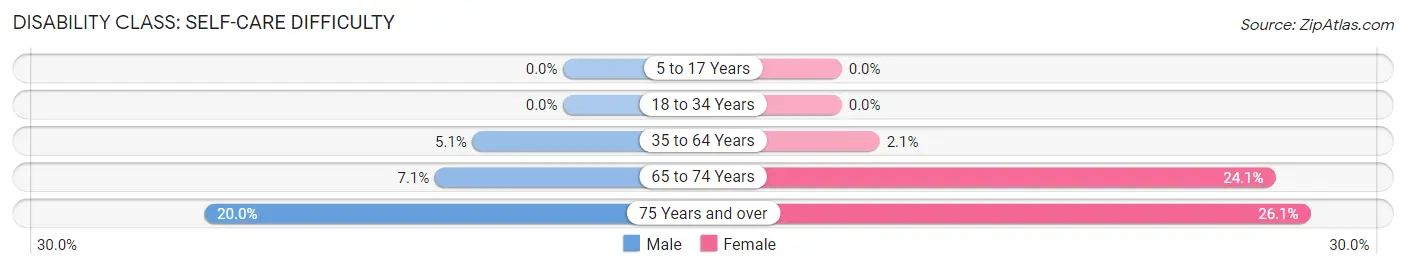
| Age Bracket | Male | Female |
| 5 to 17 Years | 0 (0.0%) | 0 (0.0%) |
| 18 to 34 Years | 0 (0.0%) | 0 (0.0%) |
| 35 to 64 Years | 5 (5.1%) | 2 (2.1%) |
| 65 to 74 Years | 2 (7.1%) | 7 (24.1%) |
| 75 Years and over | 6 (20.0%) | 6 (26.1%) |
Technology Access in Oak Valley
Computing Device Access in Oak Valley
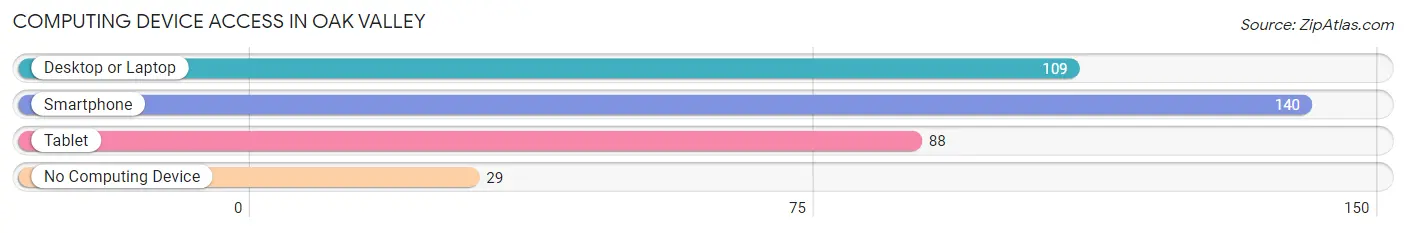
| Device Type | # Households | % Households |
| Desktop or Laptop | 109 | 61.2% |
| Smartphone | 140 | 78.6% |
| Tablet | 88 | 49.4% |
| No Computing Device | 29 | 16.3% |
| Total | 178 | 100.0% |
Internet Access in Oak Valley
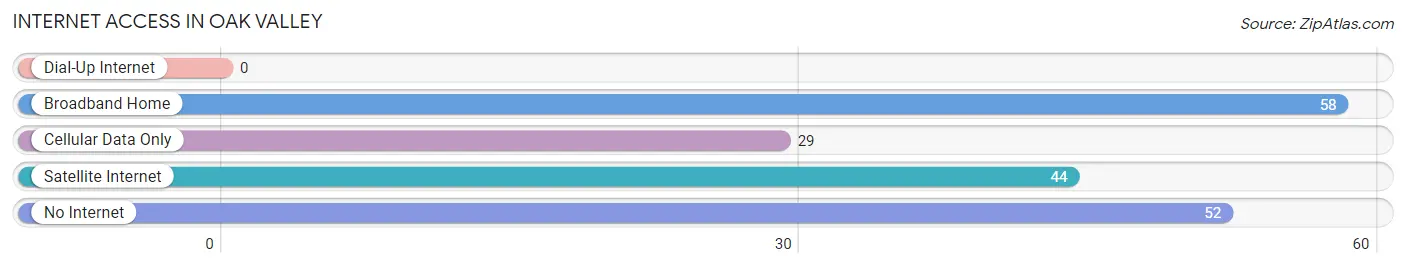
| Internet Type | # Households | % Households |
| Dial-Up Internet | 0 | 0.0% |
| Broadband Home | 58 | 32.6% |
| Cellular Data Only | 29 | 16.3% |
| Satellite Internet | 44 | 24.7% |
| No Internet | 52 | 29.2% |
| Total | 178 | 100.0% |
Oak Valley Summary
Oak Valley is a small town located in the state of Texas, in the United States of America. It is situated in the county of Collin, and is part of the Dallas-Fort Worth-Arlington metropolitan area. The town has a population of around 1,000 people, and is known for its rural charm and small-town atmosphere.
History
Oak Valley was founded in 1845 by a group of settlers from Tennessee. The town was originally called “Oak Grove”, but the name was changed to Oak Valley in 1876. The town was originally a farming community, and the main crops grown were cotton, corn, and wheat. The town also had a few small businesses, such as a general store, a blacksmith, and a post office.
In the early 1900s, the town began to grow and develop. The population increased, and new businesses opened up, such as a bank, a hotel, and a movie theater. The town also had a school, which was built in 1910.
In the 1950s, the town began to decline. Many of the businesses closed, and the population decreased. In the 1970s, the town was revitalized, and new businesses opened up, such as a grocery store, a gas station, and a restaurant.
Geography
Oak Valley is located in the northeast corner of Collin County, Texas. It is situated on the banks of the Trinity River, and is surrounded by rolling hills and farmland. The town is located about 30 miles north of Dallas, and is part of the Dallas-Fort Worth-Arlington metropolitan area.
The climate in Oak Valley is hot and humid in the summer, and mild in the winter. The average temperature in the summer is around 90 degrees Fahrenheit, and the average temperature in the winter is around 50 degrees Fahrenheit.
Economy
The economy of Oak Valley is largely based on agriculture. The town is home to several farms, which produce a variety of crops, such as cotton, corn, and wheat. The town also has a few small businesses, such as a grocery store, a gas station, and a restaurant.
Demographics
As of the 2010 census, the population of Oak Valley was 1,000 people. The racial makeup of the town was 95.2% White, 0.7% African American, 0.3% Native American, 0.3% Asian, and 3.5% from other races. The median household income was $45,000, and the median family income was $50,000.
Conclusion
Oak Valley is a small town located in the state of Texas, in the United States of America. It is situated in the county of Collin, and is part of the Dallas-Fort Worth-Arlington metropolitan area. The town has a population of around 1,000 people, and is known for its rural charm and small-town atmosphere. The economy of Oak Valley is largely based on agriculture, and the town is home to several farms, which produce a variety of crops. The racial makeup of the town is mostly White, with a small percentage of African American, Native American, and Asian residents.
Common Questions
What is the Total Population of Oak Valley?
Total Population of Oak Valley is 505.
What is the Total Male Population of Oak Valley?
Total Male Population of Oak Valley is 256.
What is the Total Female Population of Oak Valley?
Total Female Population of Oak Valley is 249.
What is the Ratio of Males per 100 Females in Oak Valley?
There are 102.81 Males per 100 Females in Oak Valley.
What is the Ratio of Females per 100 Males in Oak Valley?
There are 97.27 Females per 100 Males in Oak Valley.
What is the Median Population Age in Oak Valley?
Median Population Age in Oak Valley is 42.8 Years.
What is the Average Family Size in Oak Valley
Average Family Size in Oak Valley is 3.0 People.
What is the Average Household Size in Oak Valley
Average Household Size in Oak Valley is 2.8 People.
What is Per Capita Income in Oak Valley?
Per Capita income in Oak Valley is $31,574.
What is the Median Family Income in Oak Valley?
Median Family Income in Oak Valley is $81,875.
What is the Median Household income in Oak Valley?
Median Household Income in Oak Valley is $77,000.
What is Income or Wage Gap in Oak Valley?
Income or Wage Gap in Oak Valley is 49.6%.
Women in Oak Valley earn 50.4 cents for every dollar earned by a man.
What is Inequality or Gini Index in Oak Valley?
Inequality or Gini Index in Oak Valley is 0.36.
How Large is the Labor Force in Oak Valley?
There are 233 People in the Labor Forcein in Oak Valley.
What is the Percentage of People in the Labor Force in Oak Valley?
56.8% of People are in the Labor Force in Oak Valley.
What is the Unemployment Rate in Oak Valley?
Unemployment Rate in Oak Valley is 8.6%.