Mount Calm, TX
Mount Calm Map
Mount Calm Overview
395
TOTAL POPULATION
153
MALE POPULATION
242
FEMALE POPULATION
63.22
MALES / 100 FEMALES
158.17
FEMALES / 100 MALES
43.9
MEDIAN AGE
3.4
AVG FAMILY SIZE
2.4
AVG HOUSEHOLD SIZE
$24,025
PER CAPITA INCOME
$60,536
AVG FAMILY INCOME
$47,083
AVG HOUSEHOLD INCOME
36.8%
WAGE / INCOME GAP [ % ]
63.2¢/ $1
WAGE / INCOME GAP [ $ ]
0.36
INEQUALITY / GINI INDEX
168
LABOR FORCE [ PEOPLE ]
59.4%
PERCENT IN LABOR FORCE
5.4%
UNEMPLOYMENT RATE
Mount Calm Zip Codes
Mount Calm Area Codes
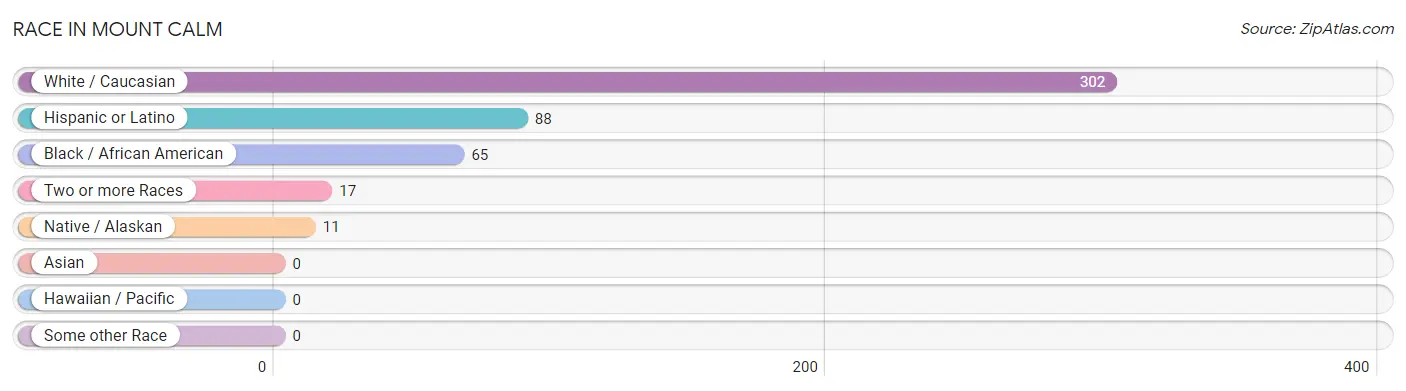
Race in Mount Calm
The most populous races in Mount Calm are White / Caucasian (302 | 76.5%), Hispanic or Latino (88 | 22.3%), and Black / African American (65 | 16.5%).
| Race | # Population | % Population |
| Asian | 0 | 0.0% |
| Black / African American | 65 | 16.5% |
| Hawaiian / Pacific | 0 | 0.0% |
| Hispanic or Latino | 88 | 22.3% |
| Native / Alaskan | 11 | 2.8% |
| White / Caucasian | 302 | 76.5% |
| Two or more Races | 17 | 4.3% |
| Some other Race | 0 | 0.0% |
| Total | 395 | 100.0% |
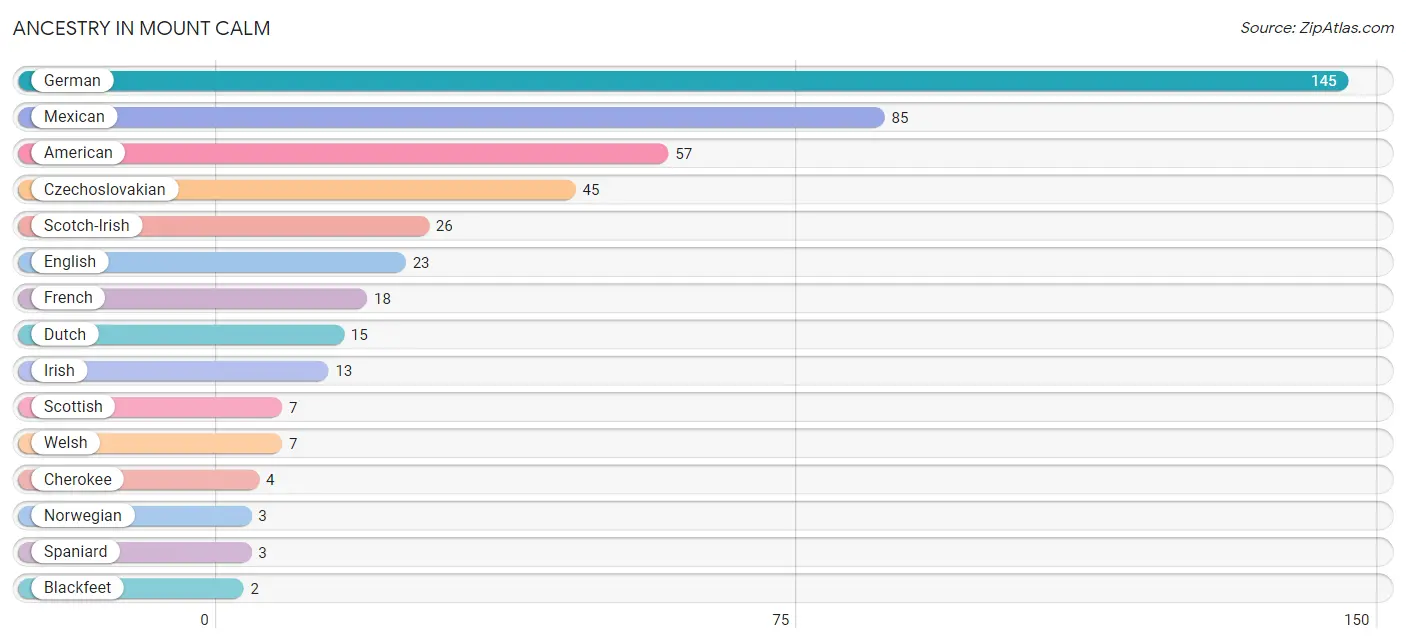
Ancestry in Mount Calm
The most populous ancestries reported in Mount Calm are German (145 | 36.7%), Mexican (85 | 21.5%), American (57 | 14.4%), Czechoslovakian (45 | 11.4%), and Scotch-Irish (26 | 6.6%), together accounting for 90.6% of all Mount Calm residents.
| Ancestry | # Population | % Population |
| American | 57 | 14.4% |
| Blackfeet | 2 | 0.5% |
| Cherokee | 4 | 1.0% |
| Comanche | 2 | 0.5% |
| Czechoslovakian | 45 | 11.4% |
| Dutch | 15 | 3.8% |
| English | 23 | 5.8% |
| French | 18 | 4.6% |
| German | 145 | 36.7% |
| Irish | 13 | 3.3% |
| Mexican | 85 | 21.5% |
| Norwegian | 3 | 0.8% |
| Scotch-Irish | 26 | 6.6% |
| Scottish | 7 | 1.8% |
| Spaniard | 3 | 0.8% |
| Swiss | 2 | 0.5% |
| Welsh | 7 | 1.8% | View All 17 Rows |
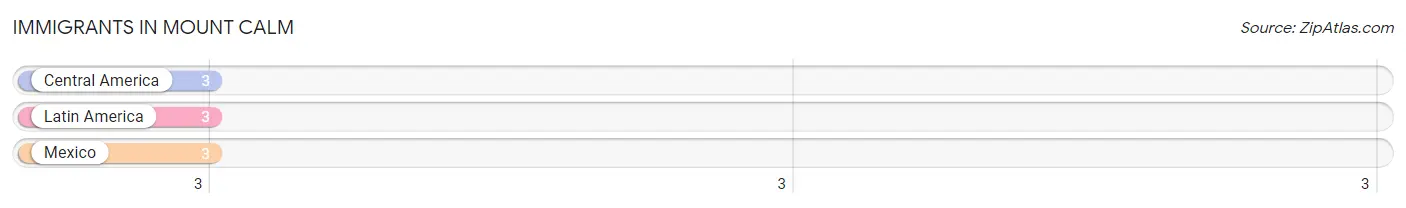
Immigrants in Mount Calm
The most numerous immigrant groups reported in Mount Calm came from Central America (3 | 0.8%), Latin America (3 | 0.8%), and Mexico (3 | 0.8%), together accounting for 2.3% of all Mount Calm residents.
| Immigration Origin | # Population | % Population |
| Central America | 3 | 0.8% |
| Latin America | 3 | 0.8% |
| Mexico | 3 | 0.8% | View All 3 Rows |
Sex and Age in Mount Calm
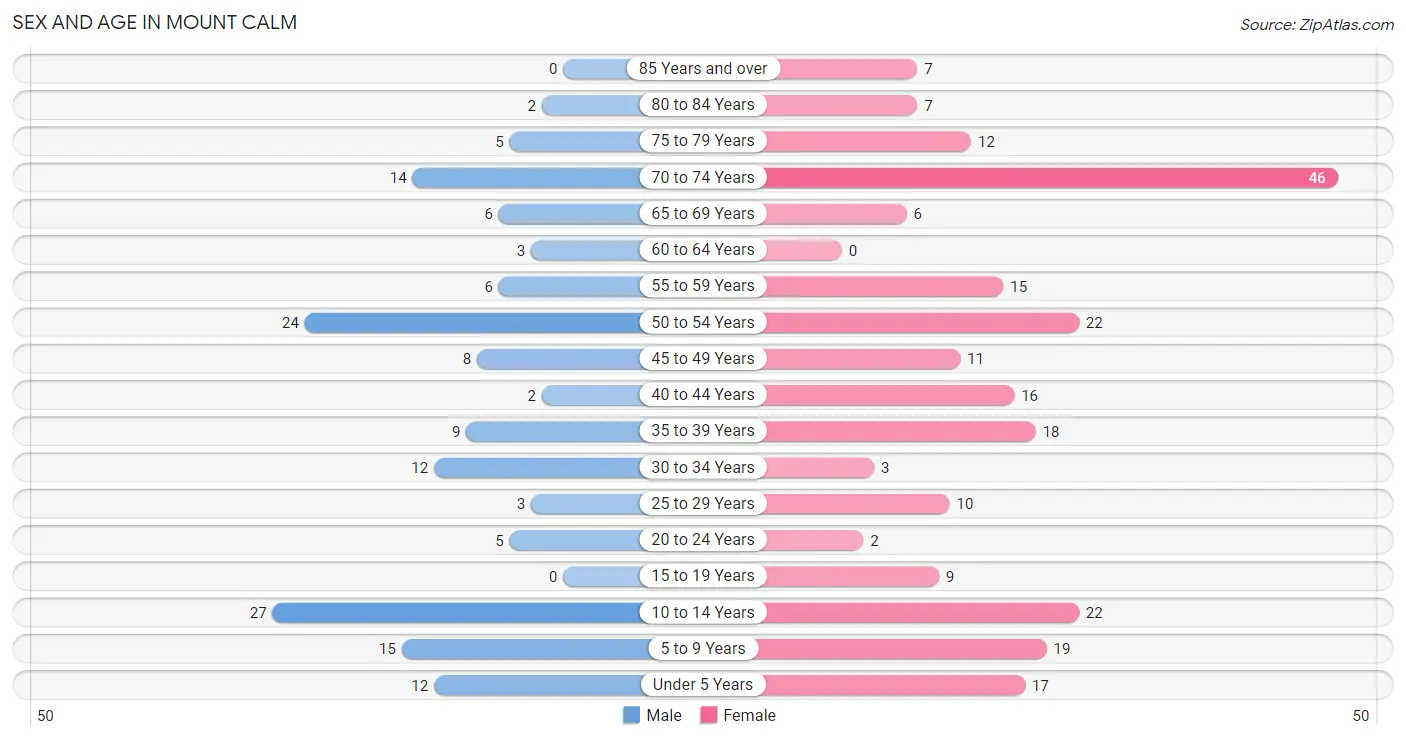
Sex and Age in Mount Calm
The most populous age groups in Mount Calm are 10 to 14 Years (27 | 17.6%) for men and 70 to 74 Years (46 | 19.0%) for women.
| Age Bracket | Male | Female |
| Under 5 Years | 12 (7.8%) | 17 (7.0%) |
| 5 to 9 Years | 15 (9.8%) | 19 (7.9%) |
| 10 to 14 Years | 27 (17.6%) | 22 (9.1%) |
| 15 to 19 Years | 0 (0.0%) | 9 (3.7%) |
| 20 to 24 Years | 5 (3.3%) | 2 (0.8%) |
| 25 to 29 Years | 3 (2.0%) | 10 (4.1%) |
| 30 to 34 Years | 12 (7.8%) | 3 (1.2%) |
| 35 to 39 Years | 9 (5.9%) | 18 (7.4%) |
| 40 to 44 Years | 2 (1.3%) | 16 (6.6%) |
| 45 to 49 Years | 8 (5.2%) | 11 (4.5%) |
| 50 to 54 Years | 24 (15.7%) | 22 (9.1%) |
| 55 to 59 Years | 6 (3.9%) | 15 (6.2%) |
| 60 to 64 Years | 3 (2.0%) | 0 (0.0%) |
| 65 to 69 Years | 6 (3.9%) | 6 (2.5%) |
| 70 to 74 Years | 14 (9.1%) | 46 (19.0%) |
| 75 to 79 Years | 5 (3.3%) | 12 (5.0%) |
| 80 to 84 Years | 2 (1.3%) | 7 (2.9%) |
| 85 Years and over | 0 (0.0%) | 7 (2.9%) |
| Total | 153 (100.0%) | 242 (100.0%) |
Families and Households in Mount Calm
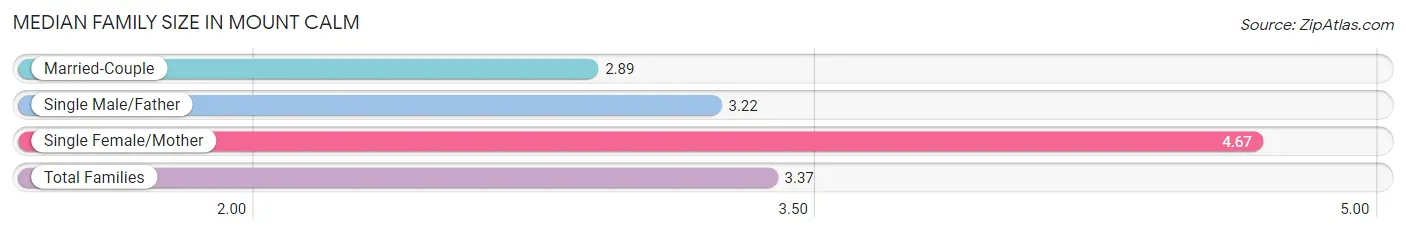
Median Family Size in Mount Calm
The median family size in Mount Calm is 3.37 persons per family, with single female/mother families (24 | 25.3%) accounting for the largest median family size of 4.67 persons per family. On the other hand, married-couple families (62 | 65.3%) represent the smallest median family size with 2.89 persons per family.
| Family Type | # Families | Family Size |
| Married-Couple | 62 (65.3%) | 2.89 |
| Single Male/Father | 9 (9.5%) | 3.22 |
| Single Female/Mother | 24 (25.3%) | 4.67 |
| Total Families | 95 (100.0%) | 3.37 |
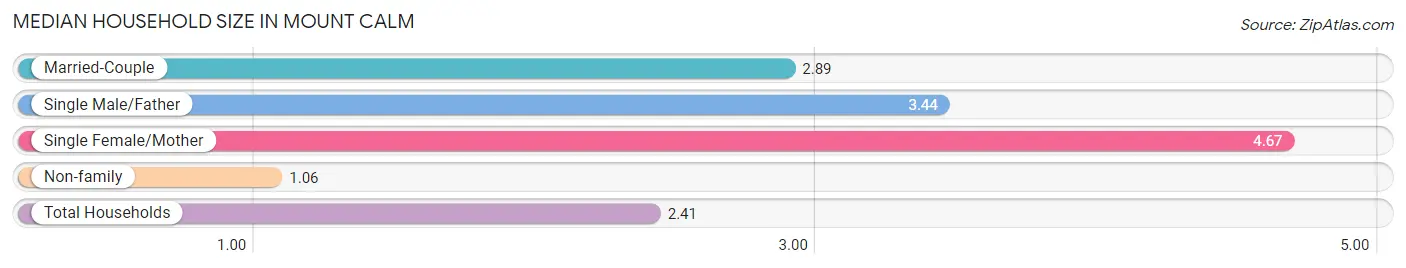
Median Household Size in Mount Calm
The median household size in Mount Calm is 2.41 persons per household, with single female/mother households (24 | 14.6%) accounting for the largest median household size of 4.67 persons per household. non-family households (69 | 42.1%) represent the smallest median household size with 1.06 persons per household.
| Household Type | # Households | Household Size |
| Married-Couple | 62 (37.8%) | 2.89 |
| Single Male/Father | 9 (5.5%) | 3.44 |
| Single Female/Mother | 24 (14.6%) | 4.67 |
| Non-family | 69 (42.1%) | 1.06 |
| Total Households | 164 (100.0%) | 2.41 |
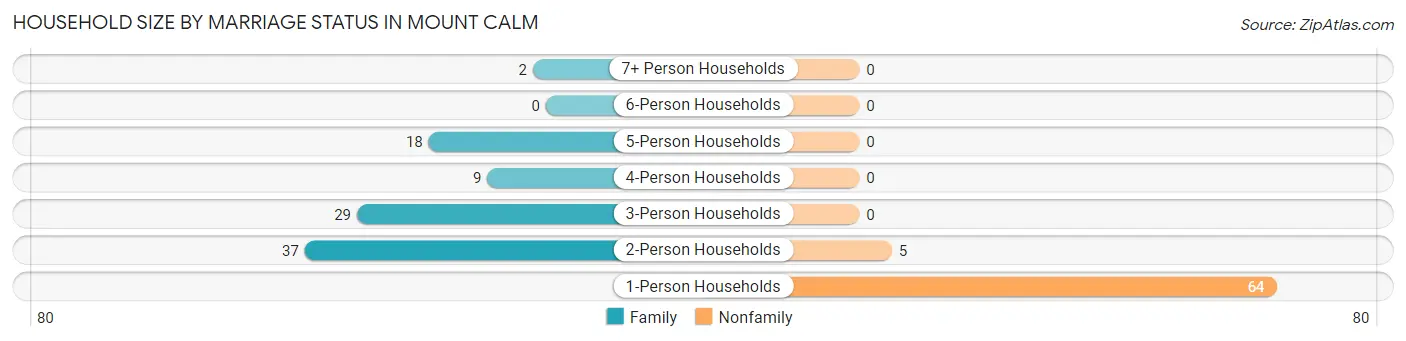
Household Size by Marriage Status in Mount Calm
Out of a total of 164 households in Mount Calm, 95 (57.9%) are family households, while 69 (42.1%) are nonfamily households. The most numerous type of family households are 2-person households, comprising 37, and the most common type of nonfamily households are 1-person households, comprising 64.
| Household Size | Family Households | Nonfamily Households |
| 1-Person Households | - | 64 (39.0%) |
| 2-Person Households | 37 (22.6%) | 5 (3.0%) |
| 3-Person Households | 29 (17.7%) | 0 (0.0%) |
| 4-Person Households | 9 (5.5%) | 0 (0.0%) |
| 5-Person Households | 18 (11.0%) | 0 (0.0%) |
| 6-Person Households | 0 (0.0%) | 0 (0.0%) |
| 7+ Person Households | 2 (1.2%) | 0 (0.0%) |
| Total | 95 (57.9%) | 69 (42.1%) |
Female Fertility in Mount Calm
Fertility by Age in Mount Calm
Average fertility rate in Mount Calm is 130.0 births per 1,000 women. Women in the age bracket of 35 to 50 years have the highest fertility rate with 200.0 births per 1,000 women. Women in the age bracket of 35 to 50 years acount for 100.0% of all women with births.
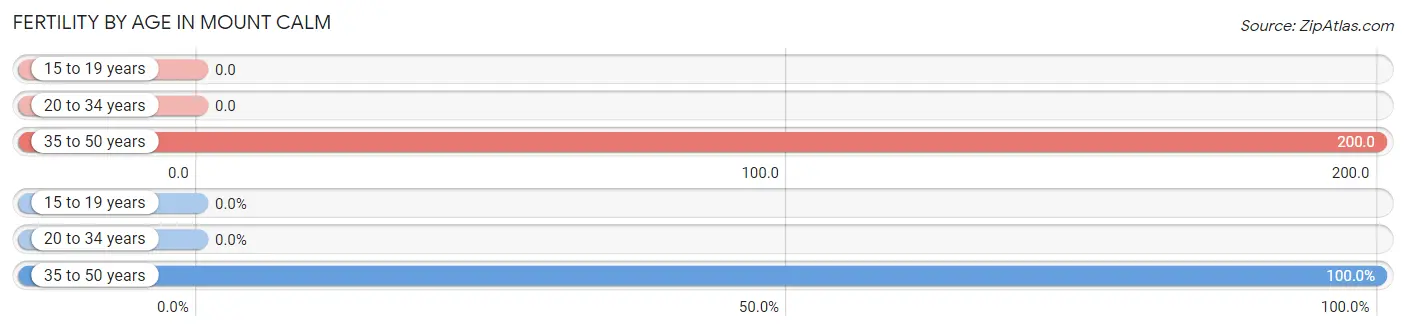
| Age Bracket | Women with Births | Births / 1,000 Women |
| 15 to 19 years | 0 (0.0%) | 0.0 |
| 20 to 34 years | 0 (0.0%) | 0.0 |
| 35 to 50 years | 9 (100.0%) | 200.0 |
| Total | 9 (100.0%) | 130.0 |
Fertility by Age by Marriage Status in Mount Calm
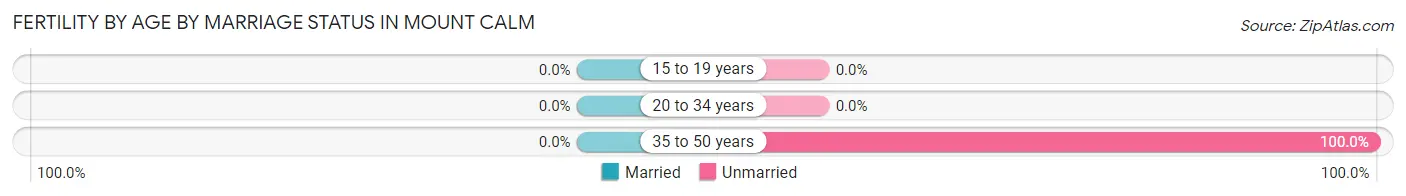
| Age Bracket | Married | Unmarried |
| 15 to 19 years | 0 (0.0%) | 0 (0.0%) |
| 20 to 34 years | 0 (0.0%) | 0 (0.0%) |
| 35 to 50 years | 0 (0.0%) | 9 (100.0%) |
| Total | 0 (0.0%) | 9 (100.0%) |
Fertility by Education in Mount Calm
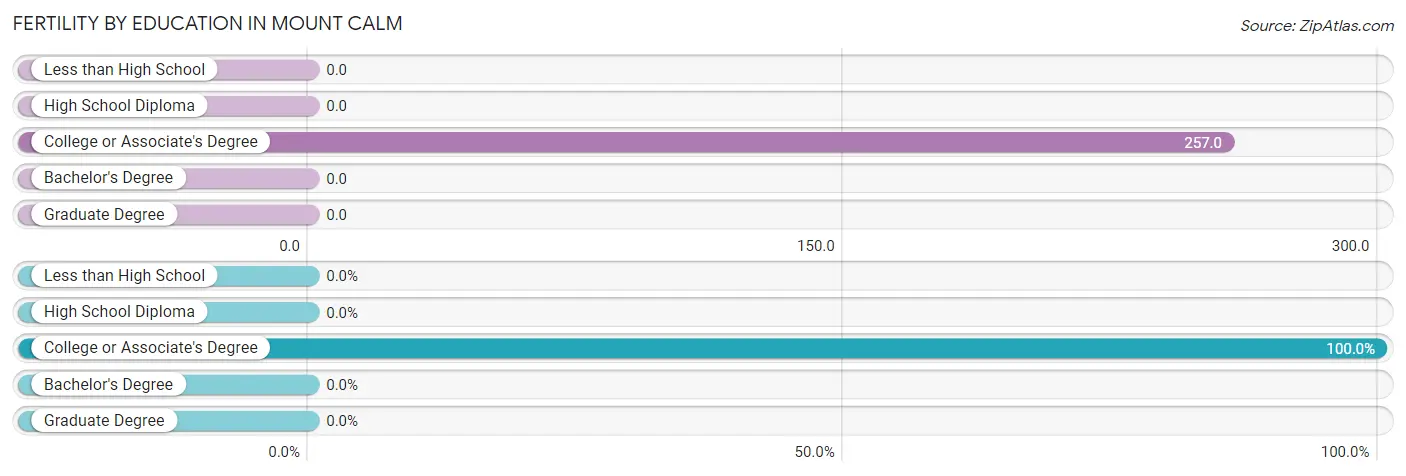
| Educational Attainment | Women with Births | Births / 1,000 Women |
| Less than High School | 0 (0.0%) | 0.0 |
| High School Diploma | 0 (0.0%) | 0.0 |
| College or Associate's Degree | 9 (100.0%) | 257.0 |
| Bachelor's Degree | 0 (0.0%) | 0.0 |
| Graduate Degree | 0 (0.0%) | 0.0 |
| Total | 9 (100.0%) | 130.0 |
Fertility by Education by Marriage Status in Mount Calm
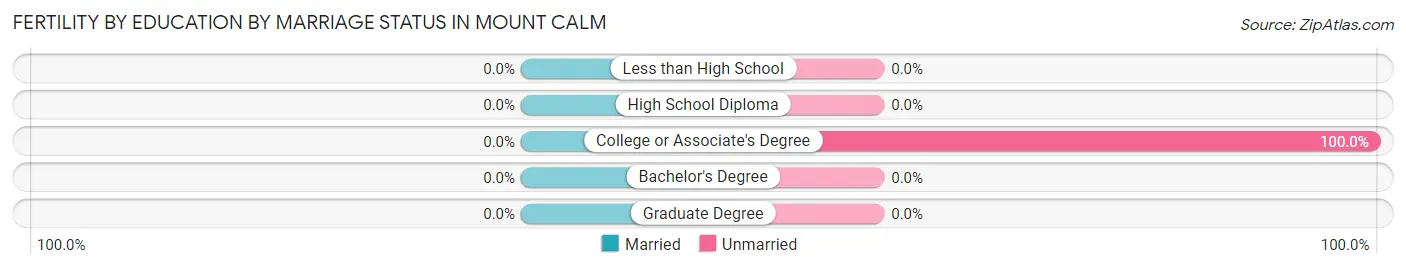
| Educational Attainment | Married | Unmarried |
| Less than High School | 0 (0.0%) | 0 (0.0%) |
| High School Diploma | 0 (0.0%) | 0 (0.0%) |
| College or Associate's Degree | 0 (0.0%) | 9 (100.0%) |
| Bachelor's Degree | 0 (0.0%) | 0 (0.0%) |
| Graduate Degree | 0 (0.0%) | 0 (0.0%) |
| Total | 0 (0.0%) | 9 (100.0%) |
Income in Mount Calm
Income Overview in Mount Calm
Per Capita Income in Mount Calm is $24,025, while median incomes of families and households are $60,536 and $47,083 respectively.
| Characteristic | Number | Measure |
| Per Capita Income | 395 | $24,025 |
| Median Family Income | 95 | $60,536 |
| Mean Family Income | 95 | $69,643 |
| Median Household Income | 164 | $47,083 |
| Mean Household Income | 164 | $60,127 |
| Income Deficit | 95 | $0 |
| Wage / Income Gap (%) | 395 | 36.80% |
| Wage / Income Gap ($) | 395 | 63.20¢ per $1 |
| Gini / Inequality Index | 395 | 0.36 |
Earnings by Sex in Mount Calm
Average Earnings in Mount Calm are $35,893, $45,417 for men and $28,704 for women, a difference of 36.8%.
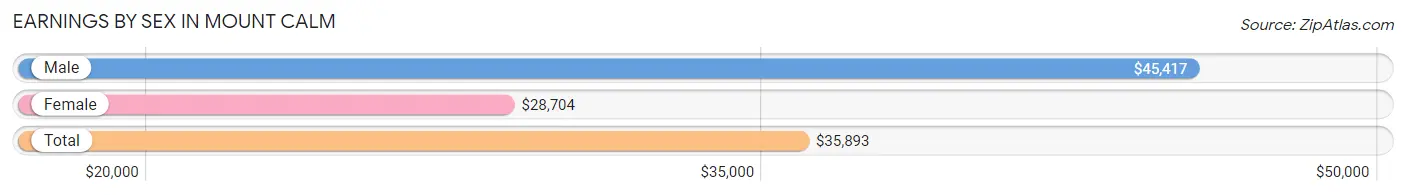
| Sex | Number | Average Earnings |
| Male | 71 (44.1%) | $45,417 |
| Female | 90 (55.9%) | $28,704 |
| Total | 161 (100.0%) | $35,893 |
Earnings by Sex by Income Bracket in Mount Calm
The most common earnings brackets in Mount Calm are $45,000 to $49,999 for men (14 | 19.7%) and $25,000 to $29,999 for women (29 | 32.2%).
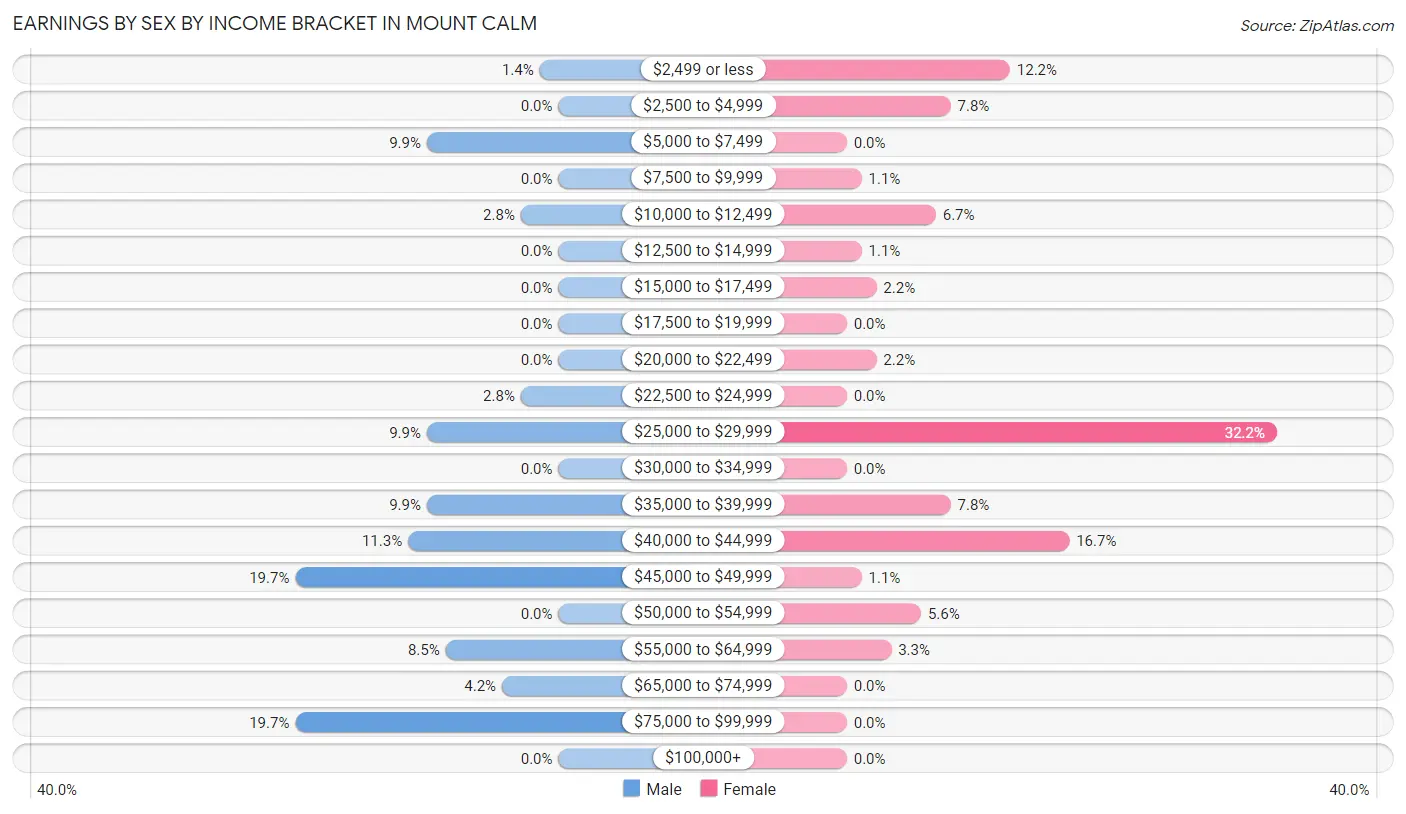
| Income | Male | Female |
| $2,499 or less | 1 (1.4%) | 11 (12.2%) |
| $2,500 to $4,999 | 0 (0.0%) | 7 (7.8%) |
| $5,000 to $7,499 | 7 (9.9%) | 0 (0.0%) |
| $7,500 to $9,999 | 0 (0.0%) | 1 (1.1%) |
| $10,000 to $12,499 | 2 (2.8%) | 6 (6.7%) |
| $12,500 to $14,999 | 0 (0.0%) | 1 (1.1%) |
| $15,000 to $17,499 | 0 (0.0%) | 2 (2.2%) |
| $17,500 to $19,999 | 0 (0.0%) | 0 (0.0%) |
| $20,000 to $22,499 | 0 (0.0%) | 2 (2.2%) |
| $22,500 to $24,999 | 2 (2.8%) | 0 (0.0%) |
| $25,000 to $29,999 | 7 (9.9%) | 29 (32.2%) |
| $30,000 to $34,999 | 0 (0.0%) | 0 (0.0%) |
| $35,000 to $39,999 | 7 (9.9%) | 7 (7.8%) |
| $40,000 to $44,999 | 8 (11.3%) | 15 (16.7%) |
| $45,000 to $49,999 | 14 (19.7%) | 1 (1.1%) |
| $50,000 to $54,999 | 0 (0.0%) | 5 (5.6%) |
| $55,000 to $64,999 | 6 (8.5%) | 3 (3.3%) |
| $65,000 to $74,999 | 3 (4.2%) | 0 (0.0%) |
| $75,000 to $99,999 | 14 (19.7%) | 0 (0.0%) |
| $100,000+ | 0 (0.0%) | 0 (0.0%) |
| Total | 71 (100.0%) | 90 (100.0%) |
Earnings by Sex by Educational Attainment in Mount Calm
Average earnings in Mount Calm are $45,694 for men and $28,796 for women, a difference of 37.0%. Men with an educational attainment of college or associate's degree enjoy the highest average annual earnings of $64,375, while those with high school diploma education earn the least with $28,750. Women with an educational attainment of high school diploma earn the most with the average annual earnings of $37,679, while those with college or associate's degree education have the smallest earnings of $28,472.
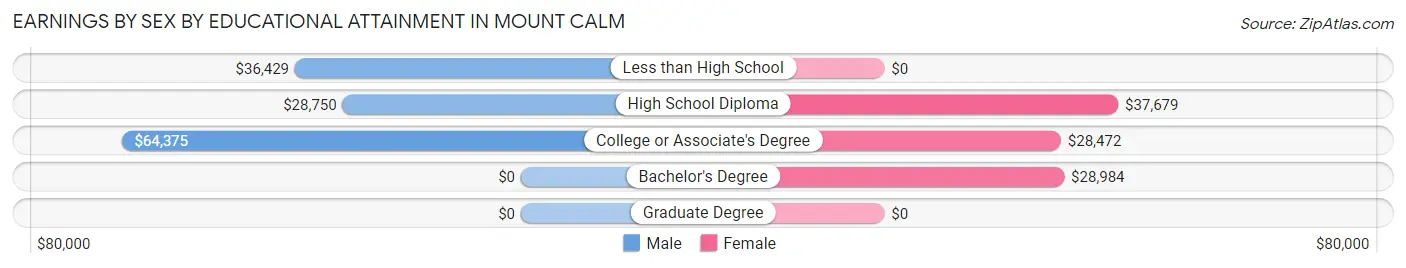
| Educational Attainment | Male Income | Female Income |
| Less than High School | $36,429 | $0 |
| High School Diploma | $28,750 | $37,679 |
| College or Associate's Degree | $64,375 | $28,472 |
| Bachelor's Degree | - | - |
| Graduate Degree | - | - |
| Total | $45,694 | $28,796 |
Family Income in Mount Calm
Family Income Brackets in Mount Calm
According to the Mount Calm family income data, there are 23 families falling into the $50,000 to $74,999 income range, which is the most common income bracket and makes up 24.2% of all families.
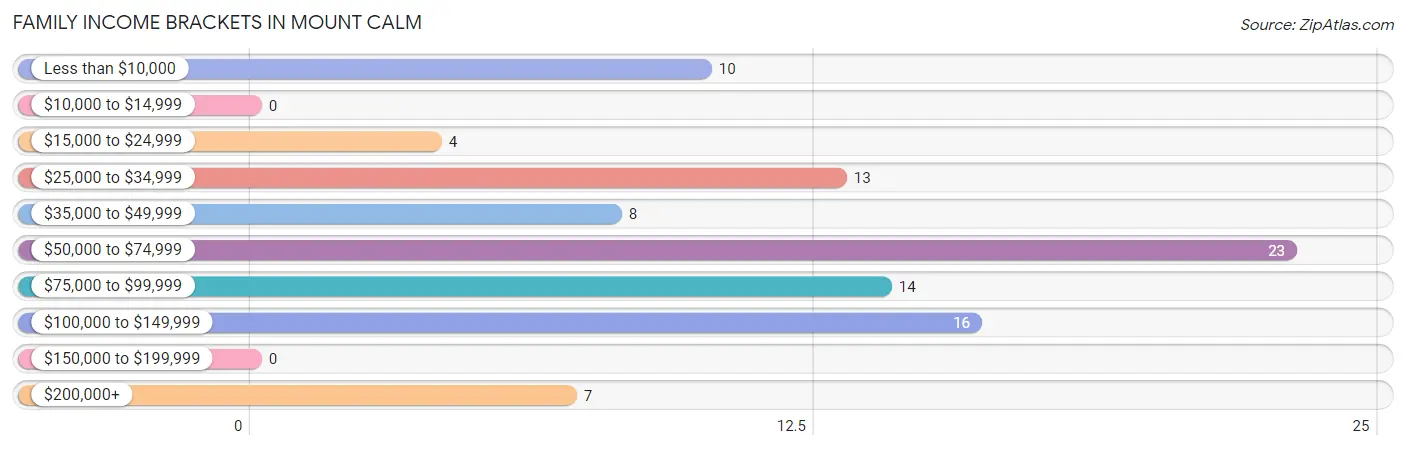
| Income Bracket | # Families | % Families |
| Less than $10,000 | 10 | 10.5% |
| $10,000 to $14,999 | 0 | 0.0% |
| $15,000 to $24,999 | 4 | 4.2% |
| $25,000 to $34,999 | 13 | 13.7% |
| $35,000 to $49,999 | 8 | 8.4% |
| $50,000 to $74,999 | 23 | 24.2% |
| $75,000 to $99,999 | 14 | 14.7% |
| $100,000 to $149,999 | 16 | 16.8% |
| $150,000 to $199,999 | 0 | 0.0% |
| $200,000+ | 7 | 7.4% |
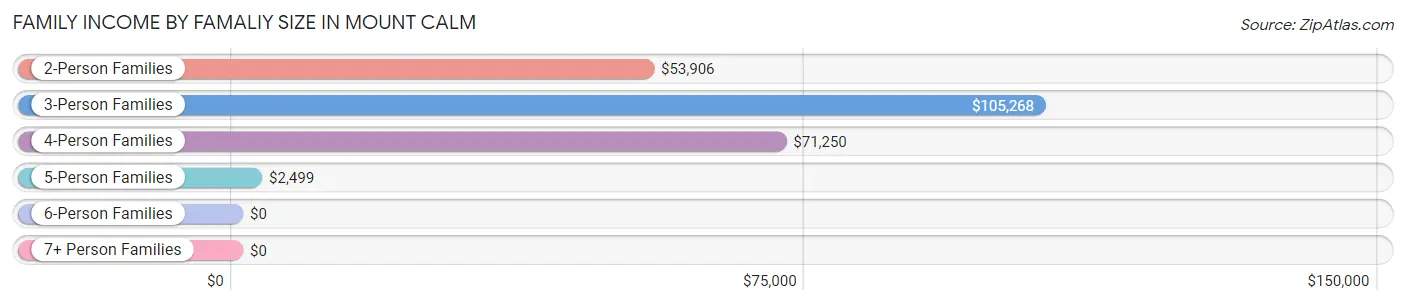
Family Income by Famaliy Size in Mount Calm
3-person families (29 | 30.5%) account for the highest median family income in Mount Calm with $105,268 per family, while 3-person families (29 | 30.5%) have the highest median income of $35,089 per family member.
| Income Bracket | # Families | Median Income |
| 2-Person Families | 37 (39.0%) | $53,906 |
| 3-Person Families | 29 (30.5%) | $105,268 |
| 4-Person Families | 10 (10.5%) | $71,250 |
| 5-Person Families | 17 (17.9%) | $2,499 |
| 6-Person Families | 0 (0.0%) | $0 |
| 7+ Person Families | 2 (2.1%) | $0 |
| Total | 95 (100.0%) | $60,536 |
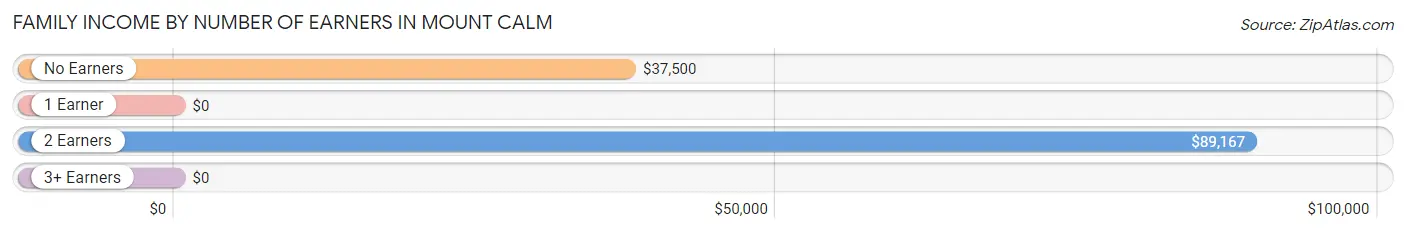
Family Income by Number of Earners in Mount Calm
| Number of Earners | # Families | Median Income |
| No Earners | 14 (14.7%) | $37,500 |
| 1 Earner | 31 (32.6%) | $0 |
| 2 Earners | 48 (50.5%) | $89,167 |
| 3+ Earners | 2 (2.1%) | $0 |
| Total | 95 (100.0%) | $60,536 |
Household Income in Mount Calm
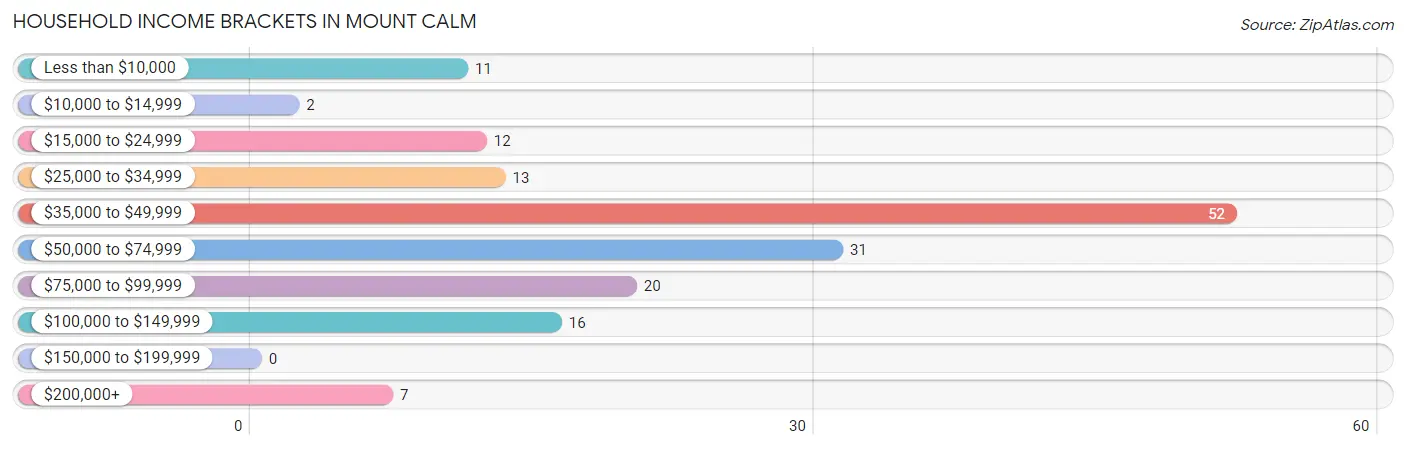
Household Income Brackets in Mount Calm
With 52 households falling in the category, the $35,000 to $49,999 income range is the most frequent in Mount Calm, accounting for 31.7% of all households.
| Income Bracket | # Households | % Households |
| Less than $10,000 | 11 | 6.7% |
| $10,000 to $14,999 | 2 | 1.2% |
| $15,000 to $24,999 | 12 | 7.3% |
| $25,000 to $34,999 | 13 | 7.9% |
| $35,000 to $49,999 | 52 | 31.7% |
| $50,000 to $74,999 | 31 | 18.9% |
| $75,000 to $99,999 | 20 | 12.2% |
| $100,000 to $149,999 | 16 | 9.8% |
| $150,000 to $199,999 | 0 | 0.0% |
| $200,000+ | 7 | 4.3% |
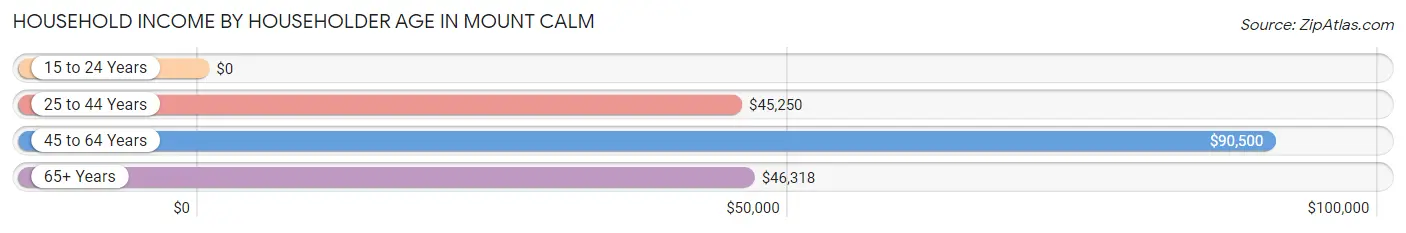
Household Income by Householder Age in Mount Calm
The median household income in Mount Calm is $47,083, with the highest median household income of $90,500 found in the 45 to 64 years age bracket for the primary householder. A total of 46 households (28.1%) fall into this category.
| Income Bracket | # Households | Median Income |
| 15 to 24 Years | 0 (0.0%) | $0 |
| 25 to 44 Years | 41 (25.0%) | $45,250 |
| 45 to 64 Years | 46 (28.1%) | $90,500 |
| 65+ Years | 77 (46.9%) | $46,318 |
| Total | 164 (100.0%) | $47,083 |
Poverty in Mount Calm
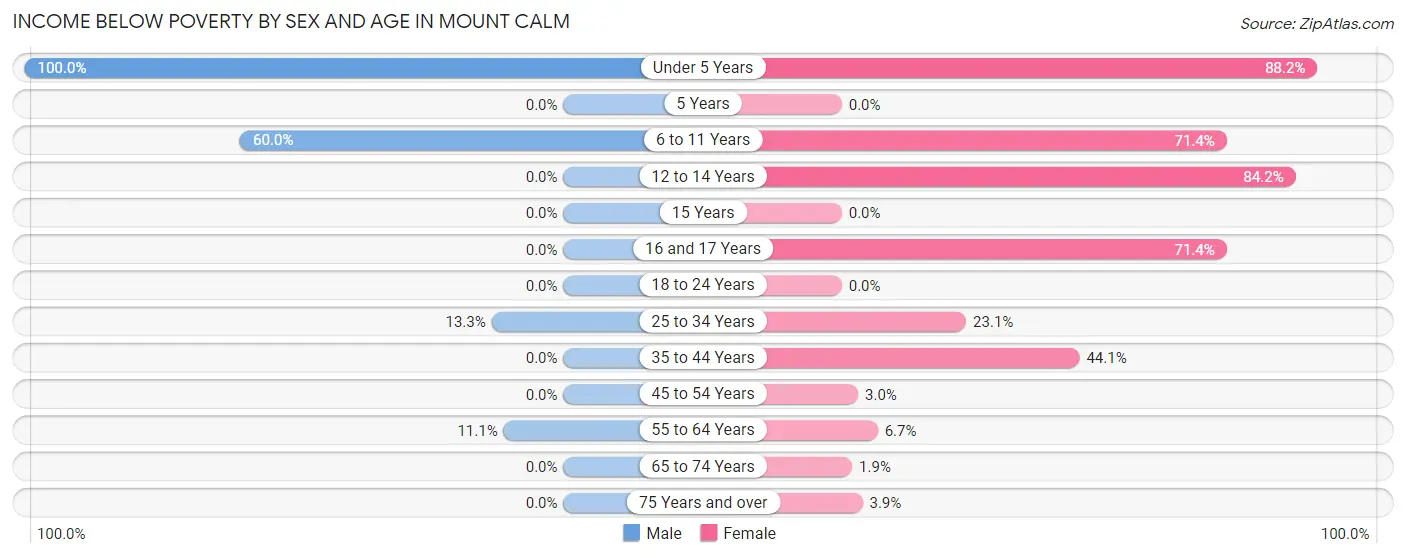
Income Below Poverty by Sex and Age in Mount Calm
With 17.6% poverty level for males and 30.2% for females among the residents of Mount Calm, under 5 year old males and under 5 year old females are the most vulnerable to poverty, with 12 males (100.0%) and 15 females (88.2%) in their respective age groups living below the poverty level.
| Age Bracket | Male | Female |
| Under 5 Years | 12 (100.0%) | 15 (88.2%) |
| 5 Years | 0 (0.0%) | 0 (0.0%) |
| 6 to 11 Years | 12 (60.0%) | 15 (71.4%) |
| 12 to 14 Years | 0 (0.0%) | 16 (84.2%) |
| 15 Years | 0 (0.0%) | 0 (0.0%) |
| 16 and 17 Years | 0 (0.0%) | 5 (71.4%) |
| 18 to 24 Years | 0 (0.0%) | 0 (0.0%) |
| 25 to 34 Years | 2 (13.3%) | 3 (23.1%) |
| 35 to 44 Years | 0 (0.0%) | 15 (44.1%) |
| 45 to 54 Years | 0 (0.0%) | 1 (3.0%) |
| 55 to 64 Years | 1 (11.1%) | 1 (6.7%) |
| 65 to 74 Years | 0 (0.0%) | 1 (1.9%) |
| 75 Years and over | 0 (0.0%) | 1 (3.8%) |
| Total | 27 (17.6%) | 73 (30.2%) |
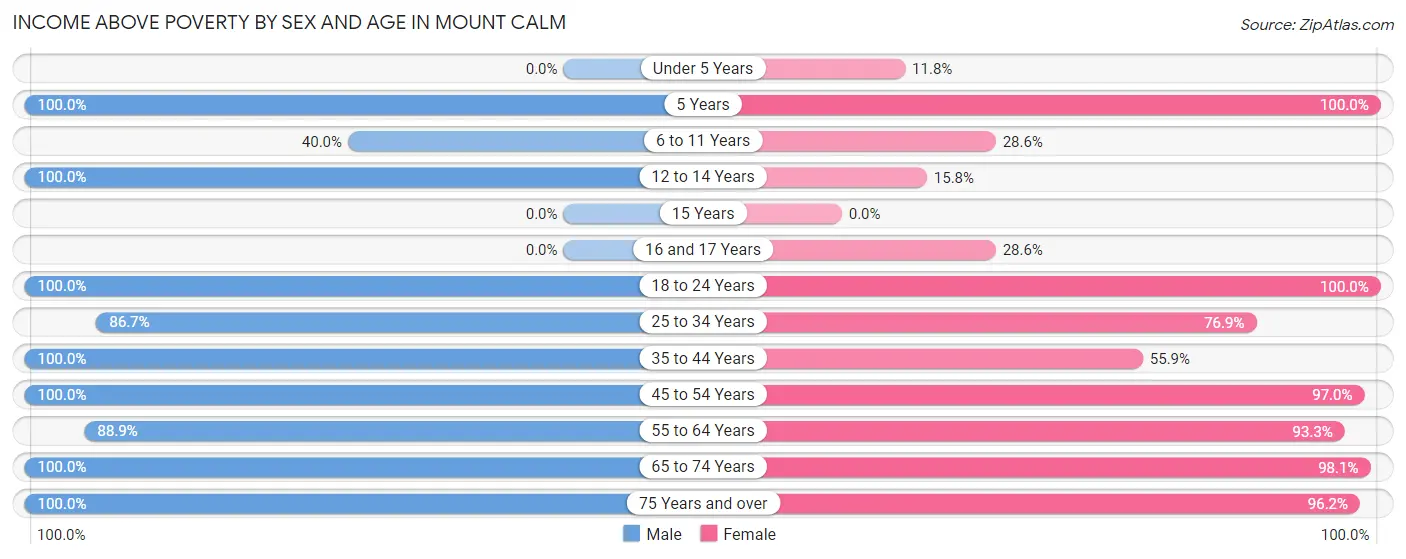
Income Above Poverty by Sex and Age in Mount Calm
According to the poverty statistics in Mount Calm, males aged 5 years and females aged 5 years are the age groups that are most secure financially, with 100.0% of males and 100.0% of females in these age groups living above the poverty line.
| Age Bracket | Male | Female |
| Under 5 Years | 0 (0.0%) | 2 (11.8%) |
| 5 Years | 4 (100.0%) | 1 (100.0%) |
| 6 to 11 Years | 8 (40.0%) | 6 (28.6%) |
| 12 to 14 Years | 18 (100.0%) | 3 (15.8%) |
| 15 Years | 0 (0.0%) | 0 (0.0%) |
| 16 and 17 Years | 0 (0.0%) | 2 (28.6%) |
| 18 to 24 Years | 5 (100.0%) | 4 (100.0%) |
| 25 to 34 Years | 13 (86.7%) | 10 (76.9%) |
| 35 to 44 Years | 11 (100.0%) | 19 (55.9%) |
| 45 to 54 Years | 32 (100.0%) | 32 (97.0%) |
| 55 to 64 Years | 8 (88.9%) | 14 (93.3%) |
| 65 to 74 Years | 20 (100.0%) | 51 (98.1%) |
| 75 Years and over | 7 (100.0%) | 25 (96.2%) |
| Total | 126 (82.4%) | 169 (69.8%) |
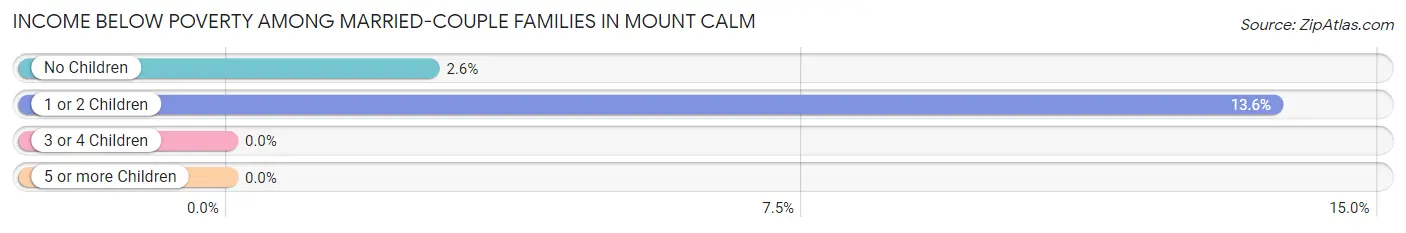
Income Below Poverty Among Married-Couple Families in Mount Calm
The poverty statistics for married-couple families in Mount Calm show that 6.5% or 4 of the total 62 families live below the poverty line. Families with 1 or 2 children have the highest poverty rate of 13.6%, comprising of 3 families. On the other hand, families with 5 or more children have the lowest poverty rate of 0.0%, which includes 0 families.
| Children | Above Poverty | Below Poverty |
| No Children | 37 (97.4%) | 1 (2.6%) |
| 1 or 2 Children | 19 (86.4%) | 3 (13.6%) |
| 3 or 4 Children | 0 (0.0%) | 0 (0.0%) |
| 5 or more Children | 2 (100.0%) | 0 (0.0%) |
| Total | 58 (93.5%) | 4 (6.5%) |
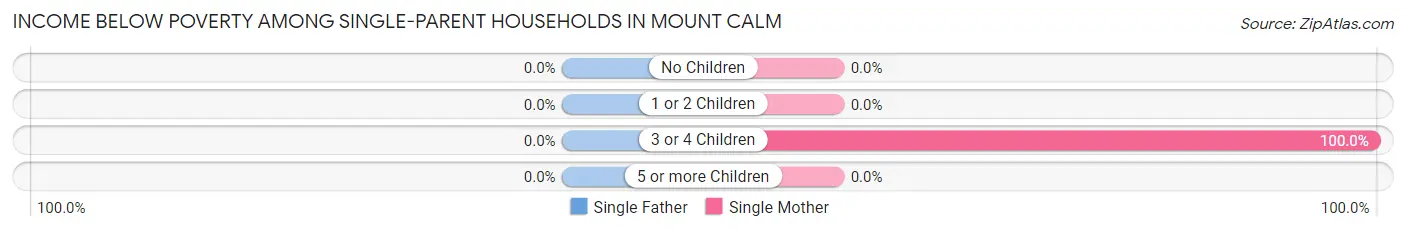
Income Below Poverty Among Single-Parent Households in Mount Calm
| Children | Single Father | Single Mother |
| No Children | 0 (0.0%) | 0 (0.0%) |
| 1 or 2 Children | 0 (0.0%) | 0 (0.0%) |
| 3 or 4 Children | 0 (0.0%) | 15 (100.0%) |
| 5 or more Children | 0 (0.0%) | 0 (0.0%) |
| Total | 0 (0.0%) | 15 (62.5%) |
Income Below Poverty Among Married-Couple vs Single-Parent Households in Mount Calm
The poverty data for Mount Calm shows that 4 of the married-couple family households (6.5%) and 15 of the single-parent households (45.5%) are living below the poverty level. Within the married-couple family households, those with 1 or 2 children have the highest poverty rate, with 3 households (13.6%) falling below the poverty line. Among the single-parent households, those with 3 or 4 children have the highest poverty rate, with 15 household (100.0%) living below poverty.
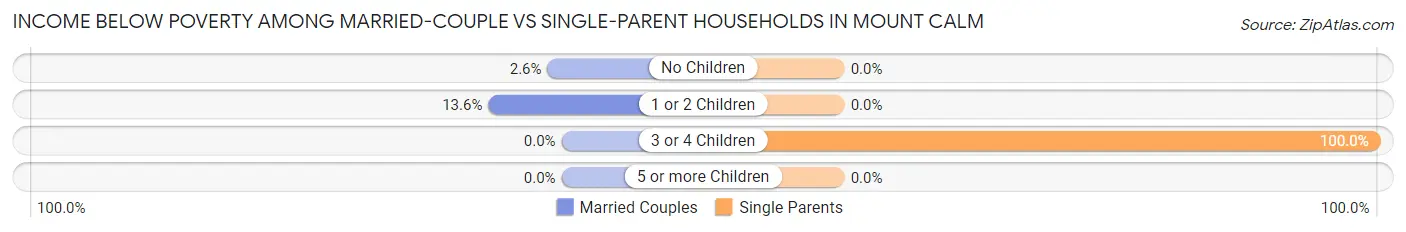
| Children | Married-Couple Families | Single-Parent Households |
| No Children | 1 (2.6%) | 0 (0.0%) |
| 1 or 2 Children | 3 (13.6%) | 0 (0.0%) |
| 3 or 4 Children | 0 (0.0%) | 15 (100.0%) |
| 5 or more Children | 0 (0.0%) | 0 (0.0%) |
| Total | 4 (6.5%) | 15 (45.5%) |
Employment Characteristics in Mount Calm
Employment by Class of Employer in Mount Calm
Among the 158 employed individuals in Mount Calm, private company employees (72 | 45.6%), state government employees (53 | 33.5%), and local government employees (14 | 8.9%) make up the most common classes of employment.
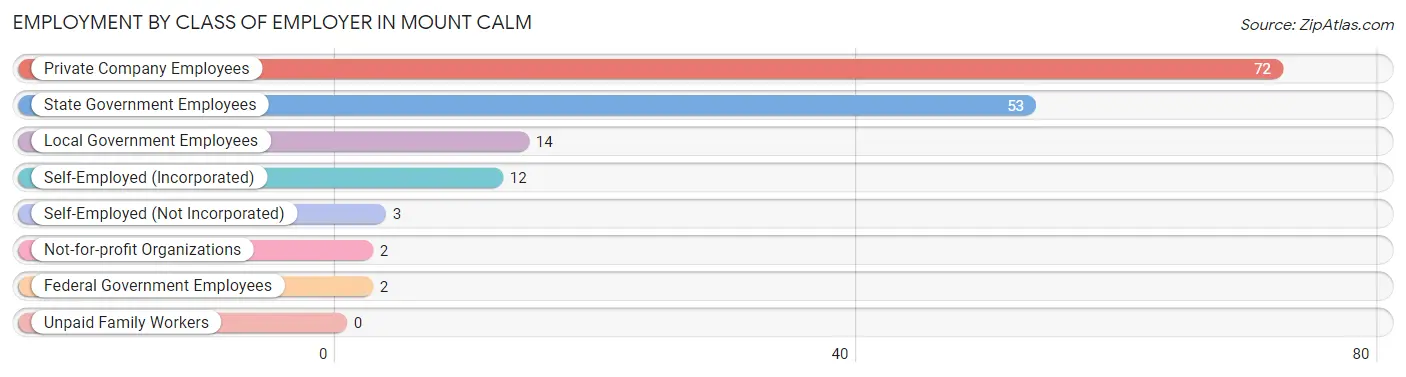
| Employer Class | # Employees | % Employees |
| Private Company Employees | 72 | 45.6% |
| Self-Employed (Incorporated) | 12 | 7.6% |
| Self-Employed (Not Incorporated) | 3 | 1.9% |
| Not-for-profit Organizations | 2 | 1.3% |
| Local Government Employees | 14 | 8.9% |
| State Government Employees | 53 | 33.5% |
| Federal Government Employees | 2 | 1.3% |
| Unpaid Family Workers | 0 | 0.0% |
| Total | 158 | 100.0% |
Employment Status by Age in Mount Calm
According to the labor force statistics for Mount Calm, out of the total population over 16 years of age (283), 59.4% or 168 individuals are in the labor force, with 5.4% or 9 of them unemployed. The age group with the highest labor force participation rate is 45 to 54 years, with 98.5% or 64 individuals in the labor force. Within the labor force, the 16 to 19 years age range has the highest percentage of unemployed individuals, with 100.0% or 5 of them being unemployed.
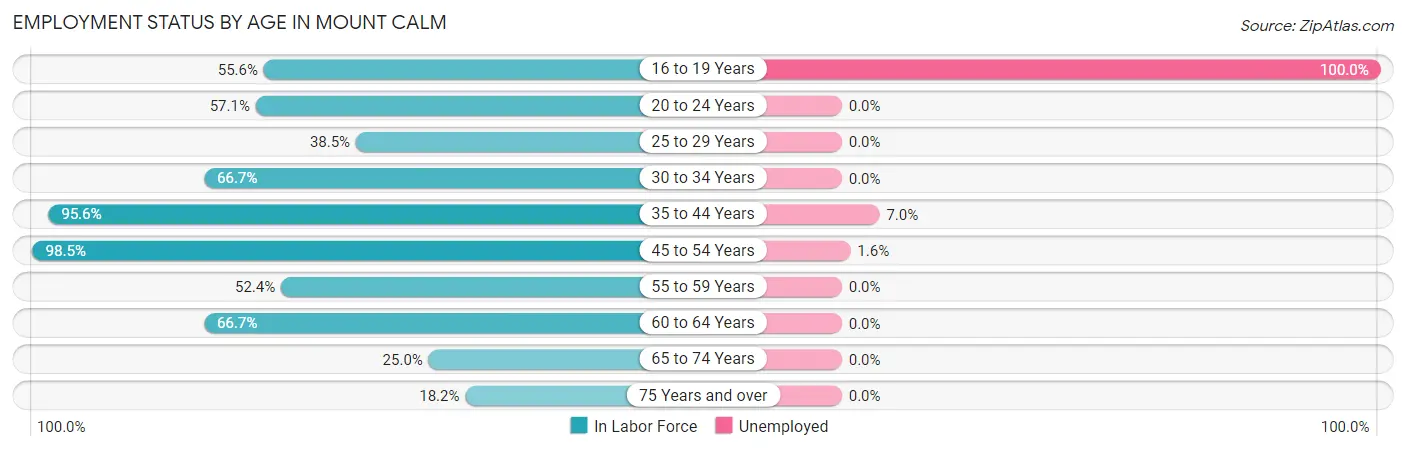
| Age Bracket | In Labor Force | Unemployed |
| 16 to 19 Years | 5 (55.6%) | 5 (100.0%) |
| 20 to 24 Years | 4 (57.1%) | 0 (0.0%) |
| 25 to 29 Years | 5 (38.5%) | 0 (0.0%) |
| 30 to 34 Years | 10 (66.7%) | 0 (0.0%) |
| 35 to 44 Years | 43 (95.6%) | 3 (7.0%) |
| 45 to 54 Years | 64 (98.5%) | 1 (1.6%) |
| 55 to 59 Years | 11 (52.4%) | 0 (0.0%) |
| 60 to 64 Years | 2 (66.7%) | 0 (0.0%) |
| 65 to 74 Years | 18 (25.0%) | 0 (0.0%) |
| 75 Years and over | 6 (18.2%) | 0 (0.0%) |
| Total | 168 (59.4%) | 9 (5.4%) |
Employment Status by Educational Attainment in Mount Calm
According to labor force statistics for Mount Calm, 83.3% of individuals (135) out of the total population between 25 and 64 years of age (162) are in the labor force, with 3.0% or 4 of them being unemployed. The group with the highest labor force participation rate are those with the educational attainment of less than high school, with 100.0% or 16 individuals in the labor force. Within the labor force, individuals with less than high school education have the highest percentage of unemployment, with 6.3% or 1 of them being unemployed.
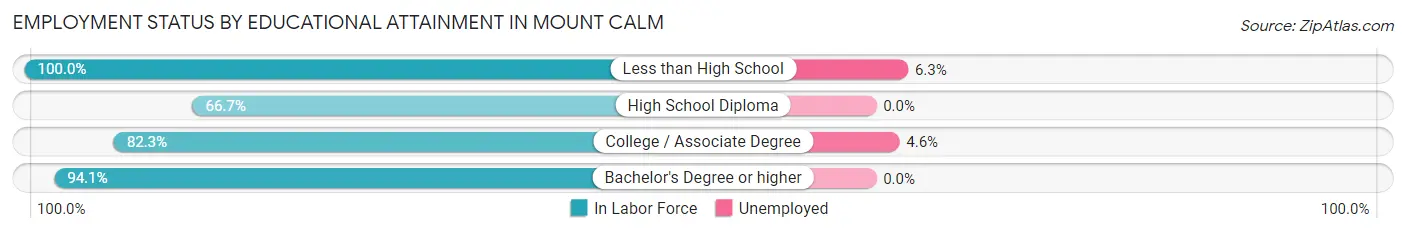
| Educational Attainment | In Labor Force | Unemployed |
| Less than High School | 16 (100.0%) | 1 (6.3%) |
| High School Diploma | 22 (66.7%) | 0 (0.0%) |
| College / Associate Degree | 65 (82.3%) | 4 (4.6%) |
| Bachelor's Degree or higher | 32 (94.1%) | 0 (0.0%) |
| Total | 135 (83.3%) | 5 (3.0%) |
Employment Occupations by Sex in Mount Calm
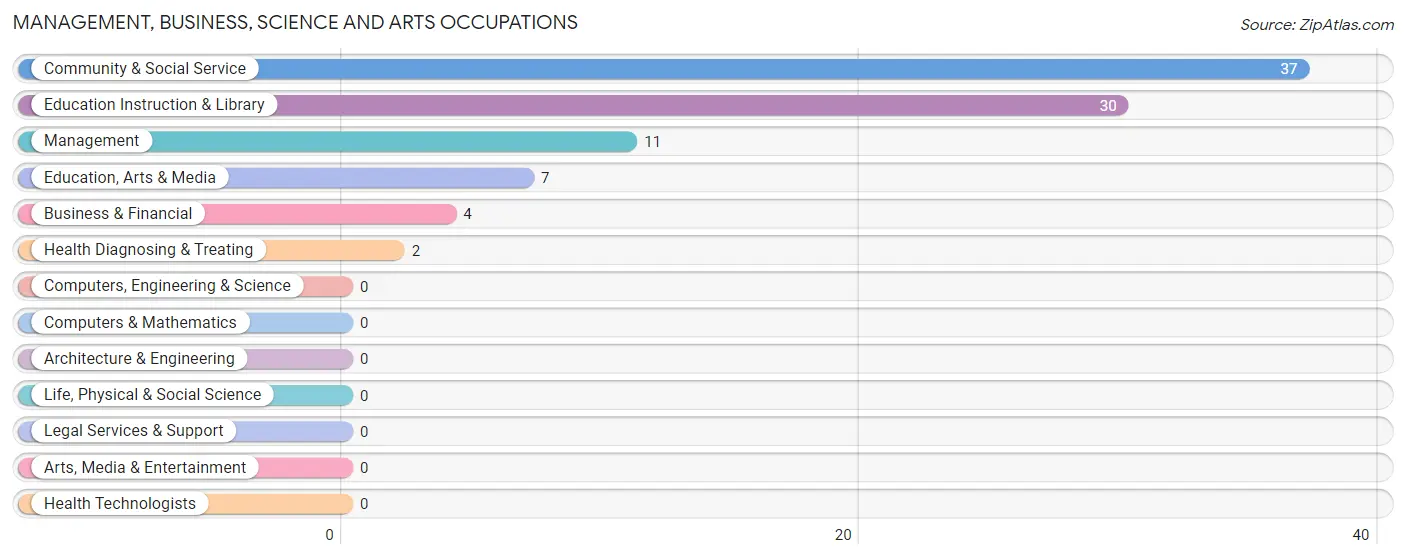
Management, Business, Science and Arts Occupations
The most common Management, Business, Science and Arts occupations in Mount Calm are Community & Social Service (37 | 23.3%), Education Instruction & Library (30 | 18.9%), Management (11 | 6.9%), Education, Arts & Media (7 | 4.4%), and Business & Financial (4 | 2.5%).
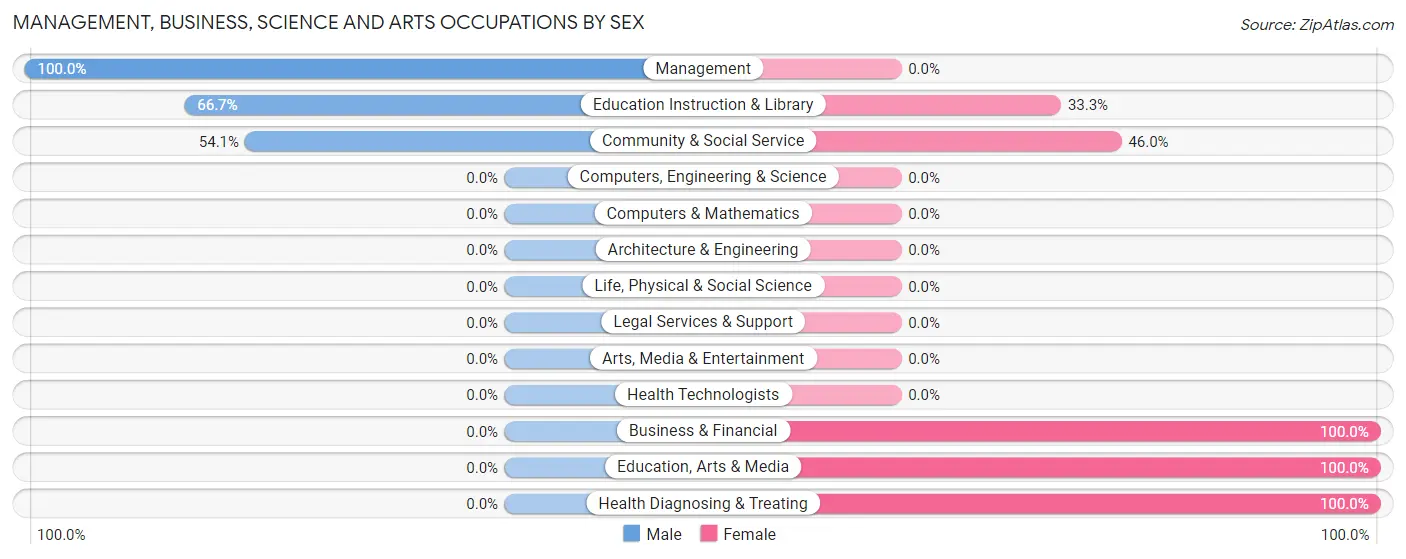
Management, Business, Science and Arts Occupations by Sex
Within the Management, Business, Science and Arts occupations in Mount Calm, the most male-oriented occupations are Management (100.0%), Education Instruction & Library (66.7%), and Community & Social Service (54.0%), while the most female-oriented occupations are Business & Financial (100.0%), Education, Arts & Media (100.0%), and Health Diagnosing & Treating (100.0%).
| Occupation | Male | Female |
| Management | 11 (100.0%) | 0 (0.0%) |
| Business & Financial | 0 (0.0%) | 4 (100.0%) |
| Computers, Engineering & Science | 0 (0.0%) | 0 (0.0%) |
| Computers & Mathematics | 0 (0.0%) | 0 (0.0%) |
| Architecture & Engineering | 0 (0.0%) | 0 (0.0%) |
| Life, Physical & Social Science | 0 (0.0%) | 0 (0.0%) |
| Community & Social Service | 20 (54.0%) | 17 (46.0%) |
| Education, Arts & Media | 0 (0.0%) | 7 (100.0%) |
| Legal Services & Support | 0 (0.0%) | 0 (0.0%) |
| Education Instruction & Library | 20 (66.7%) | 10 (33.3%) |
| Arts, Media & Entertainment | 0 (0.0%) | 0 (0.0%) |
| Health Diagnosing & Treating | 0 (0.0%) | 2 (100.0%) |
| Health Technologists | 0 (0.0%) | 0 (0.0%) |
| Total (Category) | 31 (57.4%) | 23 (42.6%) |
| Total (Overall) | 71 (44.7%) | 88 (55.3%) |
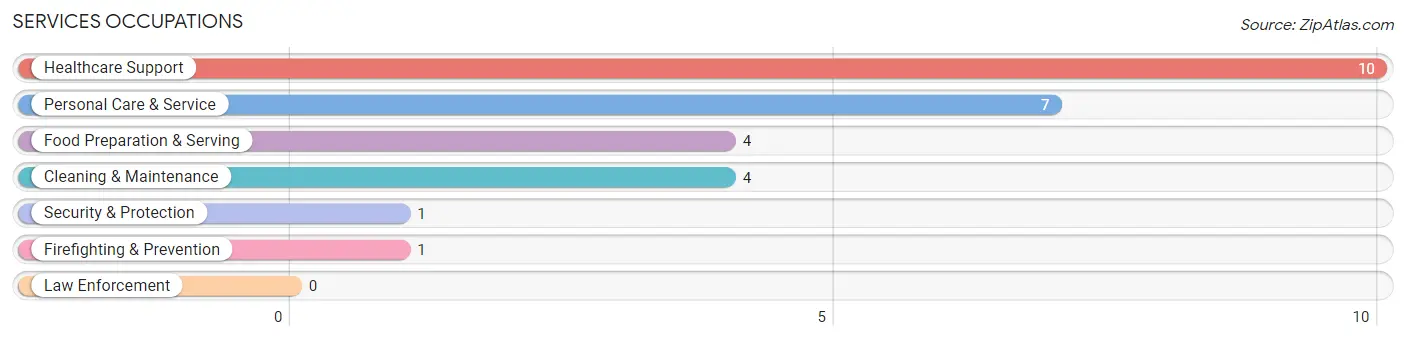
Services Occupations
The most common Services occupations in Mount Calm are Healthcare Support (10 | 6.3%), Personal Care & Service (7 | 4.4%), Food Preparation & Serving (4 | 2.5%), Cleaning & Maintenance (4 | 2.5%), and Security & Protection (1 | 0.6%).
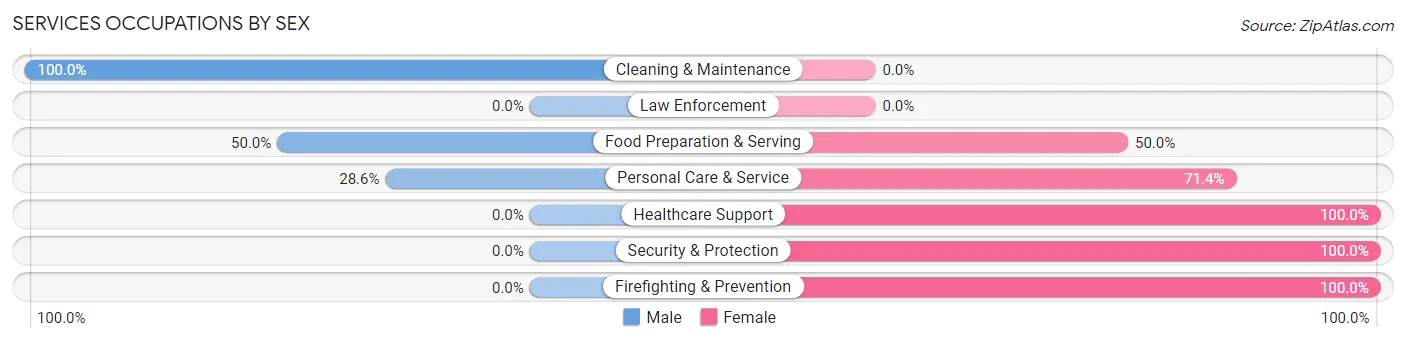
Services Occupations by Sex
Within the Services occupations in Mount Calm, the most male-oriented occupations are Cleaning & Maintenance (100.0%), Food Preparation & Serving (50.0%), and Personal Care & Service (28.6%), while the most female-oriented occupations are Healthcare Support (100.0%), Security & Protection (100.0%), and Firefighting & Prevention (100.0%).
| Occupation | Male | Female |
| Healthcare Support | 0 (0.0%) | 10 (100.0%) |
| Security & Protection | 0 (0.0%) | 1 (100.0%) |
| Firefighting & Prevention | 0 (0.0%) | 1 (100.0%) |
| Law Enforcement | 0 (0.0%) | 0 (0.0%) |
| Food Preparation & Serving | 2 (50.0%) | 2 (50.0%) |
| Cleaning & Maintenance | 4 (100.0%) | 0 (0.0%) |
| Personal Care & Service | 2 (28.6%) | 5 (71.4%) |
| Total (Category) | 8 (30.8%) | 18 (69.2%) |
| Total (Overall) | 71 (44.7%) | 88 (55.3%) |
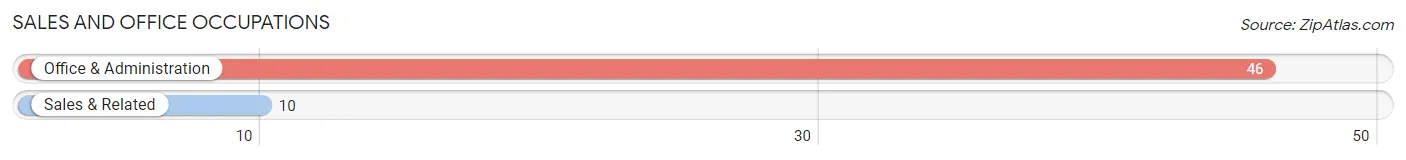
Sales and Office Occupations
The most common Sales and Office occupations in Mount Calm are Office & Administration (46 | 28.9%), and Sales & Related (10 | 6.3%).
Sales and Office Occupations by Sex
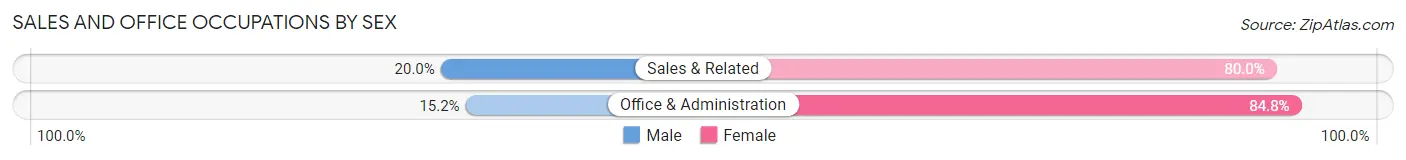
| Occupation | Male | Female |
| Sales & Related | 2 (20.0%) | 8 (80.0%) |
| Office & Administration | 7 (15.2%) | 39 (84.8%) |
| Total (Category) | 9 (16.1%) | 47 (83.9%) |
| Total (Overall) | 71 (44.7%) | 88 (55.3%) |
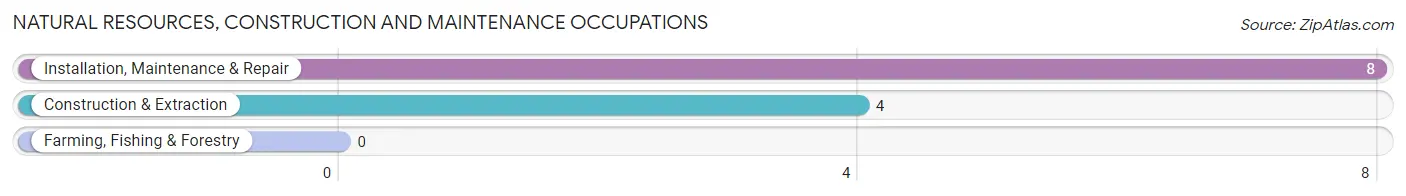
Natural Resources, Construction and Maintenance Occupations
The most common Natural Resources, Construction and Maintenance occupations in Mount Calm are Installation, Maintenance & Repair (8 | 5.0%), and Construction & Extraction (4 | 2.5%).
Natural Resources, Construction and Maintenance Occupations by Sex
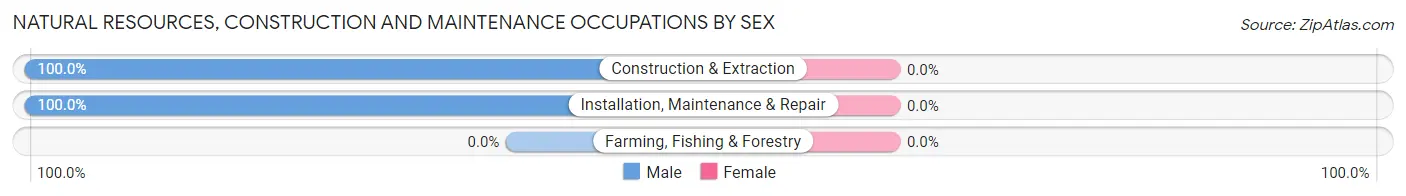
| Occupation | Male | Female |
| Farming, Fishing & Forestry | 0 (0.0%) | 0 (0.0%) |
| Construction & Extraction | 4 (100.0%) | 0 (0.0%) |
| Installation, Maintenance & Repair | 8 (100.0%) | 0 (0.0%) |
| Total (Category) | 12 (100.0%) | 0 (0.0%) |
| Total (Overall) | 71 (44.7%) | 88 (55.3%) |
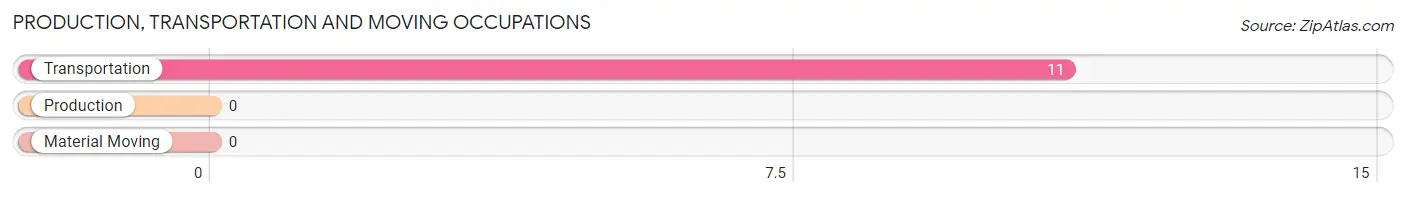
Production, Transportation and Moving Occupations
The most common Production, Transportation and Moving occupations in Mount Calm are , and Transportation (11 | 6.9%).
Production, Transportation and Moving Occupations by Sex
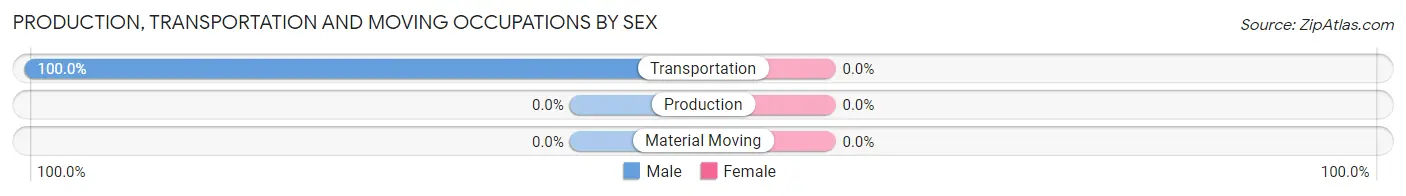
| Occupation | Male | Female |
| Production | 0 (0.0%) | 0 (0.0%) |
| Transportation | 11 (100.0%) | 0 (0.0%) |
| Material Moving | 0 (0.0%) | 0 (0.0%) |
| Total (Category) | 11 (100.0%) | 0 (0.0%) |
| Total (Overall) | 71 (44.7%) | 88 (55.3%) |
Employment Industries by Sex in Mount Calm
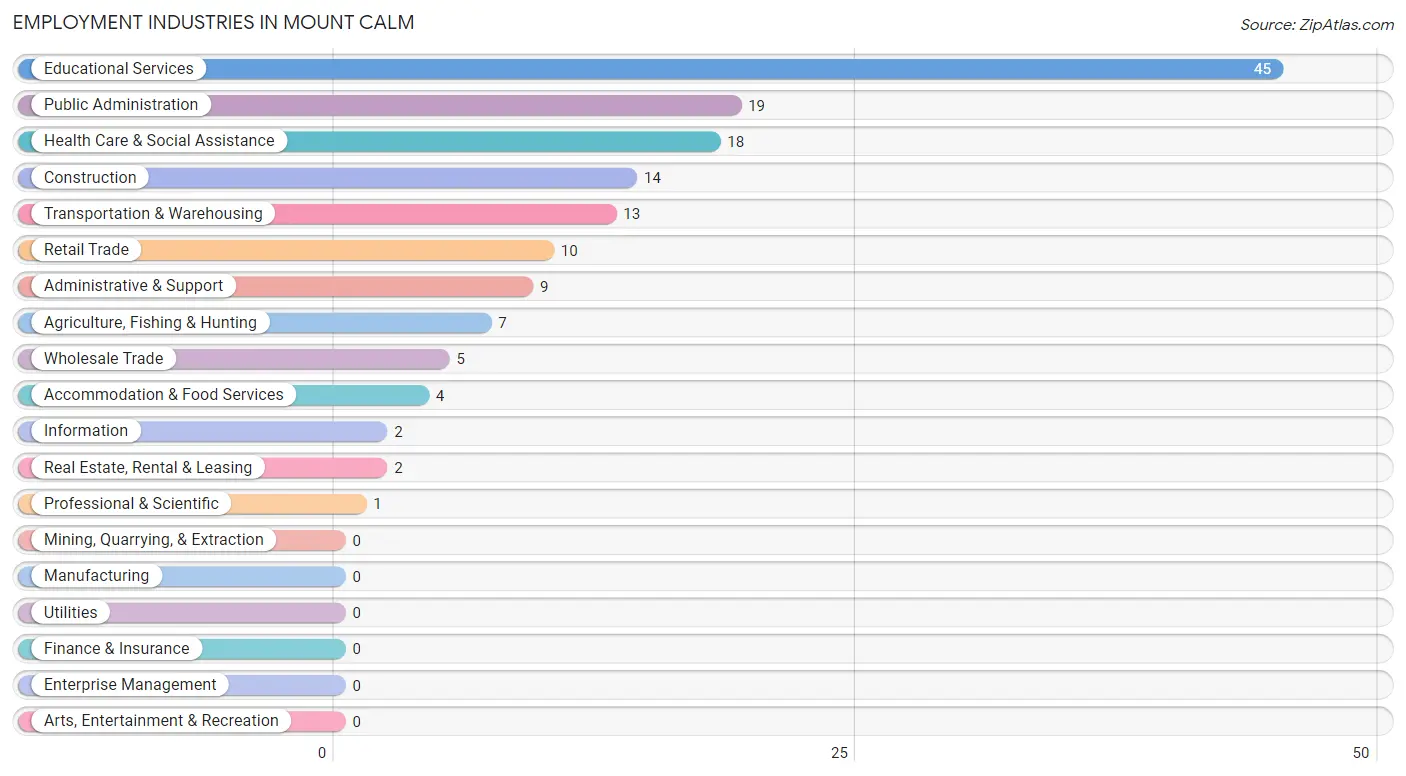
Employment Industries in Mount Calm
The major employment industries in Mount Calm include Educational Services (45 | 28.3%), Public Administration (19 | 11.9%), Health Care & Social Assistance (18 | 11.3%), Construction (14 | 8.8%), and Transportation & Warehousing (13 | 8.2%).
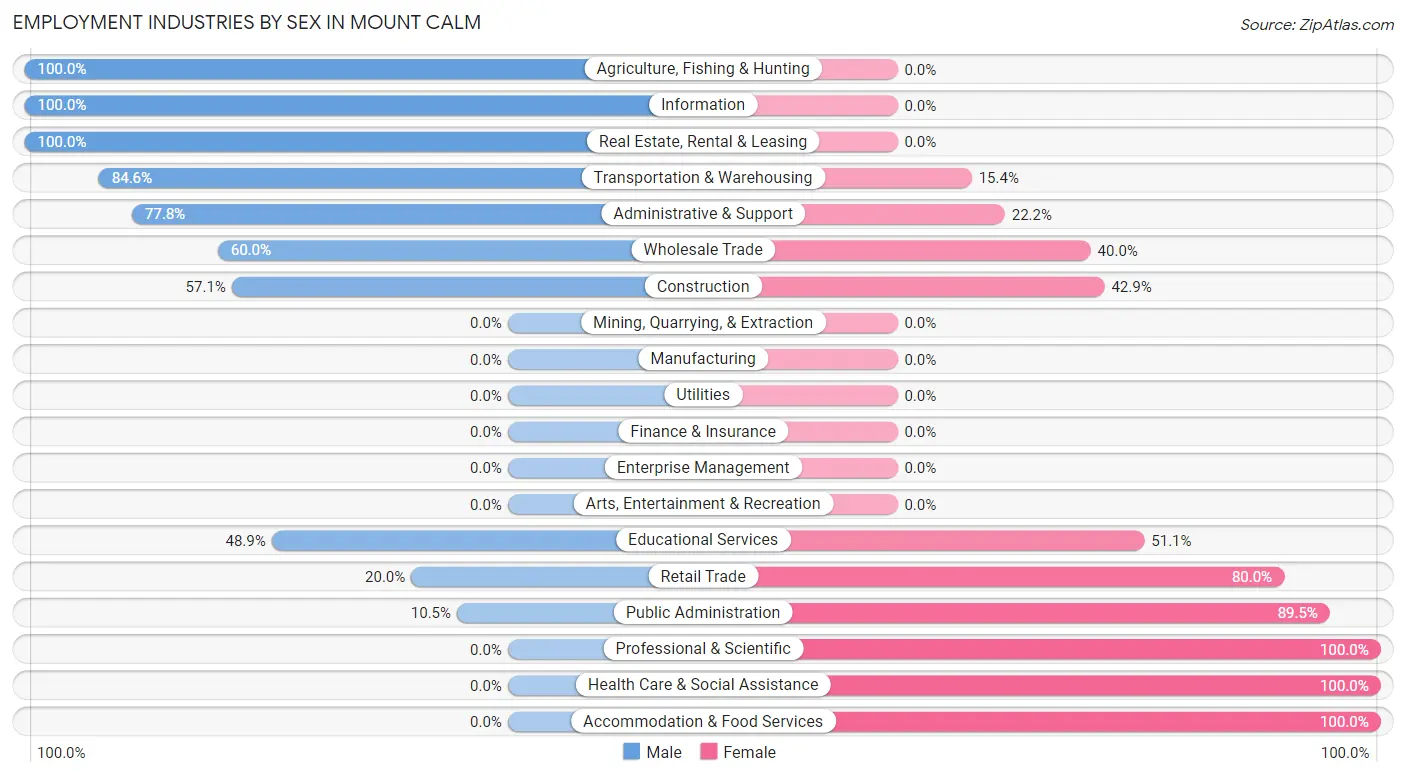
Employment Industries by Sex in Mount Calm
The Mount Calm industries that see more men than women are Agriculture, Fishing & Hunting (100.0%), Information (100.0%), and Real Estate, Rental & Leasing (100.0%), whereas the industries that tend to have a higher number of women are Professional & Scientific (100.0%), Health Care & Social Assistance (100.0%), and Accommodation & Food Services (100.0%).
| Industry | Male | Female |
| Agriculture, Fishing & Hunting | 7 (100.0%) | 0 (0.0%) |
| Mining, Quarrying, & Extraction | 0 (0.0%) | 0 (0.0%) |
| Construction | 8 (57.1%) | 6 (42.9%) |
| Manufacturing | 0 (0.0%) | 0 (0.0%) |
| Wholesale Trade | 3 (60.0%) | 2 (40.0%) |
| Retail Trade | 2 (20.0%) | 8 (80.0%) |
| Transportation & Warehousing | 11 (84.6%) | 2 (15.4%) |
| Utilities | 0 (0.0%) | 0 (0.0%) |
| Information | 2 (100.0%) | 0 (0.0%) |
| Finance & Insurance | 0 (0.0%) | 0 (0.0%) |
| Real Estate, Rental & Leasing | 2 (100.0%) | 0 (0.0%) |
| Professional & Scientific | 0 (0.0%) | 1 (100.0%) |
| Enterprise Management | 0 (0.0%) | 0 (0.0%) |
| Administrative & Support | 7 (77.8%) | 2 (22.2%) |
| Educational Services | 22 (48.9%) | 23 (51.1%) |
| Health Care & Social Assistance | 0 (0.0%) | 18 (100.0%) |
| Arts, Entertainment & Recreation | 0 (0.0%) | 0 (0.0%) |
| Accommodation & Food Services | 0 (0.0%) | 4 (100.0%) |
| Public Administration | 2 (10.5%) | 17 (89.5%) |
| Total | 71 (44.7%) | 88 (55.3%) |
Education in Mount Calm
School Enrollment in Mount Calm
The most common levels of schooling among the 108 students in Mount Calm are middle school (42 | 38.9%), elementary school (36 | 33.3%), and college / undergraduate (14 | 13.0%).
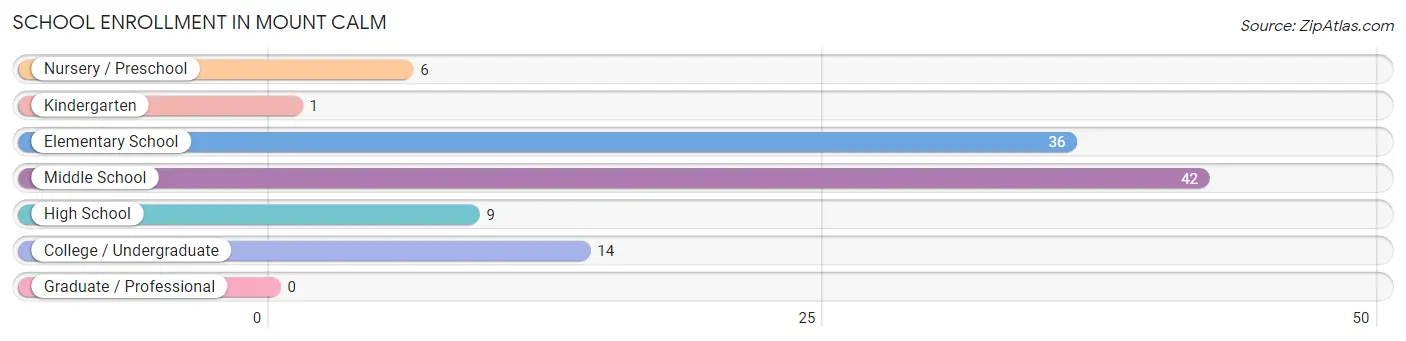
| School Level | # Students | % Students |
| Nursery / Preschool | 6 | 5.6% |
| Kindergarten | 1 | 0.9% |
| Elementary School | 36 | 33.3% |
| Middle School | 42 | 38.9% |
| High School | 9 | 8.3% |
| College / Undergraduate | 14 | 13.0% |
| Graduate / Professional | 0 | 0.0% |
| Total | 108 | 100.0% |
School Enrollment by Age by Funding Source in Mount Calm
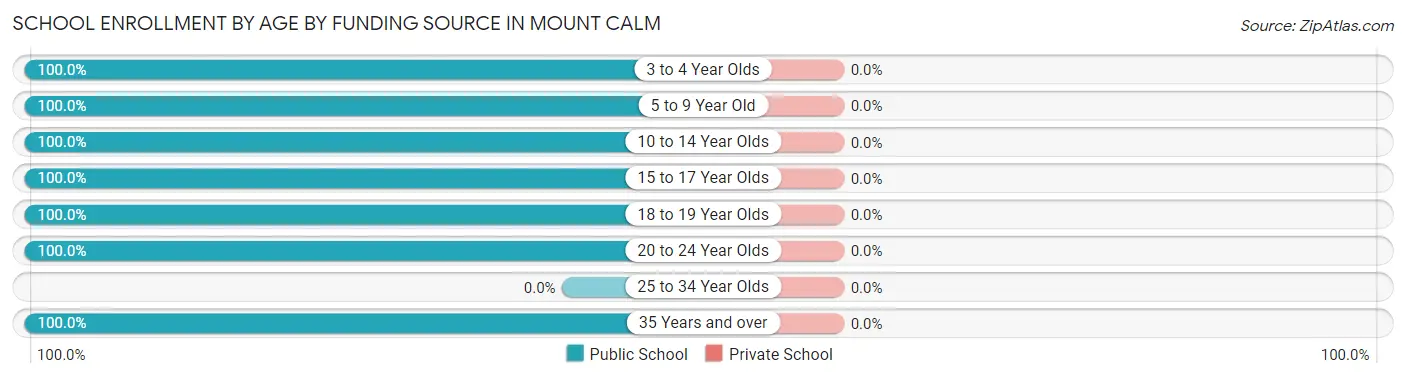
| Age Bracket | Public School | Private School |
| 3 to 4 Year Olds | 2 (100.0%) | 0 (0.0%) |
| 5 to 9 Year Old | 34 (100.0%) | 0 (0.0%) |
| 10 to 14 Year Olds | 49 (100.0%) | 0 (0.0%) |
| 15 to 17 Year Olds | 7 (100.0%) | 0 (0.0%) |
| 18 to 19 Year Olds | 2 (100.0%) | 0 (0.0%) |
| 20 to 24 Year Olds | 5 (100.0%) | 0 (0.0%) |
| 25 to 34 Year Olds | 0 (0.0%) | 0 (0.0%) |
| 35 Years and over | 9 (100.0%) | 0 (0.0%) |
| Total | 108 (100.0%) | 0 (0.0%) |
Educational Attainment by Field of Study in Mount Calm
Education (23 | 41.1%), communications (19 | 33.9%), arts & humanities (5 | 8.9%), business (4 | 7.1%), and computers & mathematics (2 | 3.6%) are the most common fields of study among 56 individuals in Mount Calm who have obtained a bachelor's degree or higher.
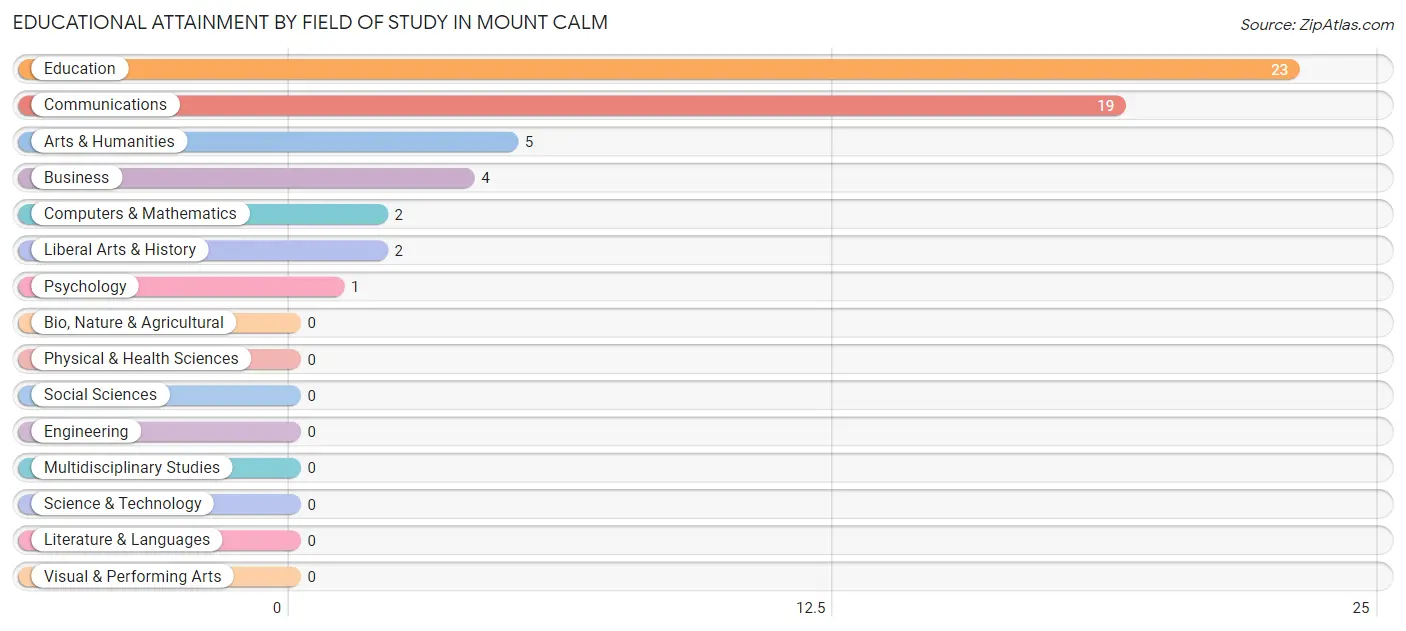
| Field of Study | # Graduates | % Graduates |
| Computers & Mathematics | 2 | 3.6% |
| Bio, Nature & Agricultural | 0 | 0.0% |
| Physical & Health Sciences | 0 | 0.0% |
| Psychology | 1 | 1.8% |
| Social Sciences | 0 | 0.0% |
| Engineering | 0 | 0.0% |
| Multidisciplinary Studies | 0 | 0.0% |
| Science & Technology | 0 | 0.0% |
| Business | 4 | 7.1% |
| Education | 23 | 41.1% |
| Literature & Languages | 0 | 0.0% |
| Liberal Arts & History | 2 | 3.6% |
| Visual & Performing Arts | 0 | 0.0% |
| Communications | 19 | 33.9% |
| Arts & Humanities | 5 | 8.9% |
| Total | 56 | 100.0% |
Transportation & Commute in Mount Calm
Vehicle Availability by Sex in Mount Calm
The most prevalent vehicle ownership categories in Mount Calm are males with 3 vehicles (27, accounting for 38.0%) and females with 3 vehicles (36, making up 31.0%).
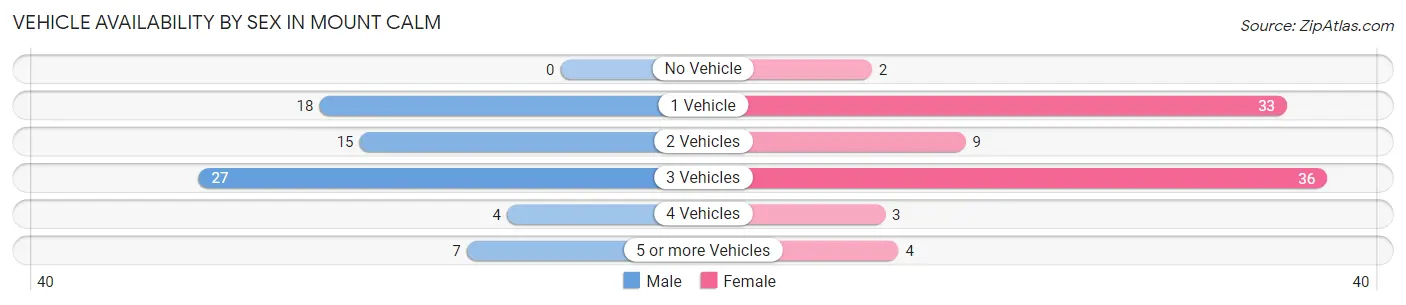
| Vehicles Available | Male | Female |
| No Vehicle | 0 (0.0%) | 2 (2.3%) |
| 1 Vehicle | 18 (25.4%) | 33 (37.9%) |
| 2 Vehicles | 15 (21.1%) | 9 (10.3%) |
| 3 Vehicles | 27 (38.0%) | 36 (41.4%) |
| 4 Vehicles | 4 (5.6%) | 3 (3.5%) |
| 5 or more Vehicles | 7 (9.9%) | 4 (4.6%) |
| Total | 71 (100.0%) | 87 (100.0%) |
Commute Time in Mount Calm
The most frequently occuring commute durations in Mount Calm are 25 to 29 minutes (20 commuters, 16.3%), 30 to 34 minutes (20 commuters, 16.3%), and 20 to 24 minutes (19 commuters, 15.4%).
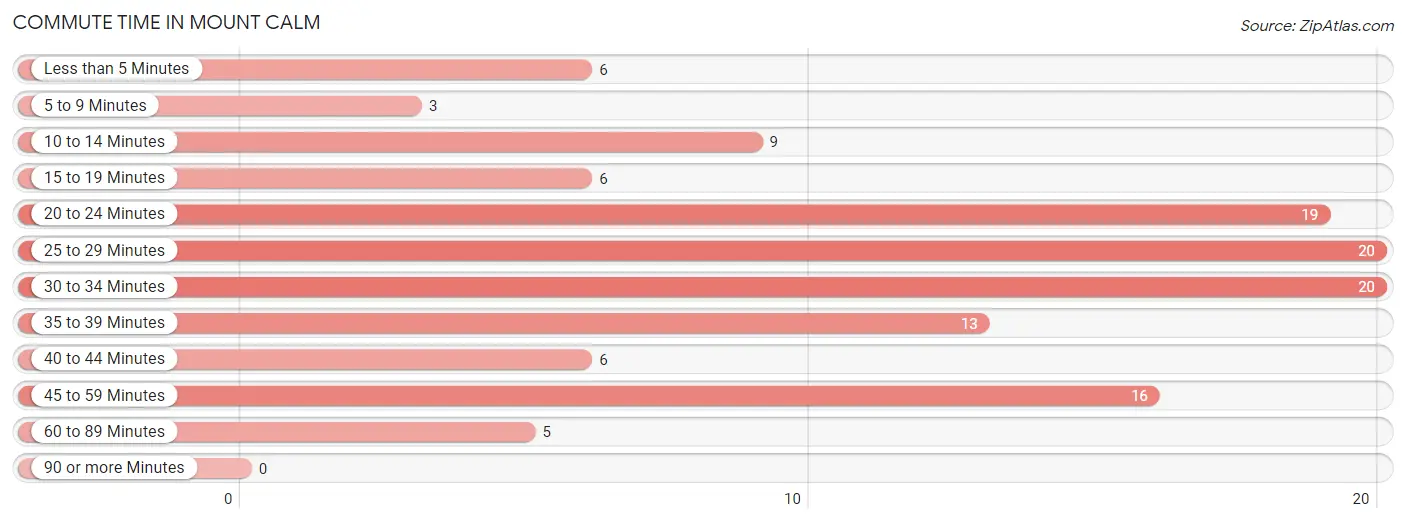
| Commute Time | # Commuters | % Commuters |
| Less than 5 Minutes | 6 | 4.9% |
| 5 to 9 Minutes | 3 | 2.4% |
| 10 to 14 Minutes | 9 | 7.3% |
| 15 to 19 Minutes | 6 | 4.9% |
| 20 to 24 Minutes | 19 | 15.4% |
| 25 to 29 Minutes | 20 | 16.3% |
| 30 to 34 Minutes | 20 | 16.3% |
| 35 to 39 Minutes | 13 | 10.6% |
| 40 to 44 Minutes | 6 | 4.9% |
| 45 to 59 Minutes | 16 | 13.0% |
| 60 to 89 Minutes | 5 | 4.1% |
| 90 or more Minutes | 0 | 0.0% |
Commute Time by Sex in Mount Calm
The most common commute times in Mount Calm are 45 to 59 minutes (16 commuters, 25.8%) for males and 20 to 24 minutes (17 commuters, 27.9%) for females.
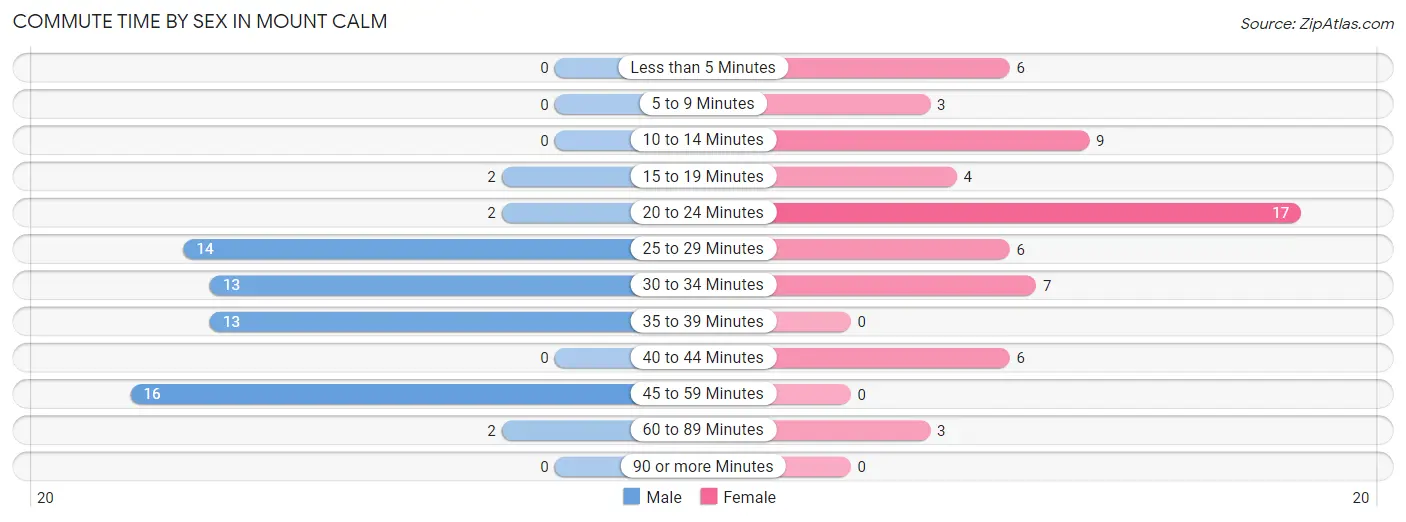
| Commute Time | Male | Female |
| Less than 5 Minutes | 0 (0.0%) | 6 (9.8%) |
| 5 to 9 Minutes | 0 (0.0%) | 3 (4.9%) |
| 10 to 14 Minutes | 0 (0.0%) | 9 (14.7%) |
| 15 to 19 Minutes | 2 (3.2%) | 4 (6.6%) |
| 20 to 24 Minutes | 2 (3.2%) | 17 (27.9%) |
| 25 to 29 Minutes | 14 (22.6%) | 6 (9.8%) |
| 30 to 34 Minutes | 13 (21.0%) | 7 (11.5%) |
| 35 to 39 Minutes | 13 (21.0%) | 0 (0.0%) |
| 40 to 44 Minutes | 0 (0.0%) | 6 (9.8%) |
| 45 to 59 Minutes | 16 (25.8%) | 0 (0.0%) |
| 60 to 89 Minutes | 2 (3.2%) | 3 (4.9%) |
| 90 or more Minutes | 0 (0.0%) | 0 (0.0%) |
Time of Departure to Work by Sex in Mount Calm
The most frequent times of departure to work in Mount Calm are 5:30 AM to 5:59 AM (14, 22.6%) for males and 7:00 AM to 7:29 AM (25, 41.0%) for females.
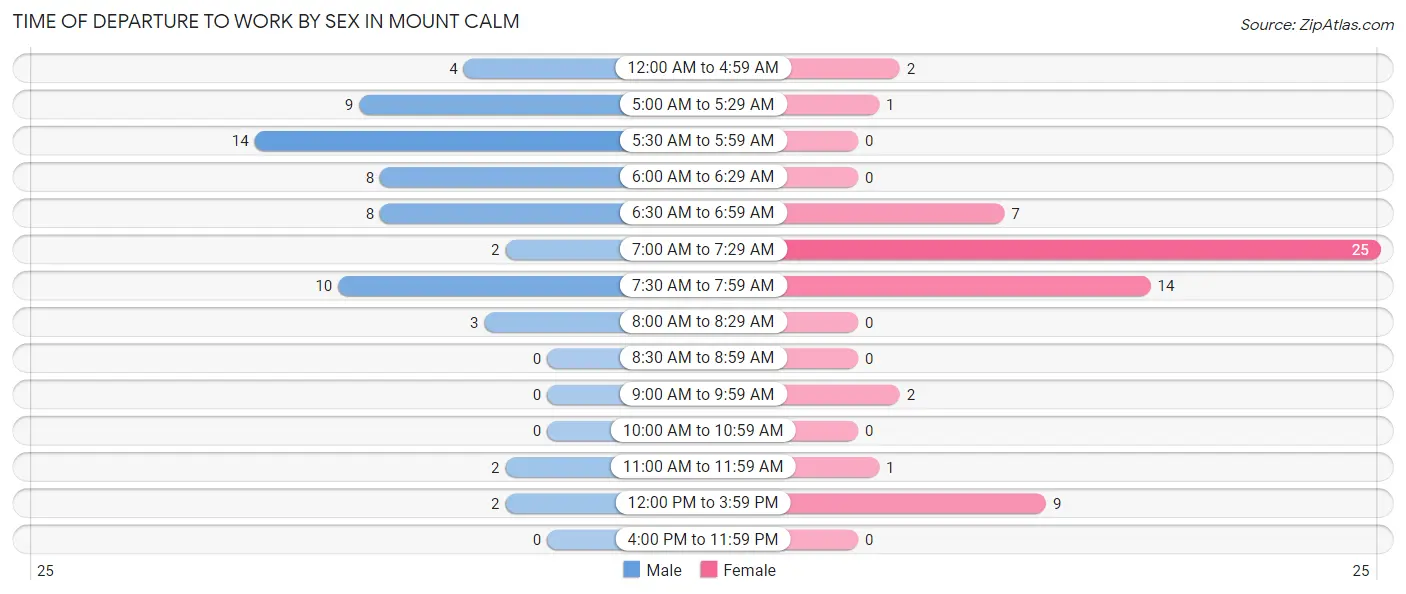
| Time of Departure | Male | Female |
| 12:00 AM to 4:59 AM | 4 (6.5%) | 2 (3.3%) |
| 5:00 AM to 5:29 AM | 9 (14.5%) | 1 (1.6%) |
| 5:30 AM to 5:59 AM | 14 (22.6%) | 0 (0.0%) |
| 6:00 AM to 6:29 AM | 8 (12.9%) | 0 (0.0%) |
| 6:30 AM to 6:59 AM | 8 (12.9%) | 7 (11.5%) |
| 7:00 AM to 7:29 AM | 2 (3.2%) | 25 (41.0%) |
| 7:30 AM to 7:59 AM | 10 (16.1%) | 14 (23.0%) |
| 8:00 AM to 8:29 AM | 3 (4.8%) | 0 (0.0%) |
| 8:30 AM to 8:59 AM | 0 (0.0%) | 0 (0.0%) |
| 9:00 AM to 9:59 AM | 0 (0.0%) | 2 (3.3%) |
| 10:00 AM to 10:59 AM | 0 (0.0%) | 0 (0.0%) |
| 11:00 AM to 11:59 AM | 2 (3.2%) | 1 (1.6%) |
| 12:00 PM to 3:59 PM | 2 (3.2%) | 9 (14.7%) |
| 4:00 PM to 11:59 PM | 0 (0.0%) | 0 (0.0%) |
| Total | 62 (100.0%) | 61 (100.0%) |
Housing Occupancy in Mount Calm
Occupancy by Ownership in Mount Calm
Of the total 164 dwellings in Mount Calm, owner-occupied units account for 123 (75.0%), while renter-occupied units make up 41 (25.0%).
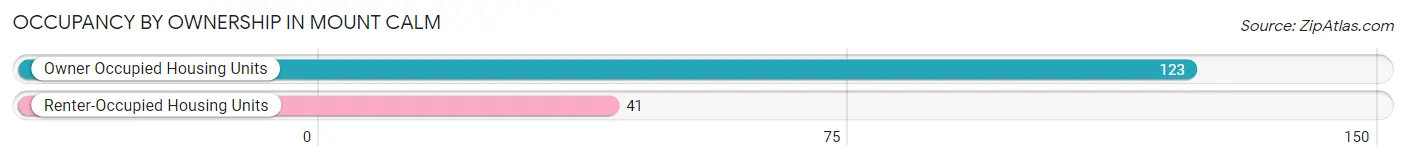
| Occupancy | # Housing Units | % Housing Units |
| Owner Occupied Housing Units | 123 | 75.0% |
| Renter-Occupied Housing Units | 41 | 25.0% |
| Total Occupied Housing Units | 164 | 100.0% |
Occupancy by Household Size in Mount Calm
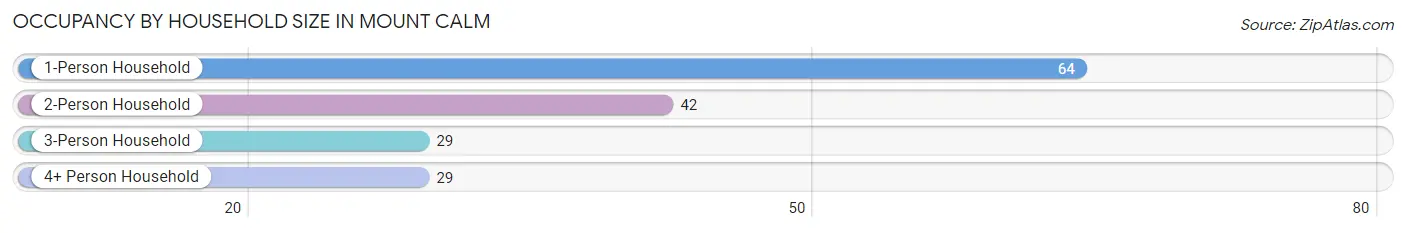
| Household Size | # Housing Units | % Housing Units |
| 1-Person Household | 64 | 39.0% |
| 2-Person Household | 42 | 25.6% |
| 3-Person Household | 29 | 17.7% |
| 4+ Person Household | 29 | 17.7% |
| Total Housing Units | 164 | 100.0% |
Occupancy by Ownership by Household Size in Mount Calm
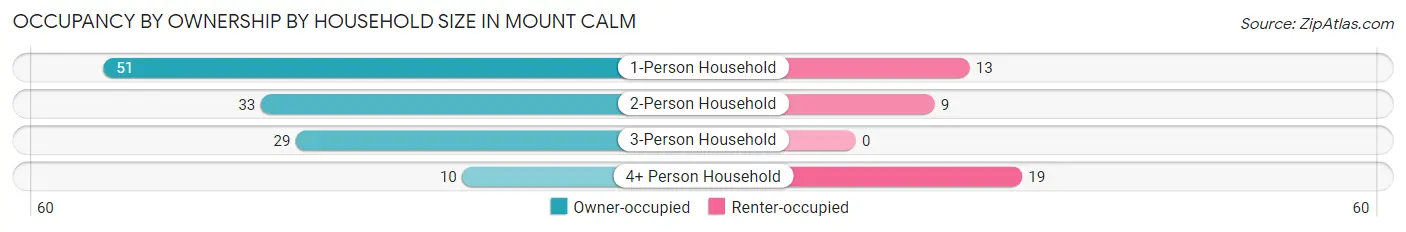
| Household Size | Owner-occupied | Renter-occupied |
| 1-Person Household | 51 (79.7%) | 13 (20.3%) |
| 2-Person Household | 33 (78.6%) | 9 (21.4%) |
| 3-Person Household | 29 (100.0%) | 0 (0.0%) |
| 4+ Person Household | 10 (34.5%) | 19 (65.5%) |
| Total Housing Units | 123 (75.0%) | 41 (25.0%) |
Occupancy by Educational Attainment in Mount Calm
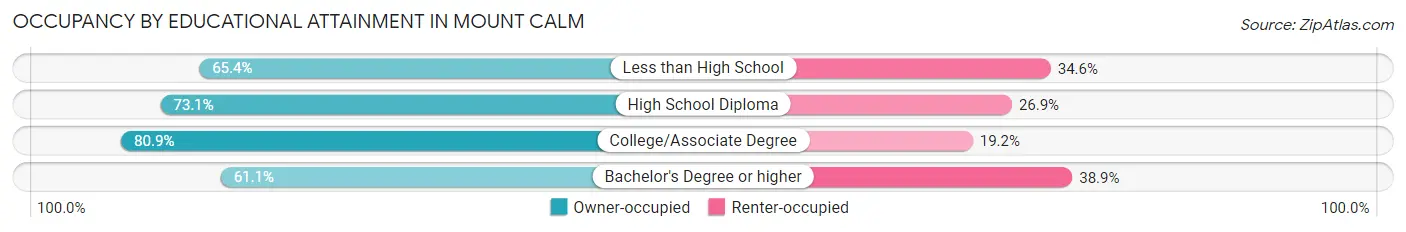
| Household Size | Owner-occupied | Renter-occupied |
| Less than High School | 17 (65.4%) | 9 (34.6%) |
| High School Diploma | 19 (73.1%) | 7 (26.9%) |
| College/Associate Degree | 76 (80.8%) | 18 (19.2%) |
| Bachelor's Degree or higher | 11 (61.1%) | 7 (38.9%) |
Occupancy by Age of Householder in Mount Calm
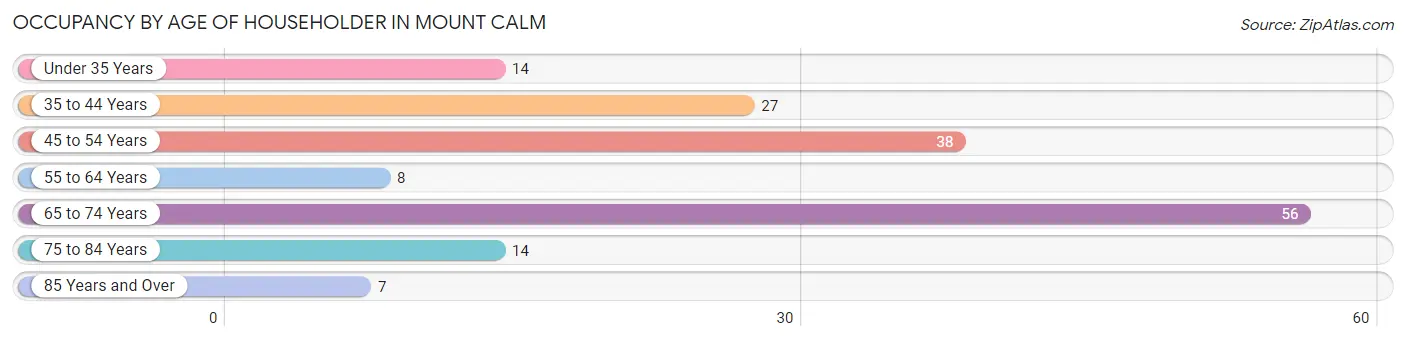
| Age Bracket | # Households | % Households |
| Under 35 Years | 14 | 8.5% |
| 35 to 44 Years | 27 | 16.5% |
| 45 to 54 Years | 38 | 23.2% |
| 55 to 64 Years | 8 | 4.9% |
| 65 to 74 Years | 56 | 34.2% |
| 75 to 84 Years | 14 | 8.5% |
| 85 Years and Over | 7 | 4.3% |
| Total | 164 | 100.0% |
Housing Finances in Mount Calm
Median Income by Occupancy in Mount Calm
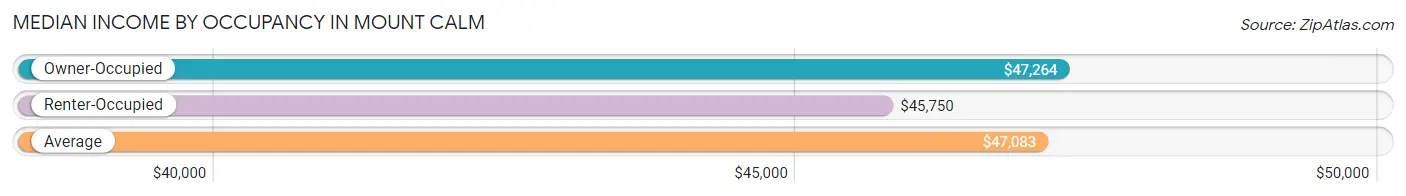
| Occupancy Type | # Households | Median Income |
| Owner-Occupied | 123 (75.0%) | $47,264 |
| Renter-Occupied | 41 (25.0%) | $45,750 |
| Average | 164 (100.0%) | $47,083 |
Occupancy by Householder Income Bracket in Mount Calm
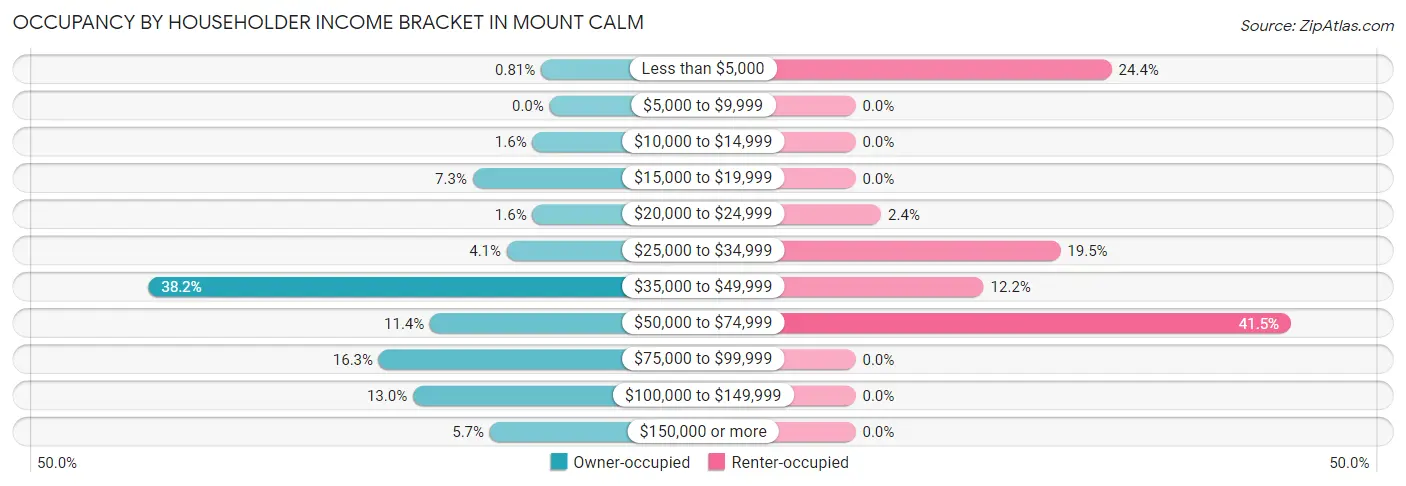
| Income Bracket | Owner-occupied | Renter-occupied |
| Less than $5,000 | 1 (0.8%) | 10 (24.4%) |
| $5,000 to $9,999 | 0 (0.0%) | 0 (0.0%) |
| $10,000 to $14,999 | 2 (1.6%) | 0 (0.0%) |
| $15,000 to $19,999 | 9 (7.3%) | 0 (0.0%) |
| $20,000 to $24,999 | 2 (1.6%) | 1 (2.4%) |
| $25,000 to $34,999 | 5 (4.1%) | 8 (19.5%) |
| $35,000 to $49,999 | 47 (38.2%) | 5 (12.2%) |
| $50,000 to $74,999 | 14 (11.4%) | 17 (41.5%) |
| $75,000 to $99,999 | 20 (16.3%) | 0 (0.0%) |
| $100,000 to $149,999 | 16 (13.0%) | 0 (0.0%) |
| $150,000 or more | 7 (5.7%) | 0 (0.0%) |
| Total | 123 (100.0%) | 41 (100.0%) |
Monthly Housing Cost Tiers in Mount Calm
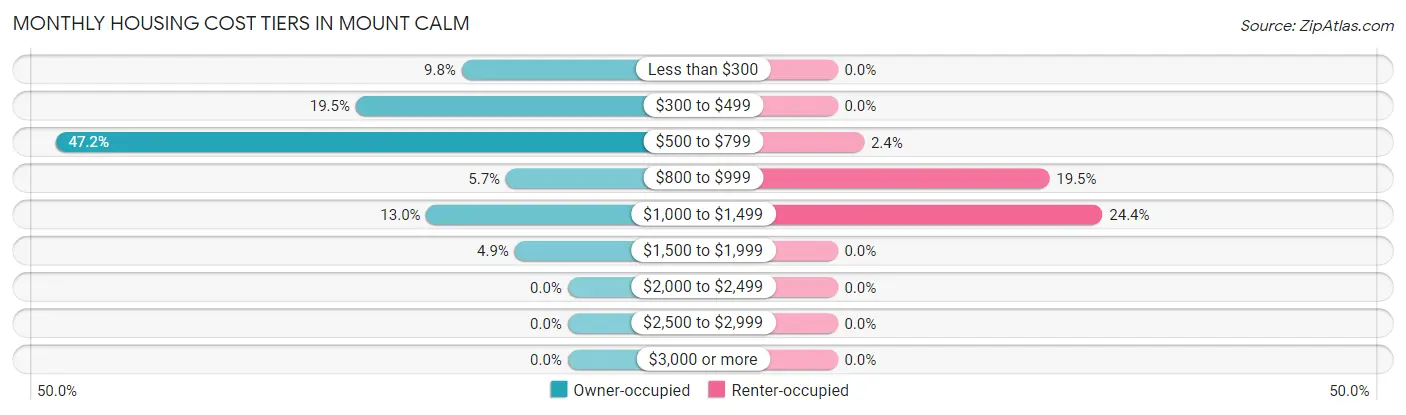
| Monthly Cost | Owner-occupied | Renter-occupied |
| Less than $300 | 12 (9.8%) | 0 (0.0%) |
| $300 to $499 | 24 (19.5%) | 0 (0.0%) |
| $500 to $799 | 58 (47.1%) | 1 (2.4%) |
| $800 to $999 | 7 (5.7%) | 8 (19.5%) |
| $1,000 to $1,499 | 16 (13.0%) | 10 (24.4%) |
| $1,500 to $1,999 | 6 (4.9%) | 0 (0.0%) |
| $2,000 to $2,499 | 0 (0.0%) | 0 (0.0%) |
| $2,500 to $2,999 | 0 (0.0%) | 0 (0.0%) |
| $3,000 or more | 0 (0.0%) | 0 (0.0%) |
| Total | 123 (100.0%) | 41 (100.0%) |
Physical Housing Characteristics in Mount Calm
Housing Structures in Mount Calm
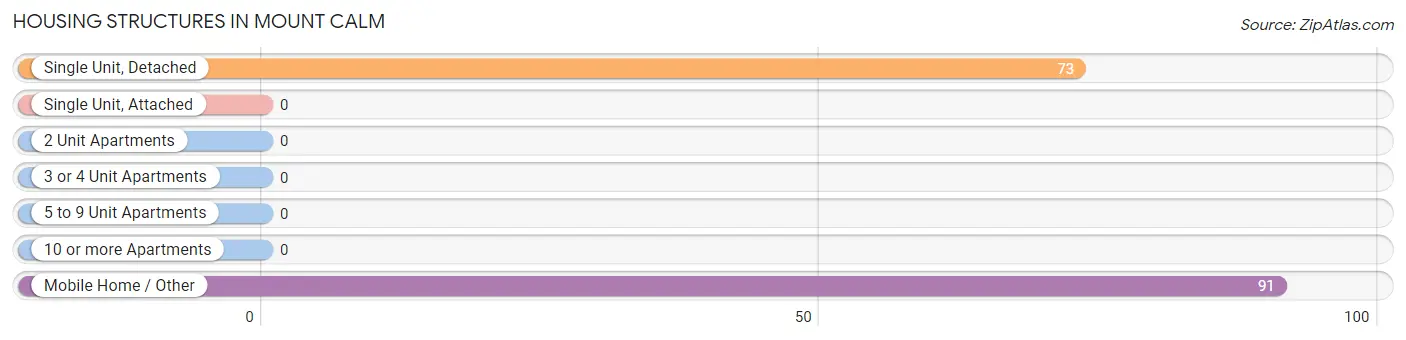
| Structure Type | # Housing Units | % Housing Units |
| Single Unit, Detached | 73 | 44.5% |
| Single Unit, Attached | 0 | 0.0% |
| 2 Unit Apartments | 0 | 0.0% |
| 3 or 4 Unit Apartments | 0 | 0.0% |
| 5 to 9 Unit Apartments | 0 | 0.0% |
| 10 or more Apartments | 0 | 0.0% |
| Mobile Home / Other | 91 | 55.5% |
| Total | 164 | 100.0% |
Housing Structures by Occupancy in Mount Calm
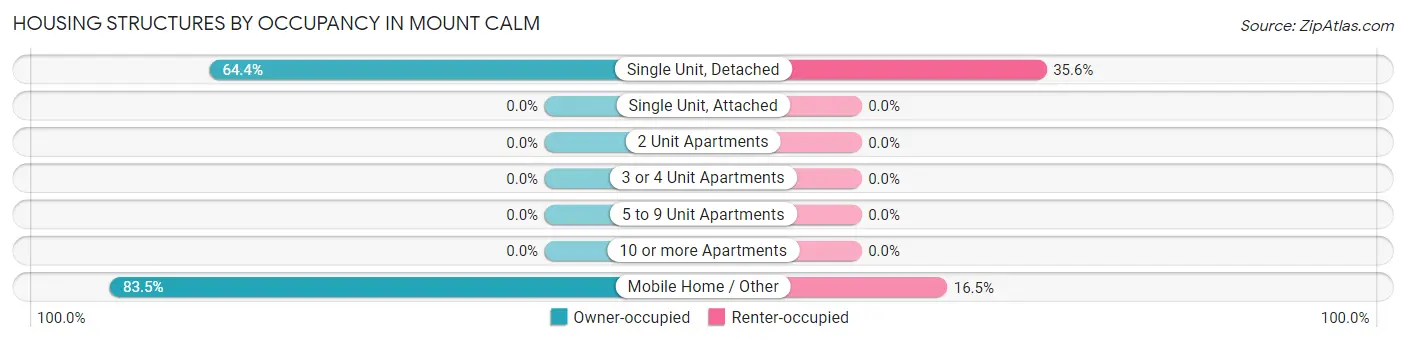
| Structure Type | Owner-occupied | Renter-occupied |
| Single Unit, Detached | 47 (64.4%) | 26 (35.6%) |
| Single Unit, Attached | 0 (0.0%) | 0 (0.0%) |
| 2 Unit Apartments | 0 (0.0%) | 0 (0.0%) |
| 3 or 4 Unit Apartments | 0 (0.0%) | 0 (0.0%) |
| 5 to 9 Unit Apartments | 0 (0.0%) | 0 (0.0%) |
| 10 or more Apartments | 0 (0.0%) | 0 (0.0%) |
| Mobile Home / Other | 76 (83.5%) | 15 (16.5%) |
| Total | 123 (75.0%) | 41 (25.0%) |
Housing Structures by Number of Rooms in Mount Calm
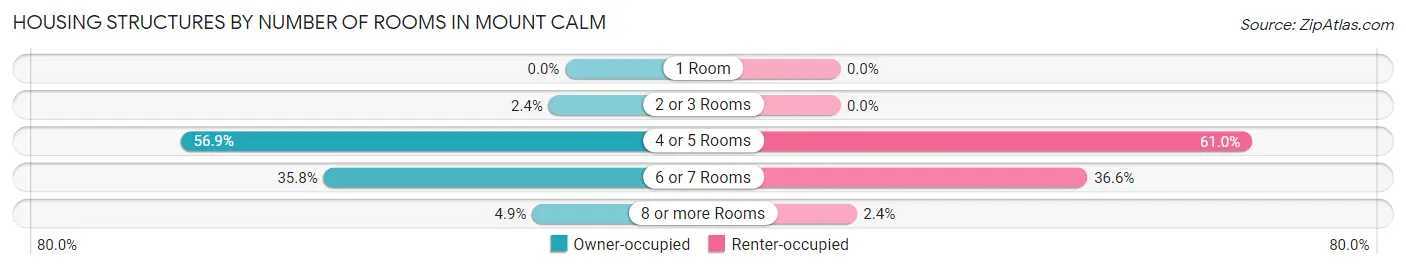
| Number of Rooms | Owner-occupied | Renter-occupied |
| 1 Room | 0 (0.0%) | 0 (0.0%) |
| 2 or 3 Rooms | 3 (2.4%) | 0 (0.0%) |
| 4 or 5 Rooms | 70 (56.9%) | 25 (61.0%) |
| 6 or 7 Rooms | 44 (35.8%) | 15 (36.6%) |
| 8 or more Rooms | 6 (4.9%) | 1 (2.4%) |
| Total | 123 (100.0%) | 41 (100.0%) |
Housing Structure by Heating Type in Mount Calm
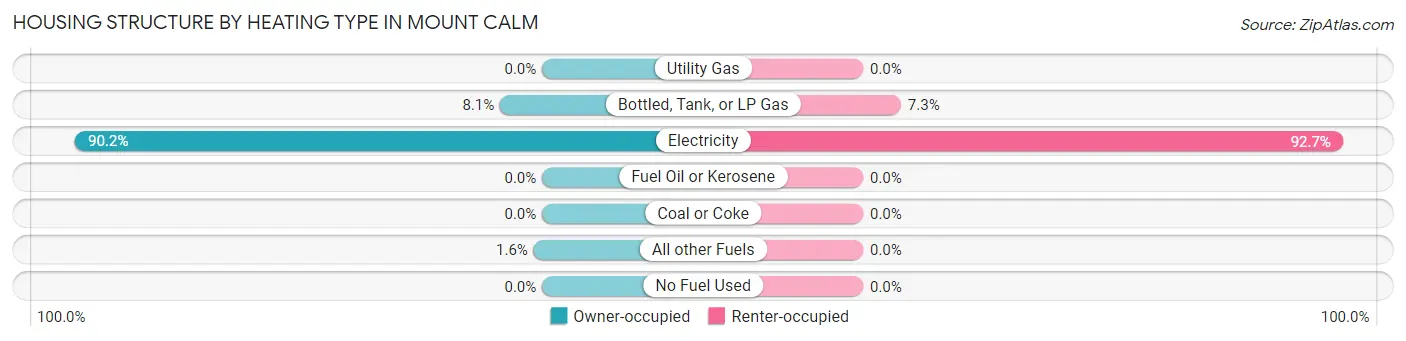
| Heating Type | Owner-occupied | Renter-occupied |
| Utility Gas | 0 (0.0%) | 0 (0.0%) |
| Bottled, Tank, or LP Gas | 10 (8.1%) | 3 (7.3%) |
| Electricity | 111 (90.2%) | 38 (92.7%) |
| Fuel Oil or Kerosene | 0 (0.0%) | 0 (0.0%) |
| Coal or Coke | 0 (0.0%) | 0 (0.0%) |
| All other Fuels | 2 (1.6%) | 0 (0.0%) |
| No Fuel Used | 0 (0.0%) | 0 (0.0%) |
| Total | 123 (100.0%) | 41 (100.0%) |
Household Vehicle Usage in Mount Calm
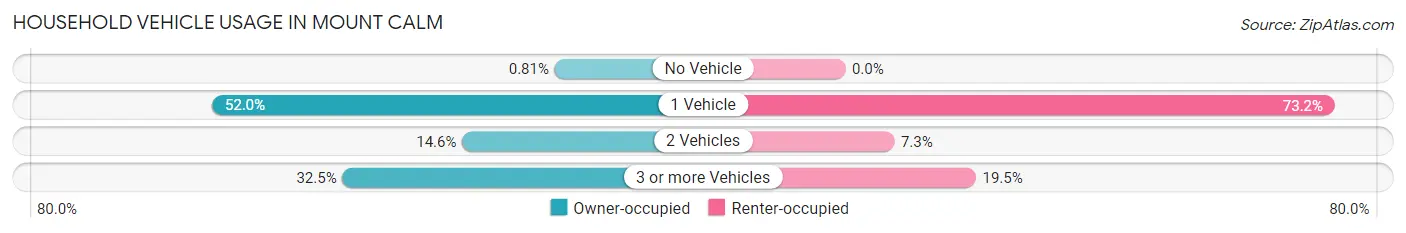
| Vehicles per Household | Owner-occupied | Renter-occupied |
| No Vehicle | 1 (0.8%) | 0 (0.0%) |
| 1 Vehicle | 64 (52.0%) | 30 (73.2%) |
| 2 Vehicles | 18 (14.6%) | 3 (7.3%) |
| 3 or more Vehicles | 40 (32.5%) | 8 (19.5%) |
| Total | 123 (100.0%) | 41 (100.0%) |
Real Estate & Mortgages in Mount Calm
Real Estate and Mortgage Overview in Mount Calm
| Characteristic | Without Mortgage | With Mortgage |
| Housing Units | 68 | 55 |
| Median Property Value | $65,000 | $95,000 |
| Median Household Income | $85,833 | $0 |
| Monthly Housing Costs | $492 | $0 |
| Real Estate Taxes | $1,054 | $0 |
Property Value by Mortgage Status in Mount Calm
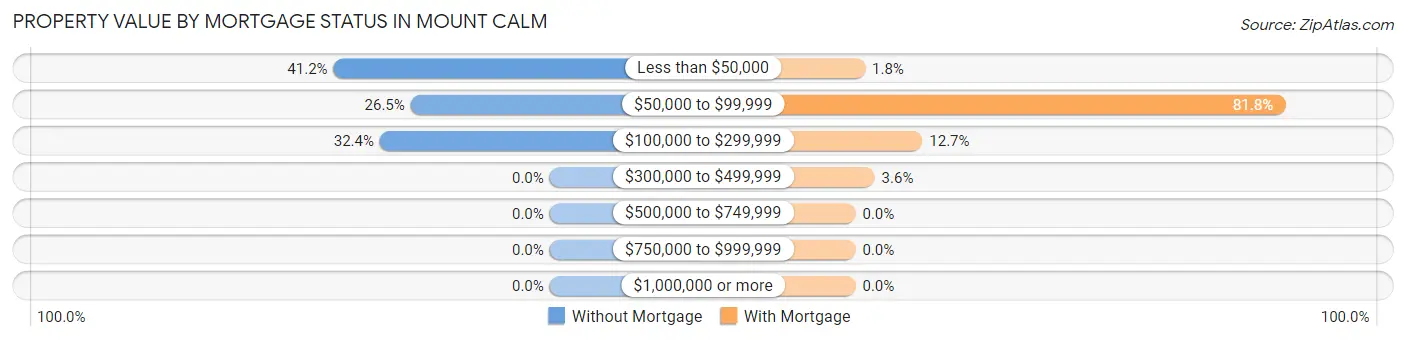
| Property Value | Without Mortgage | With Mortgage |
| Less than $50,000 | 28 (41.2%) | 1 (1.8%) |
| $50,000 to $99,999 | 18 (26.5%) | 45 (81.8%) |
| $100,000 to $299,999 | 22 (32.4%) | 7 (12.7%) |
| $300,000 to $499,999 | 0 (0.0%) | 2 (3.6%) |
| $500,000 to $749,999 | 0 (0.0%) | 0 (0.0%) |
| $750,000 to $999,999 | 0 (0.0%) | 0 (0.0%) |
| $1,000,000 or more | 0 (0.0%) | 0 (0.0%) |
| Total | 68 (100.0%) | 55 (100.0%) |
Household Income by Mortgage Status in Mount Calm
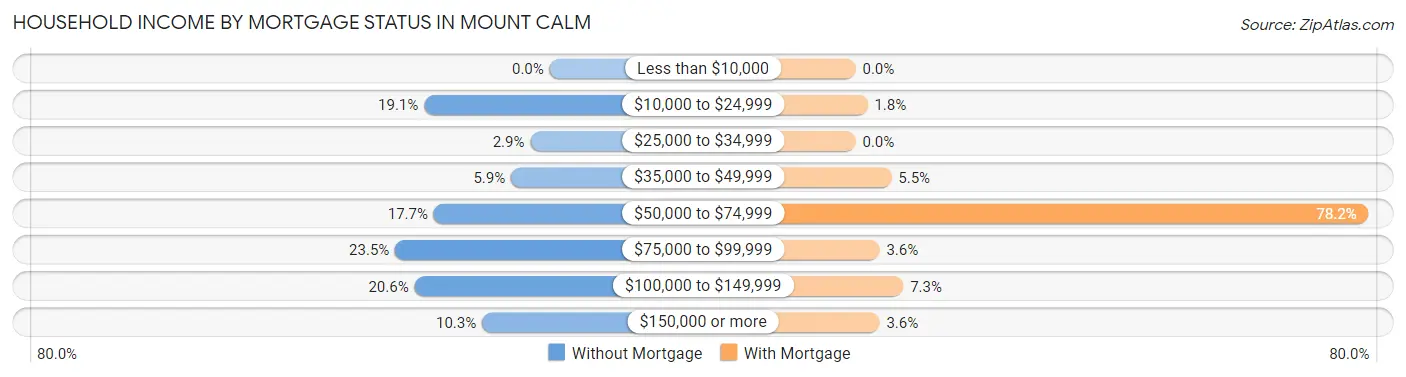
| Household Income | Without Mortgage | With Mortgage |
| Less than $10,000 | 0 (0.0%) | 0 (0.0%) |
| $10,000 to $24,999 | 13 (19.1%) | 1 (1.8%) |
| $25,000 to $34,999 | 2 (2.9%) | 0 (0.0%) |
| $35,000 to $49,999 | 4 (5.9%) | 3 (5.4%) |
| $50,000 to $74,999 | 12 (17.6%) | 43 (78.2%) |
| $75,000 to $99,999 | 16 (23.5%) | 2 (3.6%) |
| $100,000 to $149,999 | 14 (20.6%) | 4 (7.3%) |
| $150,000 or more | 7 (10.3%) | 2 (3.6%) |
| Total | 68 (100.0%) | 55 (100.0%) |
Property Value to Household Income Ratio in Mount Calm
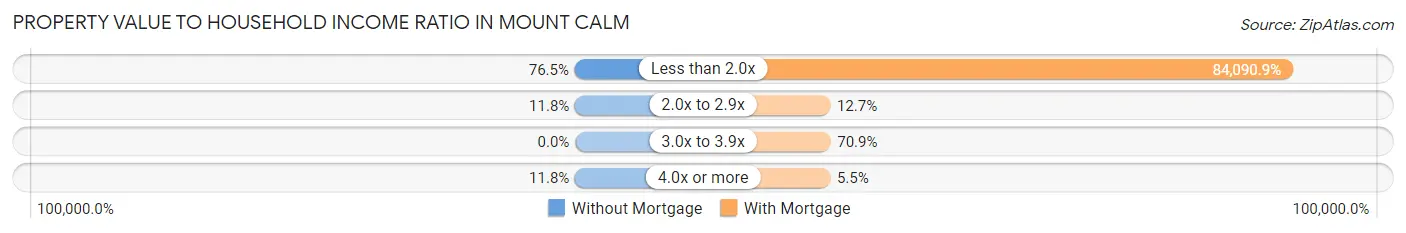
| Value-to-Income Ratio | Without Mortgage | With Mortgage |
| Less than 2.0x | 52 (76.5%) | 46,250 (84,090.9%) |
| 2.0x to 2.9x | 8 (11.8%) | 7 (12.7%) |
| 3.0x to 3.9x | 0 (0.0%) | 39 (70.9%) |
| 4.0x or more | 8 (11.8%) | 3 (5.4%) |
| Total | 68 (100.0%) | 55 (100.0%) |
Real Estate Taxes by Mortgage Status in Mount Calm
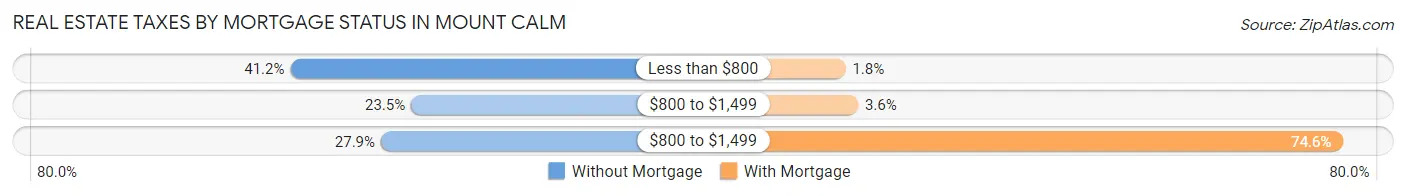
| Property Taxes | Without Mortgage | With Mortgage |
| Less than $800 | 28 (41.2%) | 1 (1.8%) |
| $800 to $1,499 | 16 (23.5%) | 2 (3.6%) |
| $800 to $1,499 | 19 (27.9%) | 41 (74.6%) |
| Total | 68 (100.0%) | 55 (100.0%) |
Health & Disability in Mount Calm
Health Insurance Coverage by Age in Mount Calm
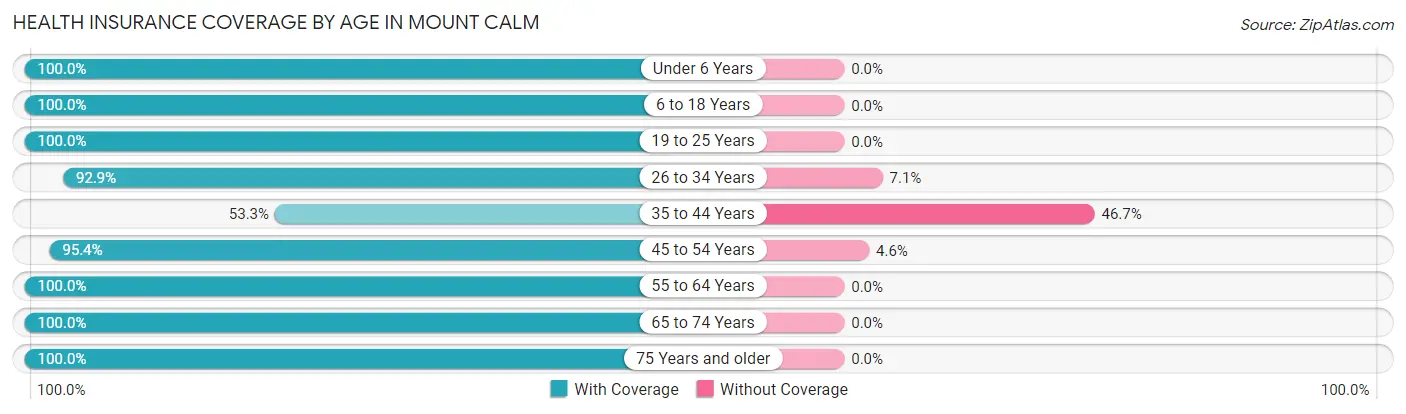
| Age Bracket | With Coverage | Without Coverage |
| Under 6 Years | 34 (100.0%) | 0 (0.0%) |
| 6 to 18 Years | 87 (100.0%) | 0 (0.0%) |
| 19 to 25 Years | 7 (100.0%) | 0 (0.0%) |
| 26 to 34 Years | 26 (92.9%) | 2 (7.1%) |
| 35 to 44 Years | 24 (53.3%) | 21 (46.7%) |
| 45 to 54 Years | 62 (95.4%) | 3 (4.6%) |
| 55 to 64 Years | 24 (100.0%) | 0 (0.0%) |
| 65 to 74 Years | 72 (100.0%) | 0 (0.0%) |
| 75 Years and older | 33 (100.0%) | 0 (0.0%) |
| Total | 369 (93.4%) | 26 (6.6%) |
Health Insurance Coverage by Citizenship Status in Mount Calm
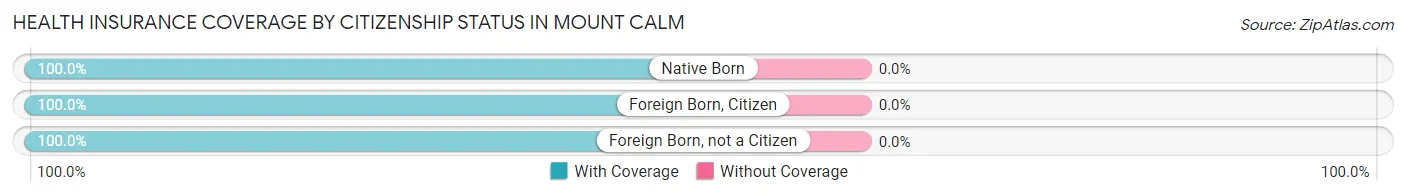
| Citizenship Status | With Coverage | Without Coverage |
| Native Born | 34 (100.0%) | 0 (0.0%) |
| Foreign Born, Citizen | 87 (100.0%) | 0 (0.0%) |
| Foreign Born, not a Citizen | 7 (100.0%) | 0 (0.0%) |
Health Insurance Coverage by Household Income in Mount Calm
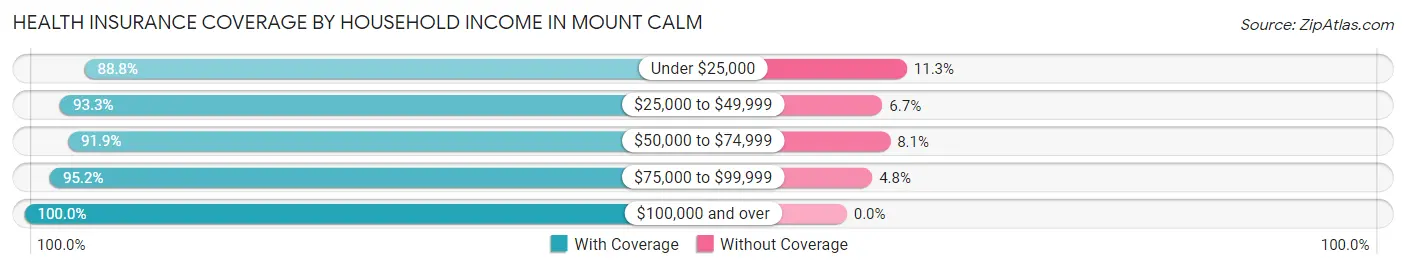
| Household Income | With Coverage | Without Coverage |
| Under $25,000 | 71 (88.7%) | 9 (11.3%) |
| $25,000 to $49,999 | 98 (93.3%) | 7 (6.7%) |
| $50,000 to $74,999 | 79 (91.9%) | 7 (8.1%) |
| $75,000 to $99,999 | 60 (95.2%) | 3 (4.8%) |
| $100,000 and over | 61 (100.0%) | 0 (0.0%) |
Public vs Private Health Insurance Coverage by Age in Mount Calm
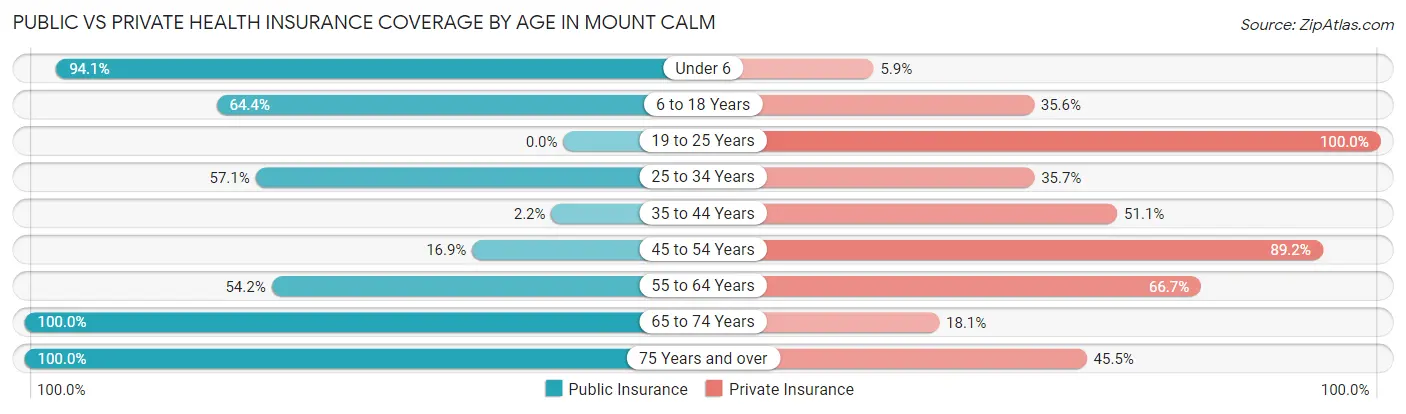
| Age Bracket | Public Insurance | Private Insurance |
| Under 6 | 32 (94.1%) | 2 (5.9%) |
| 6 to 18 Years | 56 (64.4%) | 31 (35.6%) |
| 19 to 25 Years | 0 (0.0%) | 7 (100.0%) |
| 25 to 34 Years | 16 (57.1%) | 10 (35.7%) |
| 35 to 44 Years | 1 (2.2%) | 23 (51.1%) |
| 45 to 54 Years | 11 (16.9%) | 58 (89.2%) |
| 55 to 64 Years | 13 (54.2%) | 16 (66.7%) |
| 65 to 74 Years | 72 (100.0%) | 13 (18.1%) |
| 75 Years and over | 33 (100.0%) | 15 (45.5%) |
| Total | 234 (59.2%) | 175 (44.3%) |
Disability Status by Sex by Age in Mount Calm
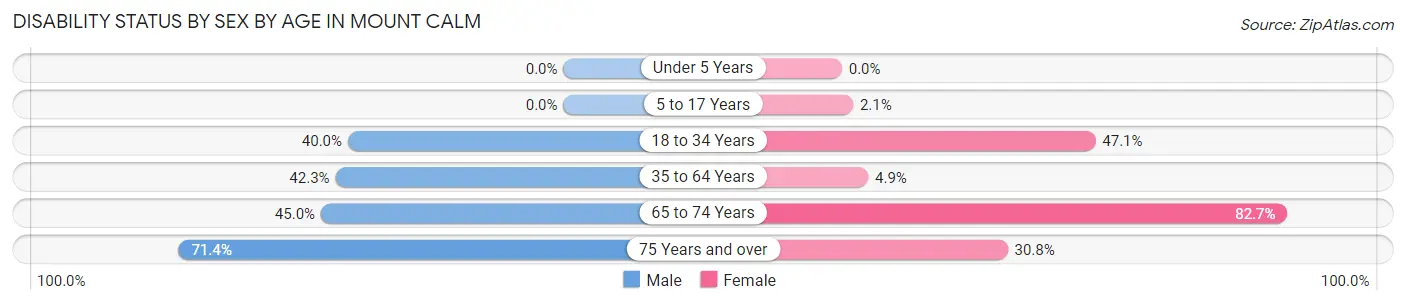
| Age Bracket | Male | Female |
| Under 5 Years | 0 (0.0%) | 0 (0.0%) |
| 5 to 17 Years | 0 (0.0%) | 1 (2.1%) |
| 18 to 34 Years | 8 (40.0%) | 8 (47.1%) |
| 35 to 64 Years | 22 (42.3%) | 4 (4.9%) |
| 65 to 74 Years | 9 (45.0%) | 43 (82.7%) |
| 75 Years and over | 5 (71.4%) | 8 (30.8%) |
Disability Class by Sex by Age in Mount Calm
Disability Class: Hearing Difficulty
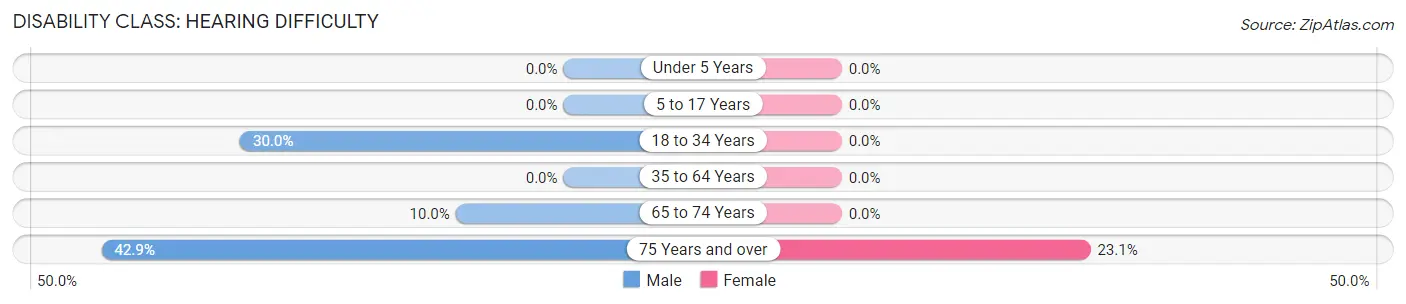
| Age Bracket | Male | Female |
| Under 5 Years | 0 (0.0%) | 0 (0.0%) |
| 5 to 17 Years | 0 (0.0%) | 0 (0.0%) |
| 18 to 34 Years | 6 (30.0%) | 0 (0.0%) |
| 35 to 64 Years | 0 (0.0%) | 0 (0.0%) |
| 65 to 74 Years | 2 (10.0%) | 0 (0.0%) |
| 75 Years and over | 3 (42.9%) | 6 (23.1%) |
Disability Class: Vision Difficulty
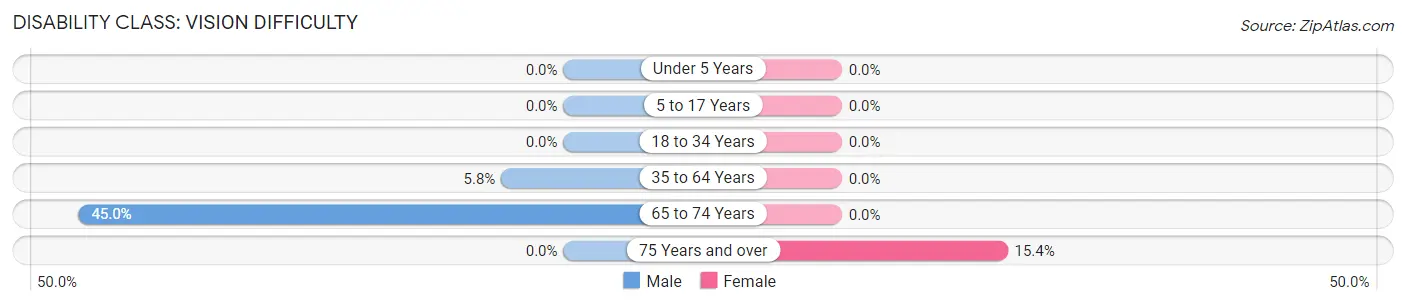
| Age Bracket | Male | Female |
| Under 5 Years | 0 (0.0%) | 0 (0.0%) |
| 5 to 17 Years | 0 (0.0%) | 0 (0.0%) |
| 18 to 34 Years | 0 (0.0%) | 0 (0.0%) |
| 35 to 64 Years | 3 (5.8%) | 0 (0.0%) |
| 65 to 74 Years | 9 (45.0%) | 0 (0.0%) |
| 75 Years and over | 0 (0.0%) | 4 (15.4%) |
Disability Class: Cognitive Difficulty
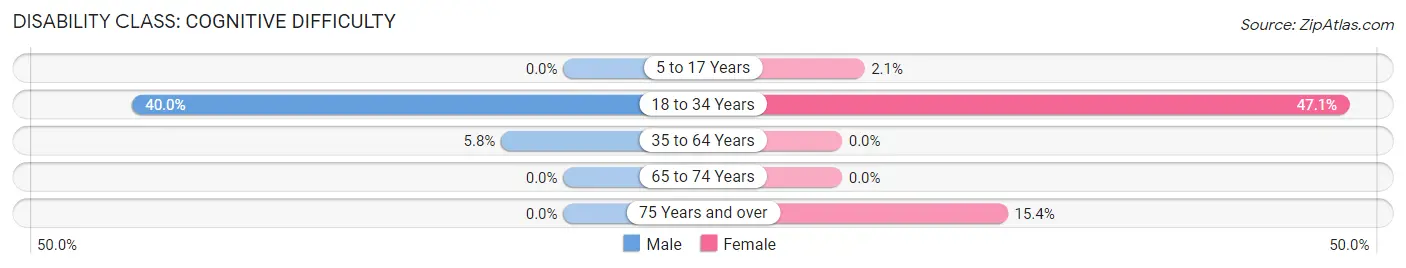
| Age Bracket | Male | Female |
| 5 to 17 Years | 0 (0.0%) | 1 (2.1%) |
| 18 to 34 Years | 8 (40.0%) | 8 (47.1%) |
| 35 to 64 Years | 3 (5.8%) | 0 (0.0%) |
| 65 to 74 Years | 0 (0.0%) | 0 (0.0%) |
| 75 Years and over | 0 (0.0%) | 4 (15.4%) |
Disability Class: Ambulatory Difficulty
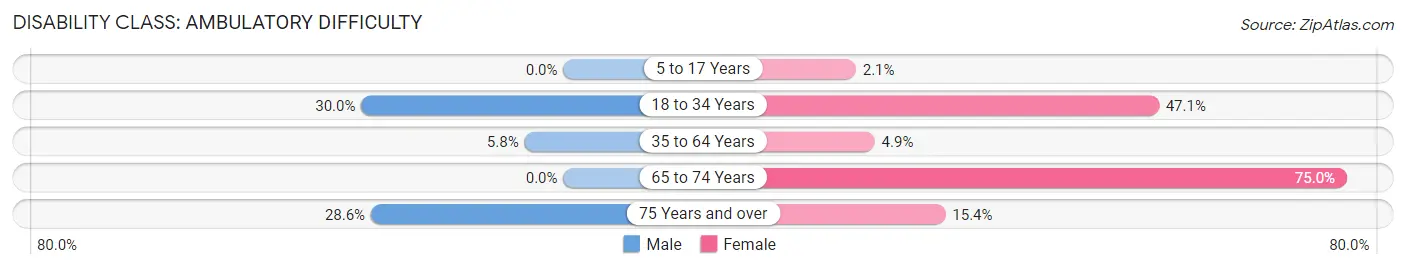
| Age Bracket | Male | Female |
| 5 to 17 Years | 0 (0.0%) | 1 (2.1%) |
| 18 to 34 Years | 6 (30.0%) | 8 (47.1%) |
| 35 to 64 Years | 3 (5.8%) | 4 (4.9%) |
| 65 to 74 Years | 0 (0.0%) | 39 (75.0%) |
| 75 Years and over | 2 (28.6%) | 4 (15.4%) |
Disability Class: Self-Care Difficulty
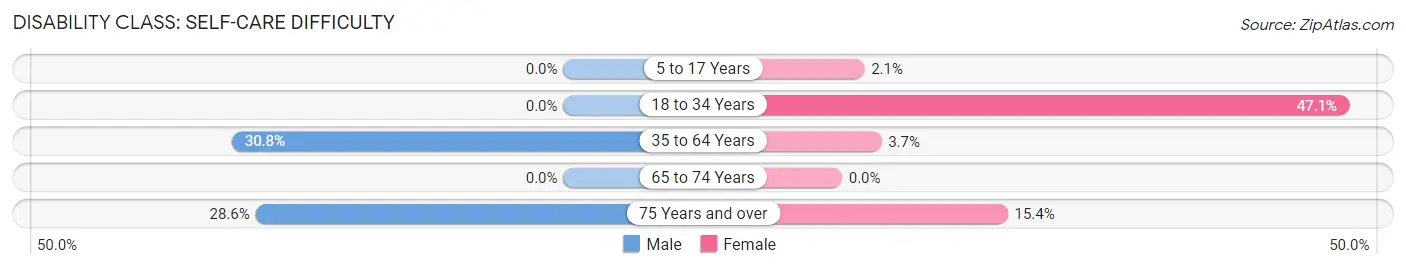
| Age Bracket | Male | Female |
| 5 to 17 Years | 0 (0.0%) | 1 (2.1%) |
| 18 to 34 Years | 0 (0.0%) | 8 (47.1%) |
| 35 to 64 Years | 16 (30.8%) | 3 (3.7%) |
| 65 to 74 Years | 0 (0.0%) | 0 (0.0%) |
| 75 Years and over | 2 (28.6%) | 4 (15.4%) |
Technology Access in Mount Calm
Computing Device Access in Mount Calm
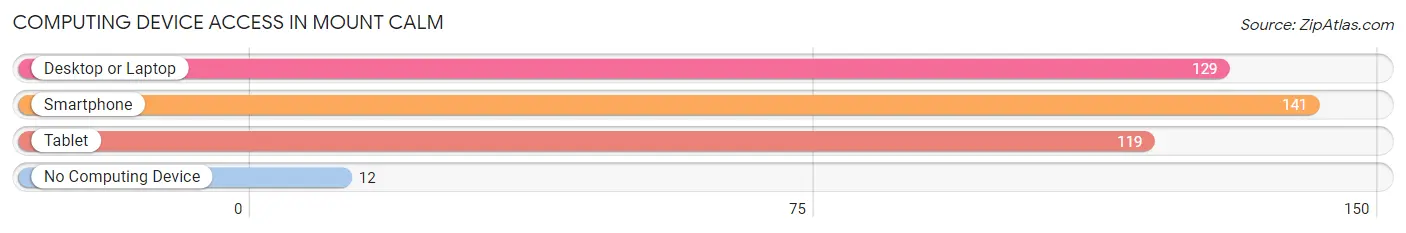
| Device Type | # Households | % Households |
| Desktop or Laptop | 129 | 78.7% |
| Smartphone | 141 | 86.0% |
| Tablet | 119 | 72.6% |
| No Computing Device | 12 | 7.3% |
| Total | 164 | 100.0% |
Internet Access in Mount Calm
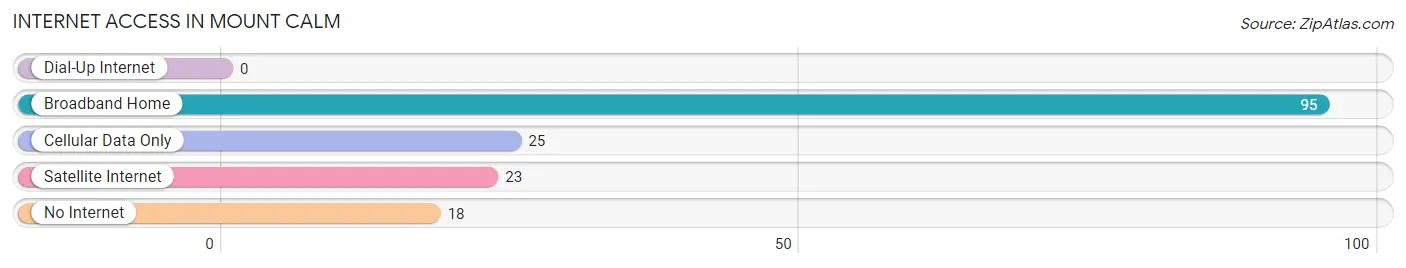
| Internet Type | # Households | % Households |
| Dial-Up Internet | 0 | 0.0% |
| Broadband Home | 95 | 57.9% |
| Cellular Data Only | 25 | 15.2% |
| Satellite Internet | 23 | 14.0% |
| No Internet | 18 | 11.0% |
| Total | 164 | 100.0% |
Mount Calm Summary
History
The small town of Mount Calm, Texas is located in Hill County, about an hour south of Dallas. The town was founded in 1854 by a group of settlers from Tennessee, led by William and Mary Ann Smith. The Smiths named the town after the nearby Mount Calm Creek, which was named by early settlers for its peaceful atmosphere.
The town grew slowly over the years, and by the early 1900s, it had a population of around 500 people. The town was primarily agricultural, with cotton and corn being the main crops. In the 1920s, the town began to experience a population boom, as many people moved to the area to work in the oil fields. This influx of people helped to spur the growth of the town, and by the 1940s, the population had grown to over 1,000 people.
The town continued to grow throughout the 20th century, and by the 2000 census, the population had grown to 1,717 people. The town has remained relatively small, but it has seen some growth in recent years, with the population increasing to 1,845 people in 2010.
Geography
Mount Calm is located in Hill County, Texas, about an hour south of Dallas. The town is situated on the western edge of the Blackland Prairie, a region of rolling hills and fertile soil. The town is located on the banks of the Brazos River, which provides a source of water for the town and its surrounding area.
The town is located at the intersection of State Highway 22 and Farm to Market Road 308. The town is also served by the Mount Calm Independent School District, which serves the town and the surrounding area.
Economy
The economy of Mount Calm is primarily based on agriculture. The town is located in an area of fertile soil, and the surrounding area is home to many farms and ranches. The town is also home to several small businesses, including a grocery store, a hardware store, and a few restaurants.
The town is also home to a few manufacturing companies, including a plastics factory and a metal fabrication plant. The town is also home to a few oil and gas companies, which are involved in the exploration and production of oil and gas in the area.
Demographics
As of the 2010 census, the population of Mount Calm was 1,845 people. The town is predominantly white, with the majority of the population (90.2%) being white. The town also has a small Hispanic population (7.2%), as well as a small African American population (1.3%).
The median household income in Mount Calm is $41,250, and the median home value is $90,000. The town has a poverty rate of 16.2%, which is slightly higher than the national average.
Conclusion
Mount Calm, Texas is a small town located in Hill County, about an hour south of Dallas. The town was founded in 1854 by a group of settlers from Tennessee, and it has grown slowly over the years. The town is primarily agricultural, with cotton and corn being the main crops. The town is also home to several small businesses, as well as a few manufacturing companies and oil and gas companies. The population of Mount Calm is predominantly white, with the majority of the population being white. The median household income in Mount Calm is $41,250, and the median home value is $90,000. The town has a poverty rate of 16.2%, which is slightly higher than the national average.
Common Questions
What is the Total Population of Mount Calm?
Total Population of Mount Calm is 395.
What is the Total Male Population of Mount Calm?
Total Male Population of Mount Calm is 153.
What is the Total Female Population of Mount Calm?
Total Female Population of Mount Calm is 242.
What is the Ratio of Males per 100 Females in Mount Calm?
There are 63.22 Males per 100 Females in Mount Calm.
What is the Ratio of Females per 100 Males in Mount Calm?
There are 158.17 Females per 100 Males in Mount Calm.
What is the Median Population Age in Mount Calm?
Median Population Age in Mount Calm is 43.9 Years.
What is the Average Family Size in Mount Calm
Average Family Size in Mount Calm is 3.4 People.
What is the Average Household Size in Mount Calm
Average Household Size in Mount Calm is 2.4 People.
What is Per Capita Income in Mount Calm?
Per Capita income in Mount Calm is $24,025.
What is the Median Family Income in Mount Calm?
Median Family Income in Mount Calm is $60,536.
What is the Median Household income in Mount Calm?
Median Household Income in Mount Calm is $47,083.
What is Income or Wage Gap in Mount Calm?
Income or Wage Gap in Mount Calm is 36.8%.
Women in Mount Calm earn 63.2 cents for every dollar earned by a man.
What is Inequality or Gini Index in Mount Calm?
Inequality or Gini Index in Mount Calm is 0.36.
How Large is the Labor Force in Mount Calm?
There are 168 People in the Labor Forcein in Mount Calm.
What is the Percentage of People in the Labor Force in Mount Calm?
59.4% of People are in the Labor Force in Mount Calm.
What is the Unemployment Rate in Mount Calm?
Unemployment Rate in Mount Calm is 5.4%.