Fort Clark Springs, TX
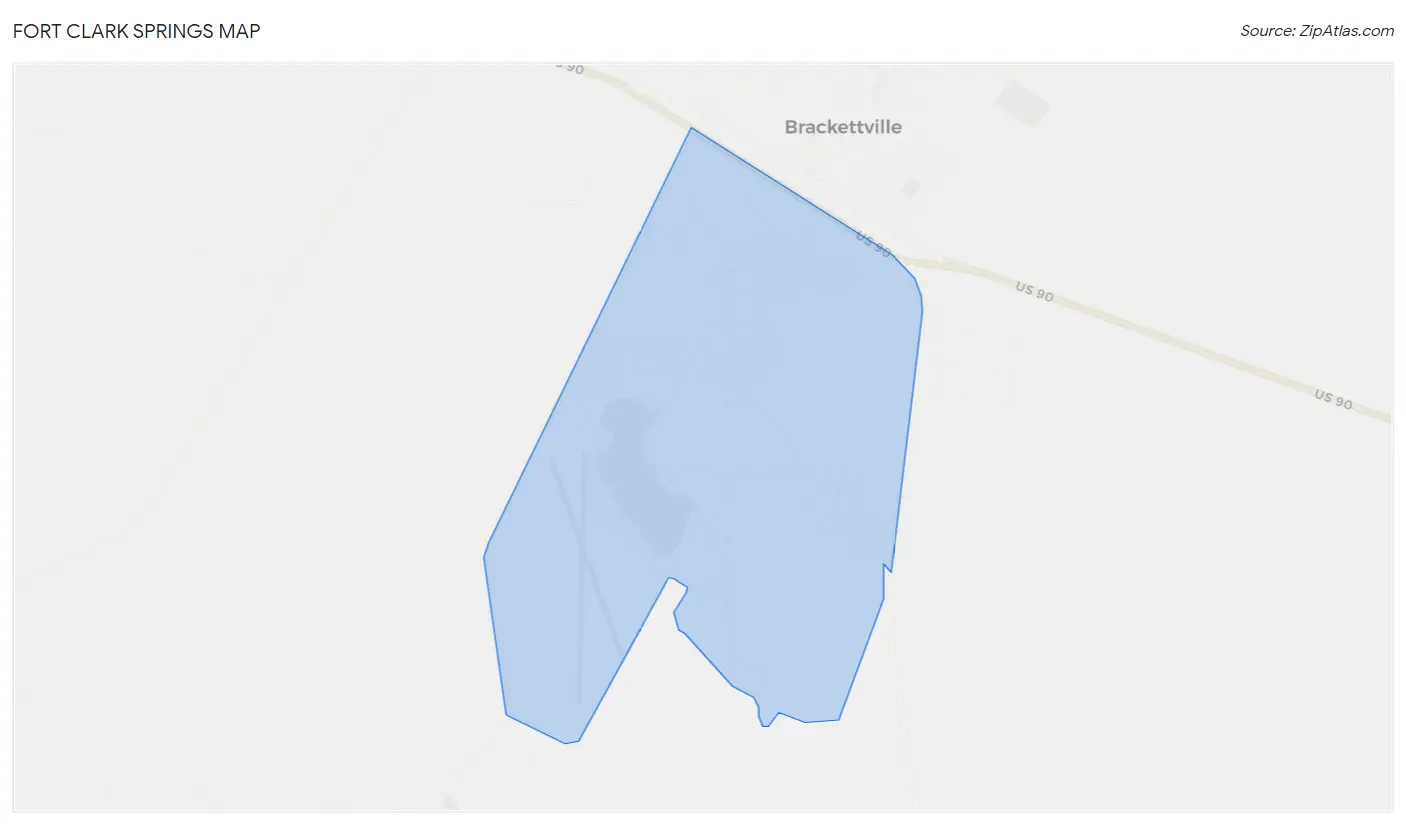
Fort Clark Springs Map
Fort Clark Springs Overview
1,298
TOTAL POPULATION
823
MALE POPULATION
475
FEMALE POPULATION
173.26
MALES / 100 FEMALES
57.72
FEMALES / 100 MALES
56.6
MEDIAN AGE
2.9
AVG FAMILY SIZE
2.1
AVG HOUSEHOLD SIZE
$41,377
PER CAPITA INCOME
$70,318
AVG FAMILY INCOME
$69,611
AVG HOUSEHOLD INCOME
0.38
INEQUALITY / GINI INDEX
577
LABOR FORCE [ PEOPLE ]
48.3%
PERCENT IN LABOR FORCE
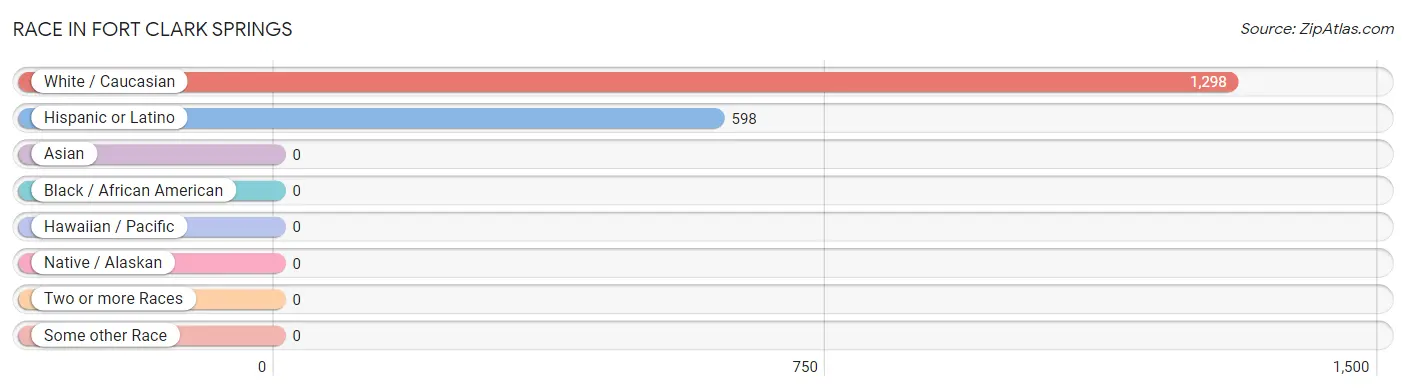
Race in Fort Clark Springs
The most populous races in Fort Clark Springs are White / Caucasian (1,298 | 100.0%), and Hispanic or Latino (598 | 46.1%).
| Race | # Population | % Population |
| Asian | 0 | 0.0% |
| Black / African American | 0 | 0.0% |
| Hawaiian / Pacific | 0 | 0.0% |
| Hispanic or Latino | 598 | 46.1% |
| Native / Alaskan | 0 | 0.0% |
| White / Caucasian | 1,298 | 100.0% |
| Two or more Races | 0 | 0.0% |
| Some other Race | 0 | 0.0% |
| Total | 1,298 | 100.0% |
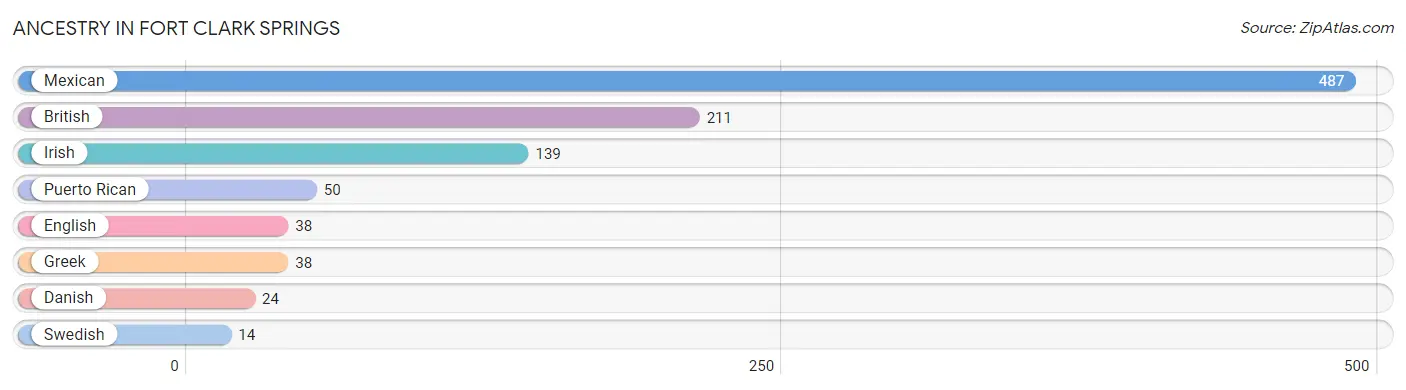
Ancestry in Fort Clark Springs
The most populous ancestries reported in Fort Clark Springs are Mexican (487 | 37.5%), British (211 | 16.3%), Irish (139 | 10.7%), Puerto Rican (50 | 3.8%), and English (38 | 2.9%), together accounting for 71.3% of all Fort Clark Springs residents.
| Ancestry | # Population | % Population |
| British | 211 | 16.3% |
| Danish | 24 | 1.8% |
| English | 38 | 2.9% |
| Greek | 38 | 2.9% |
| Irish | 139 | 10.7% |
| Mexican | 487 | 37.5% |
| Puerto Rican | 50 | 3.8% |
| Swedish | 14 | 1.1% | View All 8 Rows |
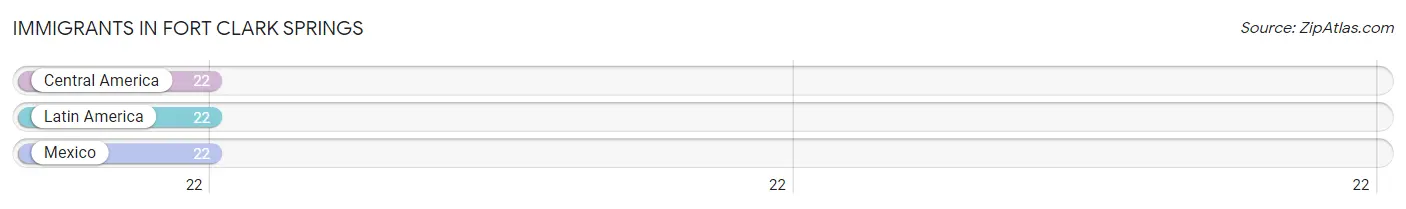
Immigrants in Fort Clark Springs
The most numerous immigrant groups reported in Fort Clark Springs came from Central America (22 | 1.7%), Latin America (22 | 1.7%), and Mexico (22 | 1.7%), together accounting for 5.1% of all Fort Clark Springs residents.
| Immigration Origin | # Population | % Population |
| Central America | 22 | 1.7% |
| Latin America | 22 | 1.7% |
| Mexico | 22 | 1.7% | View All 3 Rows |
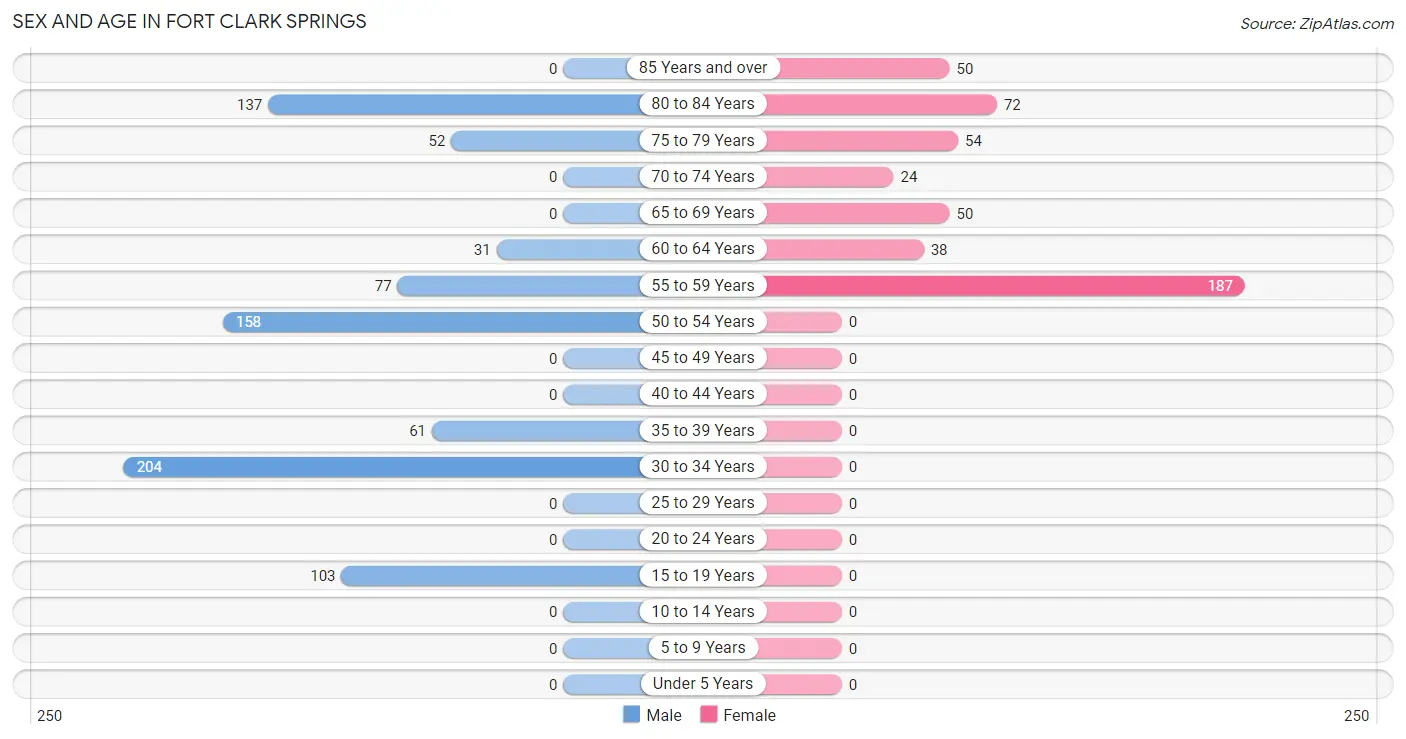
Sex and Age in Fort Clark Springs
Sex and Age in Fort Clark Springs
The most populous age groups in Fort Clark Springs are 30 to 34 Years (204 | 24.8%) for men and 55 to 59 Years (187 | 39.4%) for women.
| Age Bracket | Male | Female |
| Under 5 Years | 0 (0.0%) | 0 (0.0%) |
| 5 to 9 Years | 0 (0.0%) | 0 (0.0%) |
| 10 to 14 Years | 0 (0.0%) | 0 (0.0%) |
| 15 to 19 Years | 103 (12.5%) | 0 (0.0%) |
| 20 to 24 Years | 0 (0.0%) | 0 (0.0%) |
| 25 to 29 Years | 0 (0.0%) | 0 (0.0%) |
| 30 to 34 Years | 204 (24.8%) | 0 (0.0%) |
| 35 to 39 Years | 61 (7.4%) | 0 (0.0%) |
| 40 to 44 Years | 0 (0.0%) | 0 (0.0%) |
| 45 to 49 Years | 0 (0.0%) | 0 (0.0%) |
| 50 to 54 Years | 158 (19.2%) | 0 (0.0%) |
| 55 to 59 Years | 77 (9.4%) | 187 (39.4%) |
| 60 to 64 Years | 31 (3.8%) | 38 (8.0%) |
| 65 to 69 Years | 0 (0.0%) | 50 (10.5%) |
| 70 to 74 Years | 0 (0.0%) | 24 (5.1%) |
| 75 to 79 Years | 52 (6.3%) | 54 (11.4%) |
| 80 to 84 Years | 137 (16.7%) | 72 (15.2%) |
| 85 Years and over | 0 (0.0%) | 50 (10.5%) |
| Total | 823 (100.0%) | 475 (100.0%) |
Families and Households in Fort Clark Springs
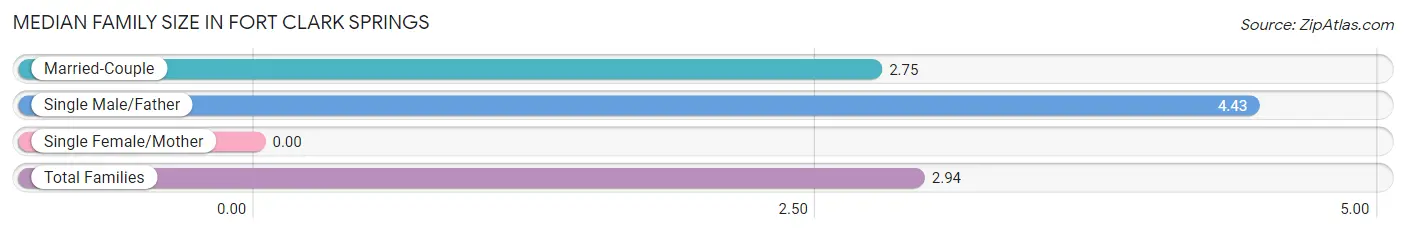
Median Family Size in Fort Clark Springs
| Family Type | # Families | Family Size |
| Married-Couple | 248 (89.2%) | 2.75 |
| Single Male/Father | 30 (10.8%) | 4.43 |
| Single Female/Mother | 0 (0.0%) | - |
| Total Families | 278 (100.0%) | 2.94 |
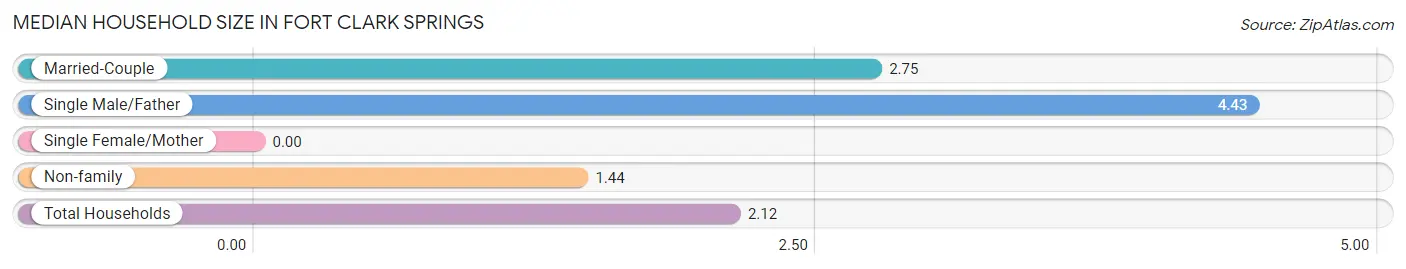
Median Household Size in Fort Clark Springs
| Household Type | # Households | Household Size |
| Married-Couple | 248 (40.5%) | 2.75 |
| Single Male/Father | 30 (4.9%) | 4.43 |
| Single Female/Mother | 0 (0.0%) | - |
| Non-family | 334 (54.6%) | 1.44 |
| Total Households | 612 (100.0%) | 2.12 |
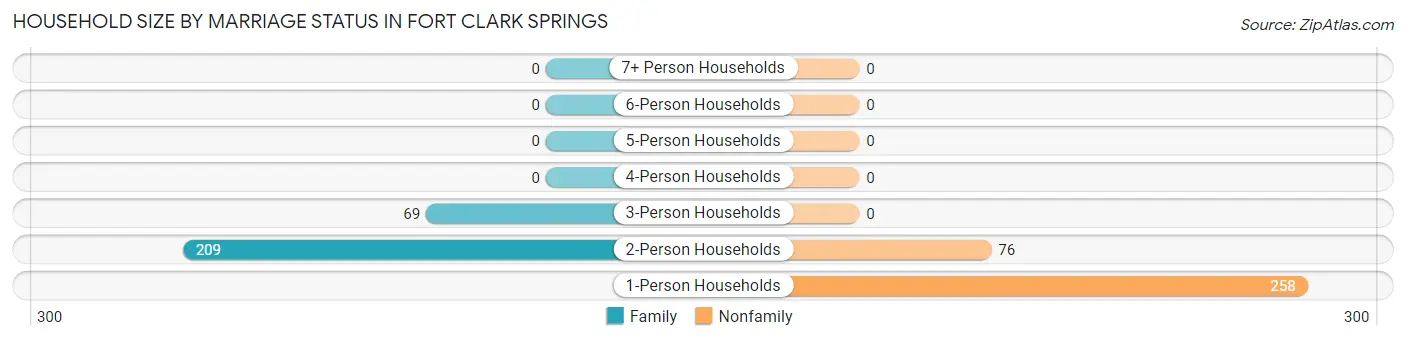
Household Size by Marriage Status in Fort Clark Springs
Out of a total of 612 households in Fort Clark Springs, 278 (45.4%) are family households, while 334 (54.6%) are nonfamily households. The most numerous type of family households are 2-person households, comprising 209, and the most common type of nonfamily households are 1-person households, comprising 258.
| Household Size | Family Households | Nonfamily Households |
| 1-Person Households | - | 258 (42.2%) |
| 2-Person Households | 209 (34.2%) | 76 (12.4%) |
| 3-Person Households | 69 (11.3%) | 0 (0.0%) |
| 4-Person Households | 0 (0.0%) | 0 (0.0%) |
| 5-Person Households | 0 (0.0%) | 0 (0.0%) |
| 6-Person Households | 0 (0.0%) | 0 (0.0%) |
| 7+ Person Households | 0 (0.0%) | 0 (0.0%) |
| Total | 278 (45.4%) | 334 (54.6%) |
Female Fertility in Fort Clark Springs
Fertility by Age in Fort Clark Springs
| Age Bracket | Women with Births | Births / 1,000 Women |
| 15 to 19 years | 0 (0.0%) | 0.0 |
| 20 to 34 years | 0 (0.0%) | 0.0 |
| 35 to 50 years | 0 (0.0%) | 0.0 |
| Total | 0 (0.0%) | 0.0 |
Fertility by Age by Marriage Status in Fort Clark Springs
| Age Bracket | Married | Unmarried |
| 15 to 19 years | 0 (0.0%) | 0 (0.0%) |
| 20 to 34 years | 0 (0.0%) | 0 (0.0%) |
| 35 to 50 years | 0 (0.0%) | 0 (0.0%) |
| Total | 0 (0.0%) | 0 (0.0%) |
Fertility by Education in Fort Clark Springs
| Educational Attainment | Women with Births | Births / 1,000 Women |
| Less than High School | 0 (0.0%) | 0.0 |
| High School Diploma | 0 (0.0%) | 0.0 |
| College or Associate's Degree | 0 (0.0%) | 0.0 |
| Bachelor's Degree | 0 (0.0%) | 0.0 |
| Graduate Degree | 0 (0.0%) | 0.0 |
| Total | 0 (0.0%) | 0.0 |
Fertility by Education by Marriage Status in Fort Clark Springs
| Educational Attainment | Married | Unmarried |
| Less than High School | 0 (0.0%) | 0 (0.0%) |
| High School Diploma | 0 (0.0%) | 0 (0.0%) |
| College or Associate's Degree | 0 (0.0%) | 0 (0.0%) |
| Bachelor's Degree | 0 (0.0%) | 0 (0.0%) |
| Graduate Degree | 0 (0.0%) | 0 (0.0%) |
| Total | 0 (0.0%) | 0 (0.0%) |
Income in Fort Clark Springs
Income Overview in Fort Clark Springs
Per Capita Income in Fort Clark Springs is $41,377, while median incomes of families and households are $70,318 and $69,611 respectively.
| Characteristic | Number | Measure |
| Per Capita Income | 1,298 | $41,377 |
| Median Family Income | 278 | $70,318 |
| Mean Family Income | 278 | $65,003 |
| Median Household Income | 612 | $69,611 |
| Mean Household Income | 612 | $75,088 |
| Income Deficit | 278 | $0 |
| Wage / Income Gap (%) | 1,298 | 0.00% |
| Wage / Income Gap ($) | 1,298 | 100.00¢ per $1 |
| Gini / Inequality Index | 1,298 | 0.38 |
Earnings by Sex in Fort Clark Springs
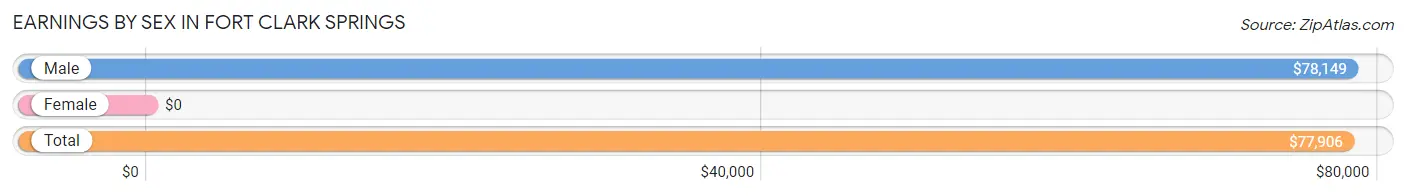
| Sex | Number | Average Earnings |
| Male | 266 (46.1%) | $78,149 |
| Female | 311 (53.9%) | $0 |
| Total | 577 (100.0%) | $77,906 |
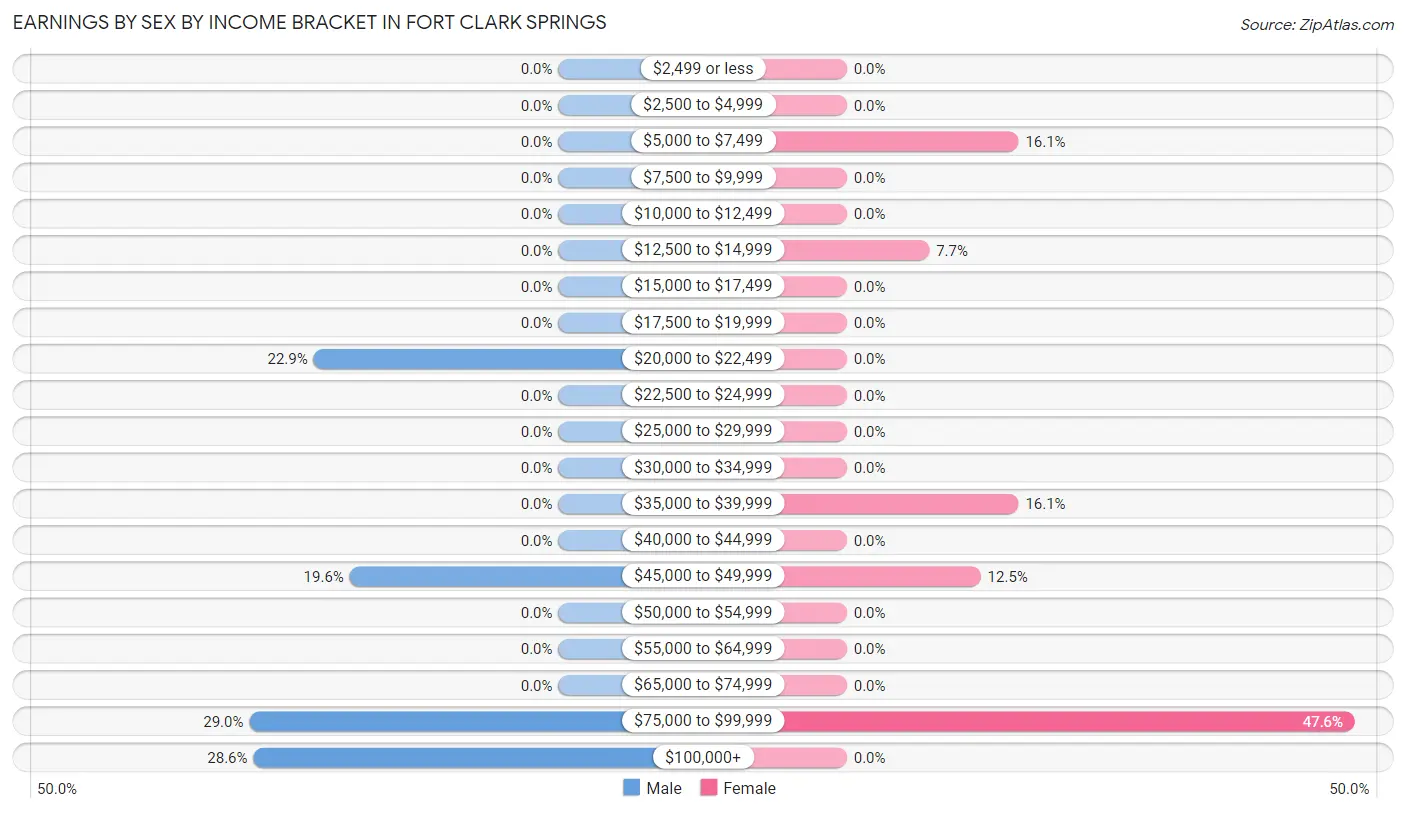
Earnings by Sex by Income Bracket in Fort Clark Springs
The most common earnings brackets in Fort Clark Springs are $75,000 to $99,999 for men (77 | 28.9%) and $75,000 to $99,999 for women (148 | 47.6%).
| Income | Male | Female |
| $2,499 or less | 0 (0.0%) | 0 (0.0%) |
| $2,500 to $4,999 | 0 (0.0%) | 0 (0.0%) |
| $5,000 to $7,499 | 0 (0.0%) | 50 (16.1%) |
| $7,500 to $9,999 | 0 (0.0%) | 0 (0.0%) |
| $10,000 to $12,499 | 0 (0.0%) | 0 (0.0%) |
| $12,500 to $14,999 | 0 (0.0%) | 24 (7.7%) |
| $15,000 to $17,499 | 0 (0.0%) | 0 (0.0%) |
| $17,500 to $19,999 | 0 (0.0%) | 0 (0.0%) |
| $20,000 to $22,499 | 61 (22.9%) | 0 (0.0%) |
| $22,500 to $24,999 | 0 (0.0%) | 0 (0.0%) |
| $25,000 to $29,999 | 0 (0.0%) | 0 (0.0%) |
| $30,000 to $34,999 | 0 (0.0%) | 0 (0.0%) |
| $35,000 to $39,999 | 0 (0.0%) | 50 (16.1%) |
| $40,000 to $44,999 | 0 (0.0%) | 0 (0.0%) |
| $45,000 to $49,999 | 52 (19.6%) | 39 (12.5%) |
| $50,000 to $54,999 | 0 (0.0%) | 0 (0.0%) |
| $55,000 to $64,999 | 0 (0.0%) | 0 (0.0%) |
| $65,000 to $74,999 | 0 (0.0%) | 0 (0.0%) |
| $75,000 to $99,999 | 77 (28.9%) | 148 (47.6%) |
| $100,000+ | 76 (28.6%) | 0 (0.0%) |
| Total | 266 (100.0%) | 311 (100.0%) |
Earnings by Sex by Educational Attainment in Fort Clark Springs
| Educational Attainment | Male Income | Female Income |
| Less than High School | - | - |
| High School Diploma | - | - |
| College or Associate's Degree | - | - |
| Bachelor's Degree | - | - |
| Graduate Degree | - | - |
| Total | $78,149 | $0 |
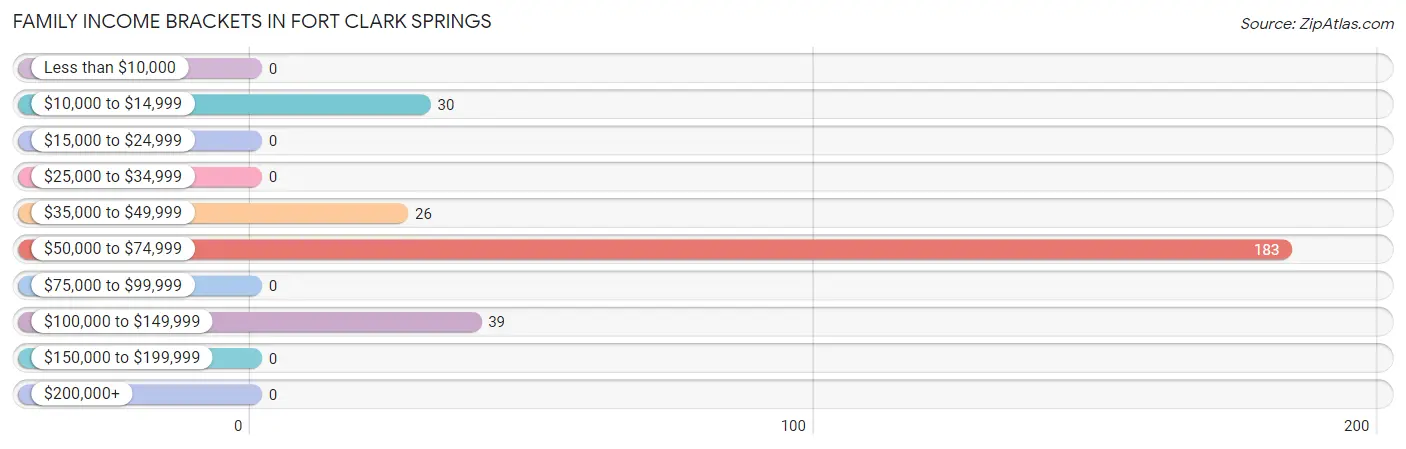
Family Income in Fort Clark Springs
Family Income Brackets in Fort Clark Springs
According to the Fort Clark Springs family income data, there are 183 families falling into the $50,000 to $74,999 income range, which is the most common income bracket and makes up 65.8% of all families.
| Income Bracket | # Families | % Families |
| Less than $10,000 | 0 | 0.0% |
| $10,000 to $14,999 | 30 | 10.8% |
| $15,000 to $24,999 | 0 | 0.0% |
| $25,000 to $34,999 | 0 | 0.0% |
| $35,000 to $49,999 | 26 | 9.4% |
| $50,000 to $74,999 | 183 | 65.8% |
| $75,000 to $99,999 | 0 | 0.0% |
| $100,000 to $149,999 | 39 | 14.0% |
| $150,000 to $199,999 | 0 | 0.0% |
| $200,000+ | 0 | 0.0% |
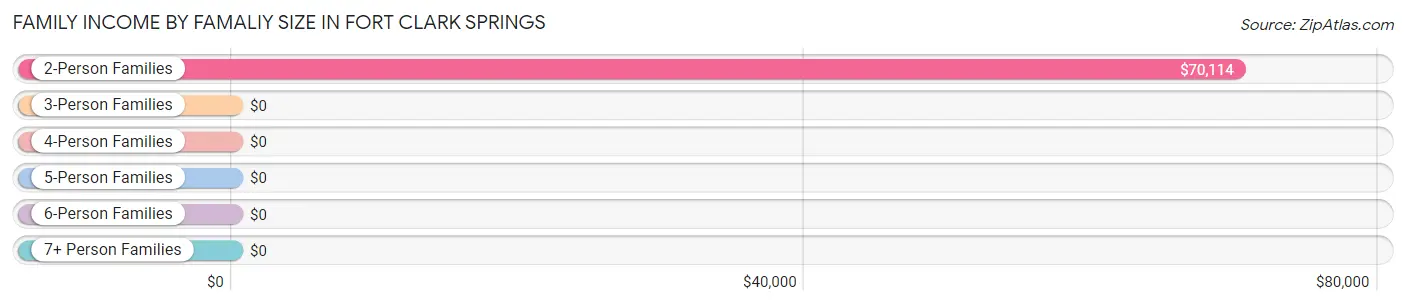
Family Income by Famaliy Size in Fort Clark Springs
2-person families (209 | 75.2%) account for the highest median family income in Fort Clark Springs with $70,114 per family, while 2-person families (209 | 75.2%) have the highest median income of $35,057 per family member.
| Income Bracket | # Families | Median Income |
| 2-Person Families | 209 (75.2%) | $70,114 |
| 3-Person Families | 69 (24.8%) | $0 |
| 4-Person Families | 0 (0.0%) | $0 |
| 5-Person Families | 0 (0.0%) | $0 |
| 6-Person Families | 0 (0.0%) | $0 |
| 7+ Person Families | 0 (0.0%) | $0 |
| Total | 278 (100.0%) | $70,318 |
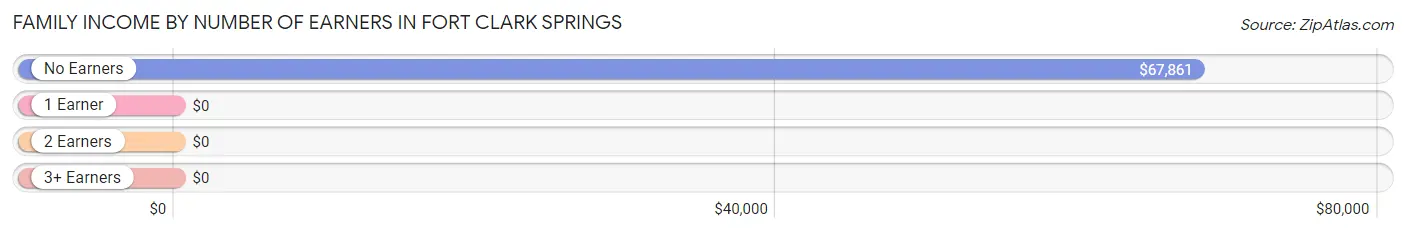
Family Income by Number of Earners in Fort Clark Springs
| Number of Earners | # Families | Median Income |
| No Earners | 187 (67.3%) | $67,861 |
| 1 Earner | 52 (18.7%) | $0 |
| 2 Earners | 39 (14.0%) | $0 |
| 3+ Earners | 0 (0.0%) | $0 |
| Total | 278 (100.0%) | $70,318 |
Household Income in Fort Clark Springs
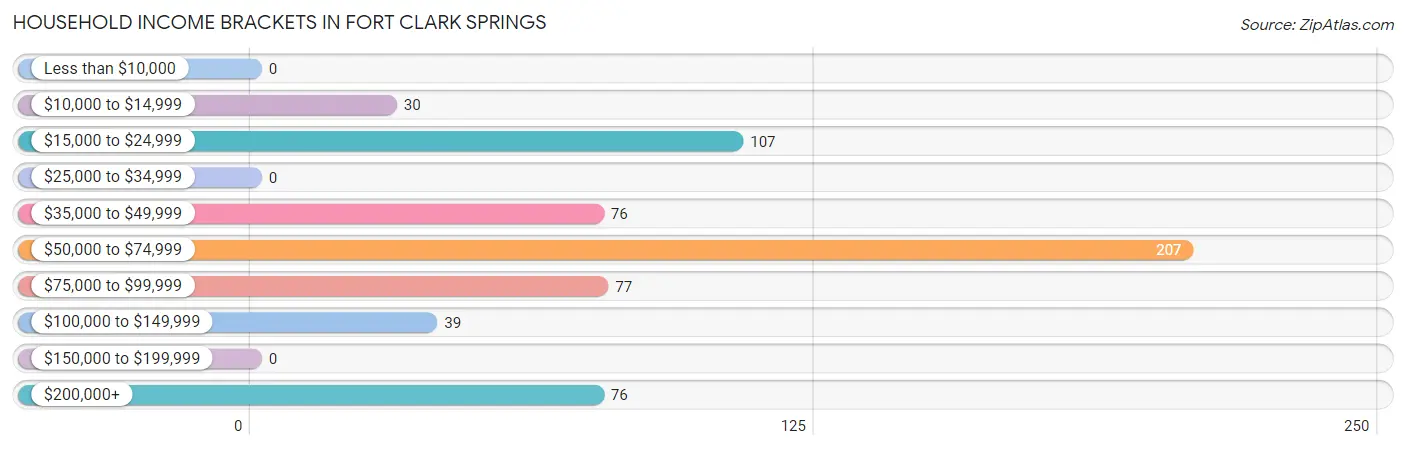
Household Income Brackets in Fort Clark Springs
With 207 households falling in the category, the $50,000 to $74,999 income range is the most frequent in Fort Clark Springs, accounting for 33.8% of all households.
| Income Bracket | # Households | % Households |
| Less than $10,000 | 0 | 0.0% |
| $10,000 to $14,999 | 30 | 4.9% |
| $15,000 to $24,999 | 107 | 17.5% |
| $25,000 to $34,999 | 0 | 0.0% |
| $35,000 to $49,999 | 76 | 12.4% |
| $50,000 to $74,999 | 207 | 33.8% |
| $75,000 to $99,999 | 77 | 12.6% |
| $100,000 to $149,999 | 39 | 6.4% |
| $150,000 to $199,999 | 0 | 0.0% |
| $200,000+ | 76 | 12.4% |
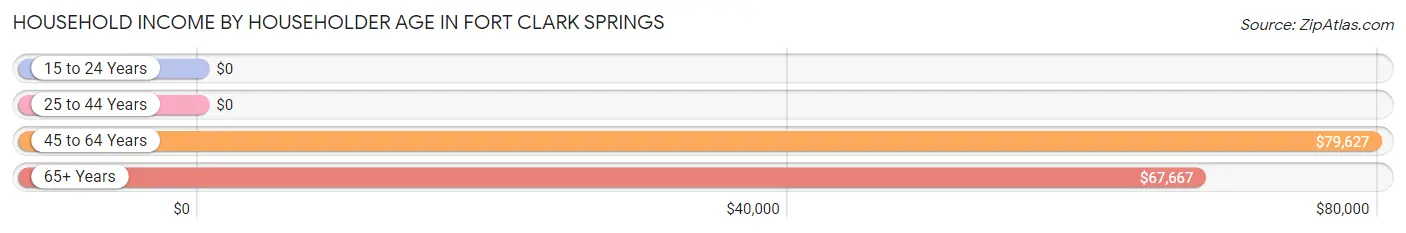
Household Income by Householder Age in Fort Clark Springs
The median household income in Fort Clark Springs is $69,611, with the highest median household income of $79,627 found in the 45 to 64 years age bracket for the primary householder. A total of 253 households (41.3%) fall into this category.
| Income Bracket | # Households | Median Income |
| 15 to 24 Years | 0 (0.0%) | $0 |
| 25 to 44 Years | 61 (10.0%) | $0 |
| 45 to 64 Years | 253 (41.3%) | $79,627 |
| 65+ Years | 298 (48.7%) | $67,667 |
| Total | 612 (100.0%) | $69,611 |
Poverty in Fort Clark Springs
Income Below Poverty by Sex and Age in Fort Clark Springs
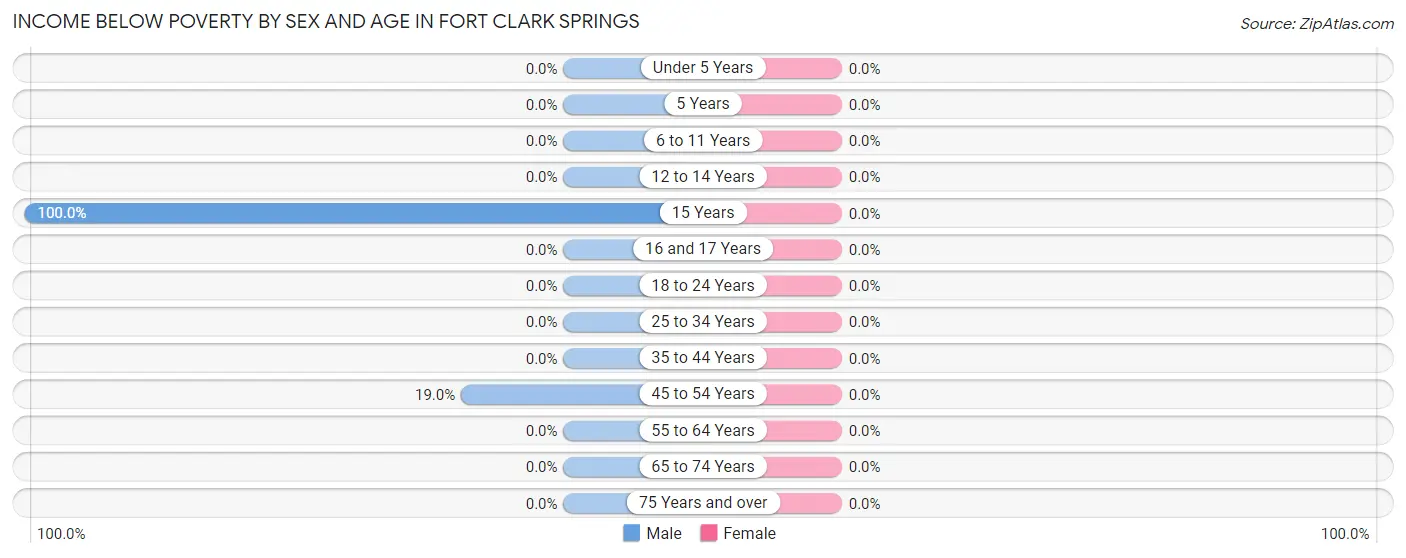
| Age Bracket | Male | Female |
| Under 5 Years | 0 (0.0%) | 0 (0.0%) |
| 5 Years | 0 (0.0%) | 0 (0.0%) |
| 6 to 11 Years | 0 (0.0%) | 0 (0.0%) |
| 12 to 14 Years | 0 (0.0%) | 0 (0.0%) |
| 15 Years | 103 (100.0%) | 0 (0.0%) |
| 16 and 17 Years | 0 (0.0%) | 0 (0.0%) |
| 18 to 24 Years | 0 (0.0%) | 0 (0.0%) |
| 25 to 34 Years | 0 (0.0%) | 0 (0.0%) |
| 35 to 44 Years | 0 (0.0%) | 0 (0.0%) |
| 45 to 54 Years | 30 (19.0%) | 0 (0.0%) |
| 55 to 64 Years | 0 (0.0%) | 0 (0.0%) |
| 65 to 74 Years | 0 (0.0%) | 0 (0.0%) |
| 75 Years and over | 0 (0.0%) | 0 (0.0%) |
| Total | 133 (16.2%) | 0 (0.0%) |
Income Above Poverty by Sex and Age in Fort Clark Springs
According to the poverty statistics in Fort Clark Springs, males aged 25 to 34 years and females aged 55 to 64 years are the age groups that are most secure financially, with 100.0% of males and 100.0% of females in these age groups living above the poverty line.
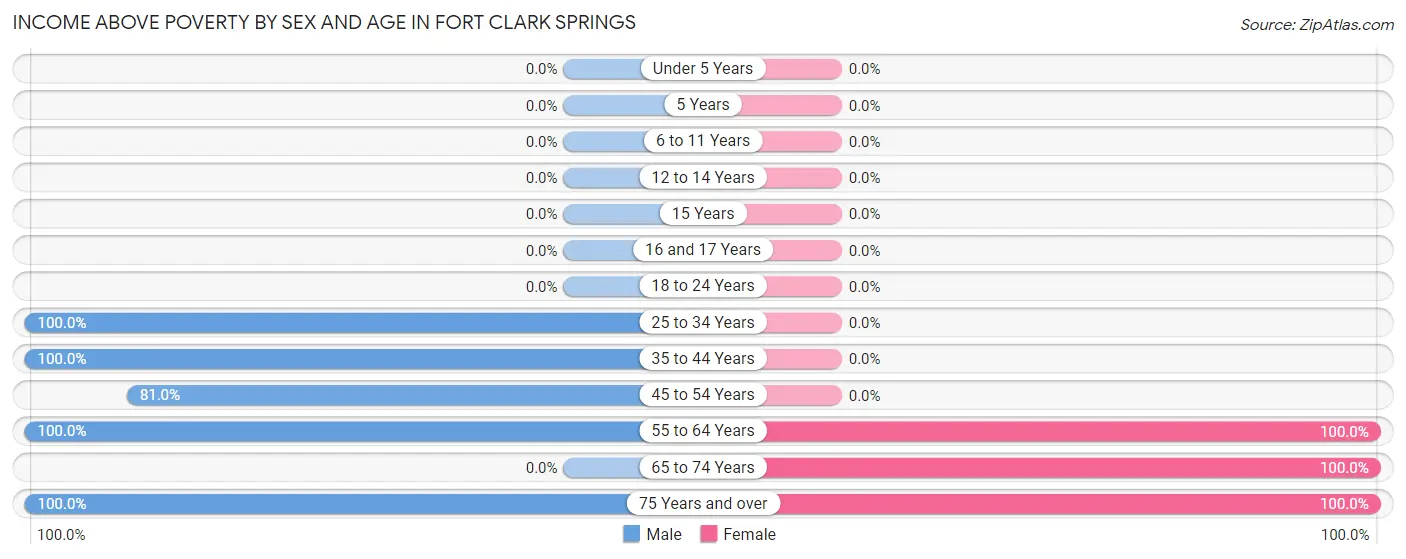
| Age Bracket | Male | Female |
| Under 5 Years | 0 (0.0%) | 0 (0.0%) |
| 5 Years | 0 (0.0%) | 0 (0.0%) |
| 6 to 11 Years | 0 (0.0%) | 0 (0.0%) |
| 12 to 14 Years | 0 (0.0%) | 0 (0.0%) |
| 15 Years | 0 (0.0%) | 0 (0.0%) |
| 16 and 17 Years | 0 (0.0%) | 0 (0.0%) |
| 18 to 24 Years | 0 (0.0%) | 0 (0.0%) |
| 25 to 34 Years | 204 (100.0%) | 0 (0.0%) |
| 35 to 44 Years | 61 (100.0%) | 0 (0.0%) |
| 45 to 54 Years | 128 (81.0%) | 0 (0.0%) |
| 55 to 64 Years | 108 (100.0%) | 225 (100.0%) |
| 65 to 74 Years | 0 (0.0%) | 74 (100.0%) |
| 75 Years and over | 189 (100.0%) | 176 (100.0%) |
| Total | 690 (83.8%) | 475 (100.0%) |
Income Below Poverty Among Married-Couple Families in Fort Clark Springs
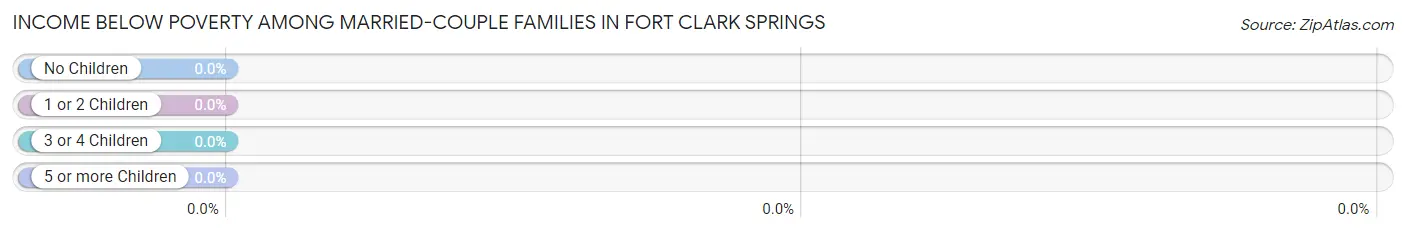
| Children | Above Poverty | Below Poverty |
| No Children | 248 (100.0%) | 0 (0.0%) |
| 1 or 2 Children | 0 (0.0%) | 0 (0.0%) |
| 3 or 4 Children | 0 (0.0%) | 0 (0.0%) |
| 5 or more Children | 0 (0.0%) | 0 (0.0%) |
| Total | 248 (100.0%) | 0 (0.0%) |
Income Below Poverty Among Single-Parent Households in Fort Clark Springs
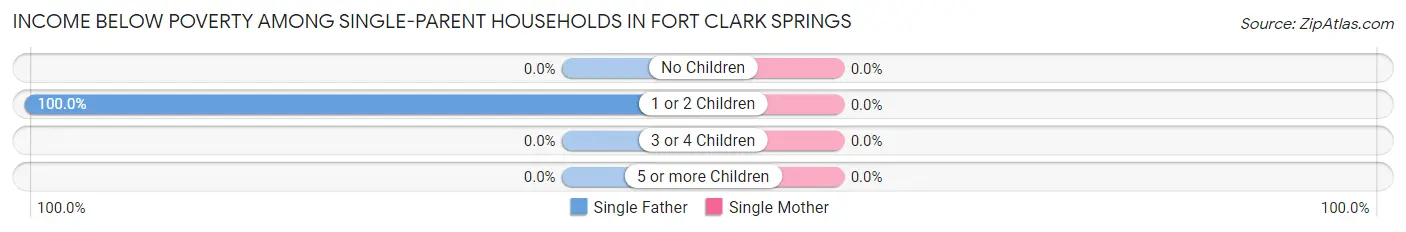
| Children | Single Father | Single Mother |
| No Children | 0 (0.0%) | 0 (0.0%) |
| 1 or 2 Children | 30 (100.0%) | 0 (0.0%) |
| 3 or 4 Children | 0 (0.0%) | 0 (0.0%) |
| 5 or more Children | 0 (0.0%) | 0 (0.0%) |
| Total | 30 (100.0%) | 0 (0.0%) |
Income Below Poverty Among Married-Couple vs Single-Parent Households in Fort Clark Springs
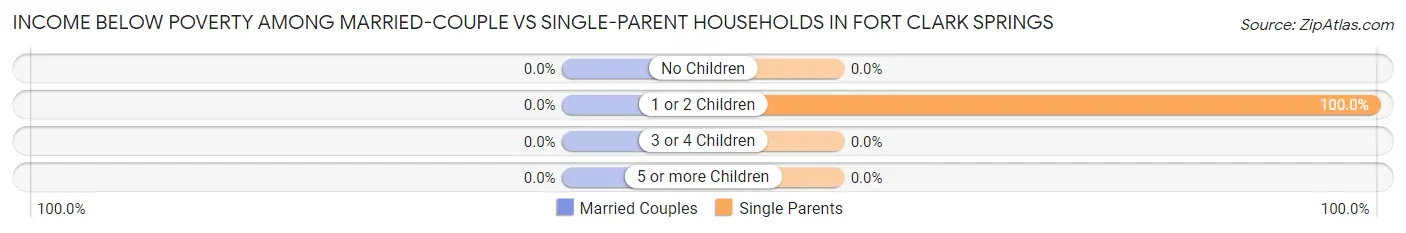
| Children | Married-Couple Families | Single-Parent Households |
| No Children | 0 (0.0%) | 0 (0.0%) |
| 1 or 2 Children | 0 (0.0%) | 30 (100.0%) |
| 3 or 4 Children | 0 (0.0%) | 0 (0.0%) |
| 5 or more Children | 0 (0.0%) | 0 (0.0%) |
| Total | 0 (0.0%) | 30 (100.0%) |
Employment Characteristics in Fort Clark Springs
Employment by Class of Employer in Fort Clark Springs
Among the 577 employed individuals in Fort Clark Springs, local government employees (229 | 39.7%), federal government employees (148 | 25.7%), and private company employees (126 | 21.8%) make up the most common classes of employment.
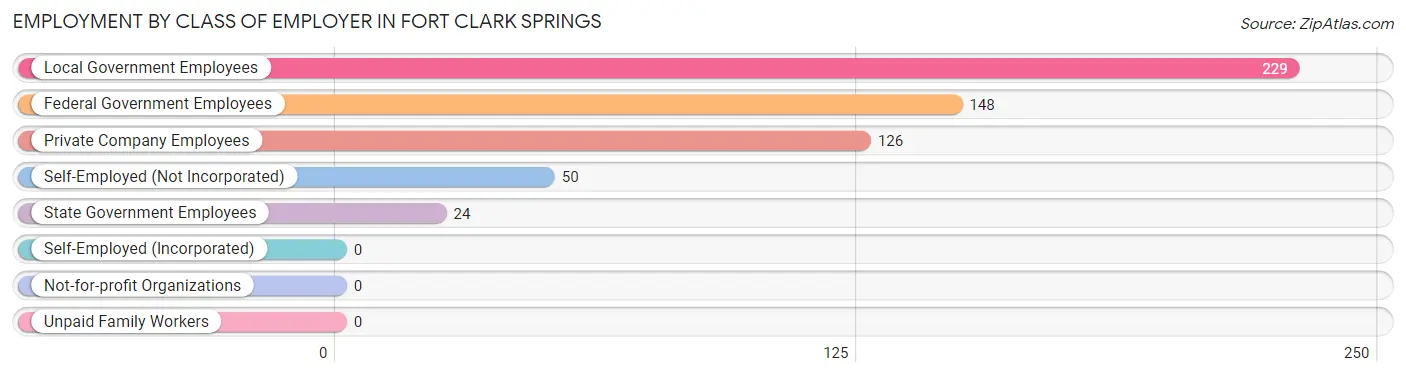
| Employer Class | # Employees | % Employees |
| Private Company Employees | 126 | 21.8% |
| Self-Employed (Incorporated) | 0 | 0.0% |
| Self-Employed (Not Incorporated) | 50 | 8.7% |
| Not-for-profit Organizations | 0 | 0.0% |
| Local Government Employees | 229 | 39.7% |
| State Government Employees | 24 | 4.2% |
| Federal Government Employees | 148 | 25.7% |
| Unpaid Family Workers | 0 | 0.0% |
| Total | 577 | 100.0% |
Employment Status by Age in Fort Clark Springs
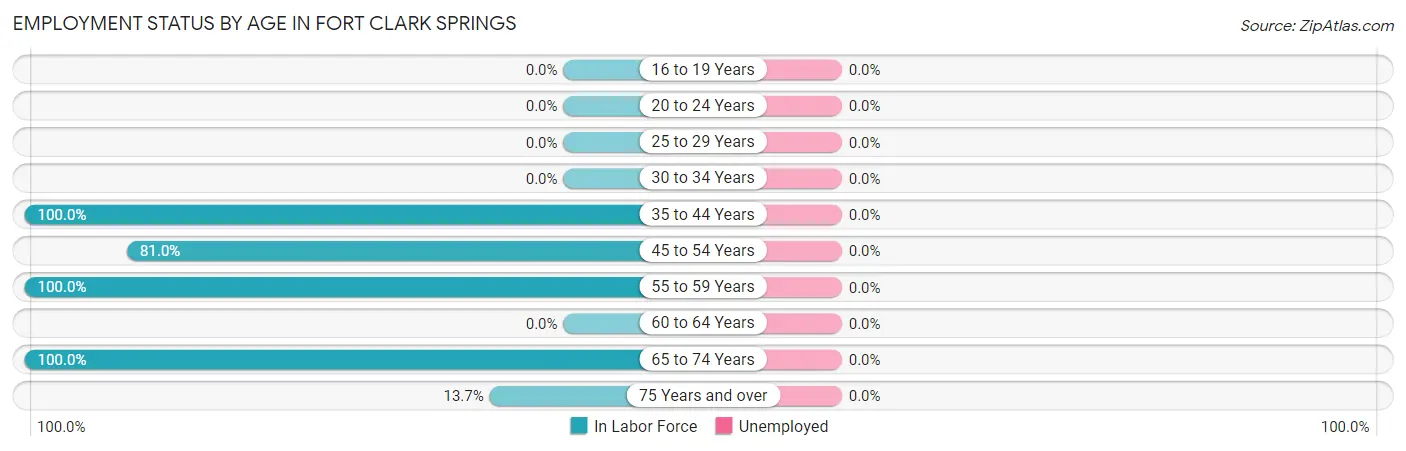
| Age Bracket | In Labor Force | Unemployed |
| 16 to 19 Years | 0 (0.0%) | 0 (0.0%) |
| 20 to 24 Years | 0 (0.0%) | 0 (0.0%) |
| 25 to 29 Years | 0 (0.0%) | 0 (0.0%) |
| 30 to 34 Years | 0 (0.0%) | 0 (0.0%) |
| 35 to 44 Years | 61 (100.0%) | 0 (0.0%) |
| 45 to 54 Years | 128 (81.0%) | 0 (0.0%) |
| 55 to 59 Years | 264 (100.0%) | 0 (0.0%) |
| 60 to 64 Years | 0 (0.0%) | 0 (0.0%) |
| 65 to 74 Years | 74 (100.0%) | 0 (0.0%) |
| 75 Years and over | 50 (13.7%) | 0 (0.0%) |
| Total | 577 (48.3%) | 0 (0.0%) |
Employment Status by Educational Attainment in Fort Clark Springs
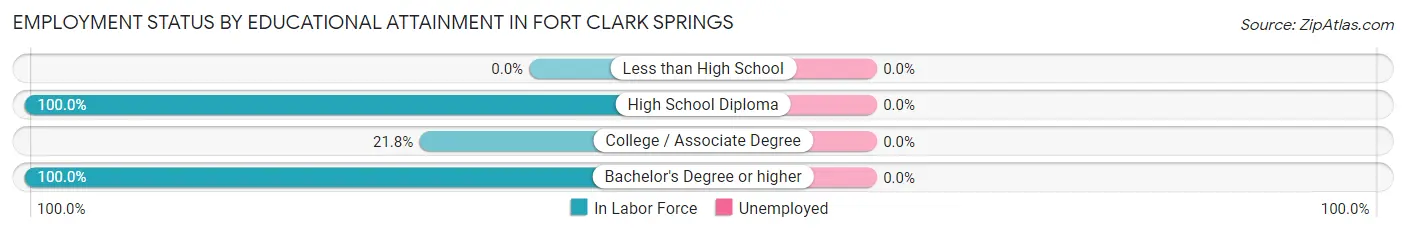
| Educational Attainment | In Labor Force | Unemployed |
| Less than High School | 0 (0.0%) | 0 (0.0%) |
| High School Diploma | 152 (100.0%) | 0 (0.0%) |
| College / Associate Degree | 76 (21.8%) | 0 (0.0%) |
| Bachelor's Degree or higher | 225 (100.0%) | 0 (0.0%) |
| Total | 453 (59.9%) | 0 (0.0%) |
Employment Occupations by Sex in Fort Clark Springs
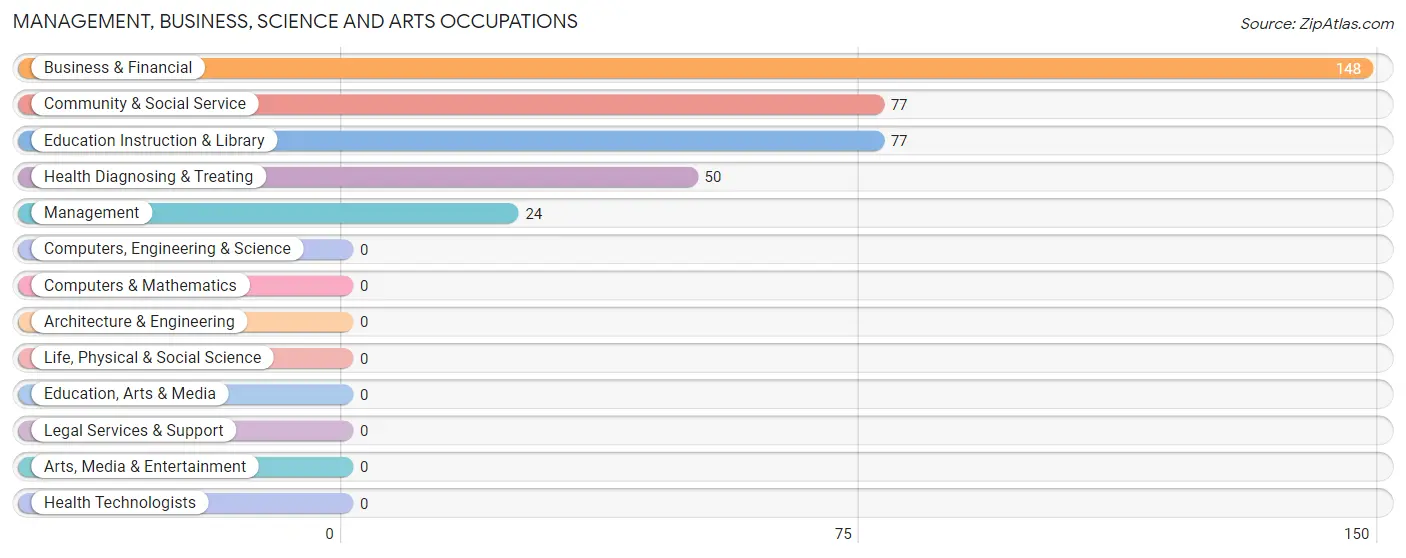
Management, Business, Science and Arts Occupations
The most common Management, Business, Science and Arts occupations in Fort Clark Springs are Business & Financial (148 | 25.7%), Community & Social Service (77 | 13.3%), Education Instruction & Library (77 | 13.3%), Health Diagnosing & Treating (50 | 8.7%), and Management (24 | 4.2%).
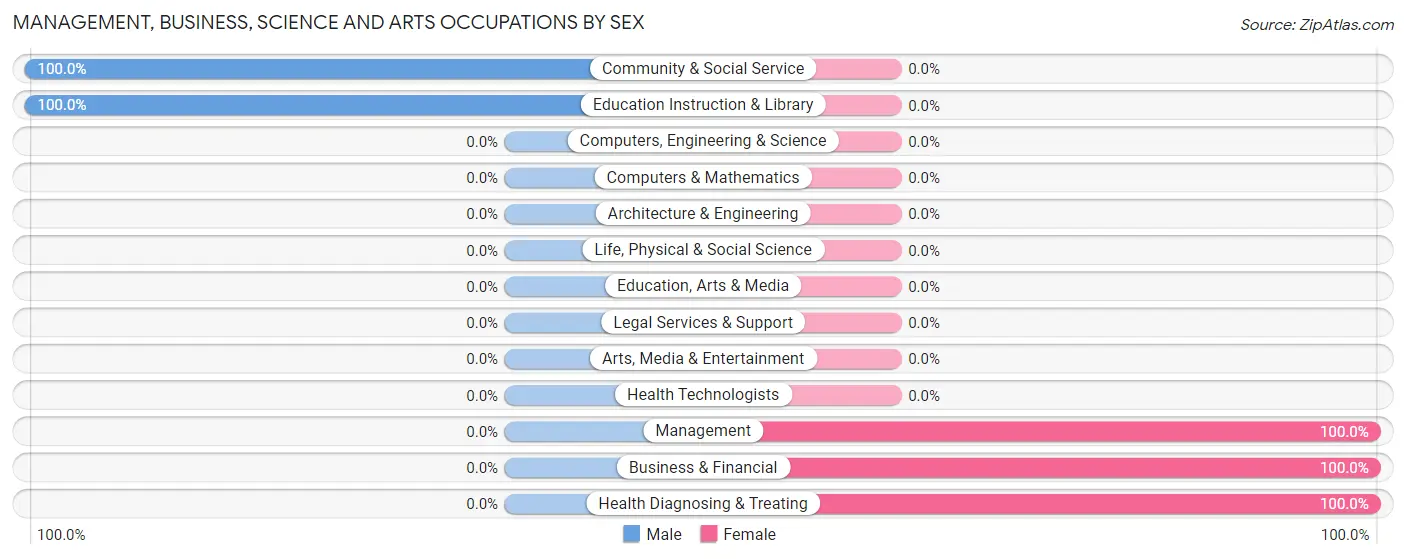
Management, Business, Science and Arts Occupations by Sex
Within the Management, Business, Science and Arts occupations in Fort Clark Springs, the most male-oriented occupations are Community & Social Service (100.0%), and Education Instruction & Library (100.0%), while the most female-oriented occupations are Management (100.0%), Business & Financial (100.0%), and Health Diagnosing & Treating (100.0%).
| Occupation | Male | Female |
| Management | 0 (0.0%) | 24 (100.0%) |
| Business & Financial | 0 (0.0%) | 148 (100.0%) |
| Computers, Engineering & Science | 0 (0.0%) | 0 (0.0%) |
| Computers & Mathematics | 0 (0.0%) | 0 (0.0%) |
| Architecture & Engineering | 0 (0.0%) | 0 (0.0%) |
| Life, Physical & Social Science | 0 (0.0%) | 0 (0.0%) |
| Community & Social Service | 77 (100.0%) | 0 (0.0%) |
| Education, Arts & Media | 0 (0.0%) | 0 (0.0%) |
| Legal Services & Support | 0 (0.0%) | 0 (0.0%) |
| Education Instruction & Library | 77 (100.0%) | 0 (0.0%) |
| Arts, Media & Entertainment | 0 (0.0%) | 0 (0.0%) |
| Health Diagnosing & Treating | 0 (0.0%) | 50 (100.0%) |
| Health Technologists | 0 (0.0%) | 0 (0.0%) |
| Total (Category) | 77 (25.8%) | 222 (74.3%) |
| Total (Overall) | 266 (46.1%) | 311 (53.9%) |
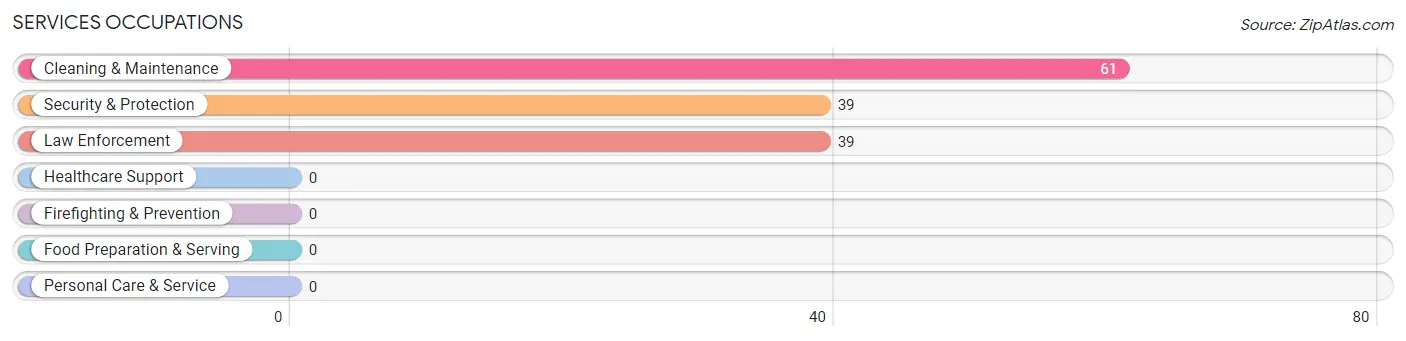
Services Occupations
The most common Services occupations in Fort Clark Springs are Cleaning & Maintenance (61 | 10.6%), Security & Protection (39 | 6.8%), and Law Enforcement (39 | 6.8%).
Services Occupations by Sex
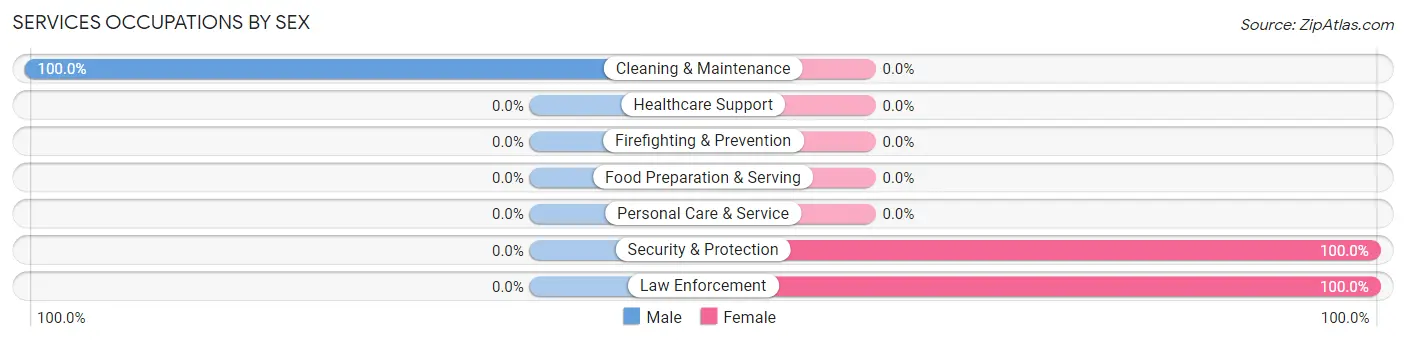
| Occupation | Male | Female |
| Healthcare Support | 0 (0.0%) | 0 (0.0%) |
| Security & Protection | 0 (0.0%) | 39 (100.0%) |
| Firefighting & Prevention | 0 (0.0%) | 0 (0.0%) |
| Law Enforcement | 0 (0.0%) | 39 (100.0%) |
| Food Preparation & Serving | 0 (0.0%) | 0 (0.0%) |
| Cleaning & Maintenance | 61 (100.0%) | 0 (0.0%) |
| Personal Care & Service | 0 (0.0%) | 0 (0.0%) |
| Total (Category) | 61 (61.0%) | 39 (39.0%) |
| Total (Overall) | 266 (46.1%) | 311 (53.9%) |
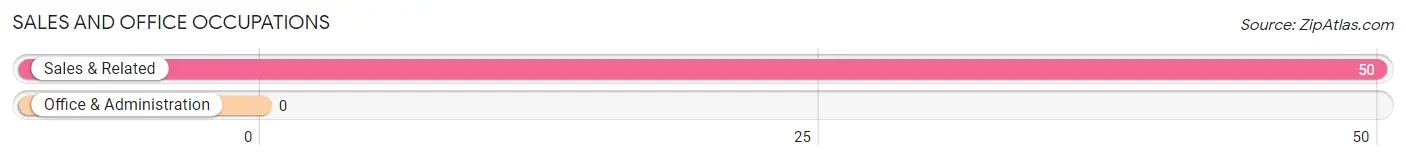
Sales and Office Occupations
The most common Sales and Office occupations in Fort Clark Springs are , and Sales & Related (50 | 8.7%).
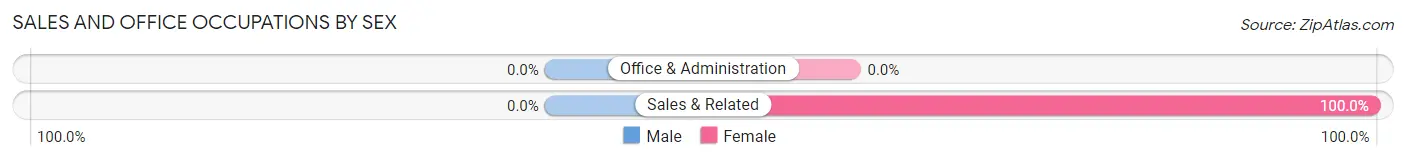
Sales and Office Occupations by Sex
| Occupation | Male | Female |
| Sales & Related | 0 (0.0%) | 50 (100.0%) |
| Office & Administration | 0 (0.0%) | 0 (0.0%) |
| Total (Category) | 0 (0.0%) | 50 (100.0%) |
| Total (Overall) | 266 (46.1%) | 311 (53.9%) |
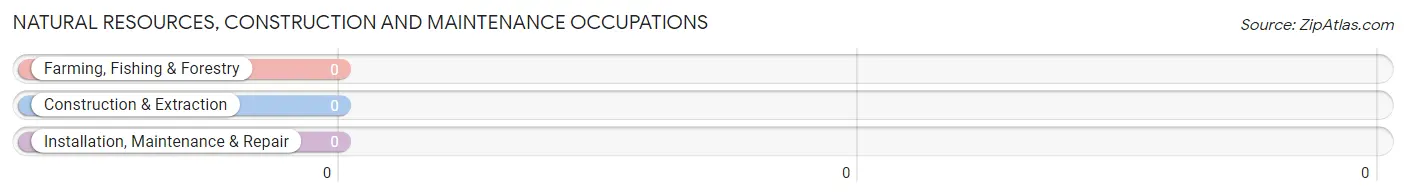
Natural Resources, Construction and Maintenance Occupations
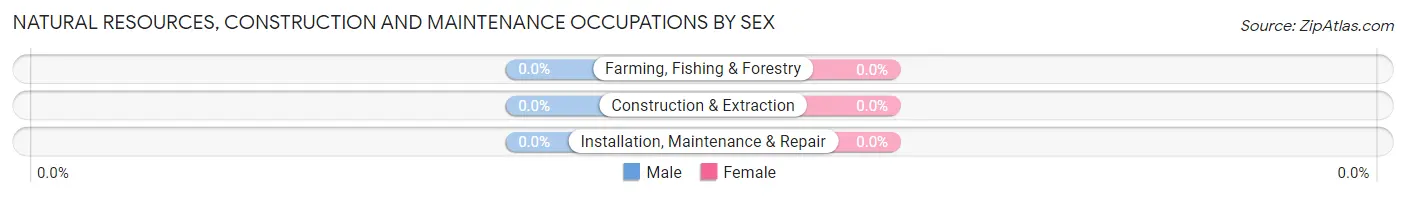
Natural Resources, Construction and Maintenance Occupations by Sex
| Occupation | Male | Female |
| Farming, Fishing & Forestry | 0 (0.0%) | 0 (0.0%) |
| Construction & Extraction | 0 (0.0%) | 0 (0.0%) |
| Installation, Maintenance & Repair | 0 (0.0%) | 0 (0.0%) |
| Total (Category) | 0 (0.0%) | 0 (0.0%) |
| Total (Overall) | 266 (46.1%) | 311 (53.9%) |
Production, Transportation and Moving Occupations
The most common Production, Transportation and Moving occupations in Fort Clark Springs are , and Transportation (128 | 22.2%).
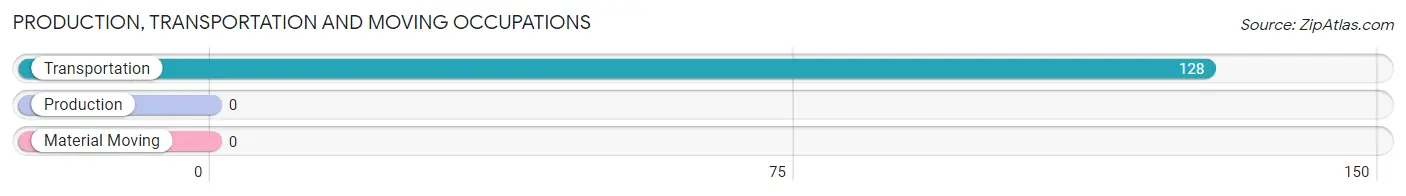
Production, Transportation and Moving Occupations by Sex
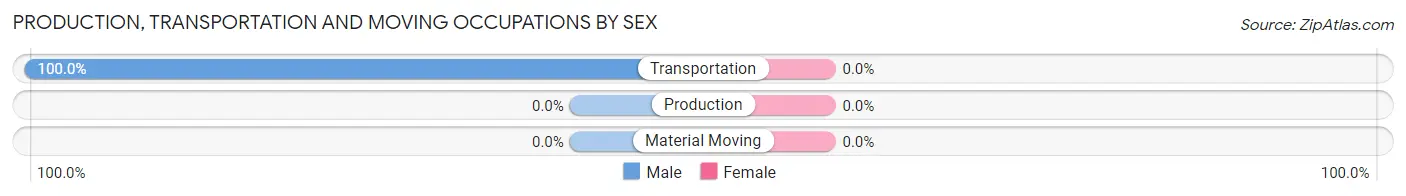
| Occupation | Male | Female |
| Production | 0 (0.0%) | 0 (0.0%) |
| Transportation | 128 (100.0%) | 0 (0.0%) |
| Material Moving | 0 (0.0%) | 0 (0.0%) |
| Total (Category) | 128 (100.0%) | 0 (0.0%) |
| Total (Overall) | 266 (46.1%) | 311 (53.9%) |
Employment Industries by Sex in Fort Clark Springs
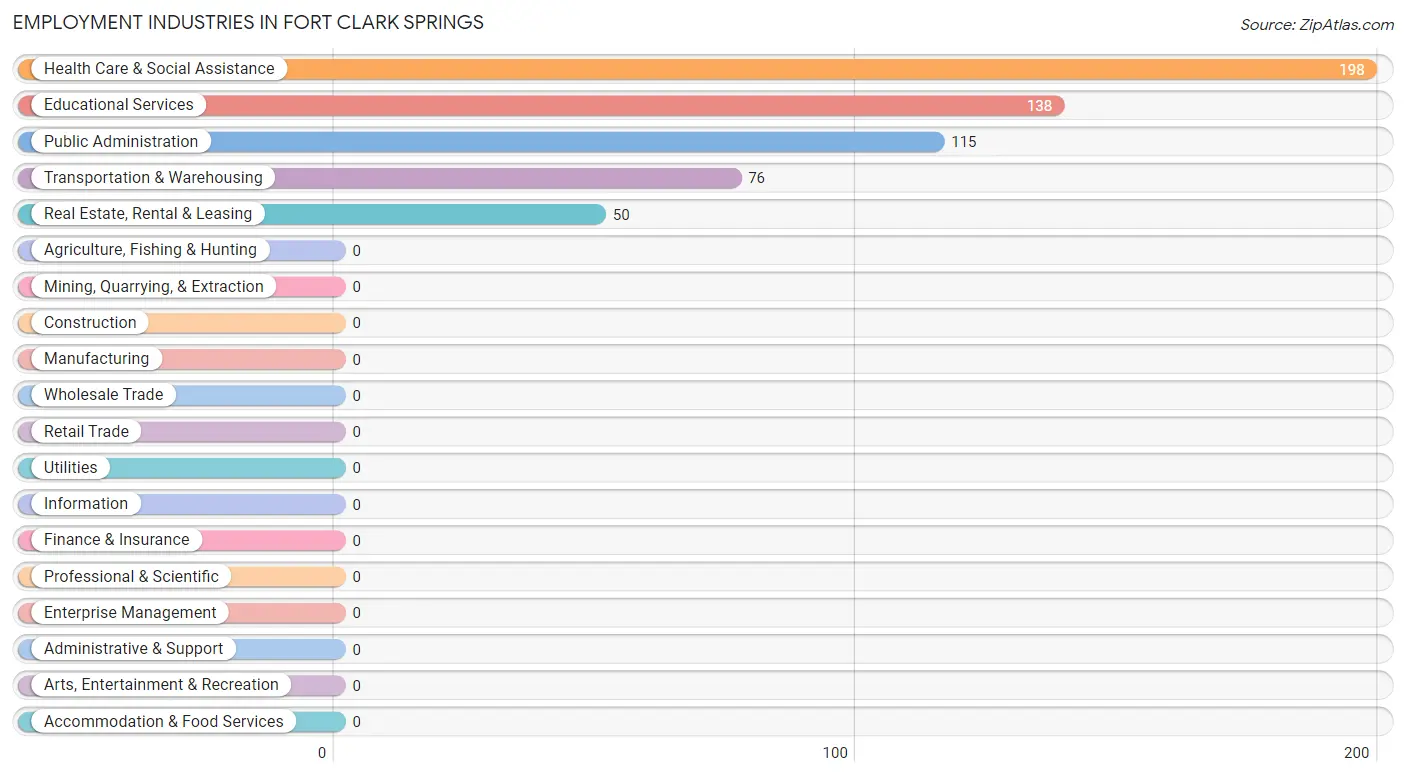
Employment Industries in Fort Clark Springs
The major employment industries in Fort Clark Springs include Health Care & Social Assistance (198 | 34.3%), Educational Services (138 | 23.9%), Public Administration (115 | 19.9%), Transportation & Warehousing (76 | 13.2%), and Real Estate, Rental & Leasing (50 | 8.7%).
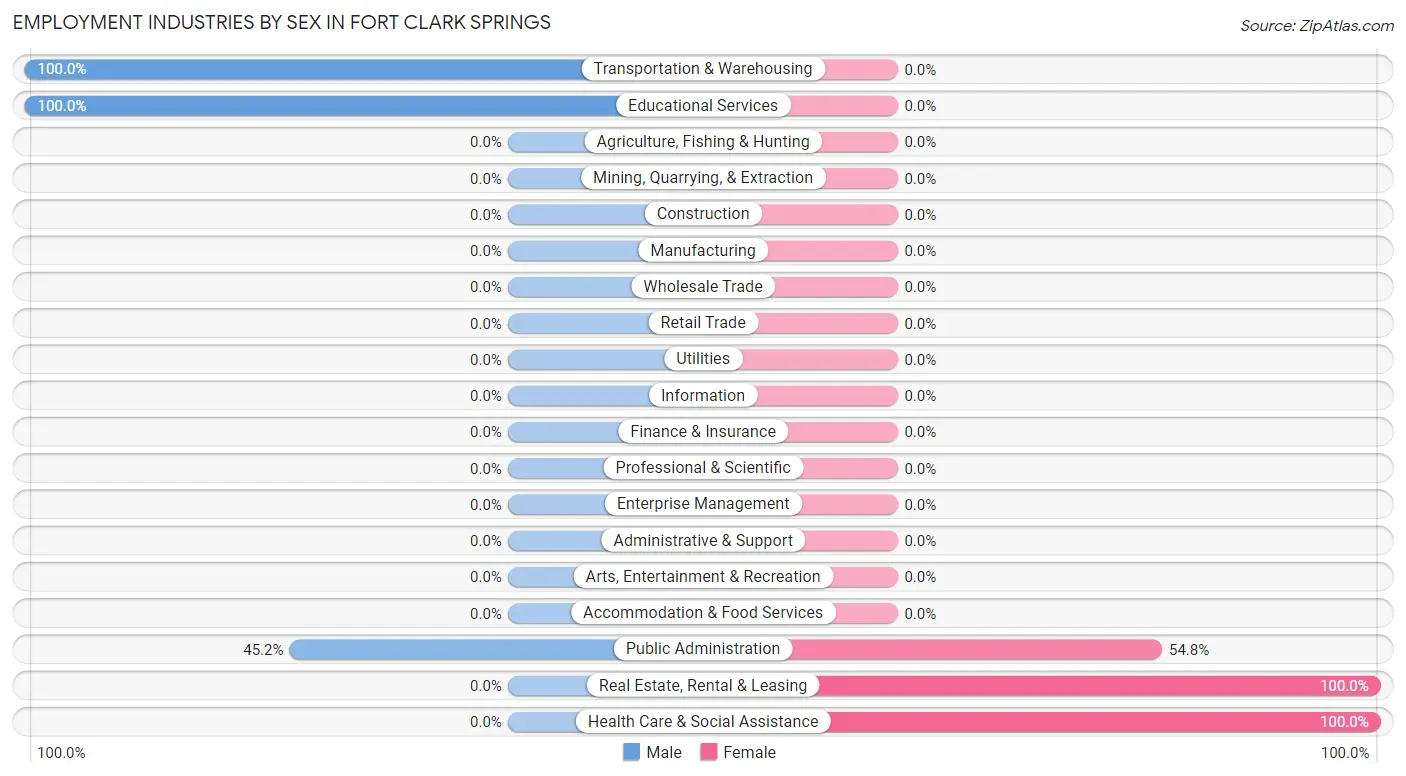
Employment Industries by Sex in Fort Clark Springs
The Fort Clark Springs industries that see more men than women are Transportation & Warehousing (100.0%), Educational Services (100.0%), and Public Administration (45.2%), whereas the industries that tend to have a higher number of women are Real Estate, Rental & Leasing (100.0%), Health Care & Social Assistance (100.0%), and Public Administration (54.8%).
| Industry | Male | Female |
| Agriculture, Fishing & Hunting | 0 (0.0%) | 0 (0.0%) |
| Mining, Quarrying, & Extraction | 0 (0.0%) | 0 (0.0%) |
| Construction | 0 (0.0%) | 0 (0.0%) |
| Manufacturing | 0 (0.0%) | 0 (0.0%) |
| Wholesale Trade | 0 (0.0%) | 0 (0.0%) |
| Retail Trade | 0 (0.0%) | 0 (0.0%) |
| Transportation & Warehousing | 76 (100.0%) | 0 (0.0%) |
| Utilities | 0 (0.0%) | 0 (0.0%) |
| Information | 0 (0.0%) | 0 (0.0%) |
| Finance & Insurance | 0 (0.0%) | 0 (0.0%) |
| Real Estate, Rental & Leasing | 0 (0.0%) | 50 (100.0%) |
| Professional & Scientific | 0 (0.0%) | 0 (0.0%) |
| Enterprise Management | 0 (0.0%) | 0 (0.0%) |
| Administrative & Support | 0 (0.0%) | 0 (0.0%) |
| Educational Services | 138 (100.0%) | 0 (0.0%) |
| Health Care & Social Assistance | 0 (0.0%) | 198 (100.0%) |
| Arts, Entertainment & Recreation | 0 (0.0%) | 0 (0.0%) |
| Accommodation & Food Services | 0 (0.0%) | 0 (0.0%) |
| Public Administration | 52 (45.2%) | 63 (54.8%) |
| Total | 266 (46.1%) | 311 (53.9%) |
Education in Fort Clark Springs
School Enrollment in Fort Clark Springs
The most common levels of schooling among the 307 students in Fort Clark Springs are college / undergraduate (204 | 66.4%), and high school (103 | 33.6%).
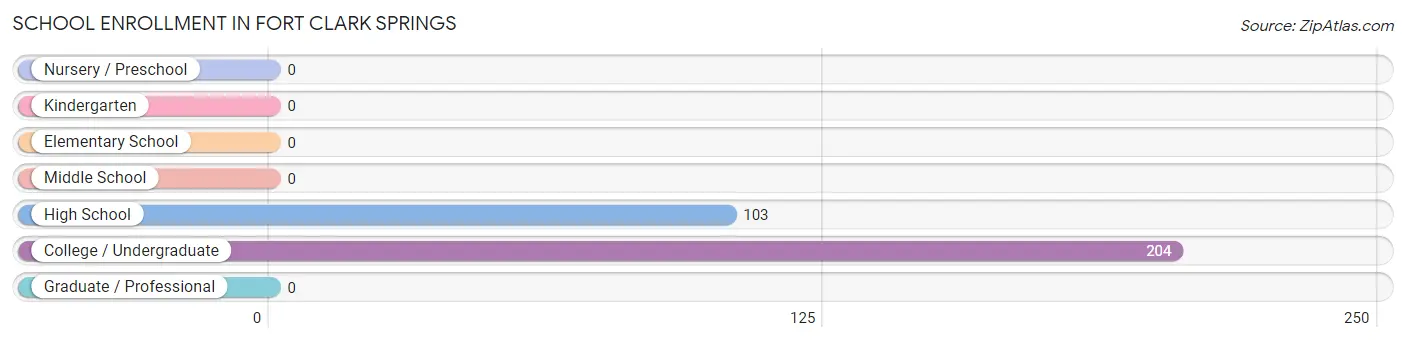
| School Level | # Students | % Students |
| Nursery / Preschool | 0 | 0.0% |
| Kindergarten | 0 | 0.0% |
| Elementary School | 0 | 0.0% |
| Middle School | 0 | 0.0% |
| High School | 103 | 33.6% |
| College / Undergraduate | 204 | 66.4% |
| Graduate / Professional | 0 | 0.0% |
| Total | 307 | 100.0% |
School Enrollment by Age by Funding Source in Fort Clark Springs
Out of a total of 307 students who are enrolled in schools in Fort Clark Springs, 52 (16.9%) attend a private institution, while the remaining 255 (83.1%) are enrolled in public schools. The age group of 15 to 17 year olds has the highest likelihood of being enrolled in private schools, with 52 (50.5% in the age bracket) enrolled. Conversely, the age group of 25 to 34 year olds has the lowest likelihood of being enrolled in a private school, with 204 (100.0% in the age bracket) attending a public institution.
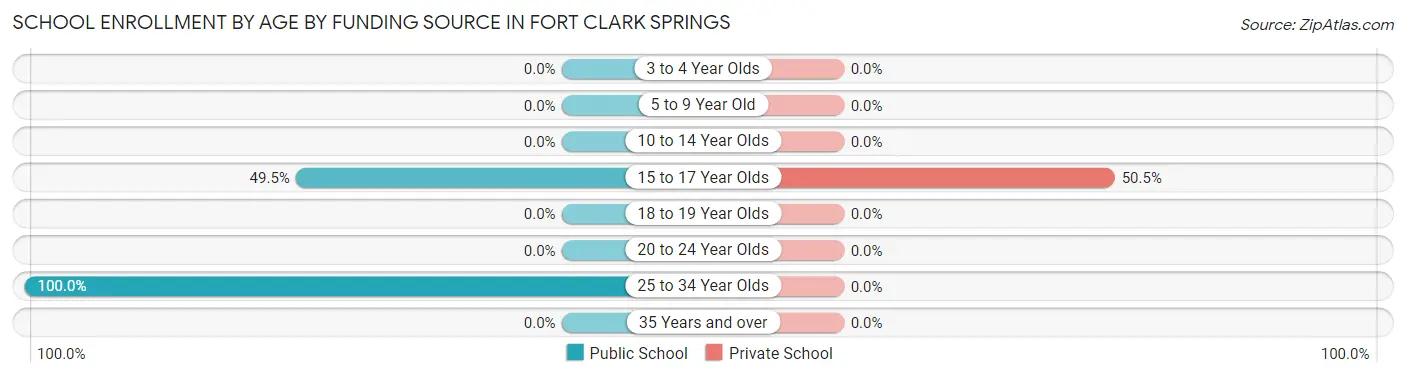
| Age Bracket | Public School | Private School |
| 3 to 4 Year Olds | 0 (0.0%) | 0 (0.0%) |
| 5 to 9 Year Old | 0 (0.0%) | 0 (0.0%) |
| 10 to 14 Year Olds | 0 (0.0%) | 0 (0.0%) |
| 15 to 17 Year Olds | 51 (49.5%) | 52 (50.5%) |
| 18 to 19 Year Olds | 0 (0.0%) | 0 (0.0%) |
| 20 to 24 Year Olds | 0 (0.0%) | 0 (0.0%) |
| 25 to 34 Year Olds | 204 (100.0%) | 0 (0.0%) |
| 35 Years and over | 0 (0.0%) | 0 (0.0%) |
| Total | 255 (83.1%) | 52 (16.9%) |
Educational Attainment by Field of Study in Fort Clark Springs
Business (148 | 59.0%), liberal arts & history (77 | 30.7%), and science & technology (26 | 10.4%) are the most common fields of study among 251 individuals in Fort Clark Springs who have obtained a bachelor's degree or higher.
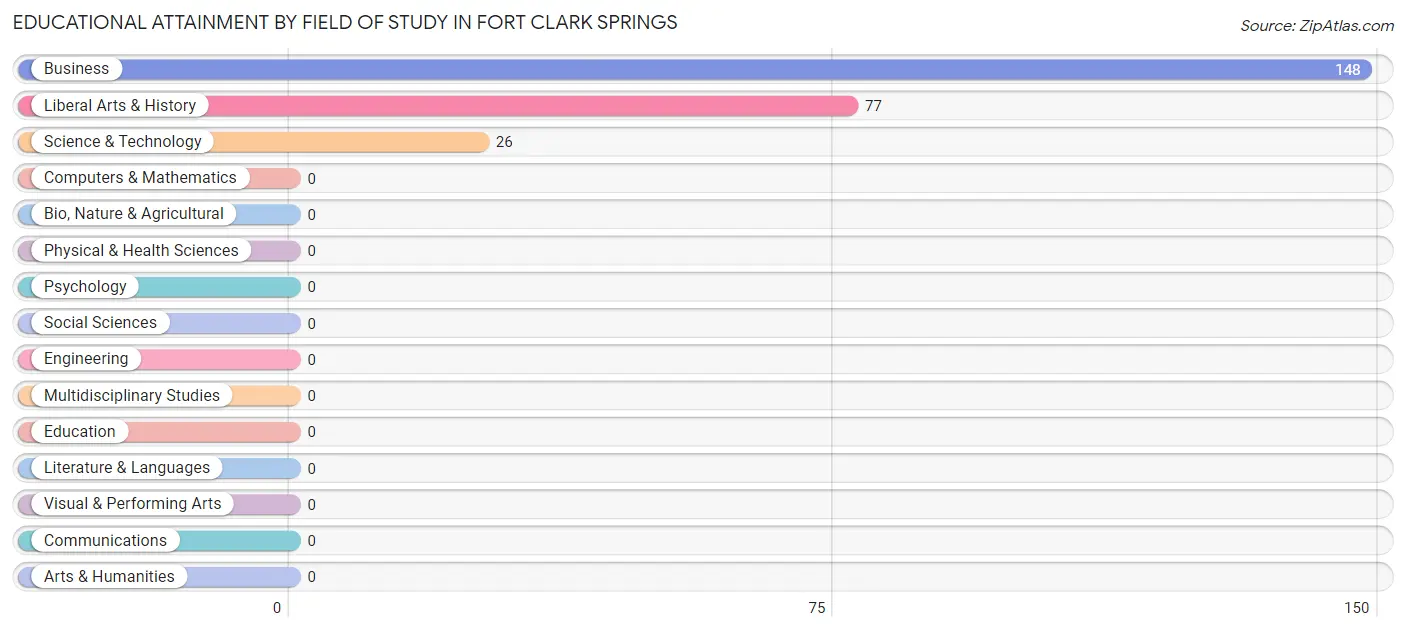
| Field of Study | # Graduates | % Graduates |
| Computers & Mathematics | 0 | 0.0% |
| Bio, Nature & Agricultural | 0 | 0.0% |
| Physical & Health Sciences | 0 | 0.0% |
| Psychology | 0 | 0.0% |
| Social Sciences | 0 | 0.0% |
| Engineering | 0 | 0.0% |
| Multidisciplinary Studies | 0 | 0.0% |
| Science & Technology | 26 | 10.4% |
| Business | 148 | 59.0% |
| Education | 0 | 0.0% |
| Literature & Languages | 0 | 0.0% |
| Liberal Arts & History | 77 | 30.7% |
| Visual & Performing Arts | 0 | 0.0% |
| Communications | 0 | 0.0% |
| Arts & Humanities | 0 | 0.0% |
| Total | 251 | 100.0% |
Transportation & Commute in Fort Clark Springs
Vehicle Availability by Sex in Fort Clark Springs
The most prevalent vehicle ownership categories in Fort Clark Springs are males with 3 vehicles (113, accounting for 42.5%) and females with 3 vehicles (39, making up 36.3%).
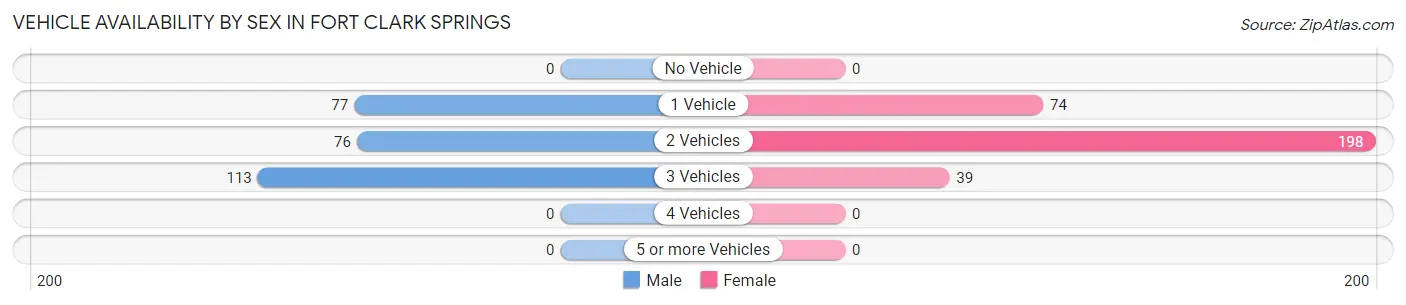
| Vehicles Available | Male | Female |
| No Vehicle | 0 (0.0%) | 0 (0.0%) |
| 1 Vehicle | 77 (28.9%) | 74 (23.8%) |
| 2 Vehicles | 76 (28.6%) | 198 (63.7%) |
| 3 Vehicles | 113 (42.5%) | 39 (12.5%) |
| 4 Vehicles | 0 (0.0%) | 0 (0.0%) |
| 5 or more Vehicles | 0 (0.0%) | 0 (0.0%) |
| Total | 266 (100.0%) | 311 (100.0%) |
Commute Time in Fort Clark Springs
The most frequently occuring commute durations in Fort Clark Springs are 5 to 9 minutes (325 commuters, 69.7%), 10 to 14 minutes (91 commuters, 19.5%), and less than 5 minutes (50 commuters, 10.7%).
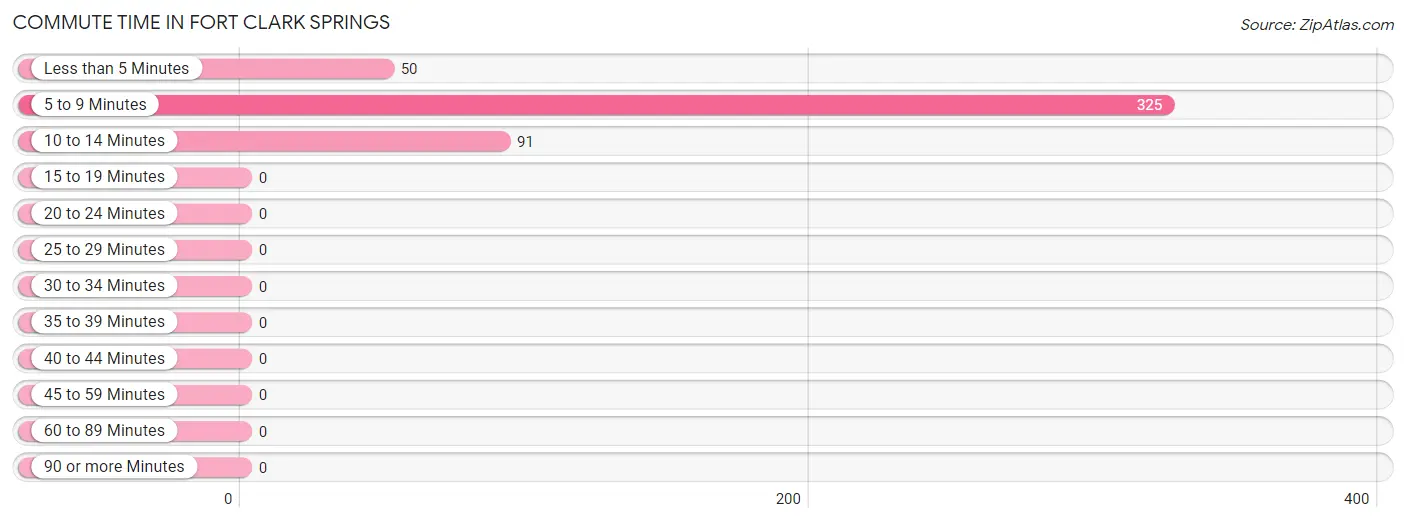
| Commute Time | # Commuters | % Commuters |
| Less than 5 Minutes | 50 | 10.7% |
| 5 to 9 Minutes | 325 | 69.7% |
| 10 to 14 Minutes | 91 | 19.5% |
| 15 to 19 Minutes | 0 | 0.0% |
| 20 to 24 Minutes | 0 | 0.0% |
| 25 to 29 Minutes | 0 | 0.0% |
| 30 to 34 Minutes | 0 | 0.0% |
| 35 to 39 Minutes | 0 | 0.0% |
| 40 to 44 Minutes | 0 | 0.0% |
| 45 to 59 Minutes | 0 | 0.0% |
| 60 to 89 Minutes | 0 | 0.0% |
| 90 or more Minutes | 0 | 0.0% |
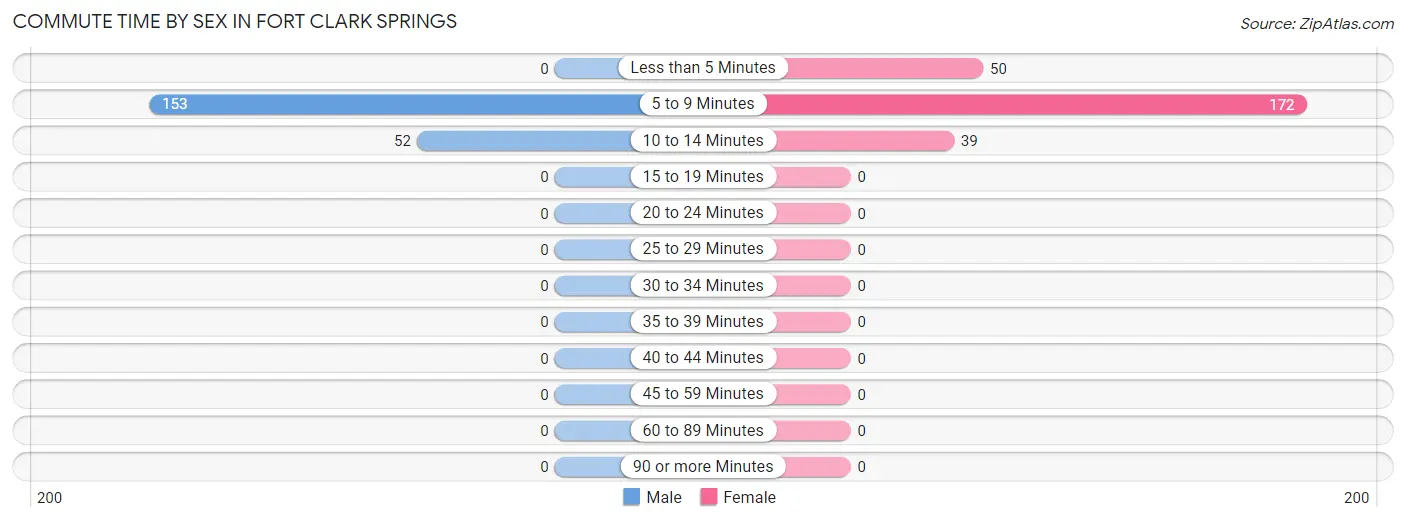
Commute Time by Sex in Fort Clark Springs
The most common commute times in Fort Clark Springs are 5 to 9 minutes (153 commuters, 74.6%) for males and 5 to 9 minutes (172 commuters, 65.9%) for females.
| Commute Time | Male | Female |
| Less than 5 Minutes | 0 (0.0%) | 50 (19.2%) |
| 5 to 9 Minutes | 153 (74.6%) | 172 (65.9%) |
| 10 to 14 Minutes | 52 (25.4%) | 39 (14.9%) |
| 15 to 19 Minutes | 0 (0.0%) | 0 (0.0%) |
| 20 to 24 Minutes | 0 (0.0%) | 0 (0.0%) |
| 25 to 29 Minutes | 0 (0.0%) | 0 (0.0%) |
| 30 to 34 Minutes | 0 (0.0%) | 0 (0.0%) |
| 35 to 39 Minutes | 0 (0.0%) | 0 (0.0%) |
| 40 to 44 Minutes | 0 (0.0%) | 0 (0.0%) |
| 45 to 59 Minutes | 0 (0.0%) | 0 (0.0%) |
| 60 to 89 Minutes | 0 (0.0%) | 0 (0.0%) |
| 90 or more Minutes | 0 (0.0%) | 0 (0.0%) |
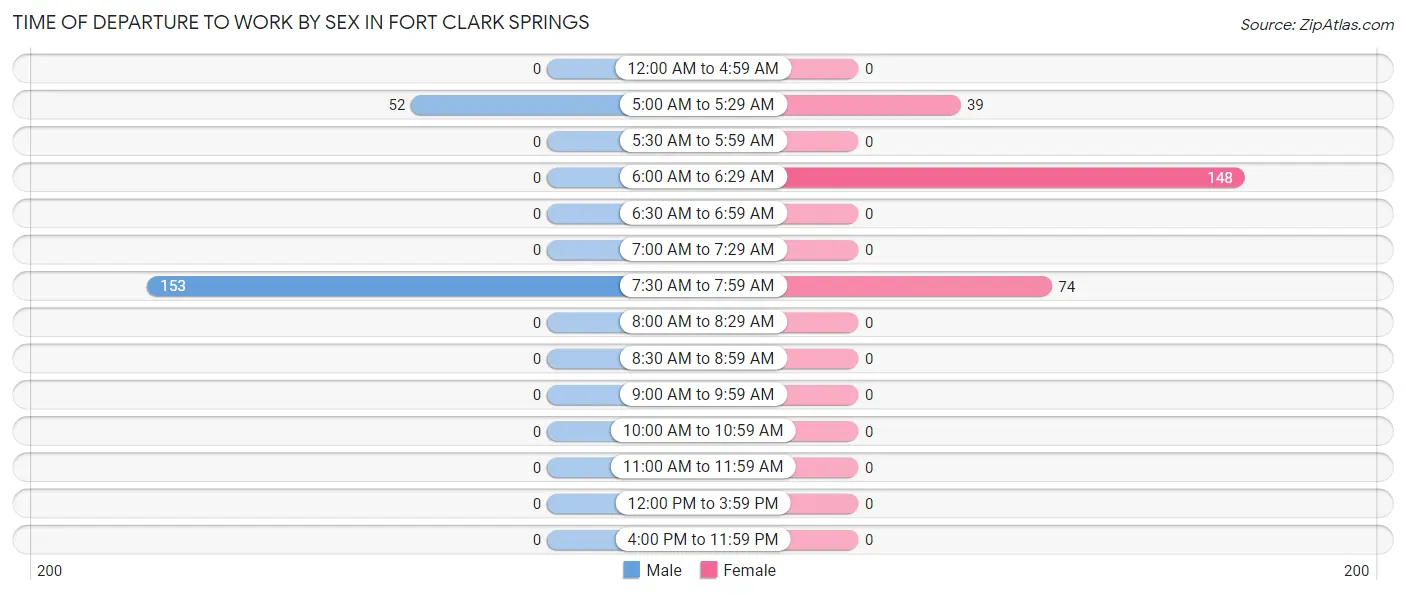
Time of Departure to Work by Sex in Fort Clark Springs
The most frequent times of departure to work in Fort Clark Springs are 7:30 AM to 7:59 AM (153, 74.6%) for males and 6:00 AM to 6:29 AM (148, 56.7%) for females.
| Time of Departure | Male | Female |
| 12:00 AM to 4:59 AM | 0 (0.0%) | 0 (0.0%) |
| 5:00 AM to 5:29 AM | 52 (25.4%) | 39 (14.9%) |
| 5:30 AM to 5:59 AM | 0 (0.0%) | 0 (0.0%) |
| 6:00 AM to 6:29 AM | 0 (0.0%) | 148 (56.7%) |
| 6:30 AM to 6:59 AM | 0 (0.0%) | 0 (0.0%) |
| 7:00 AM to 7:29 AM | 0 (0.0%) | 0 (0.0%) |
| 7:30 AM to 7:59 AM | 153 (74.6%) | 74 (28.3%) |
| 8:00 AM to 8:29 AM | 0 (0.0%) | 0 (0.0%) |
| 8:30 AM to 8:59 AM | 0 (0.0%) | 0 (0.0%) |
| 9:00 AM to 9:59 AM | 0 (0.0%) | 0 (0.0%) |
| 10:00 AM to 10:59 AM | 0 (0.0%) | 0 (0.0%) |
| 11:00 AM to 11:59 AM | 0 (0.0%) | 0 (0.0%) |
| 12:00 PM to 3:59 PM | 0 (0.0%) | 0 (0.0%) |
| 4:00 PM to 11:59 PM | 0 (0.0%) | 0 (0.0%) |
| Total | 205 (100.0%) | 261 (100.0%) |
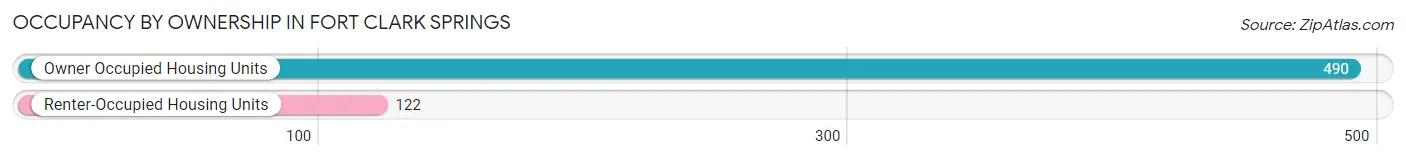
Housing Occupancy in Fort Clark Springs
Occupancy by Ownership in Fort Clark Springs
Of the total 612 dwellings in Fort Clark Springs, owner-occupied units account for 490 (80.1%), while renter-occupied units make up 122 (19.9%).
| Occupancy | # Housing Units | % Housing Units |
| Owner Occupied Housing Units | 490 | 80.1% |
| Renter-Occupied Housing Units | 122 | 19.9% |
| Total Occupied Housing Units | 612 | 100.0% |
Occupancy by Household Size in Fort Clark Springs
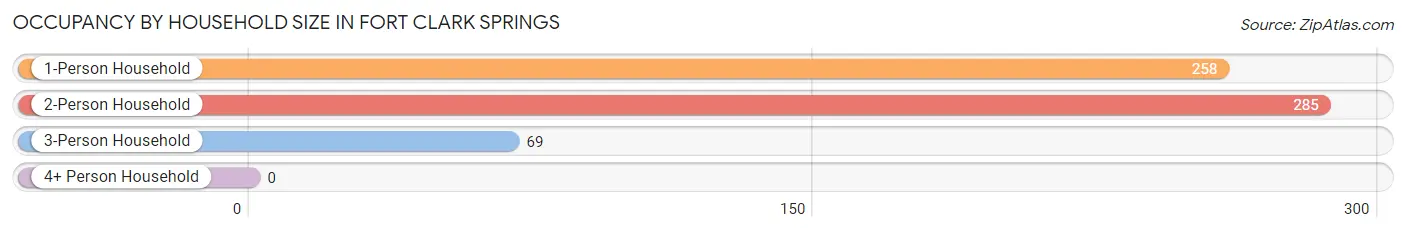
| Household Size | # Housing Units | % Housing Units |
| 1-Person Household | 258 | 42.2% |
| 2-Person Household | 285 | 46.6% |
| 3-Person Household | 69 | 11.3% |
| 4+ Person Household | 0 | 0.0% |
| Total Housing Units | 612 | 100.0% |
Occupancy by Ownership by Household Size in Fort Clark Springs
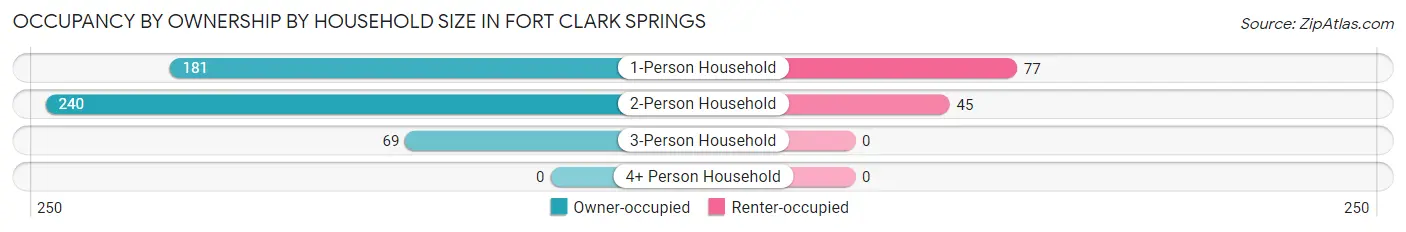
| Household Size | Owner-occupied | Renter-occupied |
| 1-Person Household | 181 (70.2%) | 77 (29.8%) |
| 2-Person Household | 240 (84.2%) | 45 (15.8%) |
| 3-Person Household | 69 (100.0%) | 0 (0.0%) |
| 4+ Person Household | 0 (0.0%) | 0 (0.0%) |
| Total Housing Units | 490 (80.1%) | 122 (19.9%) |
Occupancy by Educational Attainment in Fort Clark Springs
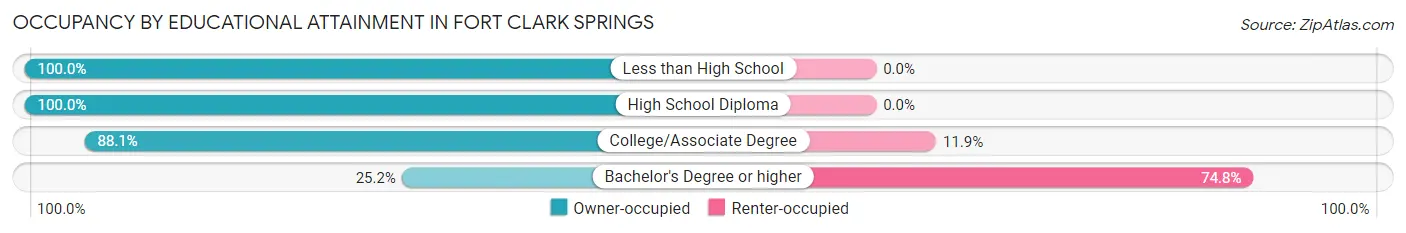
| Household Size | Owner-occupied | Renter-occupied |
| Less than High School | 30 (100.0%) | 0 (0.0%) |
| High School Diploma | 100 (100.0%) | 0 (0.0%) |
| College/Associate Degree | 334 (88.1%) | 45 (11.9%) |
| Bachelor's Degree or higher | 26 (25.2%) | 77 (74.8%) |
Occupancy by Age of Householder in Fort Clark Springs
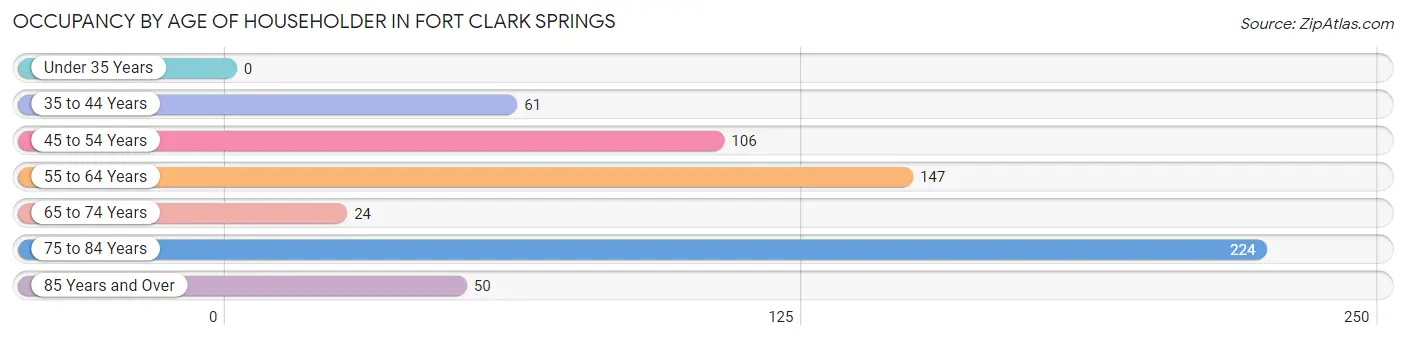
| Age Bracket | # Households | % Households |
| Under 35 Years | 0 | 0.0% |
| 35 to 44 Years | 61 | 10.0% |
| 45 to 54 Years | 106 | 17.3% |
| 55 to 64 Years | 147 | 24.0% |
| 65 to 74 Years | 24 | 3.9% |
| 75 to 84 Years | 224 | 36.6% |
| 85 Years and Over | 50 | 8.2% |
| Total | 612 | 100.0% |
Housing Finances in Fort Clark Springs
Median Income by Occupancy in Fort Clark Springs
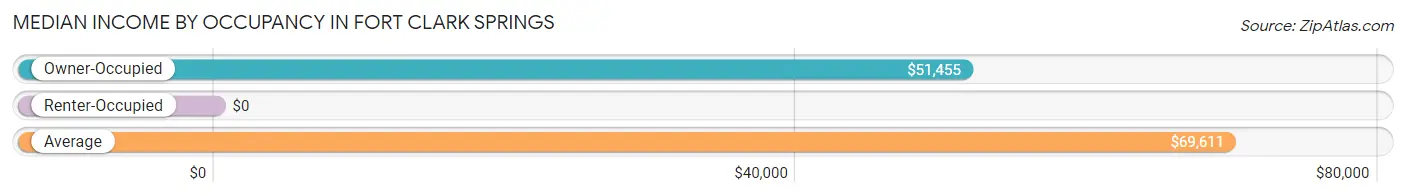
| Occupancy Type | # Households | Median Income |
| Owner-Occupied | 490 (80.1%) | $51,455 |
| Renter-Occupied | 122 (19.9%) | $0 |
| Average | 612 (100.0%) | $69,611 |
Occupancy by Householder Income Bracket in Fort Clark Springs
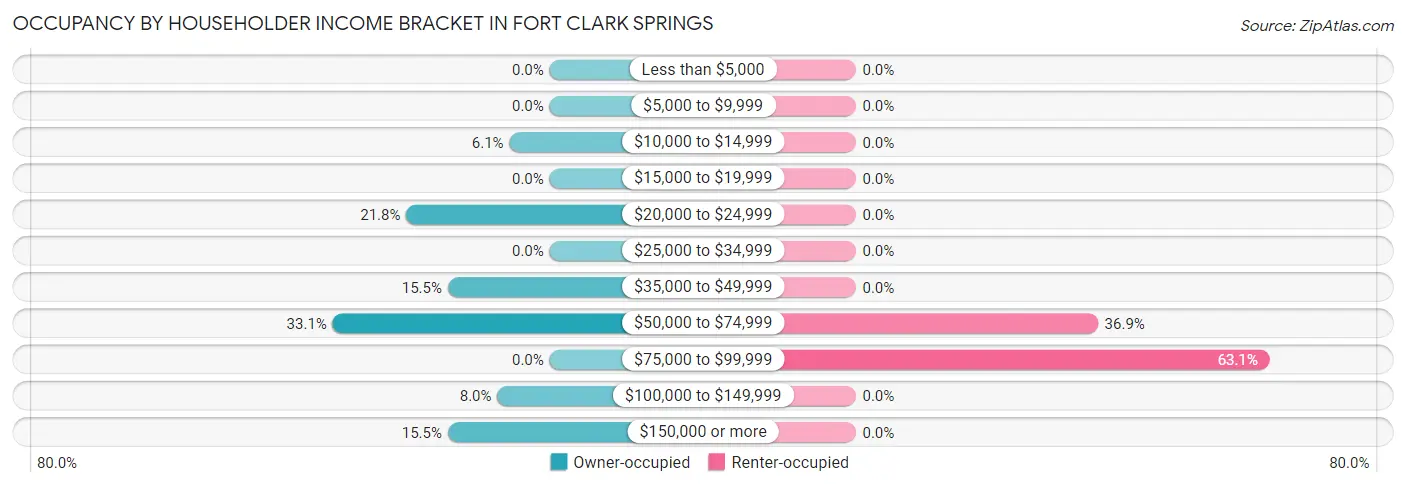
| Income Bracket | Owner-occupied | Renter-occupied |
| Less than $5,000 | 0 (0.0%) | 0 (0.0%) |
| $5,000 to $9,999 | 0 (0.0%) | 0 (0.0%) |
| $10,000 to $14,999 | 30 (6.1%) | 0 (0.0%) |
| $15,000 to $19,999 | 0 (0.0%) | 0 (0.0%) |
| $20,000 to $24,999 | 107 (21.8%) | 0 (0.0%) |
| $25,000 to $34,999 | 0 (0.0%) | 0 (0.0%) |
| $35,000 to $49,999 | 76 (15.5%) | 0 (0.0%) |
| $50,000 to $74,999 | 162 (33.1%) | 45 (36.9%) |
| $75,000 to $99,999 | 0 (0.0%) | 77 (63.1%) |
| $100,000 to $149,999 | 39 (8.0%) | 0 (0.0%) |
| $150,000 or more | 76 (15.5%) | 0 (0.0%) |
| Total | 490 (100.0%) | 122 (100.0%) |
Monthly Housing Cost Tiers in Fort Clark Springs
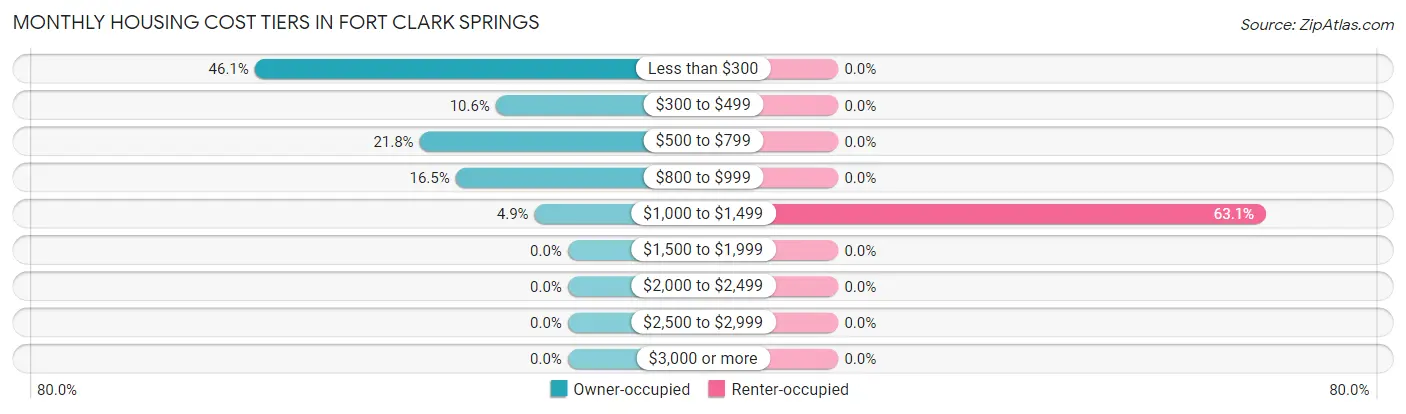
| Monthly Cost | Owner-occupied | Renter-occupied |
| Less than $300 | 226 (46.1%) | 0 (0.0%) |
| $300 to $499 | 52 (10.6%) | 0 (0.0%) |
| $500 to $799 | 107 (21.8%) | 0 (0.0%) |
| $800 to $999 | 81 (16.5%) | 0 (0.0%) |
| $1,000 to $1,499 | 24 (4.9%) | 77 (63.1%) |
| $1,500 to $1,999 | 0 (0.0%) | 0 (0.0%) |
| $2,000 to $2,499 | 0 (0.0%) | 0 (0.0%) |
| $2,500 to $2,999 | 0 (0.0%) | 0 (0.0%) |
| $3,000 or more | 0 (0.0%) | 0 (0.0%) |
| Total | 490 (100.0%) | 122 (100.0%) |
Physical Housing Characteristics in Fort Clark Springs
Housing Structures in Fort Clark Springs
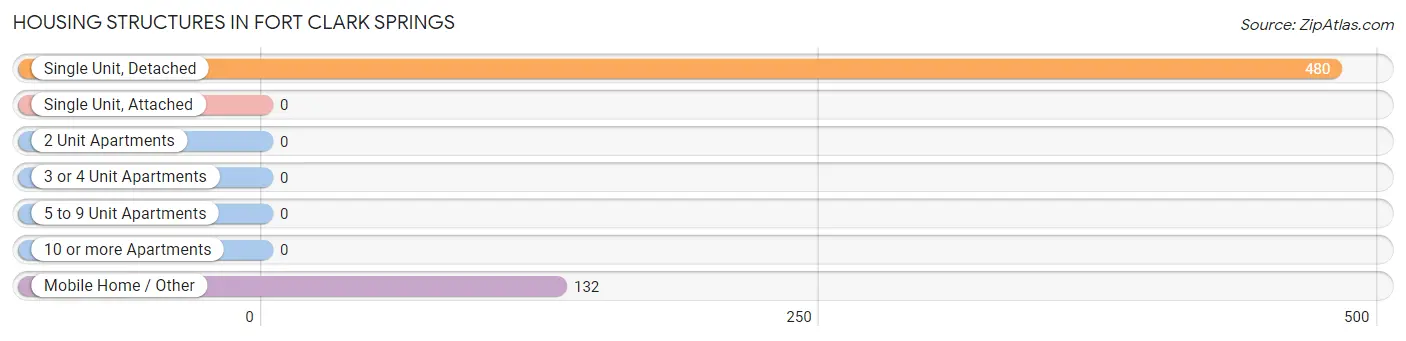
| Structure Type | # Housing Units | % Housing Units |
| Single Unit, Detached | 480 | 78.4% |
| Single Unit, Attached | 0 | 0.0% |
| 2 Unit Apartments | 0 | 0.0% |
| 3 or 4 Unit Apartments | 0 | 0.0% |
| 5 to 9 Unit Apartments | 0 | 0.0% |
| 10 or more Apartments | 0 | 0.0% |
| Mobile Home / Other | 132 | 21.6% |
| Total | 612 | 100.0% |
Housing Structures by Occupancy in Fort Clark Springs
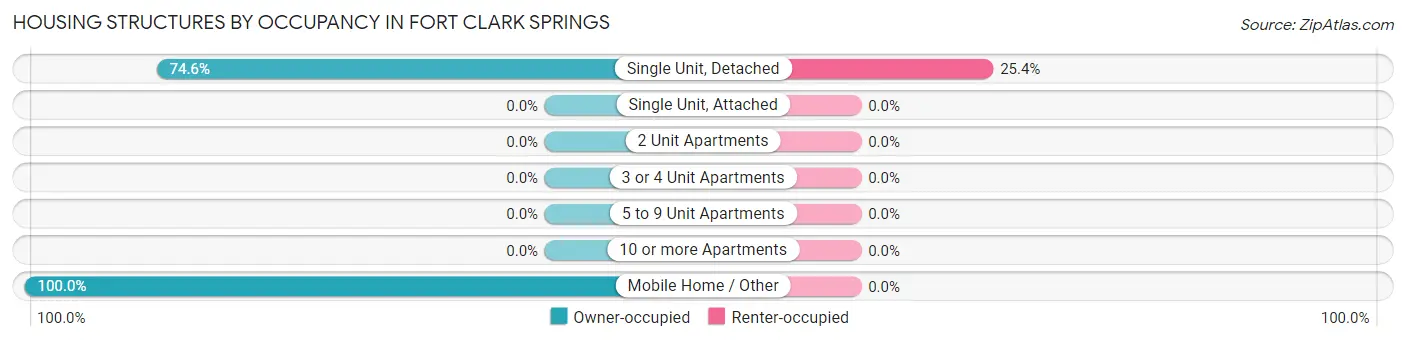
| Structure Type | Owner-occupied | Renter-occupied |
| Single Unit, Detached | 358 (74.6%) | 122 (25.4%) |
| Single Unit, Attached | 0 (0.0%) | 0 (0.0%) |
| 2 Unit Apartments | 0 (0.0%) | 0 (0.0%) |
| 3 or 4 Unit Apartments | 0 (0.0%) | 0 (0.0%) |
| 5 to 9 Unit Apartments | 0 (0.0%) | 0 (0.0%) |
| 10 or more Apartments | 0 (0.0%) | 0 (0.0%) |
| Mobile Home / Other | 132 (100.0%) | 0 (0.0%) |
| Total | 490 (80.1%) | 122 (19.9%) |
Housing Structures by Number of Rooms in Fort Clark Springs
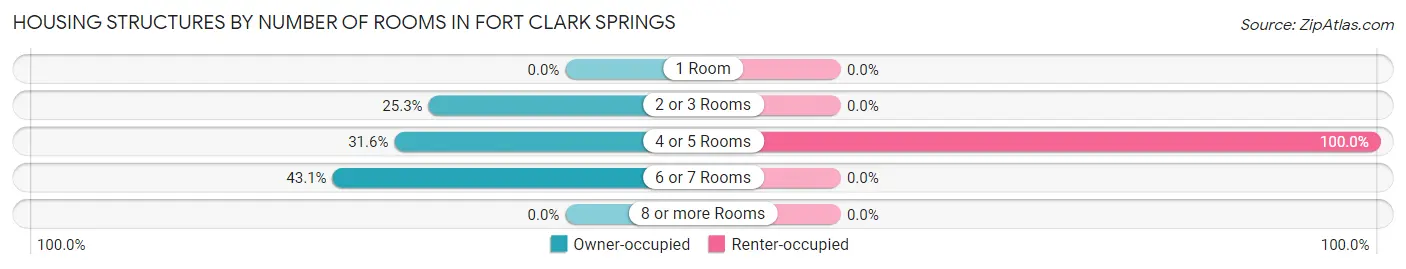
| Number of Rooms | Owner-occupied | Renter-occupied |
| 1 Room | 0 (0.0%) | 0 (0.0%) |
| 2 or 3 Rooms | 124 (25.3%) | 0 (0.0%) |
| 4 or 5 Rooms | 155 (31.6%) | 122 (100.0%) |
| 6 or 7 Rooms | 211 (43.1%) | 0 (0.0%) |
| 8 or more Rooms | 0 (0.0%) | 0 (0.0%) |
| Total | 490 (100.0%) | 122 (100.0%) |
Housing Structure by Heating Type in Fort Clark Springs
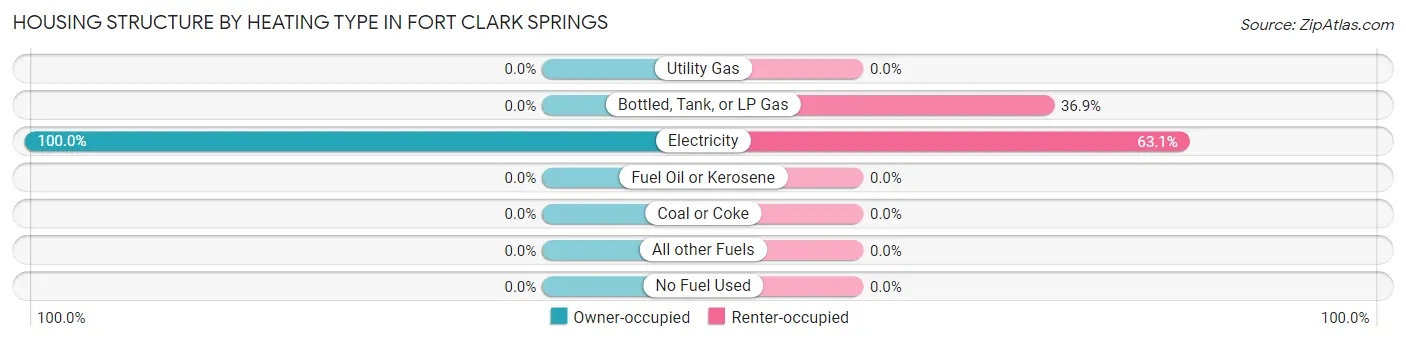
| Heating Type | Owner-occupied | Renter-occupied |
| Utility Gas | 0 (0.0%) | 0 (0.0%) |
| Bottled, Tank, or LP Gas | 0 (0.0%) | 45 (36.9%) |
| Electricity | 490 (100.0%) | 77 (63.1%) |
| Fuel Oil or Kerosene | 0 (0.0%) | 0 (0.0%) |
| Coal or Coke | 0 (0.0%) | 0 (0.0%) |
| All other Fuels | 0 (0.0%) | 0 (0.0%) |
| No Fuel Used | 0 (0.0%) | 0 (0.0%) |
| Total | 490 (100.0%) | 122 (100.0%) |
Household Vehicle Usage in Fort Clark Springs
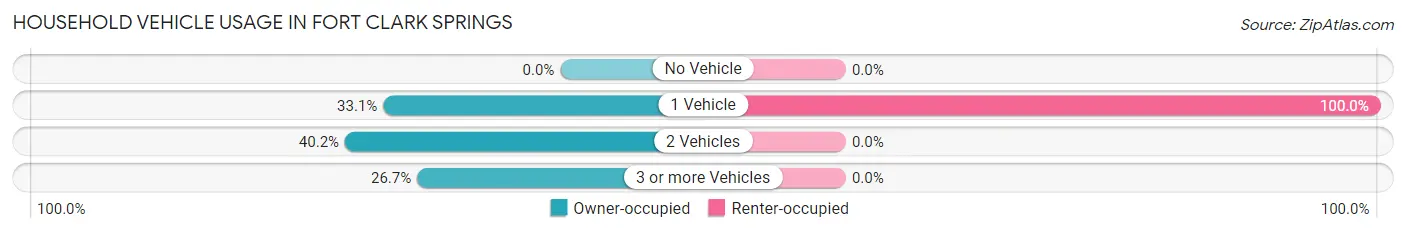
| Vehicles per Household | Owner-occupied | Renter-occupied |
| No Vehicle | 0 (0.0%) | 0 (0.0%) |
| 1 Vehicle | 162 (33.1%) | 122 (100.0%) |
| 2 Vehicles | 197 (40.2%) | 0 (0.0%) |
| 3 or more Vehicles | 131 (26.7%) | 0 (0.0%) |
| Total | 490 (100.0%) | 122 (100.0%) |
Real Estate & Mortgages in Fort Clark Springs
Real Estate and Mortgage Overview in Fort Clark Springs
| Characteristic | Without Mortgage | With Mortgage |
| Housing Units | 409 | 81 |
| Median Property Value | $154,100 | $109,100 |
| Median Household Income | $70,795 | $0 |
| Monthly Housing Costs | $294 | $0 |
| Real Estate Taxes | $1,222 | $0 |
Property Value by Mortgage Status in Fort Clark Springs
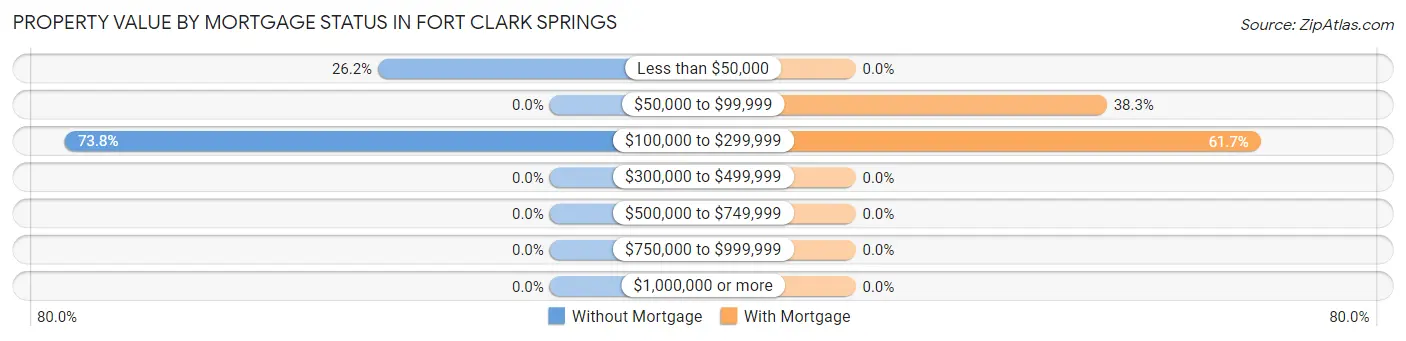
| Property Value | Without Mortgage | With Mortgage |
| Less than $50,000 | 107 (26.2%) | 0 (0.0%) |
| $50,000 to $99,999 | 0 (0.0%) | 31 (38.3%) |
| $100,000 to $299,999 | 302 (73.8%) | 50 (61.7%) |
| $300,000 to $499,999 | 0 (0.0%) | 0 (0.0%) |
| $500,000 to $749,999 | 0 (0.0%) | 0 (0.0%) |
| $750,000 to $999,999 | 0 (0.0%) | 0 (0.0%) |
| $1,000,000 or more | 0 (0.0%) | 0 (0.0%) |
| Total | 409 (100.0%) | 81 (100.0%) |
Household Income by Mortgage Status in Fort Clark Springs
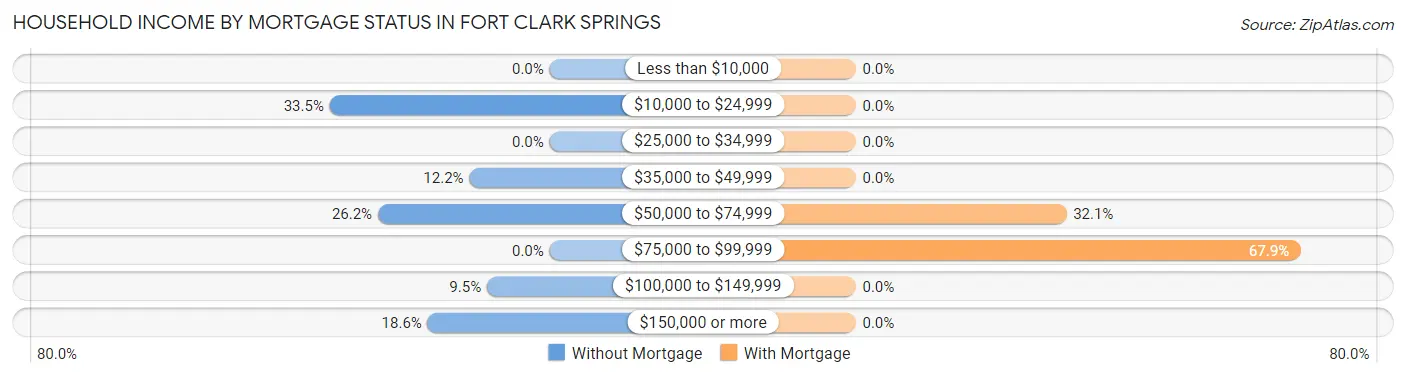
| Household Income | Without Mortgage | With Mortgage |
| Less than $10,000 | 0 (0.0%) | 0 (0.0%) |
| $10,000 to $24,999 | 137 (33.5%) | 0 (0.0%) |
| $25,000 to $34,999 | 0 (0.0%) | 0 (0.0%) |
| $35,000 to $49,999 | 50 (12.2%) | 0 (0.0%) |
| $50,000 to $74,999 | 107 (26.2%) | 26 (32.1%) |
| $75,000 to $99,999 | 0 (0.0%) | 55 (67.9%) |
| $100,000 to $149,999 | 39 (9.5%) | 0 (0.0%) |
| $150,000 or more | 76 (18.6%) | 0 (0.0%) |
| Total | 409 (100.0%) | 81 (100.0%) |
Property Value to Household Income Ratio in Fort Clark Springs
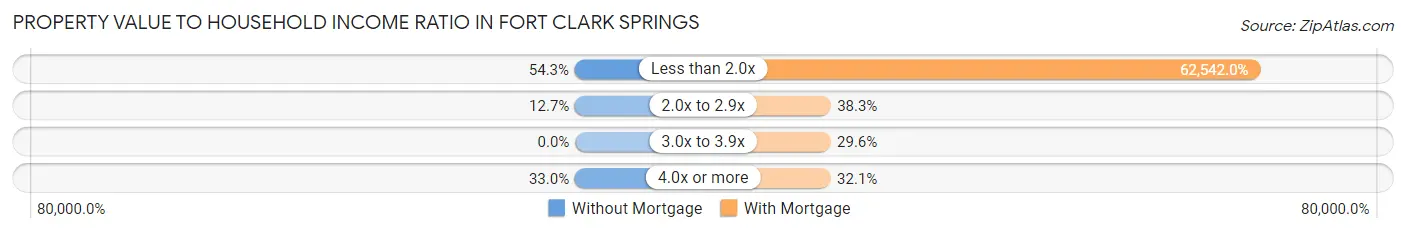
| Value-to-Income Ratio | Without Mortgage | With Mortgage |
| Less than 2.0x | 222 (54.3%) | 50,659 (62,542.0%) |
| 2.0x to 2.9x | 52 (12.7%) | 31 (38.3%) |
| 3.0x to 3.9x | 0 (0.0%) | 24 (29.6%) |
| 4.0x or more | 135 (33.0%) | 26 (32.1%) |
| Total | 409 (100.0%) | 81 (100.0%) |
Real Estate Taxes by Mortgage Status in Fort Clark Springs
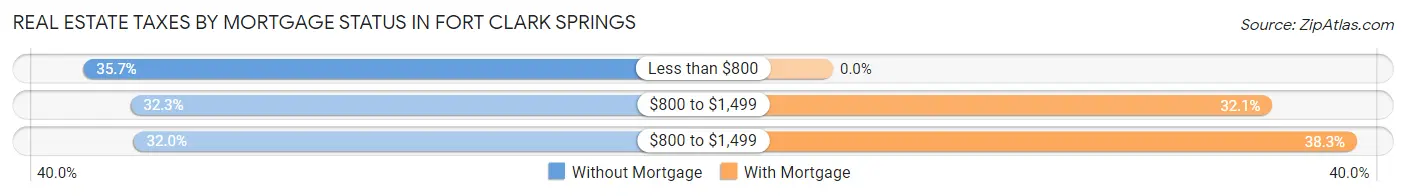
| Property Taxes | Without Mortgage | With Mortgage |
| Less than $800 | 146 (35.7%) | 0 (0.0%) |
| $800 to $1,499 | 132 (32.3%) | 26 (32.1%) |
| $800 to $1,499 | 131 (32.0%) | 31 (38.3%) |
| Total | 409 (100.0%) | 81 (100.0%) |
Health & Disability in Fort Clark Springs
Health Insurance Coverage by Age in Fort Clark Springs
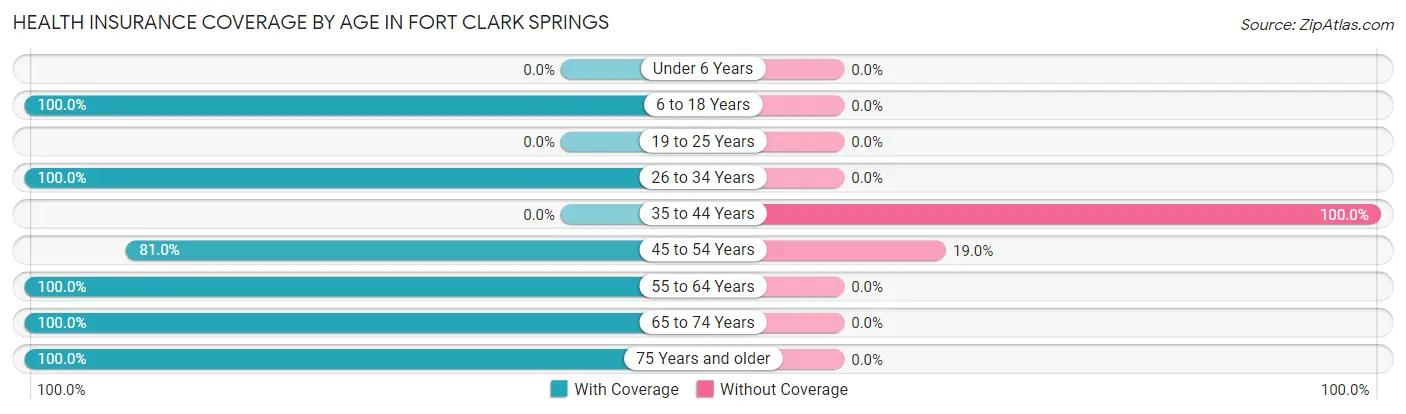
| Age Bracket | With Coverage | Without Coverage |
| Under 6 Years | 0 (0.0%) | 0 (0.0%) |
| 6 to 18 Years | 103 (100.0%) | 0 (0.0%) |
| 19 to 25 Years | 0 (0.0%) | 0 (0.0%) |
| 26 to 34 Years | 204 (100.0%) | 0 (0.0%) |
| 35 to 44 Years | 0 (0.0%) | 61 (100.0%) |
| 45 to 54 Years | 128 (81.0%) | 30 (19.0%) |
| 55 to 64 Years | 333 (100.0%) | 0 (0.0%) |
| 65 to 74 Years | 74 (100.0%) | 0 (0.0%) |
| 75 Years and older | 365 (100.0%) | 0 (0.0%) |
| Total | 1,207 (93.0%) | 91 (7.0%) |
Health Insurance Coverage by Citizenship Status in Fort Clark Springs
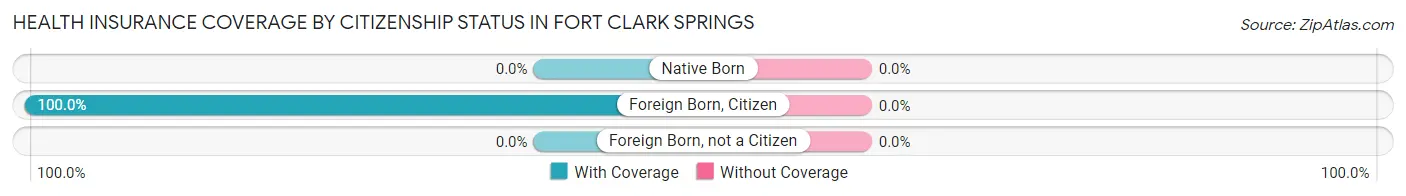
| Citizenship Status | With Coverage | Without Coverage |
| Native Born | 0 (0.0%) | 0 (0.0%) |
| Foreign Born, Citizen | 103 (100.0%) | 0 (0.0%) |
| Foreign Born, not a Citizen | 0 (0.0%) | 0 (0.0%) |
Health Insurance Coverage by Household Income in Fort Clark Springs
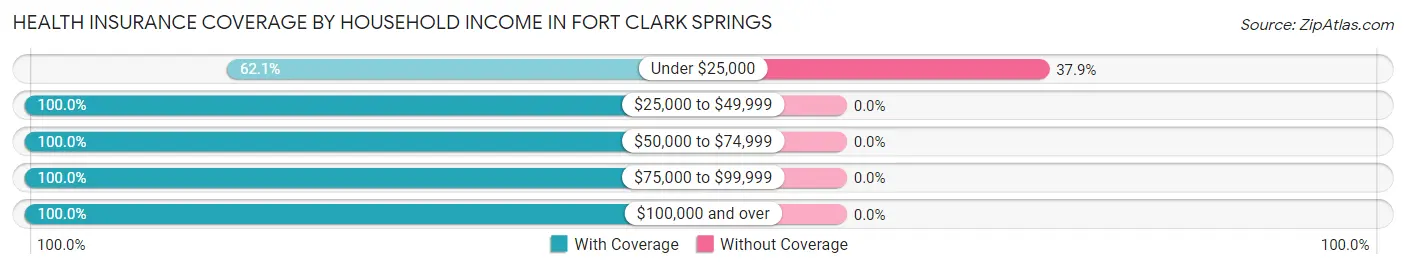
| Household Income | With Coverage | Without Coverage |
| Under $25,000 | 149 (62.1%) | 91 (37.9%) |
| $25,000 to $49,999 | 113 (100.0%) | 0 (0.0%) |
| $50,000 to $74,999 | 349 (100.0%) | 0 (0.0%) |
| $75,000 to $99,999 | 77 (100.0%) | 0 (0.0%) |
| $100,000 and over | 519 (100.0%) | 0 (0.0%) |
Public vs Private Health Insurance Coverage by Age in Fort Clark Springs
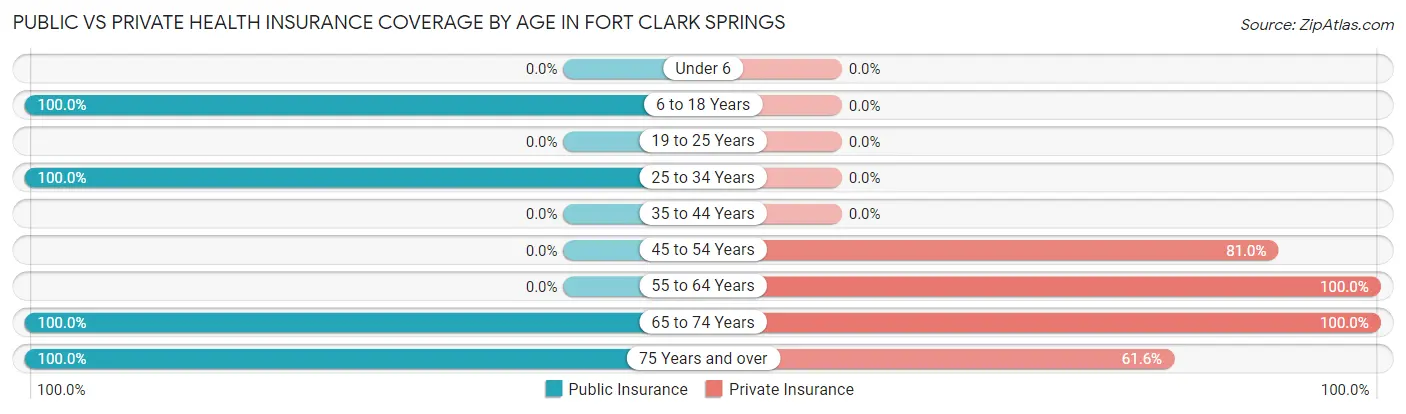
| Age Bracket | Public Insurance | Private Insurance |
| Under 6 | 0 (0.0%) | 0 (0.0%) |
| 6 to 18 Years | 103 (100.0%) | 0 (0.0%) |
| 19 to 25 Years | 0 (0.0%) | 0 (0.0%) |
| 25 to 34 Years | 204 (100.0%) | 0 (0.0%) |
| 35 to 44 Years | 0 (0.0%) | 0 (0.0%) |
| 45 to 54 Years | 0 (0.0%) | 128 (81.0%) |
| 55 to 64 Years | 0 (0.0%) | 333 (100.0%) |
| 65 to 74 Years | 74 (100.0%) | 74 (100.0%) |
| 75 Years and over | 365 (100.0%) | 225 (61.6%) |
| Total | 746 (57.5%) | 760 (58.6%) |
Disability Status by Sex by Age in Fort Clark Springs
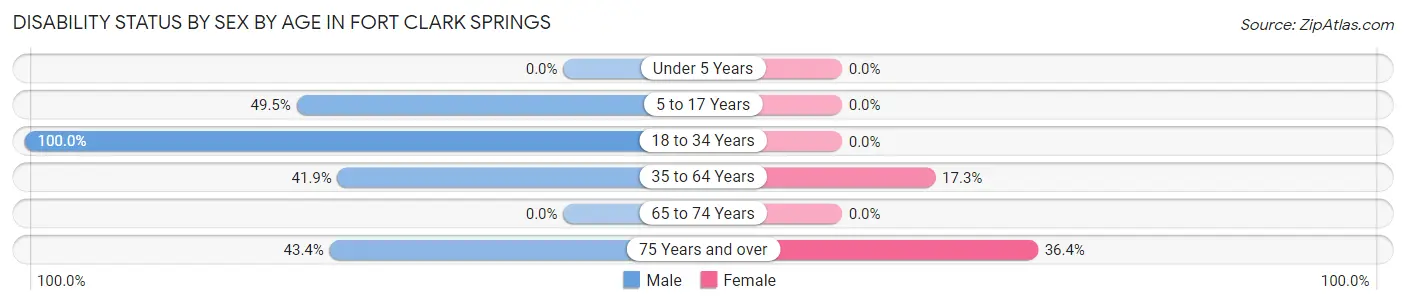
| Age Bracket | Male | Female |
| Under 5 Years | 0 (0.0%) | 0 (0.0%) |
| 5 to 17 Years | 51 (49.5%) | 0 (0.0%) |
| 18 to 34 Years | 204 (100.0%) | 0 (0.0%) |
| 35 to 64 Years | 137 (41.9%) | 39 (17.3%) |
| 65 to 74 Years | 0 (0.0%) | 0 (0.0%) |
| 75 Years and over | 82 (43.4%) | 64 (36.4%) |
Disability Class by Sex by Age in Fort Clark Springs
Disability Class: Hearing Difficulty
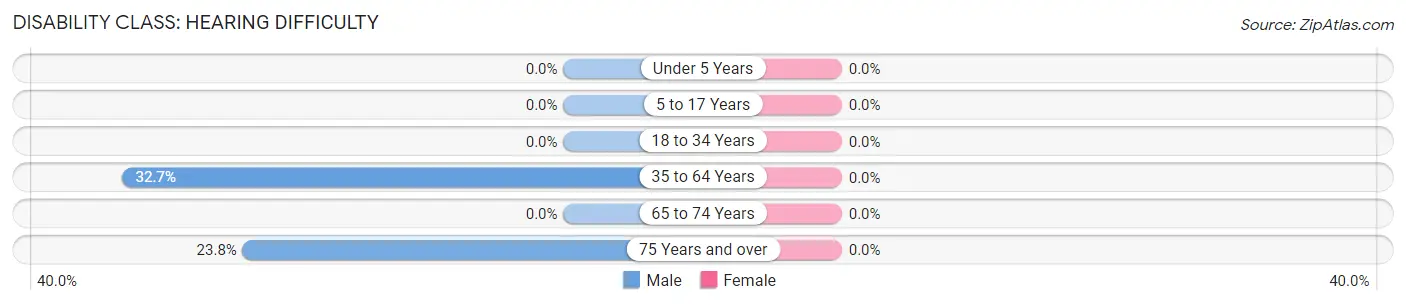
| Age Bracket | Male | Female |
| Under 5 Years | 0 (0.0%) | 0 (0.0%) |
| 5 to 17 Years | 0 (0.0%) | 0 (0.0%) |
| 18 to 34 Years | 0 (0.0%) | 0 (0.0%) |
| 35 to 64 Years | 107 (32.7%) | 0 (0.0%) |
| 65 to 74 Years | 0 (0.0%) | 0 (0.0%) |
| 75 Years and over | 45 (23.8%) | 0 (0.0%) |
Disability Class: Vision Difficulty
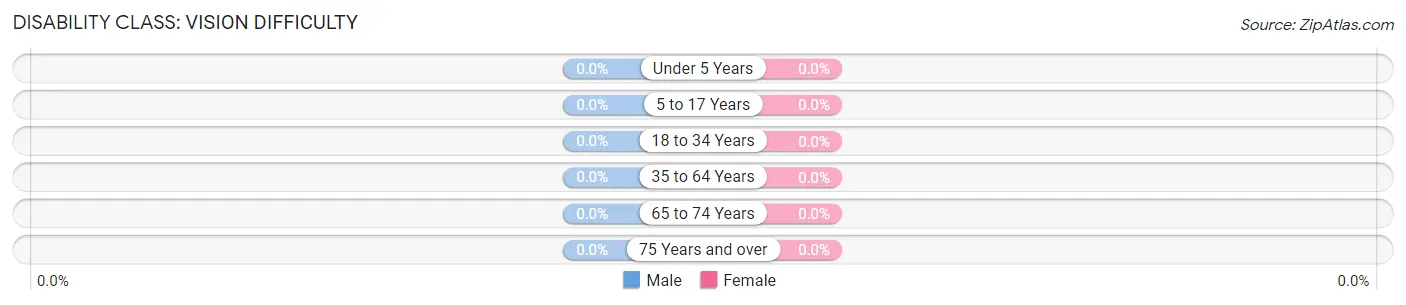
| Age Bracket | Male | Female |
| Under 5 Years | 0 (0.0%) | 0 (0.0%) |
| 5 to 17 Years | 0 (0.0%) | 0 (0.0%) |
| 18 to 34 Years | 0 (0.0%) | 0 (0.0%) |
| 35 to 64 Years | 0 (0.0%) | 0 (0.0%) |
| 65 to 74 Years | 0 (0.0%) | 0 (0.0%) |
| 75 Years and over | 0 (0.0%) | 0 (0.0%) |
Disability Class: Cognitive Difficulty
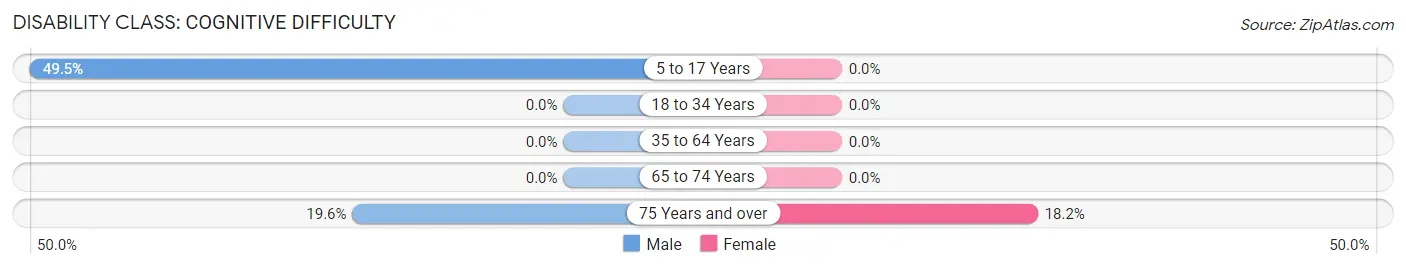
| Age Bracket | Male | Female |
| 5 to 17 Years | 51 (49.5%) | 0 (0.0%) |
| 18 to 34 Years | 0 (0.0%) | 0 (0.0%) |
| 35 to 64 Years | 0 (0.0%) | 0 (0.0%) |
| 65 to 74 Years | 0 (0.0%) | 0 (0.0%) |
| 75 Years and over | 37 (19.6%) | 32 (18.2%) |
Disability Class: Ambulatory Difficulty
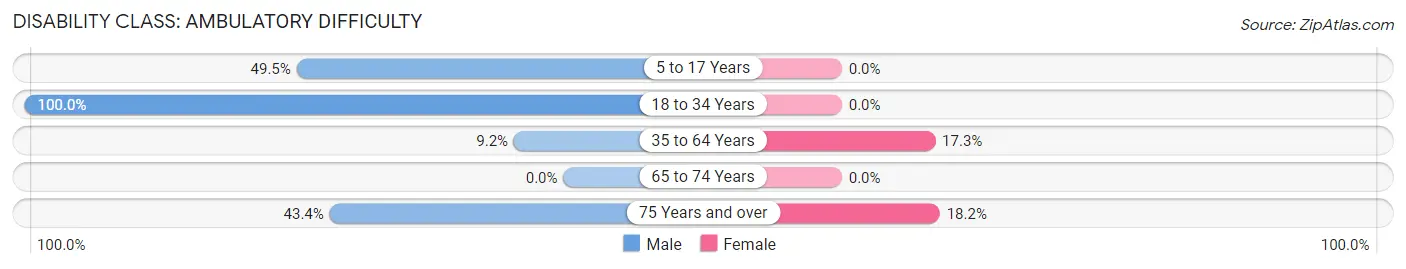
| Age Bracket | Male | Female |
| 5 to 17 Years | 51 (49.5%) | 0 (0.0%) |
| 18 to 34 Years | 204 (100.0%) | 0 (0.0%) |
| 35 to 64 Years | 30 (9.2%) | 39 (17.3%) |
| 65 to 74 Years | 0 (0.0%) | 0 (0.0%) |
| 75 Years and over | 82 (43.4%) | 32 (18.2%) |
Disability Class: Self-Care Difficulty
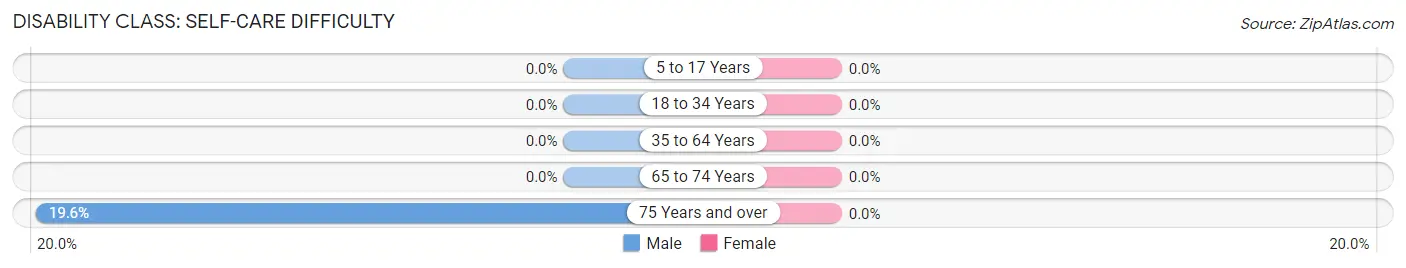
| Age Bracket | Male | Female |
| 5 to 17 Years | 0 (0.0%) | 0 (0.0%) |
| 18 to 34 Years | 0 (0.0%) | 0 (0.0%) |
| 35 to 64 Years | 0 (0.0%) | 0 (0.0%) |
| 65 to 74 Years | 0 (0.0%) | 0 (0.0%) |
| 75 Years and over | 37 (19.6%) | 0 (0.0%) |
Technology Access in Fort Clark Springs
Computing Device Access in Fort Clark Springs
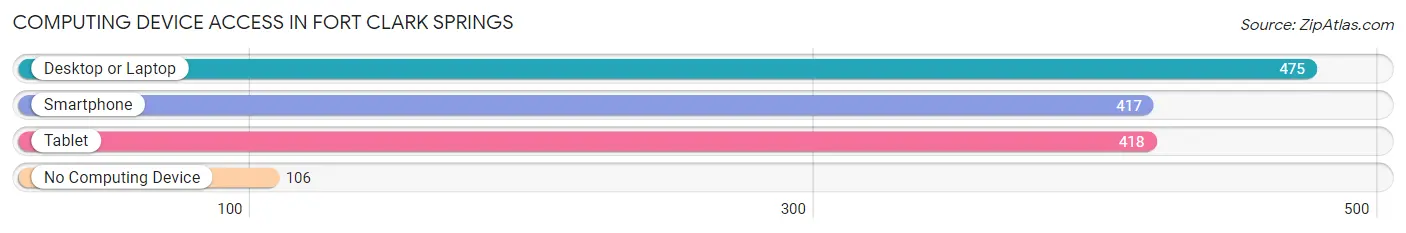
| Device Type | # Households | % Households |
| Desktop or Laptop | 475 | 77.6% |
| Smartphone | 417 | 68.1% |
| Tablet | 418 | 68.3% |
| No Computing Device | 106 | 17.3% |
| Total | 612 | 100.0% |
Internet Access in Fort Clark Springs
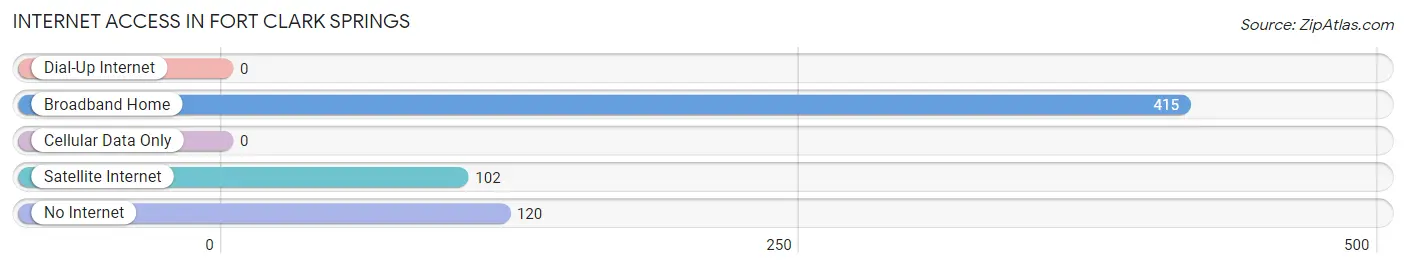
| Internet Type | # Households | % Households |
| Dial-Up Internet | 0 | 0.0% |
| Broadband Home | 415 | 67.8% |
| Cellular Data Only | 0 | 0.0% |
| Satellite Internet | 102 | 16.7% |
| No Internet | 120 | 19.6% |
| Total | 612 | 100.0% |
Fort Clark Springs Summary
Clark Springs, Texas is a small unincorporated community located in Kinney County, Texas. It is situated approximately 25 miles south of Brackettville and about 50 miles west of Del Rio. The town was founded in 1852 by a group of settlers led by Captain John Clark, who named the settlement after himself. The town was originally a stagecoach stop and trading post, and it quickly grew into a thriving community.
History
The history of Clark Springs dates back to 1852, when a group of settlers led by Captain John Clark arrived in the area. The settlers established a stagecoach stop and trading post, and the town quickly grew. By 1854, the town had a post office, a school, and a church. The town was officially incorporated in 1856, and the first mayor was elected in 1857.
In the late 1800s, the town was a popular stop for travelers on the San Antonio-El Paso Road. The town also had a thriving economy, with several businesses, including a hotel, a general store, and a blacksmith shop.
In the early 1900s, the town began to decline. The railroad bypassed the town, and the stagecoach line was discontinued. The population began to dwindle, and by the 1950s, the town was nearly abandoned.
In the late 1970s, the town was revitalized when Fort Clark Springs was established. The fort was a military training facility, and it brought new life to the town. The fort closed in the early 1990s, but the town has continued to thrive.
Geography
Clark Springs is located in Kinney County, Texas. It is situated approximately 25 miles south of Brackettville and about 50 miles west of Del Rio. The town is located in the Chihuahuan Desert, and the terrain is mostly flat. The climate is arid, with hot summers and mild winters.
Economy
The economy of Clark Springs is largely based on tourism. The town is a popular destination for hunters, hikers, and other outdoor enthusiasts. There are several hunting lodges and guest ranches in the area, as well as a few restaurants and stores.
The town is also home to several small businesses, including a gas station, a grocery store, and a hardware store. The town also has a post office and a library.
Demographics
As of the 2010 census, the population of Clark Springs was 545. The racial makeup of the town was 94.2% White, 0.7% African American, 0.4% Native American, 0.2% Asian, and 4.5% from other races. The median household income was $25,000, and the median age was 44.
Conclusion
Clark Springs, Texas is a small unincorporated community located in Kinney County, Texas. It was founded in 1852 by a group of settlers led by Captain John Clark, and it quickly grew into a thriving community. The town was a popular stop for travelers on the San Antonio-El Paso Road, and it had a thriving economy with several businesses. In the late 1970s, the town was revitalized when Fort Clark Springs was established. The fort closed in the early 1990s, but the town has continued to thrive. The economy of Clark Springs is largely based on tourism, and the town is home to several small businesses. As of the 2010 census, the population of Clark Springs was 545.
Common Questions
What is the Total Population of Fort Clark Springs?
Total Population of Fort Clark Springs is 1,298.
What is the Total Male Population of Fort Clark Springs?
Total Male Population of Fort Clark Springs is 823.
What is the Total Female Population of Fort Clark Springs?
Total Female Population of Fort Clark Springs is 475.
What is the Ratio of Males per 100 Females in Fort Clark Springs?
There are 173.26 Males per 100 Females in Fort Clark Springs.
What is the Ratio of Females per 100 Males in Fort Clark Springs?
There are 57.72 Females per 100 Males in Fort Clark Springs.
What is the Median Population Age in Fort Clark Springs?
Median Population Age in Fort Clark Springs is 56.6 Years.
What is the Average Family Size in Fort Clark Springs
Average Family Size in Fort Clark Springs is 2.9 People.
What is the Average Household Size in Fort Clark Springs
Average Household Size in Fort Clark Springs is 2.1 People.
What is Per Capita Income in Fort Clark Springs?
Per Capita income in Fort Clark Springs is $41,377.
What is the Median Family Income in Fort Clark Springs?
Median Family Income in Fort Clark Springs is $70,318.
What is the Median Household income in Fort Clark Springs?
Median Household Income in Fort Clark Springs is $69,611.
What is Inequality or Gini Index in Fort Clark Springs?
Inequality or Gini Index in Fort Clark Springs is 0.38.
How Large is the Labor Force in Fort Clark Springs?
There are 577 People in the Labor Forcein in Fort Clark Springs.
What is the Percentage of People in the Labor Force in Fort Clark Springs?
48.3% of People are in the Labor Force in Fort Clark Springs.