Smith County, TX
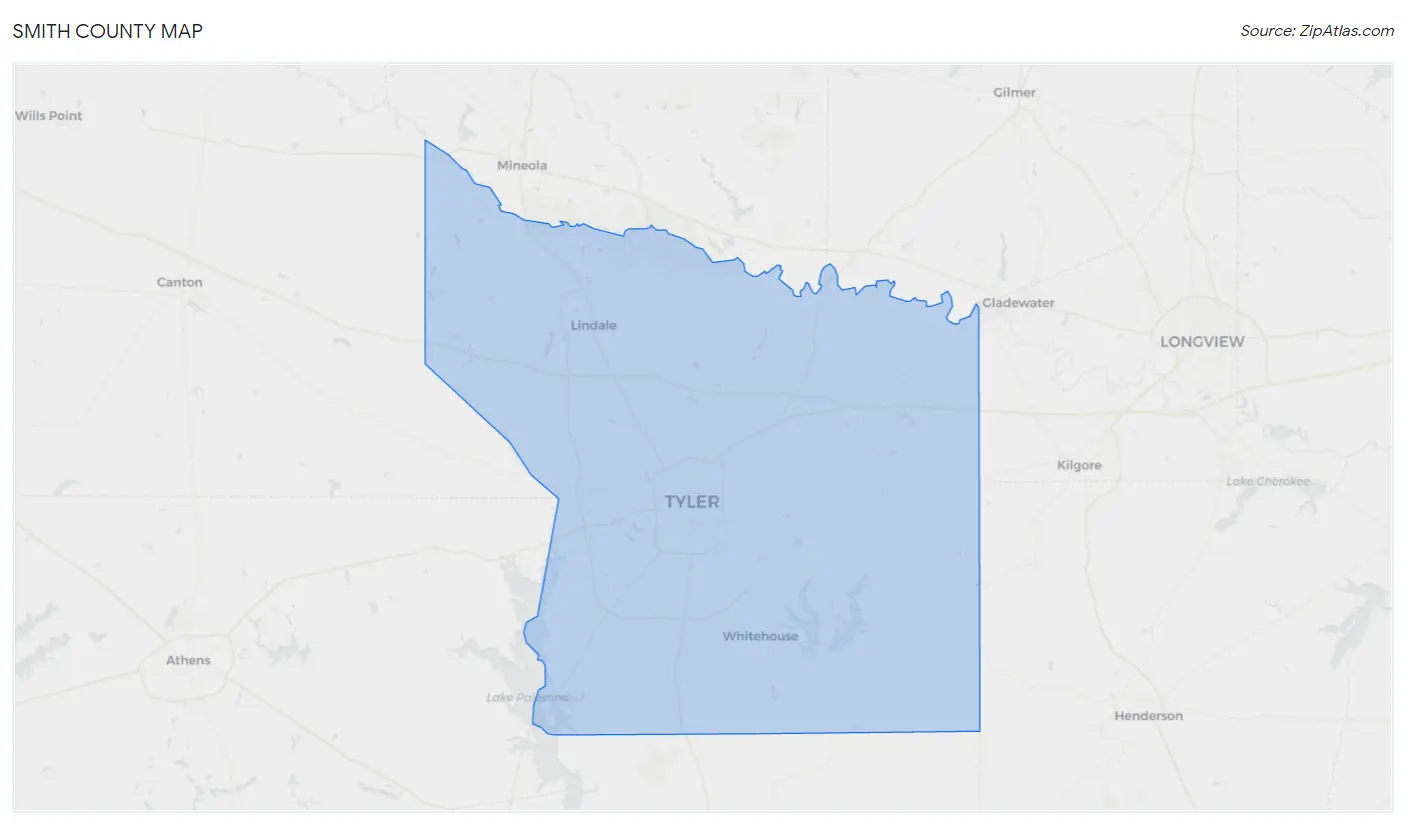
Smith County Map
Smith County Overview
234,667
TOTAL POPULATION
113,874
MALE POPULATION
120,793
FEMALE POPULATION
94.27
MALES / 100 FEMALES
106.08
FEMALES / 100 MALES
37.2
MEDIAN AGE
3.4
AVG FAMILY SIZE
2.8
AVG HOUSEHOLD SIZE
$33,903
PER CAPITA INCOME
$83,564
AVG FAMILY INCOME
$69,053
AVG HOUSEHOLD INCOME
25.9%
WAGE / INCOME GAP [ % ]
74.1¢/ $1
WAGE / INCOME GAP [ $ ]
$12,152
FAMILY INCOME DEFICIT
0.46
INEQUALITY / GINI INDEX
114,896
LABOR FORCE [ PEOPLE ]
62.4%
PERCENT IN LABOR FORCE
4.7%
UNEMPLOYMENT RATE
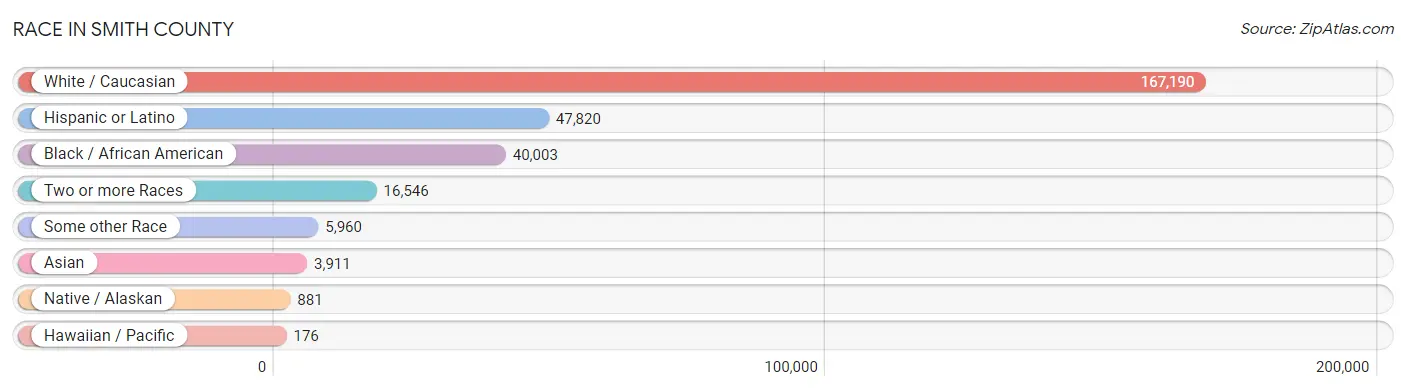
Race in Smith County
The most populous races in Smith County are White / Caucasian (167,190 | 71.3%), Hispanic or Latino (47,820 | 20.4%), and Black / African American (40,003 | 17.1%).
| Race | # Population | % Population |
| Asian | 3,911 | 1.7% |
| Black / African American | 40,003 | 17.1% |
| Hawaiian / Pacific | 176 | 0.1% |
| Hispanic or Latino | 47,820 | 20.4% |
| Native / Alaskan | 881 | 0.4% |
| White / Caucasian | 167,190 | 71.3% |
| Two or more Races | 16,546 | 7.0% |
| Some other Race | 5,960 | 2.5% |
| Total | 234,667 | 100.0% |
Ancestry in Smith County
The most populous ancestries reported in Smith County are American (44,212 | 18.8%), Mexican (43,403 | 18.5%), English (22,501 | 9.6%), German (20,709 | 8.8%), and Irish (17,814 | 7.6%), together accounting for 63.3% of all Smith County residents.

| Ancestry | # Population | % Population |
| African | 2,862 | 1.2% |
| American | 44,212 | 18.8% |
| Apache | 20 | 0.0% |
| Arab | 536 | 0.2% |
| Argentinean | 26 | 0.0% |
| Armenian | 22 | 0.0% |
| Australian | 231 | 0.1% |
| Austrian | 264 | 0.1% |
| Bahamian | 13 | 0.0% |
| Bangladeshi | 74 | 0.0% |
| Basque | 76 | 0.0% |
| Belgian | 184 | 0.1% |
| Belizean | 11 | 0.0% |
| Bhutanese | 224 | 0.1% |
| Blackfeet | 347 | 0.2% |
| Bolivian | 94 | 0.0% |
| Brazilian | 143 | 0.1% |
| British | 1,005 | 0.4% |
| Burmese | 283 | 0.1% |
| Cajun | 285 | 0.1% |
| Canadian | 80 | 0.0% |
| Celtic | 26 | 0.0% |
| Central American | 1,792 | 0.8% |
| Central American Indian | 307 | 0.1% |
| Cherokee | 507 | 0.2% |
| Chickasaw | 32 | 0.0% |
| Chilean | 17 | 0.0% |
| Choctaw | 96 | 0.0% |
| Colombian | 118 | 0.1% |
| Comanche | 55 | 0.0% |
| Costa Rican | 104 | 0.0% |
| Creek | 7 | 0.0% |
| Croatian | 20 | 0.0% |
| Cuban | 92 | 0.0% |
| Cypriot | 16 | 0.0% |
| Czech | 592 | 0.3% |
| Czechoslovakian | 37 | 0.0% |
| Danish | 263 | 0.1% |
| Dominican | 109 | 0.1% |
| Dutch | 2,194 | 0.9% |
| Dutch West Indian | 34 | 0.0% |
| Eastern European | 287 | 0.1% |
| Ecuadorian | 137 | 0.1% |
| Egyptian | 28 | 0.0% |
| English | 22,501 | 9.6% |
| Ethiopian | 12 | 0.0% |
| European | 3,288 | 1.4% |
| Filipino | 24 | 0.0% |
| Finnish | 101 | 0.0% |
| French | 3,336 | 1.4% |
| French Canadian | 324 | 0.1% |
| German | 20,709 | 8.8% |
| Ghanaian | 51 | 0.0% |
| Greek | 156 | 0.1% |
| Guatemalan | 388 | 0.2% |
| Haitian | 64 | 0.0% |
| Honduran | 552 | 0.2% |
| Hungarian | 146 | 0.1% |
| Icelander | 28 | 0.0% |
| Indian (Asian) | 811 | 0.4% |
| Iranian | 109 | 0.1% |
| Iraqi | 13 | 0.0% |
| Irish | 17,814 | 7.6% |
| Israeli | 80 | 0.0% |
| Italian | 3,001 | 1.3% |
| Jamaican | 67 | 0.0% |
| Japanese | 10 | 0.0% |
| Jordanian | 38 | 0.0% |
| Kenyan | 116 | 0.1% |
| Korean | 1,073 | 0.5% |
| Laotian | 81 | 0.0% |
| Latvian | 23 | 0.0% |
| Lebanese | 253 | 0.1% |
| Lithuanian | 38 | 0.0% |
| Mexican | 43,403 | 18.5% |
| Mexican American Indian | 300 | 0.1% |
| Native Hawaiian | 146 | 0.1% |
| Navajo | 46 | 0.0% |
| Nicaraguan | 14 | 0.0% |
| Nigerian | 1,346 | 0.6% |
| Northern European | 237 | 0.1% |
| Norwegian | 1,396 | 0.6% |
| Pakistani | 21 | 0.0% |
| Palestinian | 88 | 0.0% |
| Panamanian | 71 | 0.0% |
| Pennsylvania German | 42 | 0.0% |
| Peruvian | 133 | 0.1% |
| Pima | 2 | 0.0% |
| Polish | 1,281 | 0.5% |
| Portuguese | 139 | 0.1% |
| Potawatomi | 1 | 0.0% |
| Puerto Rican | 599 | 0.3% |
| Romanian | 74 | 0.0% |
| Russian | 475 | 0.2% |
| Salvadoran | 629 | 0.3% |
| Scandinavian | 765 | 0.3% |
| Scotch-Irish | 2,152 | 0.9% |
| Scottish | 3,727 | 1.6% |
| Serbian | 28 | 0.0% |
| Sioux | 40 | 0.0% |
| Slavic | 72 | 0.0% |
| Slovak | 25 | 0.0% |
| South African | 43 | 0.0% |
| South American | 787 | 0.3% |
| Spaniard | 196 | 0.1% |
| Spanish | 189 | 0.1% |
| Spanish American | 18 | 0.0% |
| Sri Lankan | 986 | 0.4% |
| Subsaharan African | 4,834 | 2.1% |
| Swedish | 1,309 | 0.6% |
| Swiss | 218 | 0.1% |
| Syrian | 5 | 0.0% |
| Thai | 547 | 0.2% |
| Tongan | 61 | 0.0% |
| Trinidadian and Tobagonian | 34 | 0.0% |
| Turkish | 90 | 0.0% |
| Ukrainian | 72 | 0.0% |
| Venezuelan | 262 | 0.1% |
| Vietnamese | 15 | 0.0% |
| Welsh | 861 | 0.4% |
| Yugoslavian | 22 | 0.0% | View All 121 Rows |
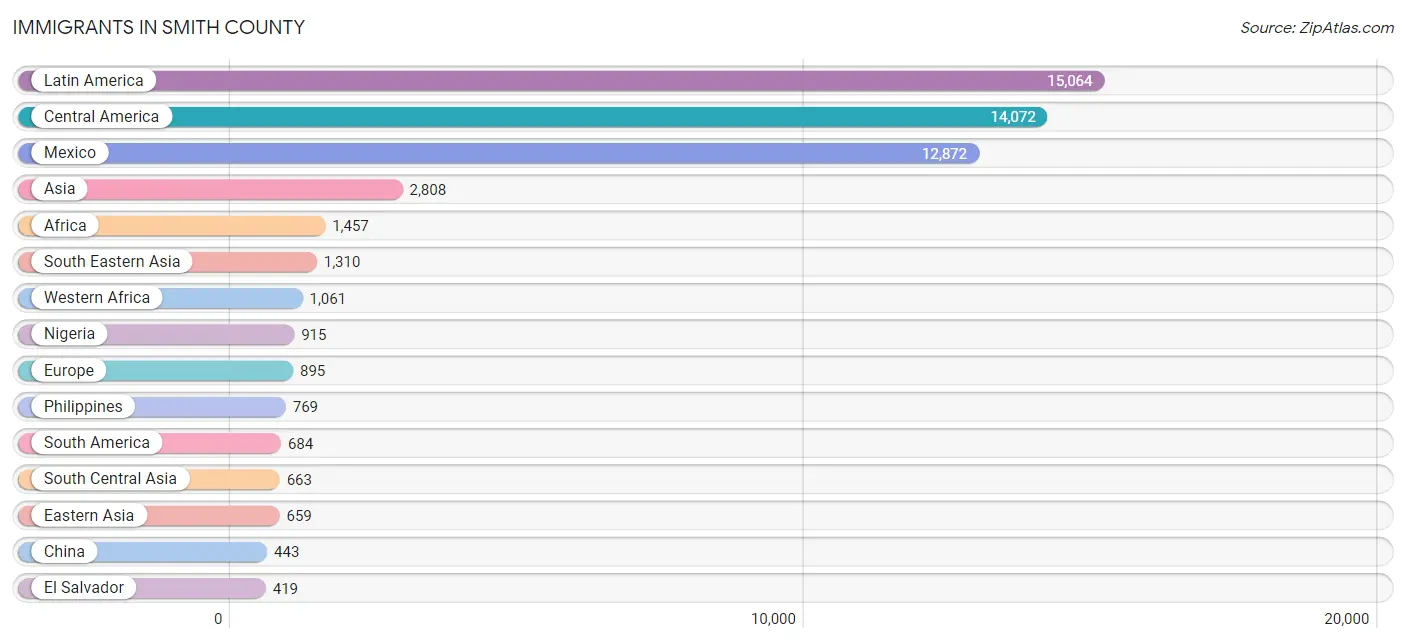
Immigrants in Smith County
The most numerous immigrant groups reported in Smith County came from Latin America (15,064 | 6.4%), Central America (14,072 | 6.0%), Mexico (12,872 | 5.5%), Asia (2,808 | 1.2%), and Africa (1,457 | 0.6%), together accounting for 19.7% of all Smith County residents.
| Immigration Origin | # Population | % Population |
| Africa | 1,457 | 0.6% |
| Argentina | 55 | 0.0% |
| Asia | 2,808 | 1.2% |
| Australia | 27 | 0.0% |
| Bahamas | 13 | 0.0% |
| Bangladesh | 15 | 0.0% |
| Belgium | 17 | 0.0% |
| Bolivia | 40 | 0.0% |
| Brazil | 149 | 0.1% |
| Cambodia | 10 | 0.0% |
| Cameroon | 15 | 0.0% |
| Canada | 246 | 0.1% |
| Caribbean | 308 | 0.1% |
| Central America | 14,072 | 6.0% |
| Chile | 10 | 0.0% |
| China | 443 | 0.2% |
| Colombia | 24 | 0.0% |
| Costa Rica | 104 | 0.0% |
| Cuba | 93 | 0.0% |
| Czechoslovakia | 10 | 0.0% |
| Denmark | 17 | 0.0% |
| Dominican Republic | 67 | 0.0% |
| Eastern Africa | 217 | 0.1% |
| Eastern Asia | 659 | 0.3% |
| Eastern Europe | 233 | 0.1% |
| Ecuador | 137 | 0.1% |
| El Salvador | 419 | 0.2% |
| England | 115 | 0.1% |
| Ethiopia | 12 | 0.0% |
| Europe | 895 | 0.4% |
| France | 29 | 0.0% |
| Germany | 178 | 0.1% |
| Ghana | 51 | 0.0% |
| Greece | 6 | 0.0% |
| Guatemala | 296 | 0.1% |
| Honduras | 363 | 0.2% |
| Hong Kong | 7 | 0.0% |
| Hungary | 50 | 0.0% |
| India | 333 | 0.1% |
| Indonesia | 81 | 0.0% |
| Iran | 64 | 0.0% |
| Jamaica | 65 | 0.0% |
| Jordan | 19 | 0.0% |
| Kenya | 90 | 0.0% |
| Korea | 216 | 0.1% |
| Laos | 14 | 0.0% |
| Latin America | 15,064 | 6.4% |
| Latvia | 28 | 0.0% |
| Malaysia | 6 | 0.0% |
| Mexico | 12,872 | 5.5% |
| Middle Africa | 15 | 0.0% |
| Nepal | 20 | 0.0% |
| Netherlands | 43 | 0.0% |
| Nigeria | 915 | 0.4% |
| Northern Africa | 95 | 0.0% |
| Northern Europe | 348 | 0.2% |
| Oceania | 35 | 0.0% |
| Pakistan | 156 | 0.1% |
| Peru | 18 | 0.0% |
| Philippines | 769 | 0.3% |
| Romania | 36 | 0.0% |
| Russia | 62 | 0.0% |
| Saudi Arabia | 9 | 0.0% |
| Serbia | 8 | 0.0% |
| Sierra Leone | 40 | 0.0% |
| South Africa | 14 | 0.0% |
| South America | 684 | 0.3% |
| South Central Asia | 663 | 0.3% |
| South Eastern Asia | 1,310 | 0.6% |
| Southern Europe | 33 | 0.0% |
| Spain | 27 | 0.0% |
| Sri Lanka | 65 | 0.0% |
| Switzerland | 14 | 0.0% |
| Taiwan | 40 | 0.0% |
| Thailand | 32 | 0.0% |
| Trinidad and Tobago | 34 | 0.0% |
| Turkey | 43 | 0.0% |
| Ukraine | 24 | 0.0% |
| Uzbekistan | 10 | 0.0% |
| Venezuela | 251 | 0.1% |
| Vietnam | 398 | 0.2% |
| Western Africa | 1,061 | 0.4% |
| Western Asia | 120 | 0.1% |
| Western Europe | 281 | 0.1% | View All 84 Rows |
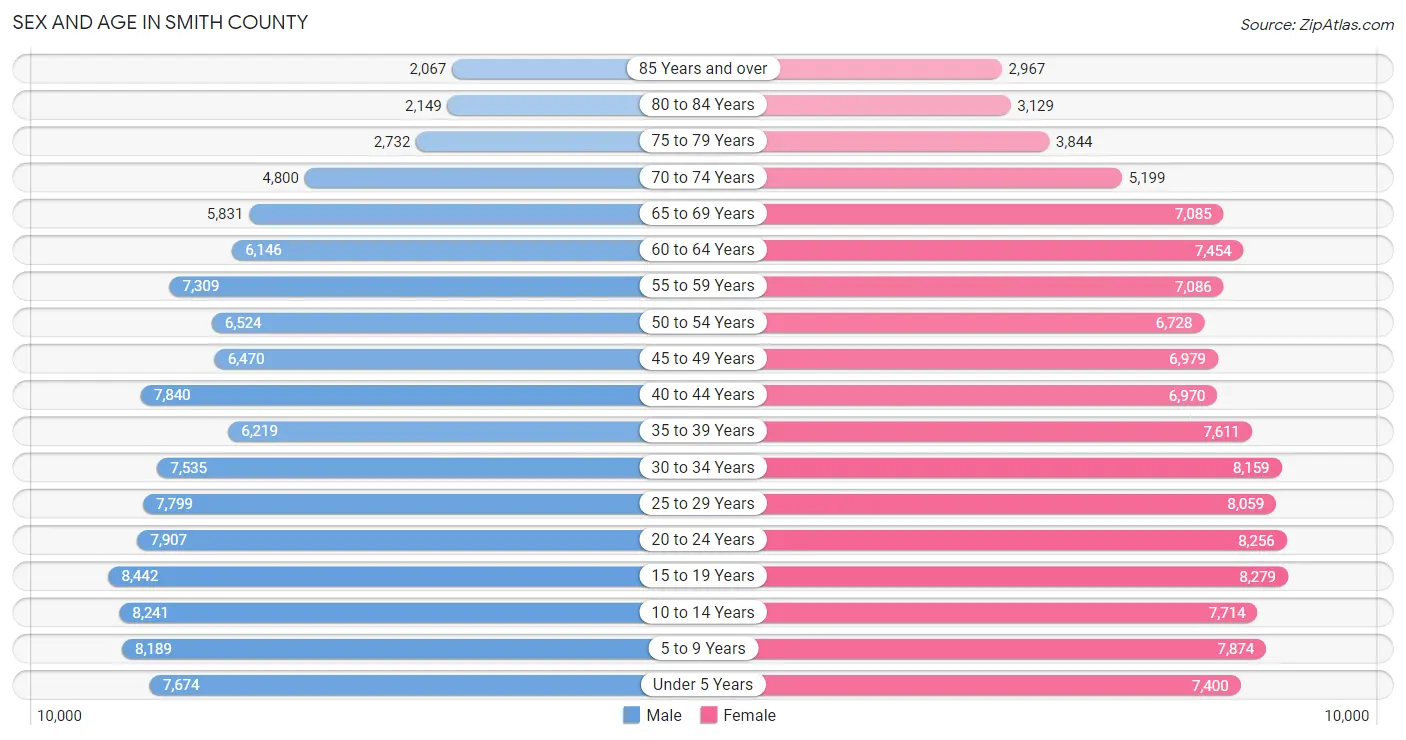
Sex and Age in Smith County
Sex and Age in Smith County
The most populous age groups in Smith County are 15 to 19 Years (8,442 | 7.4%) for men and 15 to 19 Years (8,279 | 6.9%) for women.
| Age Bracket | Male | Female |
| Under 5 Years | 7,674 (6.7%) | 7,400 (6.1%) |
| 5 to 9 Years | 8,189 (7.2%) | 7,874 (6.5%) |
| 10 to 14 Years | 8,241 (7.2%) | 7,714 (6.4%) |
| 15 to 19 Years | 8,442 (7.4%) | 8,279 (6.9%) |
| 20 to 24 Years | 7,907 (6.9%) | 8,256 (6.8%) |
| 25 to 29 Years | 7,799 (6.9%) | 8,059 (6.7%) |
| 30 to 34 Years | 7,535 (6.6%) | 8,159 (6.8%) |
| 35 to 39 Years | 6,219 (5.5%) | 7,611 (6.3%) |
| 40 to 44 Years | 7,840 (6.9%) | 6,970 (5.8%) |
| 45 to 49 Years | 6,470 (5.7%) | 6,979 (5.8%) |
| 50 to 54 Years | 6,524 (5.7%) | 6,728 (5.6%) |
| 55 to 59 Years | 7,309 (6.4%) | 7,086 (5.9%) |
| 60 to 64 Years | 6,146 (5.4%) | 7,454 (6.2%) |
| 65 to 69 Years | 5,831 (5.1%) | 7,085 (5.9%) |
| 70 to 74 Years | 4,800 (4.2%) | 5,199 (4.3%) |
| 75 to 79 Years | 2,732 (2.4%) | 3,844 (3.2%) |
| 80 to 84 Years | 2,149 (1.9%) | 3,129 (2.6%) |
| 85 Years and over | 2,067 (1.8%) | 2,967 (2.5%) |
| Total | 113,874 (100.0%) | 120,793 (100.0%) |
Families and Households in Smith County
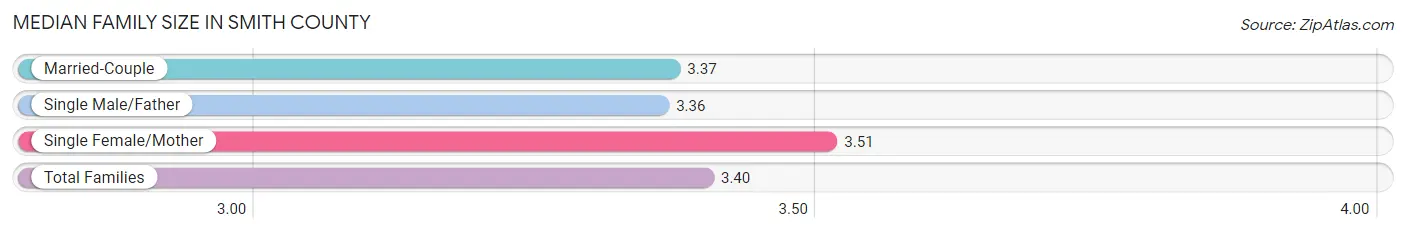
Median Family Size in Smith County
The median family size in Smith County is 3.40 persons per family, with single female/mother families (10,470 | 18.7%) accounting for the largest median family size of 3.51 persons per family. On the other hand, single male/father families (3,338 | 6.0%) represent the smallest median family size with 3.36 persons per family.
| Family Type | # Families | Family Size |
| Married-Couple | 42,208 (75.3%) | 3.37 |
| Single Male/Father | 3,338 (6.0%) | 3.36 |
| Single Female/Mother | 10,470 (18.7%) | 3.51 |
| Total Families | 56,016 (100.0%) | 3.40 |
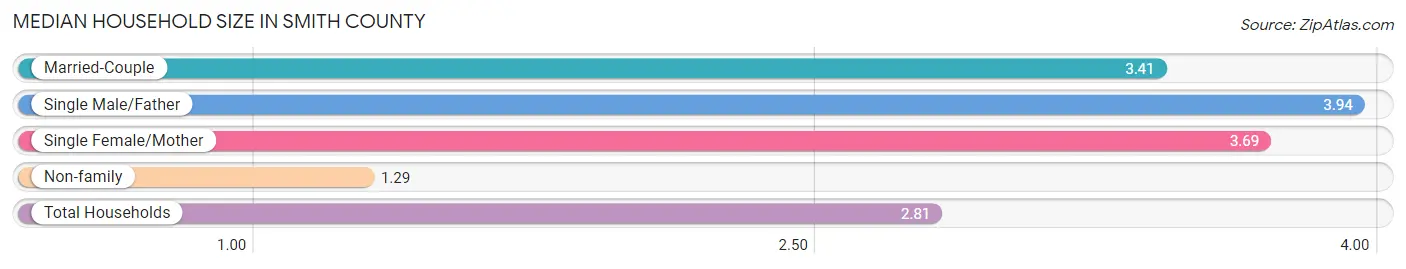
Median Household Size in Smith County
The median household size in Smith County is 2.81 persons per household, with single male/father households (3,338 | 4.1%) accounting for the largest median household size of 3.94 persons per household. non-family households (25,270 | 31.1%) represent the smallest median household size with 1.29 persons per household.
| Household Type | # Households | Household Size |
| Married-Couple | 42,208 (51.9%) | 3.41 |
| Single Male/Father | 3,338 (4.1%) | 3.94 |
| Single Female/Mother | 10,470 (12.9%) | 3.69 |
| Non-family | 25,270 (31.1%) | 1.29 |
| Total Households | 81,286 (100.0%) | 2.81 |
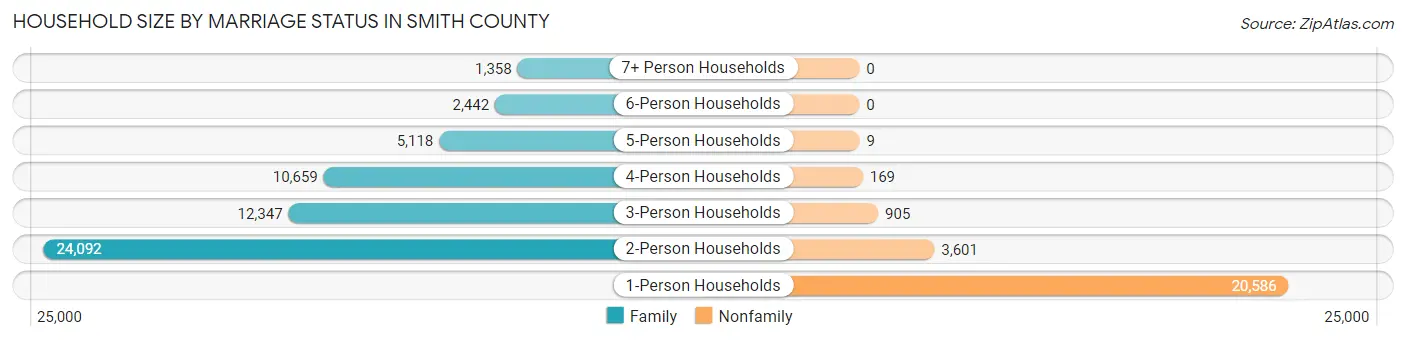
Household Size by Marriage Status in Smith County
Out of a total of 81,286 households in Smith County, 56,016 (68.9%) are family households, while 25,270 (31.1%) are nonfamily households. The most numerous type of family households are 2-person households, comprising 24,092, and the most common type of nonfamily households are 1-person households, comprising 20,586.
| Household Size | Family Households | Nonfamily Households |
| 1-Person Households | - | 20,586 (25.3%) |
| 2-Person Households | 24,092 (29.6%) | 3,601 (4.4%) |
| 3-Person Households | 12,347 (15.2%) | 905 (1.1%) |
| 4-Person Households | 10,659 (13.1%) | 169 (0.2%) |
| 5-Person Households | 5,118 (6.3%) | 9 (0.0%) |
| 6-Person Households | 2,442 (3.0%) | 0 (0.0%) |
| 7+ Person Households | 1,358 (1.7%) | 0 (0.0%) |
| Total | 56,016 (68.9%) | 25,270 (31.1%) |
Female Fertility in Smith County
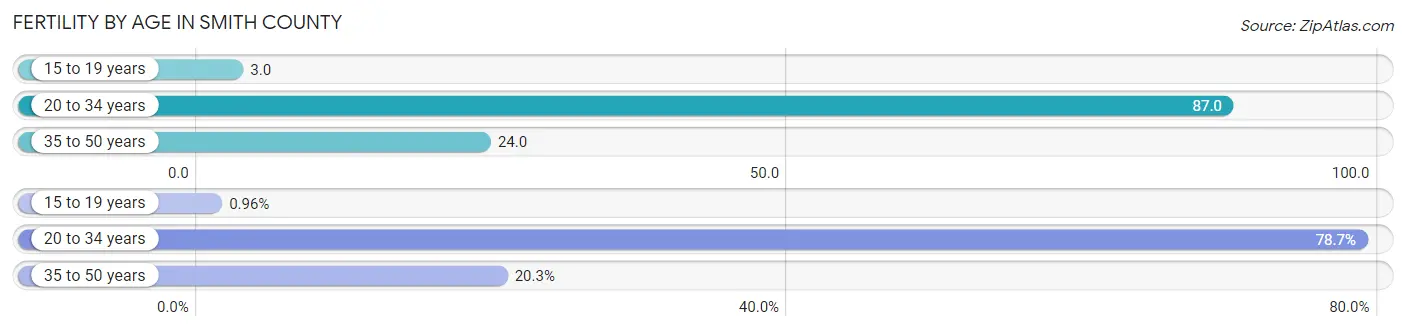
Fertility by Age in Smith County
Average fertility rate in Smith County is 49.0 births per 1,000 women. Women in the age bracket of 20 to 34 years have the highest fertility rate with 87.0 births per 1,000 women. Women in the age bracket of 20 to 34 years acount for 78.7% of all women with births.
| Age Bracket | Women with Births | Births / 1,000 Women |
| 15 to 19 years | 26 (1.0%) | 3.0 |
| 20 to 34 years | 2,128 (78.7%) | 87.0 |
| 35 to 50 years | 550 (20.3%) | 24.0 |
| Total | 2,704 (100.0%) | 49.0 |
Fertility by Age by Marriage Status in Smith County
75.5% of women with births (2,704) in Smith County are married. The highest percentage of unmarried women with births falls into 15 to 19 years age bracket with 100.0% of them unmarried at the time of birth, while the lowest percentage of unmarried women with births belong to 35 to 50 years age bracket with 9.6% of them unmarried.

| Age Bracket | Married | Unmarried |
| 15 to 19 years | 0 (0.0%) | 26 (100.0%) |
| 20 to 34 years | 1,545 (72.6%) | 583 (27.4%) |
| 35 to 50 years | 497 (90.4%) | 53 (9.6%) |
| Total | 2,042 (75.5%) | 662 (24.5%) |
Fertility by Education in Smith County
Average fertility rate in Smith County is 49.0 births per 1,000 women. Women with the education attainment of graduate degree have the highest fertility rate of 67.0 births per 1,000 women, while women with the education attainment of less than high school have the lowest fertility at 34.0 births per 1,000 women. Women with the education attainment of college or associate's degree represent 32.6% of all women with births.
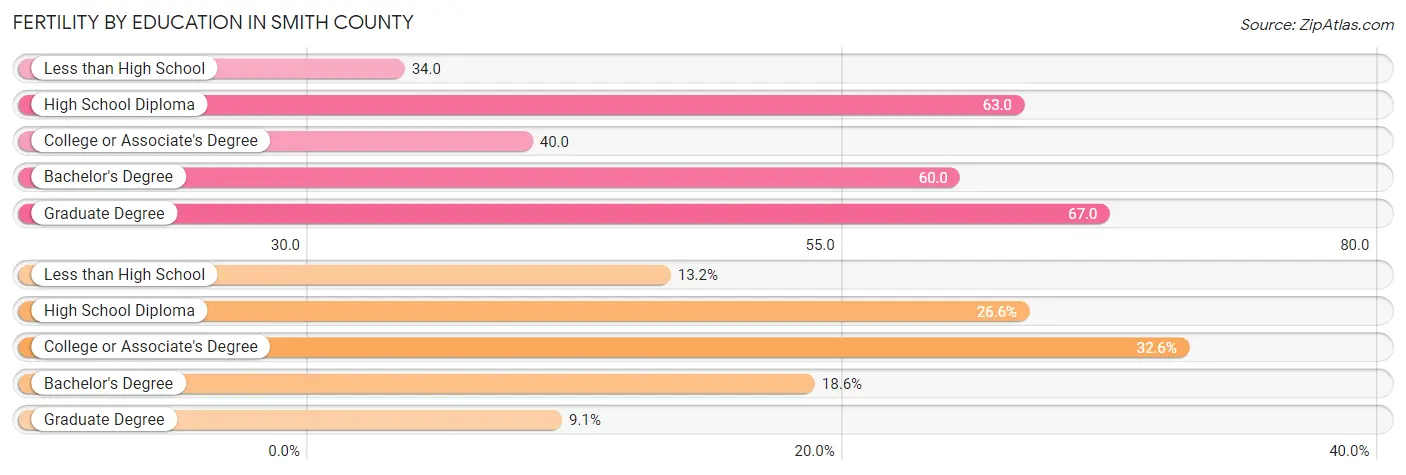
| Educational Attainment | Women with Births | Births / 1,000 Women |
| Less than High School | 356 (13.2%) | 34.0 |
| High School Diploma | 719 (26.6%) | 63.0 |
| College or Associate's Degree | 881 (32.6%) | 40.0 |
| Bachelor's Degree | 502 (18.6%) | 60.0 |
| Graduate Degree | 246 (9.1%) | 67.0 |
| Total | 2,704 (100.0%) | 49.0 |
Fertility by Education by Marriage Status in Smith County
24.5% of women with births in Smith County are unmarried. Women with the educational attainment of graduate degree are most likely to be married with 100.0% of them married at childbirth, while women with the educational attainment of less than high school are least likely to be married with 46.1% of them unmarried at childbirth.
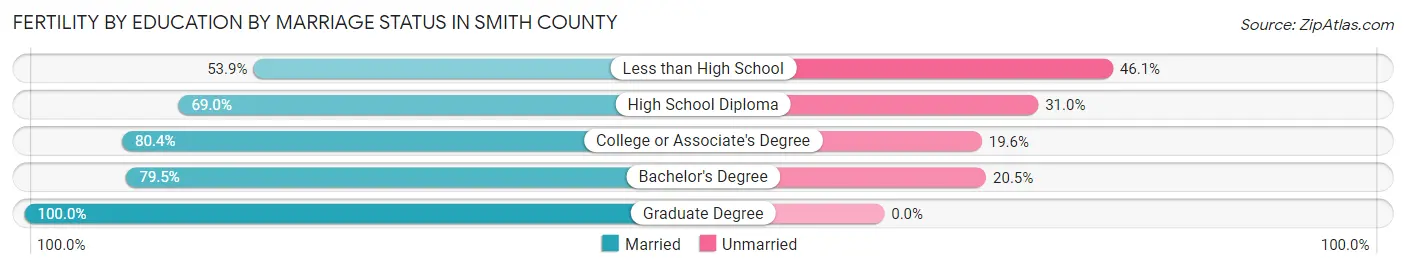
| Educational Attainment | Married | Unmarried |
| Less than High School | 192 (53.9%) | 164 (46.1%) |
| High School Diploma | 496 (69.0%) | 223 (31.0%) |
| College or Associate's Degree | 708 (80.4%) | 173 (19.6%) |
| Bachelor's Degree | 399 (79.5%) | 103 (20.5%) |
| Graduate Degree | 246 (100.0%) | 0 (0.0%) |
| Total | 2,042 (75.5%) | 662 (24.5%) |
Income in Smith County
Income Overview in Smith County
Per Capita Income in Smith County is $33,903, while median incomes of families and households are $83,564 and $69,053 respectively.
| Characteristic | Number | Measure |
| Per Capita Income | 234,667 | $33,903 |
| Median Family Income | 56,016 | $83,564 |
| Mean Family Income | 56,016 | $109,454 |
| Median Household Income | 81,286 | $69,053 |
| Mean Household Income | 81,286 | $92,062 |
| Income Deficit | 56,016 | $12,152 |
| Wage / Income Gap (%) | 234,667 | 25.87% |
| Wage / Income Gap ($) | 234,667 | 74.13¢ per $1 |
| Gini / Inequality Index | 234,667 | 0.46 |
Earnings by Sex in Smith County
Average Earnings in Smith County are $36,490, $43,203 for men and $32,025 for women, a difference of 25.9%.
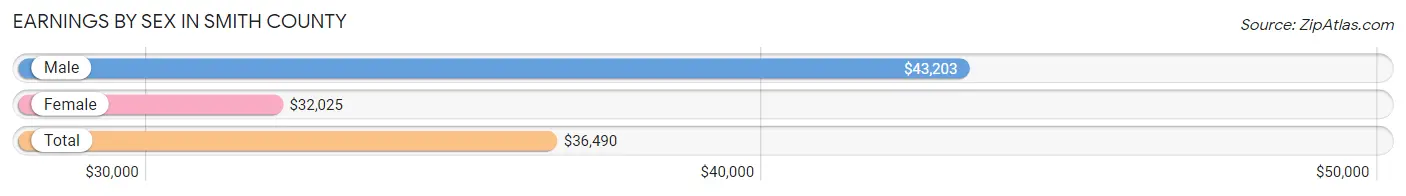
| Sex | Number | Average Earnings |
| Male | 61,568 (51.7%) | $43,203 |
| Female | 57,509 (48.3%) | $32,025 |
| Total | 119,077 (100.0%) | $36,490 |
Earnings by Sex by Income Bracket in Smith County
The most common earnings brackets in Smith County are $100,000+ for men (9,449 | 15.3%) and $55,000 to $64,999 for women (4,717 | 8.2%).
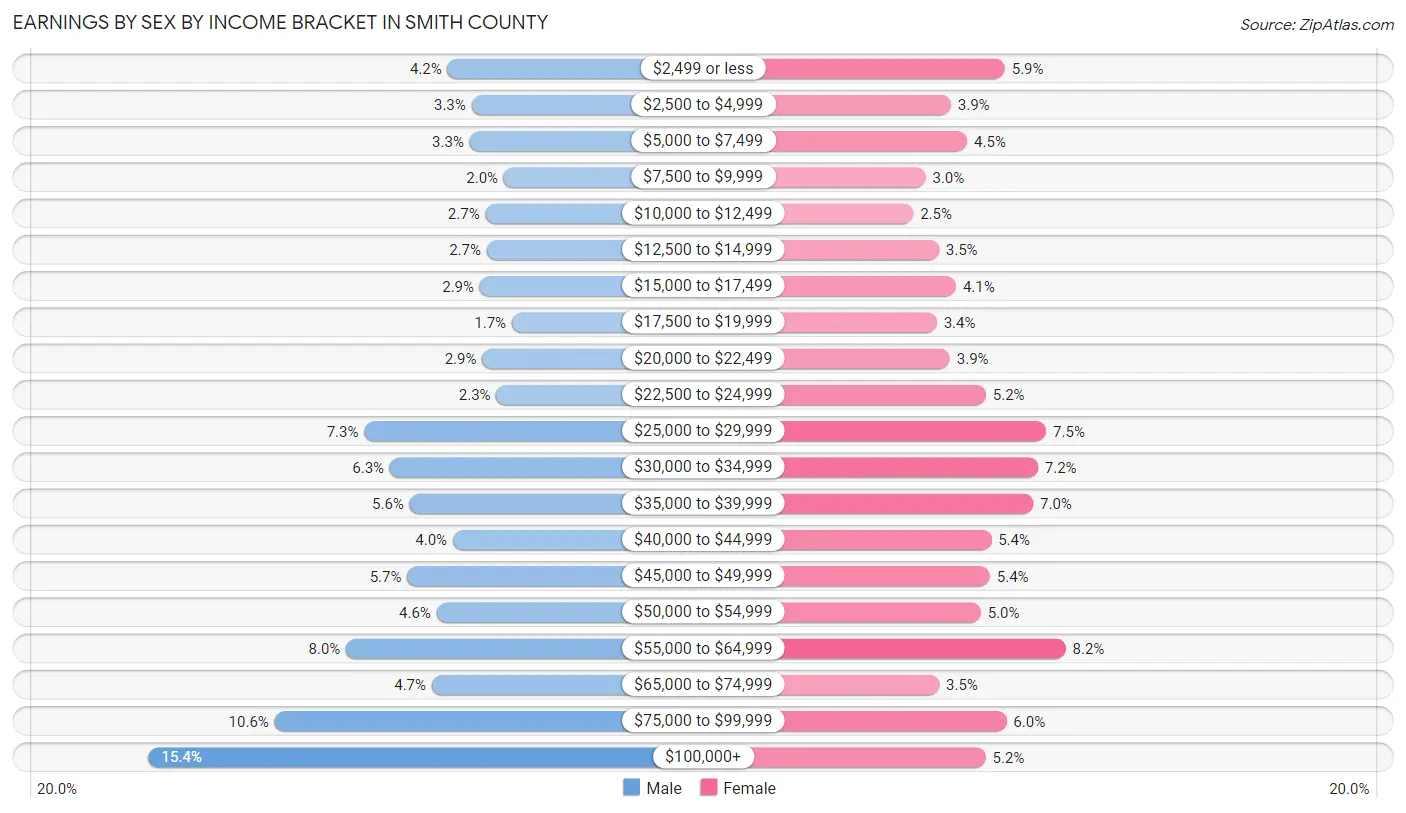
| Income | Male | Female |
| $2,499 or less | 2,558 (4.2%) | 3,405 (5.9%) |
| $2,500 to $4,999 | 2,001 (3.3%) | 2,244 (3.9%) |
| $5,000 to $7,499 | 2,042 (3.3%) | 2,593 (4.5%) |
| $7,500 to $9,999 | 1,257 (2.0%) | 1,698 (2.9%) |
| $10,000 to $12,499 | 1,682 (2.7%) | 1,430 (2.5%) |
| $12,500 to $14,999 | 1,652 (2.7%) | 1,984 (3.5%) |
| $15,000 to $17,499 | 1,808 (2.9%) | 2,351 (4.1%) |
| $17,500 to $19,999 | 1,070 (1.7%) | 1,936 (3.4%) |
| $20,000 to $22,499 | 1,754 (2.9%) | 2,222 (3.9%) |
| $22,500 to $24,999 | 1,429 (2.3%) | 2,998 (5.2%) |
| $25,000 to $29,999 | 4,474 (7.3%) | 4,297 (7.5%) |
| $30,000 to $34,999 | 3,882 (6.3%) | 4,119 (7.2%) |
| $35,000 to $39,999 | 3,431 (5.6%) | 4,015 (7.0%) |
| $40,000 to $44,999 | 2,434 (4.0%) | 3,111 (5.4%) |
| $45,000 to $49,999 | 3,482 (5.7%) | 3,080 (5.4%) |
| $50,000 to $54,999 | 2,807 (4.6%) | 2,889 (5.0%) |
| $55,000 to $64,999 | 4,894 (8.0%) | 4,717 (8.2%) |
| $65,000 to $74,999 | 2,916 (4.7%) | 1,990 (3.5%) |
| $75,000 to $99,999 | 6,546 (10.6%) | 3,441 (6.0%) |
| $100,000+ | 9,449 (15.3%) | 2,989 (5.2%) |
| Total | 61,568 (100.0%) | 57,509 (100.0%) |
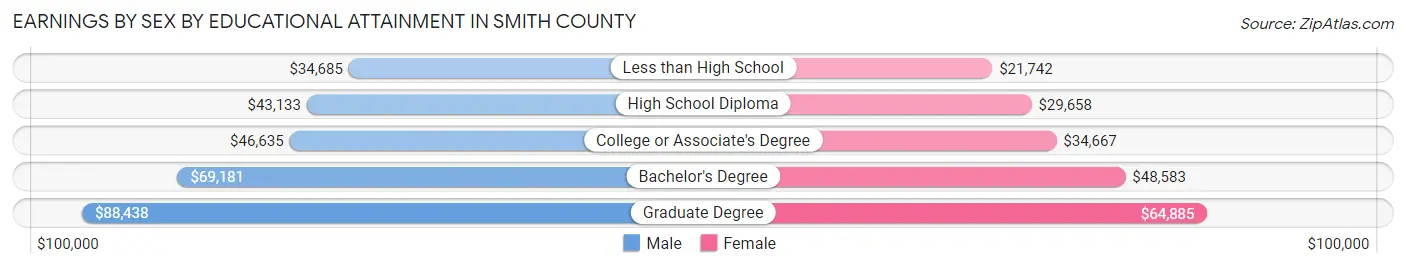
Earnings by Sex by Educational Attainment in Smith County
Average earnings in Smith County are $50,105 for men and $36,141 for women, a difference of 27.9%. Men with an educational attainment of graduate degree enjoy the highest average annual earnings of $88,438, while those with less than high school education earn the least with $34,685. Women with an educational attainment of graduate degree earn the most with the average annual earnings of $64,885, while those with less than high school education have the smallest earnings of $21,742.
| Educational Attainment | Male Income | Female Income |
| Less than High School | $34,685 | $21,742 |
| High School Diploma | $43,133 | $29,658 |
| College or Associate's Degree | $46,635 | $34,667 |
| Bachelor's Degree | $69,181 | $48,583 |
| Graduate Degree | $88,438 | $64,885 |
| Total | $50,105 | $36,141 |
Family Income in Smith County
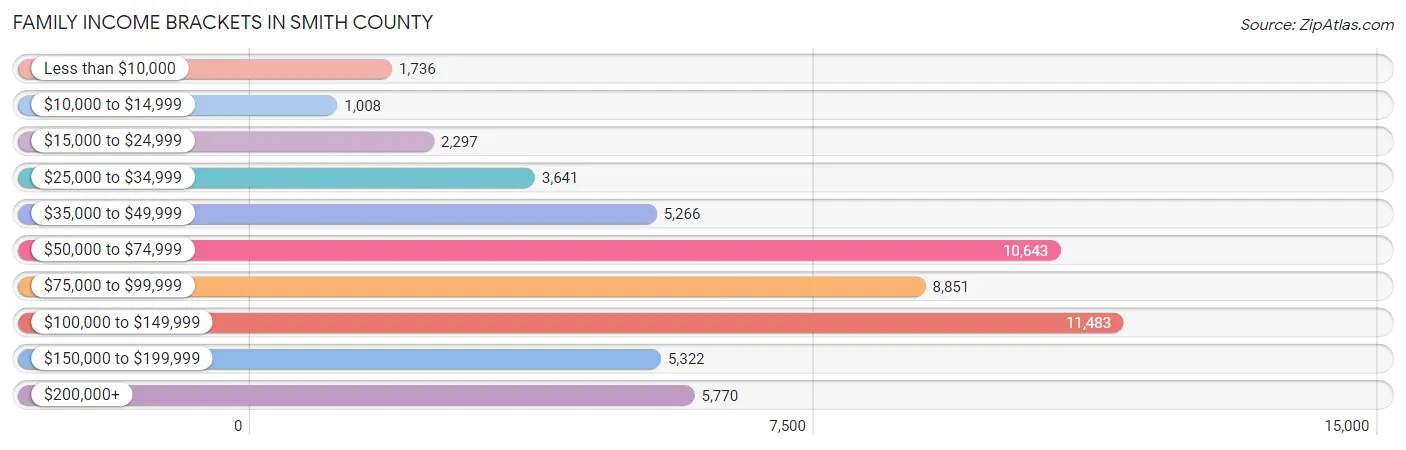
Family Income Brackets in Smith County
According to the Smith County family income data, there are 11,483 families falling into the $100,000 to $149,999 income range, which is the most common income bracket and makes up 20.5% of all families. Conversely, the $10,000 to $14,999 income bracket is the least frequent group with only 1,008 families (1.8%) belonging to this category.
| Income Bracket | # Families | % Families |
| Less than $10,000 | 1,736 | 3.1% |
| $10,000 to $14,999 | 1,008 | 1.8% |
| $15,000 to $24,999 | 2,297 | 4.1% |
| $25,000 to $34,999 | 3,641 | 6.5% |
| $35,000 to $49,999 | 5,266 | 9.4% |
| $50,000 to $74,999 | 10,643 | 19.0% |
| $75,000 to $99,999 | 8,851 | 15.8% |
| $100,000 to $149,999 | 11,483 | 20.5% |
| $150,000 to $199,999 | 5,322 | 9.5% |
| $200,000+ | 5,770 | 10.3% |
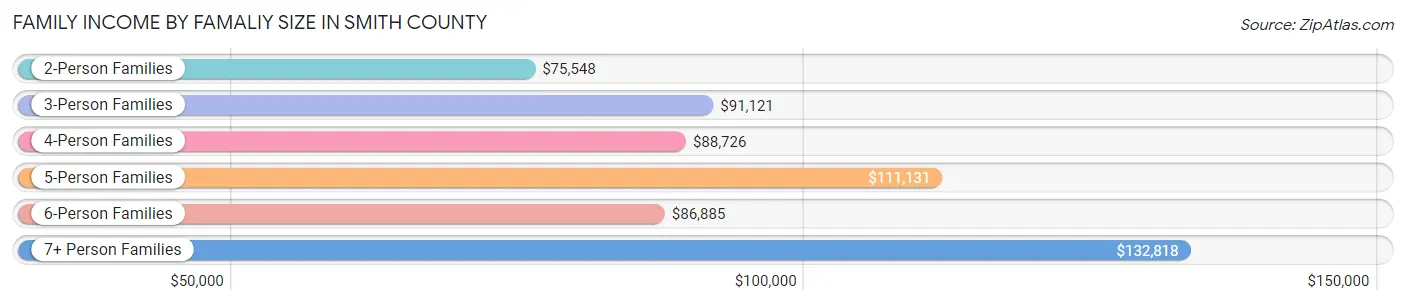
Family Income by Famaliy Size in Smith County
7+ person families (1,098 | 2.0%) account for the highest median family income in Smith County with $132,818 per family, while 2-person families (25,160 | 44.9%) have the highest median income of $37,774 per family member.
| Income Bracket | # Families | Median Income |
| 2-Person Families | 25,160 (44.9%) | $75,548 |
| 3-Person Families | 12,494 (22.3%) | $91,121 |
| 4-Person Families | 10,375 (18.5%) | $88,726 |
| 5-Person Families | 4,549 (8.1%) | $111,131 |
| 6-Person Families | 2,340 (4.2%) | $86,885 |
| 7+ Person Families | 1,098 (2.0%) | $132,818 |
| Total | 56,016 (100.0%) | $83,564 |
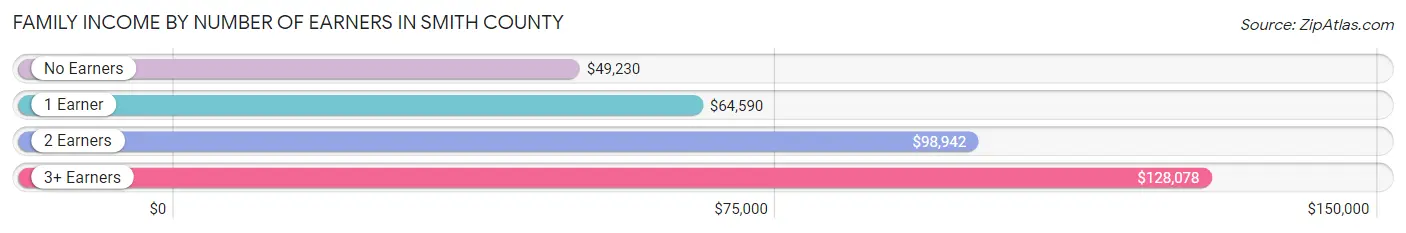
Family Income by Number of Earners in Smith County
The median family income in Smith County is $83,564, with families comprising 3+ earners (6,388) having the highest median family income of $128,078, while families with no earners (8,766) have the lowest median family income of $49,230, accounting for 11.4% and 15.7% of families, respectively.
| Number of Earners | # Families | Median Income |
| No Earners | 8,766 (15.7%) | $49,230 |
| 1 Earner | 17,482 (31.2%) | $64,590 |
| 2 Earners | 23,380 (41.7%) | $98,942 |
| 3+ Earners | 6,388 (11.4%) | $128,078 |
| Total | 56,016 (100.0%) | $83,564 |
Household Income in Smith County
Household Income Brackets in Smith County
With 14,875 households falling in the category, the $50,000 to $74,999 income range is the most frequent in Smith County, accounting for 18.3% of all households. In contrast, only 2,520 households (3.1%) fall into the $10,000 to $14,999 income bracket, making it the least populous group.

| Income Bracket | # Households | % Households |
| Less than $10,000 | 4,146 | 5.1% |
| $10,000 to $14,999 | 2,520 | 3.1% |
| $15,000 to $24,999 | 6,340 | 7.8% |
| $25,000 to $34,999 | 6,828 | 8.4% |
| $35,000 to $49,999 | 9,185 | 11.3% |
| $50,000 to $74,999 | 14,875 | 18.3% |
| $75,000 to $99,999 | 11,705 | 14.4% |
| $100,000 to $149,999 | 13,493 | 16.6% |
| $150,000 to $199,999 | 6,096 | 7.5% |
| $200,000+ | 6,178 | 7.6% |
Household Income by Householder Age in Smith County
The median household income in Smith County is $69,053, with the highest median household income of $80,816 found in the 45 to 64 years age bracket for the primary householder. A total of 27,873 households (34.3%) fall into this category. Meanwhile, the 15 to 24 years age bracket for the primary householder has the lowest median household income of $49,301, with 3,479 households (4.3%) in this group.
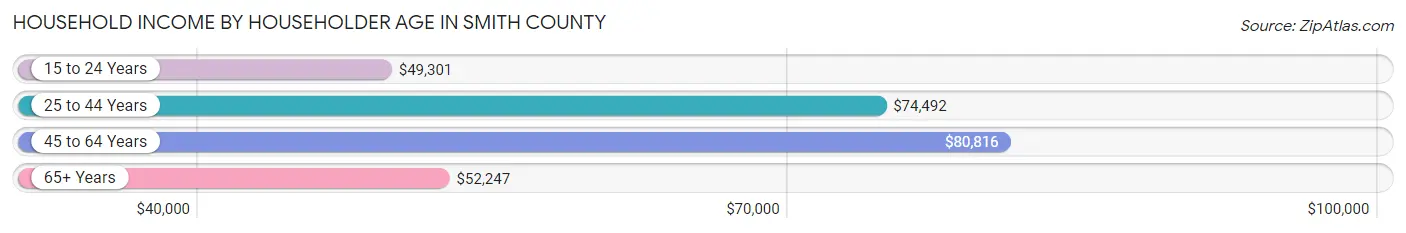
| Income Bracket | # Households | Median Income |
| 15 to 24 Years | 3,479 (4.3%) | $49,301 |
| 25 to 44 Years | 26,416 (32.5%) | $74,492 |
| 45 to 64 Years | 27,873 (34.3%) | $80,816 |
| 65+ Years | 23,518 (28.9%) | $52,247 |
| Total | 81,286 (100.0%) | $69,053 |
Poverty in Smith County
Income Below Poverty by Sex and Age in Smith County
With 12.3% poverty level for males and 12.9% for females among the residents of Smith County, 6 to 11 year old males and under 5 year old females are the most vulnerable to poverty, with 2,230 males (23.5%) and 1,338 females (18.5%) in their respective age groups living below the poverty level.
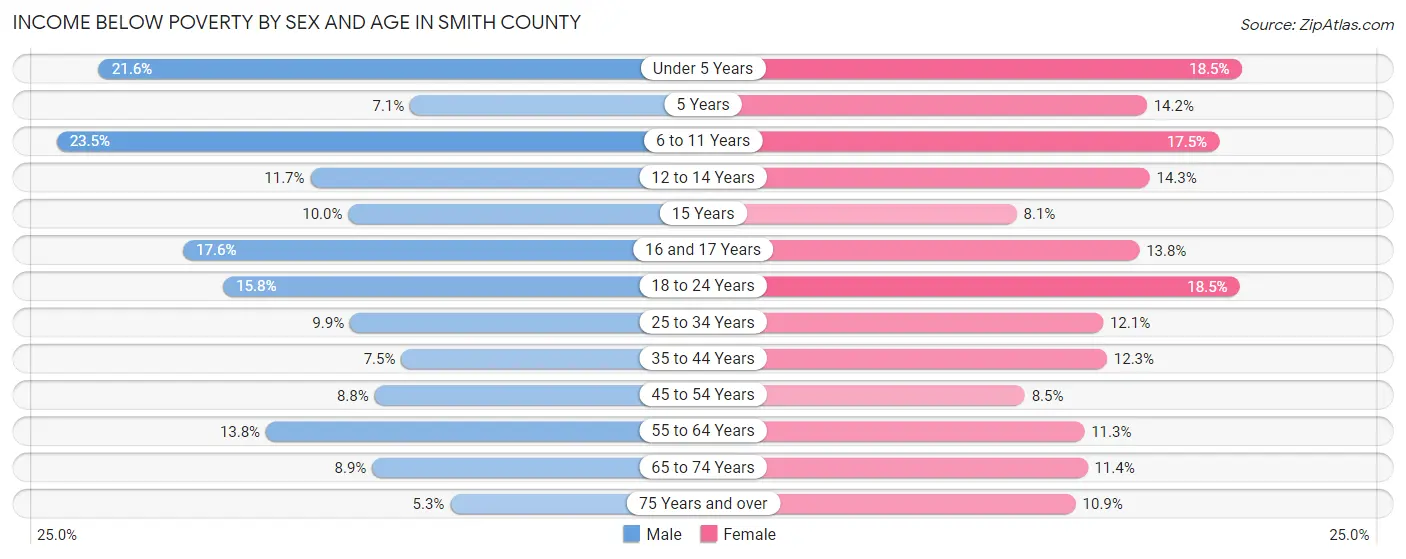
| Age Bracket | Male | Female |
| Under 5 Years | 1,611 (21.5%) | 1,338 (18.5%) |
| 5 Years | 87 (7.1%) | 289 (14.1%) |
| 6 to 11 Years | 2,230 (23.5%) | 1,544 (17.5%) |
| 12 to 14 Years | 623 (11.7%) | 617 (14.3%) |
| 15 Years | 190 (10.0%) | 124 (8.1%) |
| 16 and 17 Years | 525 (17.6%) | 451 (13.8%) |
| 18 to 24 Years | 1,625 (15.8%) | 1,870 (18.4%) |
| 25 to 34 Years | 1,493 (9.9%) | 1,957 (12.1%) |
| 35 to 44 Years | 1,036 (7.5%) | 1,785 (12.3%) |
| 45 to 54 Years | 1,114 (8.8%) | 1,159 (8.5%) |
| 55 to 64 Years | 1,816 (13.8%) | 1,614 (11.3%) |
| 65 to 74 Years | 938 (8.9%) | 1,386 (11.4%) |
| 75 Years and over | 357 (5.2%) | 1,020 (10.8%) |
| Total | 13,645 (12.3%) | 15,154 (12.9%) |
Income Above Poverty by Sex and Age in Smith County
According to the poverty statistics in Smith County, males aged 75 years and over and females aged 15 years are the age groups that are most secure financially, with 94.8% of males and 91.9% of females in these age groups living above the poverty line.
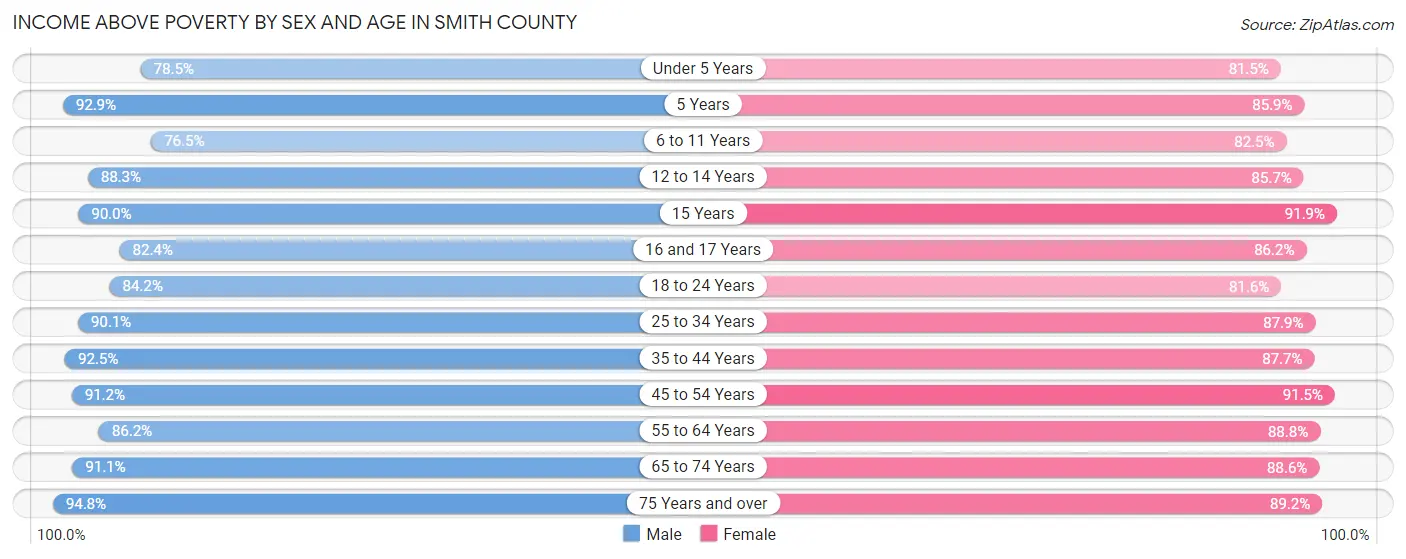
| Age Bracket | Male | Female |
| Under 5 Years | 5,865 (78.4%) | 5,878 (81.5%) |
| 5 Years | 1,136 (92.9%) | 1,754 (85.9%) |
| 6 to 11 Years | 7,256 (76.5%) | 7,281 (82.5%) |
| 12 to 14 Years | 4,685 (88.3%) | 3,703 (85.7%) |
| 15 Years | 1,714 (90.0%) | 1,405 (91.9%) |
| 16 and 17 Years | 2,452 (82.4%) | 2,817 (86.2%) |
| 18 to 24 Years | 8,672 (84.2%) | 8,266 (81.6%) |
| 25 to 34 Years | 13,581 (90.1%) | 14,186 (87.9%) |
| 35 to 44 Years | 12,734 (92.5%) | 12,726 (87.7%) |
| 45 to 54 Years | 11,606 (91.2%) | 12,499 (91.5%) |
| 55 to 64 Years | 11,340 (86.2%) | 12,735 (88.7%) |
| 65 to 74 Years | 9,635 (91.1%) | 10,776 (88.6%) |
| 75 Years and over | 6,447 (94.8%) | 8,383 (89.1%) |
| Total | 97,123 (87.7%) | 102,409 (87.1%) |
Income Below Poverty Among Married-Couple Families in Smith County
The poverty statistics for married-couple families in Smith County show that 4.8% or 2,012 of the total 42,208 families live below the poverty line. Families with 5 or more children have the highest poverty rate of 12.4%, comprising of 56 families. On the other hand, families with no children have the lowest poverty rate of 3.3%, which includes 770 families.
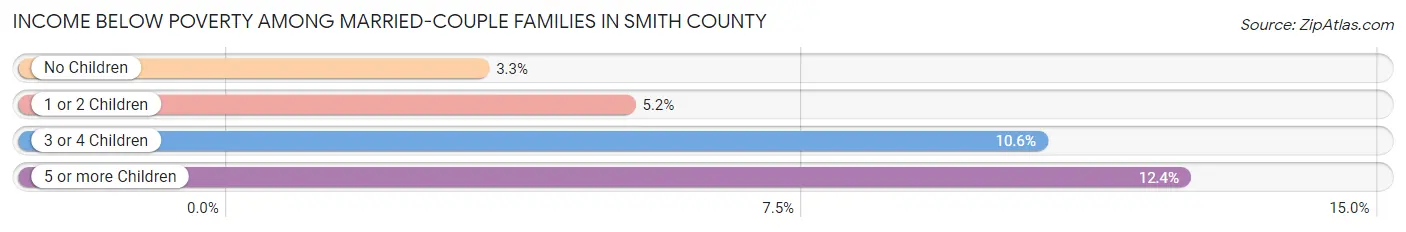
| Children | Above Poverty | Below Poverty |
| No Children | 22,715 (96.7%) | 770 (3.3%) |
| 1 or 2 Children | 13,134 (94.8%) | 719 (5.2%) |
| 3 or 4 Children | 3,953 (89.4%) | 467 (10.6%) |
| 5 or more Children | 394 (87.6%) | 56 (12.4%) |
| Total | 40,196 (95.2%) | 2,012 (4.8%) |
Income Below Poverty Among Single-Parent Households in Smith County
According to the poverty data in Smith County, 19.6% or 653 single-father households and 20.4% or 2,133 single-mother households are living below the poverty line. Among single-father households, those with 5 or more children have the highest poverty rate, with 75 households (100.0%) experiencing poverty. Likewise, among single-mother households, those with 3 or 4 children have the highest poverty rate, with 433 households (48.3%) falling below the poverty line.
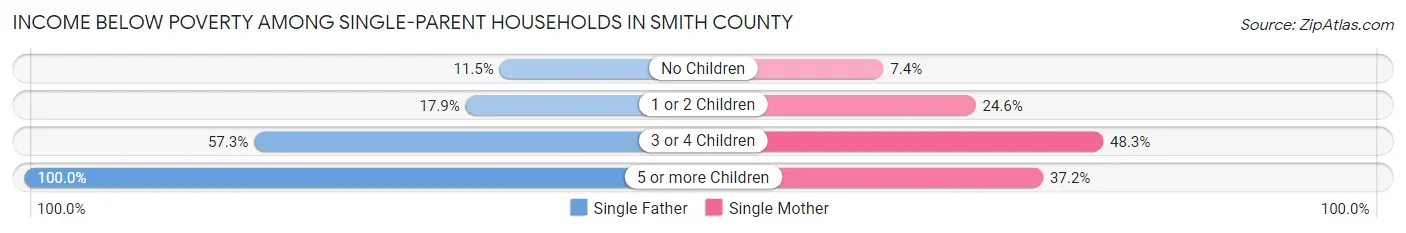
| Children | Single Father | Single Mother |
| No Children | 167 (11.5%) | 293 (7.4%) |
| 1 or 2 Children | 285 (17.9%) | 1,326 (24.6%) |
| 3 or 4 Children | 126 (57.3%) | 433 (48.3%) |
| 5 or more Children | 75 (100.0%) | 81 (37.2%) |
| Total | 653 (19.6%) | 2,133 (20.4%) |
Income Below Poverty Among Married-Couple vs Single-Parent Households in Smith County
The poverty data for Smith County shows that 2,012 of the married-couple family households (4.8%) and 2,786 of the single-parent households (20.2%) are living below the poverty level. Within the married-couple family households, those with 5 or more children have the highest poverty rate, with 56 households (12.4%) falling below the poverty line. Among the single-parent households, those with 5 or more children have the highest poverty rate, with 156 household (53.2%) living below poverty.
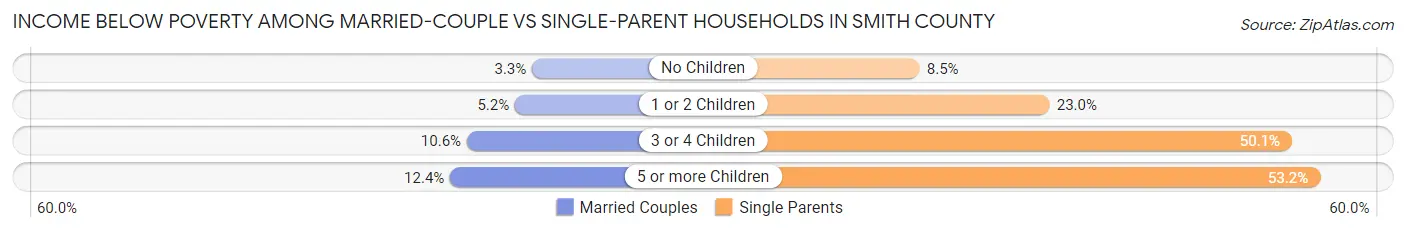
| Children | Married-Couple Families | Single-Parent Households |
| No Children | 770 (3.3%) | 460 (8.5%) |
| 1 or 2 Children | 719 (5.2%) | 1,611 (23.0%) |
| 3 or 4 Children | 467 (10.6%) | 559 (50.1%) |
| 5 or more Children | 56 (12.4%) | 156 (53.2%) |
| Total | 2,012 (4.8%) | 2,786 (20.2%) |
Employment Characteristics in Smith County
Employment by Class of Employer in Smith County
Among the 107,599 employed individuals in Smith County, private company employees (74,764 | 69.5%), self-employed (not incorporated) (7,884 | 7.3%), and local government employees (7,534 | 7.0%) make up the most common classes of employment.
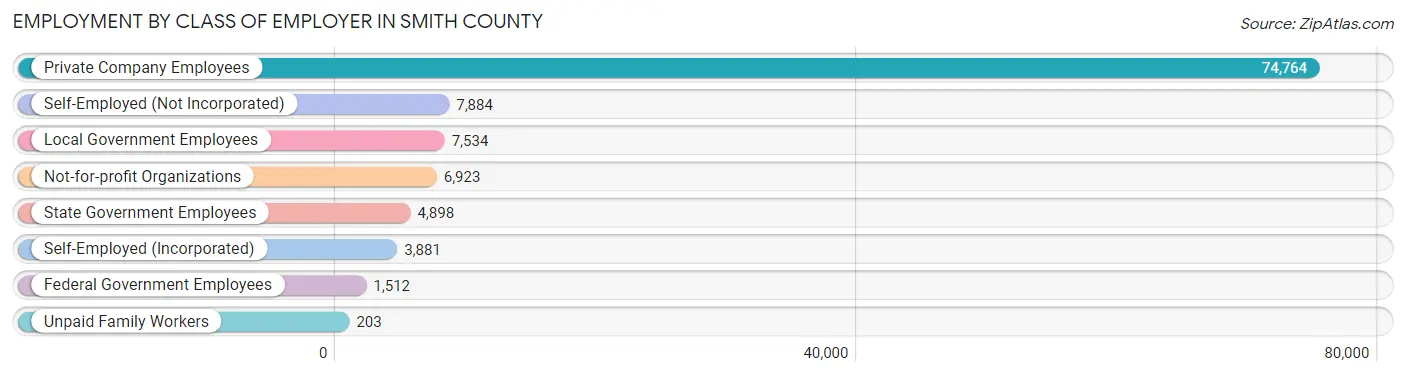
| Employer Class | # Employees | % Employees |
| Private Company Employees | 74,764 | 69.5% |
| Self-Employed (Incorporated) | 3,881 | 3.6% |
| Self-Employed (Not Incorporated) | 7,884 | 7.3% |
| Not-for-profit Organizations | 6,923 | 6.4% |
| Local Government Employees | 7,534 | 7.0% |
| State Government Employees | 4,898 | 4.5% |
| Federal Government Employees | 1,512 | 1.4% |
| Unpaid Family Workers | 203 | 0.2% |
| Total | 107,599 | 100.0% |
Employment Status by Age in Smith County
According to the labor force statistics for Smith County, out of the total population over 16 years of age (184,129), 62.4% or 114,896 individuals are in the labor force, with 4.7% or 5,400 of them unemployed. The age group with the highest labor force participation rate is 30 to 34 years, with 82.7% or 12,979 individuals in the labor force. Within the labor force, the 16 to 19 years age range has the highest percentage of unemployed individuals, with 11.5% or 635 of them being unemployed.
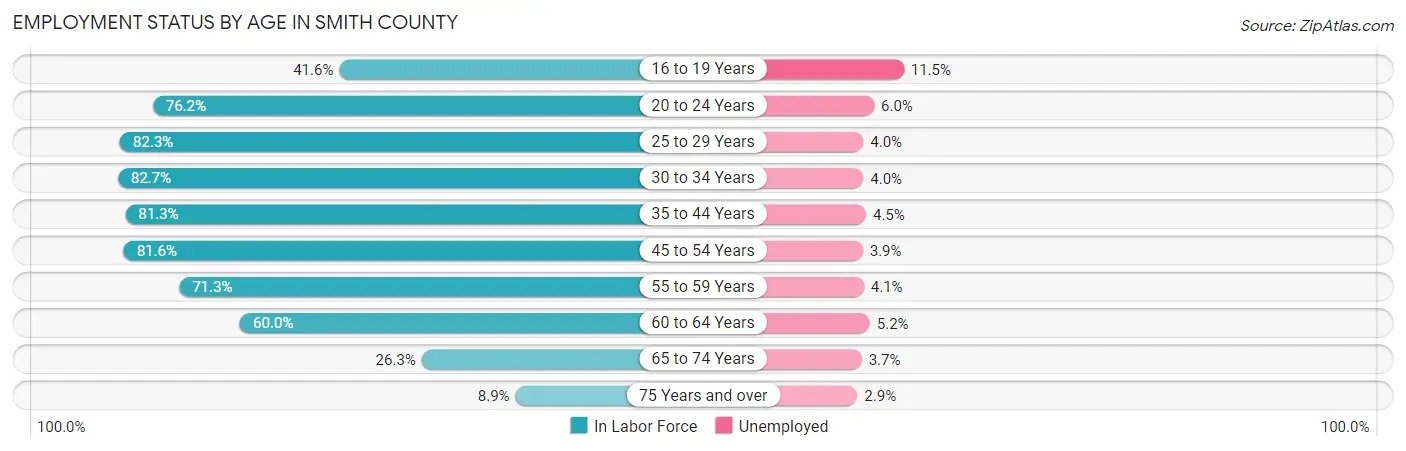
| Age Bracket | In Labor Force | Unemployed |
| 16 to 19 Years | 5,522 (41.6%) | 635 (11.5%) |
| 20 to 24 Years | 12,316 (76.2%) | 739 (6.0%) |
| 25 to 29 Years | 13,051 (82.3%) | 522 (4.0%) |
| 30 to 34 Years | 12,979 (82.7%) | 519 (4.0%) |
| 35 to 44 Years | 23,284 (81.3%) | 1,048 (4.5%) |
| 45 to 54 Years | 21,788 (81.6%) | 850 (3.9%) |
| 55 to 59 Years | 10,264 (71.3%) | 421 (4.1%) |
| 60 to 64 Years | 8,160 (60.0%) | 424 (5.2%) |
| 65 to 74 Years | 6,027 (26.3%) | 223 (3.7%) |
| 75 Years and over | 1,503 (8.9%) | 44 (2.9%) |
| Total | 114,896 (62.4%) | 5,400 (4.7%) |
Employment Status by Educational Attainment in Smith County
According to labor force statistics for Smith County, 77.9% of individuals (89,498) out of the total population between 25 and 64 years of age (114,888) are in the labor force, with 4.2% or 3,759 of them being unemployed. The group with the highest labor force participation rate are those with the educational attainment of bachelor's degree or higher, with 84.5% or 26,257 individuals in the labor force. Within the labor force, individuals with less than high school education have the highest percentage of unemployment, with 7.1% or 705 of them being unemployed.
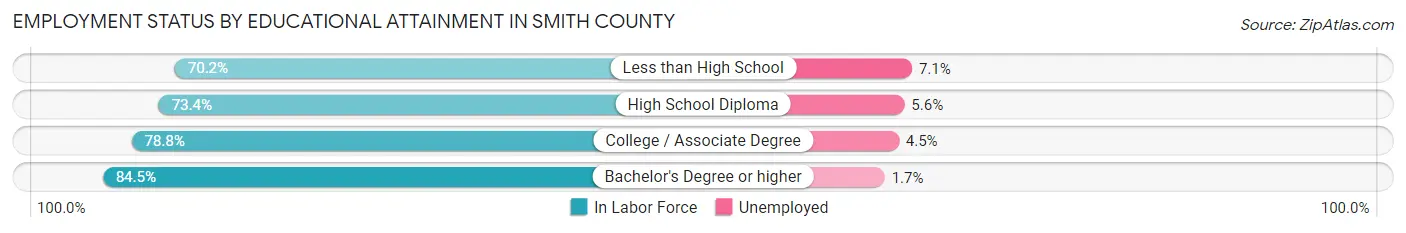
| Educational Attainment | In Labor Force | Unemployed |
| Less than High School | 9,934 (70.2%) | 1,005 (7.1%) |
| High School Diploma | 21,108 (73.4%) | 1,610 (5.6%) |
| College / Associate Degree | 32,235 (78.8%) | 1,841 (4.5%) |
| Bachelor's Degree or higher | 26,257 (84.5%) | 528 (1.7%) |
| Total | 89,498 (77.9%) | 4,825 (4.2%) |
Employment Occupations by Sex in Smith County
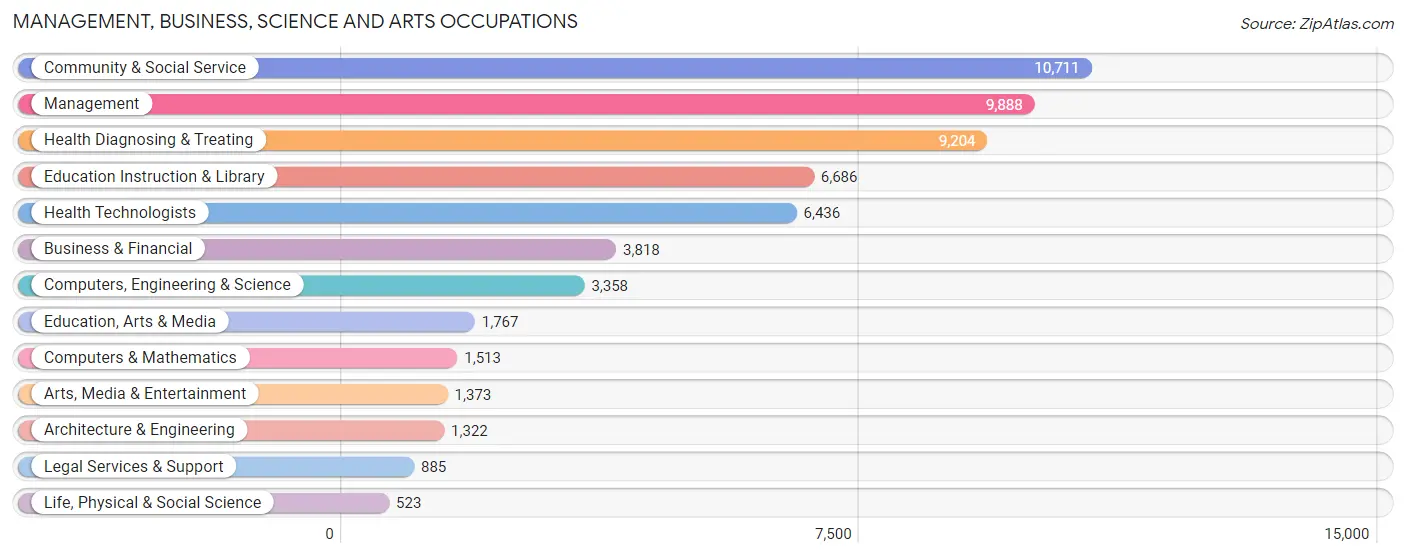
Management, Business, Science and Arts Occupations
The most common Management, Business, Science and Arts occupations in Smith County are Community & Social Service (10,711 | 9.8%), Management (9,888 | 9.0%), Health Diagnosing & Treating (9,204 | 8.4%), Education Instruction & Library (6,686 | 6.1%), and Health Technologists (6,436 | 5.9%).
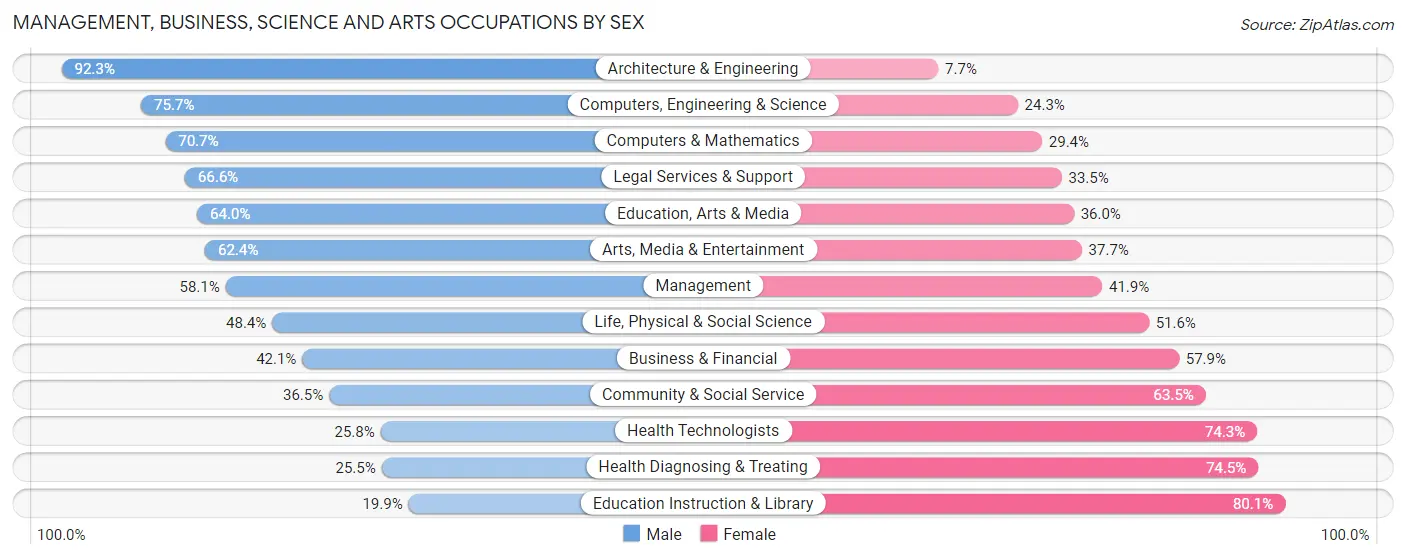
Management, Business, Science and Arts Occupations by Sex
Within the Management, Business, Science and Arts occupations in Smith County, the most male-oriented occupations are Architecture & Engineering (92.3%), Computers, Engineering & Science (75.7%), and Computers & Mathematics (70.7%), while the most female-oriented occupations are Education Instruction & Library (80.1%), Health Diagnosing & Treating (74.5%), and Health Technologists (74.3%).
| Occupation | Male | Female |
| Management | 5,744 (58.1%) | 4,144 (41.9%) |
| Business & Financial | 1,607 (42.1%) | 2,211 (57.9%) |
| Computers, Engineering & Science | 2,542 (75.7%) | 816 (24.3%) |
| Computers & Mathematics | 1,069 (70.7%) | 444 (29.3%) |
| Architecture & Engineering | 1,220 (92.3%) | 102 (7.7%) |
| Life, Physical & Social Science | 253 (48.4%) | 270 (51.6%) |
| Community & Social Service | 3,908 (36.5%) | 6,803 (63.5%) |
| Education, Arts & Media | 1,131 (64.0%) | 636 (36.0%) |
| Legal Services & Support | 589 (66.5%) | 296 (33.5%) |
| Education Instruction & Library | 1,332 (19.9%) | 5,354 (80.1%) |
| Arts, Media & Entertainment | 856 (62.4%) | 517 (37.7%) |
| Health Diagnosing & Treating | 2,350 (25.5%) | 6,854 (74.5%) |
| Health Technologists | 1,657 (25.8%) | 4,779 (74.3%) |
| Total (Category) | 16,151 (43.7%) | 20,828 (56.3%) |
| Total (Overall) | 56,404 (51.6%) | 52,876 (48.4%) |
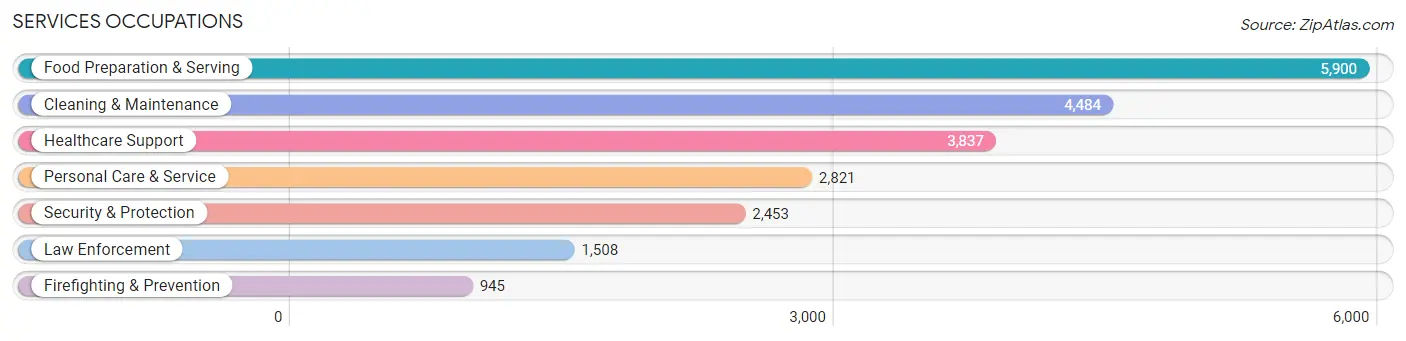
Services Occupations
The most common Services occupations in Smith County are Food Preparation & Serving (5,900 | 5.4%), Cleaning & Maintenance (4,484 | 4.1%), Healthcare Support (3,837 | 3.5%), Personal Care & Service (2,821 | 2.6%), and Security & Protection (2,453 | 2.2%).
Services Occupations by Sex
Within the Services occupations in Smith County, the most male-oriented occupations are Law Enforcement (79.0%), Security & Protection (77.2%), and Firefighting & Prevention (74.3%), while the most female-oriented occupations are Healthcare Support (90.0%), Personal Care & Service (73.9%), and Food Preparation & Serving (59.5%).
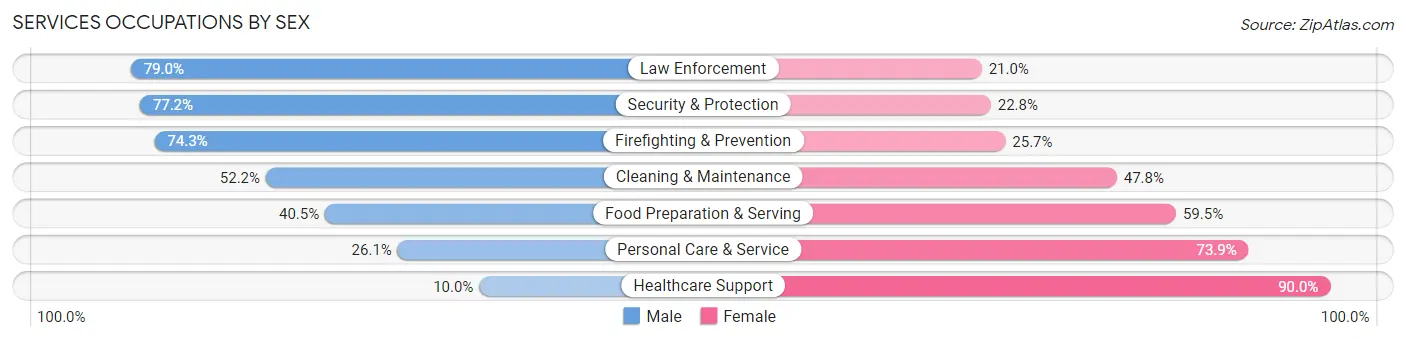
| Occupation | Male | Female |
| Healthcare Support | 383 (10.0%) | 3,454 (90.0%) |
| Security & Protection | 1,893 (77.2%) | 560 (22.8%) |
| Firefighting & Prevention | 702 (74.3%) | 243 (25.7%) |
| Law Enforcement | 1,191 (79.0%) | 317 (21.0%) |
| Food Preparation & Serving | 2,390 (40.5%) | 3,510 (59.5%) |
| Cleaning & Maintenance | 2,342 (52.2%) | 2,142 (47.8%) |
| Personal Care & Service | 737 (26.1%) | 2,084 (73.9%) |
| Total (Category) | 7,745 (39.7%) | 11,750 (60.3%) |
| Total (Overall) | 56,404 (51.6%) | 52,876 (48.4%) |
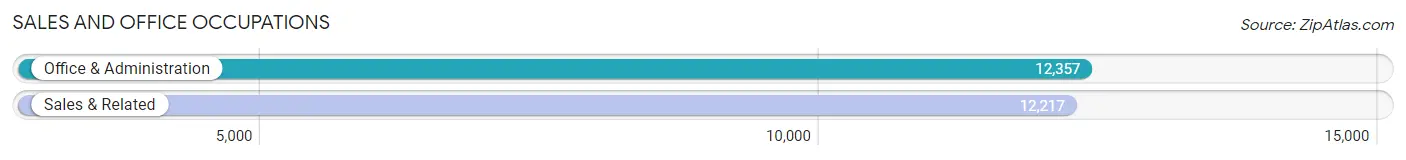
Sales and Office Occupations
The most common Sales and Office occupations in Smith County are Office & Administration (12,357 | 11.3%), and Sales & Related (12,217 | 11.2%).
Sales and Office Occupations by Sex
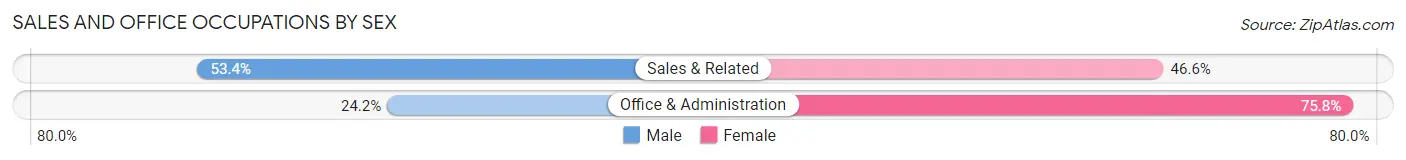
| Occupation | Male | Female |
| Sales & Related | 6,520 (53.4%) | 5,697 (46.6%) |
| Office & Administration | 2,995 (24.2%) | 9,362 (75.8%) |
| Total (Category) | 9,515 (38.7%) | 15,059 (61.3%) |
| Total (Overall) | 56,404 (51.6%) | 52,876 (48.4%) |
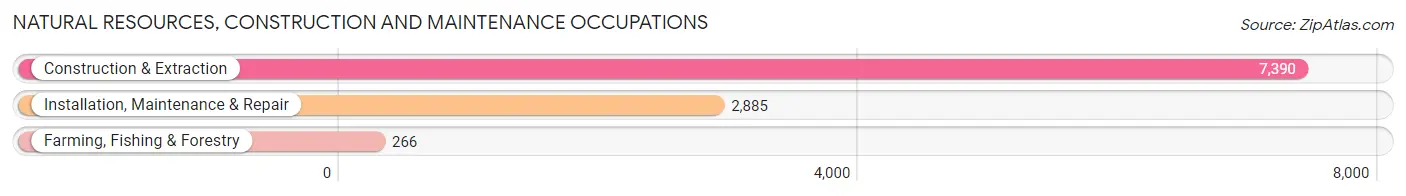
Natural Resources, Construction and Maintenance Occupations
The most common Natural Resources, Construction and Maintenance occupations in Smith County are Construction & Extraction (7,390 | 6.8%), Installation, Maintenance & Repair (2,885 | 2.6%), and Farming, Fishing & Forestry (266 | 0.2%).
Natural Resources, Construction and Maintenance Occupations by Sex
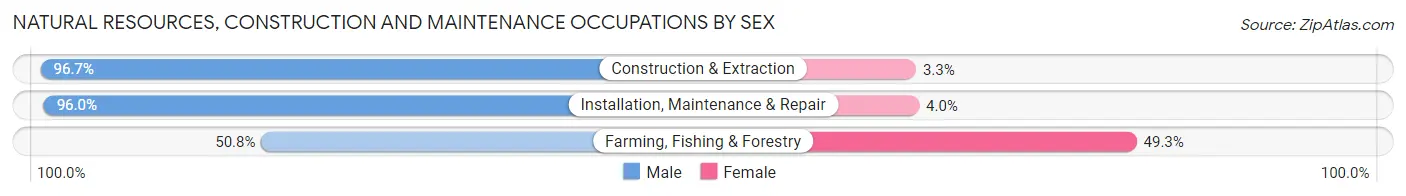
| Occupation | Male | Female |
| Farming, Fishing & Forestry | 135 (50.7%) | 131 (49.2%) |
| Construction & Extraction | 7,143 (96.7%) | 247 (3.3%) |
| Installation, Maintenance & Repair | 2,770 (96.0%) | 115 (4.0%) |
| Total (Category) | 10,048 (95.3%) | 493 (4.7%) |
| Total (Overall) | 56,404 (51.6%) | 52,876 (48.4%) |
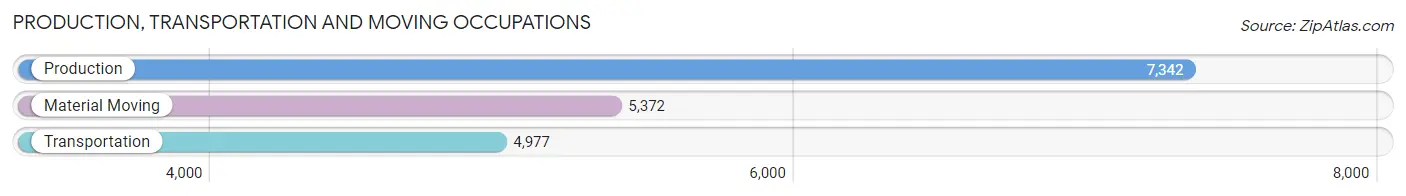
Production, Transportation and Moving Occupations
The most common Production, Transportation and Moving occupations in Smith County are Production (7,342 | 6.7%), Material Moving (5,372 | 4.9%), and Transportation (4,977 | 4.5%).
Production, Transportation and Moving Occupations by Sex
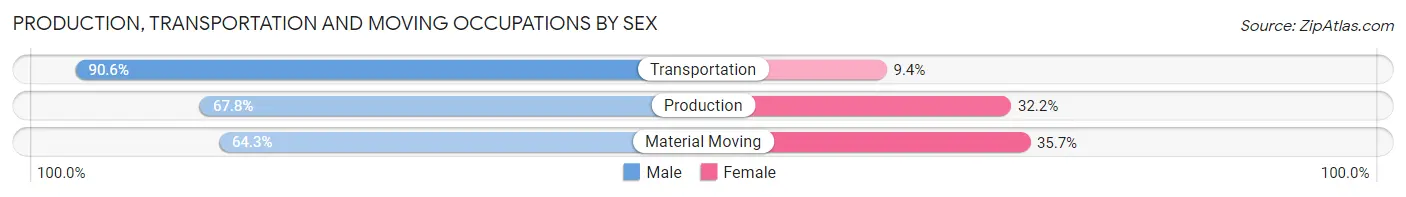
| Occupation | Male | Female |
| Production | 4,978 (67.8%) | 2,364 (32.2%) |
| Transportation | 4,511 (90.6%) | 466 (9.4%) |
| Material Moving | 3,456 (64.3%) | 1,916 (35.7%) |
| Total (Category) | 12,945 (73.2%) | 4,746 (26.8%) |
| Total (Overall) | 56,404 (51.6%) | 52,876 (48.4%) |
Employment Industries by Sex in Smith County
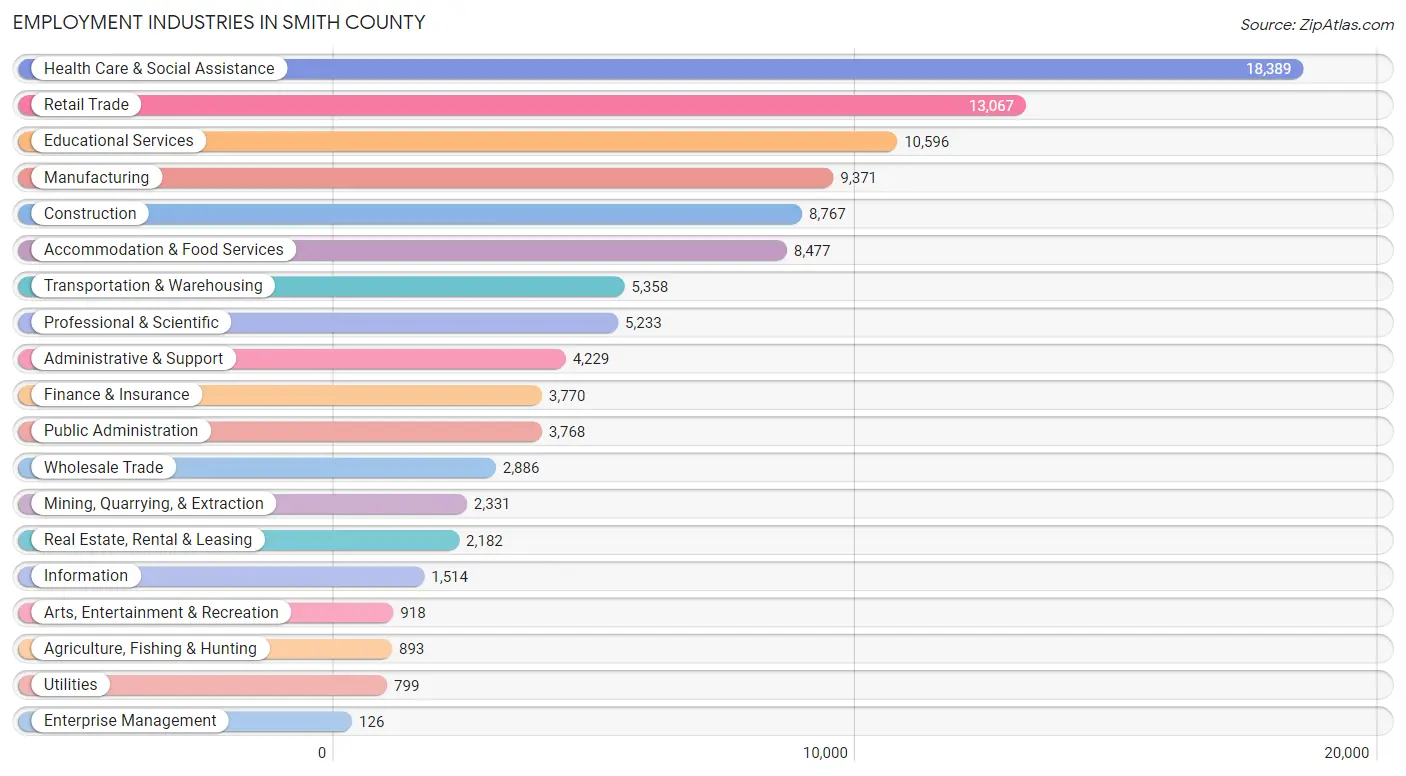
Employment Industries in Smith County
The major employment industries in Smith County include Health Care & Social Assistance (18,389 | 16.8%), Retail Trade (13,067 | 12.0%), Educational Services (10,596 | 9.7%), Manufacturing (9,371 | 8.6%), and Construction (8,767 | 8.0%).
Employment Industries by Sex in Smith County
The Smith County industries that see more men than women are Construction (90.1%), Mining, Quarrying, & Extraction (88.5%), and Transportation & Warehousing (76.0%), whereas the industries that tend to have a higher number of women are Enterprise Management (80.2%), Health Care & Social Assistance (77.2%), and Educational Services (76.3%).
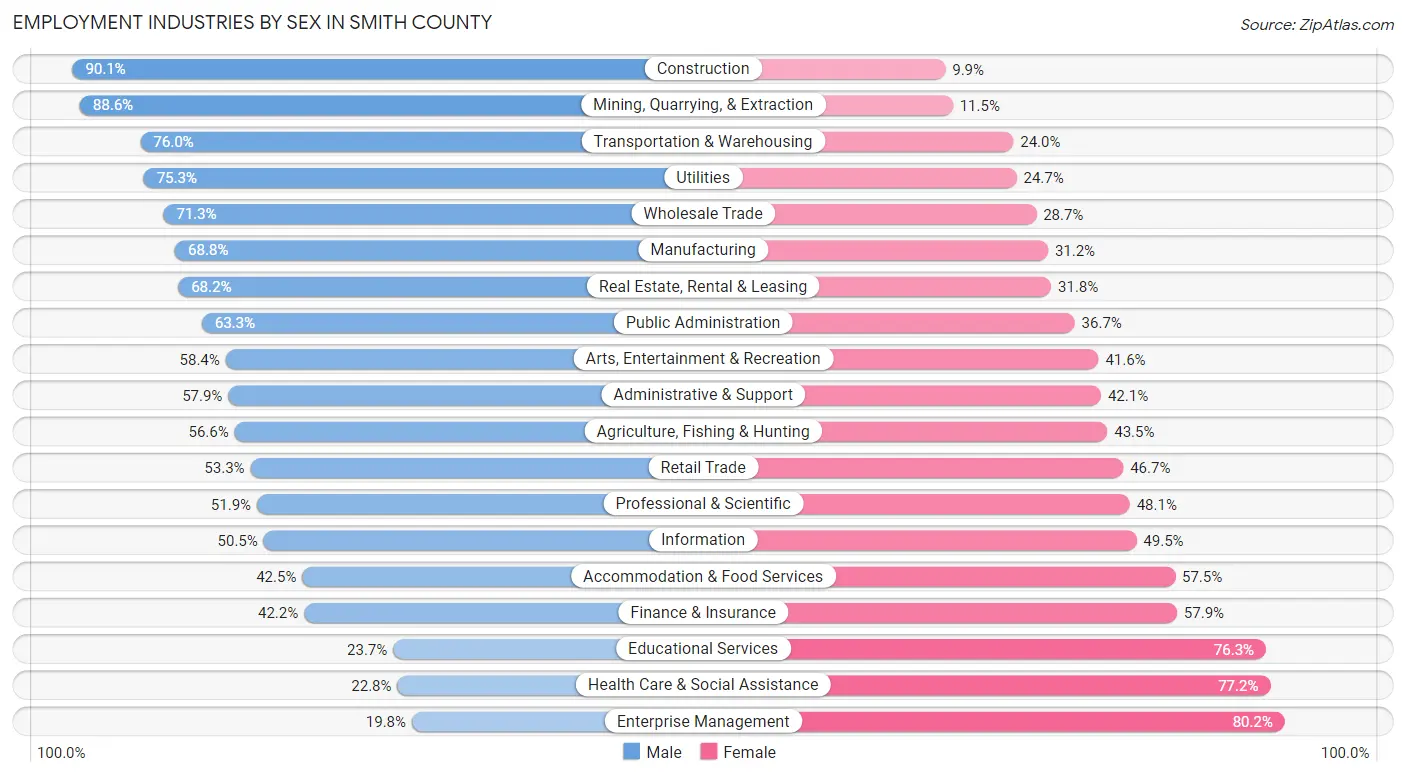
| Industry | Male | Female |
| Agriculture, Fishing & Hunting | 505 (56.6%) | 388 (43.4%) |
| Mining, Quarrying, & Extraction | 2,064 (88.5%) | 267 (11.5%) |
| Construction | 7,898 (90.1%) | 869 (9.9%) |
| Manufacturing | 6,451 (68.8%) | 2,920 (31.2%) |
| Wholesale Trade | 2,057 (71.3%) | 829 (28.7%) |
| Retail Trade | 6,960 (53.3%) | 6,107 (46.7%) |
| Transportation & Warehousing | 4,073 (76.0%) | 1,285 (24.0%) |
| Utilities | 602 (75.3%) | 197 (24.7%) |
| Information | 765 (50.5%) | 749 (49.5%) |
| Finance & Insurance | 1,589 (42.1%) | 2,181 (57.9%) |
| Real Estate, Rental & Leasing | 1,488 (68.2%) | 694 (31.8%) |
| Professional & Scientific | 2,717 (51.9%) | 2,516 (48.1%) |
| Enterprise Management | 25 (19.8%) | 101 (80.2%) |
| Administrative & Support | 2,447 (57.9%) | 1,782 (42.1%) |
| Educational Services | 2,514 (23.7%) | 8,082 (76.3%) |
| Health Care & Social Assistance | 4,200 (22.8%) | 14,189 (77.2%) |
| Arts, Entertainment & Recreation | 536 (58.4%) | 382 (41.6%) |
| Accommodation & Food Services | 3,605 (42.5%) | 4,872 (57.5%) |
| Public Administration | 2,386 (63.3%) | 1,382 (36.7%) |
| Total | 56,404 (51.6%) | 52,876 (48.4%) |
Education in Smith County
School Enrollment in Smith County
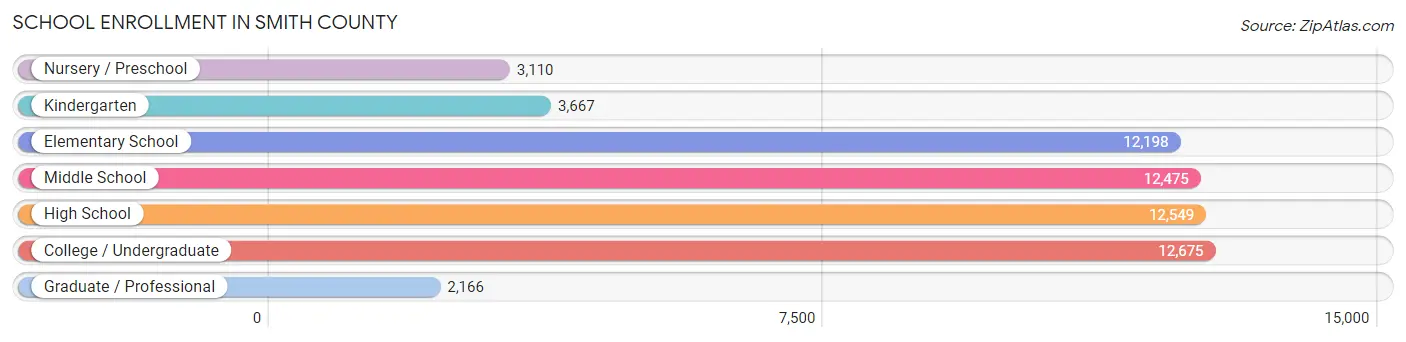
The most common levels of schooling among the 58,840 students in Smith County are college / undergraduate (12,675 | 21.5%), high school (12,549 | 21.3%), and middle school (12,475 | 21.2%).
| School Level | # Students | % Students |
| Nursery / Preschool | 3,110 | 5.3% |
| Kindergarten | 3,667 | 6.2% |
| Elementary School | 12,198 | 20.7% |
| Middle School | 12,475 | 21.2% |
| High School | 12,549 | 21.3% |
| College / Undergraduate | 12,675 | 21.5% |
| Graduate / Professional | 2,166 | 3.7% |
| Total | 58,840 | 100.0% |
School Enrollment by Age by Funding Source in Smith County
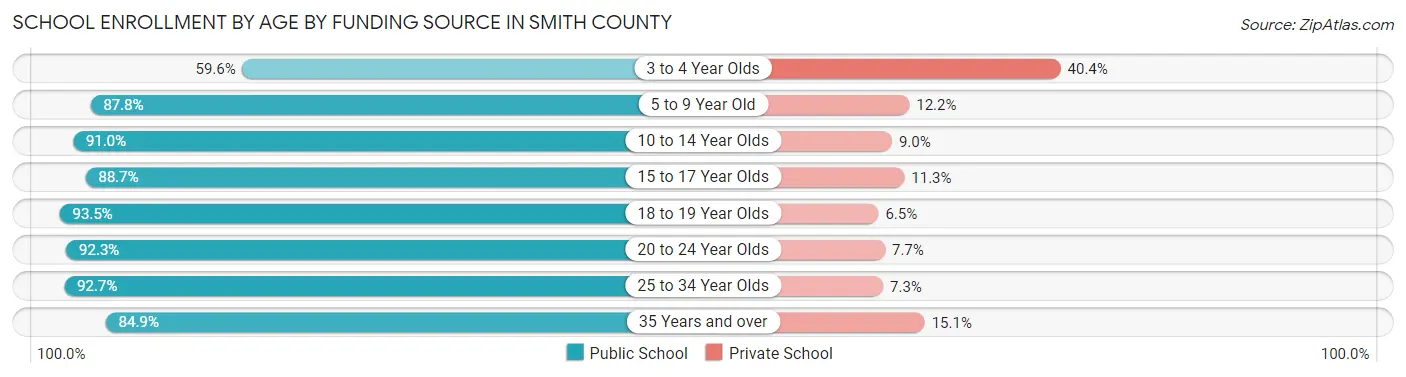
Out of a total of 58,840 students who are enrolled in schools in Smith County, 6,708 (11.4%) attend a private institution, while the remaining 52,132 (88.6%) are enrolled in public schools. The age group of 3 to 4 year olds has the highest likelihood of being enrolled in private schools, with 969 (40.4% in the age bracket) enrolled. Conversely, the age group of 18 to 19 year olds has the lowest likelihood of being enrolled in a private school, with 4,225 (93.5% in the age bracket) attending a public institution.
| Age Bracket | Public School | Private School |
| 3 to 4 Year Olds | 1,429 (59.6%) | 969 (40.4%) |
| 5 to 9 Year Old | 13,184 (87.8%) | 1,837 (12.2%) |
| 10 to 14 Year Olds | 14,282 (91.0%) | 1,411 (9.0%) |
| 15 to 17 Year Olds | 8,310 (88.7%) | 1,060 (11.3%) |
| 18 to 19 Year Olds | 4,225 (93.5%) | 293 (6.5%) |
| 20 to 24 Year Olds | 5,275 (92.3%) | 440 (7.7%) |
| 25 to 34 Year Olds | 2,853 (92.7%) | 226 (7.3%) |
| 35 Years and over | 2,586 (84.9%) | 460 (15.1%) |
| Total | 52,132 (88.6%) | 6,708 (11.4%) |
Educational Attainment by Field of Study in Smith County
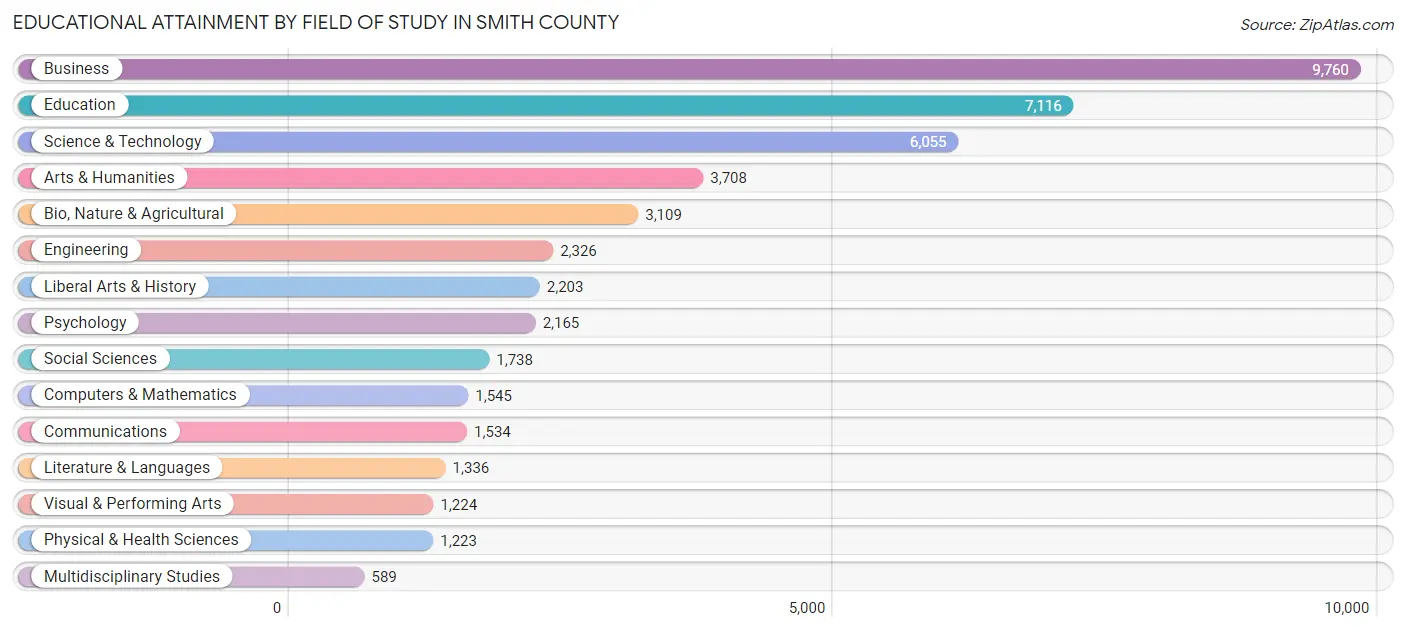
Business (9,760 | 21.4%), education (7,116 | 15.6%), science & technology (6,055 | 13.3%), arts & humanities (3,708 | 8.1%), and bio, nature & agricultural (3,109 | 6.8%) are the most common fields of study among 45,631 individuals in Smith County who have obtained a bachelor's degree or higher.
| Field of Study | # Graduates | % Graduates |
| Computers & Mathematics | 1,545 | 3.4% |
| Bio, Nature & Agricultural | 3,109 | 6.8% |
| Physical & Health Sciences | 1,223 | 2.7% |
| Psychology | 2,165 | 4.7% |
| Social Sciences | 1,738 | 3.8% |
| Engineering | 2,326 | 5.1% |
| Multidisciplinary Studies | 589 | 1.3% |
| Science & Technology | 6,055 | 13.3% |
| Business | 9,760 | 21.4% |
| Education | 7,116 | 15.6% |
| Literature & Languages | 1,336 | 2.9% |
| Liberal Arts & History | 2,203 | 4.8% |
| Visual & Performing Arts | 1,224 | 2.7% |
| Communications | 1,534 | 3.4% |
| Arts & Humanities | 3,708 | 8.1% |
| Total | 45,631 | 100.0% |
Transportation & Commute in Smith County
Vehicle Availability by Sex in Smith County
The most prevalent vehicle ownership categories in Smith County are males with 2 vehicles (24,423, accounting for 44.2%) and females with 2 vehicles (22,244, making up 47.5%).
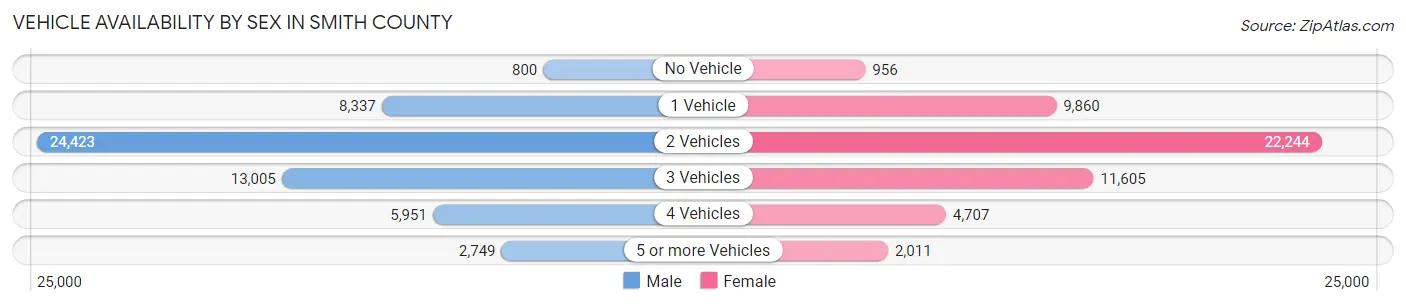
| Vehicles Available | Male | Female |
| No Vehicle | 800 (1.5%) | 956 (1.9%) |
| 1 Vehicle | 8,337 (15.1%) | 9,860 (19.2%) |
| 2 Vehicles | 24,423 (44.2%) | 22,244 (43.3%) |
| 3 Vehicles | 13,005 (23.5%) | 11,605 (22.6%) |
| 4 Vehicles | 5,951 (10.8%) | 4,707 (9.2%) |
| 5 or more Vehicles | 2,749 (5.0%) | 2,011 (3.9%) |
| Total | 55,265 (100.0%) | 51,383 (100.0%) |
Commute Time in Smith County
The most frequently occuring commute durations in Smith County are 15 to 19 minutes (19,558 commuters, 19.5%), 20 to 24 minutes (17,703 commuters, 17.7%), and 30 to 34 minutes (16,468 commuters, 16.5%).
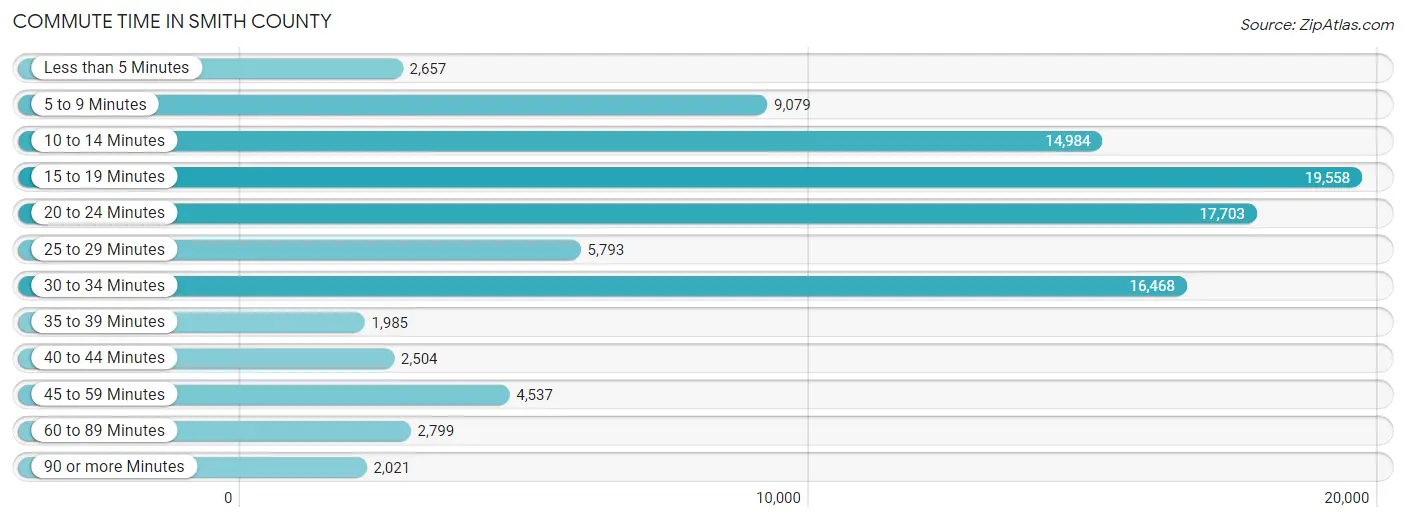
| Commute Time | # Commuters | % Commuters |
| Less than 5 Minutes | 2,657 | 2.6% |
| 5 to 9 Minutes | 9,079 | 9.1% |
| 10 to 14 Minutes | 14,984 | 15.0% |
| 15 to 19 Minutes | 19,558 | 19.5% |
| 20 to 24 Minutes | 17,703 | 17.7% |
| 25 to 29 Minutes | 5,793 | 5.8% |
| 30 to 34 Minutes | 16,468 | 16.5% |
| 35 to 39 Minutes | 1,985 | 2.0% |
| 40 to 44 Minutes | 2,504 | 2.5% |
| 45 to 59 Minutes | 4,537 | 4.5% |
| 60 to 89 Minutes | 2,799 | 2.8% |
| 90 or more Minutes | 2,021 | 2.0% |
Commute Time by Sex in Smith County
The most common commute times in Smith County are 15 to 19 minutes (9,039 commuters, 17.4%) for males and 15 to 19 minutes (10,519 commuters, 21.9%) for females.
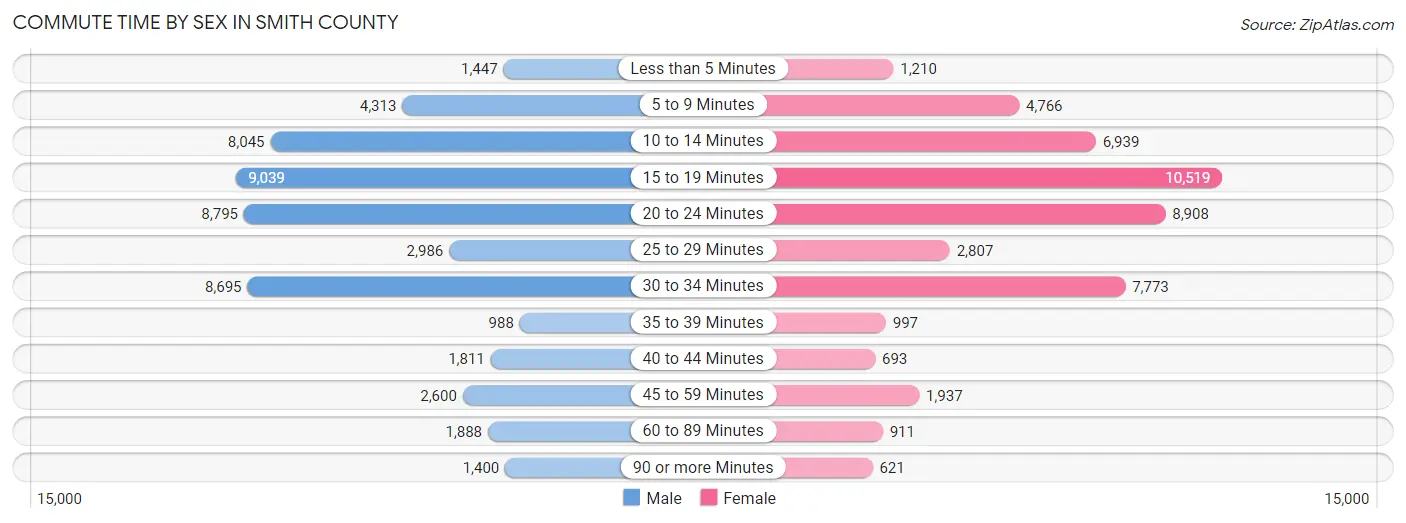
| Commute Time | Male | Female |
| Less than 5 Minutes | 1,447 (2.8%) | 1,210 (2.5%) |
| 5 to 9 Minutes | 4,313 (8.3%) | 4,766 (9.9%) |
| 10 to 14 Minutes | 8,045 (15.5%) | 6,939 (14.4%) |
| 15 to 19 Minutes | 9,039 (17.4%) | 10,519 (21.9%) |
| 20 to 24 Minutes | 8,795 (16.9%) | 8,908 (18.5%) |
| 25 to 29 Minutes | 2,986 (5.7%) | 2,807 (5.8%) |
| 30 to 34 Minutes | 8,695 (16.7%) | 7,773 (16.2%) |
| 35 to 39 Minutes | 988 (1.9%) | 997 (2.1%) |
| 40 to 44 Minutes | 1,811 (3.5%) | 693 (1.4%) |
| 45 to 59 Minutes | 2,600 (5.0%) | 1,937 (4.0%) |
| 60 to 89 Minutes | 1,888 (3.6%) | 911 (1.9%) |
| 90 or more Minutes | 1,400 (2.7%) | 621 (1.3%) |
Time of Departure to Work by Sex in Smith County
The most frequent times of departure to work in Smith County are 7:00 AM to 7:29 AM (7,817, 15.0%) for males and 7:30 AM to 7:59 AM (8,719, 18.1%) for females.
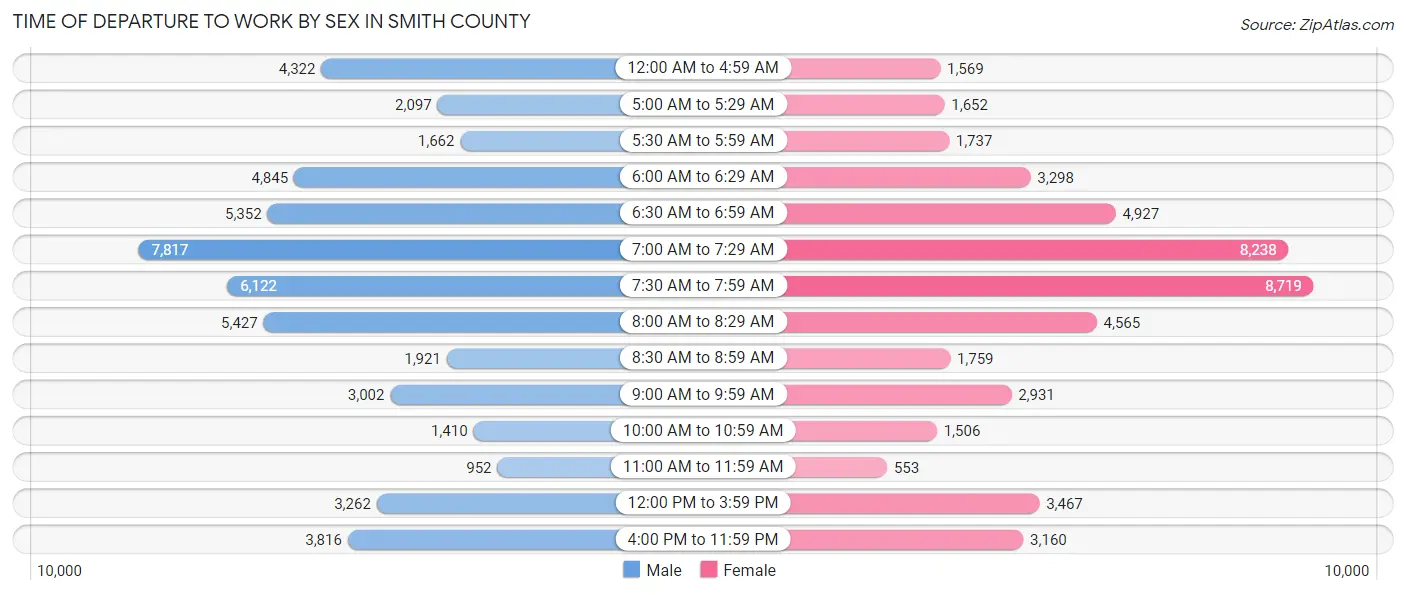
| Time of Departure | Male | Female |
| 12:00 AM to 4:59 AM | 4,322 (8.3%) | 1,569 (3.3%) |
| 5:00 AM to 5:29 AM | 2,097 (4.0%) | 1,652 (3.4%) |
| 5:30 AM to 5:59 AM | 1,662 (3.2%) | 1,737 (3.6%) |
| 6:00 AM to 6:29 AM | 4,845 (9.3%) | 3,298 (6.9%) |
| 6:30 AM to 6:59 AM | 5,352 (10.3%) | 4,927 (10.2%) |
| 7:00 AM to 7:29 AM | 7,817 (15.0%) | 8,238 (17.1%) |
| 7:30 AM to 7:59 AM | 6,122 (11.8%) | 8,719 (18.1%) |
| 8:00 AM to 8:29 AM | 5,427 (10.4%) | 4,565 (9.5%) |
| 8:30 AM to 8:59 AM | 1,921 (3.7%) | 1,759 (3.7%) |
| 9:00 AM to 9:59 AM | 3,002 (5.8%) | 2,931 (6.1%) |
| 10:00 AM to 10:59 AM | 1,410 (2.7%) | 1,506 (3.1%) |
| 11:00 AM to 11:59 AM | 952 (1.8%) | 553 (1.1%) |
| 12:00 PM to 3:59 PM | 3,262 (6.3%) | 3,467 (7.2%) |
| 4:00 PM to 11:59 PM | 3,816 (7.3%) | 3,160 (6.6%) |
| Total | 52,007 (100.0%) | 48,081 (100.0%) |
Housing Occupancy in Smith County
Occupancy by Ownership in Smith County
Of the total 81,286 dwellings in Smith County, owner-occupied units account for 55,863 (68.7%), while renter-occupied units make up 25,423 (31.3%).
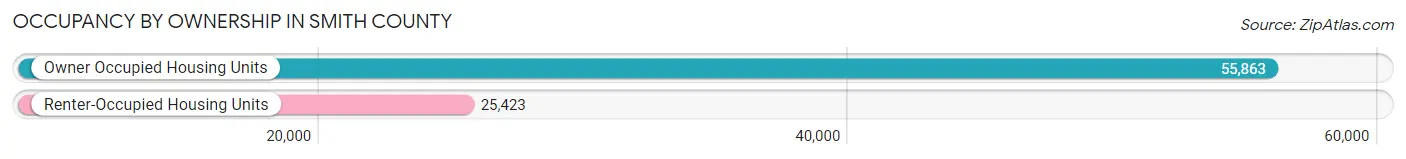
| Occupancy | # Housing Units | % Housing Units |
| Owner Occupied Housing Units | 55,863 | 68.7% |
| Renter-Occupied Housing Units | 25,423 | 31.3% |
| Total Occupied Housing Units | 81,286 | 100.0% |
Occupancy by Household Size in Smith County
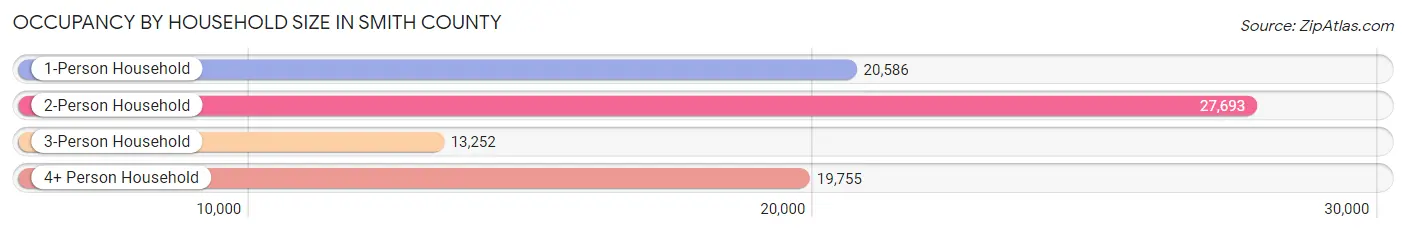
| Household Size | # Housing Units | % Housing Units |
| 1-Person Household | 20,586 | 25.3% |
| 2-Person Household | 27,693 | 34.1% |
| 3-Person Household | 13,252 | 16.3% |
| 4+ Person Household | 19,755 | 24.3% |
| Total Housing Units | 81,286 | 100.0% |
Occupancy by Ownership by Household Size in Smith County
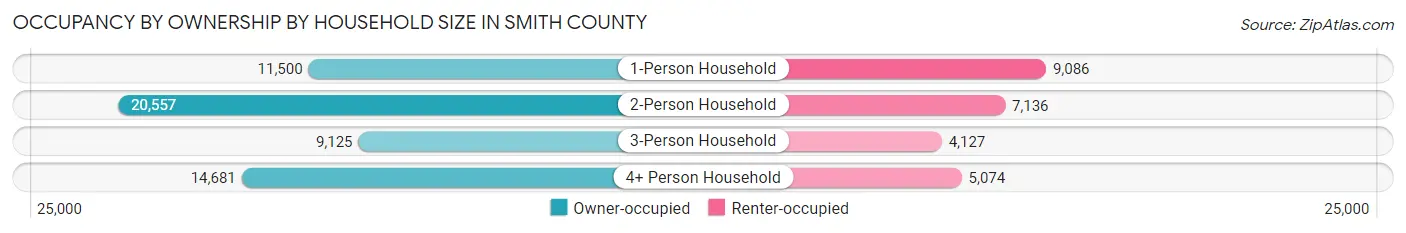
| Household Size | Owner-occupied | Renter-occupied |
| 1-Person Household | 11,500 (55.9%) | 9,086 (44.1%) |
| 2-Person Household | 20,557 (74.2%) | 7,136 (25.8%) |
| 3-Person Household | 9,125 (68.9%) | 4,127 (31.1%) |
| 4+ Person Household | 14,681 (74.3%) | 5,074 (25.7%) |
| Total Housing Units | 55,863 (68.7%) | 25,423 (31.3%) |
Occupancy by Educational Attainment in Smith County
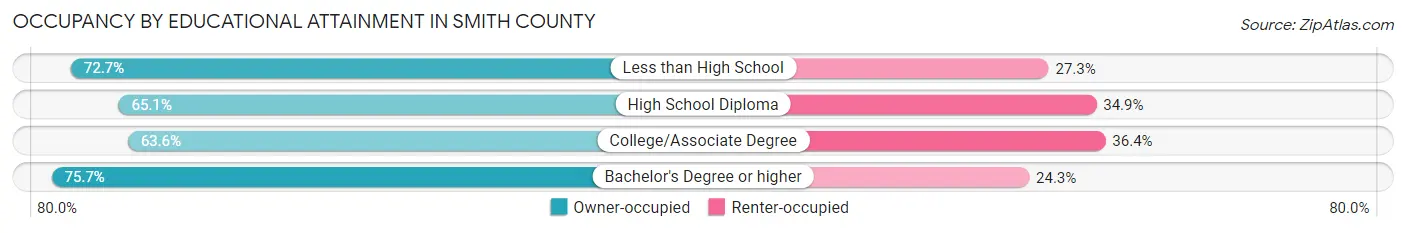
| Household Size | Owner-occupied | Renter-occupied |
| Less than High School | 6,039 (72.7%) | 2,272 (27.3%) |
| High School Diploma | 11,389 (65.1%) | 6,109 (34.9%) |
| College/Associate Degree | 18,846 (63.6%) | 10,768 (36.4%) |
| Bachelor's Degree or higher | 19,589 (75.7%) | 6,274 (24.3%) |
Occupancy by Age of Householder in Smith County
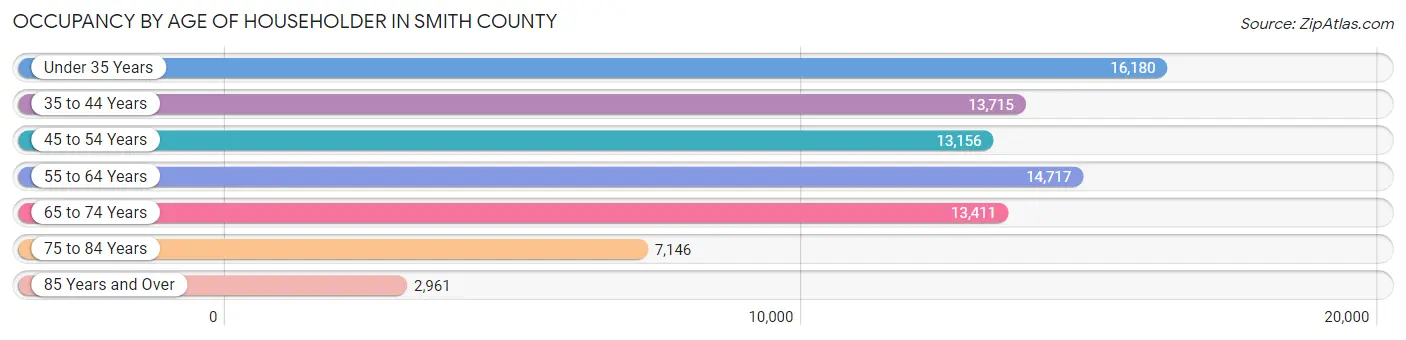
| Age Bracket | # Households | % Households |
| Under 35 Years | 16,180 | 19.9% |
| 35 to 44 Years | 13,715 | 16.9% |
| 45 to 54 Years | 13,156 | 16.2% |
| 55 to 64 Years | 14,717 | 18.1% |
| 65 to 74 Years | 13,411 | 16.5% |
| 75 to 84 Years | 7,146 | 8.8% |
| 85 Years and Over | 2,961 | 3.6% |
| Total | 81,286 | 100.0% |
Housing Finances in Smith County
Median Income by Occupancy in Smith County

| Occupancy Type | # Households | Median Income |
| Owner-Occupied | 55,863 (68.7%) | $81,323 |
| Renter-Occupied | 25,423 (31.3%) | $49,360 |
| Average | 81,286 (100.0%) | $69,053 |
Occupancy by Householder Income Bracket in Smith County
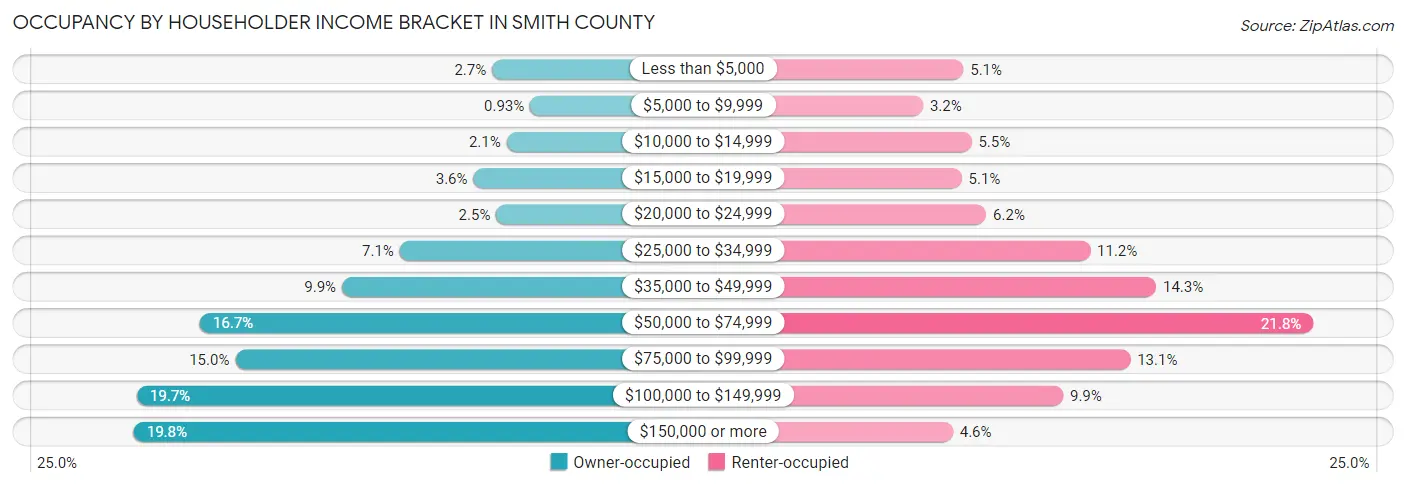
| Income Bracket | Owner-occupied | Renter-occupied |
| Less than $5,000 | 1,533 (2.7%) | 1,303 (5.1%) |
| $5,000 to $9,999 | 521 (0.9%) | 817 (3.2%) |
| $10,000 to $14,999 | 1,145 (2.1%) | 1,404 (5.5%) |
| $15,000 to $19,999 | 2,028 (3.6%) | 1,283 (5.1%) |
| $20,000 to $24,999 | 1,419 (2.5%) | 1,581 (6.2%) |
| $25,000 to $34,999 | 3,987 (7.1%) | 2,841 (11.2%) |
| $35,000 to $49,999 | 5,526 (9.9%) | 3,638 (14.3%) |
| $50,000 to $74,999 | 9,301 (16.7%) | 5,540 (21.8%) |
| $75,000 to $99,999 | 8,365 (15.0%) | 3,326 (13.1%) |
| $100,000 to $149,999 | 10,976 (19.7%) | 2,512 (9.9%) |
| $150,000 or more | 11,062 (19.8%) | 1,178 (4.6%) |
| Total | 55,863 (100.0%) | 25,423 (100.0%) |
Monthly Housing Cost Tiers in Smith County
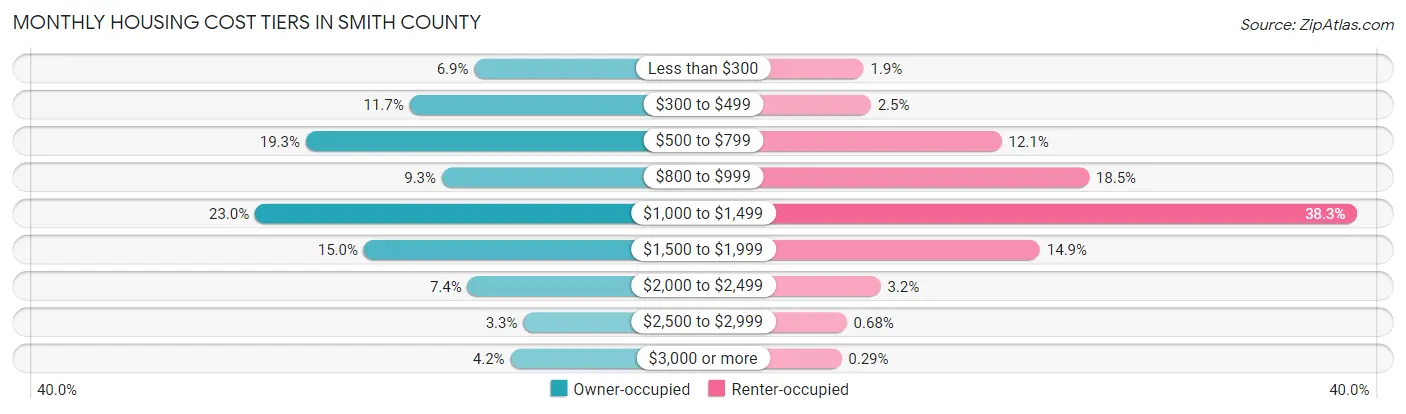
| Monthly Cost | Owner-occupied | Renter-occupied |
| Less than $300 | 3,843 (6.9%) | 487 (1.9%) |
| $300 to $499 | 6,508 (11.7%) | 623 (2.5%) |
| $500 to $799 | 10,774 (19.3%) | 3,074 (12.1%) |
| $800 to $999 | 5,181 (9.3%) | 4,709 (18.5%) |
| $1,000 to $1,499 | 12,863 (23.0%) | 9,731 (38.3%) |
| $1,500 to $1,999 | 8,390 (15.0%) | 3,791 (14.9%) |
| $2,000 to $2,499 | 4,124 (7.4%) | 807 (3.2%) |
| $2,500 to $2,999 | 1,824 (3.3%) | 173 (0.7%) |
| $3,000 or more | 2,356 (4.2%) | 73 (0.3%) |
| Total | 55,863 (100.0%) | 25,423 (100.0%) |
Physical Housing Characteristics in Smith County
Housing Structures in Smith County
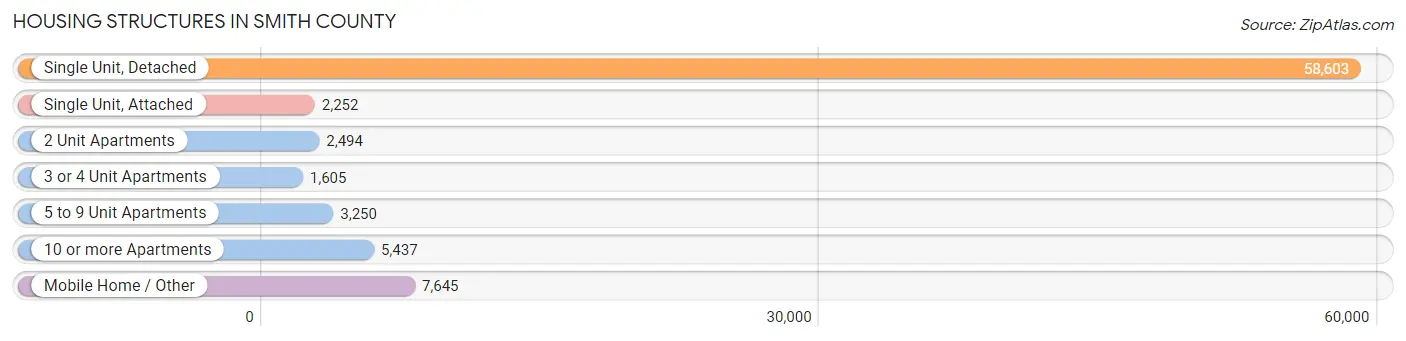
| Structure Type | # Housing Units | % Housing Units |
| Single Unit, Detached | 58,603 | 72.1% |
| Single Unit, Attached | 2,252 | 2.8% |
| 2 Unit Apartments | 2,494 | 3.1% |
| 3 or 4 Unit Apartments | 1,605 | 2.0% |
| 5 to 9 Unit Apartments | 3,250 | 4.0% |
| 10 or more Apartments | 5,437 | 6.7% |
| Mobile Home / Other | 7,645 | 9.4% |
| Total | 81,286 | 100.0% |
Housing Structures by Occupancy in Smith County
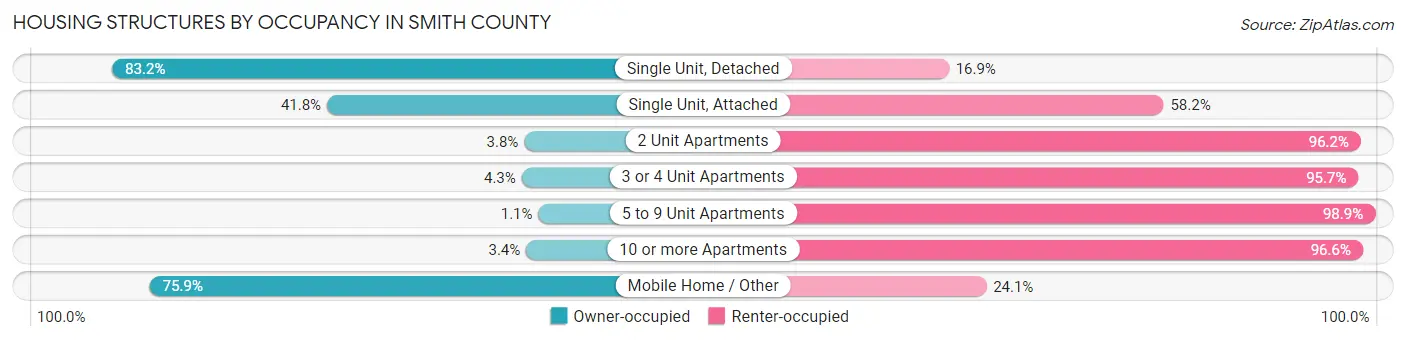
| Structure Type | Owner-occupied | Renter-occupied |
| Single Unit, Detached | 48,731 (83.2%) | 9,872 (16.9%) |
| Single Unit, Attached | 941 (41.8%) | 1,311 (58.2%) |
| 2 Unit Apartments | 95 (3.8%) | 2,399 (96.2%) |
| 3 or 4 Unit Apartments | 69 (4.3%) | 1,536 (95.7%) |
| 5 to 9 Unit Apartments | 35 (1.1%) | 3,215 (98.9%) |
| 10 or more Apartments | 187 (3.4%) | 5,250 (96.6%) |
| Mobile Home / Other | 5,805 (75.9%) | 1,840 (24.1%) |
| Total | 55,863 (68.7%) | 25,423 (31.3%) |
Housing Structures by Number of Rooms in Smith County
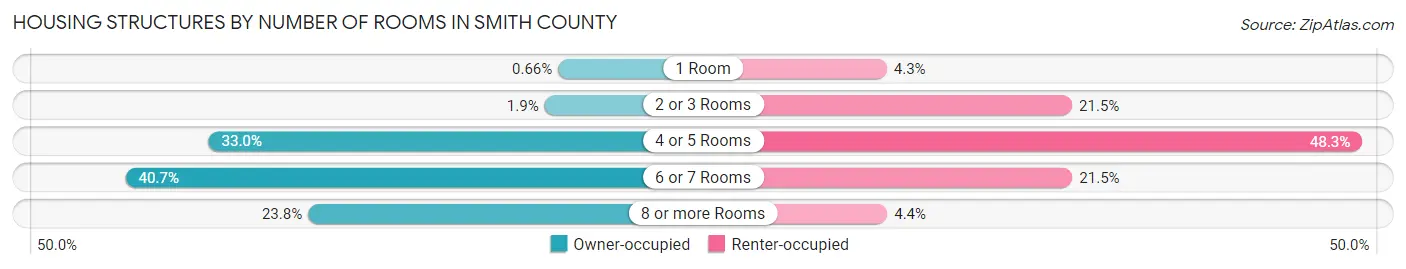
| Number of Rooms | Owner-occupied | Renter-occupied |
| 1 Room | 367 (0.7%) | 1,104 (4.3%) |
| 2 or 3 Rooms | 1,071 (1.9%) | 5,460 (21.5%) |
| 4 or 5 Rooms | 18,422 (33.0%) | 12,278 (48.3%) |
| 6 or 7 Rooms | 22,712 (40.7%) | 5,467 (21.5%) |
| 8 or more Rooms | 13,291 (23.8%) | 1,114 (4.4%) |
| Total | 55,863 (100.0%) | 25,423 (100.0%) |
Housing Structure by Heating Type in Smith County
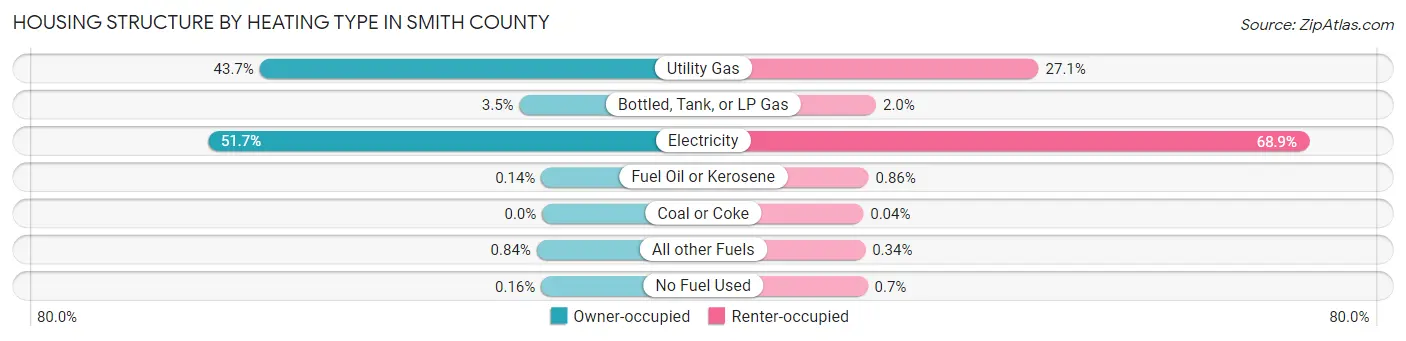
| Heating Type | Owner-occupied | Renter-occupied |
| Utility Gas | 24,393 (43.7%) | 6,899 (27.1%) |
| Bottled, Tank, or LP Gas | 1,962 (3.5%) | 512 (2.0%) |
| Electricity | 28,868 (51.7%) | 17,516 (68.9%) |
| Fuel Oil or Kerosene | 80 (0.1%) | 219 (0.9%) |
| Coal or Coke | 0 (0.0%) | 11 (0.0%) |
| All other Fuels | 470 (0.8%) | 87 (0.3%) |
| No Fuel Used | 90 (0.2%) | 179 (0.7%) |
| Total | 55,863 (100.0%) | 25,423 (100.0%) |
Household Vehicle Usage in Smith County
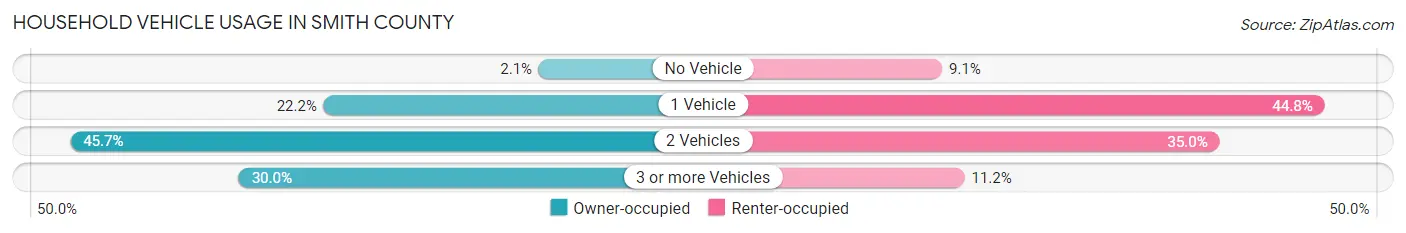
| Vehicles per Household | Owner-occupied | Renter-occupied |
| No Vehicle | 1,163 (2.1%) | 2,306 (9.1%) |
| 1 Vehicle | 12,385 (22.2%) | 11,385 (44.8%) |
| 2 Vehicles | 25,553 (45.7%) | 8,891 (35.0%) |
| 3 or more Vehicles | 16,762 (30.0%) | 2,841 (11.2%) |
| Total | 55,863 (100.0%) | 25,423 (100.0%) |
Real Estate & Mortgages in Smith County
Real Estate and Mortgage Overview in Smith County
| Characteristic | Without Mortgage | With Mortgage |
| Housing Units | 26,369 | 29,494 |
| Median Property Value | $181,500 | $214,000 |
| Median Household Income | $65,968 | $6,858 |
| Monthly Housing Costs | $582 | $2,309 |
| Real Estate Taxes | $2,113 | $1,012 |
Property Value by Mortgage Status in Smith County
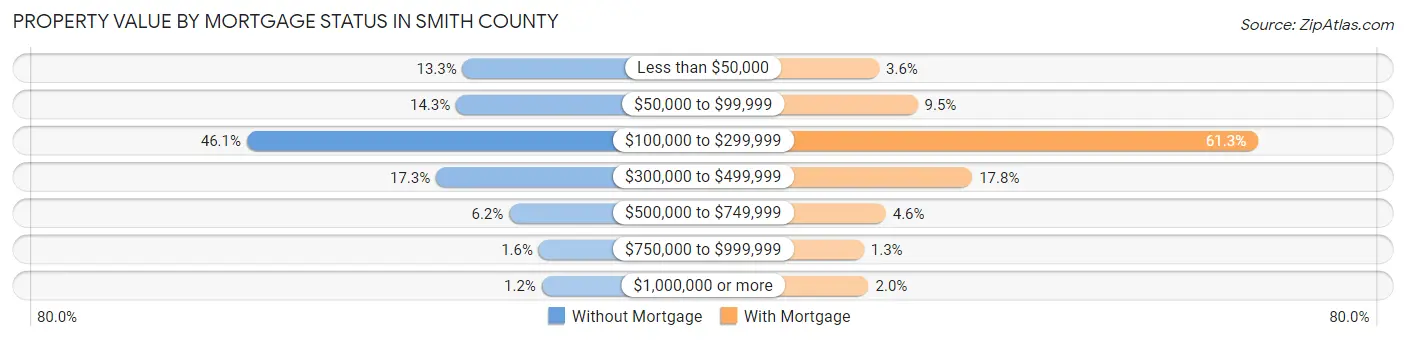
| Property Value | Without Mortgage | With Mortgage |
| Less than $50,000 | 3,500 (13.3%) | 1,059 (3.6%) |
| $50,000 to $99,999 | 3,760 (14.3%) | 2,786 (9.5%) |
| $100,000 to $299,999 | 12,166 (46.1%) | 18,085 (61.3%) |
| $300,000 to $499,999 | 4,563 (17.3%) | 5,244 (17.8%) |
| $500,000 to $749,999 | 1,628 (6.2%) | 1,359 (4.6%) |
| $750,000 to $999,999 | 432 (1.6%) | 373 (1.3%) |
| $1,000,000 or more | 320 (1.2%) | 588 (2.0%) |
| Total | 26,369 (100.0%) | 29,494 (100.0%) |
Household Income by Mortgage Status in Smith County

| Household Income | Without Mortgage | With Mortgage |
| Less than $10,000 | 1,191 (4.5%) | 463 (1.6%) |
| $10,000 to $24,999 | 3,162 (12.0%) | 863 (2.9%) |
| $25,000 to $34,999 | 2,698 (10.2%) | 1,430 (4.9%) |
| $35,000 to $49,999 | 3,301 (12.5%) | 1,289 (4.4%) |
| $50,000 to $74,999 | 4,260 (16.2%) | 2,225 (7.5%) |
| $75,000 to $99,999 | 3,365 (12.8%) | 5,041 (17.1%) |
| $100,000 to $149,999 | 4,188 (15.9%) | 5,000 (17.0%) |
| $150,000 or more | 4,204 (15.9%) | 6,788 (23.0%) |
| Total | 26,369 (100.0%) | 29,494 (100.0%) |
Property Value to Household Income Ratio in Smith County

| Value-to-Income Ratio | Without Mortgage | With Mortgage |
| Less than 2.0x | 10,299 (39.1%) | 94,358 (319.9%) |
| 2.0x to 2.9x | 4,471 (17.0%) | 13,280 (45.0%) |
| 3.0x to 3.9x | 2,874 (10.9%) | 7,055 (23.9%) |
| 4.0x or more | 8,437 (32.0%) | 3,102 (10.5%) |
| Total | 26,369 (100.0%) | 29,494 (100.0%) |
Real Estate Taxes by Mortgage Status in Smith County
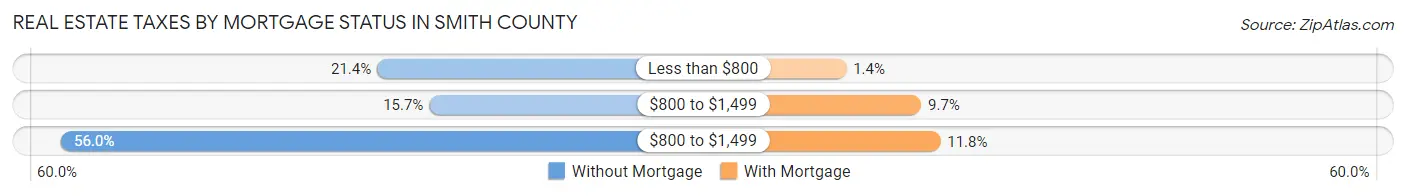
| Property Taxes | Without Mortgage | With Mortgage |
| Less than $800 | 5,637 (21.4%) | 425 (1.4%) |
| $800 to $1,499 | 4,129 (15.7%) | 2,847 (9.7%) |
| $800 to $1,499 | 14,766 (56.0%) | 3,465 (11.7%) |
| Total | 26,369 (100.0%) | 29,494 (100.0%) |
Health & Disability in Smith County
Health Insurance Coverage by Age in Smith County

| Age Bracket | With Coverage | Without Coverage |
| Under 6 Years | 16,944 (92.2%) | 1,442 (7.8%) |
| 6 to 18 Years | 36,410 (86.6%) | 5,656 (13.5%) |
| 19 to 25 Years | 15,328 (69.5%) | 6,720 (30.5%) |
| 26 to 34 Years | 19,470 (68.9%) | 8,810 (31.1%) |
| 35 to 44 Years | 20,312 (71.8%) | 7,970 (28.2%) |
| 45 to 54 Years | 21,035 (79.6%) | 5,389 (20.4%) |
| 55 to 64 Years | 23,940 (87.0%) | 3,566 (13.0%) |
| 65 to 74 Years | 22,549 (99.2%) | 186 (0.8%) |
| 75 Years and older | 16,104 (99.4%) | 103 (0.6%) |
| Total | 192,092 (82.8%) | 39,842 (17.2%) |
Health Insurance Coverage by Citizenship Status in Smith County
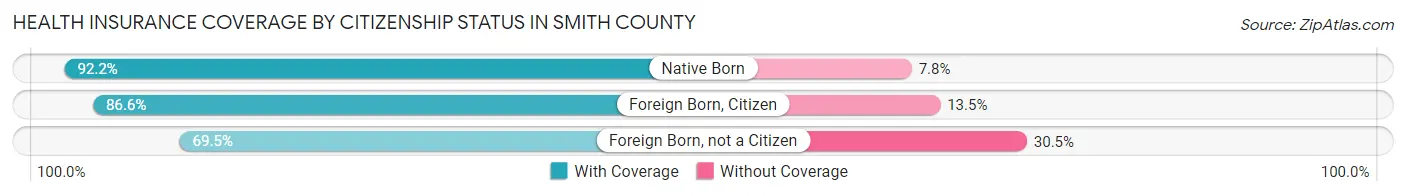
| Citizenship Status | With Coverage | Without Coverage |
| Native Born | 16,944 (92.2%) | 1,442 (7.8%) |
| Foreign Born, Citizen | 36,410 (86.6%) | 5,656 (13.5%) |
| Foreign Born, not a Citizen | 15,328 (69.5%) | 6,720 (30.5%) |
Health Insurance Coverage by Household Income in Smith County
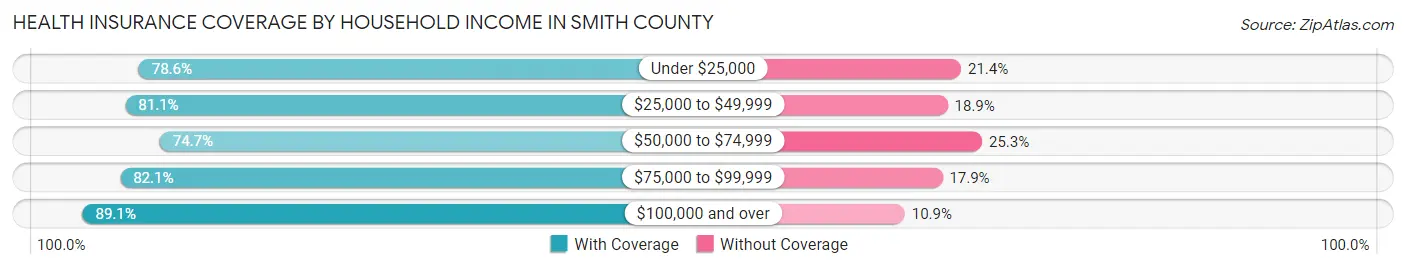
| Household Income | With Coverage | Without Coverage |
| Under $25,000 | 19,769 (78.6%) | 5,386 (21.4%) |
| $25,000 to $49,999 | 30,570 (81.1%) | 7,120 (18.9%) |
| $50,000 to $74,999 | 31,270 (74.7%) | 10,611 (25.3%) |
| $75,000 to $99,999 | 29,412 (82.1%) | 6,423 (17.9%) |
| $100,000 and over | 77,953 (89.1%) | 9,511 (10.9%) |
Public vs Private Health Insurance Coverage by Age in Smith County
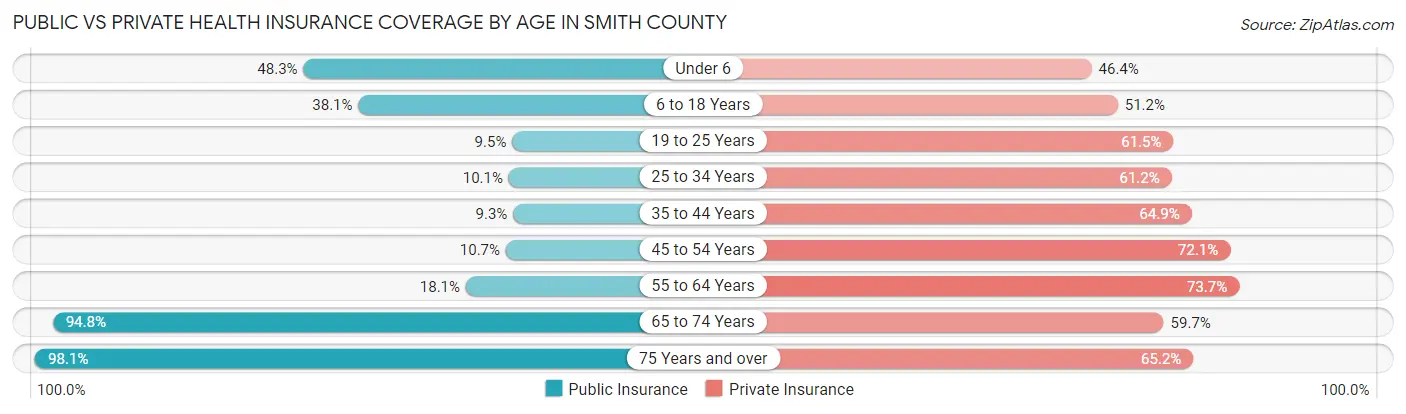
| Age Bracket | Public Insurance | Private Insurance |
| Under 6 | 8,872 (48.2%) | 8,526 (46.4%) |
| 6 to 18 Years | 16,008 (38.1%) | 21,550 (51.2%) |
| 19 to 25 Years | 2,092 (9.5%) | 13,564 (61.5%) |
| 25 to 34 Years | 2,865 (10.1%) | 17,306 (61.2%) |
| 35 to 44 Years | 2,635 (9.3%) | 18,362 (64.9%) |
| 45 to 54 Years | 2,820 (10.7%) | 19,044 (72.1%) |
| 55 to 64 Years | 4,979 (18.1%) | 20,281 (73.7%) |
| 65 to 74 Years | 21,546 (94.8%) | 13,581 (59.7%) |
| 75 Years and over | 15,891 (98.1%) | 10,568 (65.2%) |
| Total | 77,708 (33.5%) | 142,782 (61.6%) |
Disability Status by Sex by Age in Smith County
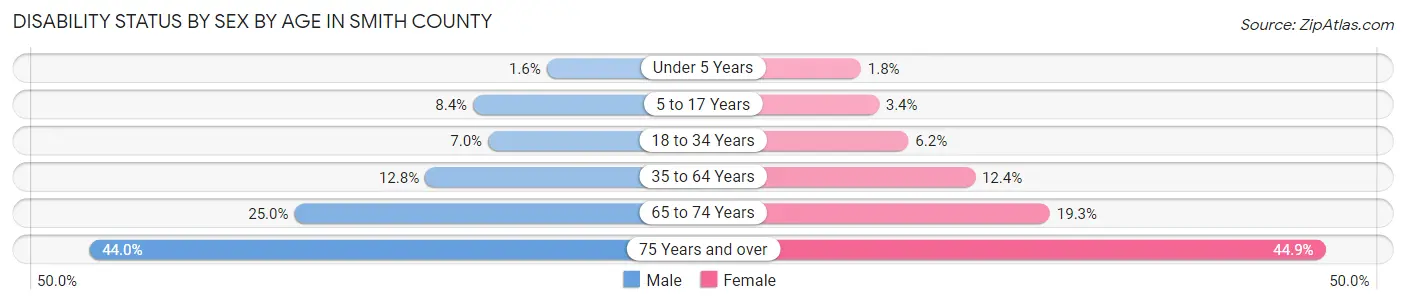
| Age Bracket | Male | Female |
| Under 5 Years | 120 (1.6%) | 131 (1.8%) |
| 5 to 17 Years | 1,782 (8.4%) | 700 (3.4%) |
| 18 to 34 Years | 1,832 (7.0%) | 1,721 (6.2%) |
| 35 to 64 Years | 5,095 (12.8%) | 5,255 (12.4%) |
| 65 to 74 Years | 2,640 (25.0%) | 2,349 (19.3%) |
| 75 Years and over | 2,994 (44.0%) | 4,220 (44.9%) |
Disability Class by Sex by Age in Smith County
Disability Class: Hearing Difficulty
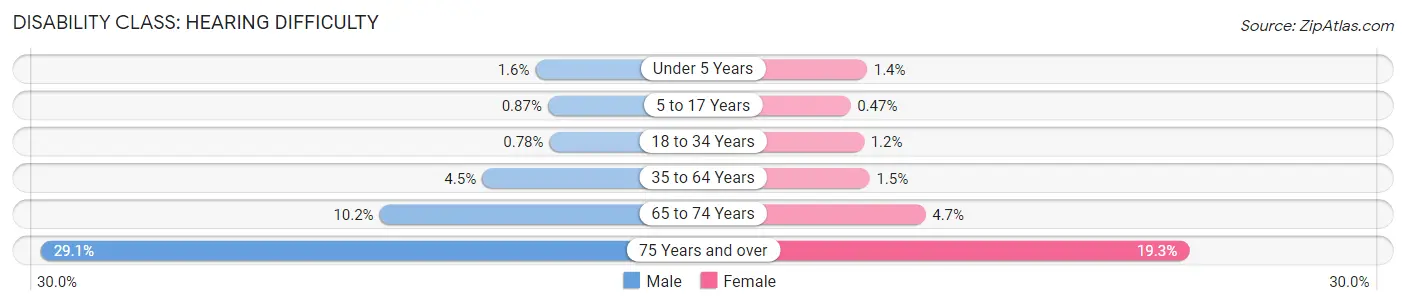
| Age Bracket | Male | Female |
| Under 5 Years | 120 (1.6%) | 103 (1.4%) |
| 5 to 17 Years | 184 (0.9%) | 96 (0.5%) |
| 18 to 34 Years | 204 (0.8%) | 339 (1.2%) |
| 35 to 64 Years | 1,798 (4.5%) | 654 (1.5%) |
| 65 to 74 Years | 1,083 (10.2%) | 565 (4.6%) |
| 75 Years and over | 1,980 (29.1%) | 1,818 (19.3%) |
Disability Class: Vision Difficulty
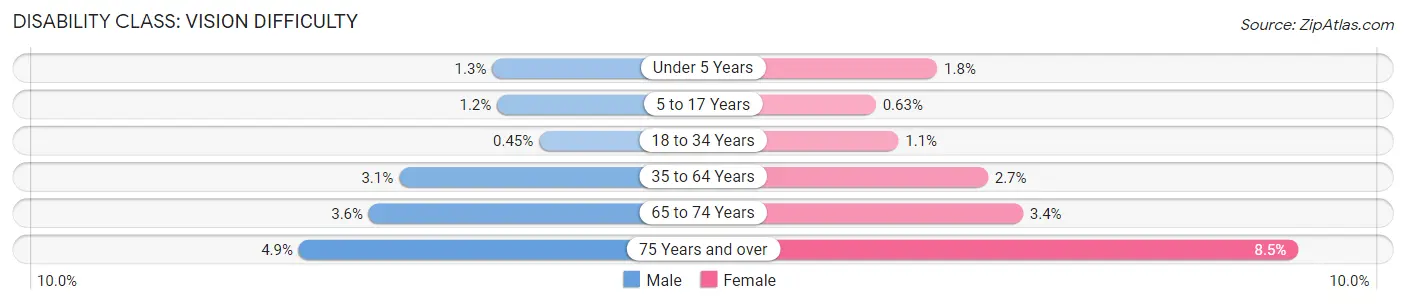
| Age Bracket | Male | Female |
| Under 5 Years | 101 (1.3%) | 131 (1.8%) |
| 5 to 17 Years | 262 (1.2%) | 129 (0.6%) |
| 18 to 34 Years | 117 (0.4%) | 292 (1.1%) |
| 35 to 64 Years | 1,211 (3.0%) | 1,153 (2.7%) |
| 65 to 74 Years | 382 (3.6%) | 409 (3.4%) |
| 75 Years and over | 334 (4.9%) | 796 (8.5%) |
Disability Class: Cognitive Difficulty
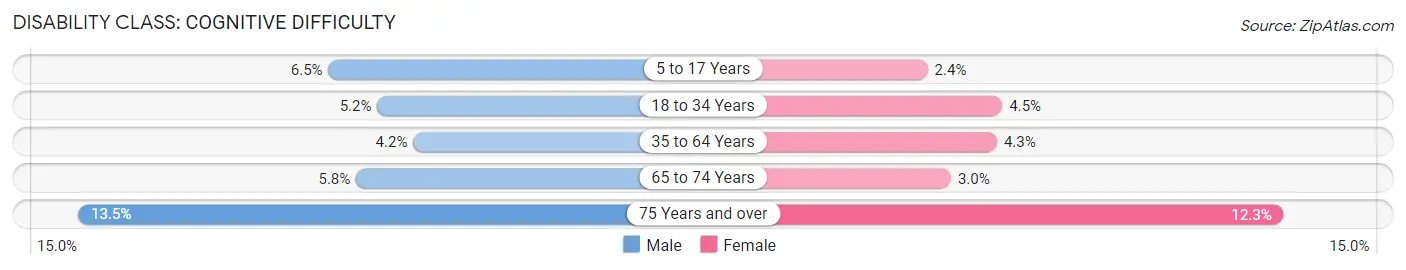
| Age Bracket | Male | Female |
| 5 to 17 Years | 1,390 (6.5%) | 488 (2.4%) |
| 18 to 34 Years | 1,357 (5.2%) | 1,246 (4.5%) |
| 35 to 64 Years | 1,658 (4.2%) | 1,835 (4.3%) |
| 65 to 74 Years | 610 (5.8%) | 370 (3.0%) |
| 75 Years and over | 919 (13.5%) | 1,157 (12.3%) |
Disability Class: Ambulatory Difficulty
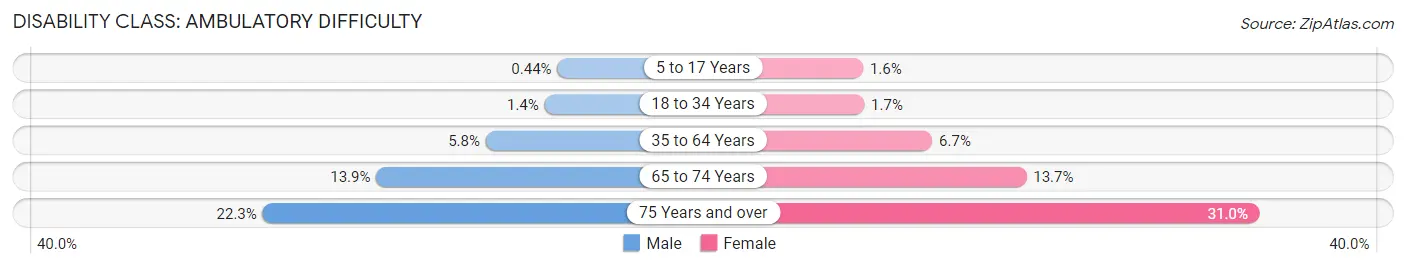
| Age Bracket | Male | Female |
| 5 to 17 Years | 93 (0.4%) | 320 (1.6%) |
| 18 to 34 Years | 365 (1.4%) | 463 (1.7%) |
| 35 to 64 Years | 2,288 (5.8%) | 2,855 (6.7%) |
| 65 to 74 Years | 1,469 (13.9%) | 1,666 (13.7%) |
| 75 Years and over | 1,519 (22.3%) | 2,918 (31.0%) |
Disability Class: Self-Care Difficulty
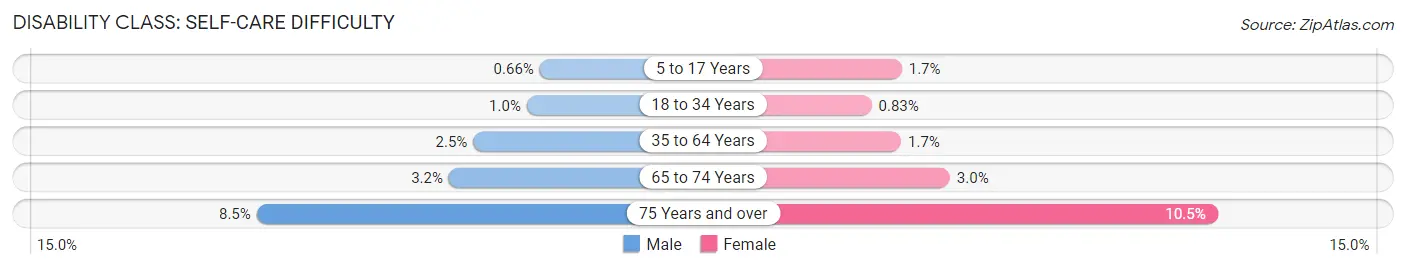
| Age Bracket | Male | Female |
| 5 to 17 Years | 141 (0.7%) | 340 (1.7%) |
| 18 to 34 Years | 268 (1.0%) | 231 (0.8%) |
| 35 to 64 Years | 995 (2.5%) | 702 (1.7%) |
| 65 to 74 Years | 337 (3.2%) | 366 (3.0%) |
| 75 Years and over | 581 (8.5%) | 984 (10.5%) |
Technology Access in Smith County
Computing Device Access in Smith County
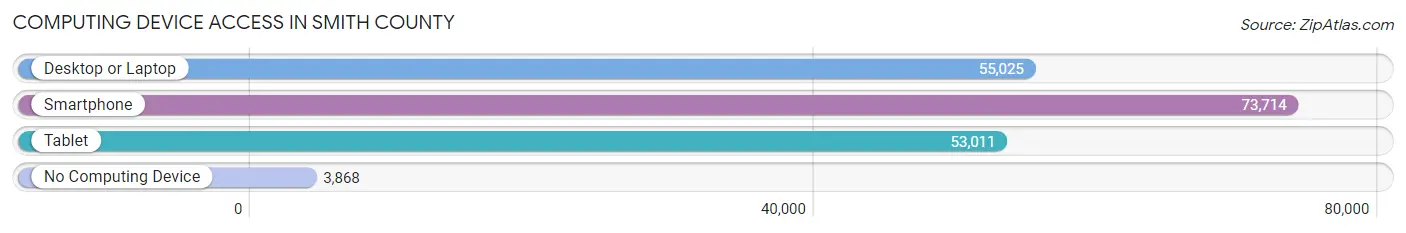
| Device Type | # Households | % Households |
| Desktop or Laptop | 55,025 | 67.7% |
| Smartphone | 73,714 | 90.7% |
| Tablet | 53,011 | 65.2% |
| No Computing Device | 3,868 | 4.8% |
| Total | 81,286 | 100.0% |
Internet Access in Smith County

| Internet Type | # Households | % Households |
| Dial-Up Internet | 96 | 0.1% |
| Broadband Home | 40,734 | 50.1% |
| Cellular Data Only | 24,767 | 30.5% |
| Satellite Internet | 7,894 | 9.7% |
| No Internet | 10,366 | 12.8% |
| Total | 81,286 | 100.0% |
Smith County Summary
Smith County is located in the northeastern part of the state of Texas, and is part of the Tyler-Longview metropolitan area. It is bordered by Gregg County to the north, Van Zandt County to the east, Henderson County to the south, and Wood and Upshur Counties to the west. The county seat is Tyler, which is also the largest city in the county.
History
Smith County was established in 1846, and was named for James Smith, a general in the Texas Revolution. The county was originally part of the Nacogdoches District, and was later divided into two districts, Smith and Rusk. The county was organized in 1848, and Tyler was chosen as the county seat.
In the late 19th century, Smith County was a major cotton-producing region, and the economy was largely based on agriculture. The county was also home to several sawmills and lumber companies, which provided jobs for many of the residents.
In the early 20th century, the economy shifted to manufacturing, and the county became home to several large factories, including the Tyler Pipe Company and the Tyler Refrigeration Company. The county also became a major center for oil production, and the discovery of oil in the area in 1930 led to a boom in the local economy.
Geography
Smith County covers an area of 890 square miles, and is located in the East Texas region of the state. The terrain is mostly flat, with some rolling hills in the western part of the county. The county is drained by the Neches River, which flows through the county from north to south.
The climate of Smith County is humid subtropical, with hot summers and mild winters. The average annual temperature is 68 degrees Fahrenheit, and the average annual precipitation is 40 inches.
Economy
The economy of Smith County is largely based on manufacturing, agriculture, and oil production. The county is home to several large factories, including the Tyler Pipe Company and the Tyler Refrigeration Company. The county is also a major center for oil production, and the discovery of oil in the area in 1930 led to a boom in the local economy.
Agriculture is also an important part of the local economy, and the county is home to several large farms and ranches. The main crops grown in the county are cotton, corn, soybeans, and wheat.
Demographics
As of the 2010 census, Smith County had a population of 209,714. The racial makeup of the county was 75.3% White, 17.7% African American, 0.7% Native American, 1.7% Asian, 0.1% Pacific Islander, and 3.5% from other races. Hispanic or Latino of any race were 11.2% of the population.
The median household income in Smith County was $45,945, and the median family income was $54,945. The per capita income was $23,845. About 14.2% of the population was below the poverty line.
Common Questions
What is the Total Population of Smith County?
Total Population of Smith County is 234,667.
What is the Total Male Population of Smith County?
Total Male Population of Smith County is 113,874.
What is the Total Female Population of Smith County?
Total Female Population of Smith County is 120,793.
What is the Ratio of Males per 100 Females in Smith County?
There are 94.27 Males per 100 Females in Smith County.
What is the Ratio of Females per 100 Males in Smith County?
There are 106.08 Females per 100 Males in Smith County.
What is the Median Population Age in Smith County?
Median Population Age in Smith County is 37.2 Years.
What is the Average Family Size in Smith County
Average Family Size in Smith County is 3.4 People.
What is the Average Household Size in Smith County
Average Household Size in Smith County is 2.8 People.
What is Per Capita Income in Smith County?
Per Capita income in Smith County is $33,903.
What is the Median Family Income in Smith County?
Median Family Income in Smith County is $83,564.
What is the Median Household income in Smith County?
Median Household Income in Smith County is $69,053.
What is Income or Wage Gap in Smith County?
Income or Wage Gap in Smith County is 25.9%.
Women in Smith County earn 74.1 cents for every dollar earned by a man.
What is Family Income Deficit in Smith County?
Family Income Deficit in Smith County is $12,152.
Families that are below poverty line in Smith County earn $12,152 less on average than the poverty threshold level.
What is Inequality or Gini Index in Smith County?
Inequality or Gini Index in Smith County is 0.46.
How Large is the Labor Force in Smith County?
There are 114,896 People in the Labor Forcein in Smith County.
What is the Percentage of People in the Labor Force in Smith County?
62.4% of People are in the Labor Force in Smith County.
What is the Unemployment Rate in Smith County?
Unemployment Rate in Smith County is 4.7%.