Midland County, TX
Midland County Map
Midland County Overview
169,393
TOTAL POPULATION
86,602
MALE POPULATION
82,791
FEMALE POPULATION
104.60
MALES / 100 FEMALES
95.60
FEMALES / 100 MALES
32.1
MEDIAN AGE
3.2
AVG FAMILY SIZE
2.6
AVG HOUSEHOLD SIZE
$46,914
PER CAPITA INCOME
$108,896
AVG FAMILY INCOME
$90,123
AVG HOUSEHOLD INCOME
40.8%
WAGE / INCOME GAP [ % ]
59.2¢/ $1
WAGE / INCOME GAP [ $ ]
$9,580
FAMILY INCOME DEFICIT
0.47
INEQUALITY / GINI INDEX
89,301
LABOR FORCE [ PEOPLE ]
71.2%
PERCENT IN LABOR FORCE
3.4%
UNEMPLOYMENT RATE
Midland County Area Codes
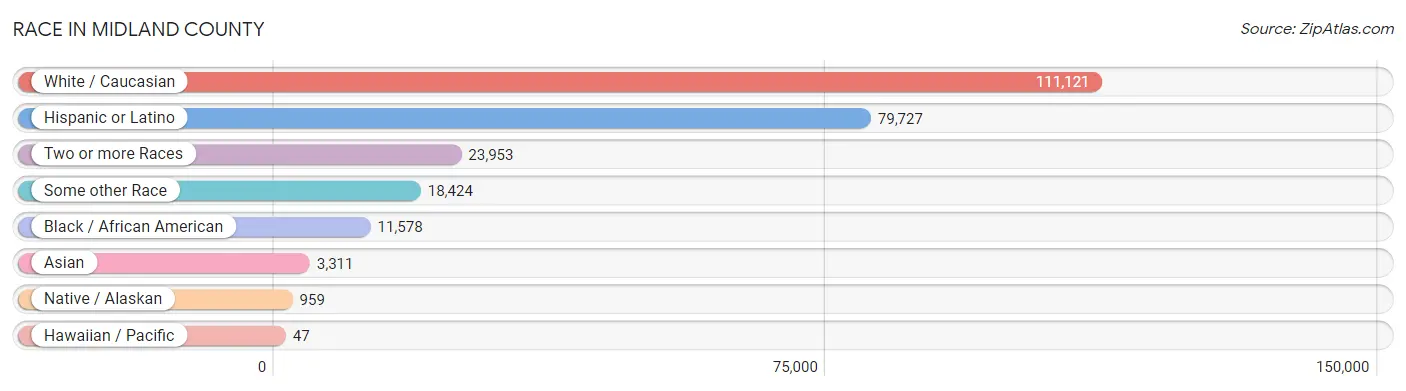
Race in Midland County
The most populous races in Midland County are White / Caucasian (111,121 | 65.6%), Hispanic or Latino (79,727 | 47.1%), and Two or more Races (23,953 | 14.1%).
| Race | # Population | % Population |
| Asian | 3,311 | 1.9% |
| Black / African American | 11,578 | 6.8% |
| Hawaiian / Pacific | 47 | 0.0% |
| Hispanic or Latino | 79,727 | 47.1% |
| Native / Alaskan | 959 | 0.6% |
| White / Caucasian | 111,121 | 65.6% |
| Two or more Races | 23,953 | 14.1% |
| Some other Race | 18,424 | 10.9% |
| Total | 169,393 | 100.0% |
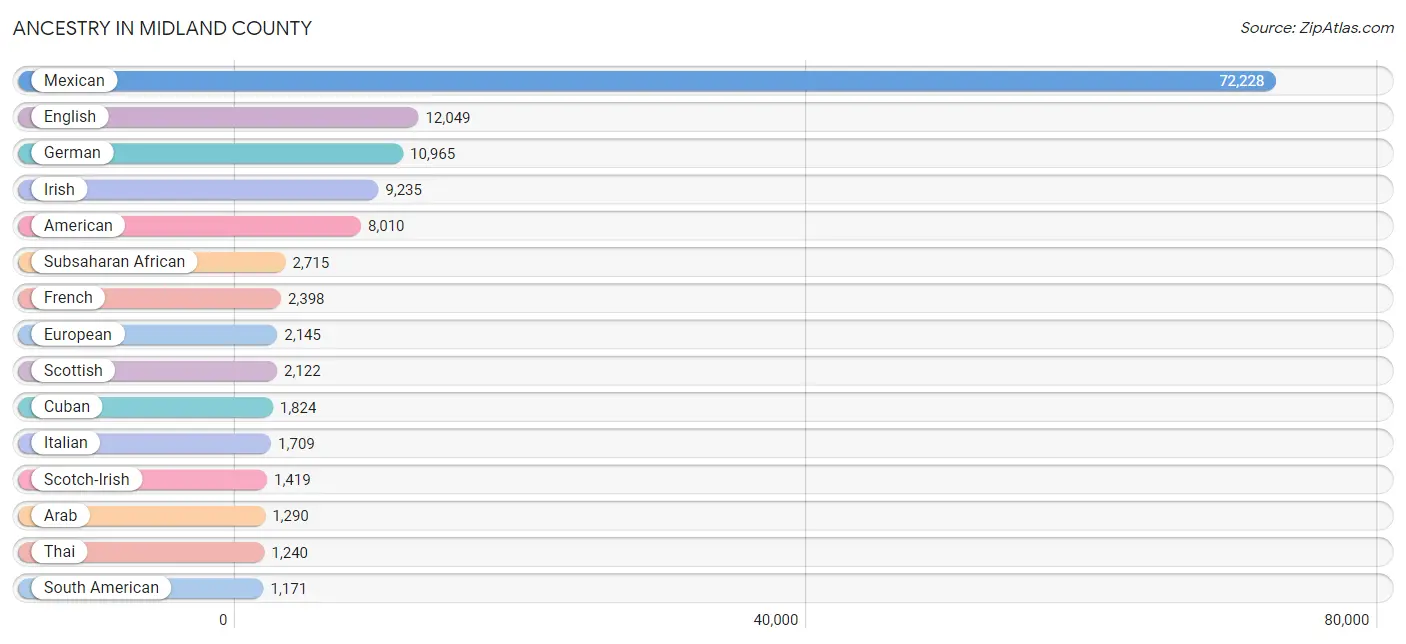
Ancestry in Midland County
The most populous ancestries reported in Midland County are Mexican (72,228 | 42.6%), English (12,049 | 7.1%), German (10,965 | 6.5%), Irish (9,235 | 5.4%), and American (8,010 | 4.7%), together accounting for 66.4% of all Midland County residents.
| Ancestry | # Population | % Population |
| African | 1,154 | 0.7% |
| Alaska Native | 69 | 0.0% |
| Albanian | 18 | 0.0% |
| American | 8,010 | 4.7% |
| Apache | 23 | 0.0% |
| Arab | 1,290 | 0.8% |
| Australian | 33 | 0.0% |
| Austrian | 134 | 0.1% |
| Belgian | 59 | 0.0% |
| Bermudan | 22 | 0.0% |
| Bhutanese | 501 | 0.3% |
| Blackfeet | 206 | 0.1% |
| Bolivian | 26 | 0.0% |
| Brazilian | 8 | 0.0% |
| British | 706 | 0.4% |
| Burmese | 463 | 0.3% |
| Cajun | 59 | 0.0% |
| Canadian | 495 | 0.3% |
| Central American | 914 | 0.5% |
| Central American Indian | 37 | 0.0% |
| Cherokee | 616 | 0.4% |
| Chickasaw | 67 | 0.0% |
| Chippewa | 10 | 0.0% |
| Choctaw | 281 | 0.2% |
| Colombian | 408 | 0.2% |
| Creek | 25 | 0.0% |
| Croatian | 37 | 0.0% |
| Cuban | 1,824 | 1.1% |
| Czech | 703 | 0.4% |
| Czechoslovakian | 59 | 0.0% |
| Danish | 193 | 0.1% |
| Delaware | 34 | 0.0% |
| Dominican | 47 | 0.0% |
| Dutch | 458 | 0.3% |
| Dutch West Indian | 43 | 0.0% |
| Eastern European | 246 | 0.2% |
| Ecuadorian | 87 | 0.1% |
| Egyptian | 15 | 0.0% |
| English | 12,049 | 7.1% |
| Ethiopian | 12 | 0.0% |
| European | 2,145 | 1.3% |
| French | 2,398 | 1.4% |
| French Canadian | 239 | 0.1% |
| German | 10,965 | 6.5% |
| Ghanaian | 23 | 0.0% |
| Greek | 256 | 0.2% |
| Guatemalan | 236 | 0.1% |
| Guyanese | 123 | 0.1% |
| Honduran | 193 | 0.1% |
| Hungarian | 51 | 0.0% |
| Indian (Asian) | 797 | 0.5% |
| Indonesian | 272 | 0.2% |
| Iranian | 28 | 0.0% |
| Irish | 9,235 | 5.4% |
| Israeli | 104 | 0.1% |
| Italian | 1,709 | 1.0% |
| Jamaican | 286 | 0.2% |
| Japanese | 503 | 0.3% |
| Korean | 746 | 0.4% |
| Lebanese | 799 | 0.5% |
| Malaysian | 98 | 0.1% |
| Mexican | 72,228 | 42.6% |
| Mexican American Indian | 233 | 0.1% |
| Native Hawaiian | 28 | 0.0% |
| Navajo | 64 | 0.0% |
| New Zealander | 6 | 0.0% |
| Nicaraguan | 164 | 0.1% |
| Nigerian | 964 | 0.6% |
| Northern European | 125 | 0.1% |
| Norwegian | 560 | 0.3% |
| Palestinian | 260 | 0.2% |
| Peruvian | 312 | 0.2% |
| Polish | 750 | 0.4% |
| Portuguese | 69 | 0.0% |
| Potawatomi | 14 | 0.0% |
| Puerto Rican | 756 | 0.4% |
| Romanian | 21 | 0.0% |
| Russian | 136 | 0.1% |
| Salvadoran | 321 | 0.2% |
| Samoan | 48 | 0.0% |
| Scandinavian | 277 | 0.2% |
| Scotch-Irish | 1,419 | 0.8% |
| Scottish | 2,122 | 1.3% |
| Serbian | 11 | 0.0% |
| Sioux | 54 | 0.0% |
| Slavic | 34 | 0.0% |
| Slovak | 68 | 0.0% |
| South African | 21 | 0.0% |
| South American | 1,171 | 0.7% |
| South American Indian | 110 | 0.1% |
| Spaniard | 386 | 0.2% |
| Spanish | 128 | 0.1% |
| Spanish American | 74 | 0.0% |
| Sri Lankan | 361 | 0.2% |
| Subsaharan African | 2,715 | 1.6% |
| Sudanese | 159 | 0.1% |
| Swedish | 775 | 0.5% |
| Swiss | 53 | 0.0% |
| Thai | 1,240 | 0.7% |
| Tongan | 32 | 0.0% |
| Ukrainian | 139 | 0.1% |
| Venezuelan | 338 | 0.2% |
| Vietnamese | 25 | 0.0% |
| Welsh | 281 | 0.2% |
| West Indian | 74 | 0.0% |
| Yugoslavian | 40 | 0.0% | View All 106 Rows |
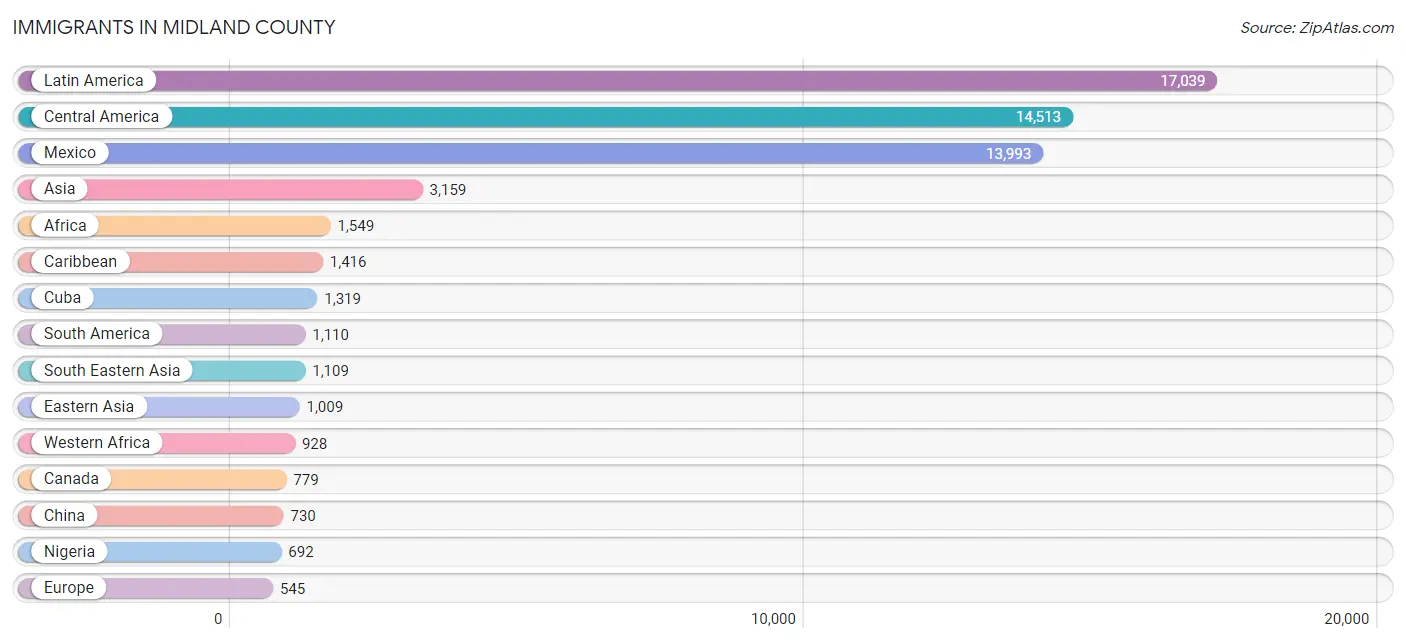
Immigrants in Midland County
The most numerous immigrant groups reported in Midland County came from Latin America (17,039 | 10.1%), Central America (14,513 | 8.6%), Mexico (13,993 | 8.3%), Asia (3,159 | 1.9%), and Africa (1,549 | 0.9%), together accounting for 29.7% of all Midland County residents.
| Immigration Origin | # Population | % Population |
| Africa | 1,549 | 0.9% |
| Albania | 18 | 0.0% |
| Asia | 3,159 | 1.9% |
| Australia | 26 | 0.0% |
| Bangladesh | 12 | 0.0% |
| Bolivia | 26 | 0.0% |
| Cambodia | 435 | 0.3% |
| Canada | 779 | 0.5% |
| Caribbean | 1,416 | 0.8% |
| Central America | 14,513 | 8.6% |
| China | 730 | 0.4% |
| Colombia | 250 | 0.2% |
| Cuba | 1,319 | 0.8% |
| Dominican Republic | 97 | 0.1% |
| Eastern Africa | 388 | 0.2% |
| Eastern Asia | 1,009 | 0.6% |
| Eastern Europe | 121 | 0.1% |
| Ecuador | 87 | 0.1% |
| Egypt | 52 | 0.0% |
| El Salvador | 353 | 0.2% |
| England | 51 | 0.0% |
| Europe | 545 | 0.3% |
| France | 4 | 0.0% |
| Germany | 303 | 0.2% |
| Ghana | 23 | 0.0% |
| Guatemala | 59 | 0.0% |
| Guyana | 40 | 0.0% |
| Honduras | 34 | 0.0% |
| Hong Kong | 15 | 0.0% |
| India | 459 | 0.3% |
| Iran | 64 | 0.0% |
| Iraq | 95 | 0.1% |
| Ireland | 1 | 0.0% |
| Italy | 37 | 0.0% |
| Japan | 110 | 0.1% |
| Kenya | 200 | 0.1% |
| Korea | 169 | 0.1% |
| Laos | 59 | 0.0% |
| Latin America | 17,039 | 10.1% |
| Lebanon | 147 | 0.1% |
| Mexico | 13,993 | 8.3% |
| Moldova | 25 | 0.0% |
| Morocco | 84 | 0.1% |
| Netherlands | 3 | 0.0% |
| Nicaragua | 74 | 0.0% |
| Nigeria | 692 | 0.4% |
| Northern Africa | 203 | 0.1% |
| Northern Europe | 77 | 0.1% |
| Oceania | 32 | 0.0% |
| Peru | 289 | 0.2% |
| Philippines | 390 | 0.2% |
| Romania | 21 | 0.0% |
| Russia | 40 | 0.0% |
| Saudi Arabia | 8 | 0.0% |
| Senegal | 51 | 0.0% |
| South Africa | 21 | 0.0% |
| South America | 1,110 | 0.7% |
| South Central Asia | 535 | 0.3% |
| South Eastern Asia | 1,109 | 0.6% |
| Southern Europe | 37 | 0.0% |
| Sudan | 67 | 0.0% |
| Syria | 83 | 0.1% |
| Taiwan | 14 | 0.0% |
| Turkey | 23 | 0.0% |
| Uganda | 129 | 0.1% |
| Ukraine | 17 | 0.0% |
| Venezuela | 392 | 0.2% |
| Vietnam | 69 | 0.0% |
| Western Africa | 928 | 0.5% |
| Western Asia | 356 | 0.2% |
| Western Europe | 310 | 0.2% | View All 71 Rows |
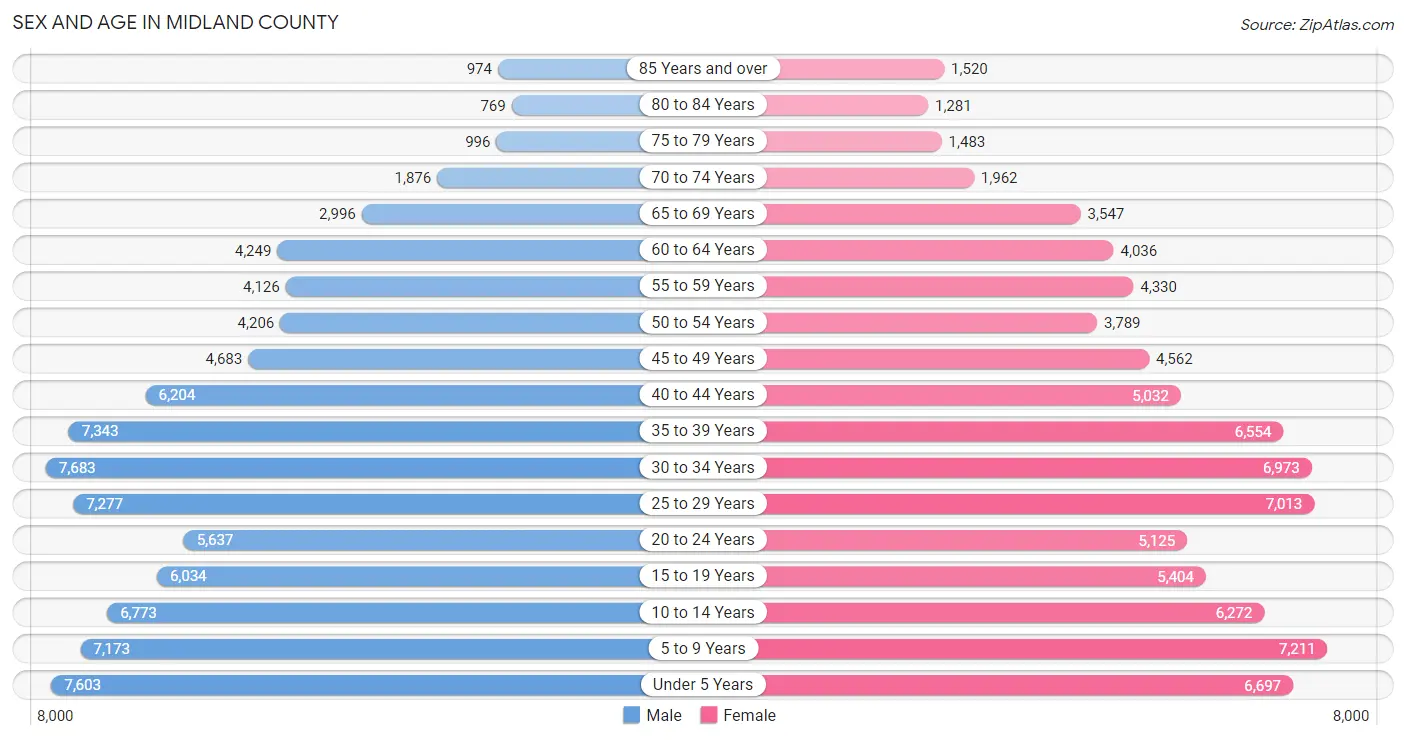
Sex and Age in Midland County
Sex and Age in Midland County
The most populous age groups in Midland County are 30 to 34 Years (7,683 | 8.9%) for men and 5 to 9 Years (7,211 | 8.7%) for women.
| Age Bracket | Male | Female |
| Under 5 Years | 7,603 (8.8%) | 6,697 (8.1%) |
| 5 to 9 Years | 7,173 (8.3%) | 7,211 (8.7%) |
| 10 to 14 Years | 6,773 (7.8%) | 6,272 (7.6%) |
| 15 to 19 Years | 6,034 (7.0%) | 5,404 (6.5%) |
| 20 to 24 Years | 5,637 (6.5%) | 5,125 (6.2%) |
| 25 to 29 Years | 7,277 (8.4%) | 7,013 (8.5%) |
| 30 to 34 Years | 7,683 (8.9%) | 6,973 (8.4%) |
| 35 to 39 Years | 7,343 (8.5%) | 6,554 (7.9%) |
| 40 to 44 Years | 6,204 (7.2%) | 5,032 (6.1%) |
| 45 to 49 Years | 4,683 (5.4%) | 4,562 (5.5%) |
| 50 to 54 Years | 4,206 (4.9%) | 3,789 (4.6%) |
| 55 to 59 Years | 4,126 (4.8%) | 4,330 (5.2%) |
| 60 to 64 Years | 4,249 (4.9%) | 4,036 (4.9%) |
| 65 to 69 Years | 2,996 (3.5%) | 3,547 (4.3%) |
| 70 to 74 Years | 1,876 (2.2%) | 1,962 (2.4%) |
| 75 to 79 Years | 996 (1.1%) | 1,483 (1.8%) |
| 80 to 84 Years | 769 (0.9%) | 1,281 (1.5%) |
| 85 Years and over | 974 (1.1%) | 1,520 (1.8%) |
| Total | 86,602 (100.0%) | 82,791 (100.0%) |
Families and Households in Midland County
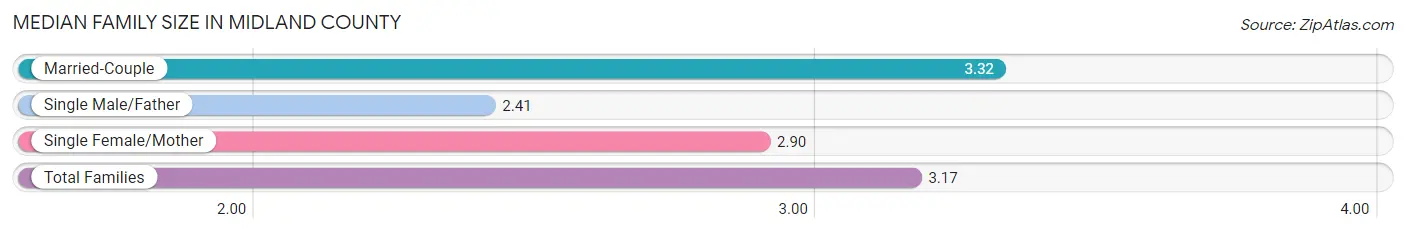
Median Family Size in Midland County
The median family size in Midland County is 3.17 persons per family, with married-couple families (32,930 | 75.0%) accounting for the largest median family size of 3.32 persons per family. On the other hand, single male/father families (4,009 | 9.1%) represent the smallest median family size with 2.41 persons per family.
| Family Type | # Families | Family Size |
| Married-Couple | 32,930 (75.0%) | 3.32 |
| Single Male/Father | 4,009 (9.1%) | 2.41 |
| Single Female/Mother | 6,944 (15.8%) | 2.90 |
| Total Families | 43,883 (100.0%) | 3.17 |
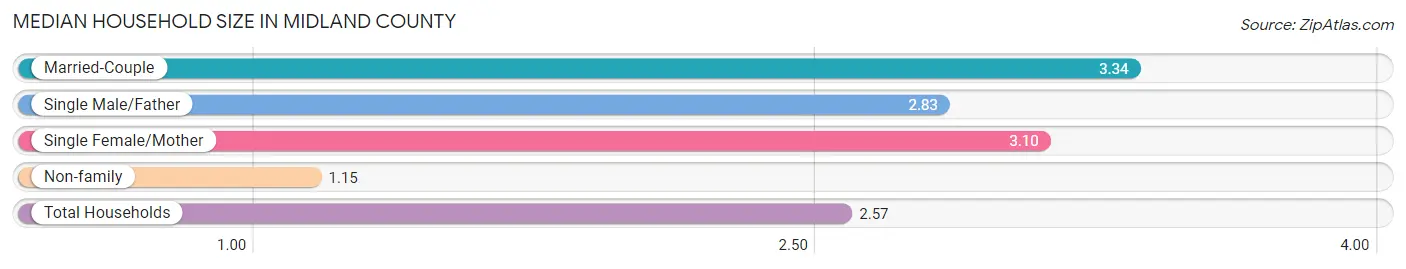
Median Household Size in Midland County
The median household size in Midland County is 2.57 persons per household, with married-couple households (32,930 | 50.5%) accounting for the largest median household size of 3.34 persons per household. non-family households (21,382 | 32.8%) represent the smallest median household size with 1.15 persons per household.
| Household Type | # Households | Household Size |
| Married-Couple | 32,930 (50.5%) | 3.34 |
| Single Male/Father | 4,009 (6.1%) | 2.83 |
| Single Female/Mother | 6,944 (10.6%) | 3.10 |
| Non-family | 21,382 (32.8%) | 1.15 |
| Total Households | 65,265 (100.0%) | 2.57 |
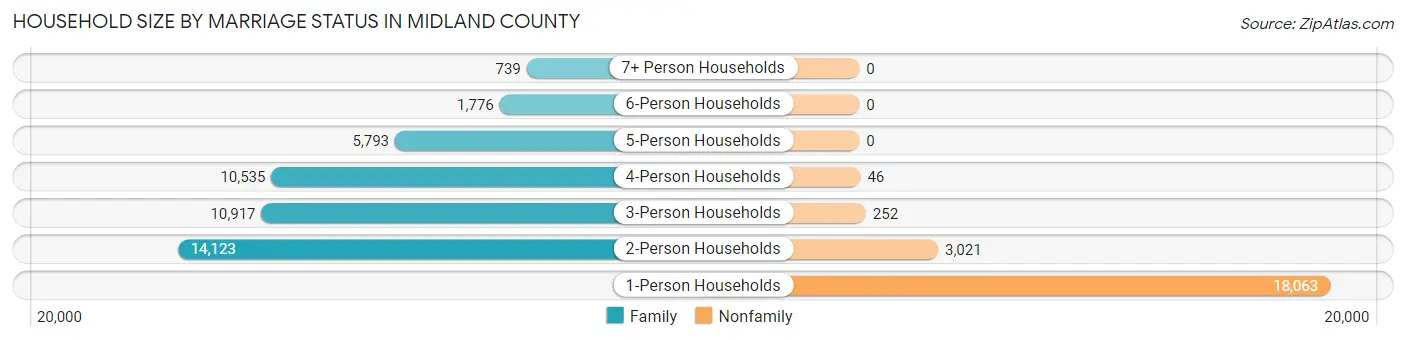
Household Size by Marriage Status in Midland County
Out of a total of 65,265 households in Midland County, 43,883 (67.2%) are family households, while 21,382 (32.8%) are nonfamily households. The most numerous type of family households are 2-person households, comprising 14,123, and the most common type of nonfamily households are 1-person households, comprising 18,063.
| Household Size | Family Households | Nonfamily Households |
| 1-Person Households | - | 18,063 (27.7%) |
| 2-Person Households | 14,123 (21.6%) | 3,021 (4.6%) |
| 3-Person Households | 10,917 (16.7%) | 252 (0.4%) |
| 4-Person Households | 10,535 (16.1%) | 46 (0.1%) |
| 5-Person Households | 5,793 (8.9%) | 0 (0.0%) |
| 6-Person Households | 1,776 (2.7%) | 0 (0.0%) |
| 7+ Person Households | 739 (1.1%) | 0 (0.0%) |
| Total | 43,883 (67.2%) | 21,382 (32.8%) |
Female Fertility in Midland County
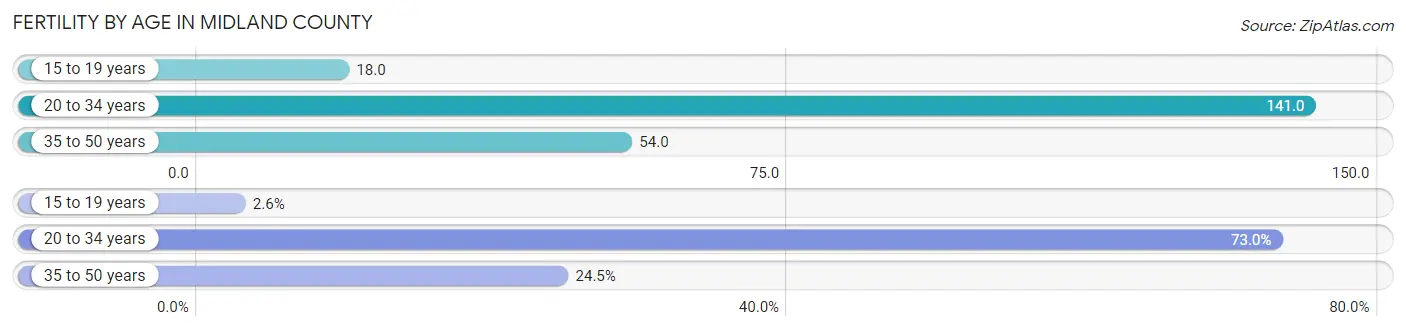
Fertility by Age in Midland County
Average fertility rate in Midland County is 90.0 births per 1,000 women. Women in the age bracket of 20 to 34 years have the highest fertility rate with 141.0 births per 1,000 women. Women in the age bracket of 20 to 34 years acount for 73.0% of all women with births.
| Age Bracket | Women with Births | Births / 1,000 Women |
| 15 to 19 years | 95 (2.6%) | 18.0 |
| 20 to 34 years | 2,695 (73.0%) | 141.0 |
| 35 to 50 years | 904 (24.5%) | 54.0 |
| Total | 3,694 (100.0%) | 90.0 |
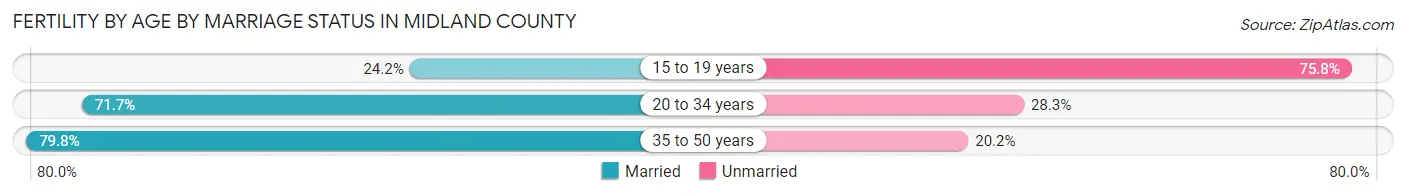
Fertility by Age by Marriage Status in Midland County
72.4% of women with births (3,694) in Midland County are married. The highest percentage of unmarried women with births falls into 15 to 19 years age bracket with 75.8% of them unmarried at the time of birth, while the lowest percentage of unmarried women with births belong to 35 to 50 years age bracket with 20.2% of them unmarried.
| Age Bracket | Married | Unmarried |
| 15 to 19 years | 23 (24.2%) | 72 (75.8%) |
| 20 to 34 years | 1,932 (71.7%) | 763 (28.3%) |
| 35 to 50 years | 721 (79.8%) | 183 (20.2%) |
| Total | 2,674 (72.4%) | 1,020 (27.6%) |
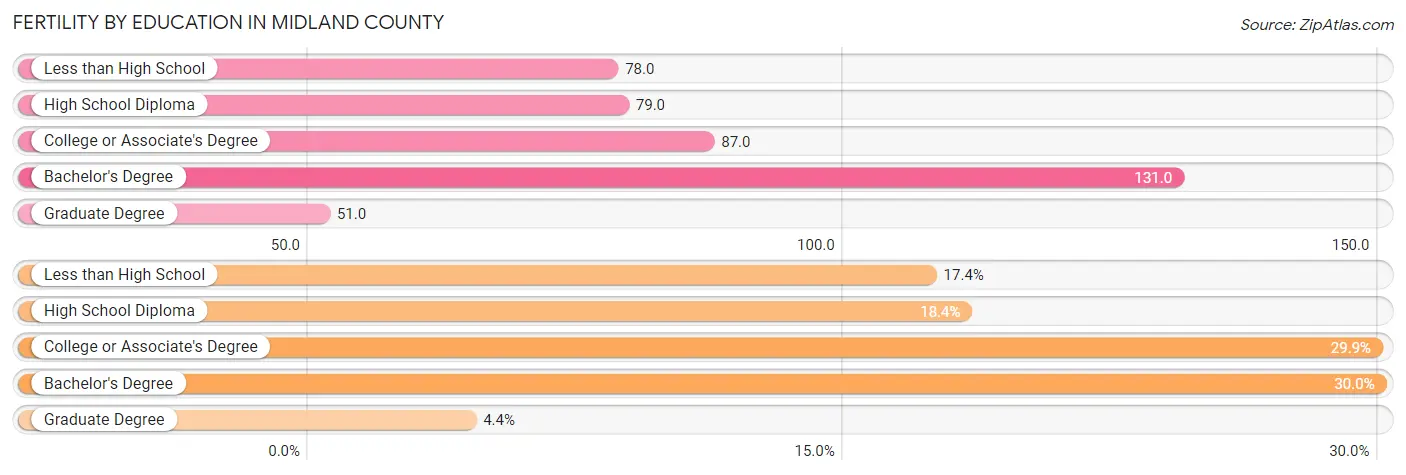
Fertility by Education in Midland County
Average fertility rate in Midland County is 90.0 births per 1,000 women. Women with the education attainment of bachelor's degree have the highest fertility rate of 131.0 births per 1,000 women, while women with the education attainment of graduate degree have the lowest fertility at 51.0 births per 1,000 women. Women with the education attainment of bachelor's degree represent 30.0% of all women with births.
| Educational Attainment | Women with Births | Births / 1,000 Women |
| Less than High School | 641 (17.3%) | 78.0 |
| High School Diploma | 678 (18.3%) | 79.0 |
| College or Associate's Degree | 1,104 (29.9%) | 87.0 |
| Bachelor's Degree | 1,108 (30.0%) | 131.0 |
| Graduate Degree | 163 (4.4%) | 51.0 |
| Total | 3,694 (100.0%) | 90.0 |
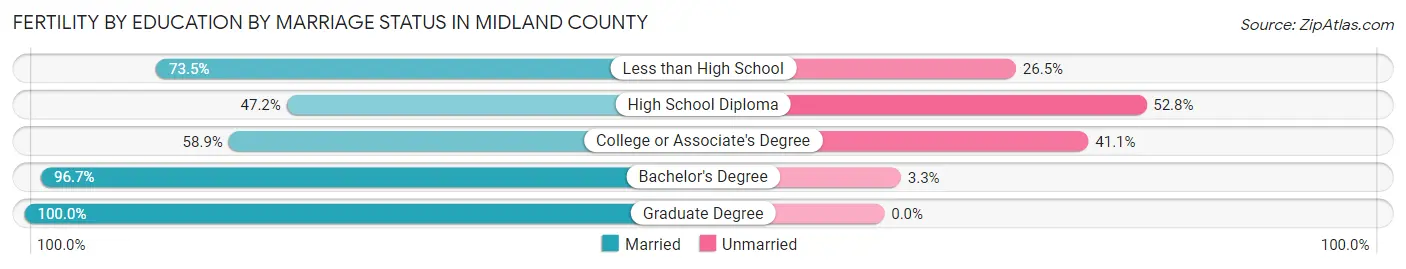
Fertility by Education by Marriage Status in Midland County
27.6% of women with births in Midland County are unmarried. Women with the educational attainment of graduate degree are most likely to be married with 100.0% of them married at childbirth, while women with the educational attainment of high school diploma are least likely to be married with 52.8% of them unmarried at childbirth.
| Educational Attainment | Married | Unmarried |
| Less than High School | 471 (73.5%) | 170 (26.5%) |
| High School Diploma | 320 (47.2%) | 358 (52.8%) |
| College or Associate's Degree | 650 (58.9%) | 454 (41.1%) |
| Bachelor's Degree | 1,071 (96.7%) | 37 (3.3%) |
| Graduate Degree | 163 (100.0%) | 0 (0.0%) |
| Total | 2,674 (72.4%) | 1,020 (27.6%) |
Income in Midland County
Income Overview in Midland County
Per Capita Income in Midland County is $46,914, while median incomes of families and households are $108,896 and $90,123 respectively.
| Characteristic | Number | Measure |
| Per Capita Income | 169,393 | $46,914 |
| Median Family Income | 43,883 | $108,896 |
| Mean Family Income | 43,883 | $140,622 |
| Median Household Income | 65,265 | $90,123 |
| Mean Household Income | 65,265 | $122,370 |
| Income Deficit | 43,883 | $9,580 |
| Wage / Income Gap (%) | 169,393 | 40.83% |
| Wage / Income Gap ($) | 169,393 | 59.17¢ per $1 |
| Gini / Inequality Index | 169,393 | 0.47 |
Earnings by Sex in Midland County
Average Earnings in Midland County are $50,056, $63,032 for men and $37,297 for women, a difference of 40.8%.
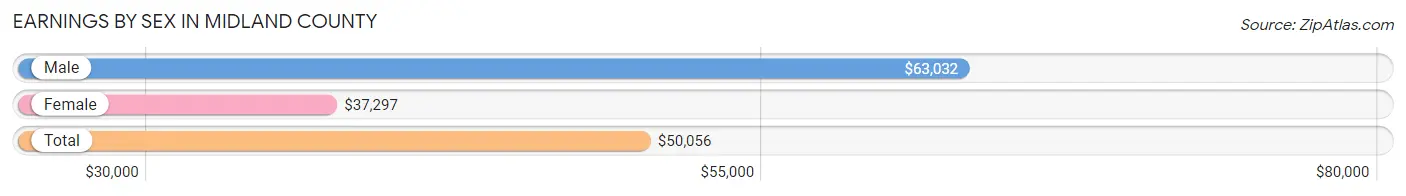
| Sex | Number | Average Earnings |
| Male | 53,855 (57.6%) | $63,032 |
| Female | 39,723 (42.4%) | $37,297 |
| Total | 93,578 (100.0%) | $50,056 |
Earnings by Sex by Income Bracket in Midland County
The most common earnings brackets in Midland County are $100,000+ for men (16,580 | 30.8%) and $55,000 to $64,999 for women (4,155 | 10.5%).
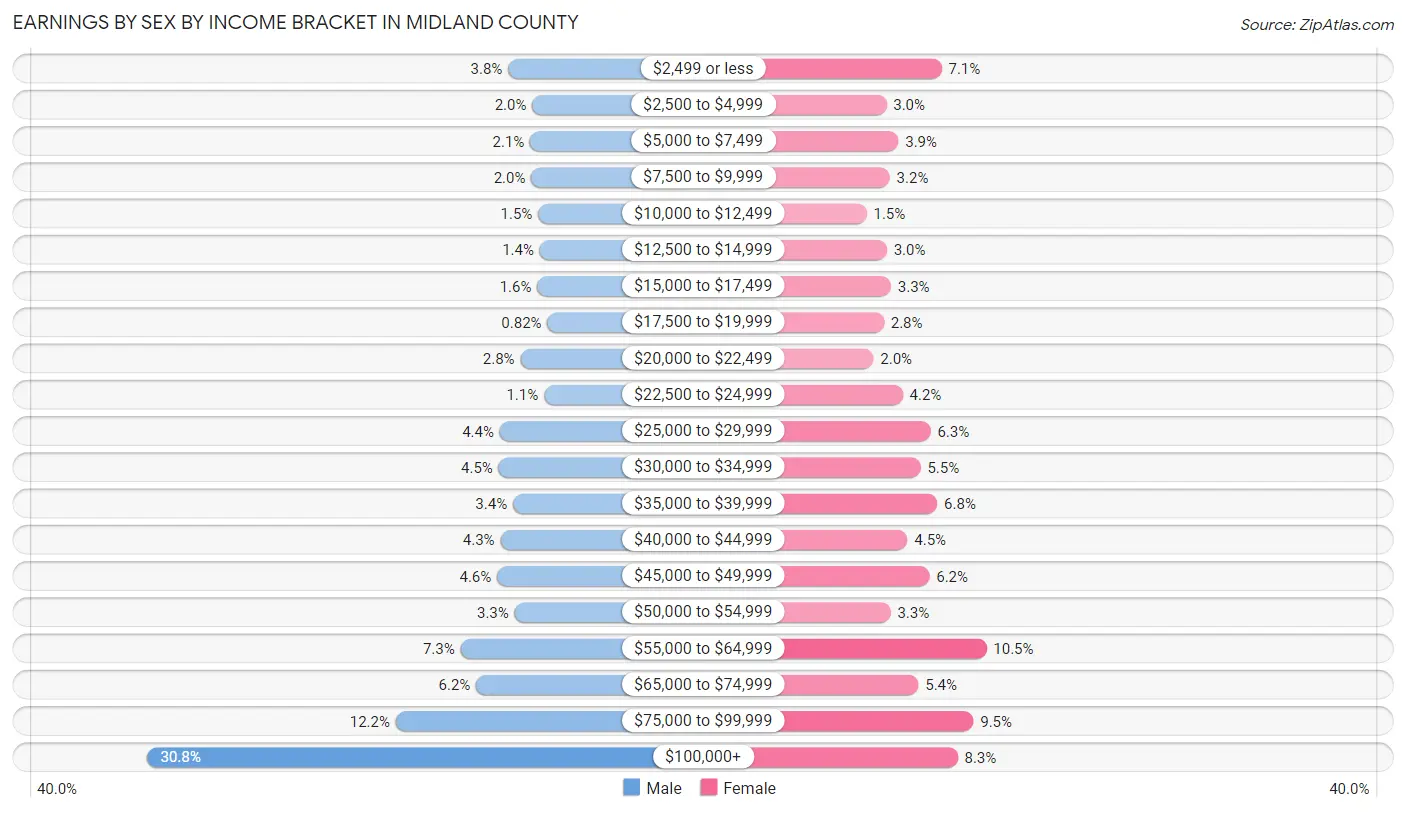
| Income | Male | Female |
| $2,499 or less | 2,025 (3.8%) | 2,820 (7.1%) |
| $2,500 to $4,999 | 1,050 (1.9%) | 1,176 (3.0%) |
| $5,000 to $7,499 | 1,136 (2.1%) | 1,534 (3.9%) |
| $7,500 to $9,999 | 1,091 (2.0%) | 1,277 (3.2%) |
| $10,000 to $12,499 | 815 (1.5%) | 588 (1.5%) |
| $12,500 to $14,999 | 748 (1.4%) | 1,189 (3.0%) |
| $15,000 to $17,499 | 852 (1.6%) | 1,311 (3.3%) |
| $17,500 to $19,999 | 444 (0.8%) | 1,099 (2.8%) |
| $20,000 to $22,499 | 1,529 (2.8%) | 791 (2.0%) |
| $22,500 to $24,999 | 576 (1.1%) | 1,660 (4.2%) |
| $25,000 to $29,999 | 2,364 (4.4%) | 2,491 (6.3%) |
| $30,000 to $34,999 | 2,408 (4.5%) | 2,192 (5.5%) |
| $35,000 to $39,999 | 1,831 (3.4%) | 2,691 (6.8%) |
| $40,000 to $44,999 | 2,339 (4.3%) | 1,804 (4.5%) |
| $45,000 to $49,999 | 2,471 (4.6%) | 2,455 (6.2%) |
| $50,000 to $54,999 | 1,769 (3.3%) | 1,300 (3.3%) |
| $55,000 to $64,999 | 3,948 (7.3%) | 4,155 (10.5%) |
| $65,000 to $74,999 | 3,320 (6.2%) | 2,130 (5.4%) |
| $75,000 to $99,999 | 6,559 (12.2%) | 3,764 (9.5%) |
| $100,000+ | 16,580 (30.8%) | 3,296 (8.3%) |
| Total | 53,855 (100.0%) | 39,723 (100.0%) |
Earnings by Sex by Educational Attainment in Midland County
Average earnings in Midland County are $73,607 for men and $44,088 for women, a difference of 40.1%. Men with an educational attainment of graduate degree enjoy the highest average annual earnings of $115,940, while those with high school diploma education earn the least with $54,309. Women with an educational attainment of graduate degree earn the most with the average annual earnings of $71,412, while those with less than high school education have the smallest earnings of $22,758.
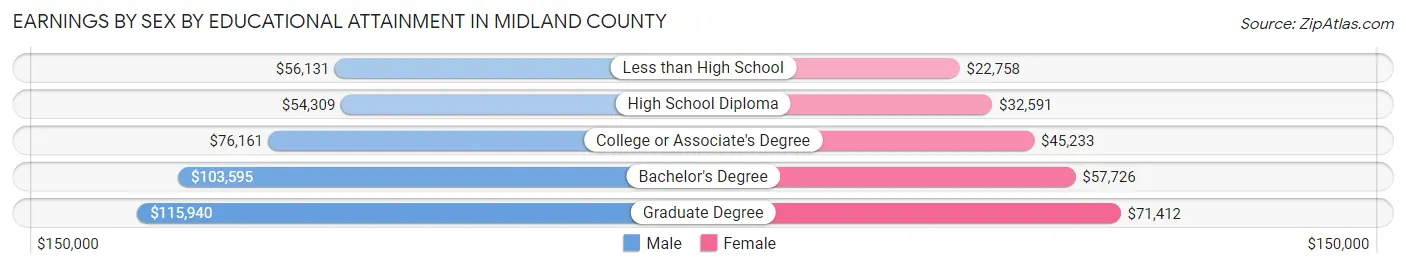
| Educational Attainment | Male Income | Female Income |
| Less than High School | $56,131 | $22,758 |
| High School Diploma | $54,309 | $32,591 |
| College or Associate's Degree | $76,161 | $45,233 |
| Bachelor's Degree | $103,595 | $57,726 |
| Graduate Degree | $115,940 | $71,412 |
| Total | $73,607 | $44,088 |
Family Income in Midland County
Family Income Brackets in Midland County
According to the Midland County family income data, there are 8,777 families falling into the $100,000 to $149,999 income range, which is the most common income bracket and makes up 20.0% of all families. Conversely, the $10,000 to $14,999 income bracket is the least frequent group with only 483 families (1.1%) belonging to this category.
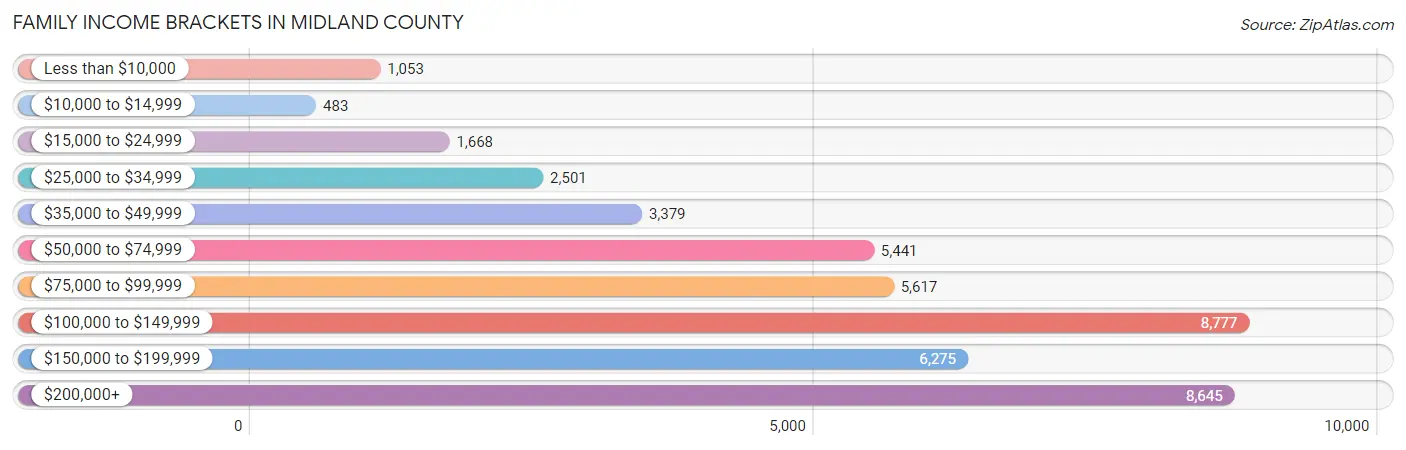
| Income Bracket | # Families | % Families |
| Less than $10,000 | 1,053 | 2.4% |
| $10,000 to $14,999 | 483 | 1.1% |
| $15,000 to $24,999 | 1,668 | 3.8% |
| $25,000 to $34,999 | 2,501 | 5.7% |
| $35,000 to $49,999 | 3,379 | 7.7% |
| $50,000 to $74,999 | 5,441 | 12.4% |
| $75,000 to $99,999 | 5,617 | 12.8% |
| $100,000 to $149,999 | 8,777 | 20.0% |
| $150,000 to $199,999 | 6,275 | 14.3% |
| $200,000+ | 8,645 | 19.7% |
Family Income by Famaliy Size in Midland County
7+ person families (468 | 1.1%) account for the highest median family income in Midland County with $174,394 per family, while 2-person families (15,597 | 35.5%) have the highest median income of $45,456 per family member.
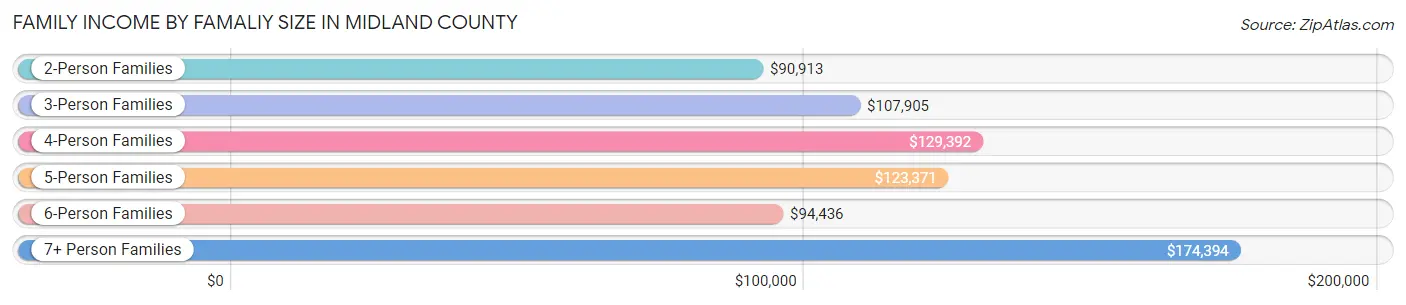
| Income Bracket | # Families | Median Income |
| 2-Person Families | 15,597 (35.5%) | $90,913 |
| 3-Person Families | 10,525 (24.0%) | $107,905 |
| 4-Person Families | 10,562 (24.1%) | $129,392 |
| 5-Person Families | 4,988 (11.4%) | $123,371 |
| 6-Person Families | 1,743 (4.0%) | $94,436 |
| 7+ Person Families | 468 (1.1%) | $174,394 |
| Total | 43,883 (100.0%) | $108,896 |
Family Income by Number of Earners in Midland County
The median family income in Midland County is $108,896, with families comprising 3+ earners (5,527) having the highest median family income of $159,575, while families with no earners (2,722) have the lowest median family income of $48,899, accounting for 12.6% and 6.2% of families, respectively.
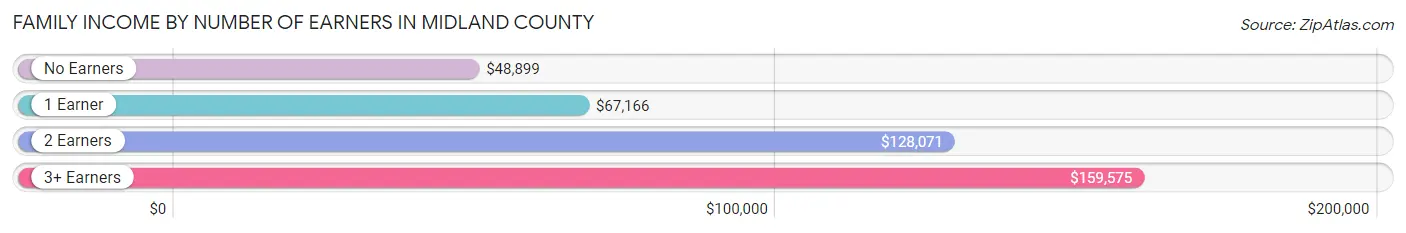
| Number of Earners | # Families | Median Income |
| No Earners | 2,722 (6.2%) | $48,899 |
| 1 Earner | 15,307 (34.9%) | $67,166 |
| 2 Earners | 20,327 (46.3%) | $128,071 |
| 3+ Earners | 5,527 (12.6%) | $159,575 |
| Total | 43,883 (100.0%) | $108,896 |
Household Income in Midland County
Household Income Brackets in Midland County
With 11,813 households falling in the category, the $100,000 to $149,999 income range is the most frequent in Midland County, accounting for 18.1% of all households. In contrast, only 1,436 households (2.2%) fall into the $10,000 to $14,999 income bracket, making it the least populous group.
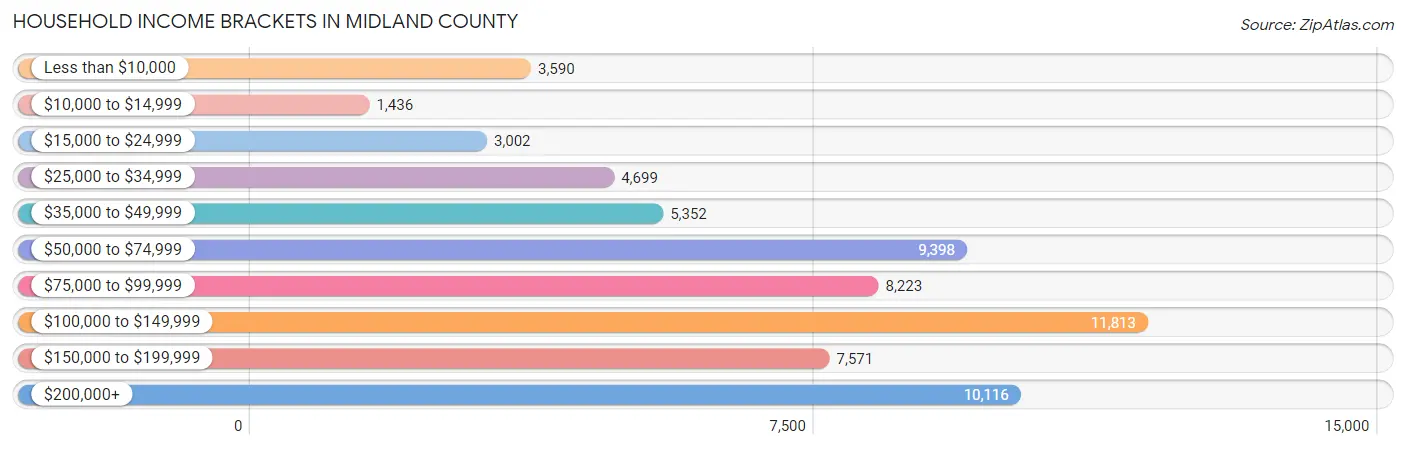
| Income Bracket | # Households | % Households |
| Less than $10,000 | 3,590 | 5.5% |
| $10,000 to $14,999 | 1,436 | 2.2% |
| $15,000 to $24,999 | 3,002 | 4.6% |
| $25,000 to $34,999 | 4,699 | 7.2% |
| $35,000 to $49,999 | 5,352 | 8.2% |
| $50,000 to $74,999 | 9,398 | 14.4% |
| $75,000 to $99,999 | 8,223 | 12.6% |
| $100,000 to $149,999 | 11,813 | 18.1% |
| $150,000 to $199,999 | 7,571 | 11.6% |
| $200,000+ | 10,116 | 15.5% |
Household Income by Householder Age in Midland County
The median household income in Midland County is $90,123, with the highest median household income of $110,650 found in the 45 to 64 years age bracket for the primary householder. A total of 20,044 households (30.7%) fall into this category. Meanwhile, the 15 to 24 years age bracket for the primary householder has the lowest median household income of $51,202, with 4,181 households (6.4%) in this group.
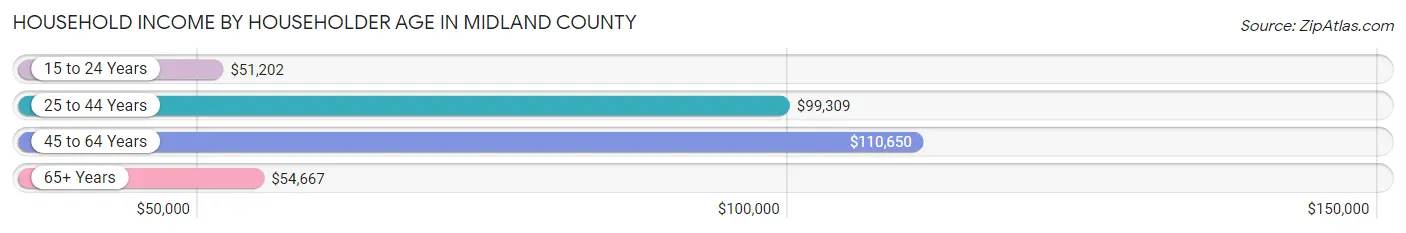
| Income Bracket | # Households | Median Income |
| 15 to 24 Years | 4,181 (6.4%) | $51,202 |
| 25 to 44 Years | 29,457 (45.1%) | $99,309 |
| 45 to 64 Years | 20,044 (30.7%) | $110,650 |
| 65+ Years | 11,583 (17.7%) | $54,667 |
| Total | 65,265 (100.0%) | $90,123 |
Poverty in Midland County
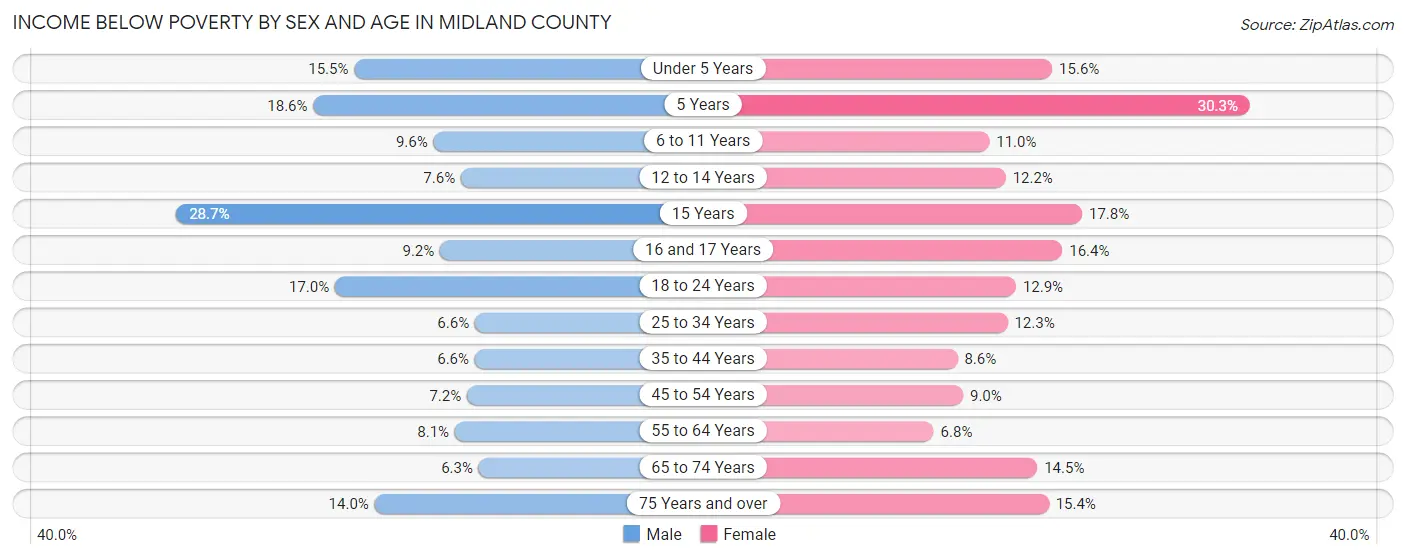
Income Below Poverty by Sex and Age in Midland County
With 9.7% poverty level for males and 11.9% for females among the residents of Midland County, 15 year old males and 5 year old females are the most vulnerable to poverty, with 375 males (28.7%) and 414 females (30.3%) in their respective age groups living below the poverty level.
| Age Bracket | Male | Female |
| Under 5 Years | 1,157 (15.5%) | 1,015 (15.6%) |
| 5 Years | 302 (18.6%) | 414 (30.3%) |
| 6 to 11 Years | 829 (9.6%) | 857 (11.0%) |
| 12 to 14 Years | 279 (7.6%) | 505 (12.2%) |
| 15 Years | 375 (28.7%) | 167 (17.8%) |
| 16 and 17 Years | 219 (9.1%) | 416 (16.4%) |
| 18 to 24 Years | 1,304 (17.0%) | 905 (12.9%) |
| 25 to 34 Years | 968 (6.6%) | 1,717 (12.3%) |
| 35 to 44 Years | 884 (6.6%) | 991 (8.6%) |
| 45 to 54 Years | 630 (7.1%) | 750 (9.0%) |
| 55 to 64 Years | 664 (8.1%) | 567 (6.8%) |
| 65 to 74 Years | 303 (6.3%) | 796 (14.5%) |
| 75 Years and over | 374 (14.0%) | 632 (15.4%) |
| Total | 8,288 (9.7%) | 9,732 (11.9%) |
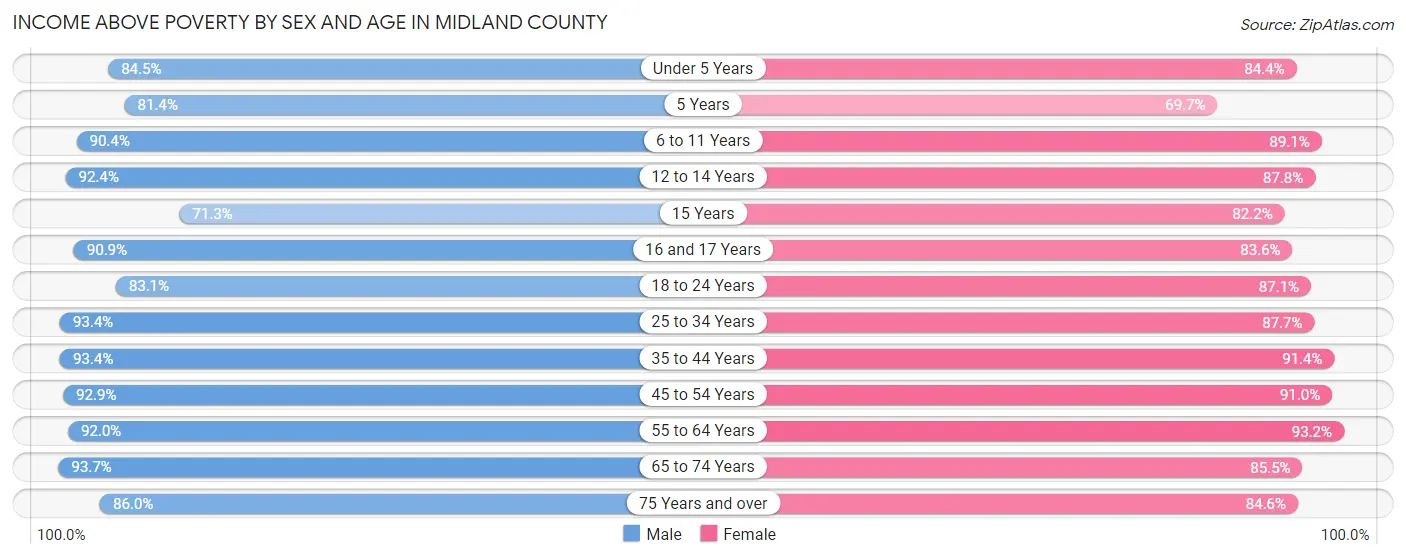
Income Above Poverty by Sex and Age in Midland County
According to the poverty statistics in Midland County, males aged 65 to 74 years and females aged 55 to 64 years are the age groups that are most secure financially, with 93.7% of males and 93.2% of females in these age groups living above the poverty line.
| Age Bracket | Male | Female |
| Under 5 Years | 6,298 (84.5%) | 5,484 (84.4%) |
| 5 Years | 1,325 (81.4%) | 953 (69.7%) |
| 6 to 11 Years | 7,774 (90.4%) | 6,967 (89.0%) |
| 12 to 14 Years | 3,392 (92.4%) | 3,644 (87.8%) |
| 15 Years | 930 (71.3%) | 769 (82.2%) |
| 16 and 17 Years | 2,175 (90.8%) | 2,125 (83.6%) |
| 18 to 24 Years | 6,388 (83.1%) | 6,095 (87.1%) |
| 25 to 34 Years | 13,794 (93.4%) | 12,239 (87.7%) |
| 35 to 44 Years | 12,580 (93.4%) | 10,549 (91.4%) |
| 45 to 54 Years | 8,178 (92.8%) | 7,583 (91.0%) |
| 55 to 64 Years | 7,581 (91.9%) | 7,751 (93.2%) |
| 65 to 74 Years | 4,524 (93.7%) | 4,690 (85.5%) |
| 75 Years and over | 2,296 (86.0%) | 3,483 (84.6%) |
| Total | 77,235 (90.3%) | 72,332 (88.1%) |
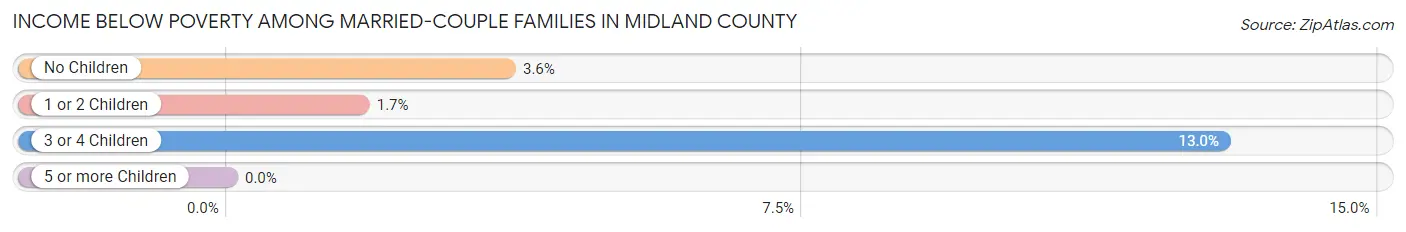
Income Below Poverty Among Married-Couple Families in Midland County
The poverty statistics for married-couple families in Midland County show that 4.1% or 1,344 of the total 32,930 families live below the poverty line. Families with 3 or 4 children have the highest poverty rate of 13.0%, comprising of 578 families. On the other hand, families with 5 or more children have the lowest poverty rate of 0.0%, which includes 0 families.
| Children | Above Poverty | Below Poverty |
| No Children | 13,983 (96.4%) | 527 (3.6%) |
| 1 or 2 Children | 13,676 (98.3%) | 239 (1.7%) |
| 3 or 4 Children | 3,881 (87.0%) | 578 (13.0%) |
| 5 or more Children | 46 (100.0%) | 0 (0.0%) |
| Total | 31,586 (95.9%) | 1,344 (4.1%) |
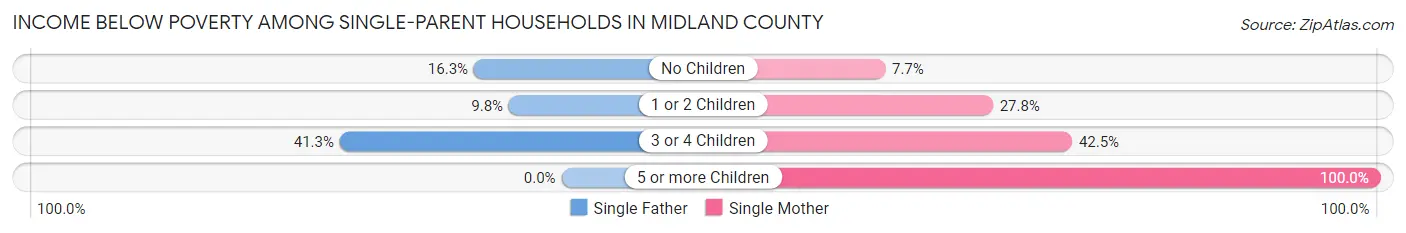
Income Below Poverty Among Single-Parent Households in Midland County
According to the poverty data in Midland County, 13.4% or 538 single-father households and 25.2% or 1,749 single-mother households are living below the poverty line. Among single-father households, those with 3 or 4 children have the highest poverty rate, with 83 households (41.3%) experiencing poverty. Likewise, among single-mother households, those with 5 or more children have the highest poverty rate, with 14 households (100.0%) falling below the poverty line.
| Children | Single Father | Single Mother |
| No Children | 218 (16.3%) | 127 (7.7%) |
| 1 or 2 Children | 237 (9.8%) | 1,199 (27.8%) |
| 3 or 4 Children | 83 (41.3%) | 409 (42.5%) |
| 5 or more Children | 0 (0.0%) | 14 (100.0%) |
| Total | 538 (13.4%) | 1,749 (25.2%) |
Income Below Poverty Among Married-Couple vs Single-Parent Households in Midland County
The poverty data for Midland County shows that 1,344 of the married-couple family households (4.1%) and 2,287 of the single-parent households (20.9%) are living below the poverty level. Within the married-couple family households, those with 3 or 4 children have the highest poverty rate, with 578 households (13.0%) falling below the poverty line. Among the single-parent households, those with 3 or 4 children have the highest poverty rate, with 492 household (42.3%) living below poverty.
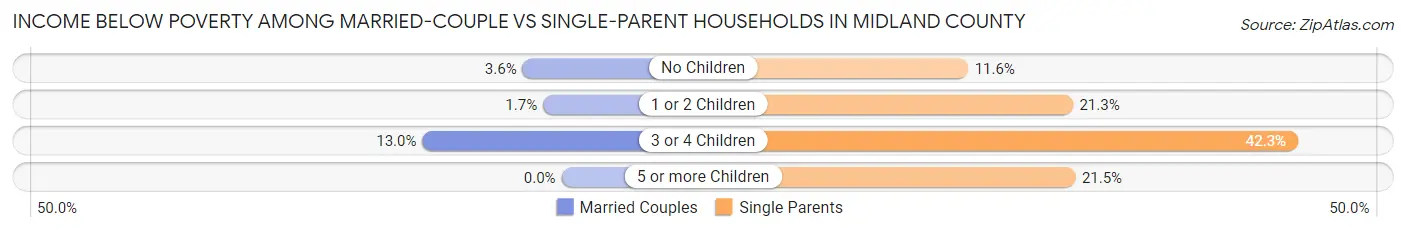
| Children | Married-Couple Families | Single-Parent Households |
| No Children | 527 (3.6%) | 345 (11.6%) |
| 1 or 2 Children | 239 (1.7%) | 1,436 (21.3%) |
| 3 or 4 Children | 578 (13.0%) | 492 (42.3%) |
| 5 or more Children | 0 (0.0%) | 14 (21.5%) |
| Total | 1,344 (4.1%) | 2,287 (20.9%) |
Employment Characteristics in Midland County
Employment by Class of Employer in Midland County
Among the 85,072 employed individuals in Midland County, private company employees (61,196 | 71.9%), not-for-profit organizations (5,708 | 6.7%), and self-employed (not incorporated) (5,674 | 6.7%) make up the most common classes of employment.
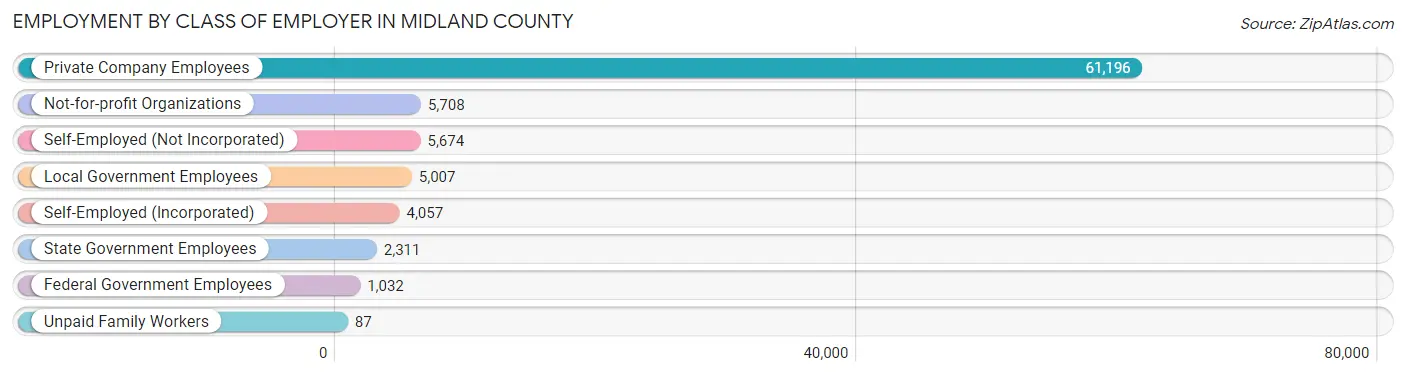
| Employer Class | # Employees | % Employees |
| Private Company Employees | 61,196 | 71.9% |
| Self-Employed (Incorporated) | 4,057 | 4.8% |
| Self-Employed (Not Incorporated) | 5,674 | 6.7% |
| Not-for-profit Organizations | 5,708 | 6.7% |
| Local Government Employees | 5,007 | 5.9% |
| State Government Employees | 2,311 | 2.7% |
| Federal Government Employees | 1,032 | 1.2% |
| Unpaid Family Workers | 87 | 0.1% |
| Total | 85,072 | 100.0% |
Employment Status by Age in Midland County
According to the labor force statistics for Midland County, out of the total population over 16 years of age (125,423), 71.2% or 89,301 individuals are in the labor force, with 3.4% or 3,036 of them unemployed. The age group with the highest labor force participation rate is 35 to 44 years, with 85.9% or 21,589 individuals in the labor force. Within the labor force, the 16 to 19 years age range has the highest percentage of unemployed individuals, with 7.2% or 259 of them being unemployed.
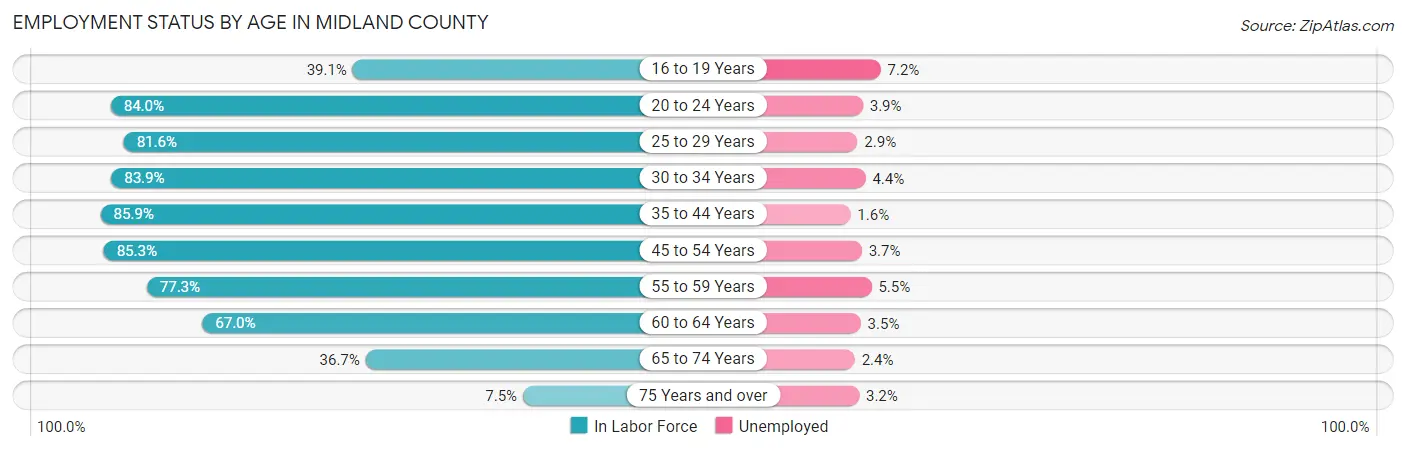
| Age Bracket | In Labor Force | Unemployed |
| 16 to 19 Years | 3,596 (39.1%) | 259 (7.2%) |
| 20 to 24 Years | 9,040 (84.0%) | 353 (3.9%) |
| 25 to 29 Years | 11,661 (81.6%) | 338 (2.9%) |
| 30 to 34 Years | 12,296 (83.9%) | 541 (4.4%) |
| 35 to 44 Years | 21,589 (85.9%) | 345 (1.6%) |
| 45 to 54 Years | 14,706 (85.3%) | 544 (3.7%) |
| 55 to 59 Years | 6,536 (77.3%) | 359 (5.5%) |
| 60 to 64 Years | 5,551 (67.0%) | 194 (3.5%) |
| 65 to 74 Years | 3,810 (36.7%) | 91 (2.4%) |
| 75 Years and over | 527 (7.5%) | 17 (3.2%) |
| Total | 89,301 (71.2%) | 3,036 (3.4%) |
Employment Status by Educational Attainment in Midland County
According to labor force statistics for Midland County, 82.2% of individuals (72,385) out of the total population between 25 and 64 years of age (88,060) are in the labor force, with 3.2% or 2,316 of them being unemployed. The group with the highest labor force participation rate are those with the educational attainment of bachelor's degree or higher, with 86.4% or 22,918 individuals in the labor force. Within the labor force, individuals with less than high school education have the highest percentage of unemployment, with 5.6% or 570 of them being unemployed.
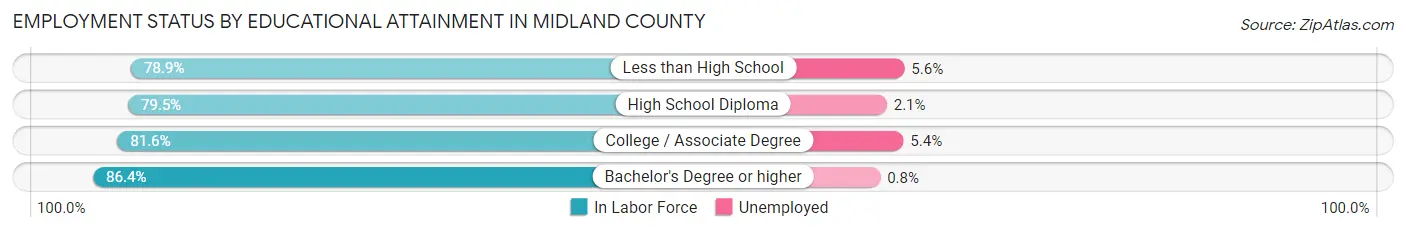
| Educational Attainment | In Labor Force | Unemployed |
| Less than High School | 10,182 (78.9%) | 723 (5.6%) |
| High School Diploma | 16,530 (79.5%) | 437 (2.1%) |
| College / Associate Degree | 22,716 (81.6%) | 1,503 (5.4%) |
| Bachelor's Degree or higher | 22,918 (86.4%) | 212 (0.8%) |
| Total | 72,385 (82.2%) | 2,818 (3.2%) |
Employment Occupations by Sex in Midland County
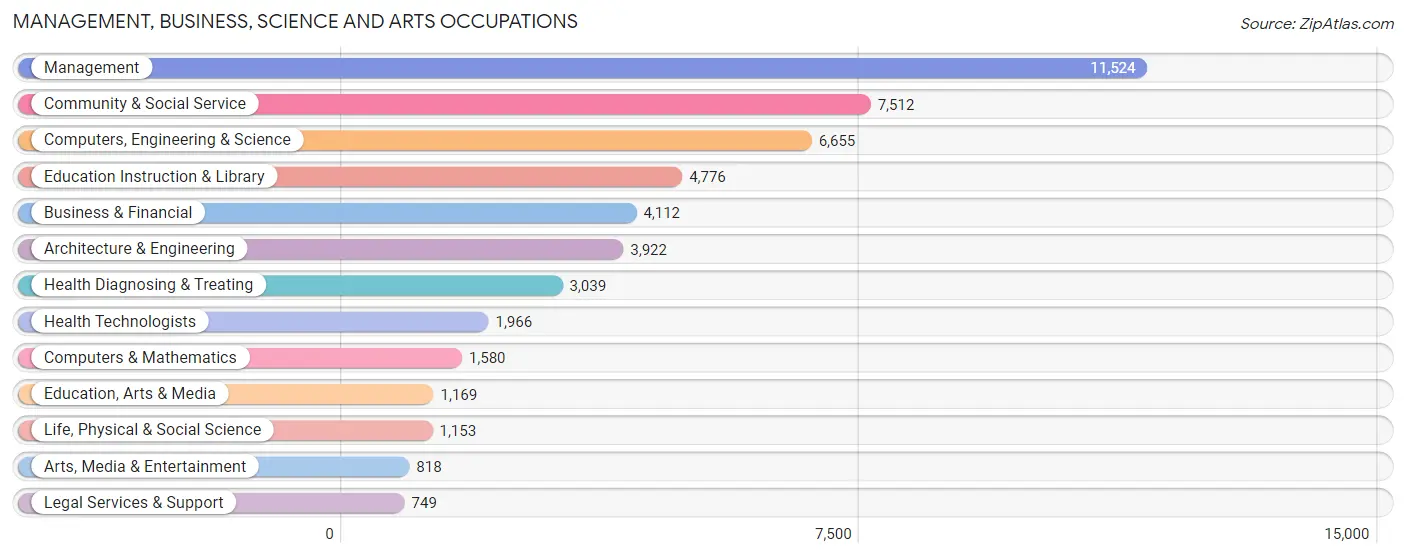
Management, Business, Science and Arts Occupations
The most common Management, Business, Science and Arts occupations in Midland County are Management (11,524 | 13.4%), Community & Social Service (7,512 | 8.7%), Computers, Engineering & Science (6,655 | 7.7%), Education Instruction & Library (4,776 | 5.6%), and Business & Financial (4,112 | 4.8%).
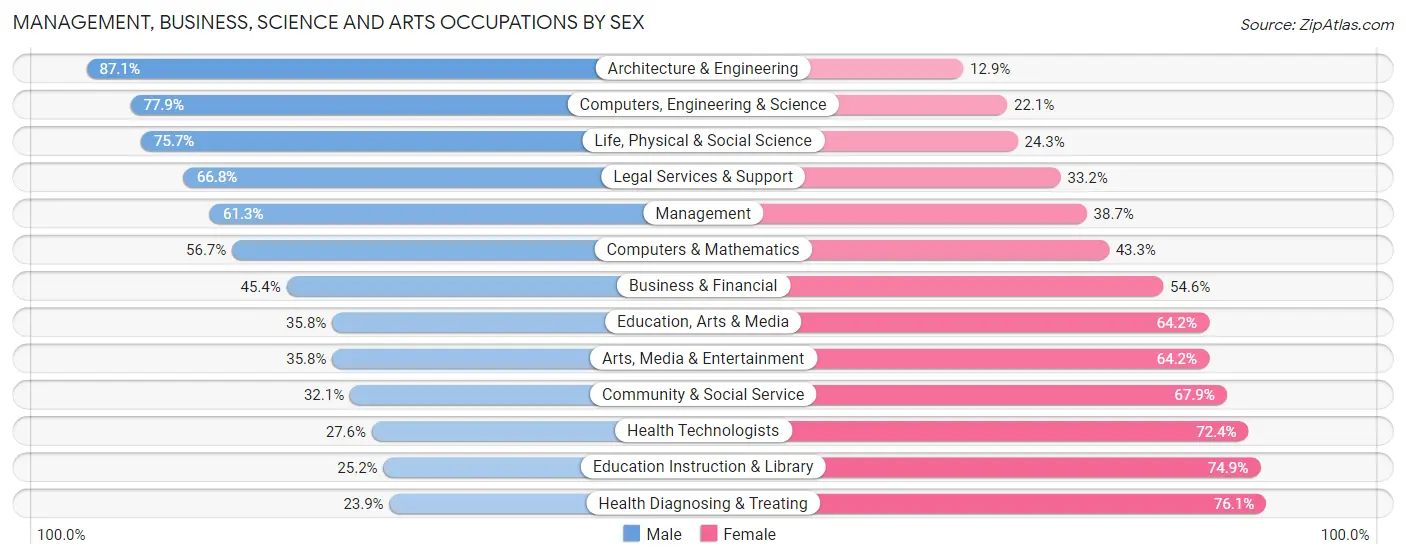
Management, Business, Science and Arts Occupations by Sex
Within the Management, Business, Science and Arts occupations in Midland County, the most male-oriented occupations are Architecture & Engineering (87.1%), Computers, Engineering & Science (77.9%), and Life, Physical & Social Science (75.7%), while the most female-oriented occupations are Health Diagnosing & Treating (76.1%), Education Instruction & Library (74.9%), and Health Technologists (72.4%).
| Occupation | Male | Female |
| Management | 7,065 (61.3%) | 4,459 (38.7%) |
| Business & Financial | 1,865 (45.4%) | 2,247 (54.6%) |
| Computers, Engineering & Science | 5,184 (77.9%) | 1,471 (22.1%) |
| Computers & Mathematics | 896 (56.7%) | 684 (43.3%) |
| Architecture & Engineering | 3,415 (87.1%) | 507 (12.9%) |
| Life, Physical & Social Science | 873 (75.7%) | 280 (24.3%) |
| Community & Social Service | 2,413 (32.1%) | 5,099 (67.9%) |
| Education, Arts & Media | 419 (35.8%) | 750 (64.2%) |
| Legal Services & Support | 500 (66.8%) | 249 (33.2%) |
| Education Instruction & Library | 1,201 (25.2%) | 3,575 (74.9%) |
| Arts, Media & Entertainment | 293 (35.8%) | 525 (64.2%) |
| Health Diagnosing & Treating | 726 (23.9%) | 2,313 (76.1%) |
| Health Technologists | 542 (27.6%) | 1,424 (72.4%) |
| Total (Category) | 17,253 (52.5%) | 15,589 (47.5%) |
| Total (Overall) | 49,811 (58.0%) | 36,097 (42.0%) |
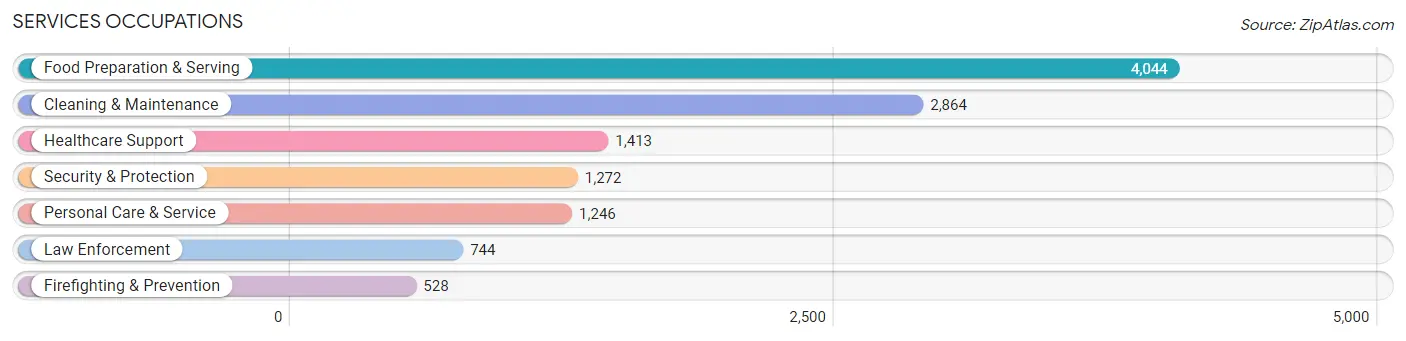
Services Occupations
The most common Services occupations in Midland County are Food Preparation & Serving (4,044 | 4.7%), Cleaning & Maintenance (2,864 | 3.3%), Healthcare Support (1,413 | 1.6%), Security & Protection (1,272 | 1.5%), and Personal Care & Service (1,246 | 1.5%).
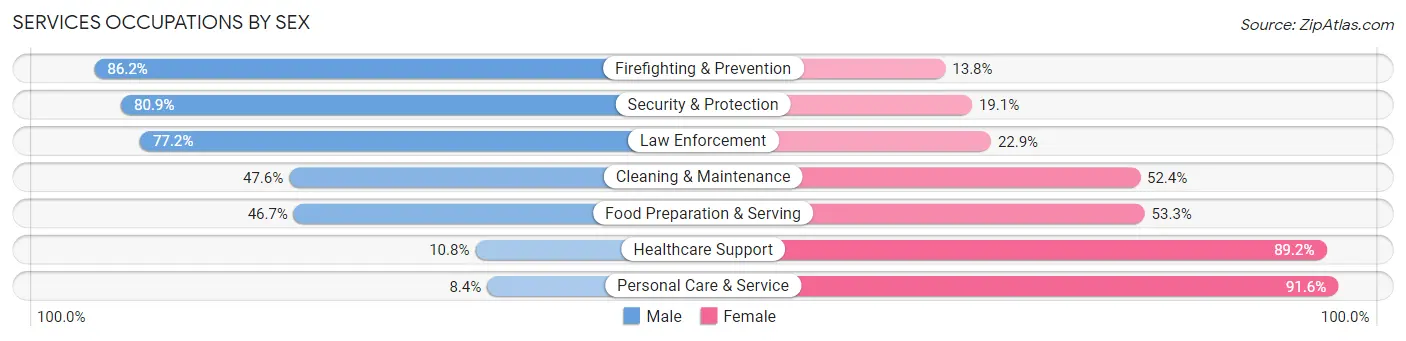
Services Occupations by Sex
Within the Services occupations in Midland County, the most male-oriented occupations are Firefighting & Prevention (86.2%), Security & Protection (80.9%), and Law Enforcement (77.1%), while the most female-oriented occupations are Personal Care & Service (91.6%), Healthcare Support (89.2%), and Food Preparation & Serving (53.3%).
| Occupation | Male | Female |
| Healthcare Support | 152 (10.8%) | 1,261 (89.2%) |
| Security & Protection | 1,029 (80.9%) | 243 (19.1%) |
| Firefighting & Prevention | 455 (86.2%) | 73 (13.8%) |
| Law Enforcement | 574 (77.1%) | 170 (22.9%) |
| Food Preparation & Serving | 1,889 (46.7%) | 2,155 (53.3%) |
| Cleaning & Maintenance | 1,364 (47.6%) | 1,500 (52.4%) |
| Personal Care & Service | 105 (8.4%) | 1,141 (91.6%) |
| Total (Category) | 4,539 (41.9%) | 6,300 (58.1%) |
| Total (Overall) | 49,811 (58.0%) | 36,097 (42.0%) |
Sales and Office Occupations
The most common Sales and Office occupations in Midland County are Sales & Related (10,457 | 12.2%), and Office & Administration (8,631 | 10.1%).

Sales and Office Occupations by Sex
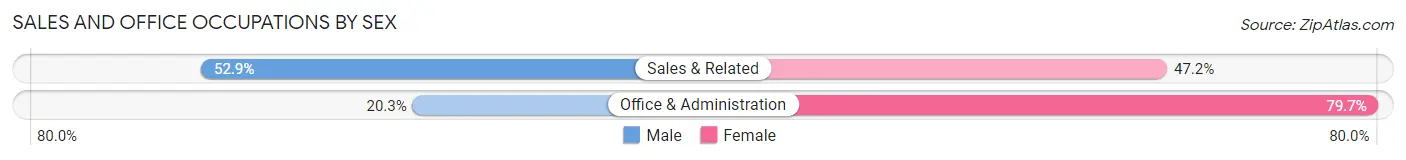
| Occupation | Male | Female |
| Sales & Related | 5,527 (52.8%) | 4,930 (47.1%) |
| Office & Administration | 1,753 (20.3%) | 6,878 (79.7%) |
| Total (Category) | 7,280 (38.1%) | 11,808 (61.9%) |
| Total (Overall) | 49,811 (58.0%) | 36,097 (42.0%) |
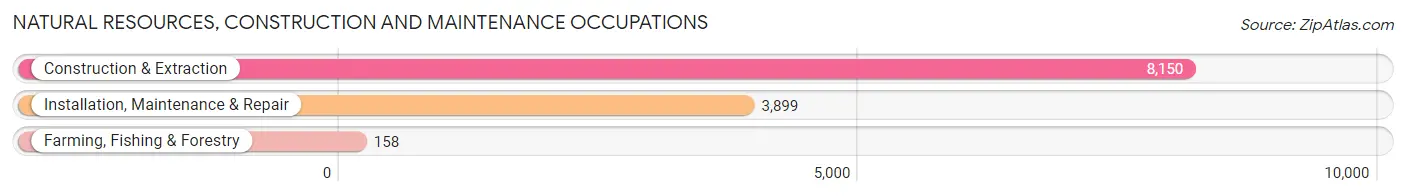
Natural Resources, Construction and Maintenance Occupations
The most common Natural Resources, Construction and Maintenance occupations in Midland County are Construction & Extraction (8,150 | 9.5%), Installation, Maintenance & Repair (3,899 | 4.5%), and Farming, Fishing & Forestry (158 | 0.2%).
Natural Resources, Construction and Maintenance Occupations by Sex
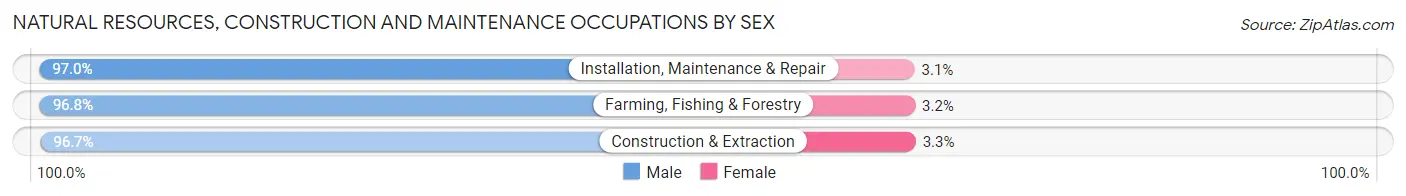
| Occupation | Male | Female |
| Farming, Fishing & Forestry | 153 (96.8%) | 5 (3.2%) |
| Construction & Extraction | 7,883 (96.7%) | 267 (3.3%) |
| Installation, Maintenance & Repair | 3,780 (97.0%) | 119 (3.0%) |
| Total (Category) | 11,816 (96.8%) | 391 (3.2%) |
| Total (Overall) | 49,811 (58.0%) | 36,097 (42.0%) |
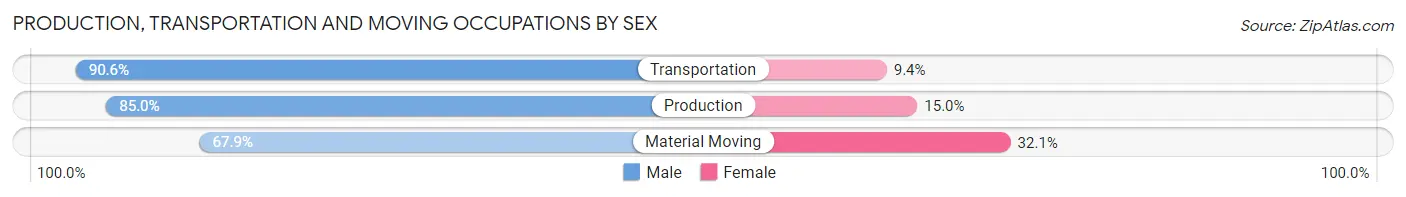
Production, Transportation and Moving Occupations
The most common Production, Transportation and Moving occupations in Midland County are Production (4,390 | 5.1%), Transportation (3,308 | 3.8%), and Material Moving (3,234 | 3.8%).
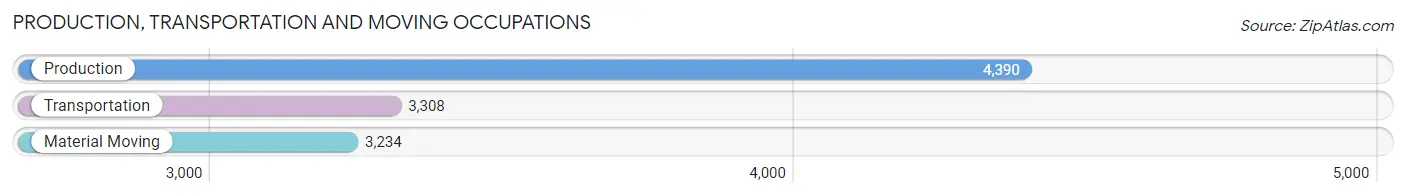
Production, Transportation and Moving Occupations by Sex
| Occupation | Male | Female |
| Production | 3,731 (85.0%) | 659 (15.0%) |
| Transportation | 2,997 (90.6%) | 311 (9.4%) |
| Material Moving | 2,195 (67.9%) | 1,039 (32.1%) |
| Total (Category) | 8,923 (81.6%) | 2,009 (18.4%) |
| Total (Overall) | 49,811 (58.0%) | 36,097 (42.0%) |
Employment Industries by Sex in Midland County
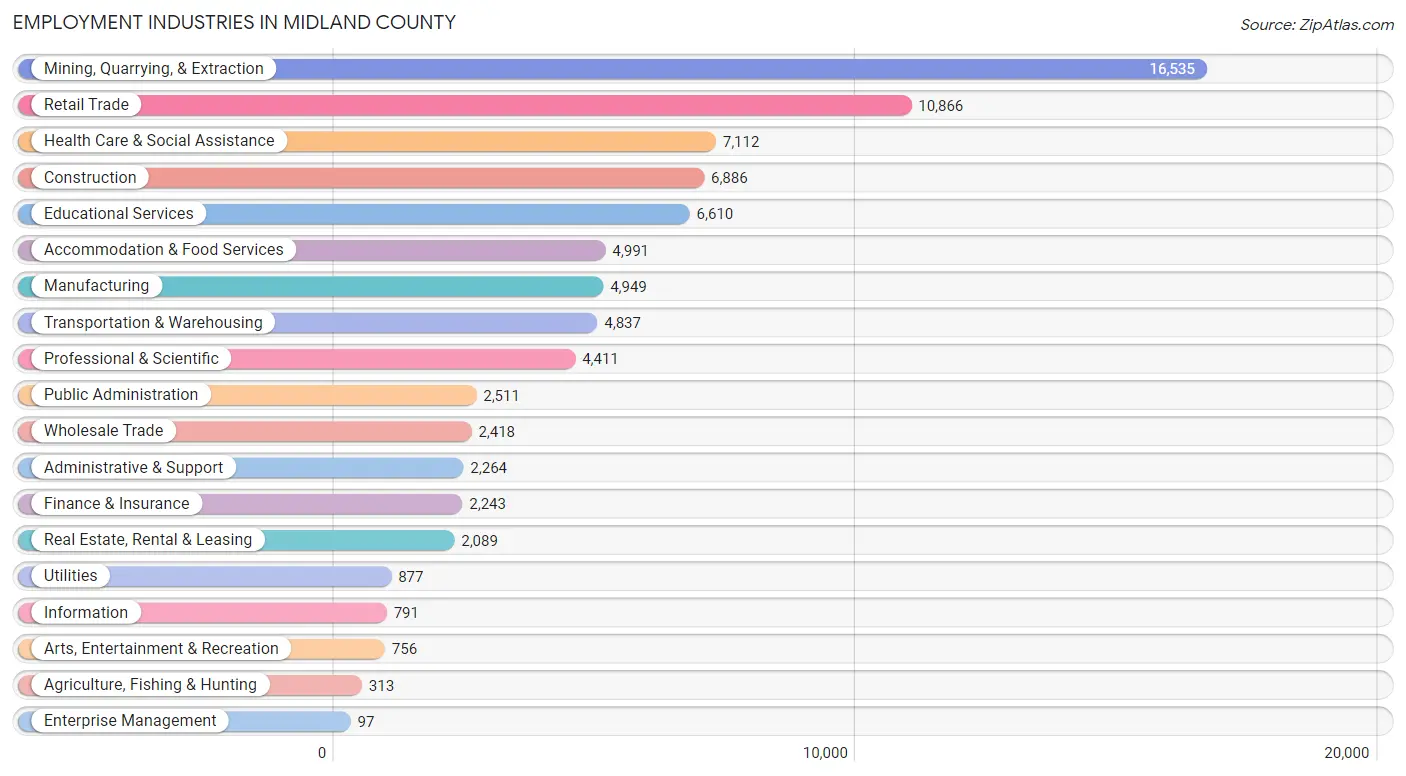
Employment Industries in Midland County
The major employment industries in Midland County include Mining, Quarrying, & Extraction (16,535 | 19.3%), Retail Trade (10,866 | 12.7%), Health Care & Social Assistance (7,112 | 8.3%), Construction (6,886 | 8.0%), and Educational Services (6,610 | 7.7%).
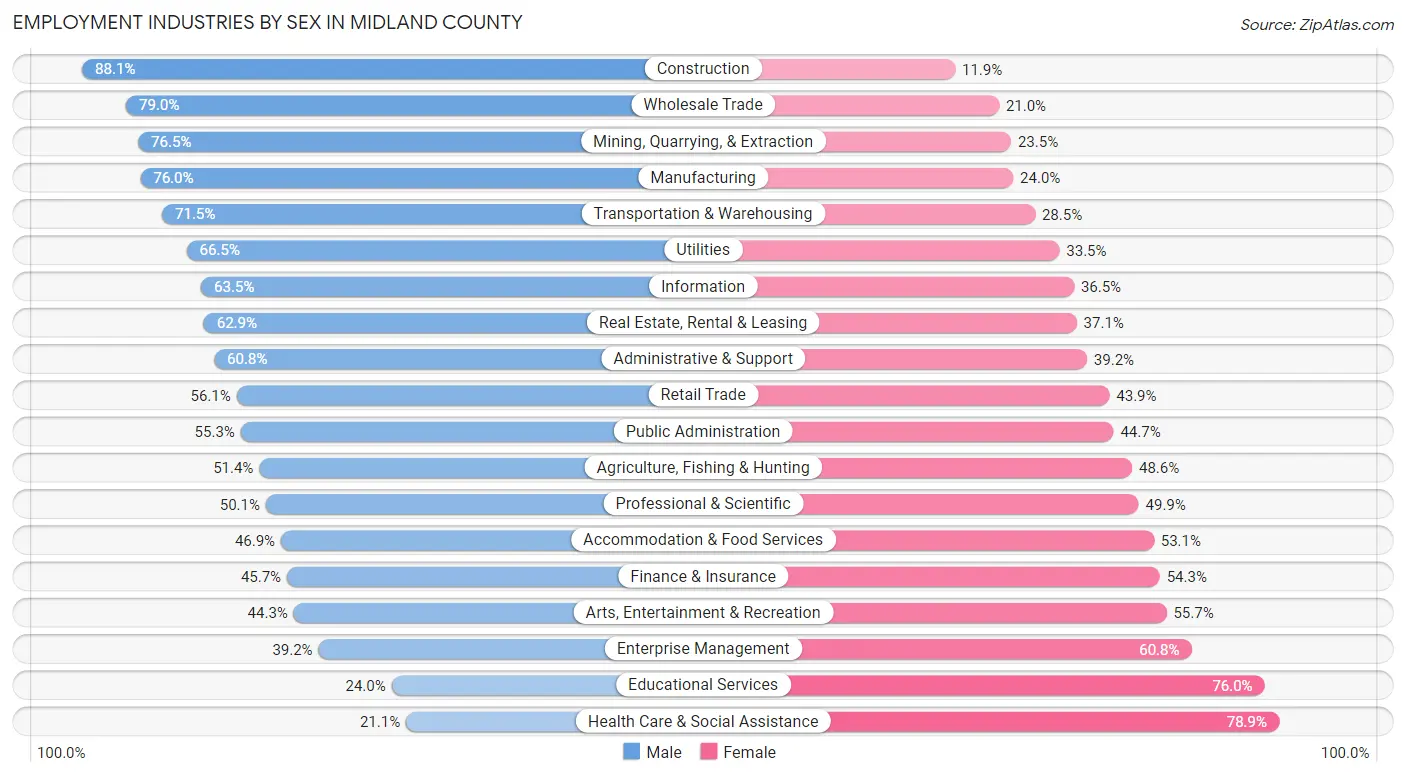
Employment Industries by Sex in Midland County
The Midland County industries that see more men than women are Construction (88.1%), Wholesale Trade (79.0%), and Mining, Quarrying, & Extraction (76.5%), whereas the industries that tend to have a higher number of women are Health Care & Social Assistance (78.9%), Educational Services (76.0%), and Enterprise Management (60.8%).
| Industry | Male | Female |
| Agriculture, Fishing & Hunting | 161 (51.4%) | 152 (48.6%) |
| Mining, Quarrying, & Extraction | 12,647 (76.5%) | 3,888 (23.5%) |
| Construction | 6,065 (88.1%) | 821 (11.9%) |
| Manufacturing | 3,763 (76.0%) | 1,186 (24.0%) |
| Wholesale Trade | 1,910 (79.0%) | 508 (21.0%) |
| Retail Trade | 6,099 (56.1%) | 4,767 (43.9%) |
| Transportation & Warehousing | 3,460 (71.5%) | 1,377 (28.5%) |
| Utilities | 583 (66.5%) | 294 (33.5%) |
| Information | 502 (63.5%) | 289 (36.5%) |
| Finance & Insurance | 1,025 (45.7%) | 1,218 (54.3%) |
| Real Estate, Rental & Leasing | 1,314 (62.9%) | 775 (37.1%) |
| Professional & Scientific | 2,209 (50.1%) | 2,202 (49.9%) |
| Enterprise Management | 38 (39.2%) | 59 (60.8%) |
| Administrative & Support | 1,376 (60.8%) | 888 (39.2%) |
| Educational Services | 1,589 (24.0%) | 5,021 (76.0%) |
| Health Care & Social Assistance | 1,498 (21.1%) | 5,614 (78.9%) |
| Arts, Entertainment & Recreation | 335 (44.3%) | 421 (55.7%) |
| Accommodation & Food Services | 2,343 (46.9%) | 2,648 (53.1%) |
| Public Administration | 1,388 (55.3%) | 1,123 (44.7%) |
| Total | 49,811 (58.0%) | 36,097 (42.0%) |
Education in Midland County
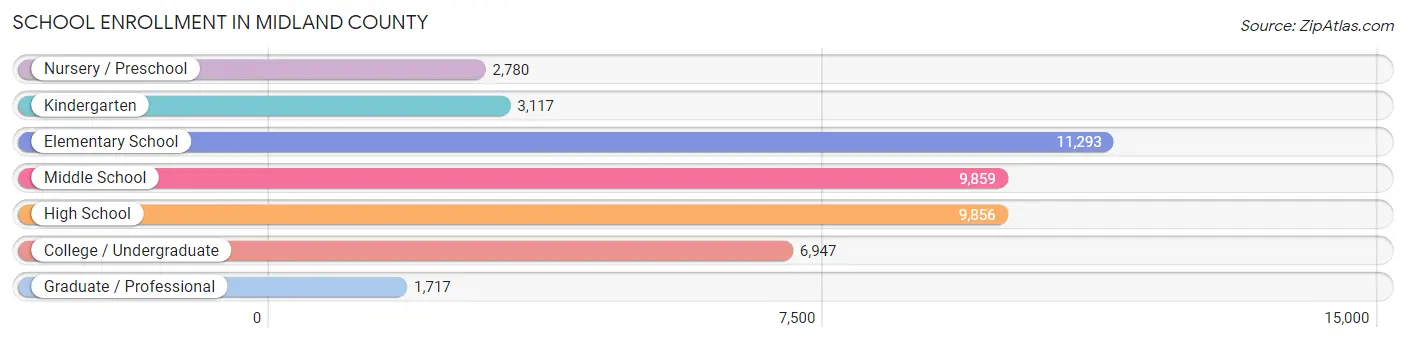
School Enrollment in Midland County
The most common levels of schooling among the 45,569 students in Midland County are elementary school (11,293 | 24.8%), middle school (9,859 | 21.6%), and high school (9,856 | 21.6%).
| School Level | # Students | % Students |
| Nursery / Preschool | 2,780 | 6.1% |
| Kindergarten | 3,117 | 6.8% |
| Elementary School | 11,293 | 24.8% |
| Middle School | 9,859 | 21.6% |
| High School | 9,856 | 21.6% |
| College / Undergraduate | 6,947 | 15.2% |
| Graduate / Professional | 1,717 | 3.8% |
| Total | 45,569 | 100.0% |
School Enrollment by Age by Funding Source in Midland County
Out of a total of 45,569 students who are enrolled in schools in Midland County, 8,248 (18.1%) attend a private institution, while the remaining 37,321 (81.9%) are enrolled in public schools. The age group of 3 to 4 year olds has the highest likelihood of being enrolled in private schools, with 759 (41.9% in the age bracket) enrolled. Conversely, the age group of 25 to 34 year olds has the lowest likelihood of being enrolled in a private school, with 2,447 (89.9% in the age bracket) attending a public institution.
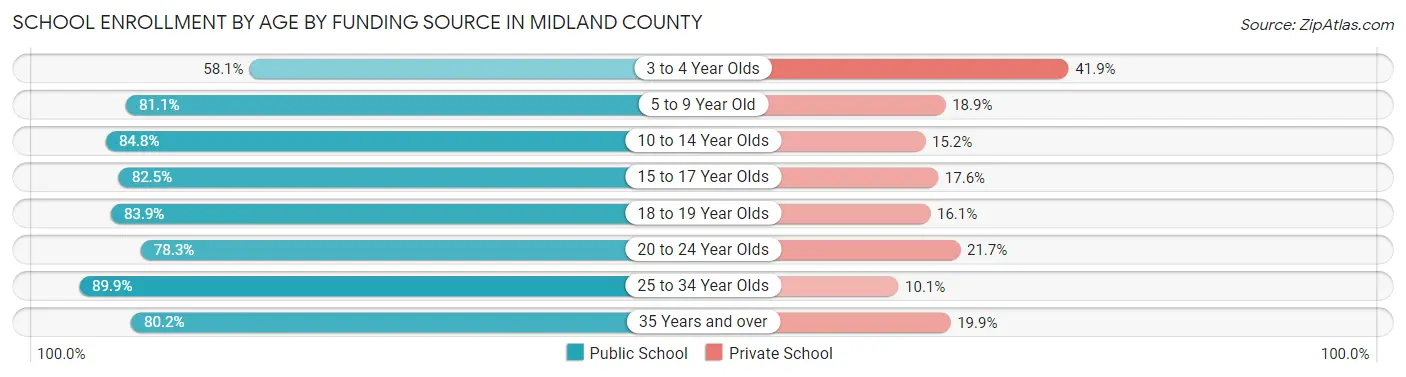
| Age Bracket | Public School | Private School |
| 3 to 4 Year Olds | 1,054 (58.1%) | 759 (41.9%) |
| 5 to 9 Year Old | 11,225 (81.1%) | 2,619 (18.9%) |
| 10 to 14 Year Olds | 10,837 (84.8%) | 1,938 (15.2%) |
| 15 to 17 Year Olds | 5,782 (82.5%) | 1,231 (17.5%) |
| 18 to 19 Year Olds | 2,091 (83.9%) | 401 (16.1%) |
| 20 to 24 Year Olds | 2,255 (78.3%) | 624 (21.7%) |
| 25 to 34 Year Olds | 2,447 (89.9%) | 276 (10.1%) |
| 35 Years and over | 1,627 (80.1%) | 403 (19.9%) |
| Total | 37,321 (81.9%) | 8,248 (18.1%) |
Educational Attainment by Field of Study in Midland County
Business (7,691 | 23.4%), engineering (4,406 | 13.4%), education (4,224 | 12.9%), science & technology (3,022 | 9.2%), and arts & humanities (1,948 | 5.9%) are the most common fields of study among 32,819 individuals in Midland County who have obtained a bachelor's degree or higher.
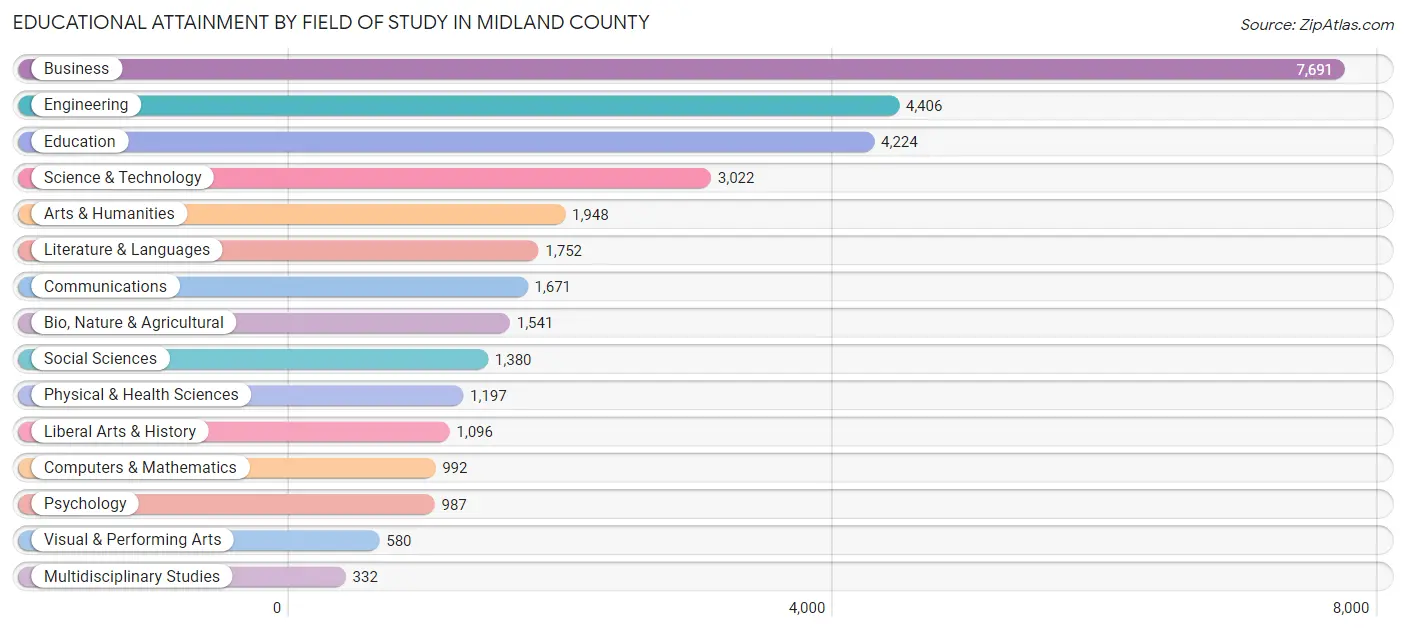
| Field of Study | # Graduates | % Graduates |
| Computers & Mathematics | 992 | 3.0% |
| Bio, Nature & Agricultural | 1,541 | 4.7% |
| Physical & Health Sciences | 1,197 | 3.6% |
| Psychology | 987 | 3.0% |
| Social Sciences | 1,380 | 4.2% |
| Engineering | 4,406 | 13.4% |
| Multidisciplinary Studies | 332 | 1.0% |
| Science & Technology | 3,022 | 9.2% |
| Business | 7,691 | 23.4% |
| Education | 4,224 | 12.9% |
| Literature & Languages | 1,752 | 5.3% |
| Liberal Arts & History | 1,096 | 3.3% |
| Visual & Performing Arts | 580 | 1.8% |
| Communications | 1,671 | 5.1% |
| Arts & Humanities | 1,948 | 5.9% |
| Total | 32,819 | 100.0% |
Transportation & Commute in Midland County
Vehicle Availability by Sex in Midland County
The most prevalent vehicle ownership categories in Midland County are males with 2 vehicles (20,526, accounting for 41.4%) and females with 2 vehicles (14,369, making up 58.1%).
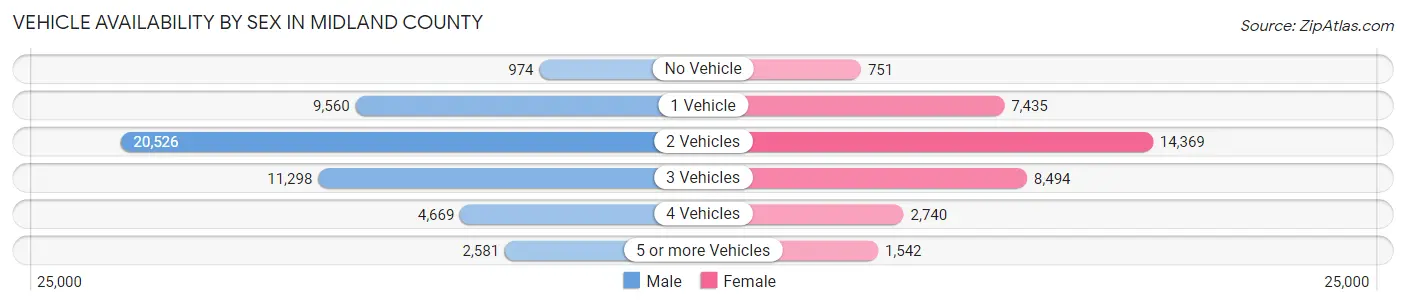
| Vehicles Available | Male | Female |
| No Vehicle | 974 (2.0%) | 751 (2.1%) |
| 1 Vehicle | 9,560 (19.3%) | 7,435 (21.0%) |
| 2 Vehicles | 20,526 (41.4%) | 14,369 (40.7%) |
| 3 Vehicles | 11,298 (22.8%) | 8,494 (24.0%) |
| 4 Vehicles | 4,669 (9.4%) | 2,740 (7.8%) |
| 5 or more Vehicles | 2,581 (5.2%) | 1,542 (4.4%) |
| Total | 49,608 (100.0%) | 35,331 (100.0%) |
Commute Time in Midland County
The most frequently occuring commute durations in Midland County are 15 to 19 minutes (17,961 commuters, 22.3%), 10 to 14 minutes (16,620 commuters, 20.7%), and 20 to 24 minutes (12,602 commuters, 15.7%).
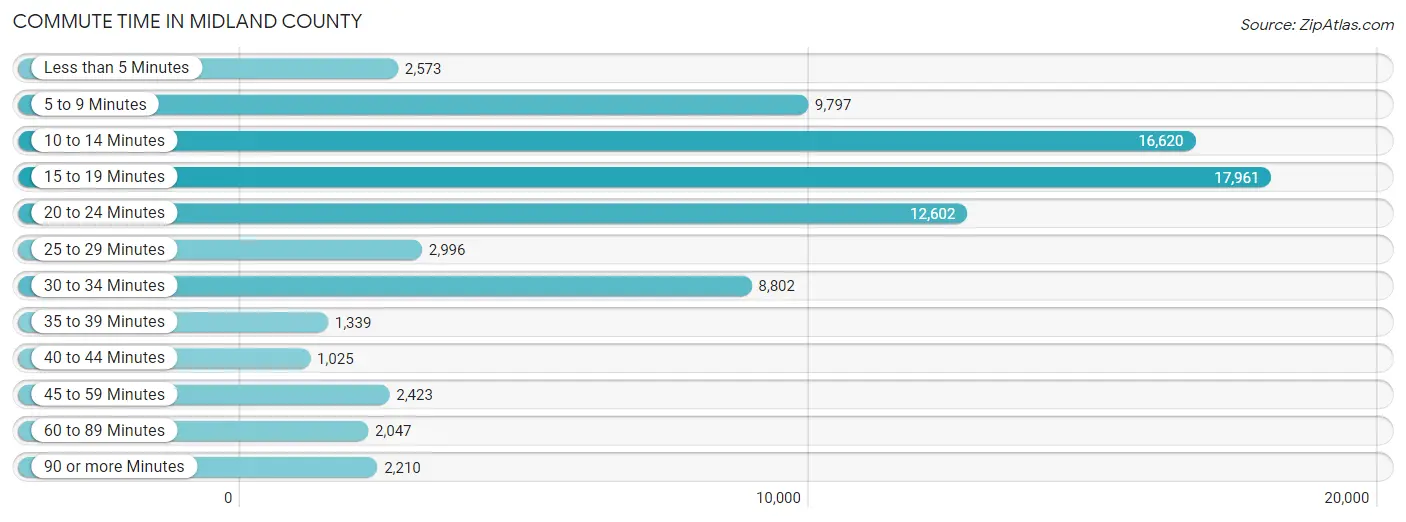
| Commute Time | # Commuters | % Commuters |
| Less than 5 Minutes | 2,573 | 3.2% |
| 5 to 9 Minutes | 9,797 | 12.2% |
| 10 to 14 Minutes | 16,620 | 20.7% |
| 15 to 19 Minutes | 17,961 | 22.3% |
| 20 to 24 Minutes | 12,602 | 15.7% |
| 25 to 29 Minutes | 2,996 | 3.7% |
| 30 to 34 Minutes | 8,802 | 11.0% |
| 35 to 39 Minutes | 1,339 | 1.7% |
| 40 to 44 Minutes | 1,025 | 1.3% |
| 45 to 59 Minutes | 2,423 | 3.0% |
| 60 to 89 Minutes | 2,047 | 2.5% |
| 90 or more Minutes | 2,210 | 2.8% |
Commute Time by Sex in Midland County
The most common commute times in Midland County are 15 to 19 minutes (10,119 commuters, 21.2%) for males and 15 to 19 minutes (7,842 commuters, 23.9%) for females.
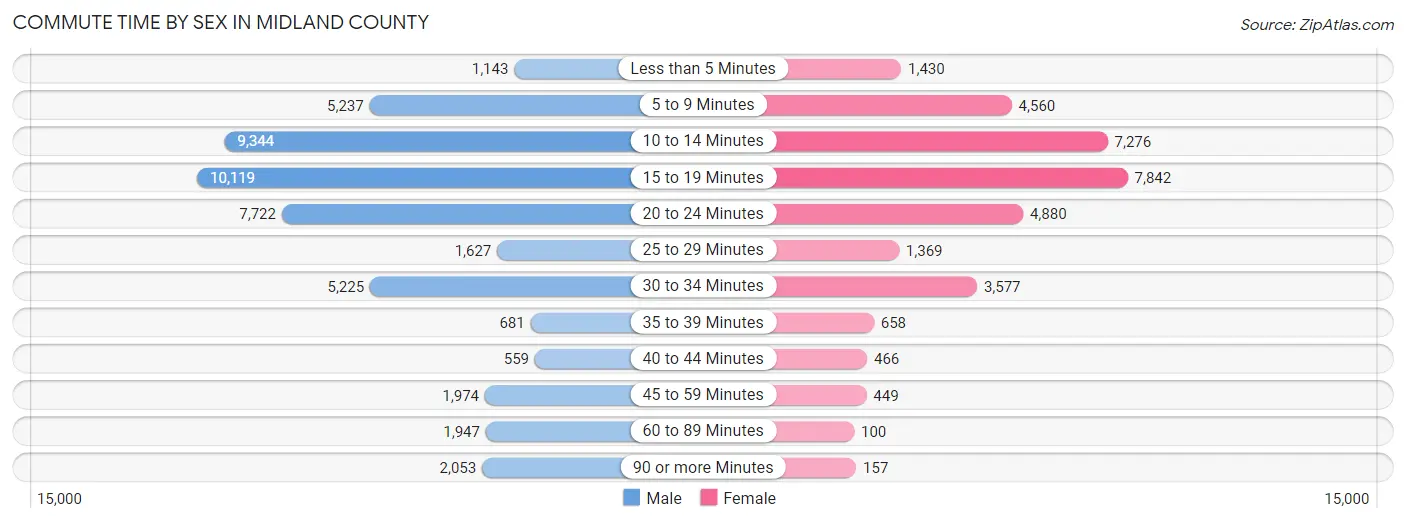
| Commute Time | Male | Female |
| Less than 5 Minutes | 1,143 (2.4%) | 1,430 (4.4%) |
| 5 to 9 Minutes | 5,237 (11.0%) | 4,560 (13.9%) |
| 10 to 14 Minutes | 9,344 (19.6%) | 7,276 (22.2%) |
| 15 to 19 Minutes | 10,119 (21.2%) | 7,842 (23.9%) |
| 20 to 24 Minutes | 7,722 (16.2%) | 4,880 (14.9%) |
| 25 to 29 Minutes | 1,627 (3.4%) | 1,369 (4.2%) |
| 30 to 34 Minutes | 5,225 (11.0%) | 3,577 (10.9%) |
| 35 to 39 Minutes | 681 (1.4%) | 658 (2.0%) |
| 40 to 44 Minutes | 559 (1.2%) | 466 (1.4%) |
| 45 to 59 Minutes | 1,974 (4.1%) | 449 (1.4%) |
| 60 to 89 Minutes | 1,947 (4.1%) | 100 (0.3%) |
| 90 or more Minutes | 2,053 (4.3%) | 157 (0.5%) |
Time of Departure to Work by Sex in Midland County
The most frequent times of departure to work in Midland County are 7:30 AM to 7:59 AM (7,793, 16.4%) for males and 7:30 AM to 7:59 AM (6,894, 21.0%) for females.
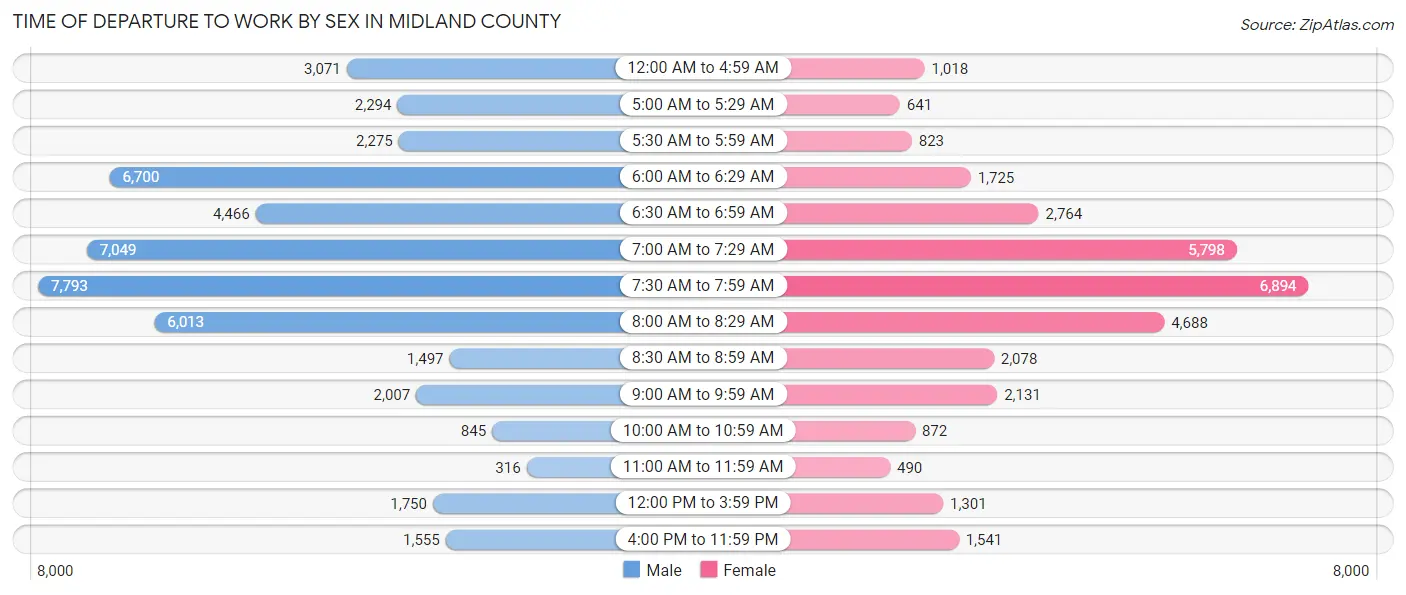
| Time of Departure | Male | Female |
| 12:00 AM to 4:59 AM | 3,071 (6.5%) | 1,018 (3.1%) |
| 5:00 AM to 5:29 AM | 2,294 (4.8%) | 641 (2.0%) |
| 5:30 AM to 5:59 AM | 2,275 (4.8%) | 823 (2.5%) |
| 6:00 AM to 6:29 AM | 6,700 (14.1%) | 1,725 (5.3%) |
| 6:30 AM to 6:59 AM | 4,466 (9.4%) | 2,764 (8.4%) |
| 7:00 AM to 7:29 AM | 7,049 (14.8%) | 5,798 (17.7%) |
| 7:30 AM to 7:59 AM | 7,793 (16.4%) | 6,894 (21.0%) |
| 8:00 AM to 8:29 AM | 6,013 (12.6%) | 4,688 (14.3%) |
| 8:30 AM to 8:59 AM | 1,497 (3.1%) | 2,078 (6.3%) |
| 9:00 AM to 9:59 AM | 2,007 (4.2%) | 2,131 (6.5%) |
| 10:00 AM to 10:59 AM | 845 (1.8%) | 872 (2.7%) |
| 11:00 AM to 11:59 AM | 316 (0.7%) | 490 (1.5%) |
| 12:00 PM to 3:59 PM | 1,750 (3.7%) | 1,301 (4.0%) |
| 4:00 PM to 11:59 PM | 1,555 (3.3%) | 1,541 (4.7%) |
| Total | 47,631 (100.0%) | 32,764 (100.0%) |
Housing Occupancy in Midland County
Occupancy by Ownership in Midland County
Of the total 65,265 dwellings in Midland County, owner-occupied units account for 43,733 (67.0%), while renter-occupied units make up 21,532 (33.0%).
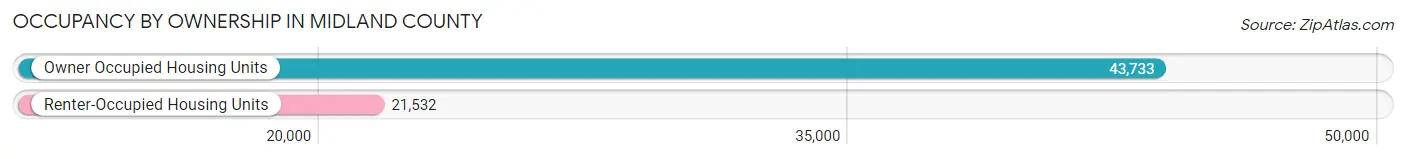
| Occupancy | # Housing Units | % Housing Units |
| Owner Occupied Housing Units | 43,733 | 67.0% |
| Renter-Occupied Housing Units | 21,532 | 33.0% |
| Total Occupied Housing Units | 65,265 | 100.0% |
Occupancy by Household Size in Midland County
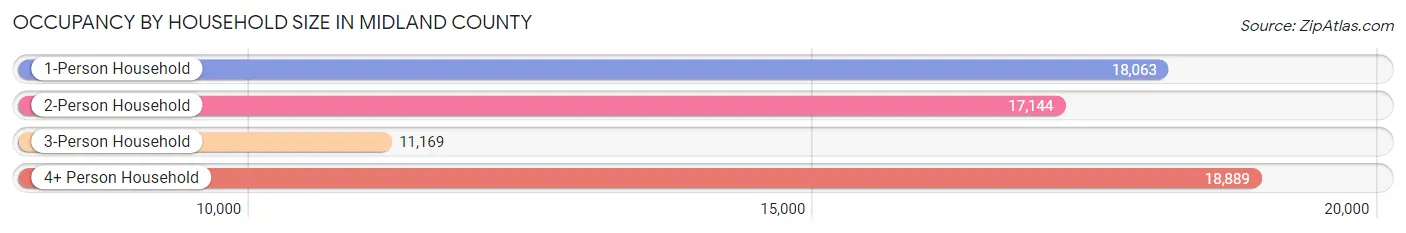
| Household Size | # Housing Units | % Housing Units |
| 1-Person Household | 18,063 | 27.7% |
| 2-Person Household | 17,144 | 26.3% |
| 3-Person Household | 11,169 | 17.1% |
| 4+ Person Household | 18,889 | 28.9% |
| Total Housing Units | 65,265 | 100.0% |
Occupancy by Ownership by Household Size in Midland County
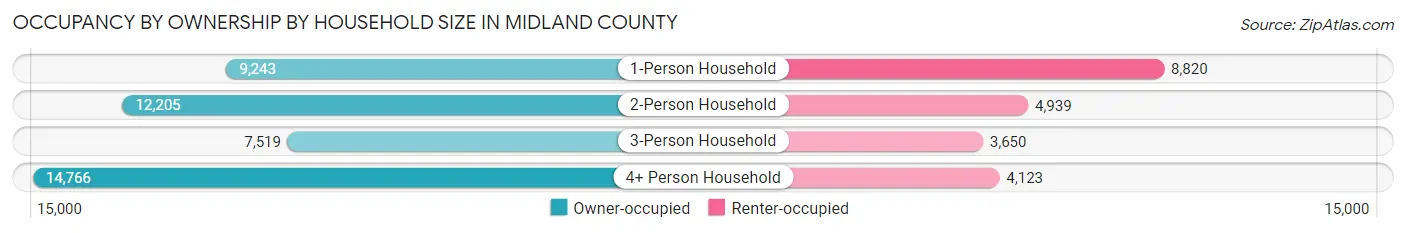
| Household Size | Owner-occupied | Renter-occupied |
| 1-Person Household | 9,243 (51.2%) | 8,820 (48.8%) |
| 2-Person Household | 12,205 (71.2%) | 4,939 (28.8%) |
| 3-Person Household | 7,519 (67.3%) | 3,650 (32.7%) |
| 4+ Person Household | 14,766 (78.2%) | 4,123 (21.8%) |
| Total Housing Units | 43,733 (67.0%) | 21,532 (33.0%) |
Occupancy by Educational Attainment in Midland County
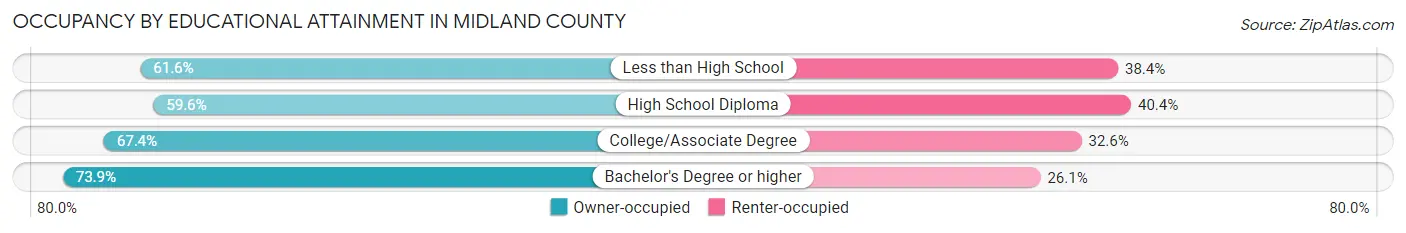
| Household Size | Owner-occupied | Renter-occupied |
| Less than High School | 5,514 (61.6%) | 3,433 (38.4%) |
| High School Diploma | 8,041 (59.6%) | 5,458 (40.4%) |
| College/Associate Degree | 15,323 (67.4%) | 7,405 (32.6%) |
| Bachelor's Degree or higher | 14,855 (73.9%) | 5,236 (26.1%) |
Occupancy by Age of Householder in Midland County
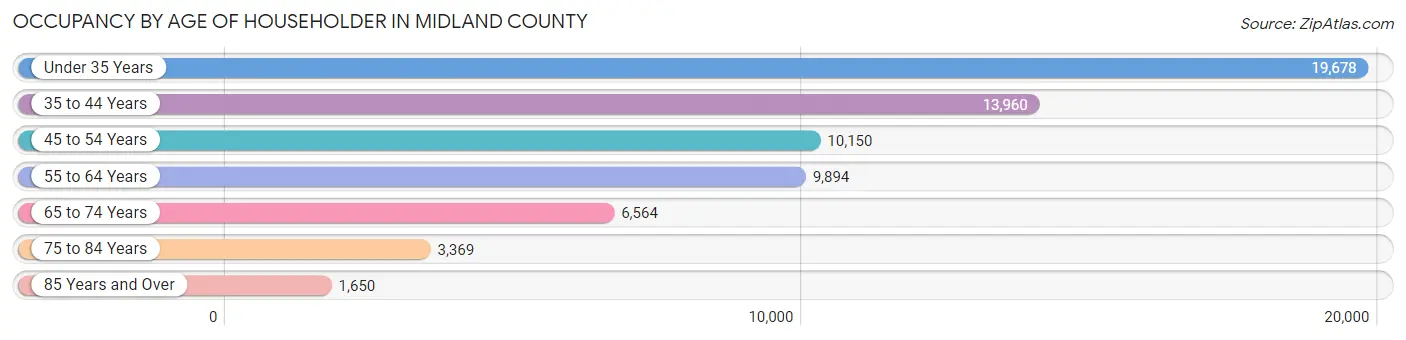
| Age Bracket | # Households | % Households |
| Under 35 Years | 19,678 | 30.1% |
| 35 to 44 Years | 13,960 | 21.4% |
| 45 to 54 Years | 10,150 | 15.5% |
| 55 to 64 Years | 9,894 | 15.2% |
| 65 to 74 Years | 6,564 | 10.1% |
| 75 to 84 Years | 3,369 | 5.2% |
| 85 Years and Over | 1,650 | 2.5% |
| Total | 65,265 | 100.0% |
Housing Finances in Midland County
Median Income by Occupancy in Midland County
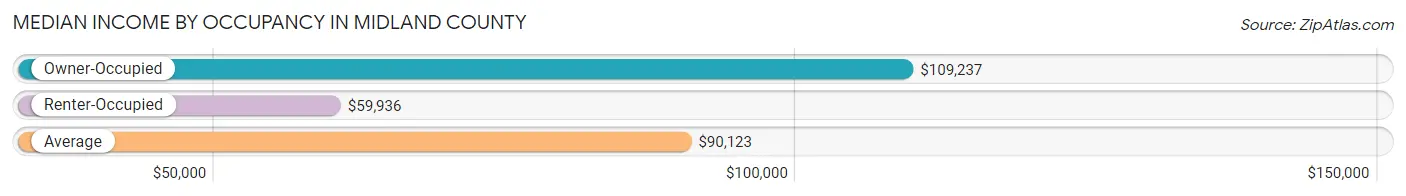
| Occupancy Type | # Households | Median Income |
| Owner-Occupied | 43,733 (67.0%) | $109,237 |
| Renter-Occupied | 21,532 (33.0%) | $59,936 |
| Average | 65,265 (100.0%) | $90,123 |
Occupancy by Householder Income Bracket in Midland County
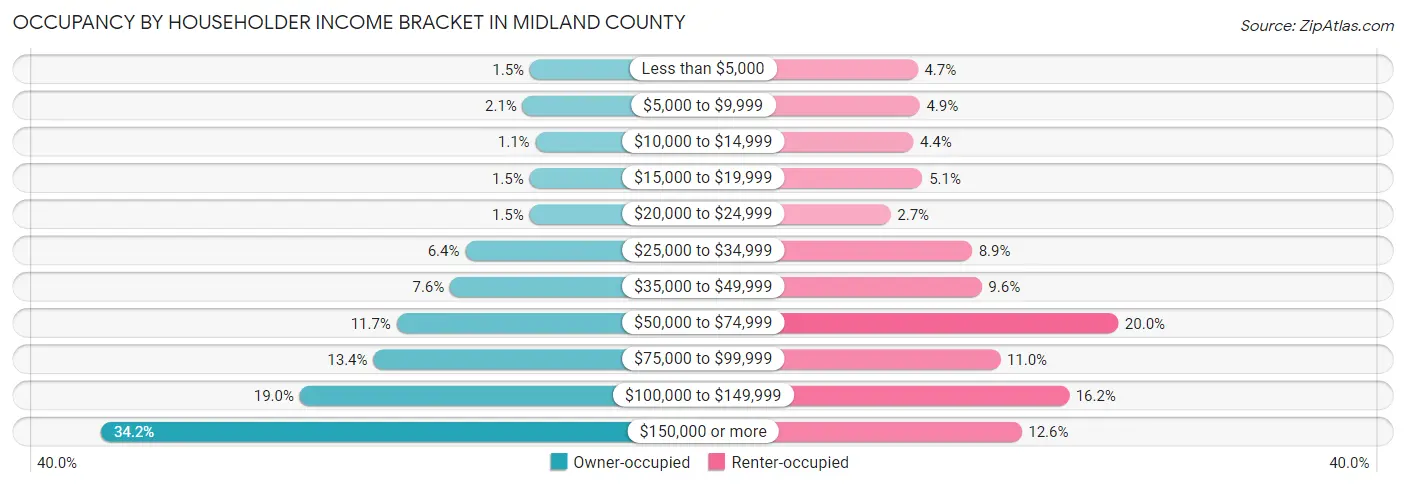
| Income Bracket | Owner-occupied | Renter-occupied |
| Less than $5,000 | 655 (1.5%) | 1,017 (4.7%) |
| $5,000 to $9,999 | 895 (2.1%) | 1,048 (4.9%) |
| $10,000 to $14,999 | 474 (1.1%) | 944 (4.4%) |
| $15,000 to $19,999 | 670 (1.5%) | 1,093 (5.1%) |
| $20,000 to $24,999 | 668 (1.5%) | 571 (2.6%) |
| $25,000 to $34,999 | 2,809 (6.4%) | 1,906 (8.8%) |
| $35,000 to $49,999 | 3,317 (7.6%) | 2,064 (9.6%) |
| $50,000 to $74,999 | 5,097 (11.7%) | 4,305 (20.0%) |
| $75,000 to $99,999 | 5,874 (13.4%) | 2,368 (11.0%) |
| $100,000 to $149,999 | 8,324 (19.0%) | 3,496 (16.2%) |
| $150,000 or more | 14,950 (34.2%) | 2,720 (12.6%) |
| Total | 43,733 (100.0%) | 21,532 (100.0%) |
Monthly Housing Cost Tiers in Midland County
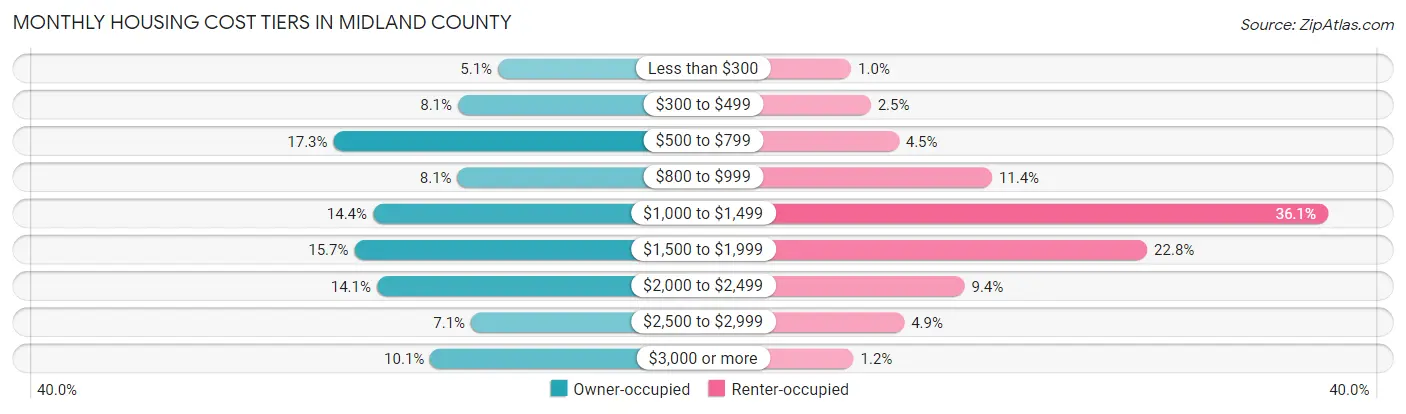
| Monthly Cost | Owner-occupied | Renter-occupied |
| Less than $300 | 2,246 (5.1%) | 218 (1.0%) |
| $300 to $499 | 3,538 (8.1%) | 527 (2.5%) |
| $500 to $799 | 7,548 (17.3%) | 973 (4.5%) |
| $800 to $999 | 3,553 (8.1%) | 2,451 (11.4%) |
| $1,000 to $1,499 | 6,276 (14.3%) | 7,775 (36.1%) |
| $1,500 to $1,999 | 6,875 (15.7%) | 4,912 (22.8%) |
| $2,000 to $2,499 | 6,150 (14.1%) | 2,016 (9.4%) |
| $2,500 to $2,999 | 3,118 (7.1%) | 1,059 (4.9%) |
| $3,000 or more | 4,429 (10.1%) | 257 (1.2%) |
| Total | 43,733 (100.0%) | 21,532 (100.0%) |
Physical Housing Characteristics in Midland County
Housing Structures in Midland County
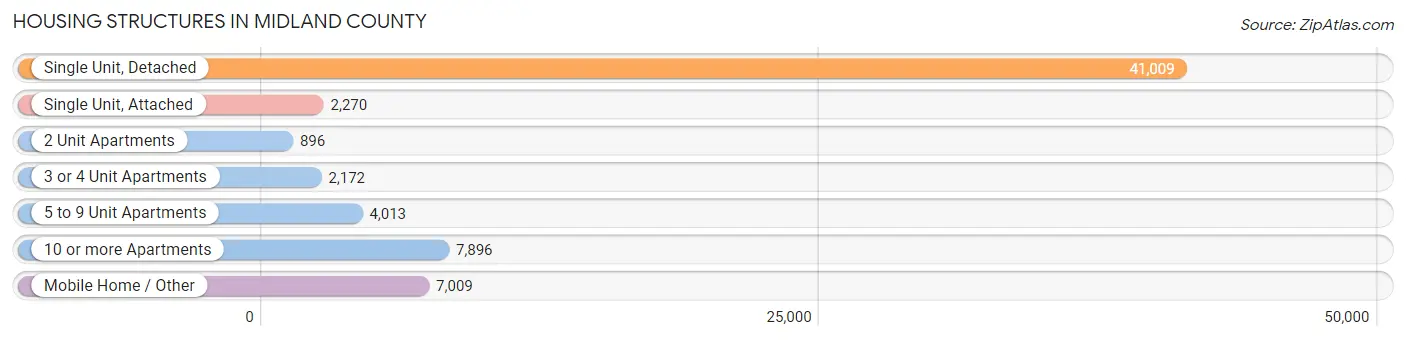
| Structure Type | # Housing Units | % Housing Units |
| Single Unit, Detached | 41,009 | 62.8% |
| Single Unit, Attached | 2,270 | 3.5% |
| 2 Unit Apartments | 896 | 1.4% |
| 3 or 4 Unit Apartments | 2,172 | 3.3% |
| 5 to 9 Unit Apartments | 4,013 | 6.1% |
| 10 or more Apartments | 7,896 | 12.1% |
| Mobile Home / Other | 7,009 | 10.7% |
| Total | 65,265 | 100.0% |
Housing Structures by Occupancy in Midland County
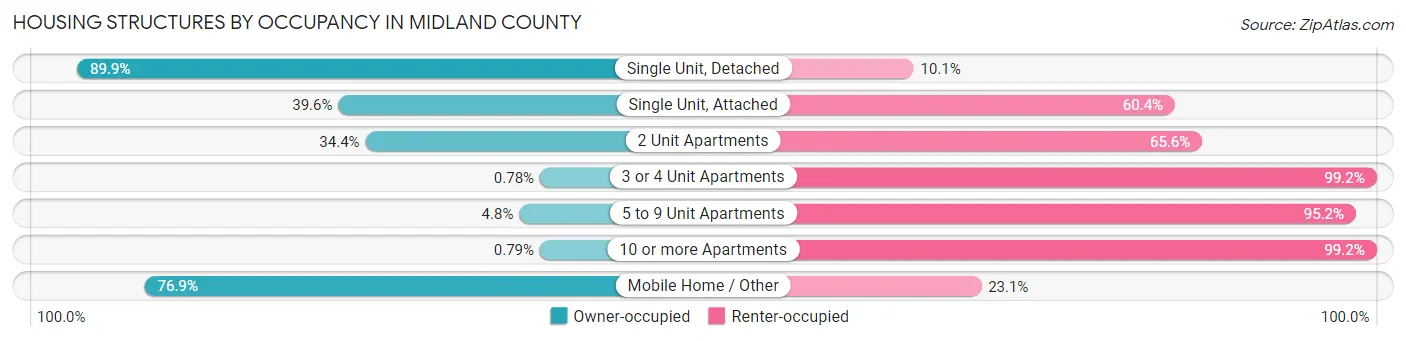
| Structure Type | Owner-occupied | Renter-occupied |
| Single Unit, Detached | 36,867 (89.9%) | 4,142 (10.1%) |
| Single Unit, Attached | 899 (39.6%) | 1,371 (60.4%) |
| 2 Unit Apartments | 308 (34.4%) | 588 (65.6%) |
| 3 or 4 Unit Apartments | 17 (0.8%) | 2,155 (99.2%) |
| 5 to 9 Unit Apartments | 191 (4.8%) | 3,822 (95.2%) |
| 10 or more Apartments | 62 (0.8%) | 7,834 (99.2%) |
| Mobile Home / Other | 5,389 (76.9%) | 1,620 (23.1%) |
| Total | 43,733 (67.0%) | 21,532 (33.0%) |
Housing Structures by Number of Rooms in Midland County
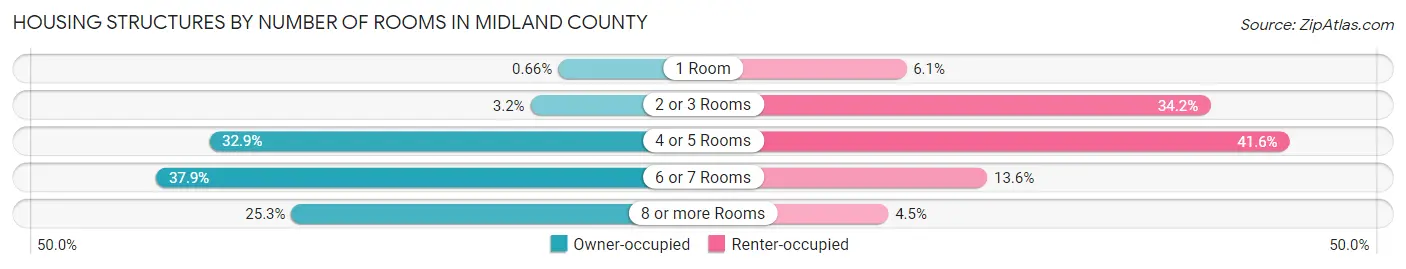
| Number of Rooms | Owner-occupied | Renter-occupied |
| 1 Room | 290 (0.7%) | 1,320 (6.1%) |
| 2 or 3 Rooms | 1,407 (3.2%) | 7,368 (34.2%) |
| 4 or 5 Rooms | 14,405 (32.9%) | 8,951 (41.6%) |
| 6 or 7 Rooms | 16,552 (37.9%) | 2,931 (13.6%) |
| 8 or more Rooms | 11,079 (25.3%) | 962 (4.5%) |
| Total | 43,733 (100.0%) | 21,532 (100.0%) |
Housing Structure by Heating Type in Midland County

| Heating Type | Owner-occupied | Renter-occupied |
| Utility Gas | 22,911 (52.4%) | 5,072 (23.6%) |
| Bottled, Tank, or LP Gas | 1,226 (2.8%) | 104 (0.5%) |
| Electricity | 19,031 (43.5%) | 16,229 (75.4%) |
| Fuel Oil or Kerosene | 0 (0.0%) | 0 (0.0%) |
| Coal or Coke | 0 (0.0%) | 0 (0.0%) |
| All other Fuels | 315 (0.7%) | 18 (0.1%) |
| No Fuel Used | 250 (0.6%) | 109 (0.5%) |
| Total | 43,733 (100.0%) | 21,532 (100.0%) |
Household Vehicle Usage in Midland County
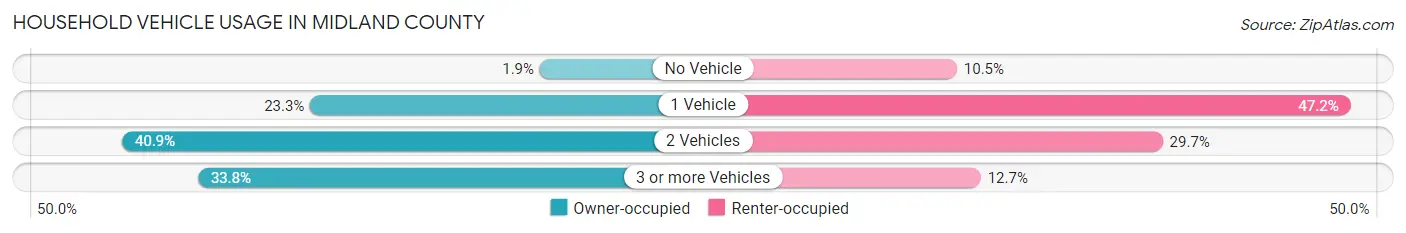
| Vehicles per Household | Owner-occupied | Renter-occupied |
| No Vehicle | 833 (1.9%) | 2,250 (10.4%) |
| 1 Vehicle | 10,206 (23.3%) | 10,164 (47.2%) |
| 2 Vehicles | 17,894 (40.9%) | 6,387 (29.7%) |
| 3 or more Vehicles | 14,800 (33.8%) | 2,731 (12.7%) |
| Total | 43,733 (100.0%) | 21,532 (100.0%) |
Real Estate & Mortgages in Midland County
Real Estate and Mortgage Overview in Midland County
| Characteristic | Without Mortgage | With Mortgage |
| Housing Units | 19,318 | 24,415 |
| Median Property Value | $229,100 | $301,900 |
| Median Household Income | $82,309 | $10,279 |
| Monthly Housing Costs | $685 | $4,324 |
| Real Estate Taxes | $2,545 | $1,316 |
Property Value by Mortgage Status in Midland County
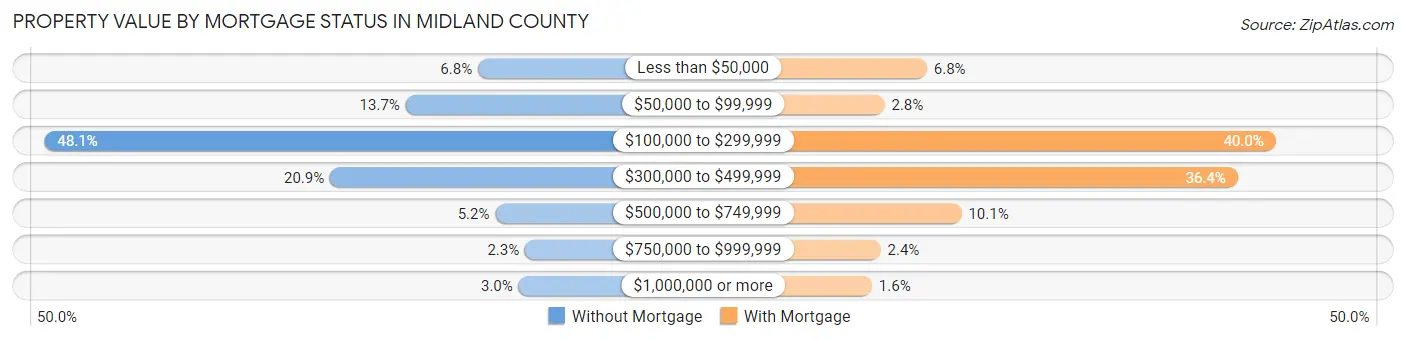
| Property Value | Without Mortgage | With Mortgage |
| Less than $50,000 | 1,317 (6.8%) | 1,657 (6.8%) |
| $50,000 to $99,999 | 2,648 (13.7%) | 675 (2.8%) |
| $100,000 to $299,999 | 9,293 (48.1%) | 9,768 (40.0%) |
| $300,000 to $499,999 | 4,039 (20.9%) | 8,885 (36.4%) |
| $500,000 to $749,999 | 999 (5.2%) | 2,464 (10.1%) |
| $750,000 to $999,999 | 452 (2.3%) | 584 (2.4%) |
| $1,000,000 or more | 570 (2.9%) | 382 (1.6%) |
| Total | 19,318 (100.0%) | 24,415 (100.0%) |
Household Income by Mortgage Status in Midland County
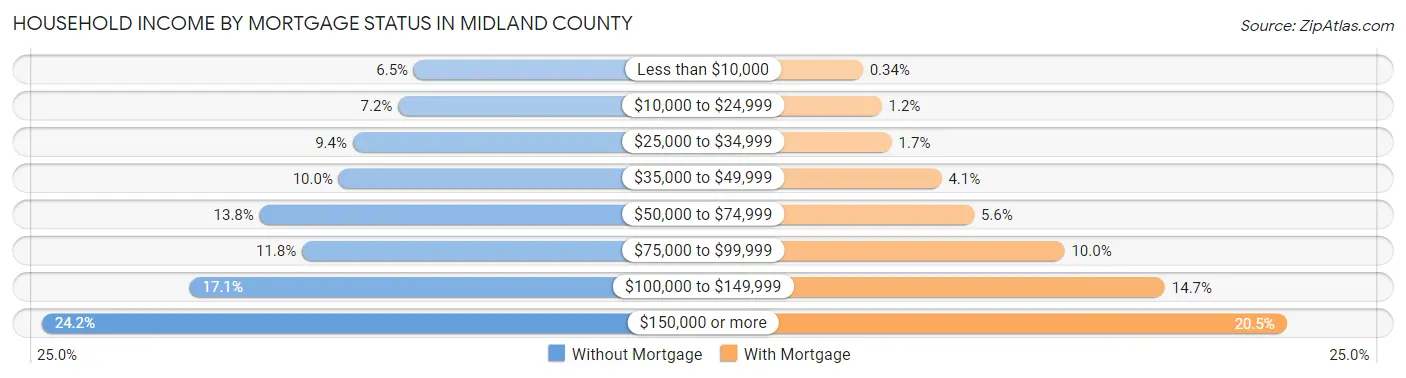
| Household Income | Without Mortgage | With Mortgage |
| Less than $10,000 | 1,247 (6.5%) | 83 (0.3%) |
| $10,000 to $24,999 | 1,393 (7.2%) | 303 (1.2%) |
| $25,000 to $34,999 | 1,811 (9.4%) | 419 (1.7%) |
| $35,000 to $49,999 | 1,939 (10.0%) | 998 (4.1%) |
| $50,000 to $74,999 | 2,668 (13.8%) | 1,378 (5.6%) |
| $75,000 to $99,999 | 2,277 (11.8%) | 2,429 (10.0%) |
| $100,000 to $149,999 | 3,312 (17.1%) | 3,597 (14.7%) |
| $150,000 or more | 4,671 (24.2%) | 5,012 (20.5%) |
| Total | 19,318 (100.0%) | 24,415 (100.0%) |
Property Value to Household Income Ratio in Midland County
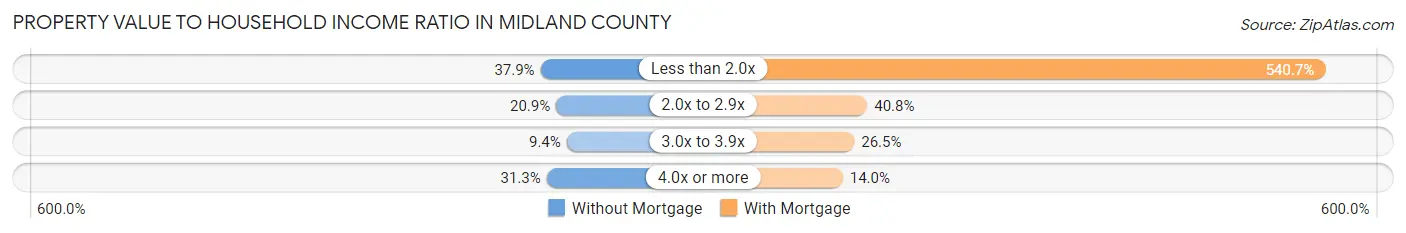
| Value-to-Income Ratio | Without Mortgage | With Mortgage |
| Less than 2.0x | 7,324 (37.9%) | 132,005 (540.7%) |
| 2.0x to 2.9x | 4,046 (20.9%) | 9,950 (40.7%) |
| 3.0x to 3.9x | 1,811 (9.4%) | 6,480 (26.5%) |
| 4.0x or more | 6,038 (31.3%) | 3,424 (14.0%) |
| Total | 19,318 (100.0%) | 24,415 (100.0%) |
Real Estate Taxes by Mortgage Status in Midland County
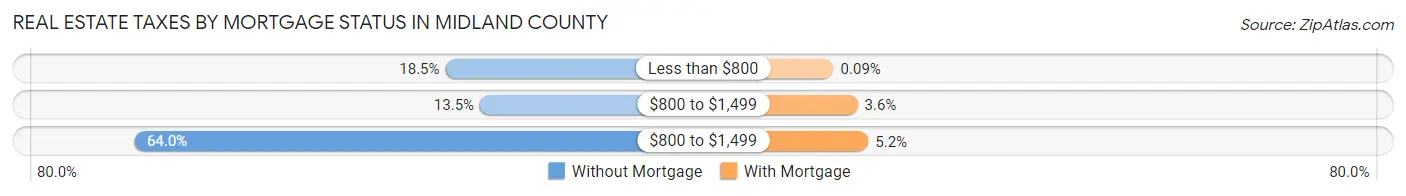
| Property Taxes | Without Mortgage | With Mortgage |
| Less than $800 | 3,577 (18.5%) | 23 (0.1%) |
| $800 to $1,499 | 2,603 (13.5%) | 877 (3.6%) |
| $800 to $1,499 | 12,367 (64.0%) | 1,260 (5.2%) |
| Total | 19,318 (100.0%) | 24,415 (100.0%) |
Health & Disability in Midland County
Health Insurance Coverage by Age in Midland County
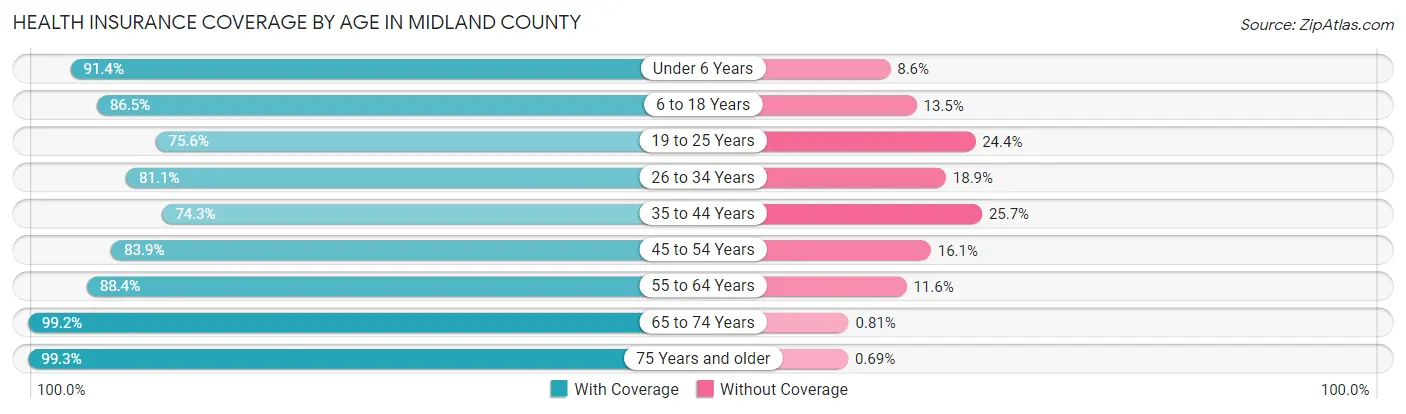
| Age Bracket | With Coverage | Without Coverage |
| Under 6 Years | 15,810 (91.4%) | 1,484 (8.6%) |
| 6 to 18 Years | 29,232 (86.5%) | 4,554 (13.5%) |
| 19 to 25 Years | 11,374 (75.6%) | 3,674 (24.4%) |
| 26 to 34 Years | 21,282 (81.1%) | 4,972 (18.9%) |
| 35 to 44 Years | 18,394 (74.3%) | 6,353 (25.7%) |
| 45 to 54 Years | 14,378 (83.9%) | 2,765 (16.1%) |
| 55 to 64 Years | 14,642 (88.4%) | 1,921 (11.6%) |
| 65 to 74 Years | 10,229 (99.2%) | 84 (0.8%) |
| 75 Years and older | 6,738 (99.3%) | 47 (0.7%) |
| Total | 142,079 (84.6%) | 25,854 (15.4%) |
Health Insurance Coverage by Citizenship Status in Midland County
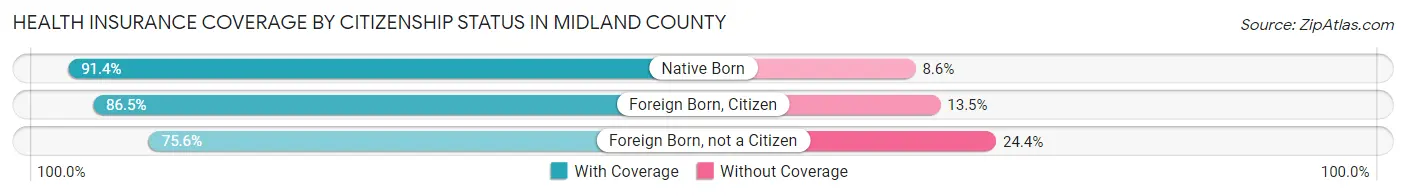
| Citizenship Status | With Coverage | Without Coverage |
| Native Born | 15,810 (91.4%) | 1,484 (8.6%) |
| Foreign Born, Citizen | 29,232 (86.5%) | 4,554 (13.5%) |
| Foreign Born, not a Citizen | 11,374 (75.6%) | 3,674 (24.4%) |
Health Insurance Coverage by Household Income in Midland County
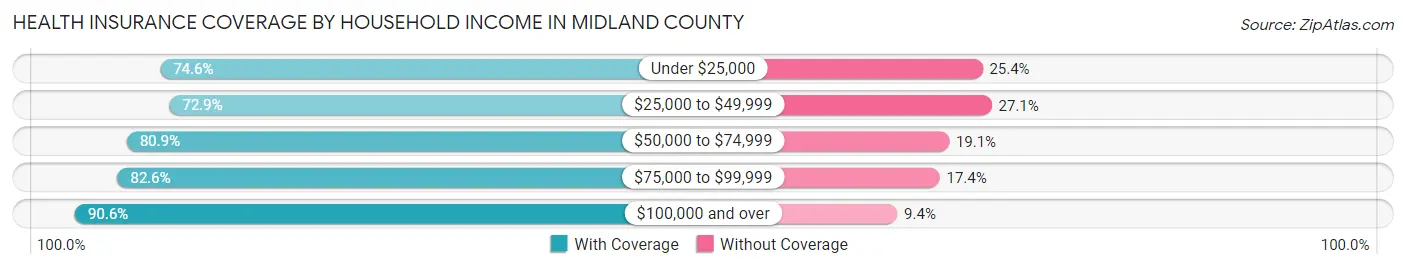
| Household Income | With Coverage | Without Coverage |
| Under $25,000 | 10,087 (74.6%) | 3,437 (25.4%) |
| $25,000 to $49,999 | 15,069 (72.9%) | 5,608 (27.1%) |
| $50,000 to $74,999 | 18,575 (80.9%) | 4,396 (19.1%) |
| $75,000 to $99,999 | 19,052 (82.6%) | 4,008 (17.4%) |
| $100,000 and over | 78,720 (90.6%) | 8,198 (9.4%) |
Public vs Private Health Insurance Coverage by Age in Midland County
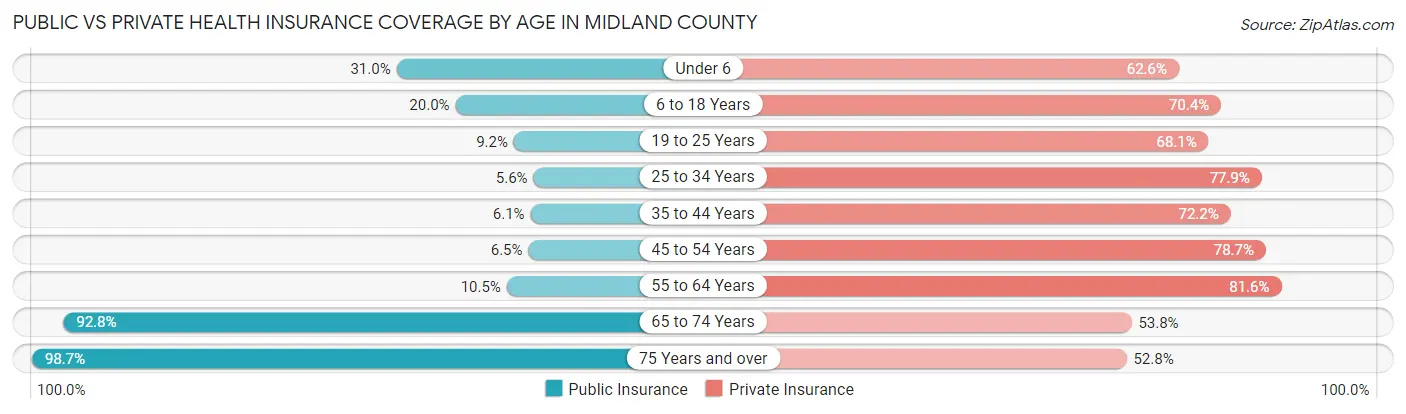
| Age Bracket | Public Insurance | Private Insurance |
| Under 6 | 5,356 (31.0%) | 10,817 (62.5%) |
| 6 to 18 Years | 6,771 (20.0%) | 23,790 (70.4%) |
| 19 to 25 Years | 1,384 (9.2%) | 10,244 (68.1%) |
| 25 to 34 Years | 1,459 (5.6%) | 20,460 (77.9%) |
| 35 to 44 Years | 1,512 (6.1%) | 17,856 (72.2%) |
| 45 to 54 Years | 1,113 (6.5%) | 13,489 (78.7%) |
| 55 to 64 Years | 1,743 (10.5%) | 13,511 (81.6%) |
| 65 to 74 Years | 9,571 (92.8%) | 5,544 (53.8%) |
| 75 Years and over | 6,694 (98.7%) | 3,585 (52.8%) |
| Total | 35,603 (21.2%) | 119,296 (71.0%) |
Disability Status by Sex by Age in Midland County
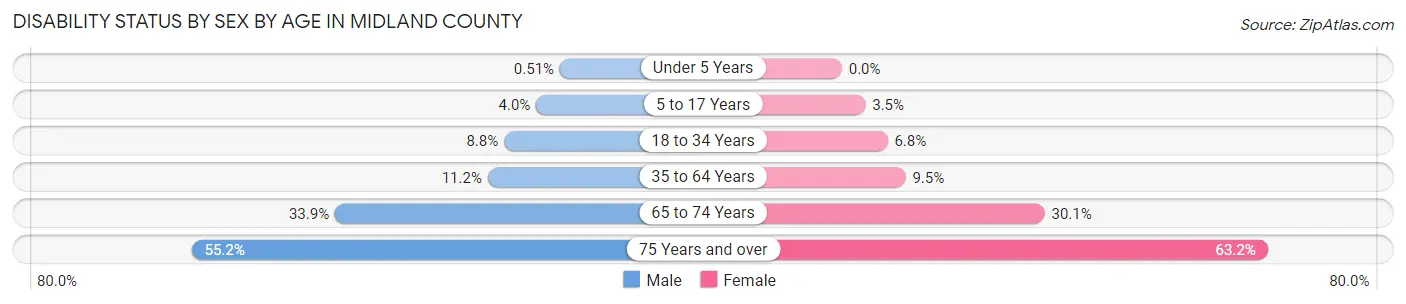
| Age Bracket | Male | Female |
| Under 5 Years | 39 (0.5%) | 0 (0.0%) |
| 5 to 17 Years | 713 (4.0%) | 591 (3.5%) |
| 18 to 34 Years | 1,978 (8.8%) | 1,424 (6.8%) |
| 35 to 64 Years | 3,398 (11.2%) | 2,666 (9.5%) |
| 65 to 74 Years | 1,637 (33.9%) | 1,652 (30.1%) |
| 75 Years and over | 1,474 (55.2%) | 2,602 (63.2%) |
Disability Class by Sex by Age in Midland County
Disability Class: Hearing Difficulty
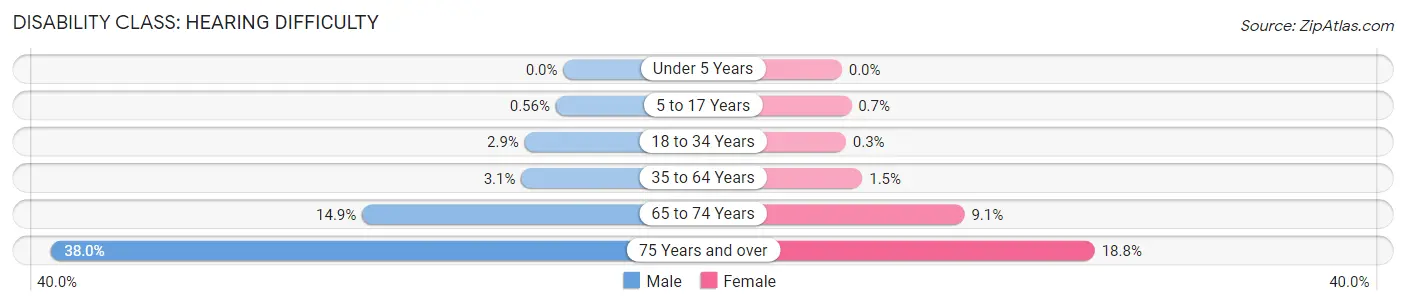
| Age Bracket | Male | Female |
| Under 5 Years | 0 (0.0%) | 0 (0.0%) |
| 5 to 17 Years | 99 (0.6%) | 118 (0.7%) |
| 18 to 34 Years | 646 (2.9%) | 62 (0.3%) |
| 35 to 64 Years | 944 (3.1%) | 428 (1.5%) |
| 65 to 74 Years | 721 (14.9%) | 500 (9.1%) |
| 75 Years and over | 1,015 (38.0%) | 773 (18.8%) |
Disability Class: Vision Difficulty
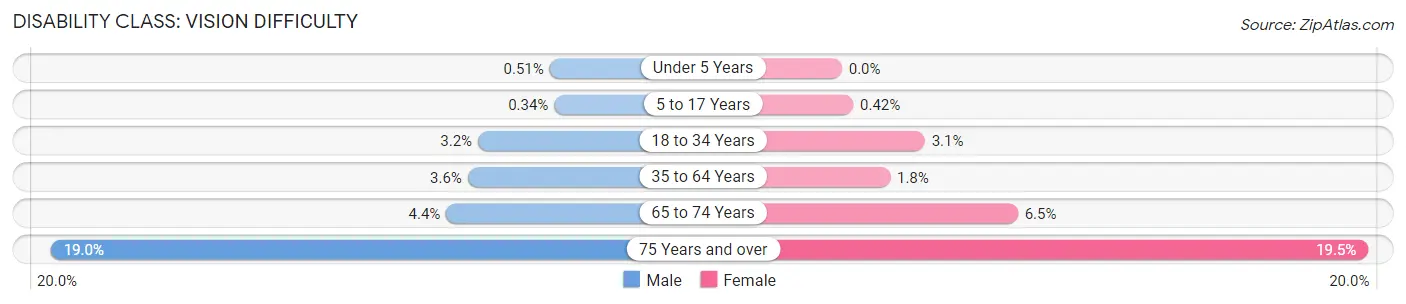
| Age Bracket | Male | Female |
| Under 5 Years | 39 (0.5%) | 0 (0.0%) |
| 5 to 17 Years | 60 (0.3%) | 71 (0.4%) |
| 18 to 34 Years | 713 (3.2%) | 646 (3.1%) |
| 35 to 64 Years | 1,073 (3.5%) | 505 (1.8%) |
| 65 to 74 Years | 210 (4.3%) | 358 (6.5%) |
| 75 Years and over | 508 (19.0%) | 804 (19.5%) |
Disability Class: Cognitive Difficulty

| Age Bracket | Male | Female |
| 5 to 17 Years | 511 (2.9%) | 479 (2.8%) |
| 18 to 34 Years | 916 (4.1%) | 567 (2.7%) |
| 35 to 64 Years | 968 (3.2%) | 665 (2.4%) |
| 65 to 74 Years | 356 (7.4%) | 260 (4.7%) |
| 75 Years and over | 368 (13.8%) | 818 (19.9%) |
Disability Class: Ambulatory Difficulty
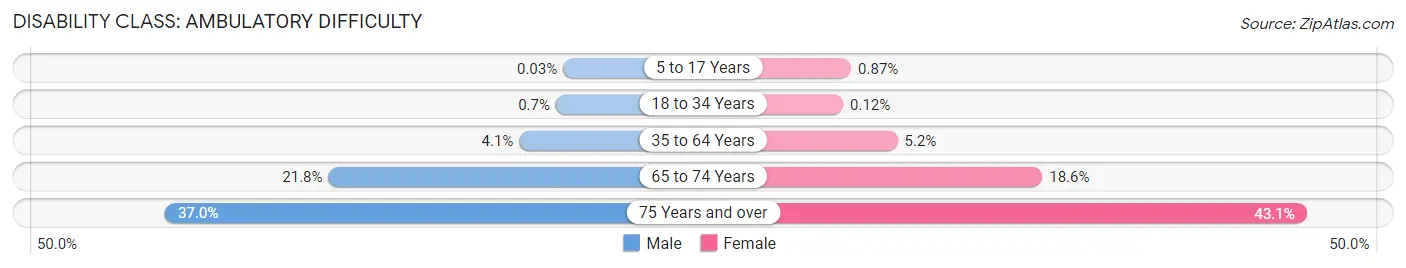
| Age Bracket | Male | Female |
| 5 to 17 Years | 6 (0.0%) | 147 (0.9%) |
| 18 to 34 Years | 158 (0.7%) | 26 (0.1%) |
| 35 to 64 Years | 1,242 (4.1%) | 1,459 (5.2%) |
| 65 to 74 Years | 1,053 (21.8%) | 1,021 (18.6%) |
| 75 Years and over | 987 (37.0%) | 1,775 (43.1%) |
Disability Class: Self-Care Difficulty
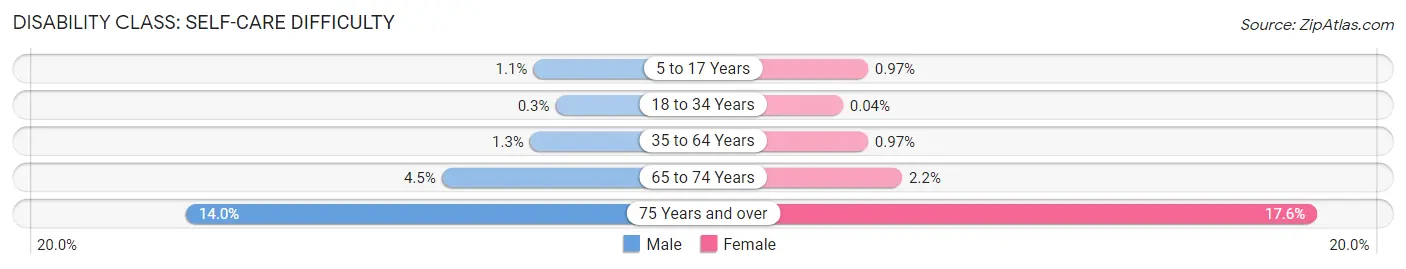
| Age Bracket | Male | Female |
| 5 to 17 Years | 198 (1.1%) | 165 (1.0%) |
| 18 to 34 Years | 68 (0.3%) | 8 (0.0%) |
| 35 to 64 Years | 379 (1.3%) | 274 (1.0%) |
| 65 to 74 Years | 218 (4.5%) | 123 (2.2%) |
| 75 Years and over | 374 (14.0%) | 726 (17.6%) |
Technology Access in Midland County
Computing Device Access in Midland County
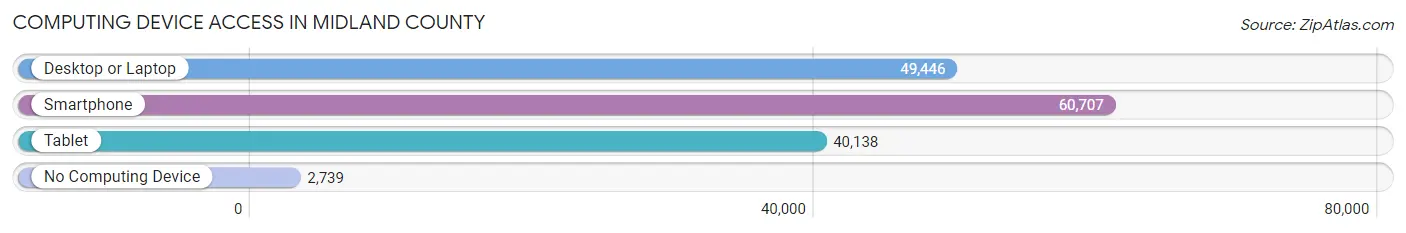
| Device Type | # Households | % Households |
| Desktop or Laptop | 49,446 | 75.8% |
| Smartphone | 60,707 | 93.0% |
| Tablet | 40,138 | 61.5% |
| No Computing Device | 2,739 | 4.2% |
| Total | 65,265 | 100.0% |
Internet Access in Midland County
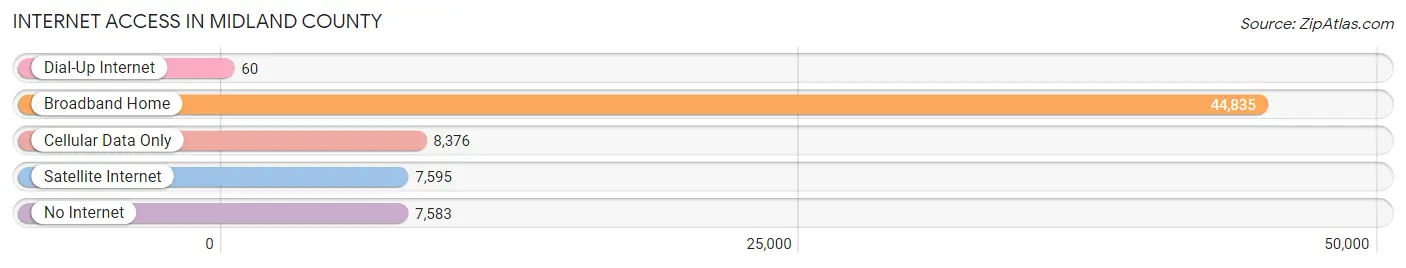
| Internet Type | # Households | % Households |
| Dial-Up Internet | 60 | 0.1% |
| Broadband Home | 44,835 | 68.7% |
| Cellular Data Only | 8,376 | 12.8% |
| Satellite Internet | 7,595 | 11.6% |
| No Internet | 7,583 | 11.6% |
| Total | 65,265 | 100.0% |
Midland County Summary
Midland County is located in the state of Texas in the United States. It is part of the Midland-Odessa metropolitan area and is the county seat of Midland County. The county was established in 1885 and has a population of approximately 158,000 people.
Geography
Midland County is located in the Permian Basin region of West Texas. It is bordered by Martin County to the north, Glasscock County to the east, Upton County to the south, and Ector County to the west. The county covers an area of 902 square miles and is mostly flat with some rolling hills. The terrain is mostly covered in grasslands and shrublands. The Pecos River runs through the county and is a major source of water for the area.
Climate
Midland County has a semi-arid climate with hot summers and mild winters. The average temperature in the summer is around 90°F and in the winter it is around 50°F. The average annual precipitation is around 17 inches.
Economy
Midland County’s economy is largely based on oil and gas production. The county is home to several major oil and gas companies, including Chevron, ExxonMobil, and ConocoPhillips. The county is also home to several other industries, including manufacturing, healthcare, and retail.
Demographics
As of the 2010 census, Midland County had a population of 158,000 people. The racial makeup of the county was 75.3% White, 5.2% African American, 0.7% Native American, 1.2% Asian, 0.1% Pacific Islander, 15.2% from other races, and 2.3% from two or more races. Hispanic or Latino of any race were 44.3% of the population.
The median household income in Midland County was $54,000 and the median family income was $62,000. The per capita income was $27,000. About 11.5% of the population was below the poverty line.
Education
Midland County is served by the Midland Independent School District. The district has 24 elementary schools, 8 middle schools, and 4 high schools. The county is also home to several private schools and the University of Texas of the Permian Basin.
Conclusion
Midland County is a county located in the state of Texas in the United States. It is part of the Midland-Odessa metropolitan area and is the county seat of Midland County. The county was established in 1885 and has a population of approximately 158,000 people. The economy of Midland County is largely based on oil and gas production and the county is home to several major oil and gas companies. The racial makeup of the county is mostly White, with a significant Hispanic or Latino population. The county is served by the Midland Independent School District and is home to several private schools and the University of Texas of the Permian Basin.
Common Questions
What is the Total Population of Midland County?
Total Population of Midland County is 169,393.
What is the Total Male Population of Midland County?
Total Male Population of Midland County is 86,602.
What is the Total Female Population of Midland County?
Total Female Population of Midland County is 82,791.
What is the Ratio of Males per 100 Females in Midland County?
There are 104.60 Males per 100 Females in Midland County.
What is the Ratio of Females per 100 Males in Midland County?
There are 95.60 Females per 100 Males in Midland County.
What is the Median Population Age in Midland County?
Median Population Age in Midland County is 32.1 Years.
What is the Average Family Size in Midland County
Average Family Size in Midland County is 3.2 People.
What is the Average Household Size in Midland County
Average Household Size in Midland County is 2.6 People.
What is Per Capita Income in Midland County?
Per Capita income in Midland County is $46,914.
What is the Median Family Income in Midland County?
Median Family Income in Midland County is $108,896.
What is the Median Household income in Midland County?
Median Household Income in Midland County is $90,123.
What is Income or Wage Gap in Midland County?
Income or Wage Gap in Midland County is 40.8%.
Women in Midland County earn 59.2 cents for every dollar earned by a man.
What is Family Income Deficit in Midland County?
Family Income Deficit in Midland County is $9,580.
Families that are below poverty line in Midland County earn $9,580 less on average than the poverty threshold level.
What is Inequality or Gini Index in Midland County?
Inequality or Gini Index in Midland County is 0.47.
How Large is the Labor Force in Midland County?
There are 89,301 People in the Labor Forcein in Midland County.
What is the Percentage of People in the Labor Force in Midland County?
71.2% of People are in the Labor Force in Midland County.
What is the Unemployment Rate in Midland County?
Unemployment Rate in Midland County is 3.4%.