McLennan County, TX
McLennan County Map
McLennan County Overview
261,090
TOTAL POPULATION
128,169
MALE POPULATION
132,921
FEMALE POPULATION
96.42
MALES / 100 FEMALES
103.71
FEMALES / 100 MALES
33.6
MEDIAN AGE
3.2
AVG FAMILY SIZE
2.6
AVG HOUSEHOLD SIZE
$31,036
PER CAPITA INCOME
$78,657
AVG FAMILY INCOME
$59,781
AVG HOUSEHOLD INCOME
29.7%
WAGE / INCOME GAP [ % ]
70.3¢/ $1
WAGE / INCOME GAP [ $ ]
$10,902
FAMILY INCOME DEFICIT
0.48
INEQUALITY / GINI INDEX
125,759
LABOR FORCE [ PEOPLE ]
61.4%
PERCENT IN LABOR FORCE
4.4%
UNEMPLOYMENT RATE
McLennan County Area Codes
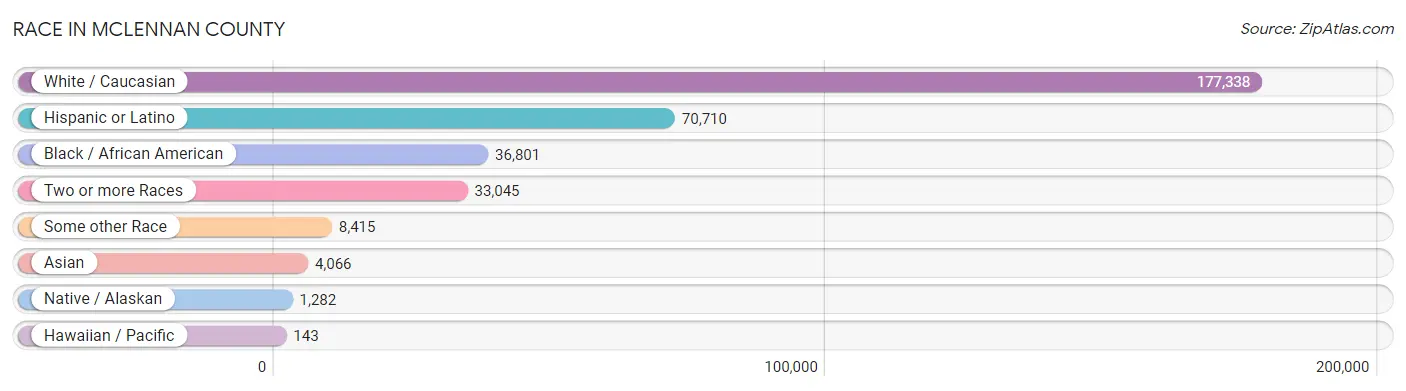
Race in McLennan County
The most populous races in McLennan County are White / Caucasian (177,338 | 67.9%), Hispanic or Latino (70,710 | 27.1%), and Black / African American (36,801 | 14.1%).
| Race | # Population | % Population |
| Asian | 4,066 | 1.6% |
| Black / African American | 36,801 | 14.1% |
| Hawaiian / Pacific | 143 | 0.1% |
| Hispanic or Latino | 70,710 | 27.1% |
| Native / Alaskan | 1,282 | 0.5% |
| White / Caucasian | 177,338 | 67.9% |
| Two or more Races | 33,045 | 12.7% |
| Some other Race | 8,415 | 3.2% |
| Total | 261,090 | 100.0% |
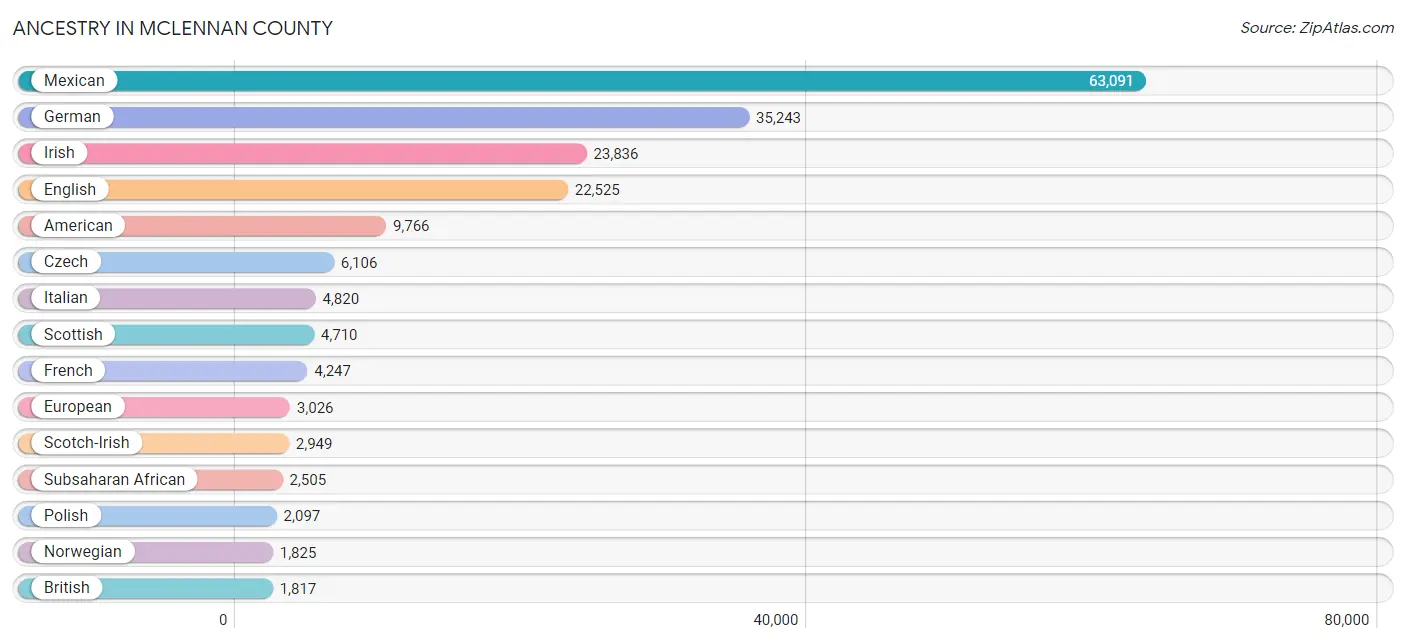
Ancestry in McLennan County
The most populous ancestries reported in McLennan County are Mexican (63,091 | 24.2%), German (35,243 | 13.5%), Irish (23,836 | 9.1%), English (22,525 | 8.6%), and American (9,766 | 3.7%), together accounting for 59.2% of all McLennan County residents.
| Ancestry | # Population | % Population |
| African | 1,682 | 0.6% |
| Alsatian | 9 | 0.0% |
| American | 9,766 | 3.7% |
| Apache | 50 | 0.0% |
| Arab | 266 | 0.1% |
| Argentinean | 41 | 0.0% |
| Armenian | 44 | 0.0% |
| Australian | 151 | 0.1% |
| Austrian | 226 | 0.1% |
| Bangladeshi | 1 | 0.0% |
| Belgian | 14 | 0.0% |
| Bhutanese | 435 | 0.2% |
| Blackfeet | 150 | 0.1% |
| Bolivian | 31 | 0.0% |
| British | 1,817 | 0.7% |
| British West Indian | 149 | 0.1% |
| Bulgarian | 5 | 0.0% |
| Burmese | 953 | 0.4% |
| Cajun | 137 | 0.1% |
| Canadian | 202 | 0.1% |
| Cape Verdean | 21 | 0.0% |
| Carpatho Rusyn | 10 | 0.0% |
| Celtic | 40 | 0.0% |
| Central American | 1,403 | 0.5% |
| Central American Indian | 21 | 0.0% |
| Cherokee | 1,178 | 0.4% |
| Chickasaw | 109 | 0.0% |
| Chilean | 93 | 0.0% |
| Chippewa | 4 | 0.0% |
| Choctaw | 197 | 0.1% |
| Colombian | 211 | 0.1% |
| Comanche | 70 | 0.0% |
| Costa Rican | 9 | 0.0% |
| Creek | 43 | 0.0% |
| Croatian | 11 | 0.0% |
| Crow | 8 | 0.0% |
| Cuban | 589 | 0.2% |
| Czech | 6,106 | 2.3% |
| Czechoslovakian | 309 | 0.1% |
| Danish | 632 | 0.2% |
| Delaware | 13 | 0.0% |
| Dominican | 70 | 0.0% |
| Dutch | 1,763 | 0.7% |
| Dutch West Indian | 48 | 0.0% |
| Eastern European | 293 | 0.1% |
| Ecuadorian | 62 | 0.0% |
| Egyptian | 44 | 0.0% |
| English | 22,525 | 8.6% |
| European | 3,026 | 1.2% |
| Filipino | 28 | 0.0% |
| Finnish | 185 | 0.1% |
| French | 4,247 | 1.6% |
| French Canadian | 526 | 0.2% |
| German | 35,243 | 13.5% |
| Ghanaian | 12 | 0.0% |
| Greek | 313 | 0.1% |
| Guamanian / Chamorro | 48 | 0.0% |
| Guatemalan | 381 | 0.2% |
| Haitian | 23 | 0.0% |
| Honduran | 653 | 0.3% |
| Hungarian | 219 | 0.1% |
| Icelander | 73 | 0.0% |
| Indian (Asian) | 1,131 | 0.4% |
| Inupiat | 30 | 0.0% |
| Iranian | 28 | 0.0% |
| Iraqi | 9 | 0.0% |
| Irish | 23,836 | 9.1% |
| Iroquois | 31 | 0.0% |
| Italian | 4,820 | 1.8% |
| Jamaican | 151 | 0.1% |
| Japanese | 71 | 0.0% |
| Jordanian | 10 | 0.0% |
| Kiowa | 38 | 0.0% |
| Korean | 870 | 0.3% |
| Laotian | 19 | 0.0% |
| Lebanese | 157 | 0.1% |
| Liberian | 303 | 0.1% |
| Lithuanian | 43 | 0.0% |
| Lumbee | 19 | 0.0% |
| Macedonian | 41 | 0.0% |
| Malaysian | 351 | 0.1% |
| Maltese | 5 | 0.0% |
| Mexican | 63,091 | 24.2% |
| Mexican American Indian | 239 | 0.1% |
| Moroccan | 12 | 0.0% |
| Native Hawaiian | 146 | 0.1% |
| Navajo | 49 | 0.0% |
| New Zealander | 27 | 0.0% |
| Nicaraguan | 68 | 0.0% |
| Nigerian | 430 | 0.2% |
| Northern European | 244 | 0.1% |
| Norwegian | 1,825 | 0.7% |
| Osage | 1 | 0.0% |
| Ottawa | 14 | 0.0% |
| Pakistani | 67 | 0.0% |
| Palestinian | 21 | 0.0% |
| Panamanian | 79 | 0.0% |
| Pennsylvania German | 49 | 0.0% |
| Peruvian | 87 | 0.0% |
| Polish | 2,097 | 0.8% |
| Portuguese | 124 | 0.1% |
| Pueblo | 29 | 0.0% |
| Puerto Rican | 1,535 | 0.6% |
| Romanian | 228 | 0.1% |
| Russian | 342 | 0.1% |
| Salvadoran | 213 | 0.1% |
| Samoan | 69 | 0.0% |
| Scandinavian | 423 | 0.2% |
| Scotch-Irish | 2,949 | 1.1% |
| Scottish | 4,710 | 1.8% |
| Seminole | 31 | 0.0% |
| Sioux | 63 | 0.0% |
| Slavic | 7 | 0.0% |
| Slovak | 107 | 0.0% |
| Slovene | 17 | 0.0% |
| South American | 674 | 0.3% |
| Spaniard | 928 | 0.4% |
| Spanish | 513 | 0.2% |
| Spanish American | 82 | 0.0% |
| Sri Lankan | 914 | 0.4% |
| Subsaharan African | 2,505 | 1.0% |
| Swedish | 1,304 | 0.5% |
| Swiss | 145 | 0.1% |
| Syrian | 13 | 0.0% |
| Thai | 909 | 0.4% |
| Tongan | 79 | 0.0% |
| Trinidadian and Tobagonian | 12 | 0.0% |
| Turkish | 50 | 0.0% |
| Ukrainian | 176 | 0.1% |
| Venezuelan | 149 | 0.1% |
| Vietnamese | 13 | 0.0% |
| Welsh | 1,394 | 0.5% |
| West Indian | 27 | 0.0% |
| Yugoslavian | 207 | 0.1% | View All 134 Rows |
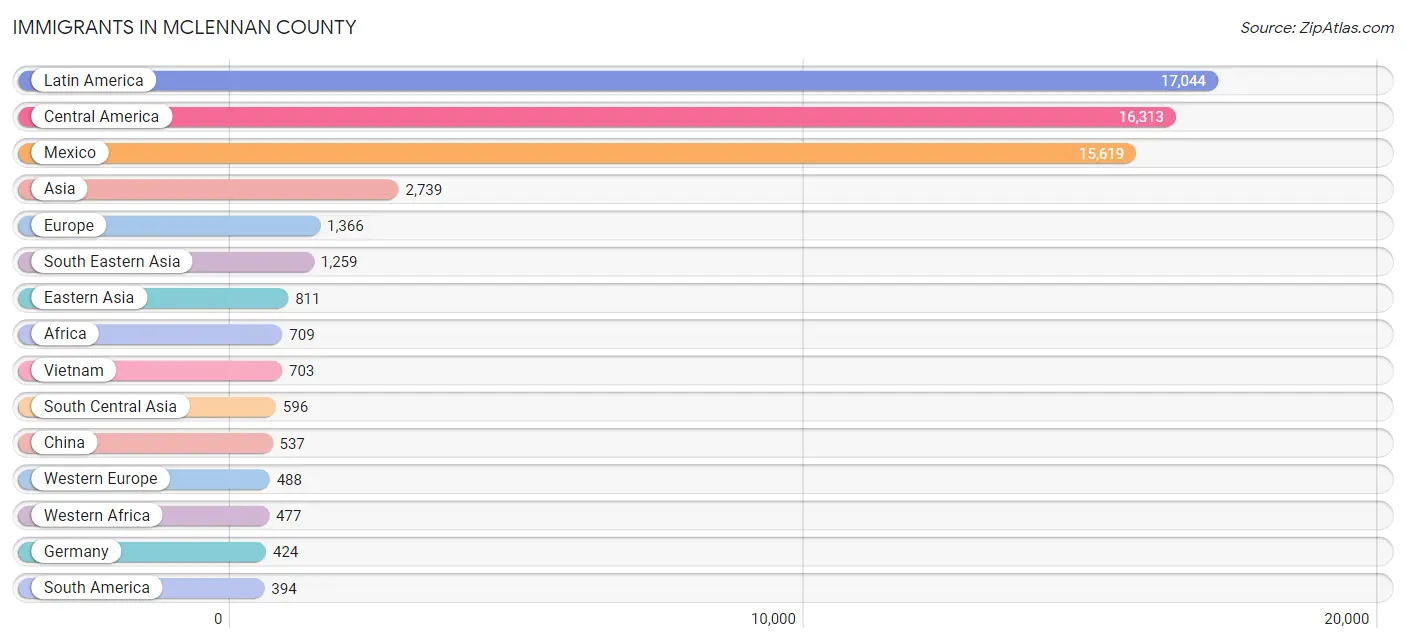
Immigrants in McLennan County
The most numerous immigrant groups reported in McLennan County came from Latin America (17,044 | 6.5%), Central America (16,313 | 6.2%), Mexico (15,619 | 6.0%), Asia (2,739 | 1.1%), and Europe (1,366 | 0.5%), together accounting for 20.3% of all McLennan County residents.
| Immigration Origin | # Population | % Population |
| Africa | 709 | 0.3% |
| Argentina | 28 | 0.0% |
| Asia | 2,739 | 1.1% |
| Australia | 37 | 0.0% |
| Bahamas | 13 | 0.0% |
| Bangladesh | 13 | 0.0% |
| Bosnia and Herzegovina | 10 | 0.0% |
| Bulgaria | 5 | 0.0% |
| Cambodia | 10 | 0.0% |
| Canada | 255 | 0.1% |
| Caribbean | 337 | 0.1% |
| Central America | 16,313 | 6.2% |
| Chile | 27 | 0.0% |
| China | 537 | 0.2% |
| Colombia | 146 | 0.1% |
| Cuba | 147 | 0.1% |
| Denmark | 24 | 0.0% |
| Eastern Africa | 90 | 0.0% |
| Eastern Asia | 811 | 0.3% |
| Eastern Europe | 310 | 0.1% |
| Ecuador | 22 | 0.0% |
| Egypt | 19 | 0.0% |
| El Salvador | 143 | 0.1% |
| England | 150 | 0.1% |
| Europe | 1,366 | 0.5% |
| Fiji | 9 | 0.0% |
| France | 29 | 0.0% |
| Germany | 424 | 0.2% |
| Guatemala | 137 | 0.1% |
| Honduras | 371 | 0.1% |
| Hungary | 3 | 0.0% |
| India | 337 | 0.1% |
| Iran | 22 | 0.0% |
| Ireland | 27 | 0.0% |
| Italy | 169 | 0.1% |
| Jamaica | 17 | 0.0% |
| Japan | 104 | 0.0% |
| Kenya | 29 | 0.0% |
| Korea | 170 | 0.1% |
| Laos | 286 | 0.1% |
| Latin America | 17,044 | 6.5% |
| Liberia | 114 | 0.0% |
| Malaysia | 14 | 0.0% |
| Mexico | 15,619 | 6.0% |
| Nepal | 179 | 0.1% |
| Netherlands | 35 | 0.0% |
| Nicaragua | 6 | 0.0% |
| Nigeria | 363 | 0.1% |
| North Macedonia | 17 | 0.0% |
| Northern Africa | 19 | 0.0% |
| Northern Europe | 373 | 0.1% |
| Oceania | 169 | 0.1% |
| Pakistan | 45 | 0.0% |
| Panama | 37 | 0.0% |
| Peru | 32 | 0.0% |
| Philippines | 204 | 0.1% |
| Poland | 16 | 0.0% |
| Portugal | 11 | 0.0% |
| Romania | 164 | 0.1% |
| Russia | 65 | 0.0% |
| Saudi Arabia | 24 | 0.0% |
| South Africa | 20 | 0.0% |
| South America | 394 | 0.2% |
| South Central Asia | 596 | 0.2% |
| South Eastern Asia | 1,259 | 0.5% |
| Southern Europe | 195 | 0.1% |
| Spain | 15 | 0.0% |
| St. Vincent and the Grenadines | 30 | 0.0% |
| Sweden | 15 | 0.0% |
| Taiwan | 25 | 0.0% |
| Thailand | 2 | 0.0% |
| Trinidad and Tobago | 78 | 0.0% |
| Ukraine | 30 | 0.0% |
| Venezuela | 139 | 0.1% |
| Vietnam | 703 | 0.3% |
| Western Africa | 477 | 0.2% |
| Western Asia | 65 | 0.0% |
| Western Europe | 488 | 0.2% |
| Zimbabwe | 61 | 0.0% | View All 79 Rows |
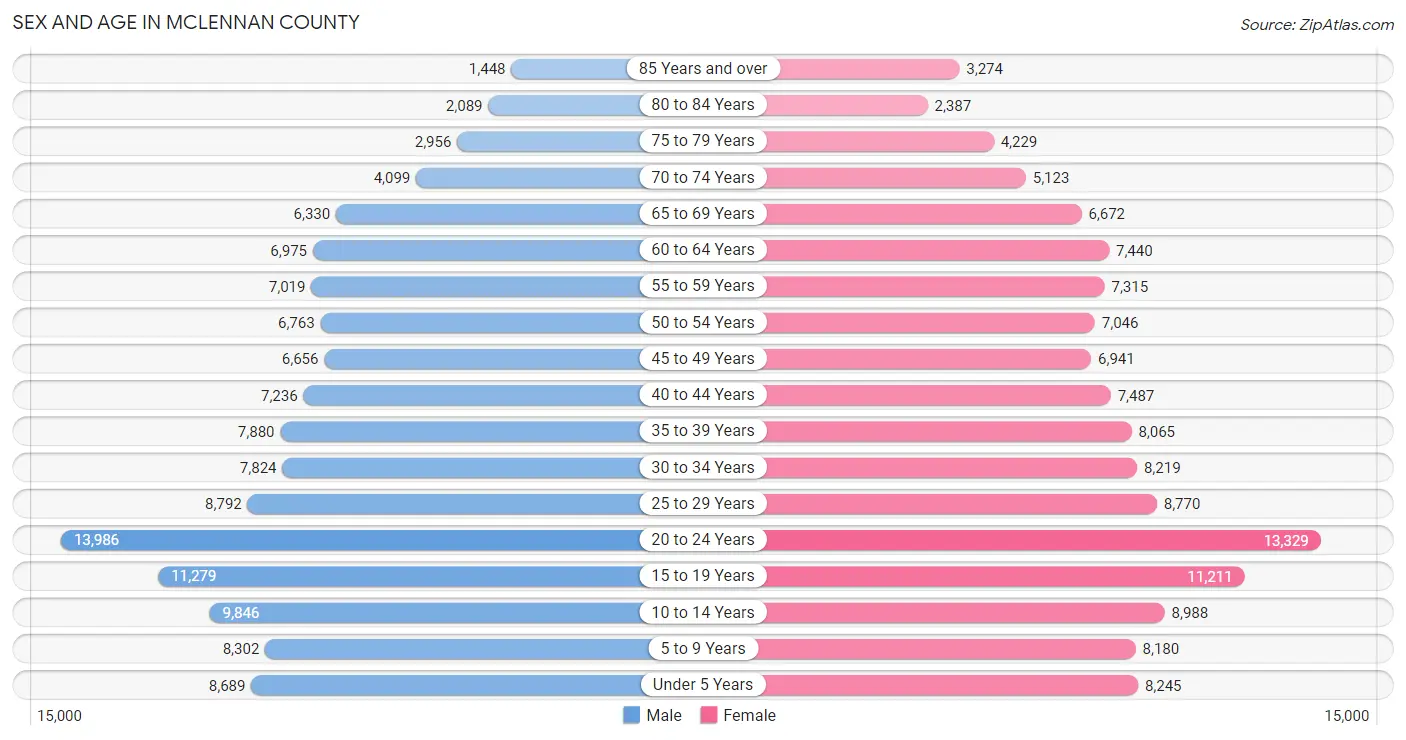
Sex and Age in McLennan County
Sex and Age in McLennan County
The most populous age groups in McLennan County are 20 to 24 Years (13,986 | 10.9%) for men and 20 to 24 Years (13,329 | 10.0%) for women.
| Age Bracket | Male | Female |
| Under 5 Years | 8,689 (6.8%) | 8,245 (6.2%) |
| 5 to 9 Years | 8,302 (6.5%) | 8,180 (6.1%) |
| 10 to 14 Years | 9,846 (7.7%) | 8,988 (6.8%) |
| 15 to 19 Years | 11,279 (8.8%) | 11,211 (8.4%) |
| 20 to 24 Years | 13,986 (10.9%) | 13,329 (10.0%) |
| 25 to 29 Years | 8,792 (6.9%) | 8,770 (6.6%) |
| 30 to 34 Years | 7,824 (6.1%) | 8,219 (6.2%) |
| 35 to 39 Years | 7,880 (6.1%) | 8,065 (6.1%) |
| 40 to 44 Years | 7,236 (5.7%) | 7,487 (5.6%) |
| 45 to 49 Years | 6,656 (5.2%) | 6,941 (5.2%) |
| 50 to 54 Years | 6,763 (5.3%) | 7,046 (5.3%) |
| 55 to 59 Years | 7,019 (5.5%) | 7,315 (5.5%) |
| 60 to 64 Years | 6,975 (5.4%) | 7,440 (5.6%) |
| 65 to 69 Years | 6,330 (4.9%) | 6,672 (5.0%) |
| 70 to 74 Years | 4,099 (3.2%) | 5,123 (3.8%) |
| 75 to 79 Years | 2,956 (2.3%) | 4,229 (3.2%) |
| 80 to 84 Years | 2,089 (1.6%) | 2,387 (1.8%) |
| 85 Years and over | 1,448 (1.1%) | 3,274 (2.5%) |
| Total | 128,169 (100.0%) | 132,921 (100.0%) |
Families and Households in McLennan County
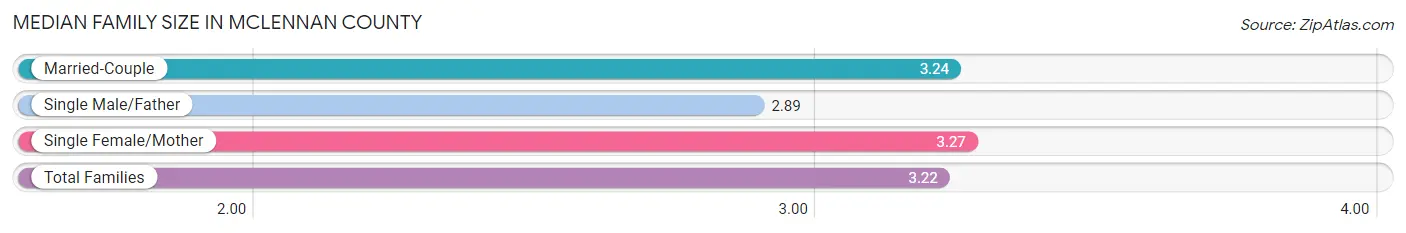
Median Family Size in McLennan County
The median family size in McLennan County is 3.22 persons per family, with single female/mother families (13,572 | 21.9%) accounting for the largest median family size of 3.27 persons per family. On the other hand, single male/father families (4,793 | 7.7%) represent the smallest median family size with 2.89 persons per family.
| Family Type | # Families | Family Size |
| Married-Couple | 43,679 (70.4%) | 3.24 |
| Single Male/Father | 4,793 (7.7%) | 2.89 |
| Single Female/Mother | 13,572 (21.9%) | 3.27 |
| Total Families | 62,044 (100.0%) | 3.22 |
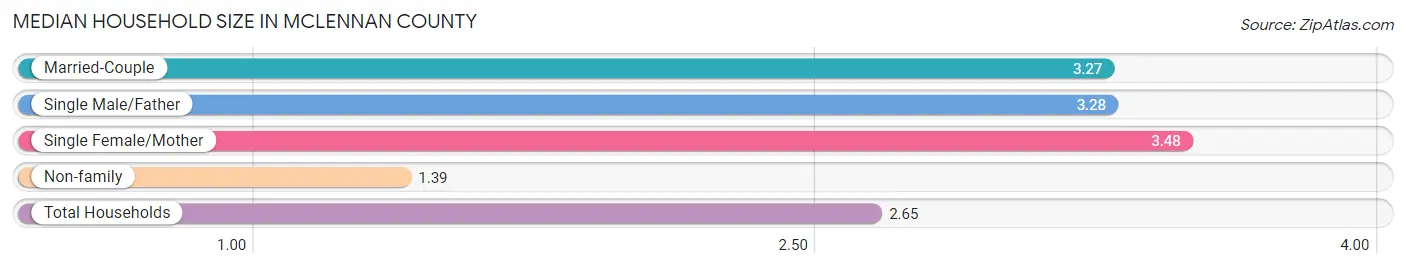
Median Household Size in McLennan County
The median household size in McLennan County is 2.65 persons per household, with single female/mother households (13,572 | 14.3%) accounting for the largest median household size of 3.48 persons per household. non-family households (32,941 | 34.7%) represent the smallest median household size with 1.39 persons per household.
| Household Type | # Households | Household Size |
| Married-Couple | 43,679 (46.0%) | 3.27 |
| Single Male/Father | 4,793 (5.1%) | 3.28 |
| Single Female/Mother | 13,572 (14.3%) | 3.48 |
| Non-family | 32,941 (34.7%) | 1.39 |
| Total Households | 94,985 (100.0%) | 2.65 |
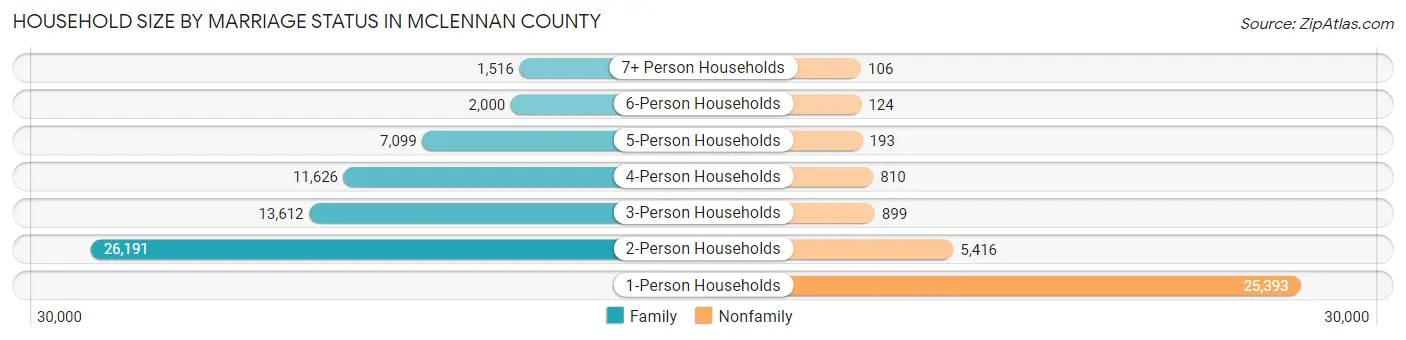
Household Size by Marriage Status in McLennan County
Out of a total of 94,985 households in McLennan County, 62,044 (65.3%) are family households, while 32,941 (34.7%) are nonfamily households. The most numerous type of family households are 2-person households, comprising 26,191, and the most common type of nonfamily households are 1-person households, comprising 25,393.
| Household Size | Family Households | Nonfamily Households |
| 1-Person Households | - | 25,393 (26.7%) |
| 2-Person Households | 26,191 (27.6%) | 5,416 (5.7%) |
| 3-Person Households | 13,612 (14.3%) | 899 (0.9%) |
| 4-Person Households | 11,626 (12.2%) | 810 (0.9%) |
| 5-Person Households | 7,099 (7.5%) | 193 (0.2%) |
| 6-Person Households | 2,000 (2.1%) | 124 (0.1%) |
| 7+ Person Households | 1,516 (1.6%) | 106 (0.1%) |
| Total | 62,044 (65.3%) | 32,941 (34.7%) |
Female Fertility in McLennan County
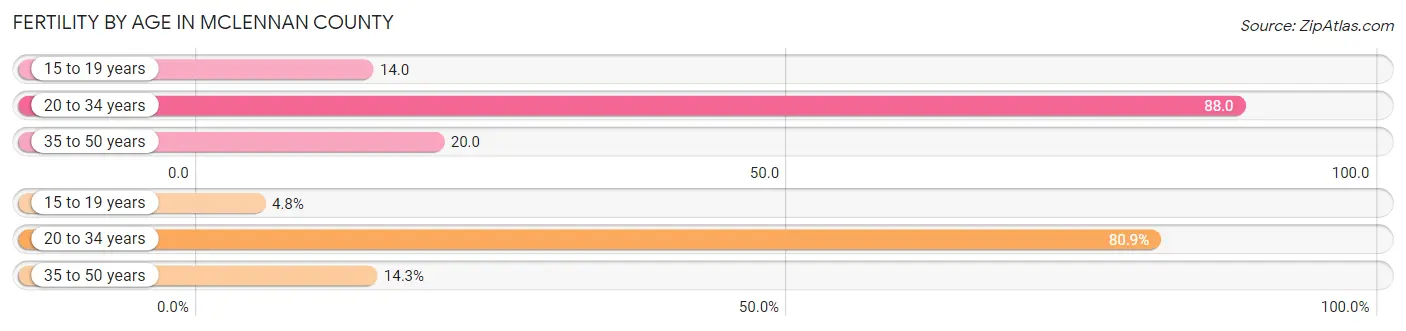
Fertility by Age in McLennan County
Average fertility rate in McLennan County is 51.0 births per 1,000 women. Women in the age bracket of 20 to 34 years have the highest fertility rate with 88.0 births per 1,000 women. Women in the age bracket of 20 to 34 years acount for 80.8% of all women with births.
| Age Bracket | Women with Births | Births / 1,000 Women |
| 15 to 19 years | 160 (4.8%) | 14.0 |
| 20 to 34 years | 2,681 (80.8%) | 88.0 |
| 35 to 50 years | 475 (14.3%) | 20.0 |
| Total | 3,316 (100.0%) | 51.0 |
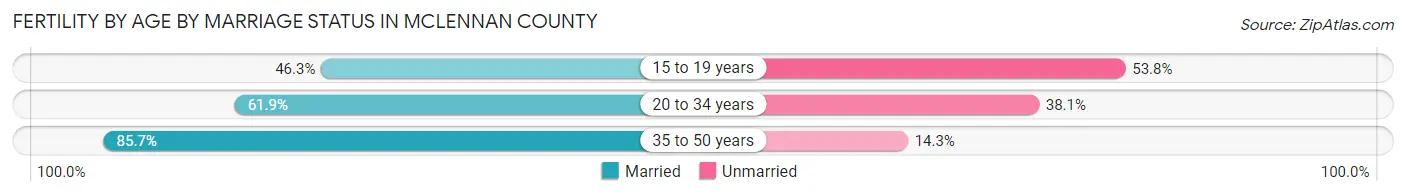
Fertility by Age by Marriage Status in McLennan County
64.6% of women with births (3,316) in McLennan County are married. The highest percentage of unmarried women with births falls into 15 to 19 years age bracket with 53.7% of them unmarried at the time of birth, while the lowest percentage of unmarried women with births belong to 35 to 50 years age bracket with 14.3% of them unmarried.
| Age Bracket | Married | Unmarried |
| 15 to 19 years | 74 (46.3%) | 86 (53.7%) |
| 20 to 34 years | 1,660 (61.9%) | 1,021 (38.1%) |
| 35 to 50 years | 407 (85.7%) | 68 (14.3%) |
| Total | 2,142 (64.6%) | 1,174 (35.4%) |
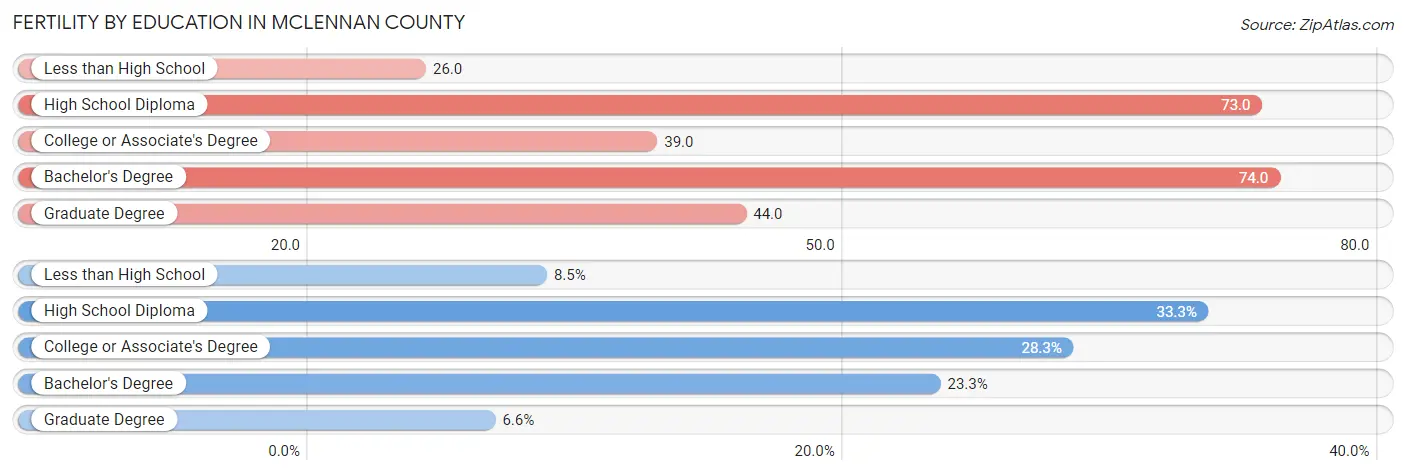
Fertility by Education in McLennan County
Average fertility rate in McLennan County is 51.0 births per 1,000 women. Women with the education attainment of bachelor's degree have the highest fertility rate of 74.0 births per 1,000 women, while women with the education attainment of less than high school have the lowest fertility at 26.0 births per 1,000 women. Women with the education attainment of high school diploma represent 33.3% of all women with births.
| Educational Attainment | Women with Births | Births / 1,000 Women |
| Less than High School | 283 (8.5%) | 26.0 |
| High School Diploma | 1,105 (33.3%) | 73.0 |
| College or Associate's Degree | 937 (28.3%) | 39.0 |
| Bachelor's Degree | 772 (23.3%) | 74.0 |
| Graduate Degree | 219 (6.6%) | 44.0 |
| Total | 3,316 (100.0%) | 51.0 |
Fertility by Education by Marriage Status in McLennan County
35.4% of women with births in McLennan County are unmarried. Women with the educational attainment of graduate degree are most likely to be married with 100.0% of them married at childbirth, while women with the educational attainment of less than high school are least likely to be married with 68.9% of them unmarried at childbirth.

| Educational Attainment | Married | Unmarried |
| Less than High School | 88 (31.1%) | 195 (68.9%) |
| High School Diploma | 612 (55.4%) | 493 (44.6%) |
| College or Associate's Degree | 520 (55.5%) | 417 (44.5%) |
| Bachelor's Degree | 702 (90.9%) | 70 (9.1%) |
| Graduate Degree | 219 (100.0%) | 0 (0.0%) |
| Total | 2,142 (64.6%) | 1,174 (35.4%) |
Income in McLennan County
Income Overview in McLennan County
Per Capita Income in McLennan County is $31,036, while median incomes of families and households are $78,657 and $59,781 respectively.
| Characteristic | Number | Measure |
| Per Capita Income | 261,090 | $31,036 |
| Median Family Income | 62,044 | $78,657 |
| Mean Family Income | 62,044 | $100,189 |
| Median Household Income | 94,985 | $59,781 |
| Mean Household Income | 94,985 | $82,845 |
| Income Deficit | 62,044 | $10,902 |
| Wage / Income Gap (%) | 261,090 | 29.70% |
| Wage / Income Gap ($) | 261,090 | 70.30¢ per $1 |
| Gini / Inequality Index | 261,090 | 0.48 |
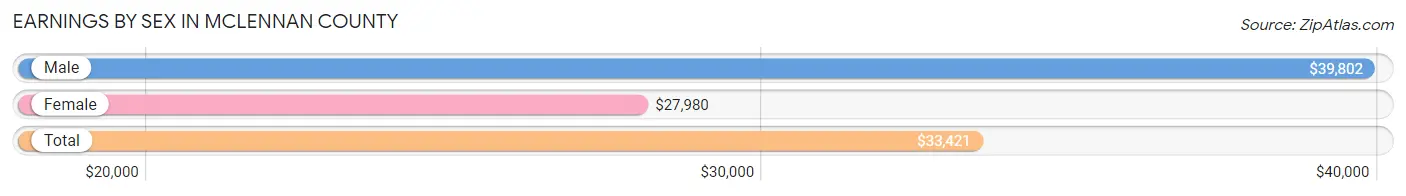
Earnings by Sex in McLennan County
Average Earnings in McLennan County are $33,421, $39,802 for men and $27,980 for women, a difference of 29.7%.
| Sex | Number | Average Earnings |
| Male | 69,929 (51.7%) | $39,802 |
| Female | 65,443 (48.3%) | $27,980 |
| Total | 135,372 (100.0%) | $33,421 |
Earnings by Sex by Income Bracket in McLennan County
The most common earnings brackets in McLennan County are $100,000+ for men (9,765 | 14.0%) and $25,000 to $29,999 for women (5,492 | 8.4%).
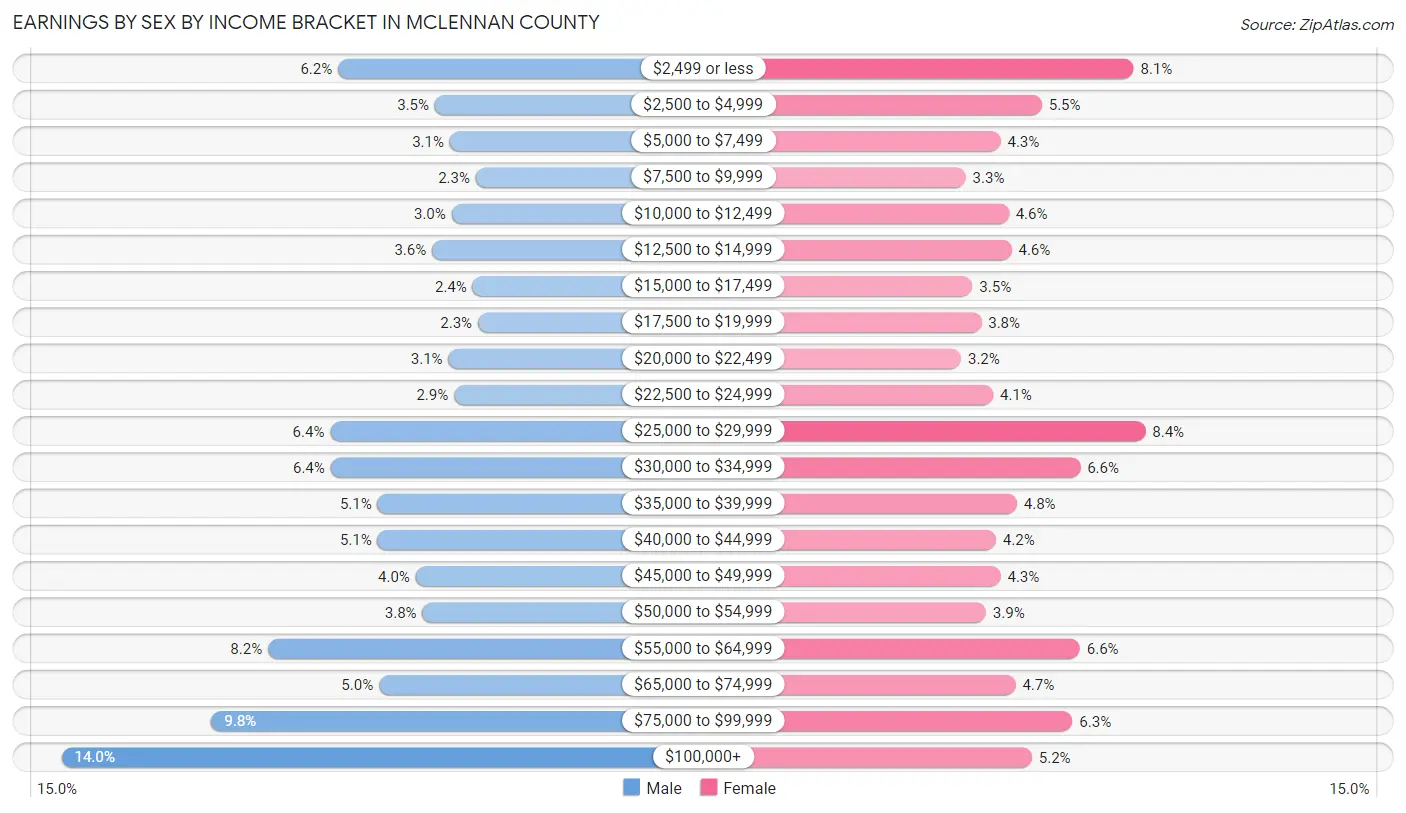
| Income | Male | Female |
| $2,499 or less | 4,329 (6.2%) | 5,273 (8.1%) |
| $2,500 to $4,999 | 2,428 (3.5%) | 3,584 (5.5%) |
| $5,000 to $7,499 | 2,131 (3.0%) | 2,825 (4.3%) |
| $7,500 to $9,999 | 1,625 (2.3%) | 2,188 (3.3%) |
| $10,000 to $12,499 | 2,098 (3.0%) | 2,979 (4.5%) |
| $12,500 to $14,999 | 2,483 (3.5%) | 3,030 (4.6%) |
| $15,000 to $17,499 | 1,686 (2.4%) | 2,310 (3.5%) |
| $17,500 to $19,999 | 1,582 (2.3%) | 2,472 (3.8%) |
| $20,000 to $22,499 | 2,164 (3.1%) | 2,100 (3.2%) |
| $22,500 to $24,999 | 2,050 (2.9%) | 2,691 (4.1%) |
| $25,000 to $29,999 | 4,485 (6.4%) | 5,492 (8.4%) |
| $30,000 to $34,999 | 4,476 (6.4%) | 4,294 (6.6%) |
| $35,000 to $39,999 | 3,553 (5.1%) | 3,125 (4.8%) |
| $40,000 to $44,999 | 3,549 (5.1%) | 2,742 (4.2%) |
| $45,000 to $49,999 | 2,804 (4.0%) | 2,829 (4.3%) |
| $50,000 to $54,999 | 2,674 (3.8%) | 2,560 (3.9%) |
| $55,000 to $64,999 | 5,704 (8.2%) | 4,288 (6.6%) |
| $65,000 to $74,999 | 3,526 (5.0%) | 3,105 (4.7%) |
| $75,000 to $99,999 | 6,817 (9.8%) | 4,151 (6.3%) |
| $100,000+ | 9,765 (14.0%) | 3,405 (5.2%) |
| Total | 69,929 (100.0%) | 65,443 (100.0%) |
Earnings by Sex by Educational Attainment in McLennan County
Average earnings in McLennan County are $50,798 for men and $35,147 for women, a difference of 30.8%. Men with an educational attainment of graduate degree enjoy the highest average annual earnings of $95,478, while those with less than high school education earn the least with $31,617. Women with an educational attainment of graduate degree earn the most with the average annual earnings of $66,427, while those with less than high school education have the smallest earnings of $20,922.
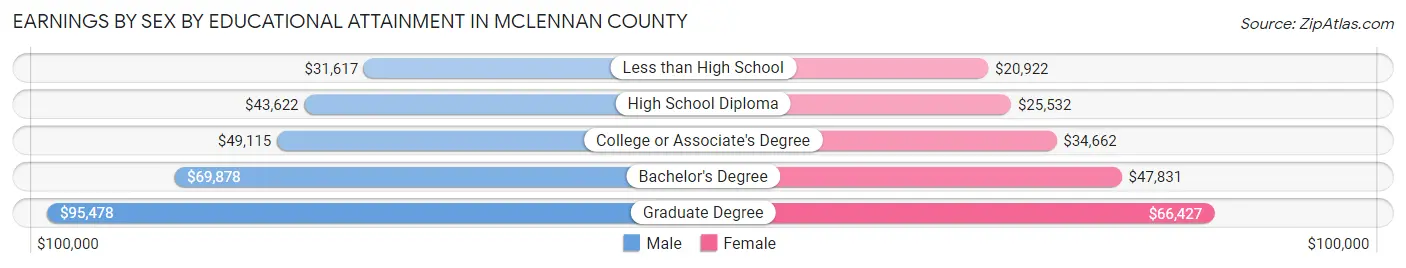
| Educational Attainment | Male Income | Female Income |
| Less than High School | $31,617 | $20,922 |
| High School Diploma | $43,622 | $25,532 |
| College or Associate's Degree | $49,115 | $34,662 |
| Bachelor's Degree | $69,878 | $47,831 |
| Graduate Degree | $95,478 | $66,427 |
| Total | $50,798 | $35,147 |
Family Income in McLennan County
Family Income Brackets in McLennan County
According to the McLennan County family income data, there are 12,161 families falling into the $100,000 to $149,999 income range, which is the most common income bracket and makes up 19.6% of all families. Conversely, the $10,000 to $14,999 income bracket is the least frequent group with only 1,489 families (2.4%) belonging to this category.

| Income Bracket | # Families | % Families |
| Less than $10,000 | 2,544 | 4.1% |
| $10,000 to $14,999 | 1,489 | 2.4% |
| $15,000 to $24,999 | 3,847 | 6.2% |
| $25,000 to $34,999 | 4,591 | 7.4% |
| $35,000 to $49,999 | 7,073 | 11.4% |
| $50,000 to $74,999 | 10,175 | 16.4% |
| $75,000 to $99,999 | 8,810 | 14.2% |
| $100,000 to $149,999 | 12,161 | 19.6% |
| $150,000 to $199,999 | 5,832 | 9.4% |
| $200,000+ | 5,522 | 8.9% |
Family Income by Famaliy Size in McLennan County
4-person families (11,203 | 18.1%) account for the highest median family income in McLennan County with $91,597 per family, while 2-person families (28,097 | 45.3%) have the highest median income of $35,714 per family member.
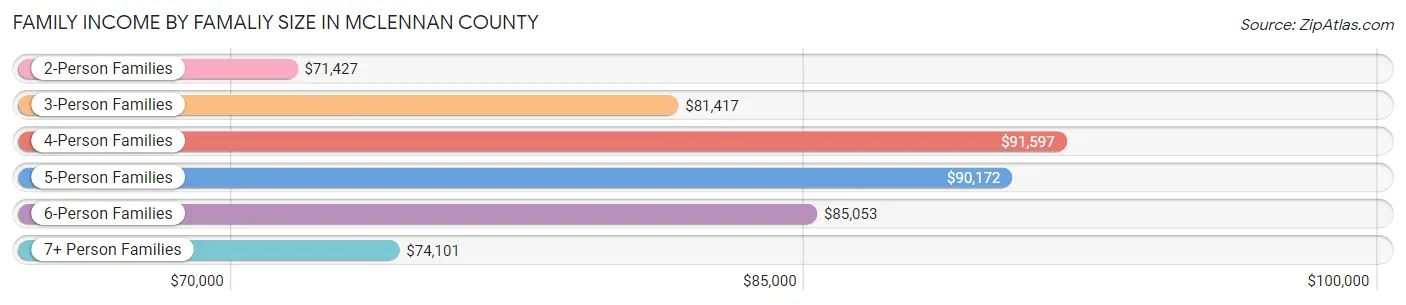
| Income Bracket | # Families | Median Income |
| 2-Person Families | 28,097 (45.3%) | $71,427 |
| 3-Person Families | 13,288 (21.4%) | $81,417 |
| 4-Person Families | 11,203 (18.1%) | $91,597 |
| 5-Person Families | 6,133 (9.9%) | $90,172 |
| 6-Person Families | 1,950 (3.1%) | $85,053 |
| 7+ Person Families | 1,373 (2.2%) | $74,101 |
| Total | 62,044 (100.0%) | $78,657 |
Family Income by Number of Earners in McLennan County
The median family income in McLennan County is $78,657, with families comprising 3+ earners (6,602) having the highest median family income of $127,224, while families with no earners (8,847) have the lowest median family income of $42,030, accounting for 10.6% and 14.3% of families, respectively.
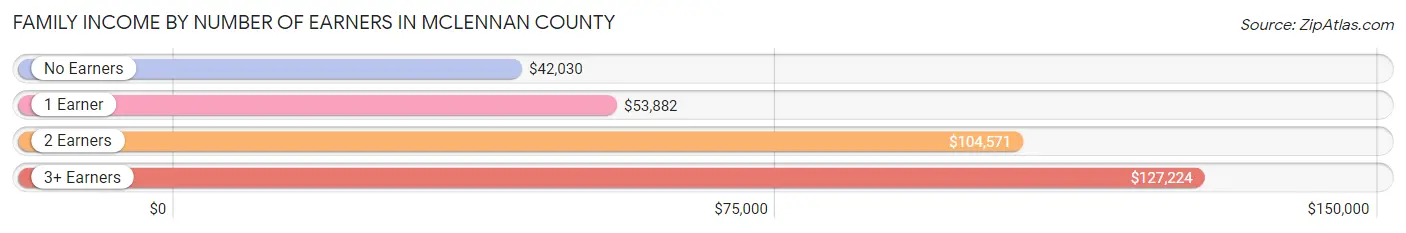
| Number of Earners | # Families | Median Income |
| No Earners | 8,847 (14.3%) | $42,030 |
| 1 Earner | 21,652 (34.9%) | $53,882 |
| 2 Earners | 24,943 (40.2%) | $104,571 |
| 3+ Earners | 6,602 (10.6%) | $127,224 |
| Total | 62,044 (100.0%) | $78,657 |
Household Income in McLennan County
Household Income Brackets in McLennan County
With 15,578 households falling in the category, the $50,000 to $74,999 income range is the most frequent in McLennan County, accounting for 16.4% of all households. In contrast, only 4,179 households (4.4%) fall into the $10,000 to $14,999 income bracket, making it the least populous group.
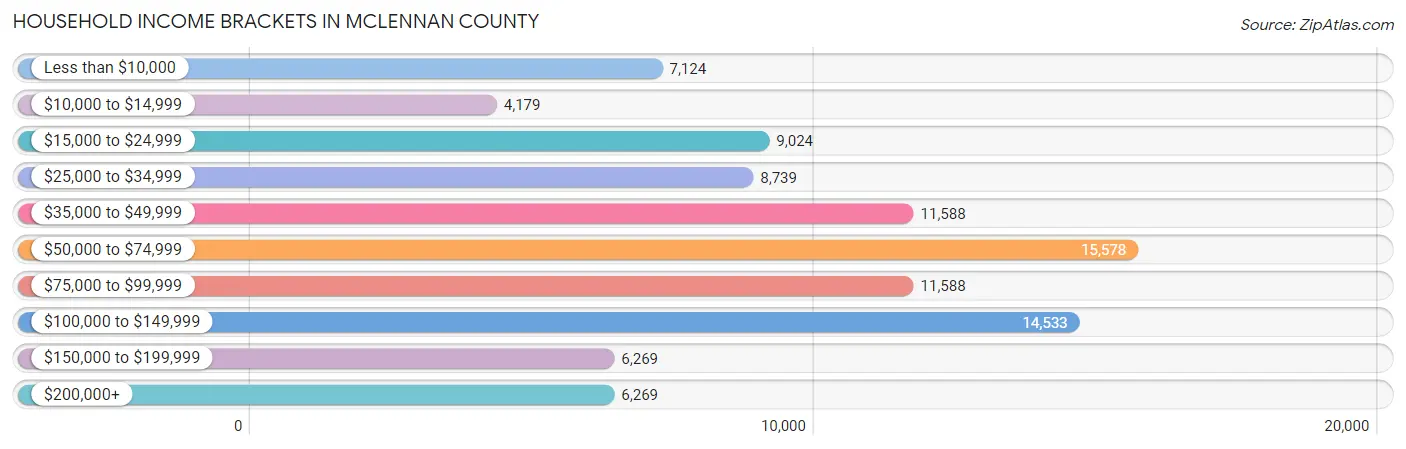
| Income Bracket | # Households | % Households |
| Less than $10,000 | 7,124 | 7.5% |
| $10,000 to $14,999 | 4,179 | 4.4% |
| $15,000 to $24,999 | 9,024 | 9.5% |
| $25,000 to $34,999 | 8,739 | 9.2% |
| $35,000 to $49,999 | 11,588 | 12.2% |
| $50,000 to $74,999 | 15,578 | 16.4% |
| $75,000 to $99,999 | 11,588 | 12.2% |
| $100,000 to $149,999 | 14,533 | 15.3% |
| $150,000 to $199,999 | 6,269 | 6.6% |
| $200,000+ | 6,269 | 6.6% |
Household Income by Householder Age in McLennan County
The median household income in McLennan County is $59,781, with the highest median household income of $80,609 found in the 45 to 64 years age bracket for the primary householder. A total of 31,305 households (33.0%) fall into this category. Meanwhile, the 15 to 24 years age bracket for the primary householder has the lowest median household income of $25,331, with 9,101 households (9.6%) in this group.
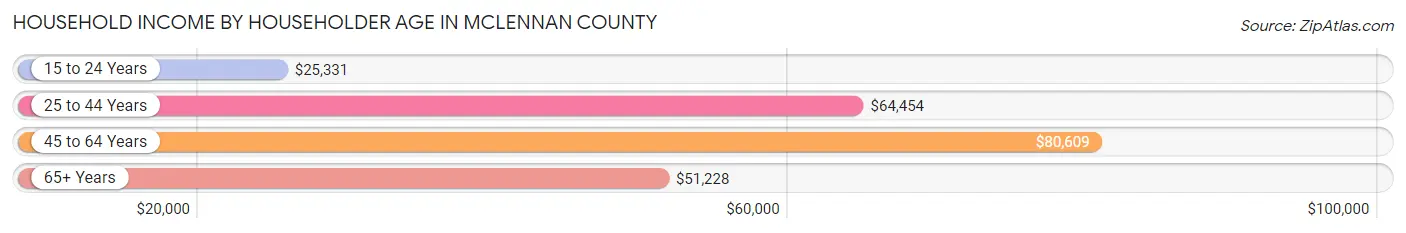
| Income Bracket | # Households | Median Income |
| 15 to 24 Years | 9,101 (9.6%) | $25,331 |
| 25 to 44 Years | 30,792 (32.4%) | $64,454 |
| 45 to 64 Years | 31,305 (33.0%) | $80,609 |
| 65+ Years | 23,787 (25.0%) | $51,228 |
| Total | 94,985 (100.0%) | $59,781 |
Poverty in McLennan County
Income Below Poverty by Sex and Age in McLennan County
With 16.5% poverty level for males and 19.2% for females among the residents of McLennan County, 18 to 24 year old males and 18 to 24 year old females are the most vulnerable to poverty, with 6,033 males (35.8%) and 6,781 females (40.6%) in their respective age groups living below the poverty level.
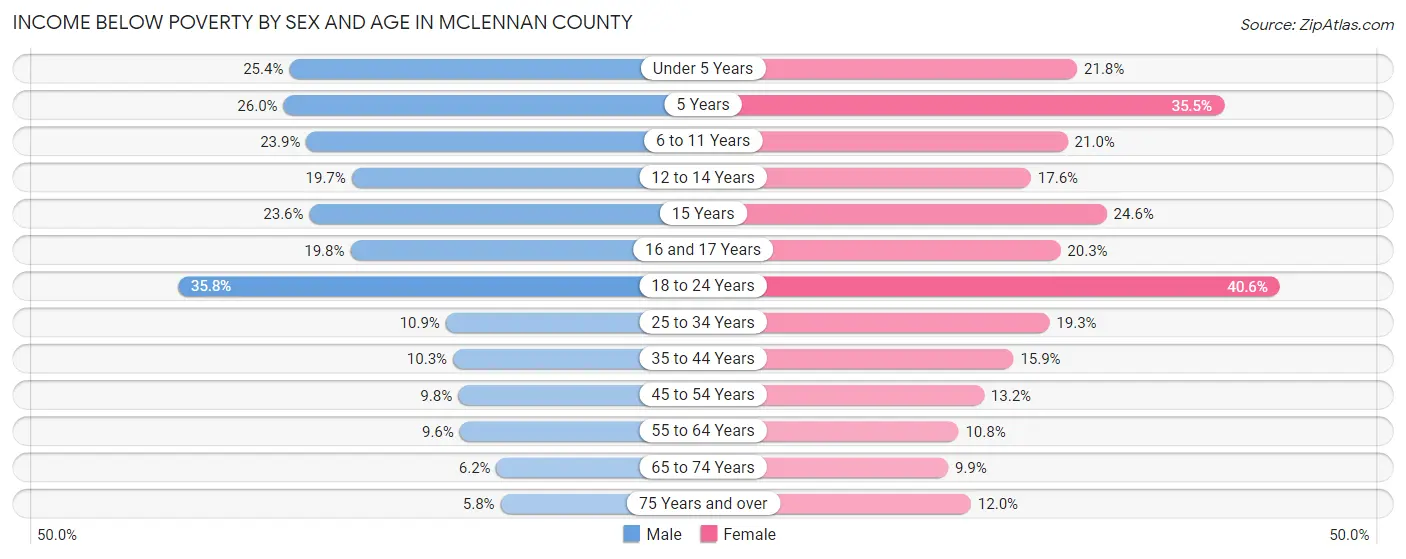
| Age Bracket | Male | Female |
| Under 5 Years | 2,152 (25.4%) | 1,748 (21.8%) |
| 5 Years | 358 (26.0%) | 615 (35.4%) |
| 6 to 11 Years | 2,611 (23.9%) | 2,096 (21.0%) |
| 12 to 14 Years | 1,056 (19.7%) | 937 (17.5%) |
| 15 Years | 440 (23.6%) | 508 (24.6%) |
| 16 and 17 Years | 682 (19.8%) | 613 (20.3%) |
| 18 to 24 Years | 6,033 (35.8%) | 6,781 (40.6%) |
| 25 to 34 Years | 1,760 (10.9%) | 3,243 (19.3%) |
| 35 to 44 Years | 1,499 (10.2%) | 2,459 (15.9%) |
| 45 to 54 Years | 1,289 (9.8%) | 1,829 (13.2%) |
| 55 to 64 Years | 1,324 (9.6%) | 1,590 (10.8%) |
| 65 to 74 Years | 641 (6.2%) | 1,136 (9.9%) |
| 75 Years and over | 363 (5.8%) | 1,088 (12.0%) |
| Total | 20,208 (16.5%) | 24,643 (19.2%) |
Income Above Poverty by Sex and Age in McLennan County
According to the poverty statistics in McLennan County, males aged 75 years and over and females aged 65 to 74 years are the age groups that are most secure financially, with 94.2% of males and 90.1% of females in these age groups living above the poverty line.
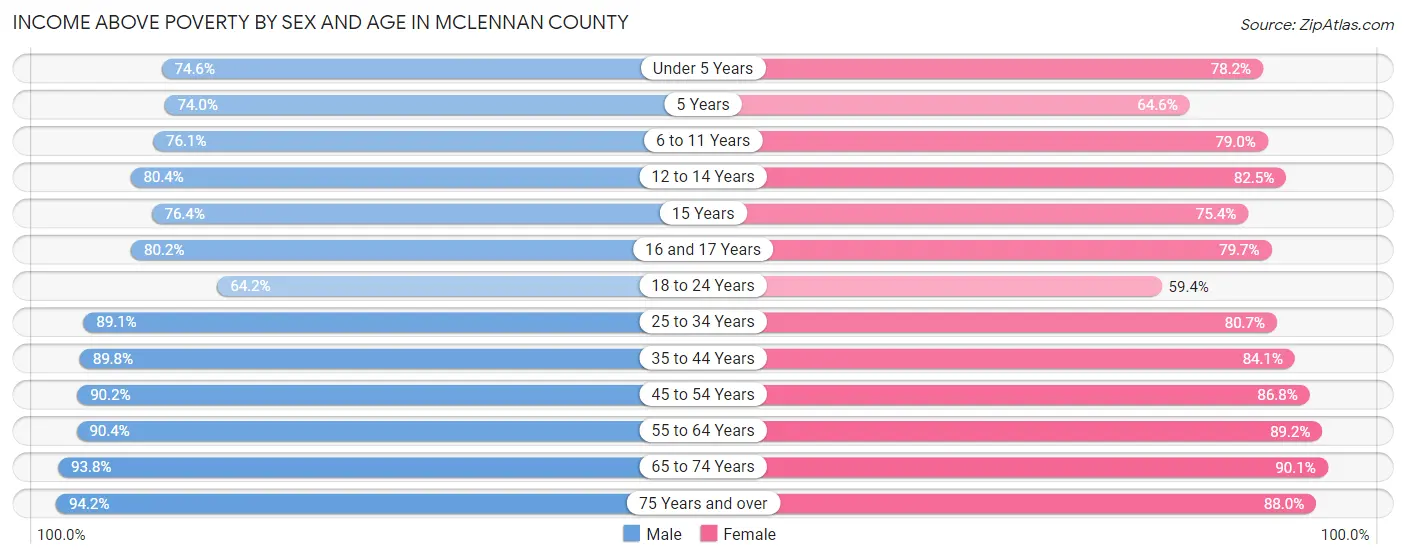
| Age Bracket | Male | Female |
| Under 5 Years | 6,306 (74.6%) | 6,257 (78.2%) |
| 5 Years | 1,020 (74.0%) | 1,120 (64.5%) |
| 6 to 11 Years | 8,333 (76.1%) | 7,903 (79.0%) |
| 12 to 14 Years | 4,317 (80.3%) | 4,403 (82.5%) |
| 15 Years | 1,427 (76.4%) | 1,559 (75.4%) |
| 16 and 17 Years | 2,768 (80.2%) | 2,408 (79.7%) |
| 18 to 24 Years | 10,834 (64.2%) | 9,907 (59.4%) |
| 25 to 34 Years | 14,364 (89.1%) | 13,583 (80.7%) |
| 35 to 44 Years | 13,127 (89.7%) | 12,974 (84.1%) |
| 45 to 54 Years | 11,891 (90.2%) | 12,042 (86.8%) |
| 55 to 64 Years | 12,425 (90.4%) | 13,098 (89.2%) |
| 65 to 74 Years | 9,686 (93.8%) | 10,388 (90.1%) |
| 75 Years and over | 5,852 (94.2%) | 7,997 (88.0%) |
| Total | 102,350 (83.5%) | 103,639 (80.8%) |
Income Below Poverty Among Married-Couple Families in McLennan County
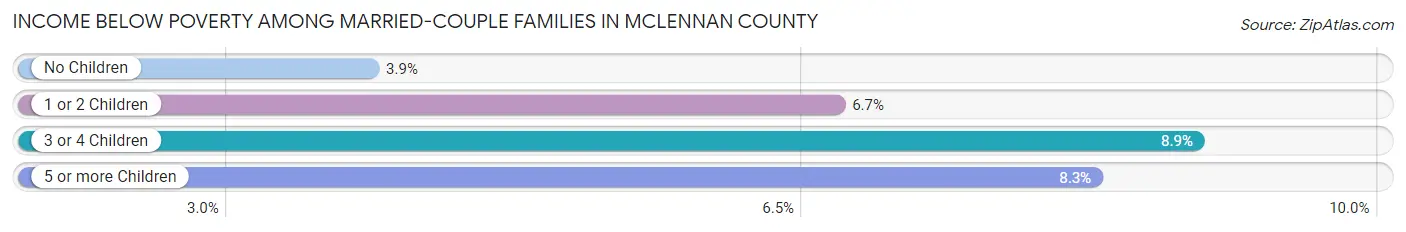
The poverty statistics for married-couple families in McLennan County show that 5.3% or 2,321 of the total 43,679 families live below the poverty line. Families with 3 or 4 children have the highest poverty rate of 8.9%, comprising of 413 families. On the other hand, families with no children have the lowest poverty rate of 3.9%, which includes 977 families.
| Children | Above Poverty | Below Poverty |
| No Children | 24,309 (96.1%) | 977 (3.9%) |
| 1 or 2 Children | 12,216 (93.3%) | 877 (6.7%) |
| 3 or 4 Children | 4,234 (91.1%) | 413 (8.9%) |
| 5 or more Children | 599 (91.7%) | 54 (8.3%) |
| Total | 41,358 (94.7%) | 2,321 (5.3%) |
Income Below Poverty Among Single-Parent Households in McLennan County
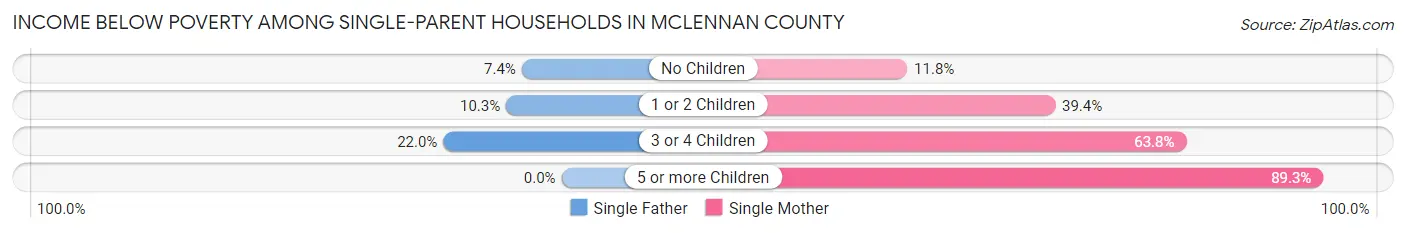
According to the poverty data in McLennan County, 10.1% or 482 single-father households and 34.6% or 4,695 single-mother households are living below the poverty line. Among single-father households, those with 3 or 4 children have the highest poverty rate, with 87 households (22.0%) experiencing poverty. Likewise, among single-mother households, those with 5 or more children have the highest poverty rate, with 117 households (89.3%) falling below the poverty line.
| Children | Single Father | Single Mother |
| No Children | 150 (7.4%) | 523 (11.8%) |
| 1 or 2 Children | 245 (10.3%) | 2,736 (39.4%) |
| 3 or 4 Children | 87 (22.0%) | 1,319 (63.8%) |
| 5 or more Children | 0 (0.0%) | 117 (89.3%) |
| Total | 482 (10.1%) | 4,695 (34.6%) |
Income Below Poverty Among Married-Couple vs Single-Parent Households in McLennan County
The poverty data for McLennan County shows that 2,321 of the married-couple family households (5.3%) and 5,177 of the single-parent households (28.2%) are living below the poverty level. Within the married-couple family households, those with 3 or 4 children have the highest poverty rate, with 413 households (8.9%) falling below the poverty line. Among the single-parent households, those with 5 or more children have the highest poverty rate, with 117 household (89.3%) living below poverty.

| Children | Married-Couple Families | Single-Parent Households |
| No Children | 977 (3.9%) | 673 (10.4%) |
| 1 or 2 Children | 877 (6.7%) | 2,981 (32.0%) |
| 3 or 4 Children | 413 (8.9%) | 1,406 (57.1%) |
| 5 or more Children | 54 (8.3%) | 117 (89.3%) |
| Total | 2,321 (5.3%) | 5,177 (28.2%) |
Employment Characteristics in McLennan County
Employment by Class of Employer in McLennan County
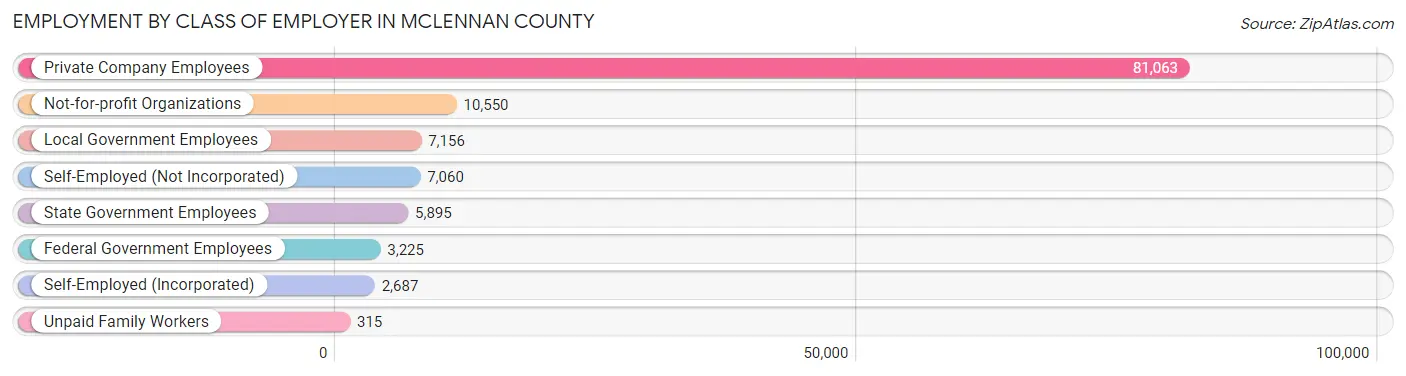
Among the 117,951 employed individuals in McLennan County, private company employees (81,063 | 68.7%), not-for-profit organizations (10,550 | 8.9%), and local government employees (7,156 | 6.1%) make up the most common classes of employment.
| Employer Class | # Employees | % Employees |
| Private Company Employees | 81,063 | 68.7% |
| Self-Employed (Incorporated) | 2,687 | 2.3% |
| Self-Employed (Not Incorporated) | 7,060 | 6.0% |
| Not-for-profit Organizations | 10,550 | 8.9% |
| Local Government Employees | 7,156 | 6.1% |
| State Government Employees | 5,895 | 5.0% |
| Federal Government Employees | 3,225 | 2.7% |
| Unpaid Family Workers | 315 | 0.3% |
| Total | 117,951 | 100.0% |
Employment Status by Age in McLennan County
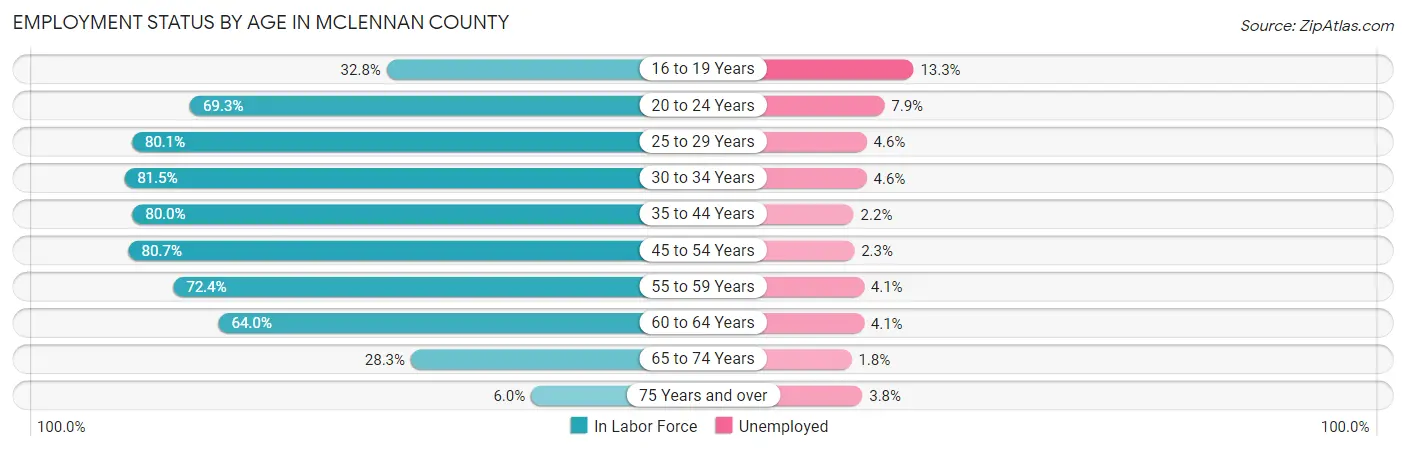
According to the labor force statistics for McLennan County, out of the total population over 16 years of age (204,820), 61.4% or 125,759 individuals are in the labor force, with 4.4% or 5,533 of them unemployed. The age group with the highest labor force participation rate is 30 to 34 years, with 81.5% or 13,075 individuals in the labor force. Within the labor force, the 16 to 19 years age range has the highest percentage of unemployed individuals, with 13.3% or 806 of them being unemployed.
| Age Bracket | In Labor Force | Unemployed |
| 16 to 19 Years | 6,058 (32.8%) | 806 (13.3%) |
| 20 to 24 Years | 18,929 (69.3%) | 1,495 (7.9%) |
| 25 to 29 Years | 14,067 (80.1%) | 647 (4.6%) |
| 30 to 34 Years | 13,075 (81.5%) | 601 (4.6%) |
| 35 to 44 Years | 24,534 (80.0%) | 540 (2.2%) |
| 45 to 54 Years | 22,117 (80.7%) | 509 (2.3%) |
| 55 to 59 Years | 10,378 (72.4%) | 425 (4.1%) |
| 60 to 64 Years | 9,226 (64.0%) | 378 (4.1%) |
| 65 to 74 Years | 6,289 (28.3%) | 113 (1.8%) |
| 75 Years and over | 983 (6.0%) | 37 (3.8%) |
| Total | 125,759 (61.4%) | 5,533 (4.4%) |
Employment Status by Educational Attainment in McLennan County
According to labor force statistics for McLennan County, 77.6% of individuals (93,452) out of the total population between 25 and 64 years of age (120,428) are in the labor force, with 3.3% or 3,084 of them being unemployed. The group with the highest labor force participation rate are those with the educational attainment of bachelor's degree or higher, with 87.8% or 28,678 individuals in the labor force. Within the labor force, individuals with high school diploma education have the highest percentage of unemployment, with 4.7% or 1,062 of them being unemployed.
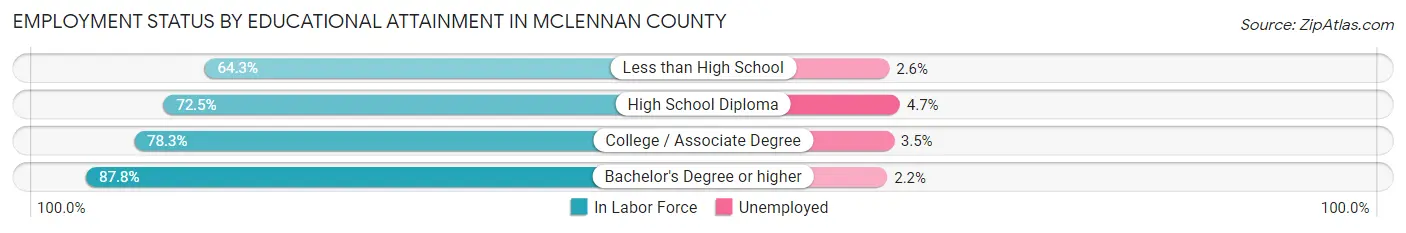
| Educational Attainment | In Labor Force | Unemployed |
| Less than High School | 10,212 (64.3%) | 413 (2.6%) |
| High School Diploma | 22,606 (72.5%) | 1,465 (4.7%) |
| College / Associate Degree | 31,870 (78.3%) | 1,425 (3.5%) |
| Bachelor's Degree or higher | 28,678 (87.8%) | 719 (2.2%) |
| Total | 93,452 (77.6%) | 3,974 (3.3%) |
Employment Occupations by Sex in McLennan County
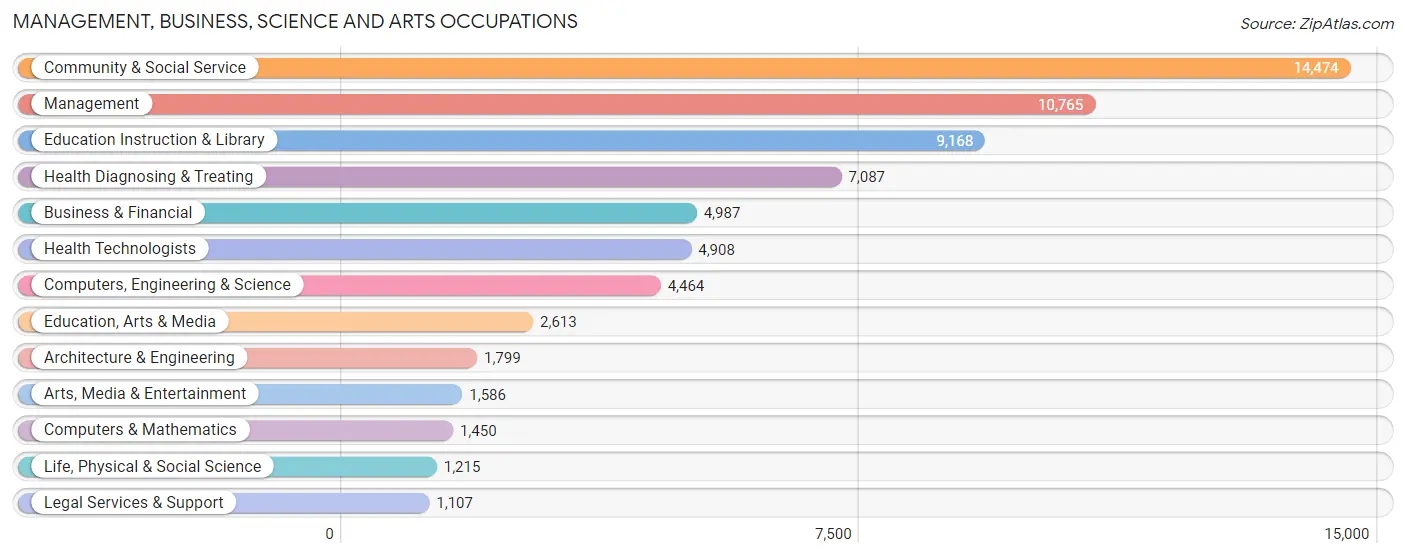
Management, Business, Science and Arts Occupations
The most common Management, Business, Science and Arts occupations in McLennan County are Community & Social Service (14,474 | 12.1%), Management (10,765 | 9.0%), Education Instruction & Library (9,168 | 7.6%), Health Diagnosing & Treating (7,087 | 5.9%), and Business & Financial (4,987 | 4.2%).
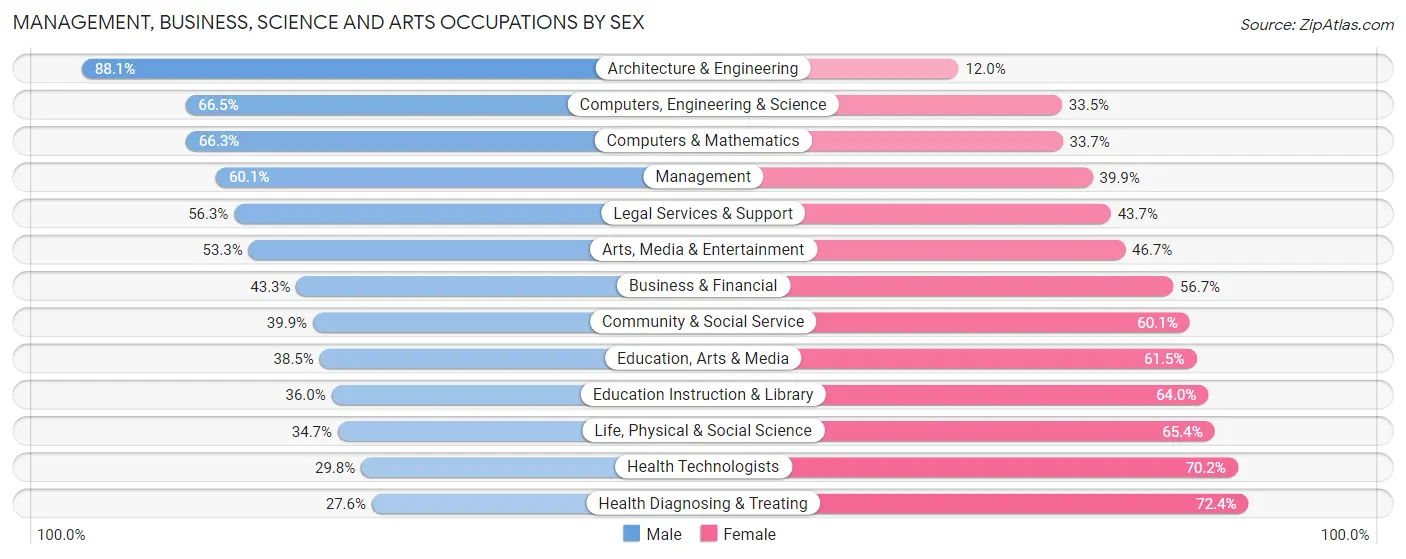
Management, Business, Science and Arts Occupations by Sex
Within the Management, Business, Science and Arts occupations in McLennan County, the most male-oriented occupations are Architecture & Engineering (88.0%), Computers, Engineering & Science (66.5%), and Computers & Mathematics (66.3%), while the most female-oriented occupations are Health Diagnosing & Treating (72.4%), Health Technologists (70.2%), and Life, Physical & Social Science (65.3%).
| Occupation | Male | Female |
| Management | 6,467 (60.1%) | 4,298 (39.9%) |
| Business & Financial | 2,160 (43.3%) | 2,827 (56.7%) |
| Computers, Engineering & Science | 2,967 (66.5%) | 1,497 (33.5%) |
| Computers & Mathematics | 962 (66.3%) | 488 (33.7%) |
| Architecture & Engineering | 1,584 (88.0%) | 215 (11.9%) |
| Life, Physical & Social Science | 421 (34.6%) | 794 (65.3%) |
| Community & Social Service | 5,770 (39.9%) | 8,704 (60.1%) |
| Education, Arts & Media | 1,005 (38.5%) | 1,608 (61.5%) |
| Legal Services & Support | 623 (56.3%) | 484 (43.7%) |
| Education Instruction & Library | 3,297 (36.0%) | 5,871 (64.0%) |
| Arts, Media & Entertainment | 845 (53.3%) | 741 (46.7%) |
| Health Diagnosing & Treating | 1,954 (27.6%) | 5,133 (72.4%) |
| Health Technologists | 1,463 (29.8%) | 3,445 (70.2%) |
| Total (Category) | 19,318 (46.2%) | 22,459 (53.8%) |
| Total (Overall) | 62,513 (52.1%) | 57,458 (47.9%) |
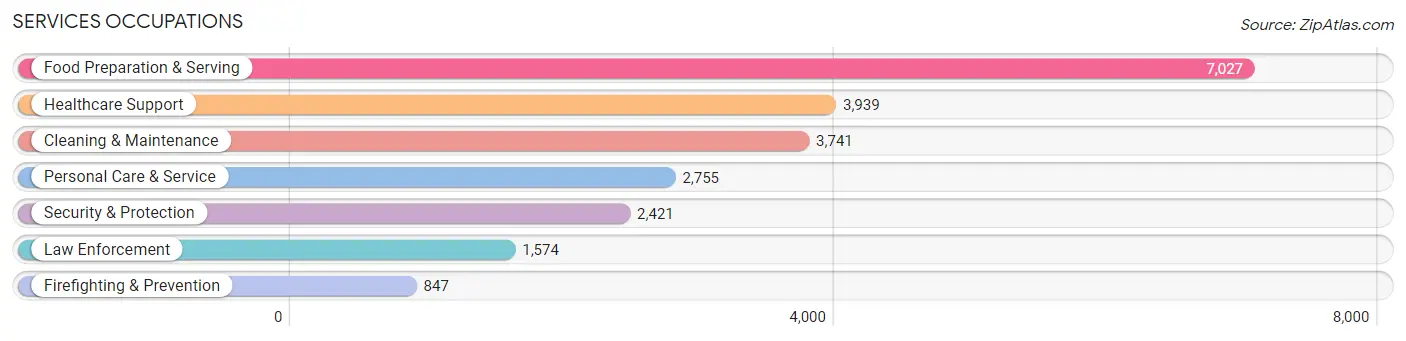
Services Occupations
The most common Services occupations in McLennan County are Food Preparation & Serving (7,027 | 5.9%), Healthcare Support (3,939 | 3.3%), Cleaning & Maintenance (3,741 | 3.1%), Personal Care & Service (2,755 | 2.3%), and Security & Protection (2,421 | 2.0%).
Services Occupations by Sex
Within the Services occupations in McLennan County, the most male-oriented occupations are Firefighting & Prevention (82.3%), Security & Protection (72.5%), and Law Enforcement (67.2%), while the most female-oriented occupations are Healthcare Support (90.9%), Personal Care & Service (76.0%), and Food Preparation & Serving (61.5%).
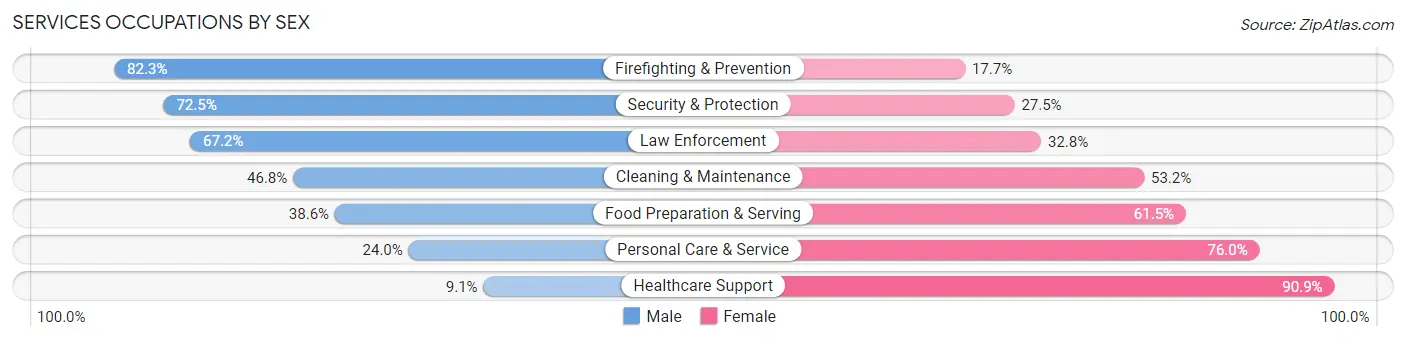
| Occupation | Male | Female |
| Healthcare Support | 360 (9.1%) | 3,579 (90.9%) |
| Security & Protection | 1,755 (72.5%) | 666 (27.5%) |
| Firefighting & Prevention | 697 (82.3%) | 150 (17.7%) |
| Law Enforcement | 1,058 (67.2%) | 516 (32.8%) |
| Food Preparation & Serving | 2,709 (38.6%) | 4,318 (61.5%) |
| Cleaning & Maintenance | 1,752 (46.8%) | 1,989 (53.2%) |
| Personal Care & Service | 660 (24.0%) | 2,095 (76.0%) |
| Total (Category) | 7,236 (36.4%) | 12,647 (63.6%) |
| Total (Overall) | 62,513 (52.1%) | 57,458 (47.9%) |
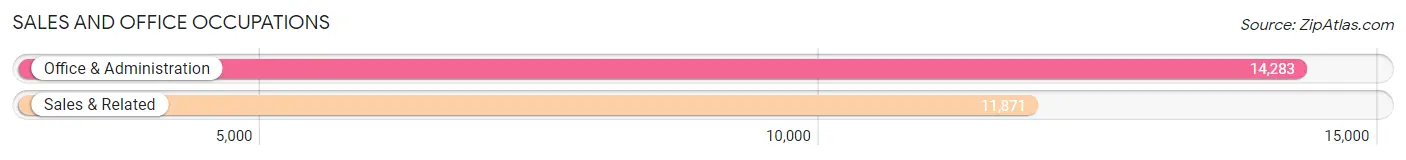
Sales and Office Occupations
The most common Sales and Office occupations in McLennan County are Office & Administration (14,283 | 11.9%), and Sales & Related (11,871 | 9.9%).
Sales and Office Occupations by Sex
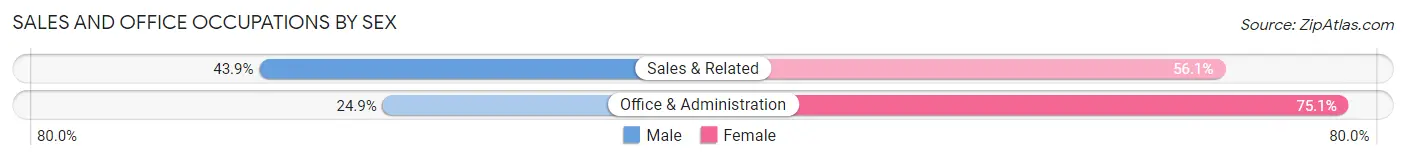
| Occupation | Male | Female |
| Sales & Related | 5,211 (43.9%) | 6,660 (56.1%) |
| Office & Administration | 3,561 (24.9%) | 10,722 (75.1%) |
| Total (Category) | 8,772 (33.5%) | 17,382 (66.5%) |
| Total (Overall) | 62,513 (52.1%) | 57,458 (47.9%) |
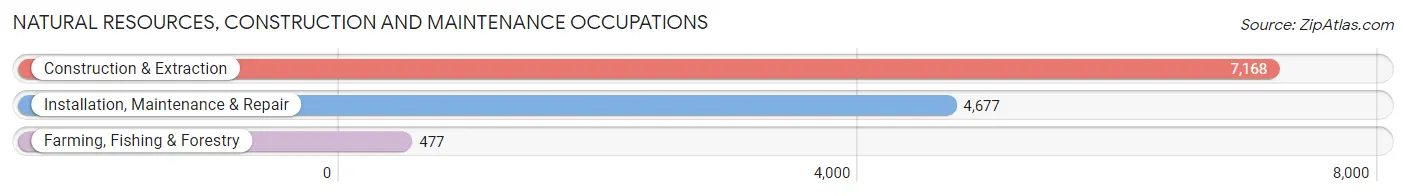
Natural Resources, Construction and Maintenance Occupations
The most common Natural Resources, Construction and Maintenance occupations in McLennan County are Construction & Extraction (7,168 | 6.0%), Installation, Maintenance & Repair (4,677 | 3.9%), and Farming, Fishing & Forestry (477 | 0.4%).
Natural Resources, Construction and Maintenance Occupations by Sex
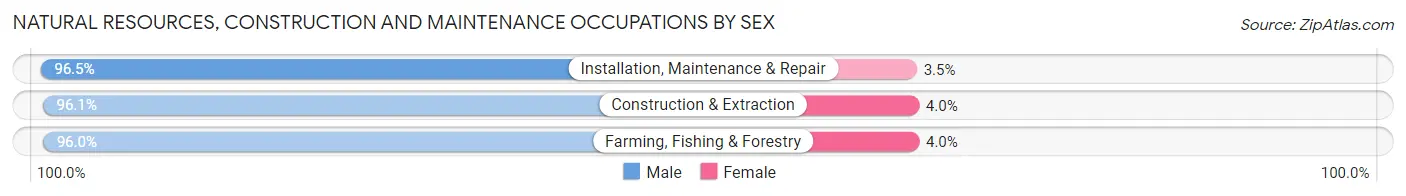
| Occupation | Male | Female |
| Farming, Fishing & Forestry | 458 (96.0%) | 19 (4.0%) |
| Construction & Extraction | 6,885 (96.1%) | 283 (4.0%) |
| Installation, Maintenance & Repair | 4,514 (96.5%) | 163 (3.5%) |
| Total (Category) | 11,857 (96.2%) | 465 (3.8%) |
| Total (Overall) | 62,513 (52.1%) | 57,458 (47.9%) |
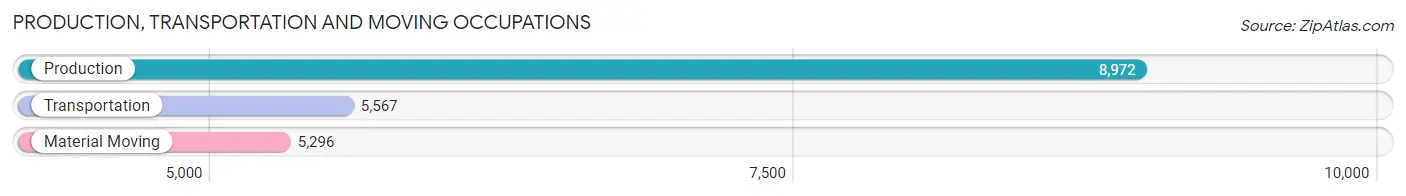
Production, Transportation and Moving Occupations
The most common Production, Transportation and Moving occupations in McLennan County are Production (8,972 | 7.5%), Transportation (5,567 | 4.6%), and Material Moving (5,296 | 4.4%).
Production, Transportation and Moving Occupations by Sex
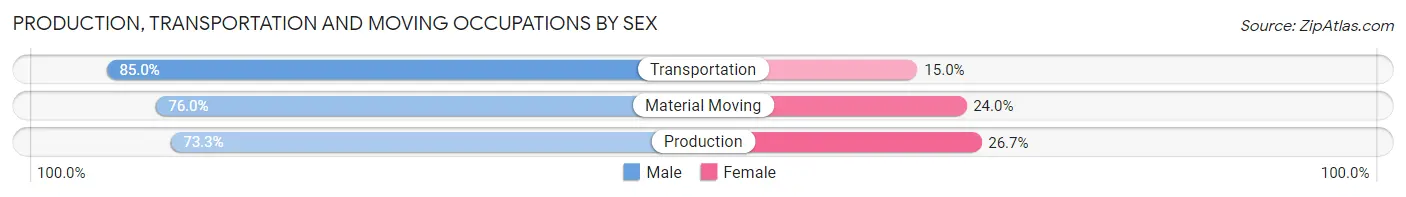
| Occupation | Male | Female |
| Production | 6,573 (73.3%) | 2,399 (26.7%) |
| Transportation | 4,731 (85.0%) | 836 (15.0%) |
| Material Moving | 4,026 (76.0%) | 1,270 (24.0%) |
| Total (Category) | 15,330 (77.3%) | 4,505 (22.7%) |
| Total (Overall) | 62,513 (52.1%) | 57,458 (47.9%) |
Employment Industries by Sex in McLennan County
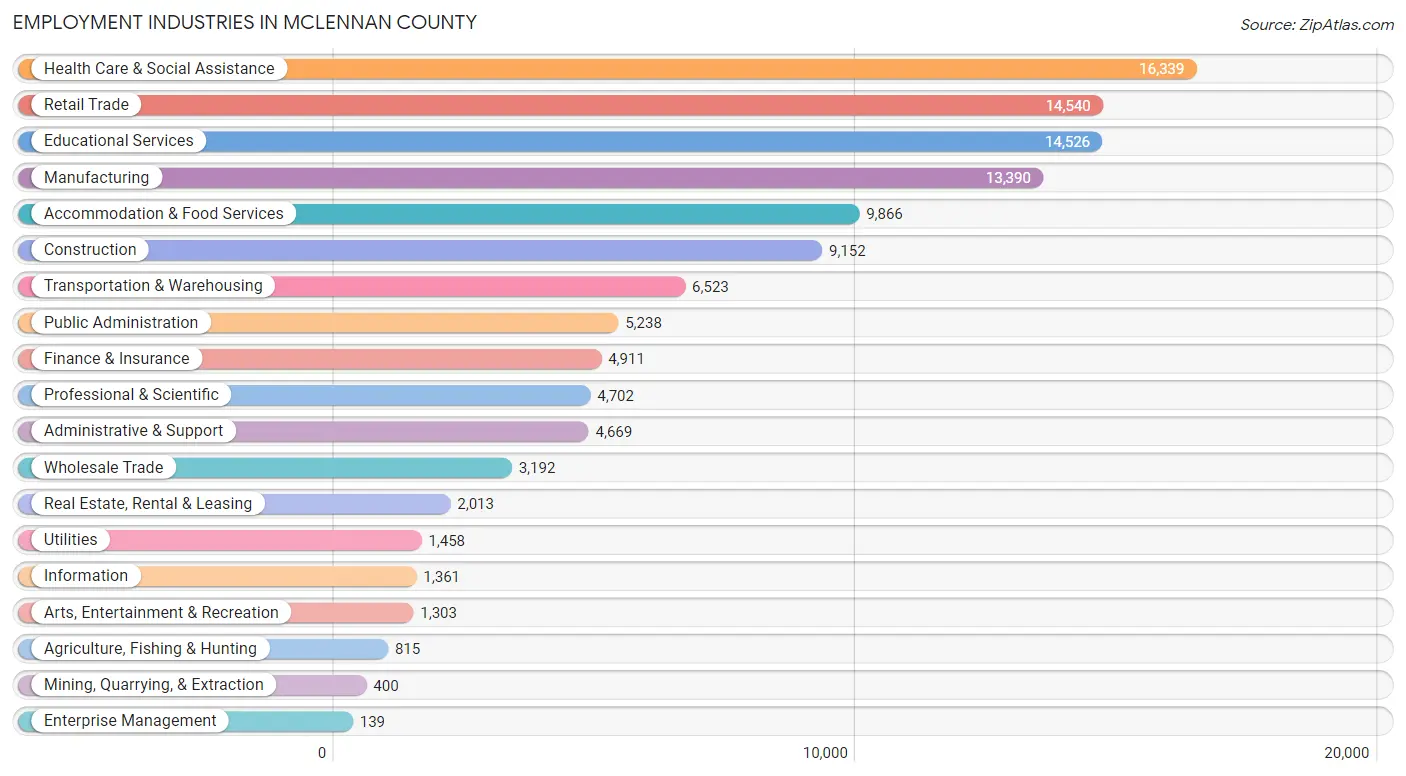
Employment Industries in McLennan County
The major employment industries in McLennan County include Health Care & Social Assistance (16,339 | 13.6%), Retail Trade (14,540 | 12.1%), Educational Services (14,526 | 12.1%), Manufacturing (13,390 | 11.2%), and Accommodation & Food Services (9,866 | 8.2%).
Employment Industries by Sex in McLennan County
The McLennan County industries that see more men than women are Construction (90.0%), Mining, Quarrying, & Extraction (89.5%), and Utilities (88.7%), whereas the industries that tend to have a higher number of women are Health Care & Social Assistance (79.5%), Finance & Insurance (70.1%), and Educational Services (64.3%).
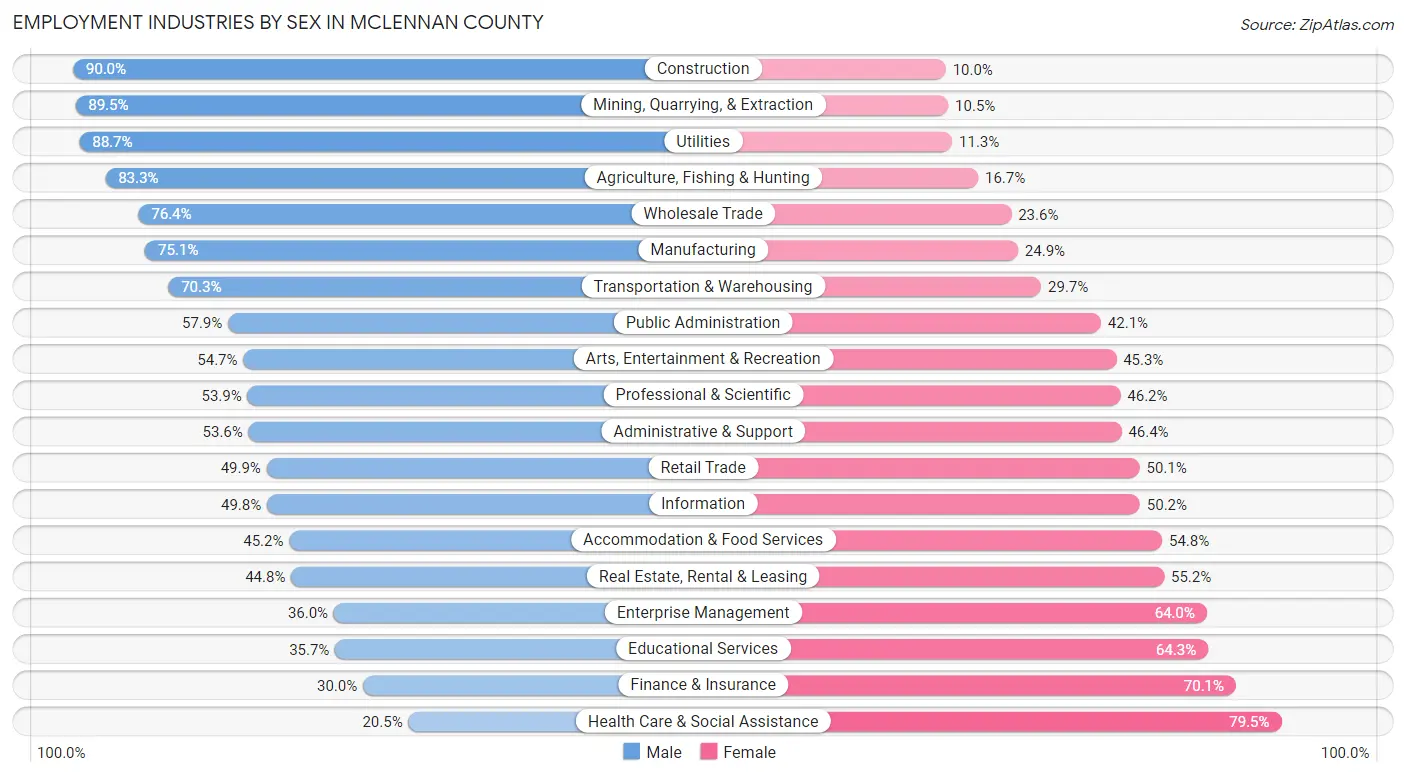
| Industry | Male | Female |
| Agriculture, Fishing & Hunting | 679 (83.3%) | 136 (16.7%) |
| Mining, Quarrying, & Extraction | 358 (89.5%) | 42 (10.5%) |
| Construction | 8,238 (90.0%) | 914 (10.0%) |
| Manufacturing | 10,050 (75.1%) | 3,340 (24.9%) |
| Wholesale Trade | 2,440 (76.4%) | 752 (23.6%) |
| Retail Trade | 7,254 (49.9%) | 7,286 (50.1%) |
| Transportation & Warehousing | 4,583 (70.3%) | 1,940 (29.7%) |
| Utilities | 1,293 (88.7%) | 165 (11.3%) |
| Information | 678 (49.8%) | 683 (50.2%) |
| Finance & Insurance | 1,471 (29.9%) | 3,440 (70.1%) |
| Real Estate, Rental & Leasing | 902 (44.8%) | 1,111 (55.2%) |
| Professional & Scientific | 2,532 (53.8%) | 2,170 (46.2%) |
| Enterprise Management | 50 (36.0%) | 89 (64.0%) |
| Administrative & Support | 2,504 (53.6%) | 2,165 (46.4%) |
| Educational Services | 5,187 (35.7%) | 9,339 (64.3%) |
| Health Care & Social Assistance | 3,356 (20.5%) | 12,983 (79.5%) |
| Arts, Entertainment & Recreation | 713 (54.7%) | 590 (45.3%) |
| Accommodation & Food Services | 4,461 (45.2%) | 5,405 (54.8%) |
| Public Administration | 3,032 (57.9%) | 2,206 (42.1%) |
| Total | 62,513 (52.1%) | 57,458 (47.9%) |
Education in McLennan County
School Enrollment in McLennan County
The most common levels of schooling among the 77,715 students in McLennan County are college / undergraduate (22,733 | 29.2%), middle school (14,891 | 19.2%), and high school (14,406 | 18.5%).

| School Level | # Students | % Students |
| Nursery / Preschool | 4,385 | 5.6% |
| Kindergarten | 2,968 | 3.8% |
| Elementary School | 13,690 | 17.6% |
| Middle School | 14,891 | 19.2% |
| High School | 14,406 | 18.5% |
| College / Undergraduate | 22,733 | 29.2% |
| Graduate / Professional | 4,642 | 6.0% |
| Total | 77,715 | 100.0% |
School Enrollment by Age by Funding Source in McLennan County
Out of a total of 77,715 students who are enrolled in schools in McLennan County, 20,750 (26.7%) attend a private institution, while the remaining 56,965 (73.3%) are enrolled in public schools. The age group of 20 to 24 year olds has the highest likelihood of being enrolled in private schools, with 8,851 (62.5% in the age bracket) enrolled. Conversely, the age group of 10 to 14 year olds has the lowest likelihood of being enrolled in a private school, with 17,002 (92.3% in the age bracket) attending a public institution.
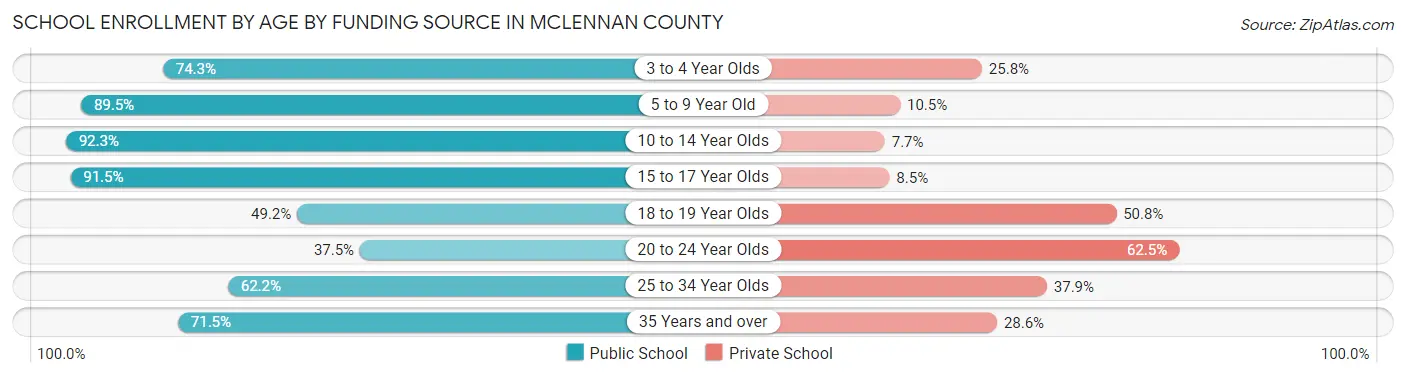
| Age Bracket | Public School | Private School |
| 3 to 4 Year Olds | 2,448 (74.3%) | 849 (25.8%) |
| 5 to 9 Year Old | 13,598 (89.5%) | 1,596 (10.5%) |
| 10 to 14 Year Olds | 17,002 (92.3%) | 1,411 (7.7%) |
| 15 to 17 Year Olds | 9,434 (91.5%) | 879 (8.5%) |
| 18 to 19 Year Olds | 4,695 (49.2%) | 4,839 (50.8%) |
| 20 to 24 Year Olds | 5,319 (37.5%) | 8,851 (62.5%) |
| 25 to 34 Year Olds | 2,649 (62.2%) | 1,613 (37.9%) |
| 35 Years and over | 1,809 (71.5%) | 723 (28.5%) |
| Total | 56,965 (73.3%) | 20,750 (26.7%) |
Educational Attainment by Field of Study in McLennan County
Business (9,051 | 19.9%), education (7,262 | 16.0%), science & technology (4,867 | 10.7%), arts & humanities (3,815 | 8.4%), and bio, nature & agricultural (3,062 | 6.7%) are the most common fields of study among 45,501 individuals in McLennan County who have obtained a bachelor's degree or higher.
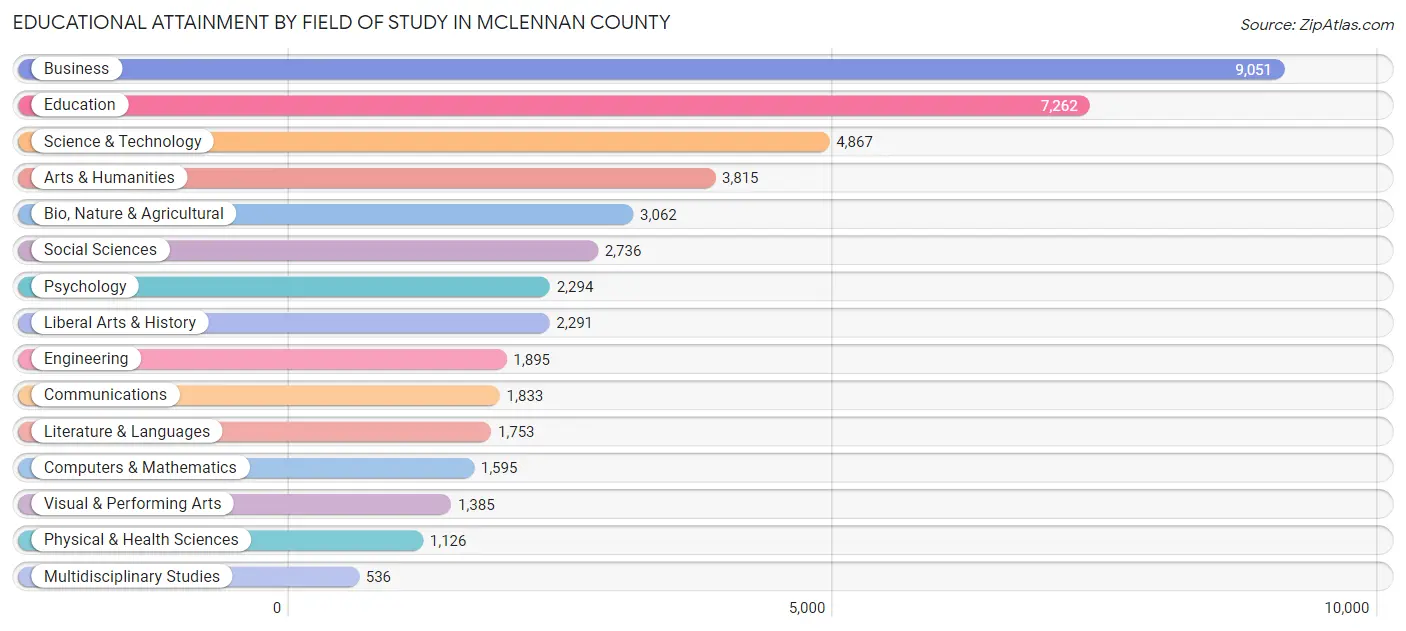
| Field of Study | # Graduates | % Graduates |
| Computers & Mathematics | 1,595 | 3.5% |
| Bio, Nature & Agricultural | 3,062 | 6.7% |
| Physical & Health Sciences | 1,126 | 2.5% |
| Psychology | 2,294 | 5.0% |
| Social Sciences | 2,736 | 6.0% |
| Engineering | 1,895 | 4.2% |
| Multidisciplinary Studies | 536 | 1.2% |
| Science & Technology | 4,867 | 10.7% |
| Business | 9,051 | 19.9% |
| Education | 7,262 | 16.0% |
| Literature & Languages | 1,753 | 3.8% |
| Liberal Arts & History | 2,291 | 5.0% |
| Visual & Performing Arts | 1,385 | 3.0% |
| Communications | 1,833 | 4.0% |
| Arts & Humanities | 3,815 | 8.4% |
| Total | 45,501 | 100.0% |
Transportation & Commute in McLennan County
Vehicle Availability by Sex in McLennan County
The most prevalent vehicle ownership categories in McLennan County are males with 2 vehicles (26,984, accounting for 44.3%) and females with 2 vehicles (22,644, making up 48.5%).
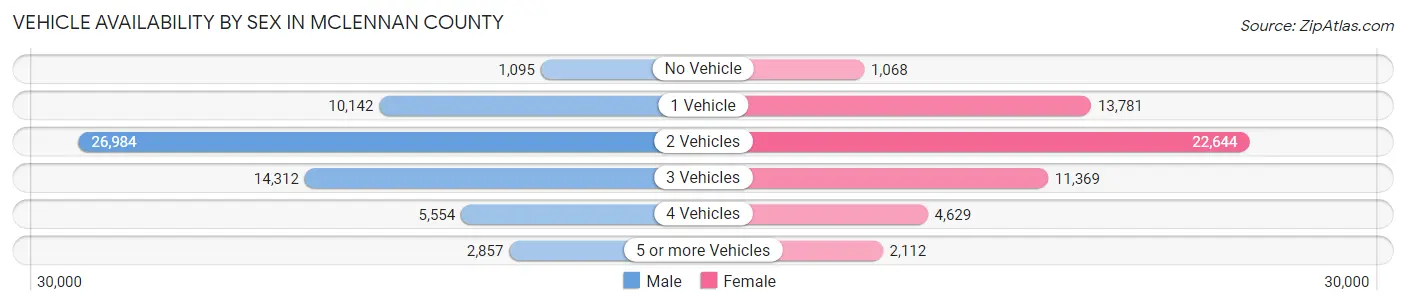
| Vehicles Available | Male | Female |
| No Vehicle | 1,095 (1.8%) | 1,068 (1.9%) |
| 1 Vehicle | 10,142 (16.6%) | 13,781 (24.8%) |
| 2 Vehicles | 26,984 (44.3%) | 22,644 (40.7%) |
| 3 Vehicles | 14,312 (23.5%) | 11,369 (20.4%) |
| 4 Vehicles | 5,554 (9.1%) | 4,629 (8.3%) |
| 5 or more Vehicles | 2,857 (4.7%) | 2,112 (3.8%) |
| Total | 60,944 (100.0%) | 55,603 (100.0%) |
Commute Time in McLennan County
The most frequently occuring commute durations in McLennan County are 15 to 19 minutes (26,825 commuters, 24.5%), 10 to 14 minutes (19,419 commuters, 17.7%), and 20 to 24 minutes (18,062 commuters, 16.5%).
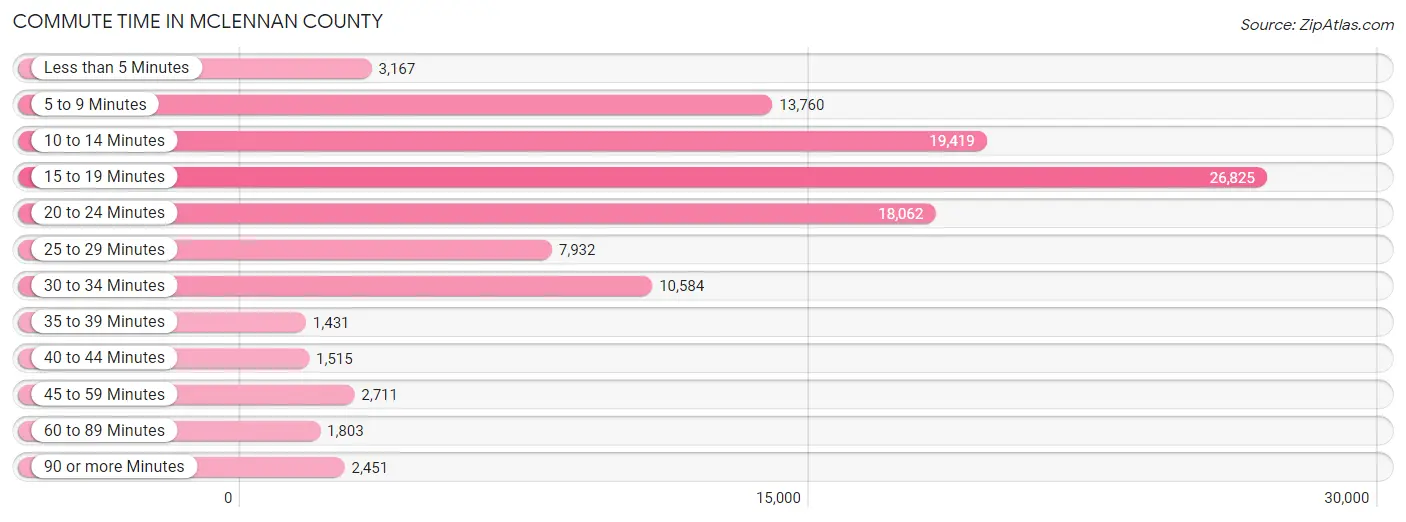
| Commute Time | # Commuters | % Commuters |
| Less than 5 Minutes | 3,167 | 2.9% |
| 5 to 9 Minutes | 13,760 | 12.6% |
| 10 to 14 Minutes | 19,419 | 17.7% |
| 15 to 19 Minutes | 26,825 | 24.5% |
| 20 to 24 Minutes | 18,062 | 16.5% |
| 25 to 29 Minutes | 7,932 | 7.2% |
| 30 to 34 Minutes | 10,584 | 9.7% |
| 35 to 39 Minutes | 1,431 | 1.3% |
| 40 to 44 Minutes | 1,515 | 1.4% |
| 45 to 59 Minutes | 2,711 | 2.5% |
| 60 to 89 Minutes | 1,803 | 1.6% |
| 90 or more Minutes | 2,451 | 2.2% |
Commute Time by Sex in McLennan County
The most common commute times in McLennan County are 15 to 19 minutes (14,105 commuters, 24.2%) for males and 15 to 19 minutes (12,720 commuters, 24.7%) for females.
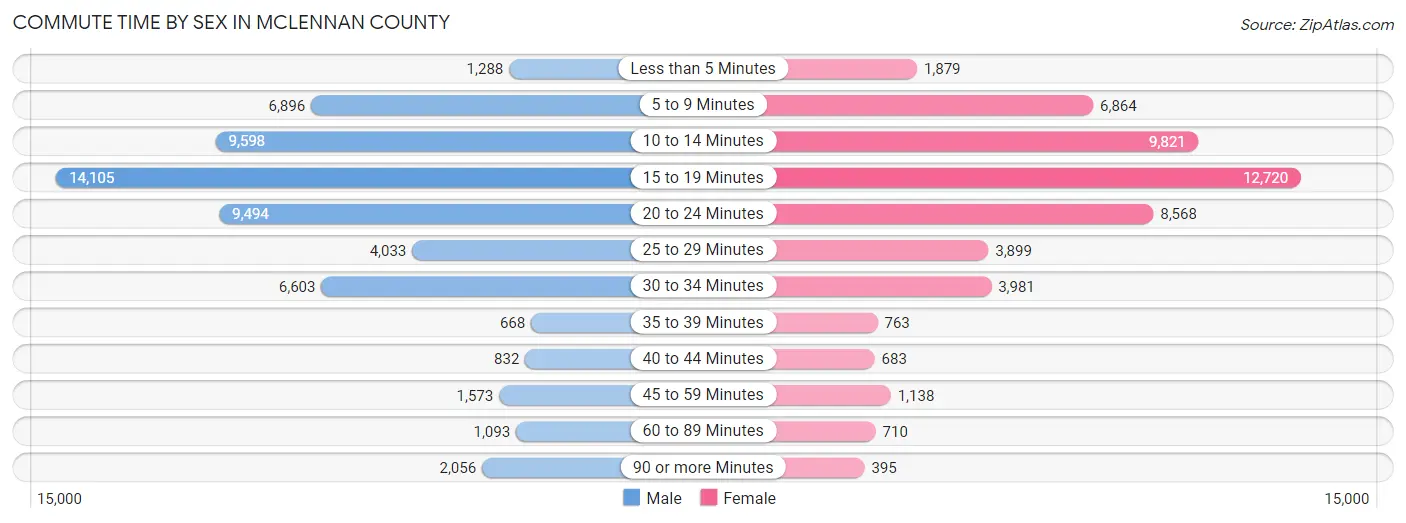
| Commute Time | Male | Female |
| Less than 5 Minutes | 1,288 (2.2%) | 1,879 (3.6%) |
| 5 to 9 Minutes | 6,896 (11.8%) | 6,864 (13.4%) |
| 10 to 14 Minutes | 9,598 (16.5%) | 9,821 (19.1%) |
| 15 to 19 Minutes | 14,105 (24.2%) | 12,720 (24.7%) |
| 20 to 24 Minutes | 9,494 (16.3%) | 8,568 (16.7%) |
| 25 to 29 Minutes | 4,033 (6.9%) | 3,899 (7.6%) |
| 30 to 34 Minutes | 6,603 (11.3%) | 3,981 (7.7%) |
| 35 to 39 Minutes | 668 (1.1%) | 763 (1.5%) |
| 40 to 44 Minutes | 832 (1.4%) | 683 (1.3%) |
| 45 to 59 Minutes | 1,573 (2.7%) | 1,138 (2.2%) |
| 60 to 89 Minutes | 1,093 (1.9%) | 710 (1.4%) |
| 90 or more Minutes | 2,056 (3.5%) | 395 (0.8%) |
Time of Departure to Work by Sex in McLennan County
The most frequent times of departure to work in McLennan County are 7:00 AM to 7:29 AM (8,782, 15.1%) for males and 7:30 AM to 7:59 AM (9,836, 19.1%) for females.
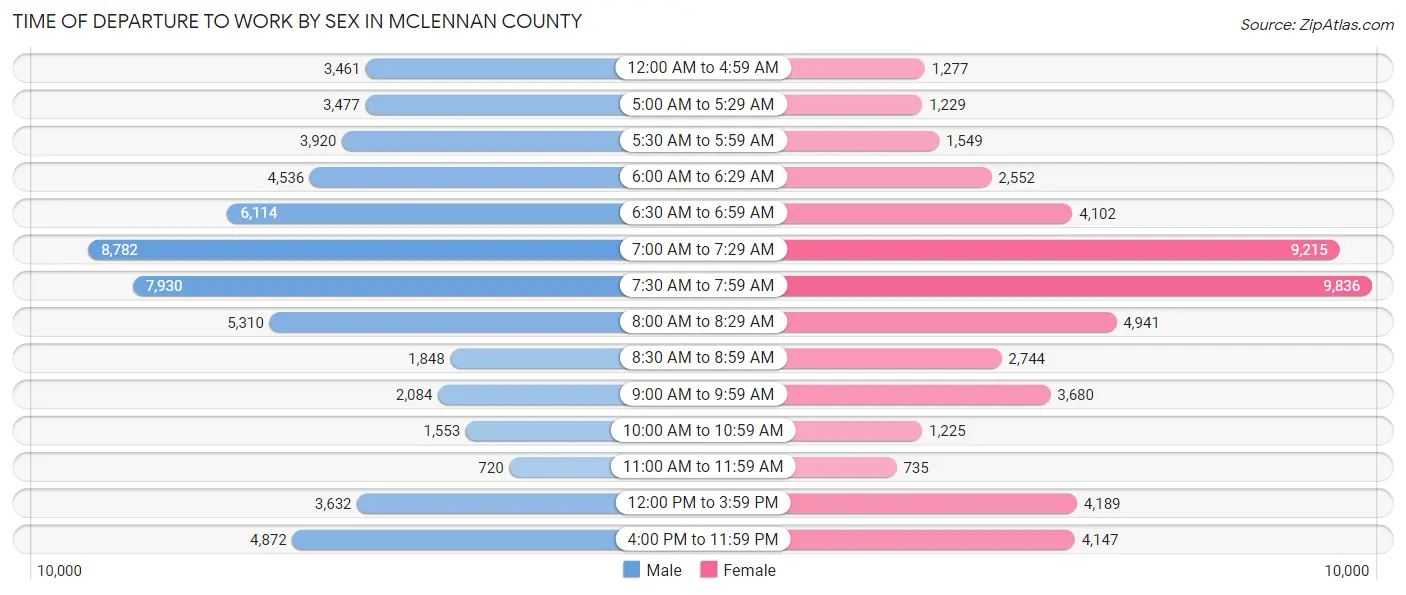
| Time of Departure | Male | Female |
| 12:00 AM to 4:59 AM | 3,461 (5.9%) | 1,277 (2.5%) |
| 5:00 AM to 5:29 AM | 3,477 (6.0%) | 1,229 (2.4%) |
| 5:30 AM to 5:59 AM | 3,920 (6.7%) | 1,549 (3.0%) |
| 6:00 AM to 6:29 AM | 4,536 (7.8%) | 2,552 (5.0%) |
| 6:30 AM to 6:59 AM | 6,114 (10.5%) | 4,102 (8.0%) |
| 7:00 AM to 7:29 AM | 8,782 (15.1%) | 9,215 (17.9%) |
| 7:30 AM to 7:59 AM | 7,930 (13.6%) | 9,836 (19.1%) |
| 8:00 AM to 8:29 AM | 5,310 (9.1%) | 4,941 (9.6%) |
| 8:30 AM to 8:59 AM | 1,848 (3.2%) | 2,744 (5.3%) |
| 9:00 AM to 9:59 AM | 2,084 (3.6%) | 3,680 (7.2%) |
| 10:00 AM to 10:59 AM | 1,553 (2.7%) | 1,225 (2.4%) |
| 11:00 AM to 11:59 AM | 720 (1.2%) | 735 (1.4%) |
| 12:00 PM to 3:59 PM | 3,632 (6.2%) | 4,189 (8.2%) |
| 4:00 PM to 11:59 PM | 4,872 (8.4%) | 4,147 (8.1%) |
| Total | 58,239 (100.0%) | 51,421 (100.0%) |
Housing Occupancy in McLennan County
Occupancy by Ownership in McLennan County
Of the total 94,985 dwellings in McLennan County, owner-occupied units account for 56,585 (59.6%), while renter-occupied units make up 38,400 (40.4%).
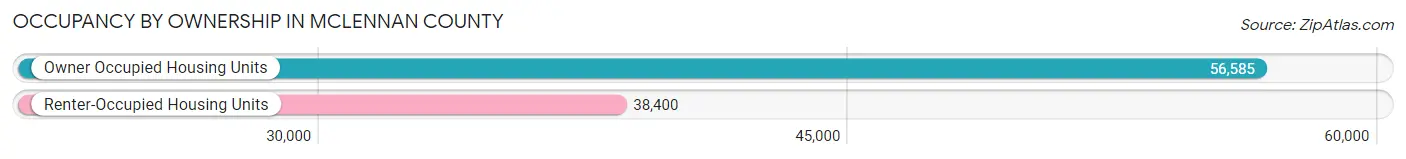
| Occupancy | # Housing Units | % Housing Units |
| Owner Occupied Housing Units | 56,585 | 59.6% |
| Renter-Occupied Housing Units | 38,400 | 40.4% |
| Total Occupied Housing Units | 94,985 | 100.0% |
Occupancy by Household Size in McLennan County
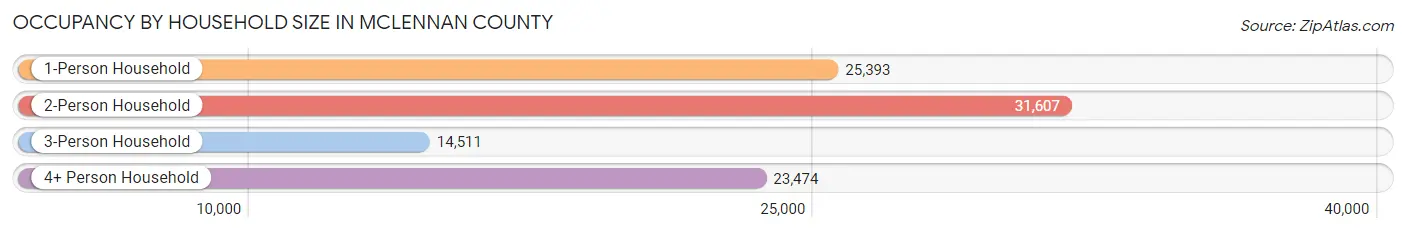
| Household Size | # Housing Units | % Housing Units |
| 1-Person Household | 25,393 | 26.7% |
| 2-Person Household | 31,607 | 33.3% |
| 3-Person Household | 14,511 | 15.3% |
| 4+ Person Household | 23,474 | 24.7% |
| Total Housing Units | 94,985 | 100.0% |
Occupancy by Ownership by Household Size in McLennan County

| Household Size | Owner-occupied | Renter-occupied |
| 1-Person Household | 11,358 (44.7%) | 14,035 (55.3%) |
| 2-Person Household | 21,091 (66.7%) | 10,516 (33.3%) |
| 3-Person Household | 9,148 (63.0%) | 5,363 (37.0%) |
| 4+ Person Household | 14,988 (63.8%) | 8,486 (36.1%) |
| Total Housing Units | 56,585 (59.6%) | 38,400 (40.4%) |
Occupancy by Educational Attainment in McLennan County
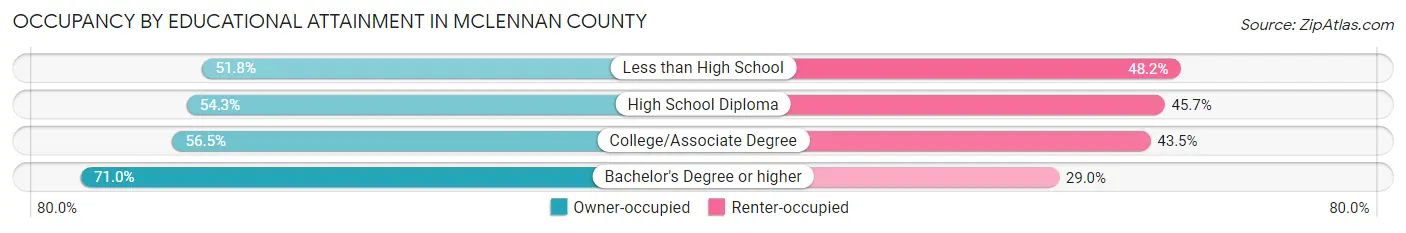
| Household Size | Owner-occupied | Renter-occupied |
| Less than High School | 5,519 (51.8%) | 5,142 (48.2%) |
| High School Diploma | 12,534 (54.3%) | 10,564 (45.7%) |
| College/Associate Degree | 19,280 (56.5%) | 14,838 (43.5%) |
| Bachelor's Degree or higher | 19,252 (71.0%) | 7,856 (29.0%) |
Occupancy by Age of Householder in McLennan County
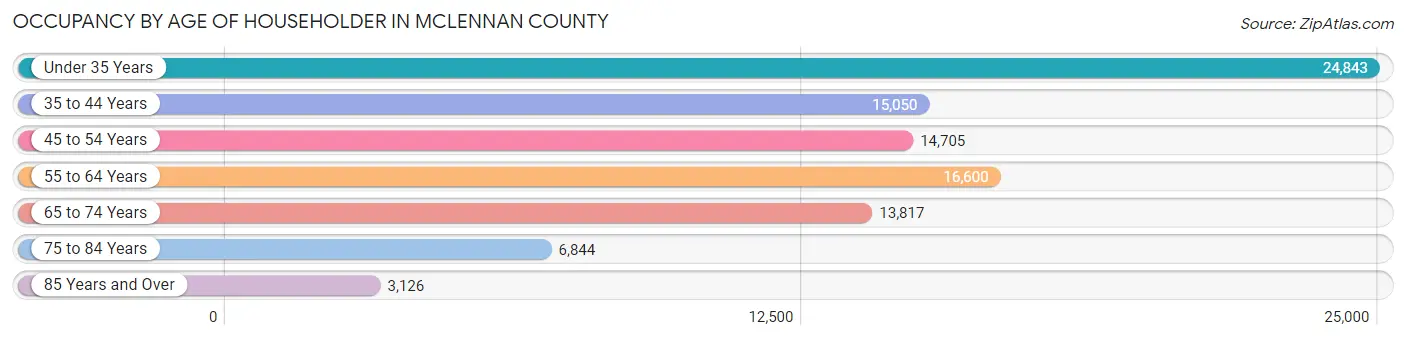
| Age Bracket | # Households | % Households |
| Under 35 Years | 24,843 | 26.2% |
| 35 to 44 Years | 15,050 | 15.8% |
| 45 to 54 Years | 14,705 | 15.5% |
| 55 to 64 Years | 16,600 | 17.5% |
| 65 to 74 Years | 13,817 | 14.5% |
| 75 to 84 Years | 6,844 | 7.2% |
| 85 Years and Over | 3,126 | 3.3% |
| Total | 94,985 | 100.0% |
Housing Finances in McLennan County
Median Income by Occupancy in McLennan County
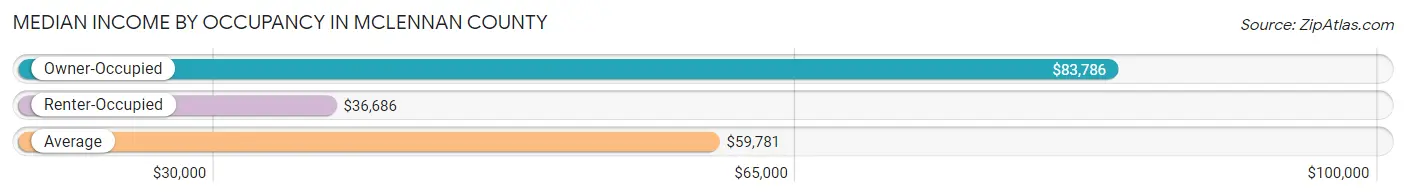
| Occupancy Type | # Households | Median Income |
| Owner-Occupied | 56,585 (59.6%) | $83,786 |
| Renter-Occupied | 38,400 (40.4%) | $36,686 |
| Average | 94,985 (100.0%) | $59,781 |
Occupancy by Householder Income Bracket in McLennan County
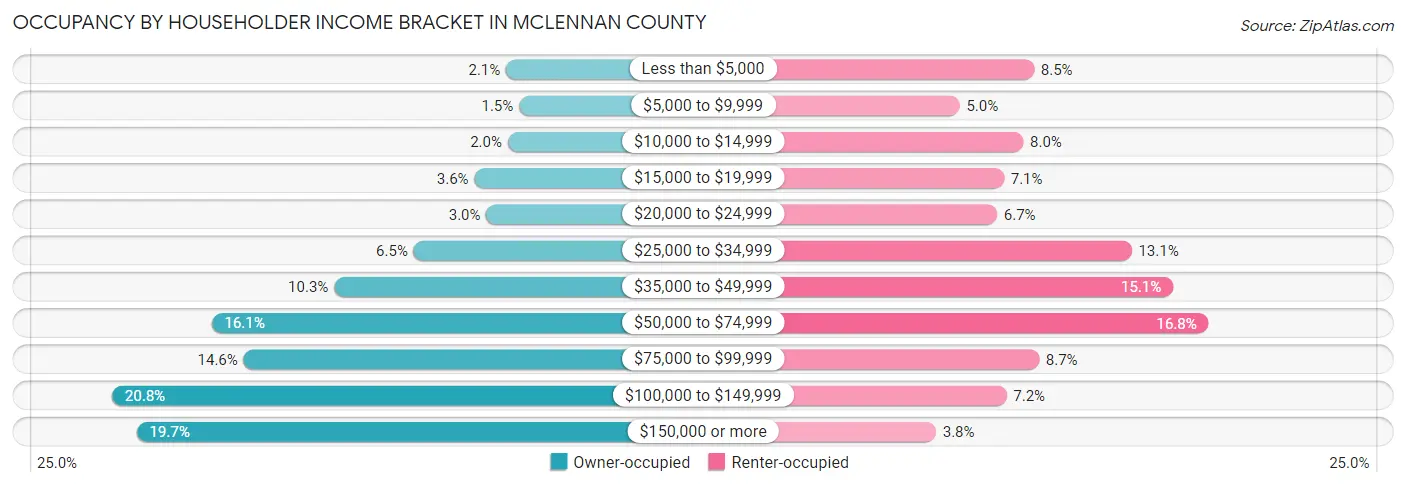
| Income Bracket | Owner-occupied | Renter-occupied |
| Less than $5,000 | 1,172 (2.1%) | 3,259 (8.5%) |
| $5,000 to $9,999 | 818 (1.5%) | 1,902 (5.0%) |
| $10,000 to $14,999 | 1,124 (2.0%) | 3,063 (8.0%) |
| $15,000 to $19,999 | 2,026 (3.6%) | 2,710 (7.1%) |
| $20,000 to $24,999 | 1,701 (3.0%) | 2,585 (6.7%) |
| $25,000 to $34,999 | 3,663 (6.5%) | 5,045 (13.1%) |
| $35,000 to $49,999 | 5,808 (10.3%) | 5,808 (15.1%) |
| $50,000 to $74,999 | 9,109 (16.1%) | 6,454 (16.8%) |
| $75,000 to $99,999 | 8,242 (14.6%) | 3,351 (8.7%) |
| $100,000 to $149,999 | 11,790 (20.8%) | 2,758 (7.2%) |
| $150,000 or more | 11,132 (19.7%) | 1,465 (3.8%) |
| Total | 56,585 (100.0%) | 38,400 (100.0%) |
Monthly Housing Cost Tiers in McLennan County
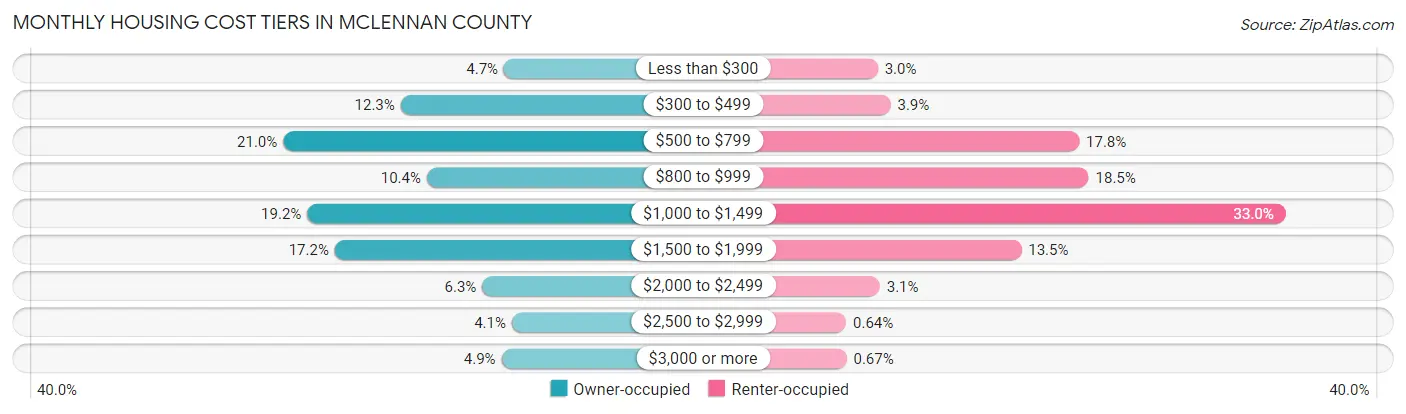
| Monthly Cost | Owner-occupied | Renter-occupied |
| Less than $300 | 2,661 (4.7%) | 1,141 (3.0%) |
| $300 to $499 | 6,963 (12.3%) | 1,503 (3.9%) |
| $500 to $799 | 11,859 (21.0%) | 6,835 (17.8%) |
| $800 to $999 | 5,875 (10.4%) | 7,103 (18.5%) |
| $1,000 to $1,499 | 10,858 (19.2%) | 12,675 (33.0%) |
| $1,500 to $1,999 | 9,711 (17.2%) | 5,199 (13.5%) |
| $2,000 to $2,499 | 3,566 (6.3%) | 1,198 (3.1%) |
| $2,500 to $2,999 | 2,330 (4.1%) | 247 (0.6%) |
| $3,000 or more | 2,762 (4.9%) | 259 (0.7%) |
| Total | 56,585 (100.0%) | 38,400 (100.0%) |
Physical Housing Characteristics in McLennan County
Housing Structures in McLennan County
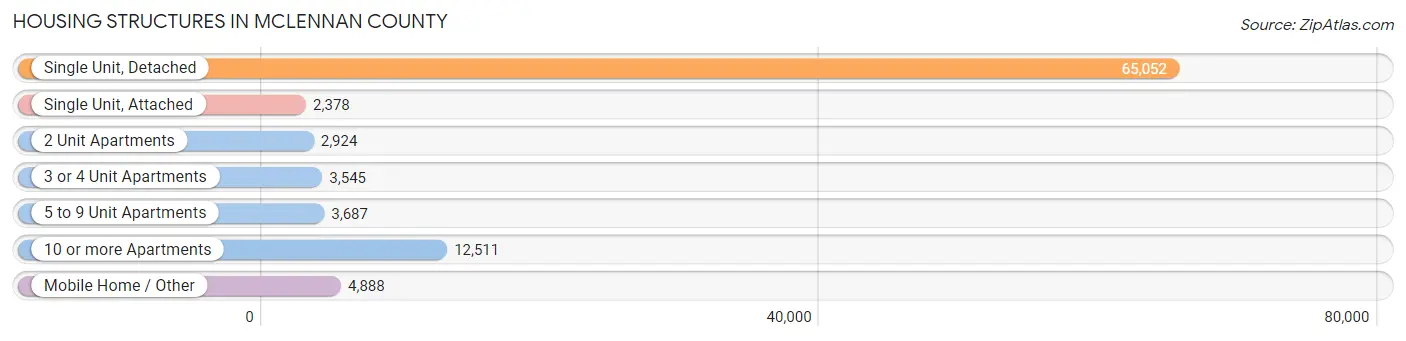
| Structure Type | # Housing Units | % Housing Units |
| Single Unit, Detached | 65,052 | 68.5% |
| Single Unit, Attached | 2,378 | 2.5% |
| 2 Unit Apartments | 2,924 | 3.1% |
| 3 or 4 Unit Apartments | 3,545 | 3.7% |
| 5 to 9 Unit Apartments | 3,687 | 3.9% |
| 10 or more Apartments | 12,511 | 13.2% |
| Mobile Home / Other | 4,888 | 5.1% |
| Total | 94,985 | 100.0% |
Housing Structures by Occupancy in McLennan County
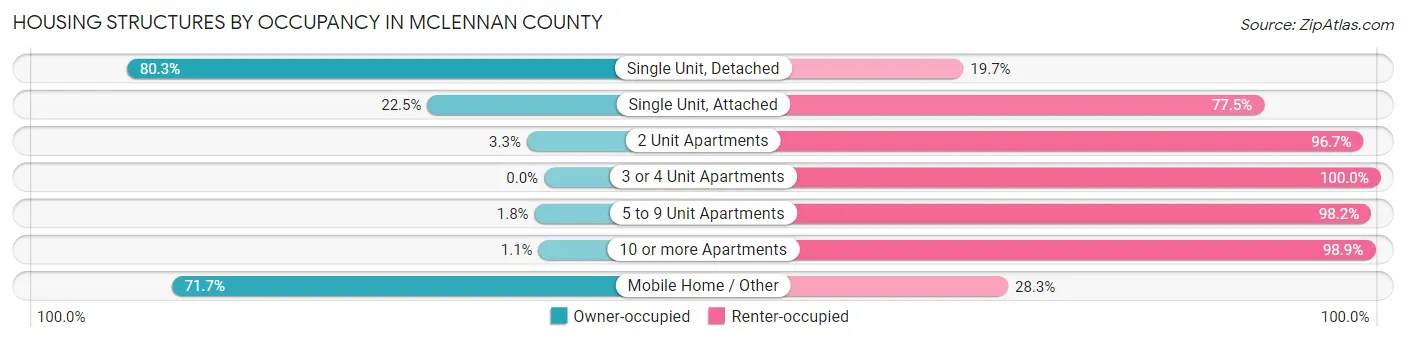
| Structure Type | Owner-occupied | Renter-occupied |
| Single Unit, Detached | 52,247 (80.3%) | 12,805 (19.7%) |
| Single Unit, Attached | 534 (22.5%) | 1,844 (77.5%) |
| 2 Unit Apartments | 97 (3.3%) | 2,827 (96.7%) |
| 3 or 4 Unit Apartments | 0 (0.0%) | 3,545 (100.0%) |
| 5 to 9 Unit Apartments | 68 (1.8%) | 3,619 (98.2%) |
| 10 or more Apartments | 134 (1.1%) | 12,377 (98.9%) |
| Mobile Home / Other | 3,505 (71.7%) | 1,383 (28.3%) |
| Total | 56,585 (59.6%) | 38,400 (40.4%) |
Housing Structures by Number of Rooms in McLennan County
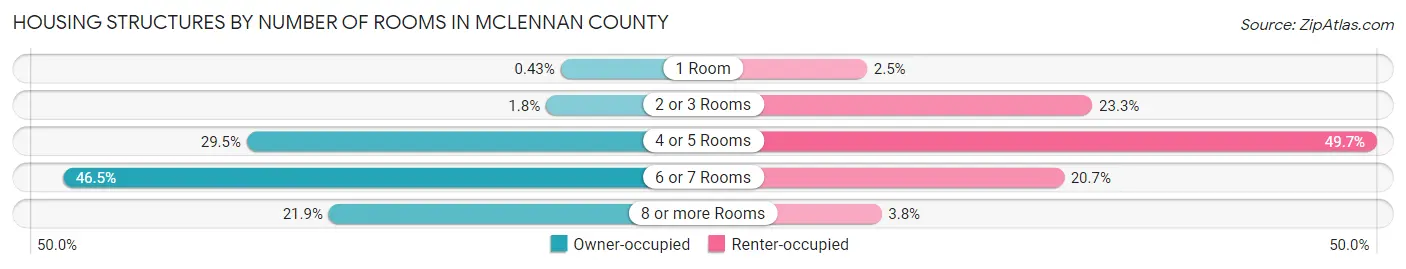
| Number of Rooms | Owner-occupied | Renter-occupied |
| 1 Room | 243 (0.4%) | 955 (2.5%) |
| 2 or 3 Rooms | 1,007 (1.8%) | 8,957 (23.3%) |
| 4 or 5 Rooms | 16,664 (29.4%) | 19,069 (49.7%) |
| 6 or 7 Rooms | 26,295 (46.5%) | 7,947 (20.7%) |
| 8 or more Rooms | 12,376 (21.9%) | 1,472 (3.8%) |
| Total | 56,585 (100.0%) | 38,400 (100.0%) |
Housing Structure by Heating Type in McLennan County
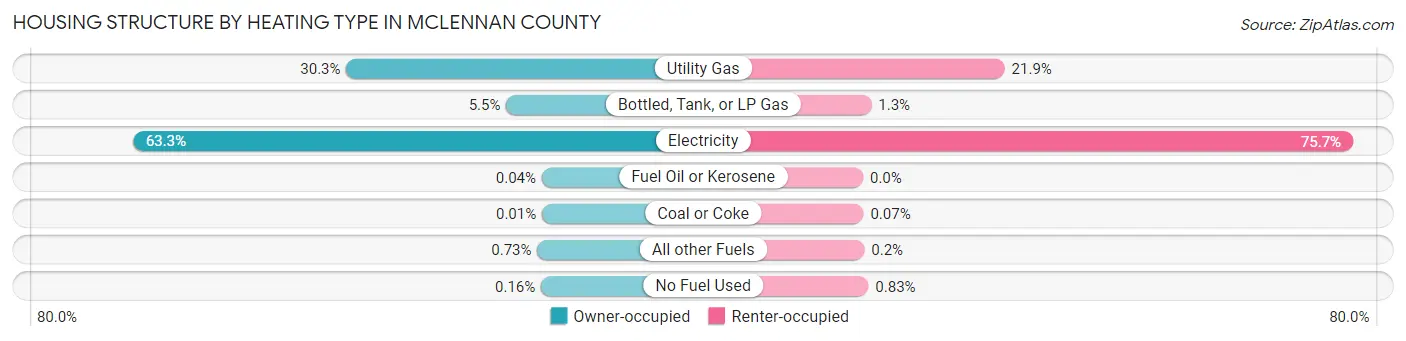
| Heating Type | Owner-occupied | Renter-occupied |
| Utility Gas | 17,120 (30.3%) | 8,407 (21.9%) |
| Bottled, Tank, or LP Gas | 3,129 (5.5%) | 490 (1.3%) |
| Electricity | 35,805 (63.3%) | 29,082 (75.7%) |
| Fuel Oil or Kerosene | 23 (0.0%) | 0 (0.0%) |
| Coal or Coke | 3 (0.0%) | 27 (0.1%) |
| All other Fuels | 414 (0.7%) | 75 (0.2%) |
| No Fuel Used | 91 (0.2%) | 319 (0.8%) |
| Total | 56,585 (100.0%) | 38,400 (100.0%) |
Household Vehicle Usage in McLennan County
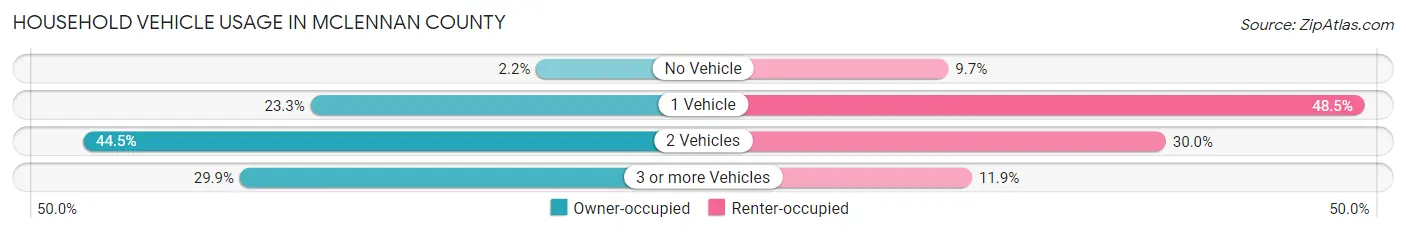
| Vehicles per Household | Owner-occupied | Renter-occupied |
| No Vehicle | 1,265 (2.2%) | 3,709 (9.7%) |
| 1 Vehicle | 13,192 (23.3%) | 18,627 (48.5%) |
| 2 Vehicles | 25,205 (44.5%) | 11,505 (30.0%) |
| 3 or more Vehicles | 16,923 (29.9%) | 4,559 (11.9%) |
| Total | 56,585 (100.0%) | 38,400 (100.0%) |
Real Estate & Mortgages in McLennan County
Real Estate and Mortgage Overview in McLennan County
| Characteristic | Without Mortgage | With Mortgage |
| Housing Units | 27,028 | 29,557 |
| Median Property Value | $159,100 | $221,100 |
| Median Household Income | $61,114 | $7,392 |
| Monthly Housing Costs | $602 | $2,749 |
| Real Estate Taxes | $2,253 | $1,024 |
Property Value by Mortgage Status in McLennan County
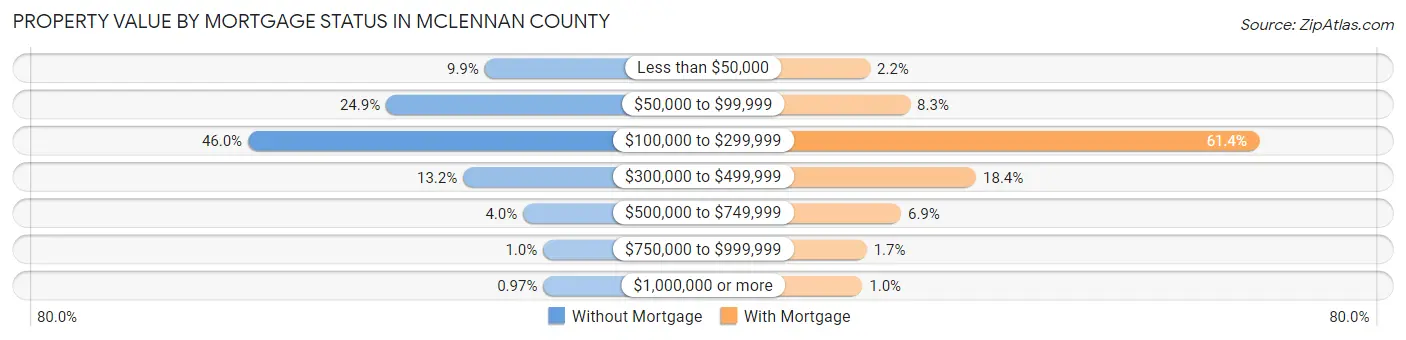
| Property Value | Without Mortgage | With Mortgage |
| Less than $50,000 | 2,676 (9.9%) | 657 (2.2%) |
| $50,000 to $99,999 | 6,739 (24.9%) | 2,459 (8.3%) |
| $100,000 to $299,999 | 12,426 (46.0%) | 18,157 (61.4%) |
| $300,000 to $499,999 | 3,564 (13.2%) | 5,431 (18.4%) |
| $500,000 to $749,999 | 1,091 (4.0%) | 2,048 (6.9%) |
| $750,000 to $999,999 | 269 (1.0%) | 502 (1.7%) |
| $1,000,000 or more | 263 (1.0%) | 303 (1.0%) |
| Total | 27,028 (100.0%) | 29,557 (100.0%) |
Household Income by Mortgage Status in McLennan County
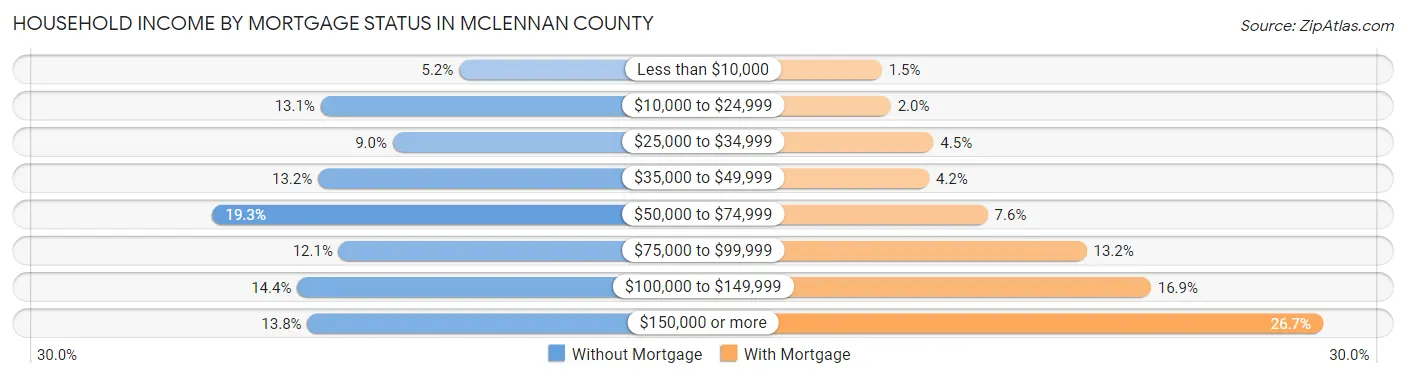
| Household Income | Without Mortgage | With Mortgage |
| Less than $10,000 | 1,397 (5.2%) | 443 (1.5%) |
| $10,000 to $24,999 | 3,535 (13.1%) | 593 (2.0%) |
| $25,000 to $34,999 | 2,421 (9.0%) | 1,316 (4.4%) |
| $35,000 to $49,999 | 3,575 (13.2%) | 1,242 (4.2%) |
| $50,000 to $74,999 | 5,206 (19.3%) | 2,233 (7.5%) |
| $75,000 to $99,999 | 3,256 (12.0%) | 3,903 (13.2%) |
| $100,000 to $149,999 | 3,898 (14.4%) | 4,986 (16.9%) |
| $150,000 or more | 3,740 (13.8%) | 7,892 (26.7%) |
| Total | 27,028 (100.0%) | 29,557 (100.0%) |
Property Value to Household Income Ratio in McLennan County
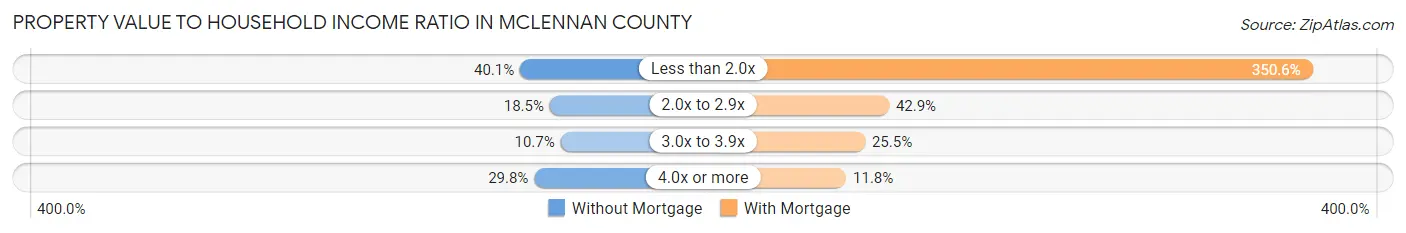
| Value-to-Income Ratio | Without Mortgage | With Mortgage |
| Less than 2.0x | 10,834 (40.1%) | 103,619 (350.6%) |
| 2.0x to 2.9x | 4,993 (18.5%) | 12,677 (42.9%) |
| 3.0x to 3.9x | 2,883 (10.7%) | 7,524 (25.5%) |
| 4.0x or more | 8,056 (29.8%) | 3,474 (11.7%) |
| Total | 27,028 (100.0%) | 29,557 (100.0%) |
Real Estate Taxes by Mortgage Status in McLennan County
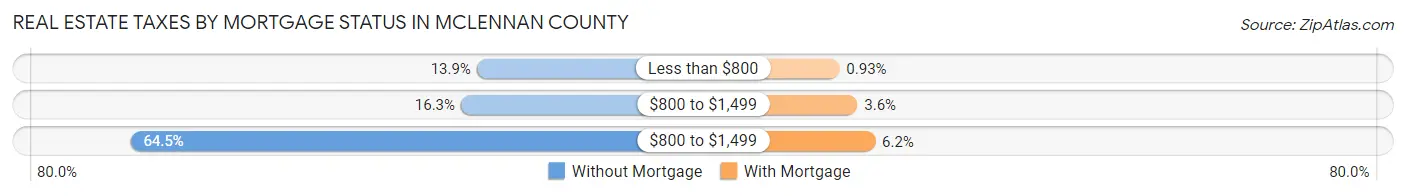
| Property Taxes | Without Mortgage | With Mortgage |
| Less than $800 | 3,769 (13.9%) | 274 (0.9%) |
| $800 to $1,499 | 4,392 (16.3%) | 1,050 (3.5%) |
| $800 to $1,499 | 17,440 (64.5%) | 1,818 (6.1%) |
| Total | 27,028 (100.0%) | 29,557 (100.0%) |
Health & Disability in McLennan County
Health Insurance Coverage by Age in McLennan County
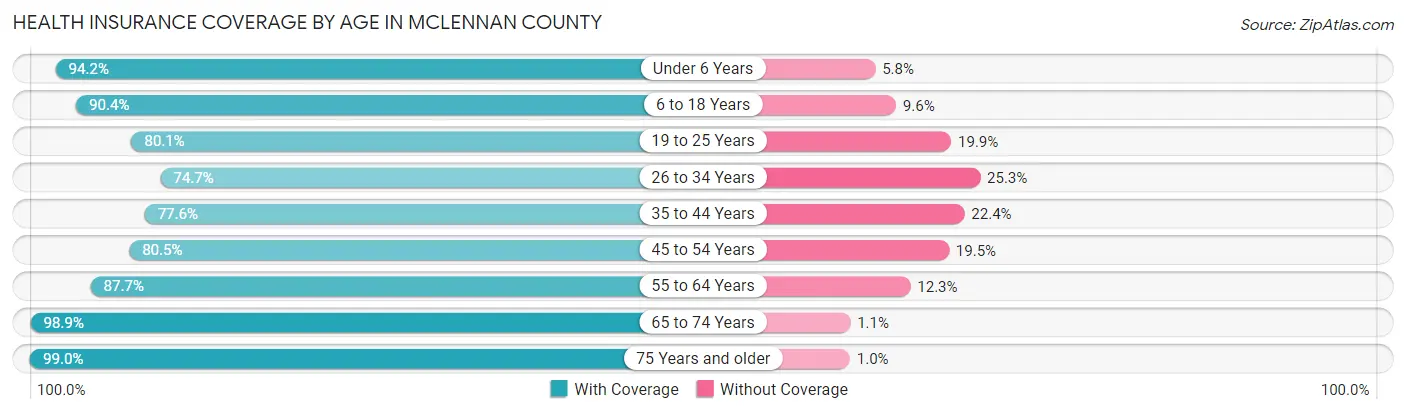
| Age Bracket | With Coverage | Without Coverage |
| Under 6 Years | 18,895 (94.2%) | 1,157 (5.8%) |
| 6 to 18 Years | 44,263 (90.4%) | 4,713 (9.6%) |
| 19 to 25 Years | 29,081 (80.1%) | 7,232 (19.9%) |
| 26 to 34 Years | 21,688 (74.7%) | 7,357 (25.3%) |
| 35 to 44 Years | 23,284 (77.6%) | 6,723 (22.4%) |
| 45 to 54 Years | 21,746 (80.5%) | 5,271 (19.5%) |
| 55 to 64 Years | 24,934 (87.7%) | 3,503 (12.3%) |
| 65 to 74 Years | 21,611 (98.9%) | 240 (1.1%) |
| 75 Years and older | 15,141 (99.0%) | 159 (1.0%) |
| Total | 220,643 (85.9%) | 36,355 (14.1%) |
Health Insurance Coverage by Citizenship Status in McLennan County
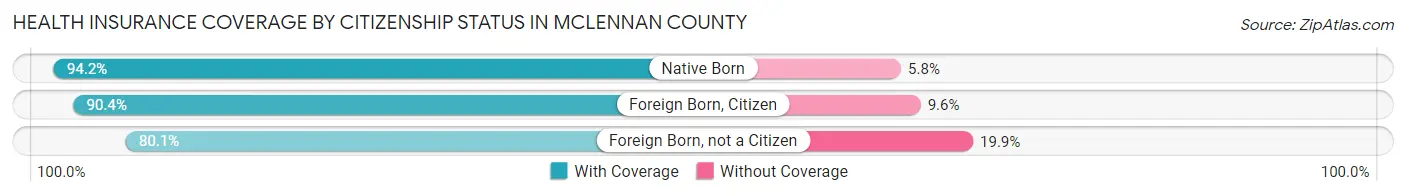
| Citizenship Status | With Coverage | Without Coverage |
| Native Born | 18,895 (94.2%) | 1,157 (5.8%) |
| Foreign Born, Citizen | 44,263 (90.4%) | 4,713 (9.6%) |
| Foreign Born, not a Citizen | 29,081 (80.1%) | 7,232 (19.9%) |
Health Insurance Coverage by Household Income in McLennan County
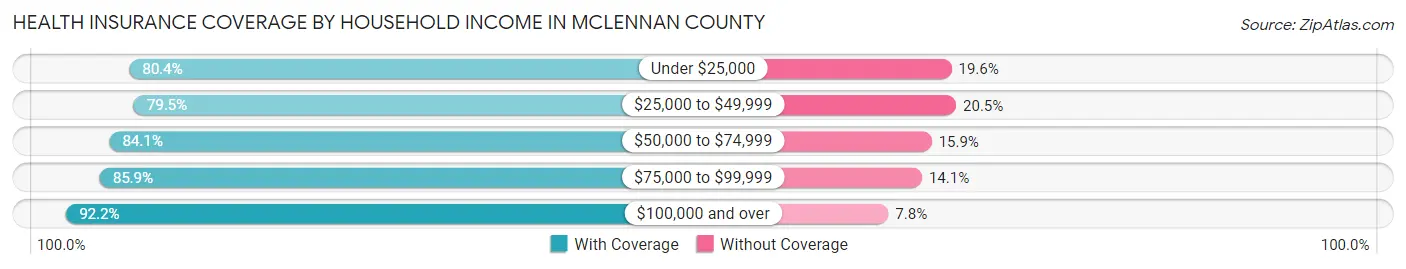
| Household Income | With Coverage | Without Coverage |
| Under $25,000 | 32,103 (80.4%) | 7,834 (19.6%) |
| $25,000 to $49,999 | 38,061 (79.5%) | 9,803 (20.5%) |
| $50,000 to $74,999 | 35,461 (84.1%) | 6,711 (15.9%) |
| $75,000 to $99,999 | 28,798 (85.9%) | 4,723 (14.1%) |
| $100,000 and over | 80,866 (92.2%) | 6,837 (7.8%) |
Public vs Private Health Insurance Coverage by Age in McLennan County
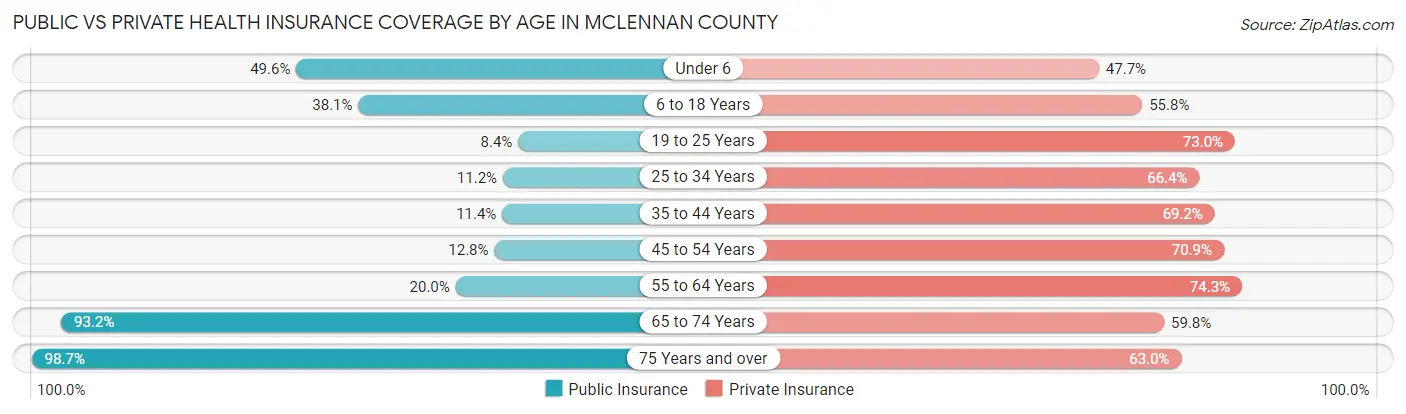
| Age Bracket | Public Insurance | Private Insurance |
| Under 6 | 9,941 (49.6%) | 9,568 (47.7%) |
| 6 to 18 Years | 18,636 (38.1%) | 27,313 (55.8%) |
| 19 to 25 Years | 3,042 (8.4%) | 26,493 (73.0%) |
| 25 to 34 Years | 3,258 (11.2%) | 19,276 (66.4%) |
| 35 to 44 Years | 3,406 (11.4%) | 20,769 (69.2%) |
| 45 to 54 Years | 3,461 (12.8%) | 19,154 (70.9%) |
| 55 to 64 Years | 5,686 (20.0%) | 21,117 (74.3%) |
| 65 to 74 Years | 20,372 (93.2%) | 13,074 (59.8%) |
| 75 Years and over | 15,102 (98.7%) | 9,643 (63.0%) |
| Total | 82,904 (32.3%) | 166,407 (64.7%) |
Disability Status by Sex by Age in McLennan County
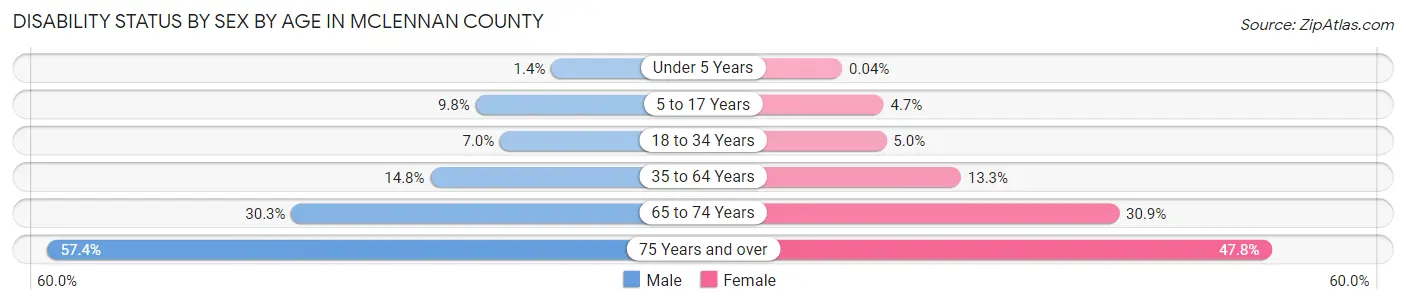
| Age Bracket | Male | Female |
| Under 5 Years | 117 (1.3%) | 3 (0.0%) |
| 5 to 17 Years | 2,289 (9.8%) | 1,034 (4.6%) |
| 18 to 34 Years | 2,503 (7.0%) | 1,800 (5.0%) |
| 35 to 64 Years | 6,143 (14.8%) | 5,829 (13.3%) |
| 65 to 74 Years | 3,128 (30.3%) | 3,559 (30.9%) |
| 75 Years and over | 3,569 (57.4%) | 4,344 (47.8%) |
Disability Class by Sex by Age in McLennan County
Disability Class: Hearing Difficulty
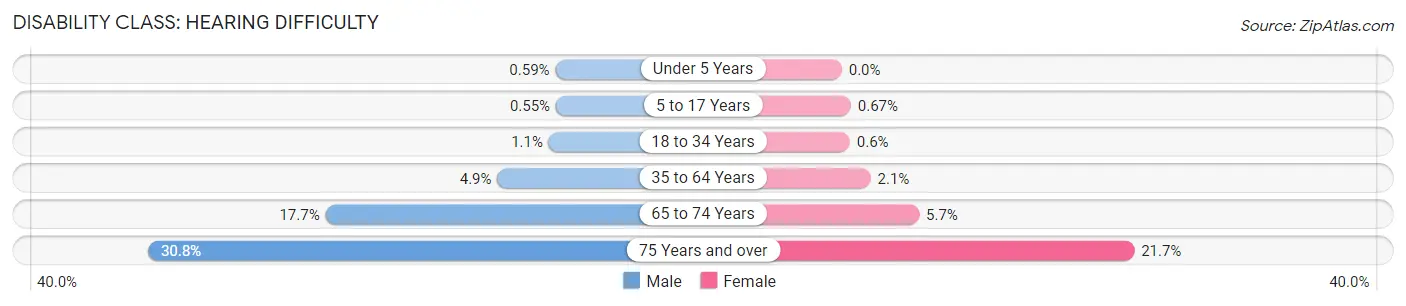
| Age Bracket | Male | Female |
| Under 5 Years | 51 (0.6%) | 0 (0.0%) |
| 5 to 17 Years | 128 (0.5%) | 148 (0.7%) |
| 18 to 34 Years | 385 (1.1%) | 218 (0.6%) |
| 35 to 64 Years | 2,034 (4.9%) | 939 (2.1%) |
| 65 to 74 Years | 1,824 (17.7%) | 661 (5.7%) |
| 75 Years and over | 1,917 (30.8%) | 1,972 (21.7%) |
Disability Class: Vision Difficulty
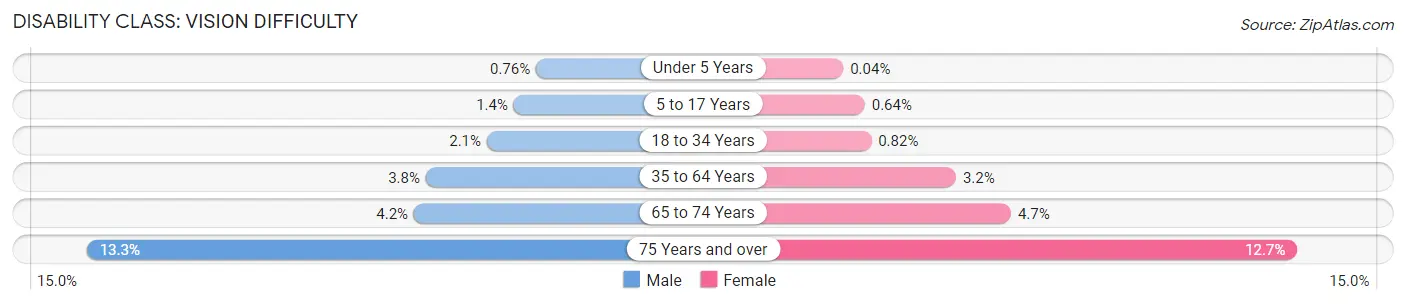
| Age Bracket | Male | Female |
| Under 5 Years | 66 (0.8%) | 3 (0.0%) |
| 5 to 17 Years | 323 (1.4%) | 142 (0.6%) |
| 18 to 34 Years | 756 (2.1%) | 297 (0.8%) |
| 35 to 64 Years | 1,588 (3.8%) | 1,398 (3.2%) |
| 65 to 74 Years | 430 (4.2%) | 543 (4.7%) |
| 75 Years and over | 825 (13.3%) | 1,152 (12.7%) |
Disability Class: Cognitive Difficulty
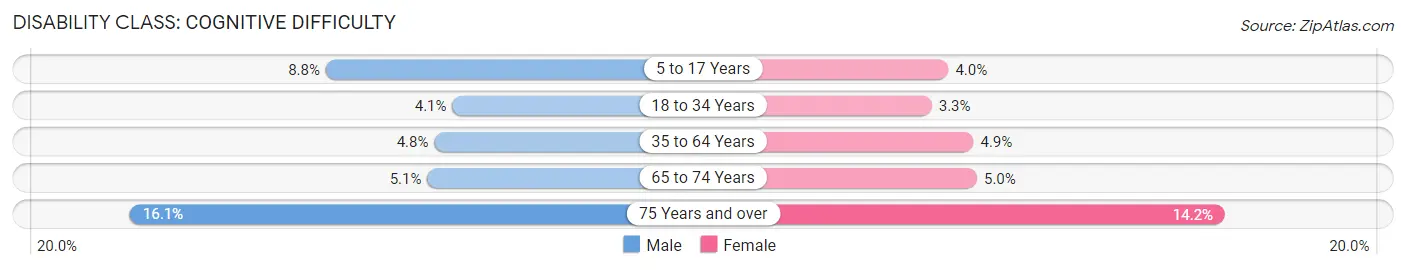
| Age Bracket | Male | Female |
| 5 to 17 Years | 2,064 (8.8%) | 881 (4.0%) |
| 18 to 34 Years | 1,466 (4.1%) | 1,209 (3.3%) |
| 35 to 64 Years | 1,989 (4.8%) | 2,150 (4.9%) |
| 65 to 74 Years | 522 (5.1%) | 579 (5.0%) |
| 75 Years and over | 1,000 (16.1%) | 1,292 (14.2%) |
Disability Class: Ambulatory Difficulty
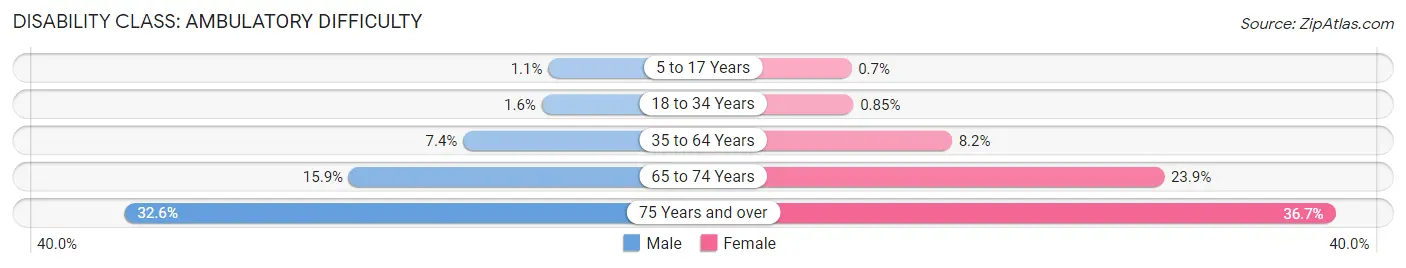
| Age Bracket | Male | Female |
| 5 to 17 Years | 262 (1.1%) | 155 (0.7%) |
| 18 to 34 Years | 572 (1.6%) | 309 (0.9%) |
| 35 to 64 Years | 3,087 (7.4%) | 3,590 (8.2%) |
| 65 to 74 Years | 1,644 (15.9%) | 2,756 (23.9%) |
| 75 Years and over | 2,025 (32.6%) | 3,330 (36.6%) |
Disability Class: Self-Care Difficulty
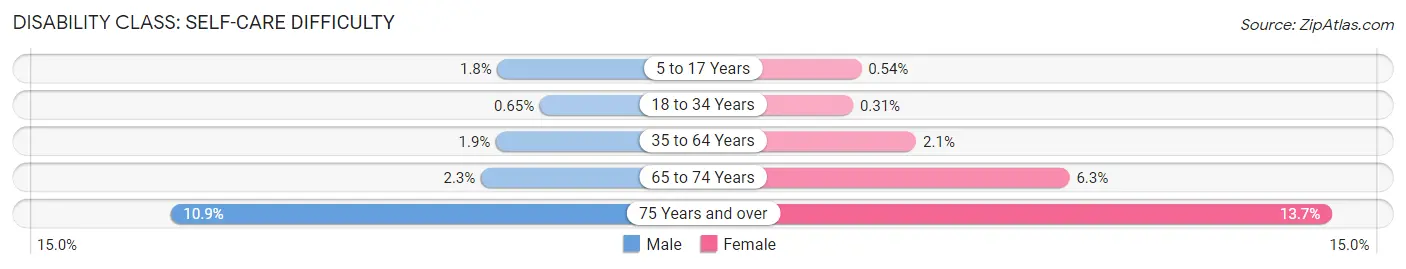
| Age Bracket | Male | Female |
| 5 to 17 Years | 428 (1.8%) | 121 (0.5%) |
| 18 to 34 Years | 231 (0.6%) | 111 (0.3%) |
| 35 to 64 Years | 775 (1.9%) | 912 (2.1%) |
| 65 to 74 Years | 237 (2.3%) | 731 (6.3%) |
| 75 Years and over | 680 (10.9%) | 1,240 (13.7%) |
Technology Access in McLennan County
Computing Device Access in McLennan County

| Device Type | # Households | % Households |
| Desktop or Laptop | 69,276 | 72.9% |
| Smartphone | 84,560 | 89.0% |
| Tablet | 54,680 | 57.6% |
| No Computing Device | 6,512 | 6.9% |
| Total | 94,985 | 100.0% |
Internet Access in McLennan County
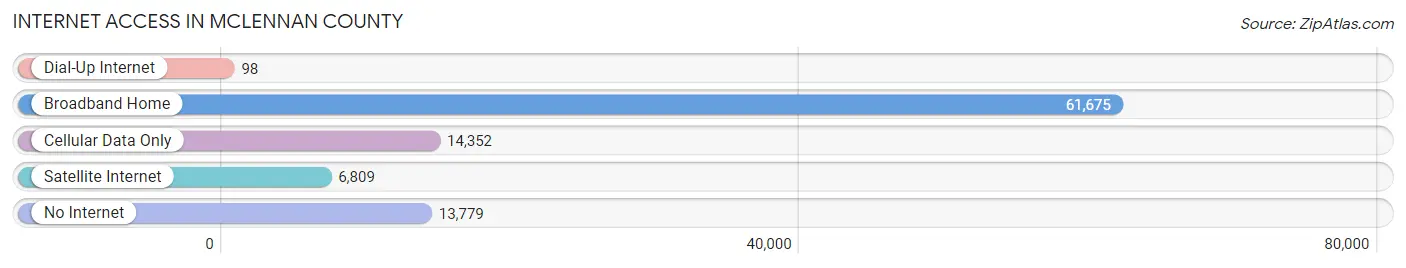
| Internet Type | # Households | % Households |
| Dial-Up Internet | 98 | 0.1% |
| Broadband Home | 61,675 | 64.9% |
| Cellular Data Only | 14,352 | 15.1% |
| Satellite Internet | 6,809 | 7.2% |
| No Internet | 13,779 | 14.5% |
| Total | 94,985 | 100.0% |
McLennan County Summary
Mclennan County, Texas is located in the central part of the state and is part of the Waco Metropolitan Statistical Area. The county is bordered by Hill County to the north, Bosque County to the east, Falls County to the south, and Bell County to the west. The county seat is Waco, which is also the largest city in the county.
History
Mclennan County was established in 1850 and named after Neil McLennan, an early settler in the area. The county was originally part of Milam County, but was later divided into its own county. The county was initially populated by Native Americans, but by the mid-1800s, settlers from the United States began to move into the area.
The county was home to several battles during the Civil War, including the Battle of Waco in 1865. After the war, the county experienced a period of growth and development, with the establishment of several towns and cities, including Waco, which became the county seat in 1873.
Geography
Mclennan County covers an area of 1,062 square miles and is located in the central part of the state. The county is bordered by Hill County to the north, Bosque County to the east, Falls County to the south, and Bell County to the west. The county is mostly flat, with some rolling hills in the northern part of the county. The Brazos River runs through the county, and there are several lakes and reservoirs in the area.
The climate in Mclennan County is generally hot and humid in the summer and mild in the winter. The average annual temperature is around 68 degrees Fahrenheit, and the average annual precipitation is around 37 inches.
Economy
Mclennan County has a diverse economy, with a mix of manufacturing, agriculture, and services. The county is home to several large employers, including Baylor University, Waco Regional Airport, and the Waco Independent School District. The county is also home to several large manufacturing companies, including Caterpillar, Inc., and Texas Instruments.
Agriculture is also an important part of the county’s economy, with the main crops being cotton, corn, and hay. Livestock production is also important, with cattle, hogs, and poultry being the main animals raised in the county.
Demographics
As of the 2010 census, Mclennan County had a population of 234,906. The population was spread out, with 48.3% of the population being male and 51.7% being female. The median age was 33.7 years, and the median household income was $45,945.
The racial makeup of the county was 73.2% White, 15.3% Hispanic or Latino, 9.2% African American, 1.2% Asian, and 0.7% Native American. The largest ancestry groups in the county were German (17.2%), Irish (14.2%), English (13.2%), and Mexican (12.2%).
Mclennan County is a diverse and vibrant county with a rich history and a strong economy. The county is home to several large employers, and the population is diverse, with a mix of different racial and ethnic backgrounds. The county is also home to several recreational activities, including fishing, camping, and hiking.
Common Questions
What is the Total Population of McLennan County?
Total Population of McLennan County is 261,090.
What is the Total Male Population of McLennan County?
Total Male Population of McLennan County is 128,169.
What is the Total Female Population of McLennan County?
Total Female Population of McLennan County is 132,921.
What is the Ratio of Males per 100 Females in McLennan County?
There are 96.42 Males per 100 Females in McLennan County.
What is the Ratio of Females per 100 Males in McLennan County?
There are 103.71 Females per 100 Males in McLennan County.
What is the Median Population Age in McLennan County?
Median Population Age in McLennan County is 33.6 Years.
What is the Average Family Size in McLennan County
Average Family Size in McLennan County is 3.2 People.
What is the Average Household Size in McLennan County
Average Household Size in McLennan County is 2.6 People.
What is Per Capita Income in McLennan County?
Per Capita income in McLennan County is $31,036.
What is the Median Family Income in McLennan County?
Median Family Income in McLennan County is $78,657.
What is the Median Household income in McLennan County?
Median Household Income in McLennan County is $59,781.
What is Income or Wage Gap in McLennan County?
Income or Wage Gap in McLennan County is 29.7%.
Women in McLennan County earn 70.3 cents for every dollar earned by a man.
What is Family Income Deficit in McLennan County?
Family Income Deficit in McLennan County is $10,902.
Families that are below poverty line in McLennan County earn $10,902 less on average than the poverty threshold level.
What is Inequality or Gini Index in McLennan County?
Inequality or Gini Index in McLennan County is 0.48.
How Large is the Labor Force in McLennan County?
There are 125,759 People in the Labor Forcein in McLennan County.
What is the Percentage of People in the Labor Force in McLennan County?
61.4% of People are in the Labor Force in McLennan County.
What is the Unemployment Rate in McLennan County?
Unemployment Rate in McLennan County is 4.4%.