Fort Bend County, TX
Fort Bend County Map

Fort Bend County Overview
832,607
TOTAL POPULATION
411,621
MALE POPULATION
420,986
FEMALE POPULATION
97.78
MALES / 100 FEMALES
102.28
FEMALES / 100 MALES
36.9
MEDIAN AGE
3.4
AVG FAMILY SIZE
3.1
AVG HOUSEHOLD SIZE
$45,172
PER CAPITA INCOME
$122,578
AVG FAMILY INCOME
$109,987
AVG HOUSEHOLD INCOME
36.8%
WAGE / INCOME GAP [ % ]
63.2¢/ $1
WAGE / INCOME GAP [ $ ]
$12,360
FAMILY INCOME DEFICIT
0.42
INEQUALITY / GINI INDEX
424,077
LABOR FORCE [ PEOPLE ]
66.9%
PERCENT IN LABOR FORCE
5.2%
UNEMPLOYMENT RATE
Race in Fort Bend County
The most populous races in Fort Bend County are White / Caucasian (340,686 | 40.9%), Hispanic or Latino (209,110 | 25.1%), and Asian (178,091 | 21.4%).

| Race | # Population | % Population |
| Asian | 178,091 | 21.4% |
| Black / African American | 169,120 | 20.3% |
| Hawaiian / Pacific | 392 | 0.1% |
| Hispanic or Latino | 209,110 | 25.1% |
| Native / Alaskan | 2,695 | 0.3% |
| White / Caucasian | 340,686 | 40.9% |
| Two or more Races | 92,448 | 11.1% |
| Some other Race | 49,175 | 5.9% |
| Total | 832,607 | 100.0% |
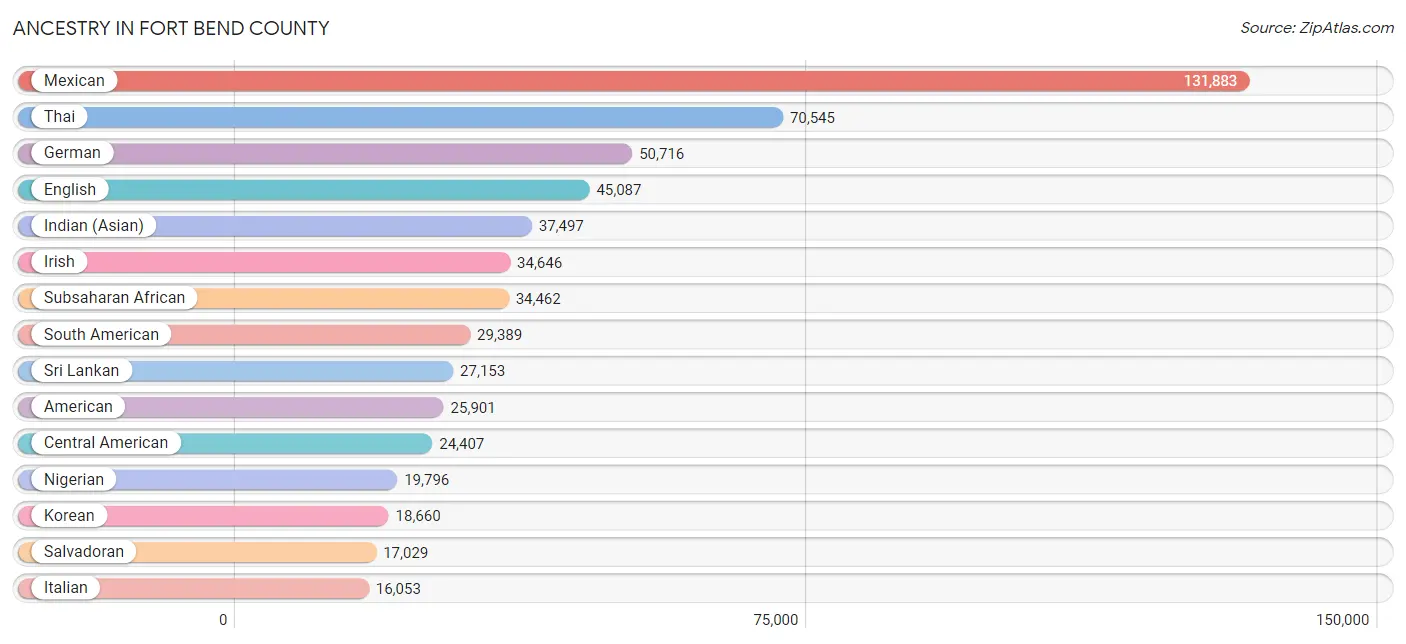
Ancestry in Fort Bend County
The most populous ancestries reported in Fort Bend County are Mexican (131,883 | 15.8%), Thai (70,545 | 8.5%), German (50,716 | 6.1%), English (45,087 | 5.4%), and Indian (Asian) (37,497 | 4.5%), together accounting for 40.3% of all Fort Bend County residents.
| Ancestry | # Population | % Population |
| Afghan | 716 | 0.1% |
| African | 7,166 | 0.9% |
| Alaska Native | 5 | 0.0% |
| Albanian | 141 | 0.0% |
| Alsatian | 11 | 0.0% |
| American | 25,901 | 3.1% |
| Apache | 88 | 0.0% |
| Arab | 13,821 | 1.7% |
| Argentinean | 1,364 | 0.2% |
| Armenian | 246 | 0.0% |
| Australian | 37 | 0.0% |
| Austrian | 678 | 0.1% |
| Bahamian | 103 | 0.0% |
| Bangladeshi | 432 | 0.1% |
| Barbadian | 226 | 0.0% |
| Basque | 126 | 0.0% |
| Belgian | 406 | 0.1% |
| Belizean | 411 | 0.1% |
| Bhutanese | 2,749 | 0.3% |
| Blackfeet | 259 | 0.0% |
| Bolivian | 321 | 0.0% |
| Brazilian | 1,304 | 0.2% |
| British | 4,809 | 0.6% |
| British West Indian | 238 | 0.0% |
| Bulgarian | 176 | 0.0% |
| Burmese | 4,831 | 0.6% |
| Cajun | 561 | 0.1% |
| Cambodian | 28 | 0.0% |
| Canadian | 1,281 | 0.2% |
| Celtic | 5 | 0.0% |
| Central American | 24,407 | 2.9% |
| Central American Indian | 1,242 | 0.2% |
| Cherokee | 1,540 | 0.2% |
| Cheyenne | 55 | 0.0% |
| Chickasaw | 79 | 0.0% |
| Chilean | 1,139 | 0.1% |
| Chippewa | 143 | 0.0% |
| Choctaw | 385 | 0.1% |
| Colombian | 10,313 | 1.2% |
| Comanche | 321 | 0.0% |
| Costa Rican | 332 | 0.0% |
| Cree | 9 | 0.0% |
| Creek | 81 | 0.0% |
| Croatian | 548 | 0.1% |
| Cuban | 4,029 | 0.5% |
| Cypriot | 5 | 0.0% |
| Czech | 7,662 | 0.9% |
| Czechoslovakian | 721 | 0.1% |
| Danish | 953 | 0.1% |
| Delaware | 7 | 0.0% |
| Dominican | 1,766 | 0.2% |
| Dutch | 3,376 | 0.4% |
| Eastern European | 507 | 0.1% |
| Ecuadorian | 661 | 0.1% |
| Egyptian | 1,451 | 0.2% |
| English | 45,087 | 5.4% |
| Ethiopian | 952 | 0.1% |
| European | 8,248 | 1.0% |
| Filipino | 2,945 | 0.4% |
| Finnish | 550 | 0.1% |
| French | 11,391 | 1.4% |
| French American Indian | 32 | 0.0% |
| French Canadian | 1,870 | 0.2% |
| German | 50,716 | 6.1% |
| German Russian | 86 | 0.0% |
| Ghanaian | 518 | 0.1% |
| Greek | 1,986 | 0.2% |
| Guamanian / Chamorro | 177 | 0.0% |
| Guatemalan | 1,948 | 0.2% |
| Guyanese | 71 | 0.0% |
| Haitian | 716 | 0.1% |
| Hmong | 28 | 0.0% |
| Honduran | 3,474 | 0.4% |
| Hopi | 28 | 0.0% |
| Hungarian | 1,068 | 0.1% |
| Icelander | 134 | 0.0% |
| Indian (Asian) | 37,497 | 4.5% |
| Indonesian | 160 | 0.0% |
| Iranian | 1,687 | 0.2% |
| Iraqi | 2,768 | 0.3% |
| Irish | 34,646 | 4.2% |
| Iroquois | 57 | 0.0% |
| Israeli | 32 | 0.0% |
| Italian | 16,053 | 1.9% |
| Jamaican | 2,631 | 0.3% |
| Japanese | 967 | 0.1% |
| Jordanian | 813 | 0.1% |
| Kenyan | 1,814 | 0.2% |
| Korean | 18,660 | 2.2% |
| Laotian | 1,311 | 0.2% |
| Latvian | 23 | 0.0% |
| Lebanese | 2,876 | 0.4% |
| Liberian | 180 | 0.0% |
| Lithuanian | 408 | 0.1% |
| Macedonian | 74 | 0.0% |
| Malaysian | 39 | 0.0% |
| Mexican | 131,883 | 15.8% |
| Mexican American Indian | 1,406 | 0.2% |
| Mongolian | 1,011 | 0.1% |
| Moroccan | 522 | 0.1% |
| Native Hawaiian | 520 | 0.1% |
| Navajo | 305 | 0.0% |
| Nicaraguan | 568 | 0.1% |
| Nigerian | 19,796 | 2.4% |
| Northern European | 460 | 0.1% |
| Norwegian | 3,556 | 0.4% |
| Okinawan | 179 | 0.0% |
| Osage | 160 | 0.0% |
| Pakistani | 689 | 0.1% |
| Palestinian | 679 | 0.1% |
| Panamanian | 1,056 | 0.1% |
| Pennsylvania German | 9 | 0.0% |
| Peruvian | 3,517 | 0.4% |
| Polish | 7,855 | 0.9% |
| Portuguese | 1,656 | 0.2% |
| Potawatomi | 28 | 0.0% |
| Pueblo | 57 | 0.0% |
| Puerto Rican | 5,326 | 0.6% |
| Romanian | 962 | 0.1% |
| Russian | 2,514 | 0.3% |
| Salvadoran | 17,029 | 2.1% |
| Samoan | 92 | 0.0% |
| Scandinavian | 1,064 | 0.1% |
| Scotch-Irish | 4,159 | 0.5% |
| Scottish | 7,040 | 0.9% |
| Seminole | 13 | 0.0% |
| Senegalese | 53 | 0.0% |
| Serbian | 610 | 0.1% |
| Sierra Leonean | 607 | 0.1% |
| Sioux | 12 | 0.0% |
| Slavic | 248 | 0.0% |
| Slovak | 444 | 0.1% |
| Slovene | 50 | 0.0% |
| Somali | 54 | 0.0% |
| South African | 1,103 | 0.1% |
| South American | 29,389 | 3.5% |
| South American Indian | 415 | 0.1% |
| Spaniard | 3,461 | 0.4% |
| Spanish | 1,745 | 0.2% |
| Spanish American | 46 | 0.0% |
| Spanish American Indian | 33 | 0.0% |
| Sri Lankan | 27,153 | 3.3% |
| Subsaharan African | 34,462 | 4.1% |
| Sudanese | 701 | 0.1% |
| Swedish | 2,663 | 0.3% |
| Swiss | 669 | 0.1% |
| Syrian | 316 | 0.0% |
| Thai | 70,545 | 8.5% |
| Trinidadian and Tobagonian | 320 | 0.0% |
| Turkish | 3,011 | 0.4% |
| Ugandan | 141 | 0.0% |
| Ukrainian | 476 | 0.1% |
| Uruguayan | 202 | 0.0% |
| Ute | 3 | 0.0% |
| Venezuelan | 11,872 | 1.4% |
| Vietnamese | 1,092 | 0.1% |
| Welsh | 2,264 | 0.3% |
| West Indian | 582 | 0.1% |
| Yaqui | 14 | 0.0% |
| Yugoslavian | 274 | 0.0% |
| Zimbabwean | 51 | 0.0% | View All 161 Rows |
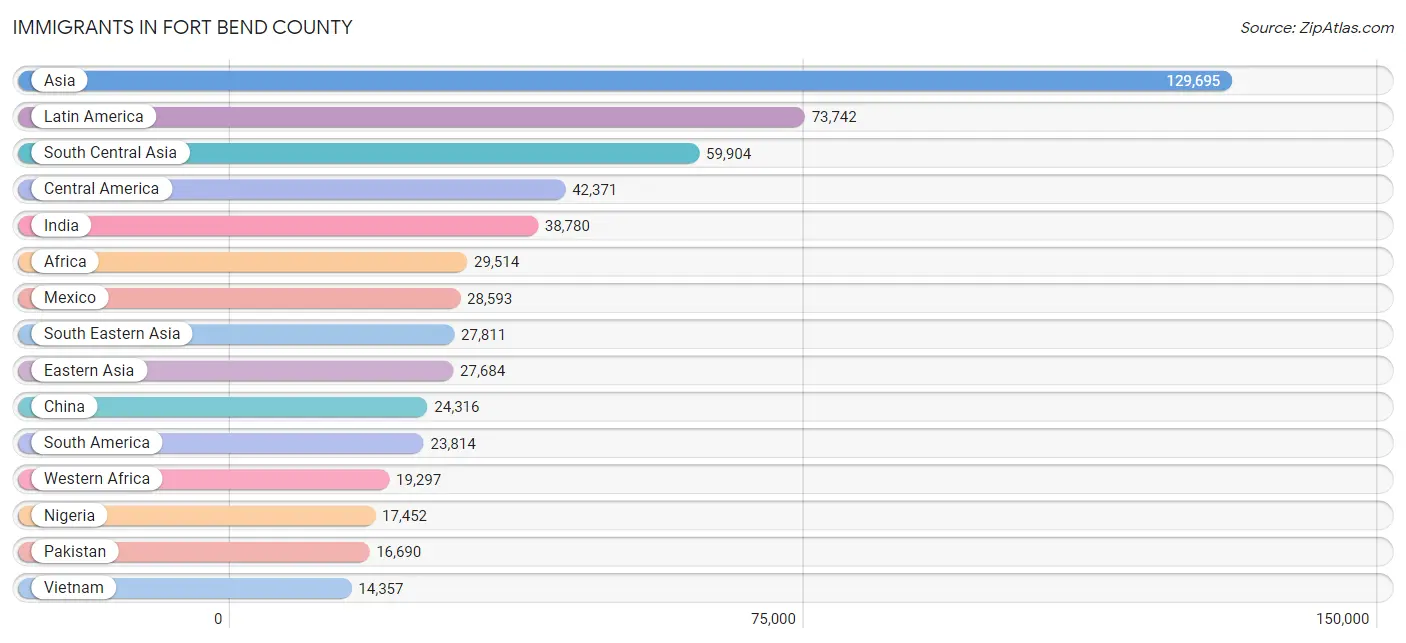
Immigrants in Fort Bend County
The most numerous immigrant groups reported in Fort Bend County came from Asia (129,695 | 15.6%), Latin America (73,742 | 8.9%), South Central Asia (59,904 | 7.2%), Central America (42,371 | 5.1%), and India (38,780 | 4.7%), together accounting for 41.4% of all Fort Bend County residents.
| Immigration Origin | # Population | % Population |
| Afghanistan | 552 | 0.1% |
| Africa | 29,514 | 3.5% |
| Albania | 120 | 0.0% |
| Argentina | 1,050 | 0.1% |
| Armenia | 43 | 0.0% |
| Asia | 129,695 | 15.6% |
| Australia | 169 | 0.0% |
| Austria | 21 | 0.0% |
| Bahamas | 18 | 0.0% |
| Bangladesh | 1,267 | 0.2% |
| Barbados | 280 | 0.0% |
| Belgium | 16 | 0.0% |
| Belize | 285 | 0.0% |
| Bolivia | 310 | 0.0% |
| Bosnia and Herzegovina | 85 | 0.0% |
| Brazil | 1,846 | 0.2% |
| Bulgaria | 6 | 0.0% |
| Cambodia | 456 | 0.1% |
| Cameroon | 677 | 0.1% |
| Canada | 3,527 | 0.4% |
| Caribbean | 7,557 | 0.9% |
| Central America | 42,371 | 5.1% |
| Chile | 811 | 0.1% |
| China | 24,316 | 2.9% |
| Colombia | 7,185 | 0.9% |
| Congo | 171 | 0.0% |
| Costa Rica | 279 | 0.0% |
| Croatia | 87 | 0.0% |
| Cuba | 2,129 | 0.3% |
| Czechoslovakia | 140 | 0.0% |
| Denmark | 123 | 0.0% |
| Dominica | 468 | 0.1% |
| Dominican Republic | 929 | 0.1% |
| Eastern Africa | 4,704 | 0.6% |
| Eastern Asia | 27,684 | 3.3% |
| Eastern Europe | 2,915 | 0.4% |
| Ecuador | 349 | 0.0% |
| Egypt | 1,201 | 0.1% |
| El Salvador | 9,136 | 1.1% |
| England | 1,200 | 0.1% |
| Eritrea | 315 | 0.0% |
| Ethiopia | 1,174 | 0.1% |
| Europe | 13,142 | 1.6% |
| Fiji | 15 | 0.0% |
| France | 281 | 0.0% |
| Germany | 887 | 0.1% |
| Ghana | 512 | 0.1% |
| Greece | 254 | 0.0% |
| Grenada | 129 | 0.0% |
| Guatemala | 1,088 | 0.1% |
| Guyana | 174 | 0.0% |
| Haiti | 276 | 0.0% |
| Honduras | 2,154 | 0.3% |
| Hong Kong | 1,880 | 0.2% |
| Hungary | 157 | 0.0% |
| India | 38,780 | 4.7% |
| Indonesia | 926 | 0.1% |
| Iran | 1,329 | 0.2% |
| Iraq | 3,538 | 0.4% |
| Ireland | 13 | 0.0% |
| Israel | 272 | 0.0% |
| Italy | 882 | 0.1% |
| Jamaica | 2,297 | 0.3% |
| Japan | 1,015 | 0.1% |
| Jordan | 823 | 0.1% |
| Kazakhstan | 159 | 0.0% |
| Kenya | 1,971 | 0.2% |
| Korea | 2,268 | 0.3% |
| Kuwait | 195 | 0.0% |
| Laos | 31 | 0.0% |
| Latin America | 73,742 | 8.9% |
| Latvia | 30 | 0.0% |
| Lebanon | 1,247 | 0.2% |
| Liberia | 269 | 0.0% |
| Lithuania | 45 | 0.0% |
| Malaysia | 1,264 | 0.2% |
| Mexico | 28,593 | 3.4% |
| Micronesia | 78 | 0.0% |
| Middle Africa | 1,146 | 0.1% |
| Moldova | 24 | 0.0% |
| Morocco | 184 | 0.0% |
| Nepal | 546 | 0.1% |
| Netherlands | 576 | 0.1% |
| Nicaragua | 282 | 0.0% |
| Nigeria | 17,452 | 2.1% |
| North Macedonia | 86 | 0.0% |
| Northern Africa | 2,560 | 0.3% |
| Northern Europe | 6,404 | 0.8% |
| Norway | 497 | 0.1% |
| Oceania | 372 | 0.0% |
| Pakistan | 16,690 | 2.0% |
| Panama | 554 | 0.1% |
| Peru | 2,079 | 0.3% |
| Philippines | 9,819 | 1.2% |
| Poland | 583 | 0.1% |
| Portugal | 179 | 0.0% |
| Romania | 184 | 0.0% |
| Russia | 879 | 0.1% |
| Saudi Arabia | 1,573 | 0.2% |
| Scotland | 717 | 0.1% |
| Senegal | 114 | 0.0% |
| Serbia | 130 | 0.0% |
| Sierra Leone | 692 | 0.1% |
| Singapore | 318 | 0.0% |
| Somalia | 14 | 0.0% |
| South Africa | 1,394 | 0.2% |
| South America | 23,814 | 2.9% |
| South Central Asia | 59,904 | 7.2% |
| South Eastern Asia | 27,811 | 3.3% |
| Southern Europe | 1,991 | 0.2% |
| Spain | 676 | 0.1% |
| Sri Lanka | 317 | 0.0% |
| St. Vincent and the Grenadines | 50 | 0.0% |
| Sudan | 466 | 0.1% |
| Sweden | 301 | 0.0% |
| Switzerland | 51 | 0.0% |
| Syria | 487 | 0.1% |
| Taiwan | 4,445 | 0.5% |
| Thailand | 486 | 0.1% |
| Trinidad and Tobago | 730 | 0.1% |
| Turkey | 3,514 | 0.4% |
| Uganda | 329 | 0.0% |
| Ukraine | 233 | 0.0% |
| Uruguay | 92 | 0.0% |
| Uzbekistan | 73 | 0.0% |
| Venezuela | 9,884 | 1.2% |
| Vietnam | 14,357 | 1.7% |
| West Indies | 109 | 0.0% |
| Western Africa | 19,297 | 2.3% |
| Western Asia | 13,938 | 1.7% |
| Western Europe | 1,832 | 0.2% |
| Yemen | 14 | 0.0% |
| Zaire | 93 | 0.0% |
| Zimbabwe | 71 | 0.0% | View All 134 Rows |
Sex and Age in Fort Bend County
Sex and Age in Fort Bend County
The most populous age groups in Fort Bend County are 10 to 14 Years (35,956 | 8.7%) for men and 35 to 39 Years (33,246 | 7.9%) for women.

| Age Bracket | Male | Female |
| Under 5 Years | 26,819 (6.5%) | 25,974 (6.2%) |
| 5 to 9 Years | 31,436 (7.6%) | 30,986 (7.4%) |
| 10 to 14 Years | 35,956 (8.7%) | 32,967 (7.8%) |
| 15 to 19 Years | 32,463 (7.9%) | 30,597 (7.3%) |
| 20 to 24 Years | 25,031 (6.1%) | 24,343 (5.8%) |
| 25 to 29 Years | 22,184 (5.4%) | 22,977 (5.5%) |
| 30 to 34 Years | 24,532 (6.0%) | 27,185 (6.5%) |
| 35 to 39 Years | 29,748 (7.2%) | 33,246 (7.9%) |
| 40 to 44 Years | 32,778 (8.0%) | 32,964 (7.8%) |
| 45 to 49 Years | 31,012 (7.5%) | 31,453 (7.5%) |
| 50 to 54 Years | 27,579 (6.7%) | 27,244 (6.5%) |
| 55 to 59 Years | 24,449 (5.9%) | 25,247 (6.0%) |
| 60 to 64 Years | 22,484 (5.5%) | 23,096 (5.5%) |
| 65 to 69 Years | 18,155 (4.4%) | 19,634 (4.7%) |
| 70 to 74 Years | 12,824 (3.1%) | 14,485 (3.4%) |
| 75 to 79 Years | 7,802 (1.9%) | 8,699 (2.1%) |
| 80 to 84 Years | 3,584 (0.9%) | 4,872 (1.2%) |
| 85 Years and over | 2,785 (0.7%) | 5,017 (1.2%) |
| Total | 411,621 (100.0%) | 420,986 (100.0%) |
Families and Households in Fort Bend County
Median Family Size in Fort Bend County
The median family size in Fort Bend County is 3.41 persons per family, with married-couple families (177,562 | 80.4%) accounting for the largest median family size of 3.49 persons per family. On the other hand, single male/father families (11,828 | 5.4%) represent the smallest median family size with 2.91 persons per family.

| Family Type | # Families | Family Size |
| Married-Couple | 177,562 (80.4%) | 3.49 |
| Single Male/Father | 11,828 (5.4%) | 2.91 |
| Single Female/Mother | 31,483 (14.2%) | 3.20 |
| Total Families | 220,873 (100.0%) | 3.41 |
Median Household Size in Fort Bend County
The median household size in Fort Bend County is 3.06 persons per household, with married-couple households (177,562 | 65.7%) accounting for the largest median household size of 3.5 persons per household. non-family households (49,263 | 18.2%) represent the smallest median household size with 1.21 persons per household.

| Household Type | # Households | Household Size |
| Married-Couple | 177,562 (65.7%) | 3.50 |
| Single Male/Father | 11,828 (4.4%) | 3.19 |
| Single Female/Mother | 31,483 (11.7%) | 3.40 |
| Non-family | 49,263 (18.2%) | 1.21 |
| Total Households | 270,136 (100.0%) | 3.06 |
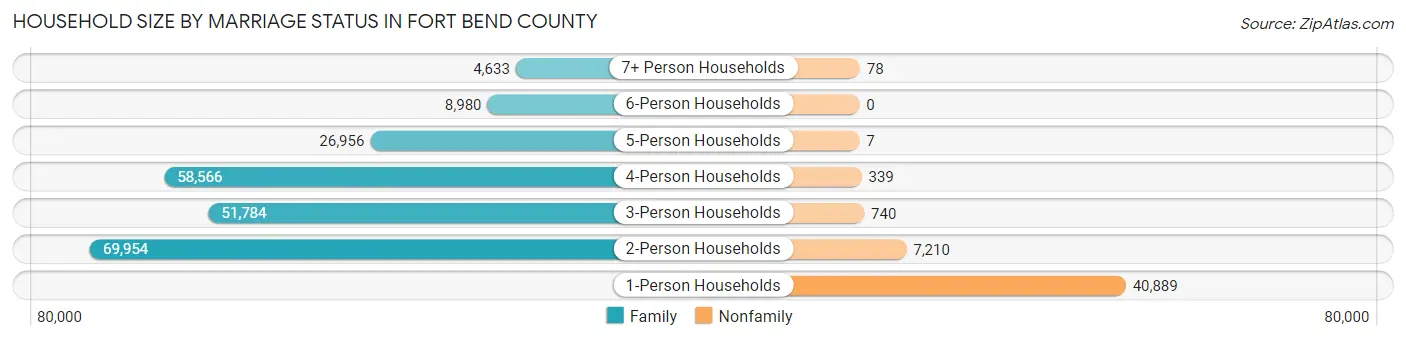
Household Size by Marriage Status in Fort Bend County
Out of a total of 270,136 households in Fort Bend County, 220,873 (81.8%) are family households, while 49,263 (18.2%) are nonfamily households. The most numerous type of family households are 2-person households, comprising 69,954, and the most common type of nonfamily households are 1-person households, comprising 40,889.
| Household Size | Family Households | Nonfamily Households |
| 1-Person Households | - | 40,889 (15.1%) |
| 2-Person Households | 69,954 (25.9%) | 7,210 (2.7%) |
| 3-Person Households | 51,784 (19.2%) | 740 (0.3%) |
| 4-Person Households | 58,566 (21.7%) | 339 (0.1%) |
| 5-Person Households | 26,956 (10.0%) | 7 (0.0%) |
| 6-Person Households | 8,980 (3.3%) | 0 (0.0%) |
| 7+ Person Households | 4,633 (1.7%) | 78 (0.0%) |
| Total | 220,873 (81.8%) | 49,263 (18.2%) |
Female Fertility in Fort Bend County
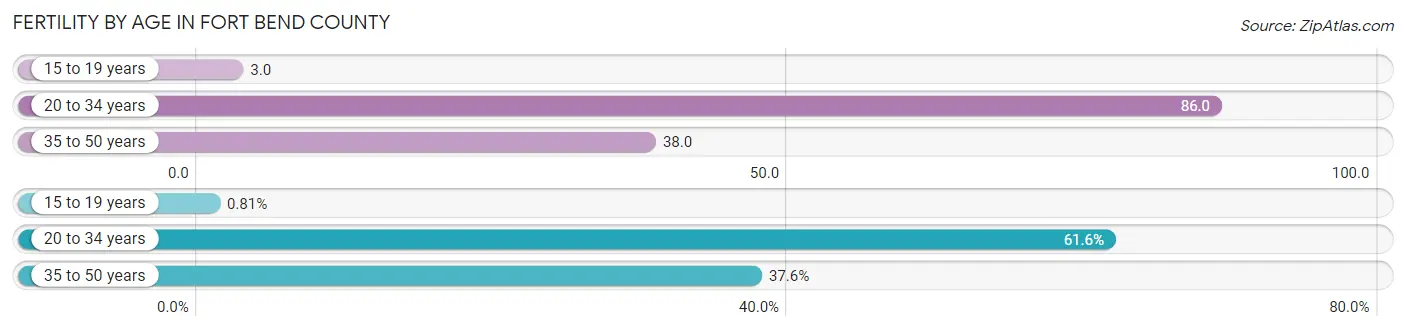
Fertility by Age in Fort Bend County
Average fertility rate in Fort Bend County is 50.0 births per 1,000 women. Women in the age bracket of 20 to 34 years have the highest fertility rate with 86.0 births per 1,000 women. Women in the age bracket of 20 to 34 years acount for 61.6% of all women with births.
| Age Bracket | Women with Births | Births / 1,000 Women |
| 15 to 19 years | 84 (0.8%) | 3.0 |
| 20 to 34 years | 6,421 (61.6%) | 86.0 |
| 35 to 50 years | 3,919 (37.6%) | 38.0 |
| Total | 10,424 (100.0%) | 50.0 |
Fertility by Age by Marriage Status in Fort Bend County
83.8% of women with births (10,424) in Fort Bend County are married. The highest percentage of unmarried women with births falls into 15 to 19 years age bracket with 90.5% of them unmarried at the time of birth, while the lowest percentage of unmarried women with births belong to 35 to 50 years age bracket with 6.6% of them unmarried.
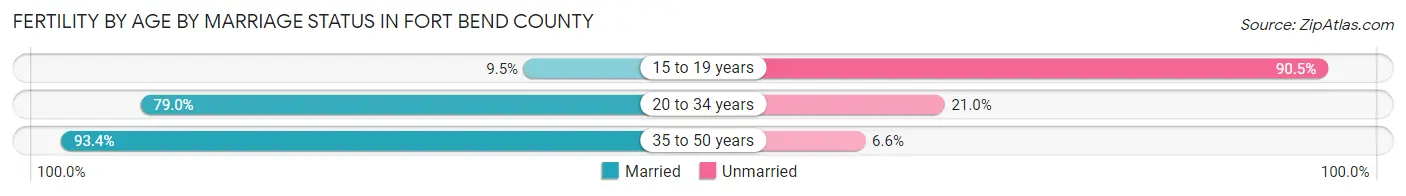
| Age Bracket | Married | Unmarried |
| 15 to 19 years | 8 (9.5%) | 76 (90.5%) |
| 20 to 34 years | 5,073 (79.0%) | 1,348 (21.0%) |
| 35 to 50 years | 3,660 (93.4%) | 259 (6.6%) |
| Total | 8,735 (83.8%) | 1,689 (16.2%) |
Fertility by Education in Fort Bend County
Average fertility rate in Fort Bend County is 50.0 births per 1,000 women. Women with the education attainment of bachelor's degree have the highest fertility rate of 69.0 births per 1,000 women, while women with the education attainment of less than high school have the lowest fertility at 13.0 births per 1,000 women. Women with the education attainment of bachelor's degree represent 38.4% of all women with births.
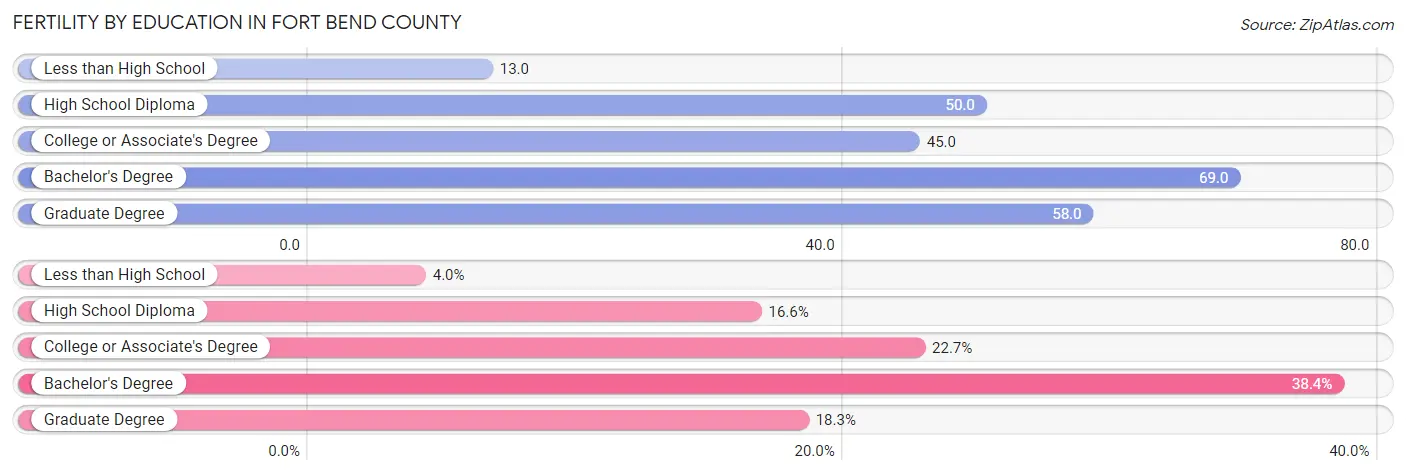
| Educational Attainment | Women with Births | Births / 1,000 Women |
| Less than High School | 416 (4.0%) | 13.0 |
| High School Diploma | 1,727 (16.6%) | 50.0 |
| College or Associate's Degree | 2,366 (22.7%) | 45.0 |
| Bachelor's Degree | 4,003 (38.4%) | 69.0 |
| Graduate Degree | 1,912 (18.3%) | 58.0 |
| Total | 10,424 (100.0%) | 50.0 |
Fertility by Education by Marriage Status in Fort Bend County
16.2% of women with births in Fort Bend County are unmarried. Women with the educational attainment of graduate degree are most likely to be married with 97.7% of them married at childbirth, while women with the educational attainment of high school diploma are least likely to be married with 53.6% of them unmarried at childbirth.
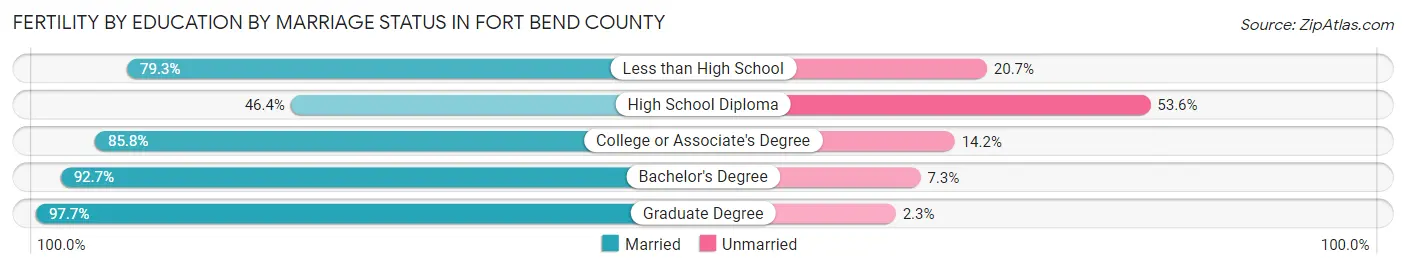
| Educational Attainment | Married | Unmarried |
| Less than High School | 330 (79.3%) | 86 (20.7%) |
| High School Diploma | 801 (46.4%) | 926 (53.6%) |
| College or Associate's Degree | 2,030 (85.8%) | 336 (14.2%) |
| Bachelor's Degree | 3,711 (92.7%) | 292 (7.3%) |
| Graduate Degree | 1,868 (97.7%) | 44 (2.3%) |
| Total | 8,735 (83.8%) | 1,689 (16.2%) |
Income in Fort Bend County
Income Overview in Fort Bend County
Per Capita Income in Fort Bend County is $45,172, while median incomes of families and households are $122,578 and $109,987 respectively.
| Characteristic | Number | Measure |
| Per Capita Income | 832,607 | $45,172 |
| Median Family Income | 220,873 | $122,578 |
| Mean Family Income | 220,873 | $150,106 |
| Median Household Income | 270,136 | $109,987 |
| Mean Household Income | 270,136 | $138,115 |
| Income Deficit | 220,873 | $12,360 |
| Wage / Income Gap (%) | 832,607 | 36.78% |
| Wage / Income Gap ($) | 832,607 | 63.22¢ per $1 |
| Gini / Inequality Index | 832,607 | 0.42 |
Earnings by Sex in Fort Bend County
Average Earnings in Fort Bend County are $51,593, $65,084 for men and $41,145 for women, a difference of 36.8%.
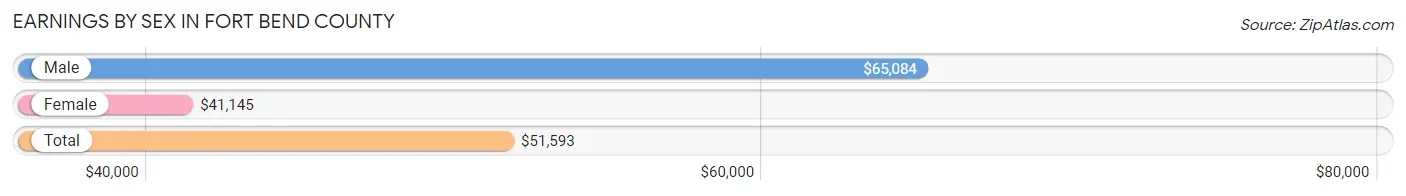
| Sex | Number | Average Earnings |
| Male | 232,919 (53.3%) | $65,084 |
| Female | 204,099 (46.7%) | $41,145 |
| Total | 437,018 (100.0%) | $51,593 |
Earnings by Sex by Income Bracket in Fort Bend County
The most common earnings brackets in Fort Bend County are $100,000+ for men (75,683 | 32.5%) and $100,000+ for women (27,436 | 13.4%).
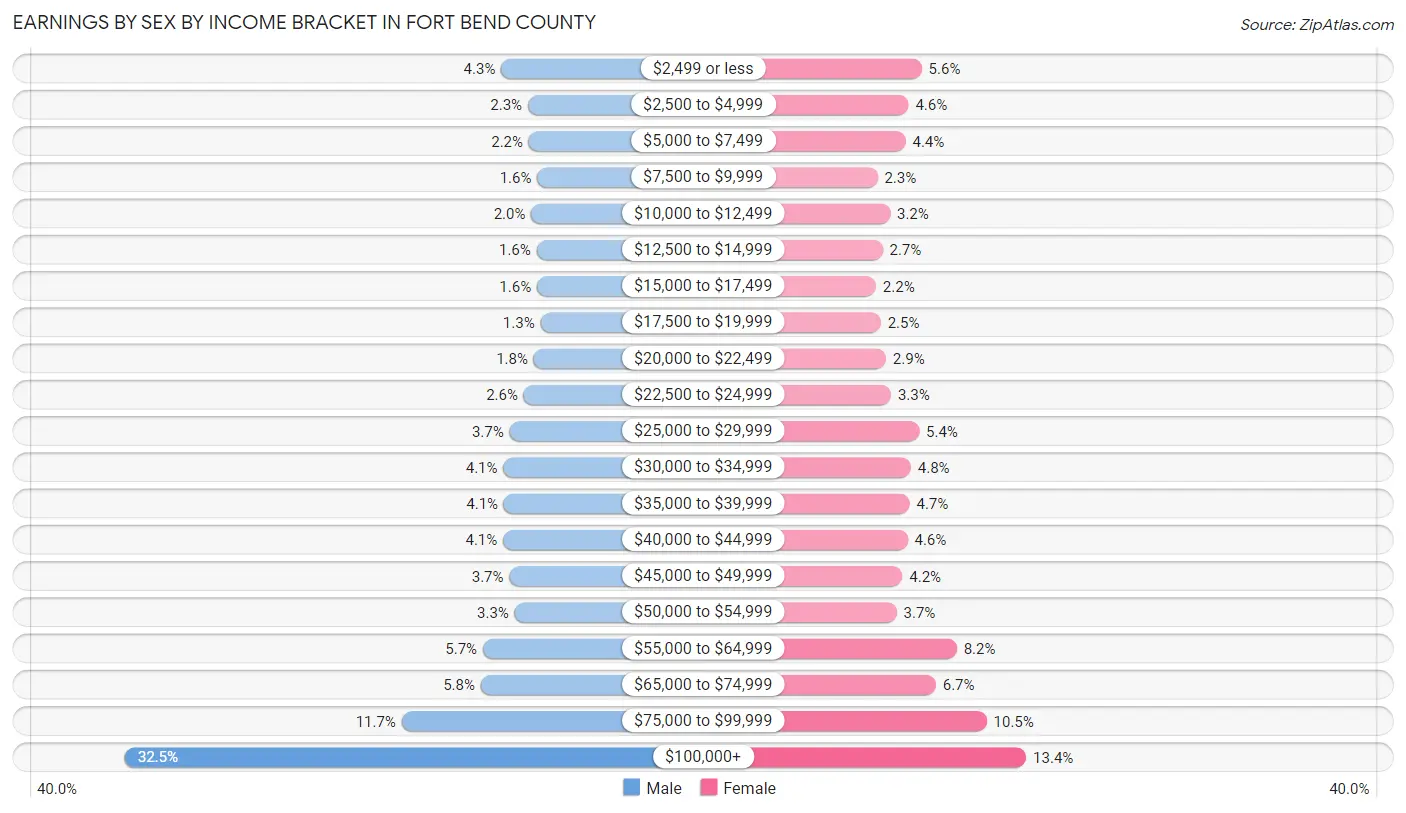
| Income | Male | Female |
| $2,499 or less | 9,967 (4.3%) | 11,446 (5.6%) |
| $2,500 to $4,999 | 5,300 (2.3%) | 9,439 (4.6%) |
| $5,000 to $7,499 | 5,141 (2.2%) | 8,986 (4.4%) |
| $7,500 to $9,999 | 3,683 (1.6%) | 4,686 (2.3%) |
| $10,000 to $12,499 | 4,734 (2.0%) | 6,623 (3.2%) |
| $12,500 to $14,999 | 3,786 (1.6%) | 5,479 (2.7%) |
| $15,000 to $17,499 | 3,717 (1.6%) | 4,443 (2.2%) |
| $17,500 to $19,999 | 3,131 (1.3%) | 5,182 (2.5%) |
| $20,000 to $22,499 | 4,282 (1.8%) | 5,983 (2.9%) |
| $22,500 to $24,999 | 6,028 (2.6%) | 6,749 (3.3%) |
| $25,000 to $29,999 | 8,529 (3.7%) | 11,068 (5.4%) |
| $30,000 to $34,999 | 9,600 (4.1%) | 9,791 (4.8%) |
| $35,000 to $39,999 | 9,497 (4.1%) | 9,587 (4.7%) |
| $40,000 to $44,999 | 9,645 (4.1%) | 9,285 (4.5%) |
| $45,000 to $49,999 | 8,538 (3.7%) | 8,492 (4.2%) |
| $50,000 to $54,999 | 7,618 (3.3%) | 7,604 (3.7%) |
| $55,000 to $64,999 | 13,150 (5.7%) | 16,825 (8.2%) |
| $65,000 to $74,999 | 13,539 (5.8%) | 13,606 (6.7%) |
| $75,000 to $99,999 | 27,351 (11.7%) | 21,389 (10.5%) |
| $100,000+ | 75,683 (32.5%) | 27,436 (13.4%) |
| Total | 232,919 (100.0%) | 204,099 (100.0%) |
Earnings by Sex by Educational Attainment in Fort Bend County
Average earnings in Fort Bend County are $74,381 for men and $47,657 for women, a difference of 35.9%. Men with an educational attainment of graduate degree enjoy the highest average annual earnings of $130,915, while those with less than high school education earn the least with $39,213. Women with an educational attainment of graduate degree earn the most with the average annual earnings of $74,755, while those with less than high school education have the smallest earnings of $25,073.
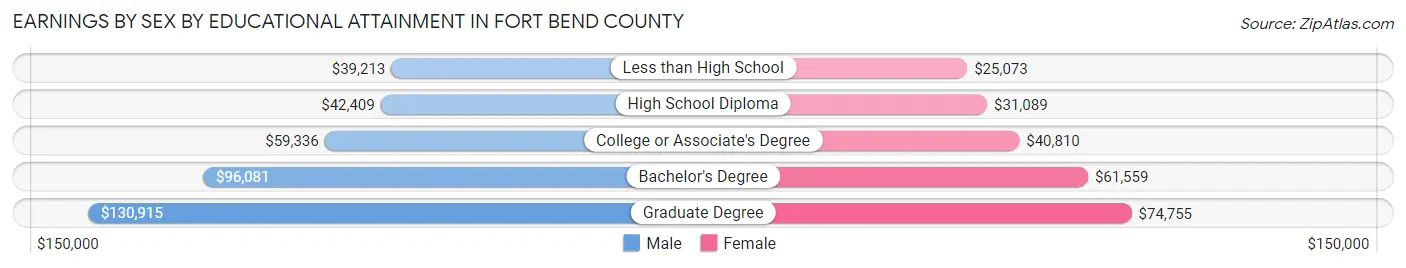
| Educational Attainment | Male Income | Female Income |
| Less than High School | $39,213 | $25,073 |
| High School Diploma | $42,409 | $31,089 |
| College or Associate's Degree | $59,336 | $40,810 |
| Bachelor's Degree | $96,081 | $61,559 |
| Graduate Degree | $130,915 | $74,755 |
| Total | $74,381 | $47,657 |
Family Income in Fort Bend County
Family Income Brackets in Fort Bend County
According to the Fort Bend County family income data, there are 50,580 families falling into the $200,000+ income range, which is the most common income bracket and makes up 22.9% of all families. Conversely, the $10,000 to $14,999 income bracket is the least frequent group with only 1,988 families (0.9%) belonging to this category.
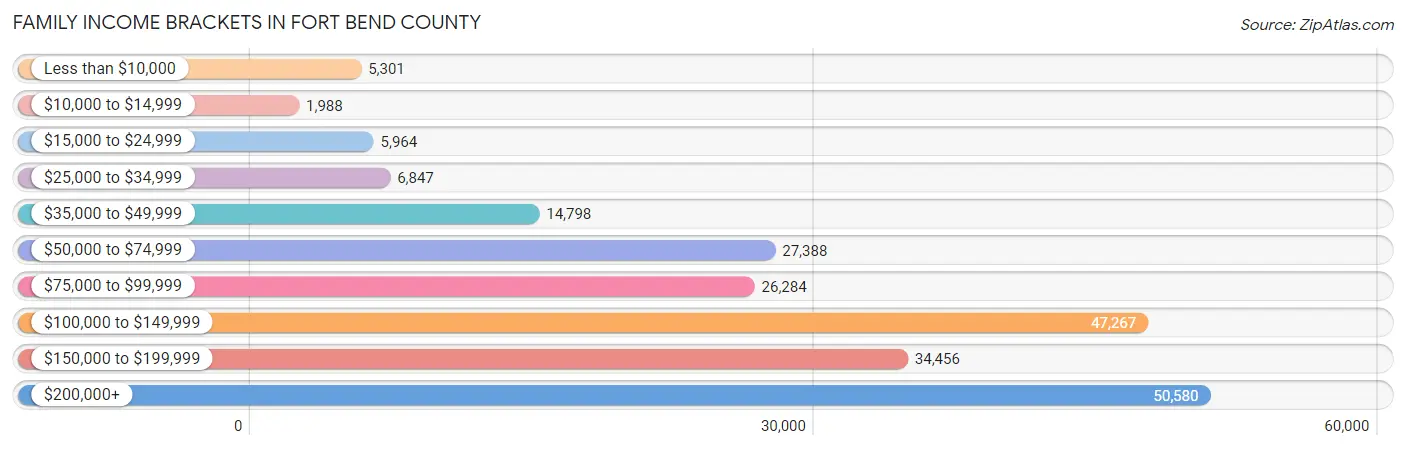
| Income Bracket | # Families | % Families |
| Less than $10,000 | 5,301 | 2.4% |
| $10,000 to $14,999 | 1,988 | 0.9% |
| $15,000 to $24,999 | 5,964 | 2.7% |
| $25,000 to $34,999 | 6,847 | 3.1% |
| $35,000 to $49,999 | 14,798 | 6.7% |
| $50,000 to $74,999 | 27,388 | 12.4% |
| $75,000 to $99,999 | 26,284 | 11.9% |
| $100,000 to $149,999 | 47,267 | 21.4% |
| $150,000 to $199,999 | 34,456 | 15.6% |
| $200,000+ | 50,580 | 22.9% |
Family Income by Famaliy Size in Fort Bend County
7+ person families (4,050 | 1.8%) account for the highest median family income in Fort Bend County with $152,898 per family, while 2-person families (73,357 | 33.2%) have the highest median income of $50,135 per family member.

| Income Bracket | # Families | Median Income |
| 2-Person Families | 73,357 (33.2%) | $100,270 |
| 3-Person Families | 52,549 (23.8%) | $124,694 |
| 4-Person Families | 57,297 (25.9%) | $140,783 |
| 5-Person Families | 25,146 (11.4%) | $124,450 |
| 6-Person Families | 8,474 (3.8%) | $148,042 |
| 7+ Person Families | 4,050 (1.8%) | $152,898 |
| Total | 220,873 (100.0%) | $122,578 |
Family Income by Number of Earners in Fort Bend County
The median family income in Fort Bend County is $122,578, with families comprising 3+ earners (31,227) having the highest median family income of $157,462, while families with no earners (19,892) have the lowest median family income of $56,011, accounting for 14.1% and 9.0% of families, respectively.
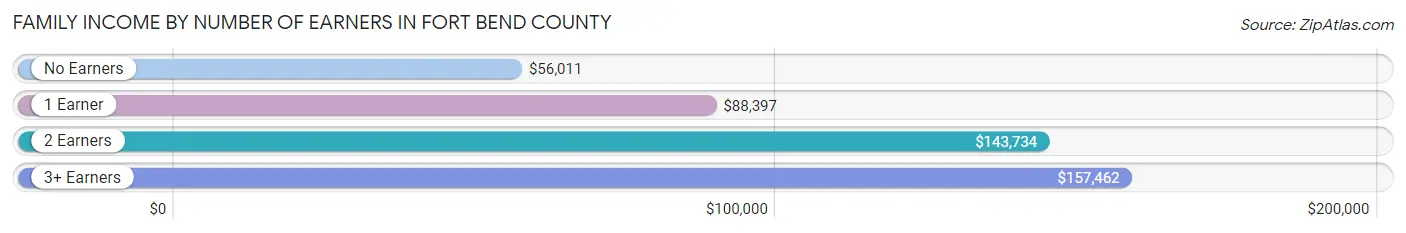
| Number of Earners | # Families | Median Income |
| No Earners | 19,892 (9.0%) | $56,011 |
| 1 Earner | 69,829 (31.6%) | $88,397 |
| 2 Earners | 99,925 (45.2%) | $143,734 |
| 3+ Earners | 31,227 (14.1%) | $157,462 |
| Total | 220,873 (100.0%) | $122,578 |
Household Income in Fort Bend County
Household Income Brackets in Fort Bend County
With 55,378 households falling in the category, the $100,000 to $149,999 income range is the most frequent in Fort Bend County, accounting for 20.5% of all households. In contrast, only 3,782 households (1.4%) fall into the $10,000 to $14,999 income bracket, making it the least populous group.

| Income Bracket | # Households | % Households |
| Less than $10,000 | 8,374 | 3.1% |
| $10,000 to $14,999 | 3,782 | 1.4% |
| $15,000 to $24,999 | 9,995 | 3.7% |
| $25,000 to $34,999 | 11,616 | 4.3% |
| $35,000 to $49,999 | 20,530 | 7.6% |
| $50,000 to $74,999 | 35,118 | 13.0% |
| $75,000 to $99,999 | 32,957 | 12.2% |
| $100,000 to $149,999 | 55,378 | 20.5% |
| $150,000 to $199,999 | 38,900 | 14.4% |
| $200,000+ | 53,217 | 19.7% |
Household Income by Householder Age in Fort Bend County
The median household income in Fort Bend County is $109,987, with the highest median household income of $126,704 found in the 45 to 64 years age bracket for the primary householder. A total of 112,403 households (41.6%) fall into this category. Meanwhile, the 15 to 24 years age bracket for the primary householder has the lowest median household income of $52,423, with 5,706 households (2.1%) in this group.
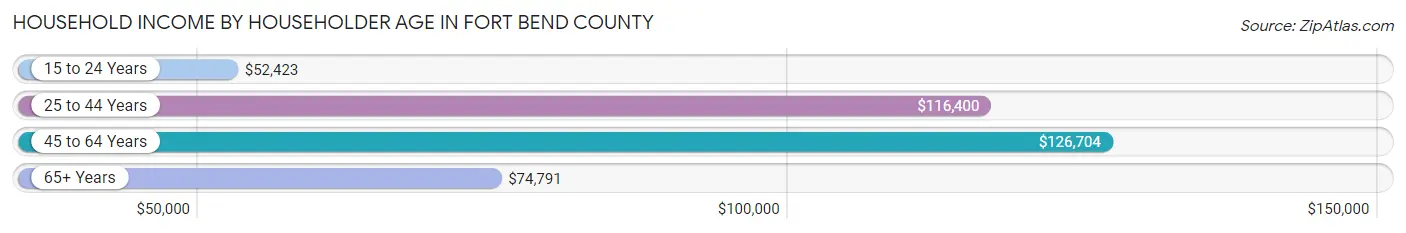
| Income Bracket | # Households | Median Income |
| 15 to 24 Years | 5,706 (2.1%) | $52,423 |
| 25 to 44 Years | 100,712 (37.3%) | $116,400 |
| 45 to 64 Years | 112,403 (41.6%) | $126,704 |
| 65+ Years | 51,315 (19.0%) | $74,791 |
| Total | 270,136 (100.0%) | $109,987 |
Poverty in Fort Bend County
Income Below Poverty by Sex and Age in Fort Bend County
With 6.4% poverty level for males and 7.5% for females among the residents of Fort Bend County, under 5 year old males and 75 year old and over females are the most vulnerable to poverty, with 2,713 males (10.3%) and 2,334 females (12.8%) in their respective age groups living below the poverty level.
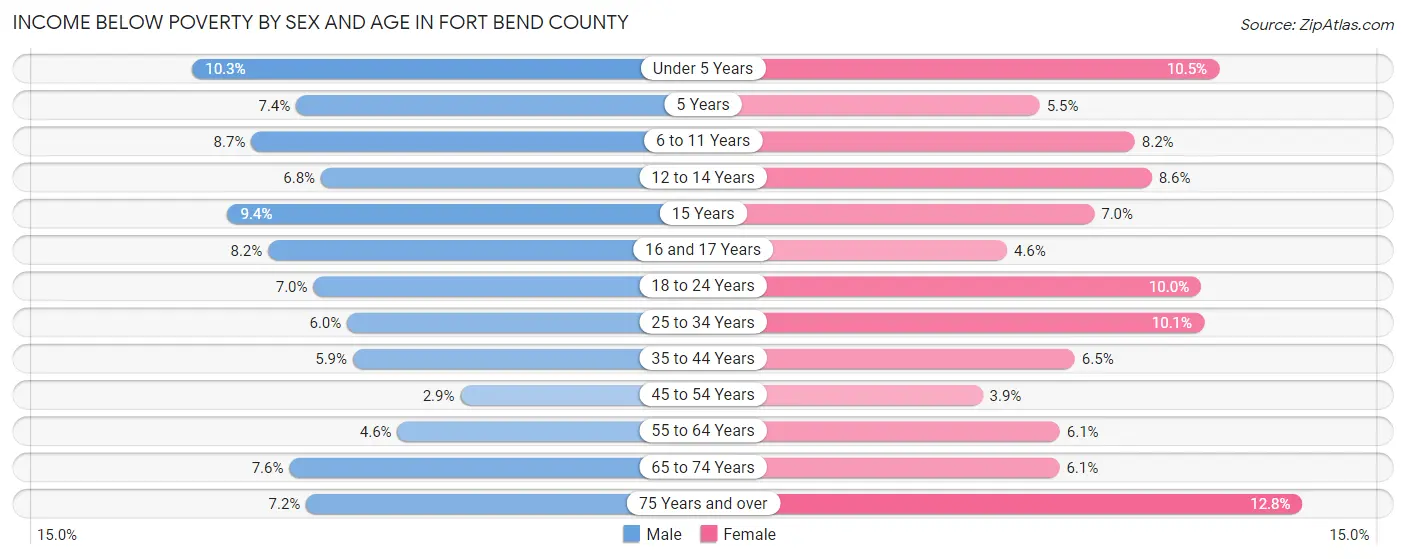
| Age Bracket | Male | Female |
| Under 5 Years | 2,713 (10.3%) | 2,686 (10.5%) |
| 5 Years | 503 (7.4%) | 336 (5.5%) |
| 6 to 11 Years | 3,278 (8.7%) | 3,136 (8.2%) |
| 12 to 14 Years | 1,517 (6.8%) | 1,611 (8.6%) |
| 15 Years | 659 (9.3%) | 528 (7.0%) |
| 16 and 17 Years | 1,136 (8.2%) | 566 (4.6%) |
| 18 to 24 Years | 2,528 (7.0%) | 3,506 (10.0%) |
| 25 to 34 Years | 2,764 (6.0%) | 5,052 (10.1%) |
| 35 to 44 Years | 3,616 (5.9%) | 4,292 (6.5%) |
| 45 to 54 Years | 1,655 (2.9%) | 2,300 (3.9%) |
| 55 to 64 Years | 2,145 (4.6%) | 2,930 (6.1%) |
| 65 to 74 Years | 2,334 (7.6%) | 2,061 (6.1%) |
| 75 Years and over | 1,002 (7.2%) | 2,334 (12.8%) |
| Total | 25,850 (6.4%) | 31,338 (7.5%) |
Income Above Poverty by Sex and Age in Fort Bend County
According to the poverty statistics in Fort Bend County, males aged 45 to 54 years and females aged 45 to 54 years are the age groups that are most secure financially, with 97.1% of males and 96.1% of females in these age groups living above the poverty line.

| Age Bracket | Male | Female |
| Under 5 Years | 23,538 (89.7%) | 22,901 (89.5%) |
| 5 Years | 6,256 (92.6%) | 5,761 (94.5%) |
| 6 to 11 Years | 34,426 (91.3%) | 35,308 (91.8%) |
| 12 to 14 Years | 20,957 (93.2%) | 17,048 (91.4%) |
| 15 Years | 6,386 (90.6%) | 6,987 (93.0%) |
| 16 and 17 Years | 12,692 (91.8%) | 11,747 (95.4%) |
| 18 to 24 Years | 33,793 (93.0%) | 31,546 (90.0%) |
| 25 to 34 Years | 43,136 (94.0%) | 45,086 (89.9%) |
| 35 to 44 Years | 58,099 (94.1%) | 61,860 (93.5%) |
| 45 to 54 Years | 56,029 (97.1%) | 56,376 (96.1%) |
| 55 to 64 Years | 44,242 (95.4%) | 45,302 (93.9%) |
| 65 to 74 Years | 28,243 (92.4%) | 31,932 (93.9%) |
| 75 Years and over | 12,994 (92.8%) | 15,871 (87.2%) |
| Total | 380,791 (93.6%) | 387,725 (92.5%) |
Income Below Poverty Among Married-Couple Families in Fort Bend County
The poverty statistics for married-couple families in Fort Bend County show that 3.7% or 6,551 of the total 177,562 families live below the poverty line. Families with 5 or more children have the highest poverty rate of 11.4%, comprising of 71 families. On the other hand, families with no children have the lowest poverty rate of 3.4%, which includes 2,743 families.
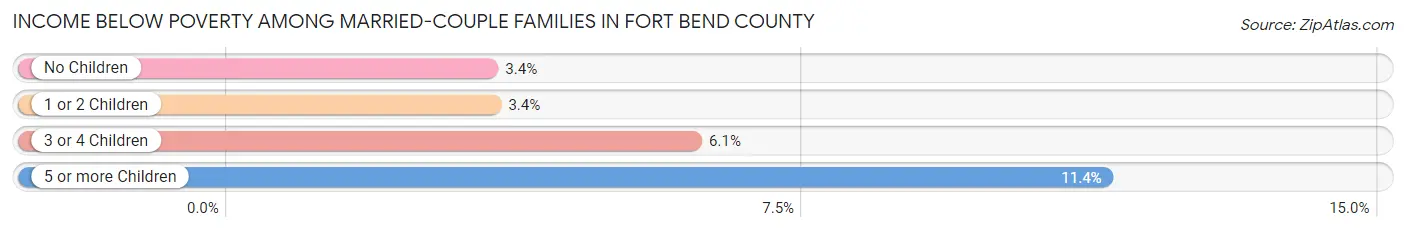
| Children | Above Poverty | Below Poverty |
| No Children | 78,018 (96.6%) | 2,743 (3.4%) |
| 1 or 2 Children | 76,991 (96.6%) | 2,740 (3.4%) |
| 3 or 4 Children | 15,452 (93.9%) | 997 (6.1%) |
| 5 or more Children | 550 (88.6%) | 71 (11.4%) |
| Total | 171,011 (96.3%) | 6,551 (3.7%) |
Income Below Poverty Among Single-Parent Households in Fort Bend County
According to the poverty data in Fort Bend County, 8.8% or 1,042 single-father households and 15.4% or 4,852 single-mother households are living below the poverty line. Among single-father households, those with 5 or more children have the highest poverty rate, with 48 households (36.6%) experiencing poverty. Likewise, among single-mother households, those with 5 or more children have the highest poverty rate, with 199 households (88.0%) falling below the poverty line.

| Children | Single Father | Single Mother |
| No Children | 646 (11.1%) | 889 (7.5%) |
| 1 or 2 Children | 156 (3.3%) | 2,192 (14.0%) |
| 3 or 4 Children | 192 (18.1%) | 1,572 (42.2%) |
| 5 or more Children | 48 (36.6%) | 199 (88.0%) |
| Total | 1,042 (8.8%) | 4,852 (15.4%) |
Income Below Poverty Among Married-Couple vs Single-Parent Households in Fort Bend County
The poverty data for Fort Bend County shows that 6,551 of the married-couple family households (3.7%) and 5,894 of the single-parent households (13.6%) are living below the poverty level. Within the married-couple family households, those with 5 or more children have the highest poverty rate, with 71 households (11.4%) falling below the poverty line. Among the single-parent households, those with 5 or more children have the highest poverty rate, with 247 household (69.2%) living below poverty.
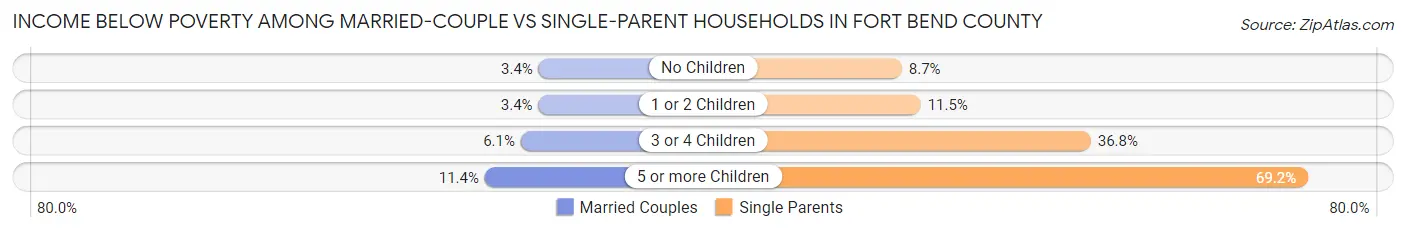
| Children | Married-Couple Families | Single-Parent Households |
| No Children | 2,743 (3.4%) | 1,535 (8.7%) |
| 1 or 2 Children | 2,740 (3.4%) | 2,348 (11.5%) |
| 3 or 4 Children | 997 (6.1%) | 1,764 (36.8%) |
| 5 or more Children | 71 (11.4%) | 247 (69.2%) |
| Total | 6,551 (3.7%) | 5,894 (13.6%) |
Employment Characteristics in Fort Bend County
Employment by Class of Employer in Fort Bend County
Among the 393,884 employed individuals in Fort Bend County, private company employees (274,832 | 69.8%), local government employees (30,177 | 7.7%), and self-employed (not incorporated) (25,752 | 6.5%) make up the most common classes of employment.
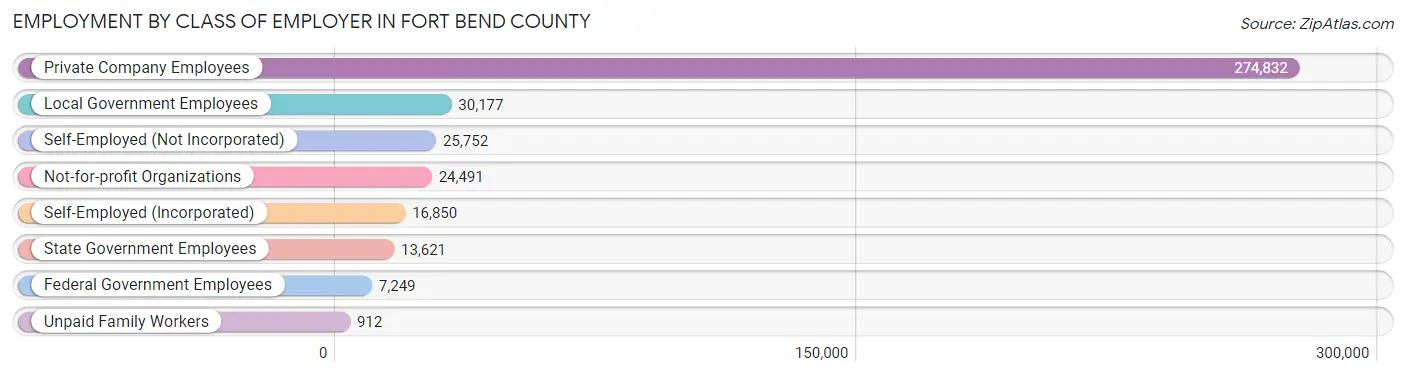
| Employer Class | # Employees | % Employees |
| Private Company Employees | 274,832 | 69.8% |
| Self-Employed (Incorporated) | 16,850 | 4.3% |
| Self-Employed (Not Incorporated) | 25,752 | 6.5% |
| Not-for-profit Organizations | 24,491 | 6.2% |
| Local Government Employees | 30,177 | 7.7% |
| State Government Employees | 13,621 | 3.5% |
| Federal Government Employees | 7,249 | 1.8% |
| Unpaid Family Workers | 912 | 0.2% |
| Total | 393,884 | 100.0% |
Employment Status by Age in Fort Bend County
According to the labor force statistics for Fort Bend County, out of the total population over 16 years of age (633,897), 66.9% or 424,077 individuals are in the labor force, with 5.2% or 22,052 of them unemployed. The age group with the highest labor force participation rate is 35 to 44 years, with 83.9% or 108,010 individuals in the labor force. Within the labor force, the 16 to 19 years age range has the highest percentage of unemployed individuals, with 12.0% or 1,653 of them being unemployed.

| Age Bracket | In Labor Force | Unemployed |
| 16 to 19 Years | 13,771 (28.4%) | 1,653 (12.0%) |
| 20 to 24 Years | 35,747 (72.4%) | 4,218 (11.8%) |
| 25 to 29 Years | 36,897 (81.7%) | 2,878 (7.8%) |
| 30 to 34 Years | 42,149 (81.5%) | 1,897 (4.5%) |
| 35 to 44 Years | 108,010 (83.9%) | 4,104 (3.8%) |
| 45 to 54 Years | 98,405 (83.9%) | 3,149 (3.2%) |
| 55 to 59 Years | 39,160 (78.8%) | 1,841 (4.7%) |
| 60 to 64 Years | 28,624 (62.8%) | 1,317 (4.6%) |
| 65 to 74 Years | 18,683 (28.7%) | 934 (5.0%) |
| 75 Years and over | 2,555 (7.8%) | 82 (3.2%) |
| Total | 424,077 (66.9%) | 22,052 (5.2%) |
Employment Status by Educational Attainment in Fort Bend County
According to labor force statistics for Fort Bend County, 80.6% of individuals (353,171) out of the total population between 25 and 64 years of age (438,178) are in the labor force, with 4.3% or 15,186 of them being unemployed. The group with the highest labor force participation rate are those with the educational attainment of bachelor's degree or higher, with 85.4% or 189,700 individuals in the labor force. Within the labor force, individuals with high school diploma education have the highest percentage of unemployment, with 6.0% or 3,441 of them being unemployed.

| Educational Attainment | In Labor Force | Unemployed |
| Less than High School | 20,588 (64.9%) | 1,586 (5.0%) |
| High School Diploma | 57,351 (75.8%) | 4,540 (6.0%) |
| College / Associate Degree | 85,736 (78.9%) | 4,021 (3.7%) |
| Bachelor's Degree or higher | 189,700 (85.4%) | 8,885 (4.0%) |
| Total | 353,171 (80.6%) | 18,842 (4.3%) |
Employment Occupations by Sex in Fort Bend County
Management, Business, Science and Arts Occupations
The most common Management, Business, Science and Arts occupations in Fort Bend County are Management (51,810 | 12.9%), Community & Social Service (45,322 | 11.3%), Computers, Engineering & Science (43,086 | 10.7%), Business & Financial (33,004 | 8.2%), and Health Diagnosing & Treating (32,722 | 8.2%).

Management, Business, Science and Arts Occupations by Sex
Within the Management, Business, Science and Arts occupations in Fort Bend County, the most male-oriented occupations are Architecture & Engineering (85.2%), Computers, Engineering & Science (79.5%), and Computers & Mathematics (77.4%), while the most female-oriented occupations are Education Instruction & Library (75.9%), Health Technologists (75.1%), and Health Diagnosing & Treating (72.1%).

| Occupation | Male | Female |
| Management | 31,911 (61.6%) | 19,899 (38.4%) |
| Business & Financial | 15,873 (48.1%) | 17,131 (51.9%) |
| Computers, Engineering & Science | 34,236 (79.5%) | 8,850 (20.5%) |
| Computers & Mathematics | 14,422 (77.4%) | 4,212 (22.6%) |
| Architecture & Engineering | 16,646 (85.2%) | 2,902 (14.8%) |
| Life, Physical & Social Science | 3,168 (64.6%) | 1,736 (35.4%) |
| Community & Social Service | 14,481 (32.0%) | 30,841 (68.0%) |
| Education, Arts & Media | 1,855 (31.5%) | 4,029 (68.5%) |
| Legal Services & Support | 1,960 (45.8%) | 2,319 (54.2%) |
| Education Instruction & Library | 6,759 (24.1%) | 21,281 (75.9%) |
| Arts, Media & Entertainment | 3,907 (54.9%) | 3,212 (45.1%) |
| Health Diagnosing & Treating | 9,125 (27.9%) | 23,597 (72.1%) |
| Health Technologists | 6,238 (24.9%) | 18,815 (75.1%) |
| Total (Category) | 105,626 (51.3%) | 100,318 (48.7%) |
| Total (Overall) | 215,959 (53.8%) | 185,718 (46.2%) |
Services Occupations
The most common Services occupations in Fort Bend County are Food Preparation & Serving (15,354 | 3.8%), Healthcare Support (10,083 | 2.5%), Personal Care & Service (9,456 | 2.4%), Cleaning & Maintenance (7,839 | 1.9%), and Security & Protection (7,629 | 1.9%).

Services Occupations by Sex
Within the Services occupations in Fort Bend County, the most male-oriented occupations are Law Enforcement (81.5%), Security & Protection (75.4%), and Firefighting & Prevention (69.1%), while the most female-oriented occupations are Healthcare Support (88.2%), Personal Care & Service (76.7%), and Food Preparation & Serving (52.2%).

| Occupation | Male | Female |
| Healthcare Support | 1,185 (11.7%) | 8,898 (88.2%) |
| Security & Protection | 5,756 (75.4%) | 1,873 (24.5%) |
| Firefighting & Prevention | 2,559 (69.1%) | 1,145 (30.9%) |
| Law Enforcement | 3,197 (81.5%) | 728 (18.5%) |
| Food Preparation & Serving | 7,333 (47.8%) | 8,021 (52.2%) |
| Cleaning & Maintenance | 4,342 (55.4%) | 3,497 (44.6%) |
| Personal Care & Service | 2,204 (23.3%) | 7,252 (76.7%) |
| Total (Category) | 20,820 (41.3%) | 29,541 (58.7%) |
| Total (Overall) | 215,959 (53.8%) | 185,718 (46.2%) |
Sales and Office Occupations
The most common Sales and Office occupations in Fort Bend County are Sales & Related (43,734 | 10.9%), and Office & Administration (39,854 | 9.9%).

Sales and Office Occupations by Sex
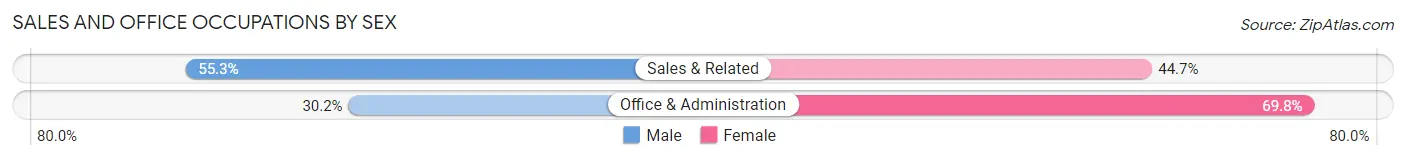
| Occupation | Male | Female |
| Sales & Related | 24,173 (55.3%) | 19,561 (44.7%) |
| Office & Administration | 12,026 (30.2%) | 27,828 (69.8%) |
| Total (Category) | 36,199 (43.3%) | 47,389 (56.7%) |
| Total (Overall) | 215,959 (53.8%) | 185,718 (46.2%) |
Natural Resources, Construction and Maintenance Occupations
The most common Natural Resources, Construction and Maintenance occupations in Fort Bend County are Construction & Extraction (13,506 | 3.4%), Installation, Maintenance & Repair (10,419 | 2.6%), and Farming, Fishing & Forestry (743 | 0.2%).
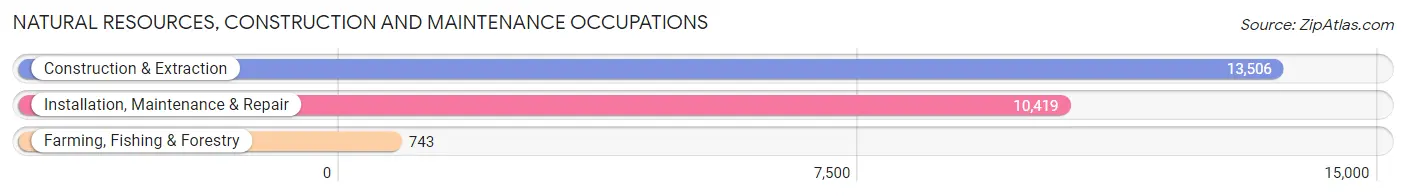
Natural Resources, Construction and Maintenance Occupations by Sex

| Occupation | Male | Female |
| Farming, Fishing & Forestry | 657 (88.4%) | 86 (11.6%) |
| Construction & Extraction | 13,184 (97.6%) | 322 (2.4%) |
| Installation, Maintenance & Repair | 9,812 (94.2%) | 607 (5.8%) |
| Total (Category) | 23,653 (95.9%) | 1,015 (4.1%) |
| Total (Overall) | 215,959 (53.8%) | 185,718 (46.2%) |
Production, Transportation and Moving Occupations
The most common Production, Transportation and Moving occupations in Fort Bend County are Transportation (14,065 | 3.5%), Production (13,587 | 3.4%), and Material Moving (9,464 | 2.4%).
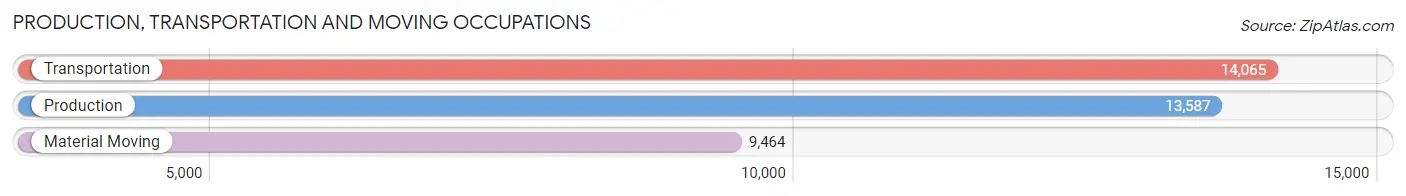
Production, Transportation and Moving Occupations by Sex

| Occupation | Male | Female |
| Production | 10,440 (76.8%) | 3,147 (23.2%) |
| Transportation | 12,585 (89.5%) | 1,480 (10.5%) |
| Material Moving | 6,636 (70.1%) | 2,828 (29.9%) |
| Total (Category) | 29,661 (79.9%) | 7,455 (20.1%) |
| Total (Overall) | 215,959 (53.8%) | 185,718 (46.2%) |
Employment Industries by Sex in Fort Bend County
Employment Industries in Fort Bend County
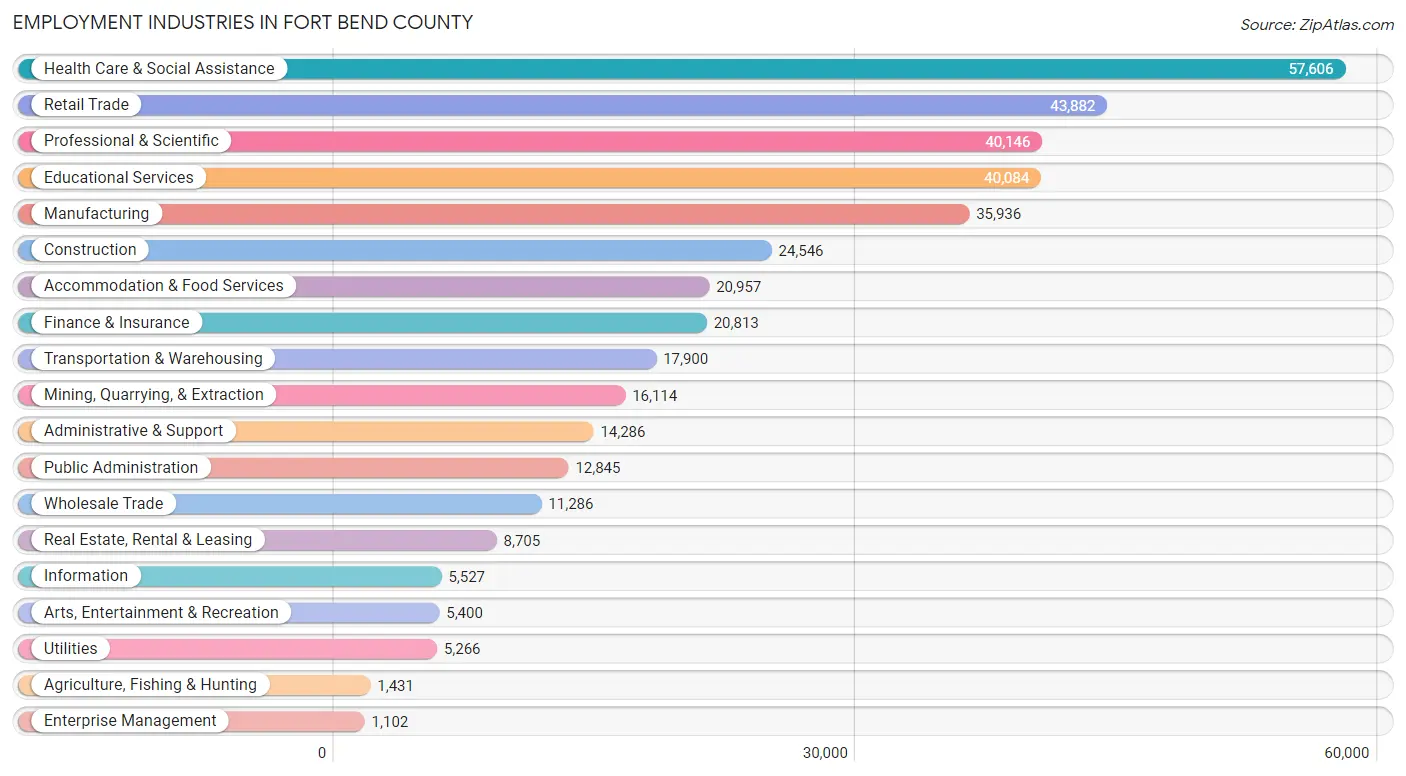
The major employment industries in Fort Bend County include Health Care & Social Assistance (57,606 | 14.3%), Retail Trade (43,882 | 10.9%), Professional & Scientific (40,146 | 10.0%), Educational Services (40,084 | 10.0%), and Manufacturing (35,936 | 8.9%).
Employment Industries by Sex in Fort Bend County
The Fort Bend County industries that see more men than women are Construction (84.7%), Agriculture, Fishing & Hunting (82.4%), and Utilities (78.9%), whereas the industries that tend to have a higher number of women are Educational Services (74.6%), Health Care & Social Assistance (74.5%), and Real Estate, Rental & Leasing (54.3%).

| Industry | Male | Female |
| Agriculture, Fishing & Hunting | 1,179 (82.4%) | 252 (17.6%) |
| Mining, Quarrying, & Extraction | 12,659 (78.6%) | 3,455 (21.4%) |
| Construction | 20,798 (84.7%) | 3,748 (15.3%) |
| Manufacturing | 26,651 (74.2%) | 9,285 (25.8%) |
| Wholesale Trade | 7,679 (68.0%) | 3,607 (32.0%) |
| Retail Trade | 24,327 (55.4%) | 19,555 (44.6%) |
| Transportation & Warehousing | 13,504 (75.4%) | 4,396 (24.6%) |
| Utilities | 4,154 (78.9%) | 1,112 (21.1%) |
| Information | 3,699 (66.9%) | 1,828 (33.1%) |
| Finance & Insurance | 9,750 (46.9%) | 11,063 (53.1%) |
| Real Estate, Rental & Leasing | 3,976 (45.7%) | 4,729 (54.3%) |
| Professional & Scientific | 24,569 (61.2%) | 15,577 (38.8%) |
| Enterprise Management | 757 (68.7%) | 345 (31.3%) |
| Administrative & Support | 8,840 (61.9%) | 5,446 (38.1%) |
| Educational Services | 10,190 (25.4%) | 29,894 (74.6%) |
| Health Care & Social Assistance | 14,713 (25.5%) | 42,893 (74.5%) |
| Arts, Entertainment & Recreation | 3,186 (59.0%) | 2,214 (41.0%) |
| Accommodation & Food Services | 10,720 (51.1%) | 10,237 (48.8%) |
| Public Administration | 6,478 (50.4%) | 6,367 (49.6%) |
| Total | 215,959 (53.8%) | 185,718 (46.2%) |
Education in Fort Bend County
School Enrollment in Fort Bend County
The most common levels of schooling among the 243,493 students in Fort Bend County are high school (55,221 | 22.7%), middle school (54,164 | 22.2%), and elementary school (48,232 | 19.8%).

| School Level | # Students | % Students |
| Nursery / Preschool | 15,965 | 6.6% |
| Kindergarten | 12,396 | 5.1% |
| Elementary School | 48,232 | 19.8% |
| Middle School | 54,164 | 22.2% |
| High School | 55,221 | 22.7% |
| College / Undergraduate | 46,717 | 19.2% |
| Graduate / Professional | 10,798 | 4.4% |
| Total | 243,493 | 100.0% |
School Enrollment by Age by Funding Source in Fort Bend County
Out of a total of 243,493 students who are enrolled in schools in Fort Bend County, 31,167 (12.8%) attend a private institution, while the remaining 212,326 (87.2%) are enrolled in public schools. The age group of 3 to 4 year olds has the highest likelihood of being enrolled in private schools, with 6,587 (55.5% in the age bracket) enrolled. Conversely, the age group of 10 to 14 year olds has the lowest likelihood of being enrolled in a private school, with 64,598 (95.2% in the age bracket) attending a public institution.

| Age Bracket | Public School | Private School |
| 3 to 4 Year Olds | 5,270 (44.5%) | 6,587 (55.5%) |
| 5 to 9 Year Old | 51,626 (87.7%) | 7,236 (12.3%) |
| 10 to 14 Year Olds | 64,598 (95.2%) | 3,226 (4.8%) |
| 15 to 17 Year Olds | 36,549 (91.8%) | 3,277 (8.2%) |
| 18 to 19 Year Olds | 16,389 (93.3%) | 1,177 (6.7%) |
| 20 to 24 Year Olds | 20,294 (83.6%) | 3,969 (16.4%) |
| 25 to 34 Year Olds | 8,217 (82.8%) | 1,712 (17.2%) |
| 35 Years and over | 9,467 (70.8%) | 3,899 (29.2%) |
| Total | 212,326 (87.2%) | 31,167 (12.8%) |
Educational Attainment by Field of Study in Fort Bend County
Business (62,804 | 22.9%), engineering (46,786 | 17.1%), science & technology (29,579 | 10.8%), education (21,431 | 7.8%), and computers & mathematics (15,380 | 5.6%) are the most common fields of study among 274,262 individuals in Fort Bend County who have obtained a bachelor's degree or higher.

| Field of Study | # Graduates | % Graduates |
| Computers & Mathematics | 15,380 | 5.6% |
| Bio, Nature & Agricultural | 15,108 | 5.5% |
| Physical & Health Sciences | 13,425 | 4.9% |
| Psychology | 10,225 | 3.7% |
| Social Sciences | 15,349 | 5.6% |
| Engineering | 46,786 | 17.1% |
| Multidisciplinary Studies | 2,358 | 0.9% |
| Science & Technology | 29,579 | 10.8% |
| Business | 62,804 | 22.9% |
| Education | 21,431 | 7.8% |
| Literature & Languages | 7,481 | 2.7% |
| Liberal Arts & History | 8,928 | 3.3% |
| Visual & Performing Arts | 4,893 | 1.8% |
| Communications | 8,996 | 3.3% |
| Arts & Humanities | 11,519 | 4.2% |
| Total | 274,262 | 100.0% |
Transportation & Commute in Fort Bend County
Vehicle Availability by Sex in Fort Bend County
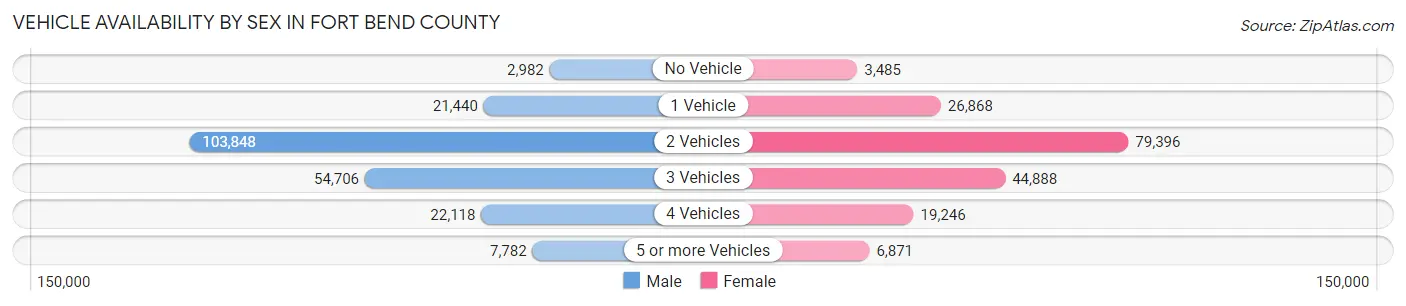
The most prevalent vehicle ownership categories in Fort Bend County are males with 2 vehicles (103,848, accounting for 48.8%) and females with 2 vehicles (79,396, making up 57.5%).
| Vehicles Available | Male | Female |
| No Vehicle | 2,982 (1.4%) | 3,485 (1.9%) |
| 1 Vehicle | 21,440 (10.1%) | 26,868 (14.9%) |
| 2 Vehicles | 103,848 (48.8%) | 79,396 (43.9%) |
| 3 Vehicles | 54,706 (25.7%) | 44,888 (24.8%) |
| 4 Vehicles | 22,118 (10.4%) | 19,246 (10.6%) |
| 5 or more Vehicles | 7,782 (3.7%) | 6,871 (3.8%) |
| Total | 212,876 (100.0%) | 180,754 (100.0%) |
Commute Time in Fort Bend County
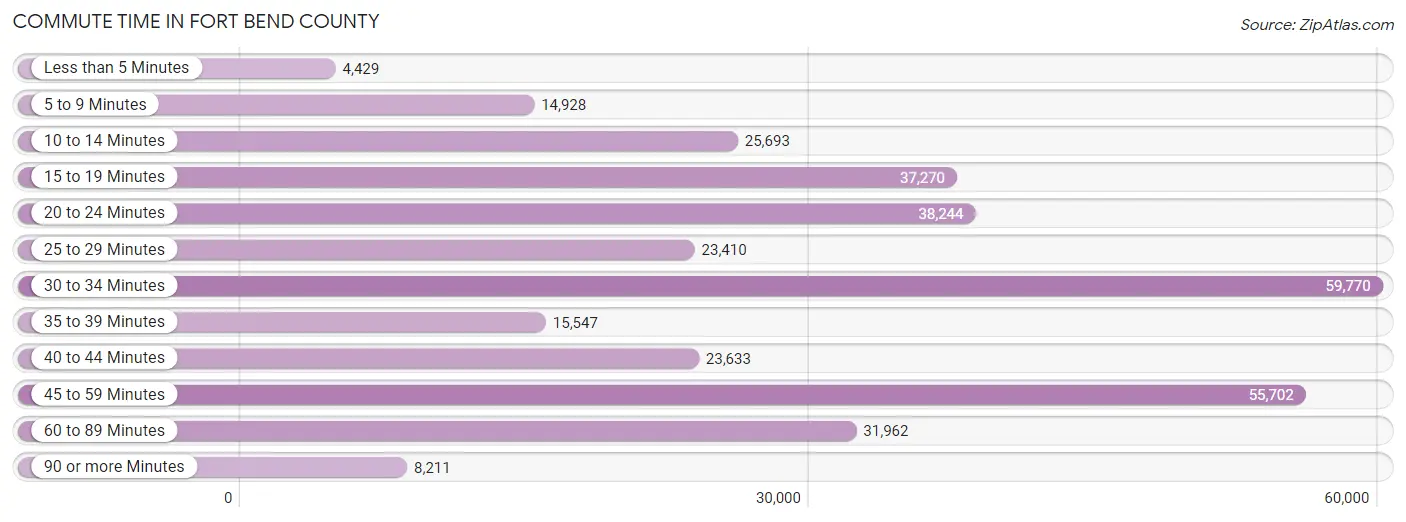
The most frequently occuring commute durations in Fort Bend County are 30 to 34 minutes (59,770 commuters, 17.6%), 45 to 59 minutes (55,702 commuters, 16.4%), and 20 to 24 minutes (38,244 commuters, 11.3%).
| Commute Time | # Commuters | % Commuters |
| Less than 5 Minutes | 4,429 | 1.3% |
| 5 to 9 Minutes | 14,928 | 4.4% |
| 10 to 14 Minutes | 25,693 | 7.6% |
| 15 to 19 Minutes | 37,270 | 11.0% |
| 20 to 24 Minutes | 38,244 | 11.3% |
| 25 to 29 Minutes | 23,410 | 6.9% |
| 30 to 34 Minutes | 59,770 | 17.6% |
| 35 to 39 Minutes | 15,547 | 4.6% |
| 40 to 44 Minutes | 23,633 | 7.0% |
| 45 to 59 Minutes | 55,702 | 16.4% |
| 60 to 89 Minutes | 31,962 | 9.4% |
| 90 or more Minutes | 8,211 | 2.4% |
Commute Time by Sex in Fort Bend County
The most common commute times in Fort Bend County are 30 to 34 minutes (33,130 commuters, 18.0%) for males and 30 to 34 minutes (26,640 commuters, 17.2%) for females.

| Commute Time | Male | Female |
| Less than 5 Minutes | 2,509 (1.4%) | 1,920 (1.2%) |
| 5 to 9 Minutes | 6,665 (3.6%) | 8,263 (5.3%) |
| 10 to 14 Minutes | 12,092 (6.6%) | 13,601 (8.8%) |
| 15 to 19 Minutes | 16,378 (8.9%) | 20,892 (13.5%) |
| 20 to 24 Minutes | 19,131 (10.4%) | 19,113 (12.4%) |
| 25 to 29 Minutes | 12,763 (6.9%) | 10,647 (6.9%) |
| 30 to 34 Minutes | 33,130 (18.0%) | 26,640 (17.2%) |
| 35 to 39 Minutes | 8,491 (4.6%) | 7,056 (4.6%) |
| 40 to 44 Minutes | 14,395 (7.8%) | 9,238 (6.0%) |
| 45 to 59 Minutes | 32,741 (17.8%) | 22,961 (14.9%) |
| 60 to 89 Minutes | 20,015 (10.8%) | 11,947 (7.7%) |
| 90 or more Minutes | 6,077 (3.3%) | 2,134 (1.4%) |
Time of Departure to Work by Sex in Fort Bend County
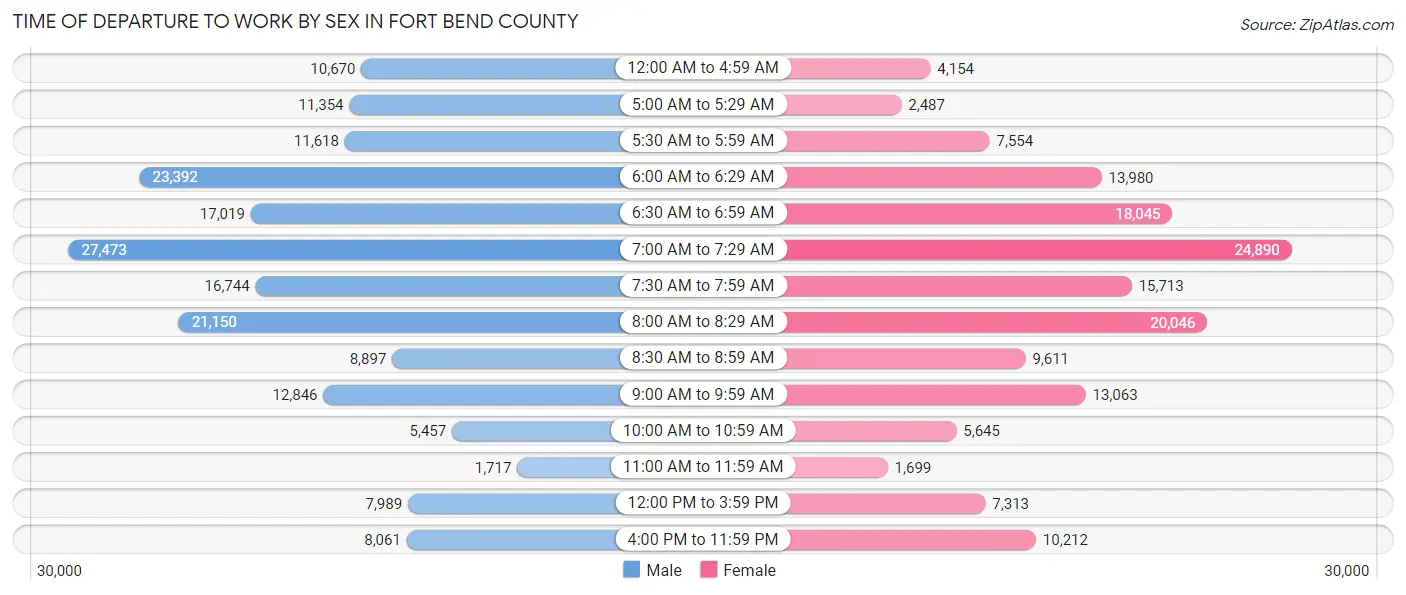
The most frequent times of departure to work in Fort Bend County are 7:00 AM to 7:29 AM (27,473, 14.9%) for males and 7:00 AM to 7:29 AM (24,890, 16.1%) for females.
| Time of Departure | Male | Female |
| 12:00 AM to 4:59 AM | 10,670 (5.8%) | 4,154 (2.7%) |
| 5:00 AM to 5:29 AM | 11,354 (6.2%) | 2,487 (1.6%) |
| 5:30 AM to 5:59 AM | 11,618 (6.3%) | 7,554 (4.9%) |
| 6:00 AM to 6:29 AM | 23,392 (12.7%) | 13,980 (9.0%) |
| 6:30 AM to 6:59 AM | 17,019 (9.2%) | 18,045 (11.7%) |
| 7:00 AM to 7:29 AM | 27,473 (14.9%) | 24,890 (16.1%) |
| 7:30 AM to 7:59 AM | 16,744 (9.1%) | 15,713 (10.2%) |
| 8:00 AM to 8:29 AM | 21,150 (11.5%) | 20,046 (13.0%) |
| 8:30 AM to 8:59 AM | 8,897 (4.8%) | 9,611 (6.2%) |
| 9:00 AM to 9:59 AM | 12,846 (7.0%) | 13,063 (8.5%) |
| 10:00 AM to 10:59 AM | 5,457 (3.0%) | 5,645 (3.7%) |
| 11:00 AM to 11:59 AM | 1,717 (0.9%) | 1,699 (1.1%) |
| 12:00 PM to 3:59 PM | 7,989 (4.3%) | 7,313 (4.7%) |
| 4:00 PM to 11:59 PM | 8,061 (4.4%) | 10,212 (6.6%) |
| Total | 184,387 (100.0%) | 154,412 (100.0%) |
Housing Occupancy in Fort Bend County
Occupancy by Ownership in Fort Bend County
Of the total 270,136 dwellings in Fort Bend County, owner-occupied units account for 209,960 (77.7%), while renter-occupied units make up 60,176 (22.3%).
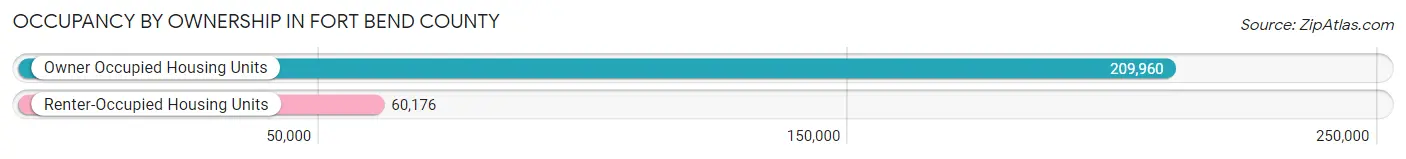
| Occupancy | # Housing Units | % Housing Units |
| Owner Occupied Housing Units | 209,960 | 77.7% |
| Renter-Occupied Housing Units | 60,176 | 22.3% |
| Total Occupied Housing Units | 270,136 | 100.0% |
Occupancy by Household Size in Fort Bend County

| Household Size | # Housing Units | % Housing Units |
| 1-Person Household | 40,889 | 15.1% |
| 2-Person Household | 77,164 | 28.6% |
| 3-Person Household | 52,524 | 19.4% |
| 4+ Person Household | 99,559 | 36.9% |
| Total Housing Units | 270,136 | 100.0% |
Occupancy by Ownership by Household Size in Fort Bend County

| Household Size | Owner-occupied | Renter-occupied |
| 1-Person Household | 24,633 (60.2%) | 16,256 (39.8%) |
| 2-Person Household | 62,977 (81.6%) | 14,187 (18.4%) |
| 3-Person Household | 40,776 (77.6%) | 11,748 (22.4%) |
| 4+ Person Household | 81,574 (81.9%) | 17,985 (18.1%) |
| Total Housing Units | 209,960 (77.7%) | 60,176 (22.3%) |
Occupancy by Educational Attainment in Fort Bend County

| Household Size | Owner-occupied | Renter-occupied |
| Less than High School | 12,257 (68.3%) | 5,692 (31.7%) |
| High School Diploma | 25,771 (64.9%) | 13,955 (35.1%) |
| College/Associate Degree | 48,968 (73.3%) | 17,883 (26.8%) |
| Bachelor's Degree or higher | 122,964 (84.5%) | 22,646 (15.5%) |
Occupancy by Age of Householder in Fort Bend County

| Age Bracket | # Households | % Households |
| Under 35 Years | 41,607 | 15.4% |
| 35 to 44 Years | 64,811 | 24.0% |
| 45 to 54 Years | 61,355 | 22.7% |
| 55 to 64 Years | 51,048 | 18.9% |
| 65 to 74 Years | 35,145 | 13.0% |
| 75 to 84 Years | 12,115 | 4.5% |
| 85 Years and Over | 4,055 | 1.5% |
| Total | 270,136 | 100.0% |
Housing Finances in Fort Bend County
Median Income by Occupancy in Fort Bend County

| Occupancy Type | # Households | Median Income |
| Owner-Occupied | 209,960 (77.7%) | $127,813 |
| Renter-Occupied | 60,176 (22.3%) | $64,519 |
| Average | 270,136 (100.0%) | $109,987 |
Occupancy by Householder Income Bracket in Fort Bend County

| Income Bracket | Owner-occupied | Renter-occupied |
| Less than $5,000 | 2,260 (1.1%) | 2,934 (4.9%) |
| $5,000 to $9,999 | 1,680 (0.8%) | 1,527 (2.5%) |
| $10,000 to $14,999 | 2,186 (1.0%) | 1,488 (2.5%) |
| $15,000 to $19,999 | 2,567 (1.2%) | 2,135 (3.5%) |
| $20,000 to $24,999 | 2,488 (1.2%) | 2,896 (4.8%) |
| $25,000 to $34,999 | 6,604 (3.2%) | 5,092 (8.5%) |
| $35,000 to $49,999 | 13,058 (6.2%) | 7,461 (12.4%) |
| $50,000 to $74,999 | 24,408 (11.6%) | 10,682 (17.7%) |
| $75,000 to $99,999 | 23,819 (11.3%) | 9,263 (15.4%) |
| $100,000 to $149,999 | 45,499 (21.7%) | 9,962 (16.6%) |
| $150,000 or more | 85,391 (40.7%) | 6,736 (11.2%) |
| Total | 209,960 (100.0%) | 60,176 (100.0%) |
Monthly Housing Cost Tiers in Fort Bend County
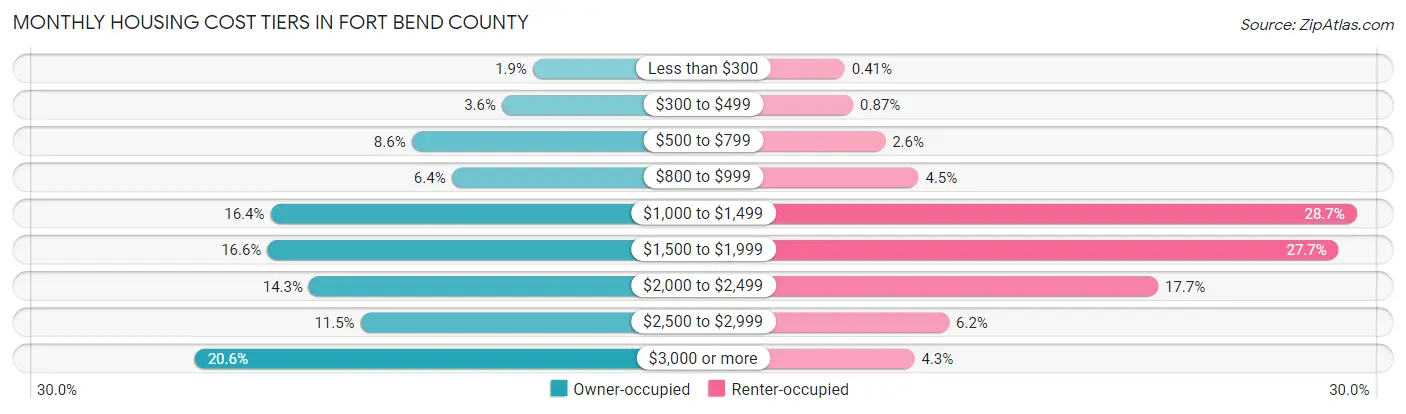
| Monthly Cost | Owner-occupied | Renter-occupied |
| Less than $300 | 4,055 (1.9%) | 246 (0.4%) |
| $300 to $499 | 7,633 (3.6%) | 522 (0.9%) |
| $500 to $799 | 18,128 (8.6%) | 1,588 (2.6%) |
| $800 to $999 | 13,480 (6.4%) | 2,693 (4.5%) |
| $1,000 to $1,499 | 34,494 (16.4%) | 17,253 (28.7%) |
| $1,500 to $1,999 | 34,858 (16.6%) | 16,658 (27.7%) |
| $2,000 to $2,499 | 30,016 (14.3%) | 10,657 (17.7%) |
| $2,500 to $2,999 | 24,035 (11.5%) | 3,710 (6.2%) |
| $3,000 or more | 43,261 (20.6%) | 2,565 (4.3%) |
| Total | 209,960 (100.0%) | 60,176 (100.0%) |
Physical Housing Characteristics in Fort Bend County
Housing Structures in Fort Bend County
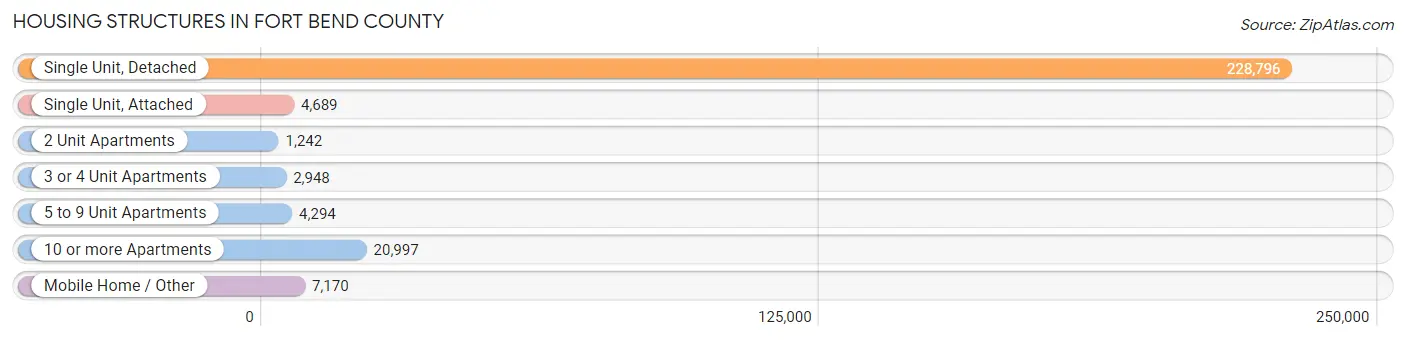
| Structure Type | # Housing Units | % Housing Units |
| Single Unit, Detached | 228,796 | 84.7% |
| Single Unit, Attached | 4,689 | 1.7% |
| 2 Unit Apartments | 1,242 | 0.5% |
| 3 or 4 Unit Apartments | 2,948 | 1.1% |
| 5 to 9 Unit Apartments | 4,294 | 1.6% |
| 10 or more Apartments | 20,997 | 7.8% |
| Mobile Home / Other | 7,170 | 2.6% |
| Total | 270,136 | 100.0% |
Housing Structures by Occupancy in Fort Bend County
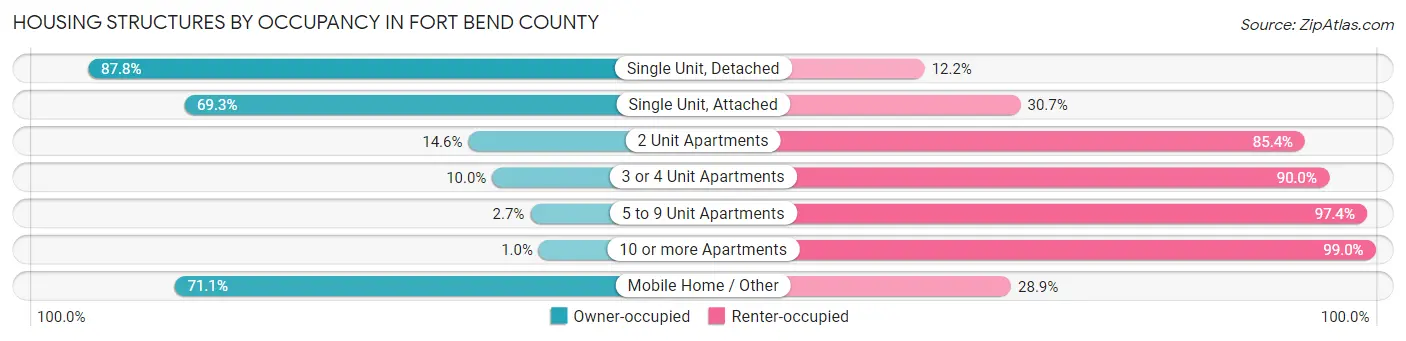
| Structure Type | Owner-occupied | Renter-occupied |
| Single Unit, Detached | 200,811 (87.8%) | 27,985 (12.2%) |
| Single Unit, Attached | 3,250 (69.3%) | 1,439 (30.7%) |
| 2 Unit Apartments | 181 (14.6%) | 1,061 (85.4%) |
| 3 or 4 Unit Apartments | 294 (10.0%) | 2,654 (90.0%) |
| 5 to 9 Unit Apartments | 114 (2.6%) | 4,180 (97.4%) |
| 10 or more Apartments | 210 (1.0%) | 20,787 (99.0%) |
| Mobile Home / Other | 5,100 (71.1%) | 2,070 (28.9%) |
| Total | 209,960 (77.7%) | 60,176 (22.3%) |
Housing Structures by Number of Rooms in Fort Bend County

| Number of Rooms | Owner-occupied | Renter-occupied |
| 1 Room | 903 (0.4%) | 2,791 (4.6%) |
| 2 or 3 Rooms | 1,936 (0.9%) | 12,510 (20.8%) |
| 4 or 5 Rooms | 35,854 (17.1%) | 22,853 (38.0%) |
| 6 or 7 Rooms | 74,417 (35.4%) | 15,109 (25.1%) |
| 8 or more Rooms | 96,850 (46.1%) | 6,913 (11.5%) |
| Total | 209,960 (100.0%) | 60,176 (100.0%) |
Housing Structure by Heating Type in Fort Bend County

| Heating Type | Owner-occupied | Renter-occupied |
| Utility Gas | 142,124 (67.7%) | 18,117 (30.1%) |
| Bottled, Tank, or LP Gas | 6,439 (3.1%) | 998 (1.7%) |
| Electricity | 59,755 (28.5%) | 40,225 (66.8%) |
| Fuel Oil or Kerosene | 181 (0.1%) | 86 (0.1%) |
| Coal or Coke | 115 (0.1%) | 0 (0.0%) |
| All other Fuels | 800 (0.4%) | 101 (0.2%) |
| No Fuel Used | 546 (0.3%) | 649 (1.1%) |
| Total | 209,960 (100.0%) | 60,176 (100.0%) |
Household Vehicle Usage in Fort Bend County

| Vehicles per Household | Owner-occupied | Renter-occupied |
| No Vehicle | 3,542 (1.7%) | 4,135 (6.9%) |
| 1 Vehicle | 34,041 (16.2%) | 24,726 (41.1%) |
| 2 Vehicles | 106,757 (50.8%) | 23,703 (39.4%) |
| 3 or more Vehicles | 65,620 (31.2%) | 7,612 (12.7%) |
| Total | 209,960 (100.0%) | 60,176 (100.0%) |
Real Estate & Mortgages in Fort Bend County
Real Estate and Mortgage Overview in Fort Bend County
| Characteristic | Without Mortgage | With Mortgage |
| Housing Units | 70,699 | 139,261 |
| Median Property Value | $309,000 | $338,500 |
| Median Household Income | $101,383 | $63,389 |
| Monthly Housing Costs | $925 | $42,549 |
| Real Estate Taxes | $5,872 | $4,361 |
Property Value by Mortgage Status in Fort Bend County

| Property Value | Without Mortgage | With Mortgage |
| Less than $50,000 | 3,817 (5.4%) | 2,098 (1.5%) |
| $50,000 to $99,999 | 2,821 (4.0%) | 1,581 (1.1%) |
| $100,000 to $299,999 | 27,404 (38.8%) | 52,983 (38.1%) |
| $300,000 to $499,999 | 24,004 (34.0%) | 57,262 (41.1%) |
| $500,000 to $749,999 | 8,791 (12.4%) | 18,441 (13.2%) |
| $750,000 to $999,999 | 2,332 (3.3%) | 3,867 (2.8%) |
| $1,000,000 or more | 1,530 (2.2%) | 3,029 (2.2%) |
| Total | 70,699 (100.0%) | 139,261 (100.0%) |
Household Income by Mortgage Status in Fort Bend County

| Household Income | Without Mortgage | With Mortgage |
| Less than $10,000 | 1,787 (2.5%) | 1,489 (1.1%) |
| $10,000 to $24,999 | 3,961 (5.6%) | 2,153 (1.5%) |
| $25,000 to $34,999 | 3,834 (5.4%) | 3,280 (2.4%) |
| $35,000 to $49,999 | 5,645 (8.0%) | 2,770 (2.0%) |
| $50,000 to $74,999 | 10,706 (15.1%) | 7,413 (5.3%) |
| $75,000 to $99,999 | 8,963 (12.7%) | 13,702 (9.8%) |
| $100,000 to $149,999 | 13,801 (19.5%) | 14,856 (10.7%) |
| $150,000 or more | 22,002 (31.1%) | 31,698 (22.8%) |
| Total | 70,699 (100.0%) | 139,261 (100.0%) |
Property Value to Household Income Ratio in Fort Bend County
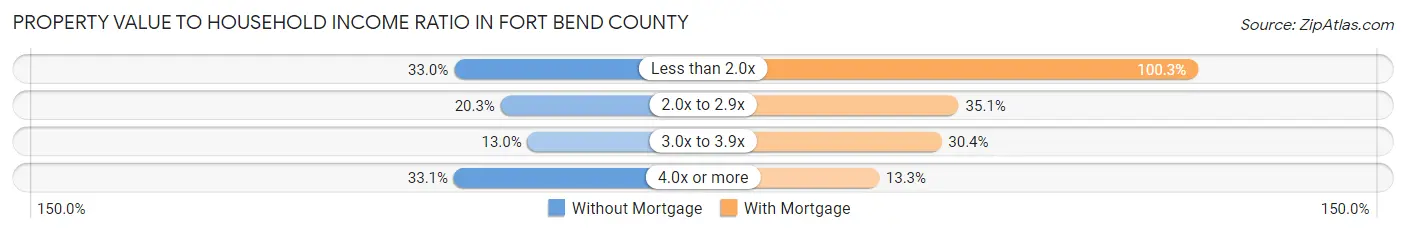
| Value-to-Income Ratio | Without Mortgage | With Mortgage |
| Less than 2.0x | 23,335 (33.0%) | 139,634 (100.3%) |
| 2.0x to 2.9x | 14,350 (20.3%) | 48,844 (35.1%) |
| 3.0x to 3.9x | 9,182 (13.0%) | 42,277 (30.4%) |
| 4.0x or more | 23,373 (33.1%) | 18,566 (13.3%) |
| Total | 70,699 (100.0%) | 139,261 (100.0%) |
Real Estate Taxes by Mortgage Status in Fort Bend County
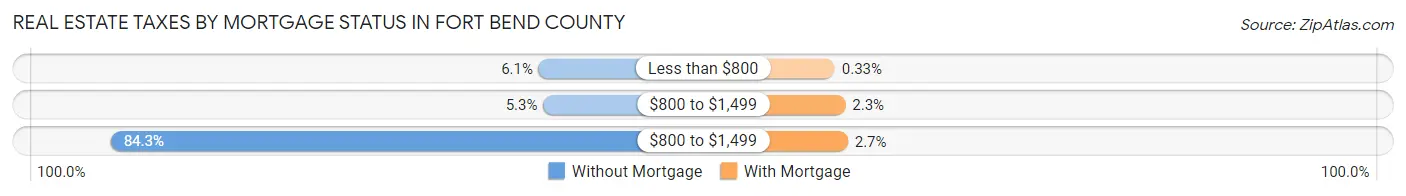
| Property Taxes | Without Mortgage | With Mortgage |
| Less than $800 | 4,299 (6.1%) | 457 (0.3%) |
| $800 to $1,499 | 3,722 (5.3%) | 3,135 (2.2%) |
| $800 to $1,499 | 59,577 (84.3%) | 3,747 (2.7%) |
| Total | 70,699 (100.0%) | 139,261 (100.0%) |
Health & Disability in Fort Bend County
Health Insurance Coverage by Age in Fort Bend County
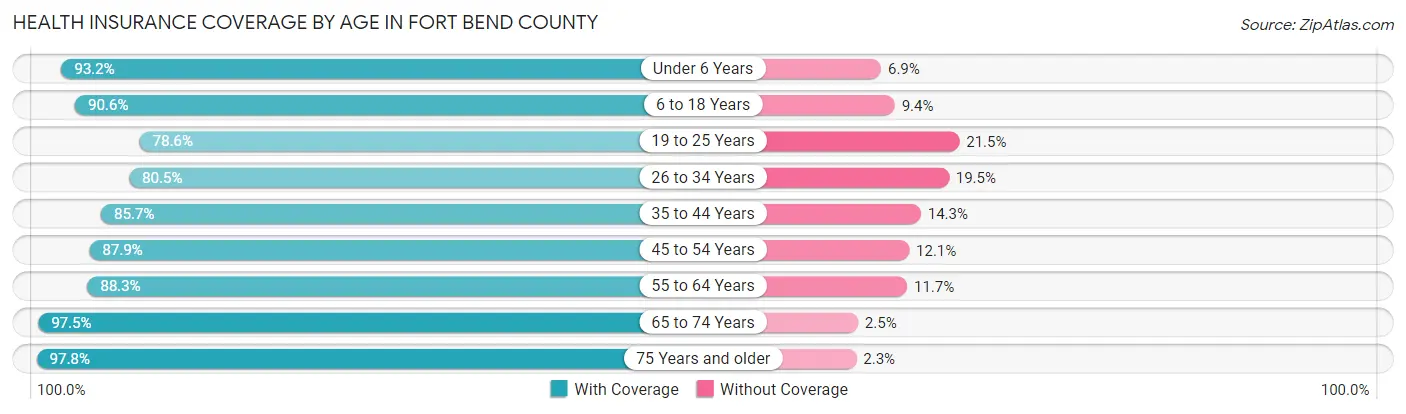
| Age Bracket | With Coverage | Without Coverage |
| Under 6 Years | 61,154 (93.1%) | 4,495 (6.9%) |
| 6 to 18 Years | 155,008 (90.6%) | 16,093 (9.4%) |
| 19 to 25 Years | 54,316 (78.5%) | 14,834 (21.4%) |
| 26 to 34 Years | 69,342 (80.5%) | 16,790 (19.5%) |
| 35 to 44 Years | 109,609 (85.7%) | 18,241 (14.3%) |
| 45 to 54 Years | 102,276 (87.9%) | 14,063 (12.1%) |
| 55 to 64 Years | 83,547 (88.3%) | 11,072 (11.7%) |
| 65 to 74 Years | 62,933 (97.5%) | 1,637 (2.5%) |
| 75 Years and older | 31,476 (97.8%) | 725 (2.2%) |
| Total | 729,661 (88.2%) | 97,950 (11.8%) |
Health Insurance Coverage by Citizenship Status in Fort Bend County

| Citizenship Status | With Coverage | Without Coverage |
| Native Born | 61,154 (93.1%) | 4,495 (6.9%) |
| Foreign Born, Citizen | 155,008 (90.6%) | 16,093 (9.4%) |
| Foreign Born, not a Citizen | 54,316 (78.5%) | 14,834 (21.4%) |
Health Insurance Coverage by Household Income in Fort Bend County

| Household Income | With Coverage | Without Coverage |
| Under $25,000 | 37,079 (76.2%) | 11,568 (23.8%) |
| $25,000 to $49,999 | 59,111 (74.7%) | 19,978 (25.3%) |
| $50,000 to $74,999 | 84,917 (84.8%) | 15,262 (15.2%) |
| $75,000 to $99,999 | 80,092 (83.6%) | 15,771 (16.5%) |
| $100,000 and over | 467,473 (93.0%) | 35,227 (7.0%) |
Public vs Private Health Insurance Coverage by Age in Fort Bend County

| Age Bracket | Public Insurance | Private Insurance |
| Under 6 | 17,462 (26.6%) | 46,168 (70.3%) |
| 6 to 18 Years | 35,009 (20.5%) | 125,153 (73.2%) |
| 19 to 25 Years | 5,714 (8.3%) | 49,836 (72.1%) |
| 25 to 34 Years | 6,503 (7.5%) | 65,161 (75.6%) |
| 35 to 44 Years | 6,516 (5.1%) | 106,082 (83.0%) |
| 45 to 54 Years | 7,269 (6.2%) | 98,433 (84.6%) |
| 55 to 64 Years | 7,795 (8.2%) | 78,153 (82.6%) |
| 65 to 74 Years | 57,259 (88.7%) | 32,576 (50.4%) |
| 75 Years and over | 30,591 (95.0%) | 14,905 (46.3%) |
| Total | 174,118 (21.0%) | 616,467 (74.5%) |
Disability Status by Sex by Age in Fort Bend County
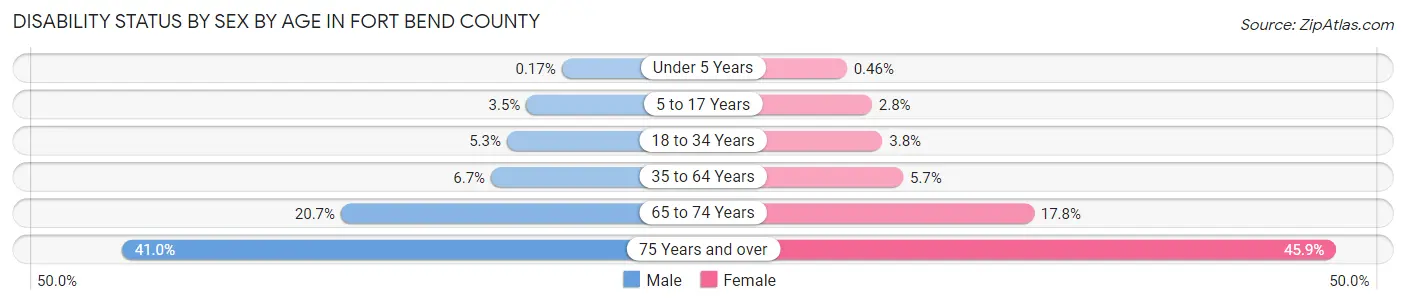
| Age Bracket | Male | Female |
| Under 5 Years | 45 (0.2%) | 120 (0.5%) |
| 5 to 17 Years | 3,047 (3.5%) | 2,336 (2.8%) |
| 18 to 34 Years | 4,307 (5.2%) | 3,199 (3.8%) |
| 35 to 64 Years | 11,136 (6.7%) | 9,823 (5.7%) |
| 65 to 74 Years | 6,315 (20.6%) | 6,057 (17.8%) |
| 75 Years and over | 5,735 (41.0%) | 8,352 (45.9%) |
Disability Class by Sex by Age in Fort Bend County
Disability Class: Hearing Difficulty

| Age Bracket | Male | Female |
| Under 5 Years | 45 (0.2%) | 120 (0.5%) |
| 5 to 17 Years | 253 (0.3%) | 319 (0.4%) |
| 18 to 34 Years | 407 (0.5%) | 577 (0.7%) |
| 35 to 64 Years | 3,406 (2.1%) | 1,862 (1.1%) |
| 65 to 74 Years | 2,561 (8.4%) | 1,229 (3.6%) |
| 75 Years and over | 3,201 (22.9%) | 2,183 (12.0%) |
Disability Class: Vision Difficulty
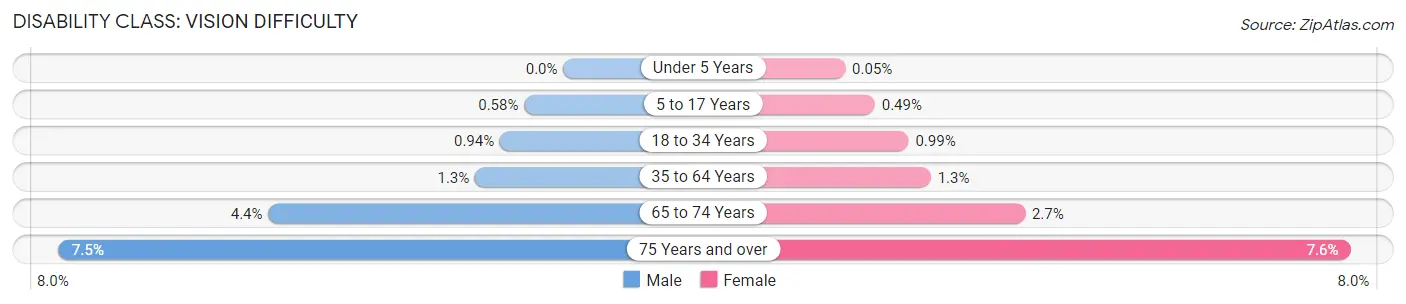
| Age Bracket | Male | Female |
| Under 5 Years | 0 (0.0%) | 14 (0.1%) |
| 5 to 17 Years | 509 (0.6%) | 409 (0.5%) |
| 18 to 34 Years | 772 (0.9%) | 841 (1.0%) |
| 35 to 64 Years | 2,164 (1.3%) | 2,282 (1.3%) |
| 65 to 74 Years | 1,339 (4.4%) | 926 (2.7%) |
| 75 Years and over | 1,048 (7.5%) | 1,375 (7.5%) |
Disability Class: Cognitive Difficulty

| Age Bracket | Male | Female |
| 5 to 17 Years | 2,469 (2.8%) | 1,688 (2.0%) |
| 18 to 34 Years | 3,024 (3.7%) | 1,865 (2.2%) |
| 35 to 64 Years | 3,472 (2.1%) | 3,117 (1.8%) |
| 65 to 74 Years | 1,143 (3.7%) | 1,214 (3.6%) |
| 75 Years and over | 1,468 (10.5%) | 3,150 (17.3%) |
Disability Class: Ambulatory Difficulty
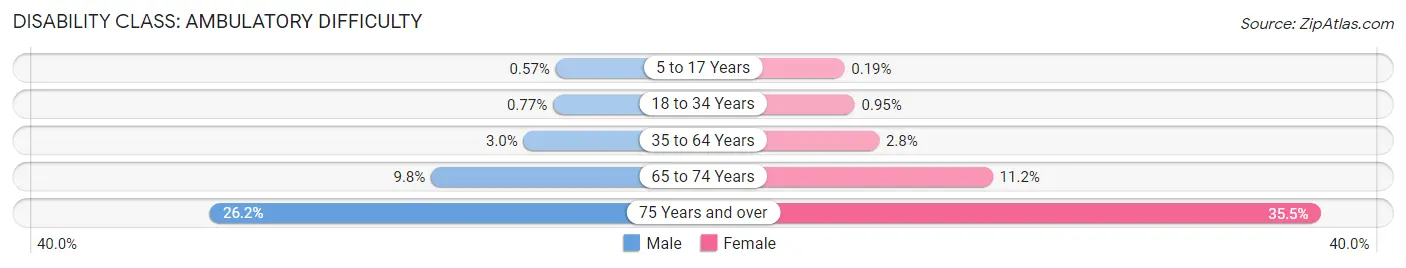
| Age Bracket | Male | Female |
| 5 to 17 Years | 506 (0.6%) | 162 (0.2%) |
| 18 to 34 Years | 635 (0.8%) | 807 (0.9%) |
| 35 to 64 Years | 4,886 (2.9%) | 4,776 (2.8%) |
| 65 to 74 Years | 3,003 (9.8%) | 3,807 (11.2%) |
| 75 Years and over | 3,671 (26.2%) | 6,468 (35.5%) |
Disability Class: Self-Care Difficulty
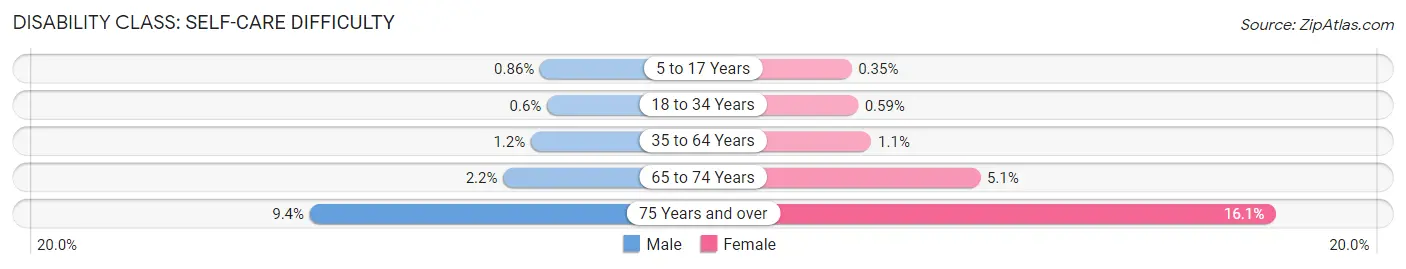
| Age Bracket | Male | Female |
| 5 to 17 Years | 760 (0.9%) | 292 (0.4%) |
| 18 to 34 Years | 490 (0.6%) | 504 (0.6%) |
| 35 to 64 Years | 1,994 (1.2%) | 1,882 (1.1%) |
| 65 to 74 Years | 683 (2.2%) | 1,743 (5.1%) |
| 75 Years and over | 1,317 (9.4%) | 2,934 (16.1%) |
Technology Access in Fort Bend County
Computing Device Access in Fort Bend County

| Device Type | # Households | % Households |
| Desktop or Laptop | 245,263 | 90.8% |
| Smartphone | 254,259 | 94.1% |
| Tablet | 206,452 | 76.4% |
| No Computing Device | 7,099 | 2.6% |
| Total | 270,136 | 100.0% |
Internet Access in Fort Bend County
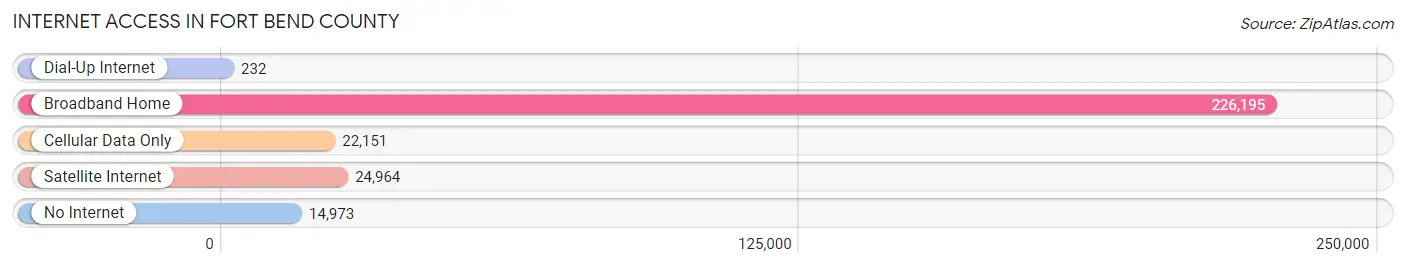
| Internet Type | # Households | % Households |
| Dial-Up Internet | 232 | 0.1% |
| Broadband Home | 226,195 | 83.7% |
| Cellular Data Only | 22,151 | 8.2% |
| Satellite Internet | 24,964 | 9.2% |
| No Internet | 14,973 | 5.5% |
| Total | 270,136 | 100.0% |
Fort Bend County Summary
Introduction
Fort Bend County is located in the southeastern part of Texas, and is part of the Houston-The Woodlands-Sugar Land metropolitan area. It is the tenth most populous county in Texas, with a population of 716,087 as of the 2019 census. The county seat is Richmond, and the largest city is Sugar Land. The county was founded in 1837 and named after a bend in the Brazos River.
History
Fort Bend County was established in 1837, and was named after a bend in the Brazos River. The area was originally inhabited by the Karankawa and Atakapan Native American tribes. The first settlers in the area were Stephen F. Austin and his colonists, who arrived in 1822. The county was part of Austin's colony, and was part of the Mexican state of Coahuila y Tejas. After the Texas Revolution, the area became part of the Republic of Texas.
In 1837, Fort Bend County was established, and the county seat was located in Richmond. The county was named after a bend in the Brazos River, and the county was divided into four districts. The county was home to several plantations, and the economy was based on cotton and sugar production.
In the late 19th century, the county experienced a population boom due to the arrival of immigrants from Germany, Austria, and Czechoslovakia. The county also experienced an economic boom due to the discovery of oil in the area.
Geography
Fort Bend County is located in the southeastern part of Texas, and is part of the Houston-The Woodlands-Sugar Land metropolitan area. It is bordered by Harris County to the north, Brazoria County to the east, and Matagorda County to the south. The county covers an area of 885 square miles, and is the tenth most populous county in Texas.
The terrain of the county is mostly flat, with some rolling hills in the western part of the county. The county is drained by the Brazos River, which forms the northern boundary of the county. The county also contains several lakes, including Oyster Creek Lake, Lake Houston, and Lake Austin.
Economy
Fort Bend County has a diverse economy, with a mix of industries including manufacturing, retail, healthcare, and education. The county is home to several major employers, including the University of Houston, the Houston Independent School District, and the Houston Community College System.
The county is also home to several major oil and gas companies, including Chevron, ExxonMobil, and Shell. The county is also home to several major manufacturing companies, including Dow Chemical, BASF, and LyondellBasell.
The county is also home to several major retail companies, including Walmart, Target, and Home Depot. The county is also home to several major healthcare companies, including Memorial Hermann Health System, Houston Methodist Hospital, and MD Anderson Cancer Center.
Demographics
As of the 2019 census, Fort Bend County had a population of 716,087. The population is racially and ethnically diverse, with the largest racial group being White (47.3%), followed by Hispanic or Latino (30.2%), Black or African American (17.2%), and Asian (4.3%).
The median household income in the county is $90,845, and the median home value is $269,400. The county has a poverty rate of 8.3%, and the unemployment rate is 3.7%.
Conclusion
Fort Bend County is located in the southeastern part of Texas, and is part of the Houston-The Woodlands-Sugar Land metropolitan area. It is the tenth most populous county in Texas, with a population of 716,087 as of the 2019 census. The county has a diverse economy, with a mix of industries including manufacturing, retail, healthcare, and education. The population is racially and ethnically diverse, with the largest racial group being White (47.3%), followed by Hispanic or Latino (30.2%), Black or African American (17.2%), and Asian (4.3%). The median household income in the county is $90,845, and the median home value is $269,400. The county has a poverty rate of 8.3%, and the unemployment rate is 3.7%.
Common Questions
What is the Total Population of Fort Bend County?
Total Population of Fort Bend County is 832,607.
What is the Total Male Population of Fort Bend County?
Total Male Population of Fort Bend County is 411,621.
What is the Total Female Population of Fort Bend County?
Total Female Population of Fort Bend County is 420,986.
What is the Ratio of Males per 100 Females in Fort Bend County?
There are 97.78 Males per 100 Females in Fort Bend County.
What is the Ratio of Females per 100 Males in Fort Bend County?
There are 102.28 Females per 100 Males in Fort Bend County.
What is the Median Population Age in Fort Bend County?
Median Population Age in Fort Bend County is 36.9 Years.
What is the Average Family Size in Fort Bend County
Average Family Size in Fort Bend County is 3.4 People.
What is the Average Household Size in Fort Bend County
Average Household Size in Fort Bend County is 3.1 People.
What is Per Capita Income in Fort Bend County?
Per Capita income in Fort Bend County is $45,172.
What is the Median Family Income in Fort Bend County?
Median Family Income in Fort Bend County is $122,578.
What is the Median Household income in Fort Bend County?
Median Household Income in Fort Bend County is $109,987.
What is Income or Wage Gap in Fort Bend County?
Income or Wage Gap in Fort Bend County is 36.8%.
Women in Fort Bend County earn 63.2 cents for every dollar earned by a man.
What is Family Income Deficit in Fort Bend County?
Family Income Deficit in Fort Bend County is $12,360.
Families that are below poverty line in Fort Bend County earn $12,360 less on average than the poverty threshold level.
What is Inequality or Gini Index in Fort Bend County?
Inequality or Gini Index in Fort Bend County is 0.42.
How Large is the Labor Force in Fort Bend County?
There are 424,077 People in the Labor Forcein in Fort Bend County.
What is the Percentage of People in the Labor Force in Fort Bend County?
66.9% of People are in the Labor Force in Fort Bend County.
What is the Unemployment Rate in Fort Bend County?
Unemployment Rate in Fort Bend County is 5.2%.