Bell County, TX
Bell County Map
Bell County Overview
372,821
TOTAL POPULATION
186,259
MALE POPULATION
186,562
FEMALE POPULATION
99.84
MALES / 100 FEMALES
100.16
FEMALES / 100 MALES
31.7
MEDIAN AGE
3.3
AVG FAMILY SIZE
2.7
AVG HOUSEHOLD SIZE
$31,822
PER CAPITA INCOME
$75,314
AVG FAMILY INCOME
$62,858
AVG HOUSEHOLD INCOME
29.8%
WAGE / INCOME GAP [ % ]
70.2¢/ $1
WAGE / INCOME GAP [ $ ]
$11,712
FAMILY INCOME DEFICIT
0.45
INEQUALITY / GINI INDEX
184,576
LABOR FORCE [ PEOPLE ]
65.7%
PERCENT IN LABOR FORCE
7.7%
UNEMPLOYMENT RATE
Bell County Area Codes
Race in Bell County
The most populous races in Bell County are White / Caucasian (203,119 | 54.5%), Hispanic or Latino (97,612 | 26.2%), and Black / African American (88,937 | 23.9%).

| Race | # Population | % Population |
| Asian | 10,801 | 2.9% |
| Black / African American | 88,937 | 23.9% |
| Hawaiian / Pacific | 2,566 | 0.7% |
| Hispanic or Latino | 97,612 | 26.2% |
| Native / Alaskan | 2,212 | 0.6% |
| White / Caucasian | 203,119 | 54.5% |
| Two or more Races | 44,666 | 12.0% |
| Some other Race | 20,520 | 5.5% |
| Total | 372,821 | 100.0% |
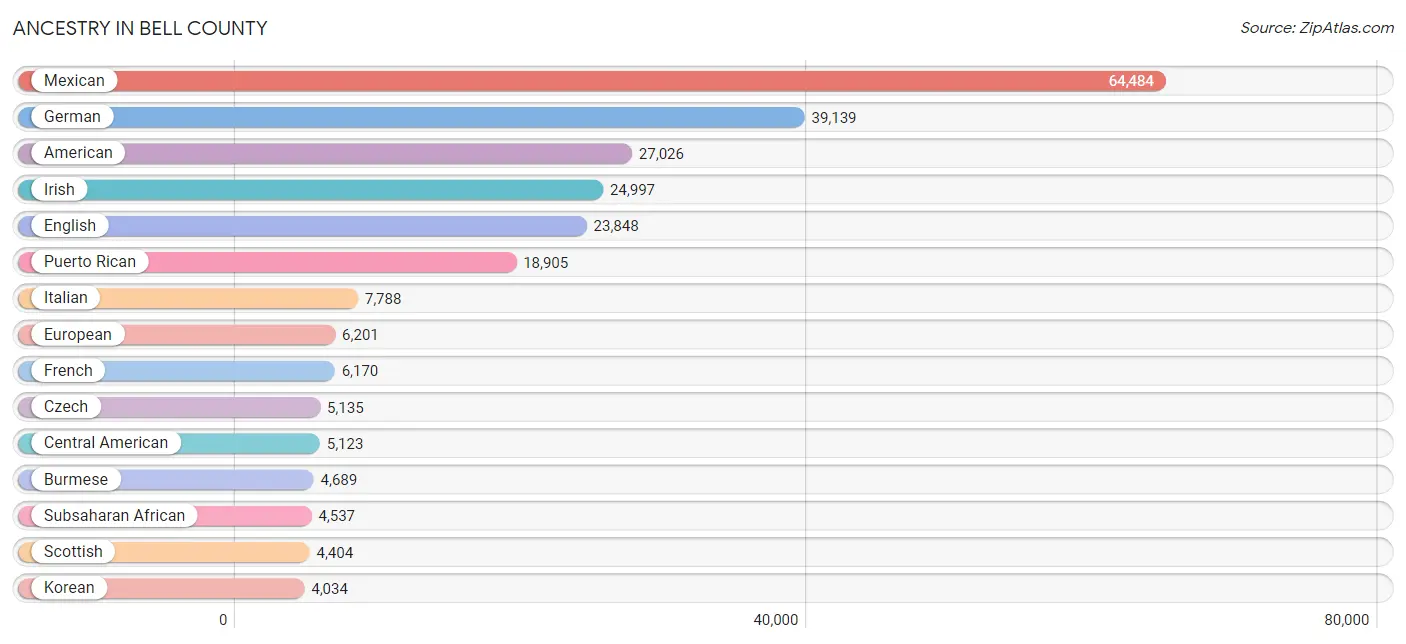
Ancestry in Bell County
The most populous ancestries reported in Bell County are Mexican (64,484 | 17.3%), German (39,139 | 10.5%), American (27,026 | 7.2%), Irish (24,997 | 6.7%), and English (23,848 | 6.4%), together accounting for 48.1% of all Bell County residents.
| Ancestry | # Population | % Population |
| African | 2,261 | 0.6% |
| Alaska Native | 29 | 0.0% |
| Albanian | 131 | 0.0% |
| Aleut | 44 | 0.0% |
| American | 27,026 | 7.2% |
| Apache | 195 | 0.1% |
| Arab | 1,958 | 0.5% |
| Argentinean | 259 | 0.1% |
| Armenian | 64 | 0.0% |
| Assyrian / Chaldean / Syriac | 42 | 0.0% |
| Australian | 147 | 0.0% |
| Austrian | 316 | 0.1% |
| Bahamian | 114 | 0.0% |
| Bangladeshi | 45 | 0.0% |
| Barbadian | 141 | 0.0% |
| Basque | 43 | 0.0% |
| Belgian | 68 | 0.0% |
| Belizean | 48 | 0.0% |
| Bermudan | 11 | 0.0% |
| Bhutanese | 1,665 | 0.4% |
| Blackfeet | 435 | 0.1% |
| Bolivian | 154 | 0.0% |
| Brazilian | 489 | 0.1% |
| British | 2,861 | 0.8% |
| British West Indian | 89 | 0.0% |
| Bulgarian | 13 | 0.0% |
| Burmese | 4,689 | 1.3% |
| Cajun | 37 | 0.0% |
| Canadian | 453 | 0.1% |
| Cape Verdean | 20 | 0.0% |
| Celtic | 26 | 0.0% |
| Central American | 5,123 | 1.4% |
| Central American Indian | 1,060 | 0.3% |
| Cherokee | 1,602 | 0.4% |
| Cheyenne | 6 | 0.0% |
| Chickasaw | 176 | 0.1% |
| Chilean | 24 | 0.0% |
| Chinese | 30 | 0.0% |
| Chippewa | 99 | 0.0% |
| Choctaw | 519 | 0.1% |
| Colombian | 757 | 0.2% |
| Comanche | 31 | 0.0% |
| Costa Rican | 39 | 0.0% |
| Creek | 67 | 0.0% |
| Croatian | 177 | 0.1% |
| Crow | 128 | 0.0% |
| Cuban | 660 | 0.2% |
| Cypriot | 5 | 0.0% |
| Czech | 5,135 | 1.4% |
| Czechoslovakian | 335 | 0.1% |
| Danish | 738 | 0.2% |
| Dominican | 1,865 | 0.5% |
| Dutch | 3,032 | 0.8% |
| Dutch West Indian | 70 | 0.0% |
| Eastern European | 238 | 0.1% |
| Ecuadorian | 145 | 0.0% |
| Egyptian | 94 | 0.0% |
| English | 23,848 | 6.4% |
| Estonian | 6 | 0.0% |
| Ethiopian | 12 | 0.0% |
| European | 6,201 | 1.7% |
| Filipino | 182 | 0.1% |
| Finnish | 198 | 0.1% |
| French | 6,170 | 1.7% |
| French Canadian | 548 | 0.2% |
| German | 39,139 | 10.5% |
| German Russian | 12 | 0.0% |
| Ghanaian | 414 | 0.1% |
| Greek | 522 | 0.1% |
| Guamanian / Chamorro | 1,359 | 0.4% |
| Guatemalan | 1,940 | 0.5% |
| Guyanese | 25 | 0.0% |
| Haitian | 329 | 0.1% |
| Honduran | 343 | 0.1% |
| Hopi | 5 | 0.0% |
| Houma | 8 | 0.0% |
| Hungarian | 609 | 0.2% |
| Indian (Asian) | 1,502 | 0.4% |
| Indonesian | 53 | 0.0% |
| Inupiat | 54 | 0.0% |
| Iranian | 72 | 0.0% |
| Iraqi | 70 | 0.0% |
| Irish | 24,997 | 6.7% |
| Iroquois | 74 | 0.0% |
| Israeli | 94 | 0.0% |
| Italian | 7,788 | 2.1% |
| Jamaican | 2,054 | 0.5% |
| Japanese | 389 | 0.1% |
| Jordanian | 252 | 0.1% |
| Kenyan | 93 | 0.0% |
| Korean | 4,034 | 1.1% |
| Laotian | 60 | 0.0% |
| Latvian | 44 | 0.0% |
| Lebanese | 549 | 0.2% |
| Liberian | 102 | 0.0% |
| Lithuanian | 56 | 0.0% |
| Lumbee | 14 | 0.0% |
| Malaysian | 214 | 0.1% |
| Marshallese | 53 | 0.0% |
| Mexican | 64,484 | 17.3% |
| Mexican American Indian | 1,090 | 0.3% |
| Moroccan | 17 | 0.0% |
| Native Hawaiian | 1,471 | 0.4% |
| Navajo | 266 | 0.1% |
| Nicaraguan | 254 | 0.1% |
| Nigerian | 1,083 | 0.3% |
| Northern European | 286 | 0.1% |
| Norwegian | 2,527 | 0.7% |
| Ottawa | 24 | 0.0% |
| Pakistani | 527 | 0.1% |
| Palestinian | 169 | 0.1% |
| Panamanian | 1,294 | 0.4% |
| Pennsylvania German | 3 | 0.0% |
| Peruvian | 539 | 0.1% |
| Polish | 3,656 | 1.0% |
| Portuguese | 1,017 | 0.3% |
| Potawatomi | 14 | 0.0% |
| Pueblo | 328 | 0.1% |
| Puerto Rican | 18,905 | 5.1% |
| Romanian | 96 | 0.0% |
| Russian | 1,161 | 0.3% |
| Salvadoran | 1,236 | 0.3% |
| Samoan | 780 | 0.2% |
| Scandinavian | 781 | 0.2% |
| Scotch-Irish | 2,556 | 0.7% |
| Scottish | 4,404 | 1.2% |
| Seminole | 17 | 0.0% |
| Senegalese | 14 | 0.0% |
| Serbian | 249 | 0.1% |
| Sierra Leonean | 24 | 0.0% |
| Sioux | 97 | 0.0% |
| Slavic | 27 | 0.0% |
| Slovak | 122 | 0.0% |
| Slovene | 79 | 0.0% |
| South African | 11 | 0.0% |
| South American | 1,998 | 0.5% |
| Soviet Union | 12 | 0.0% |
| Spaniard | 1,910 | 0.5% |
| Spanish | 473 | 0.1% |
| Spanish American | 278 | 0.1% |
| Spanish American Indian | 22 | 0.0% |
| Sri Lankan | 1,734 | 0.5% |
| Subsaharan African | 4,537 | 1.2% |
| Sudanese | 6 | 0.0% |
| Swedish | 1,338 | 0.4% |
| Swiss | 768 | 0.2% |
| Syrian | 135 | 0.0% |
| Thai | 1,666 | 0.4% |
| Tlingit-Haida | 23 | 0.0% |
| Tohono O'Odham | 13 | 0.0% |
| Tongan | 10 | 0.0% |
| Trinidadian and Tobagonian | 248 | 0.1% |
| Turkish | 177 | 0.1% |
| U.S. Virgin Islander | 88 | 0.0% |
| Ukrainian | 276 | 0.1% |
| Venezuelan | 113 | 0.0% |
| Vietnamese | 3 | 0.0% |
| Welsh | 1,540 | 0.4% |
| West Indian | 299 | 0.1% |
| Yugoslavian | 101 | 0.0% | View All 160 Rows |
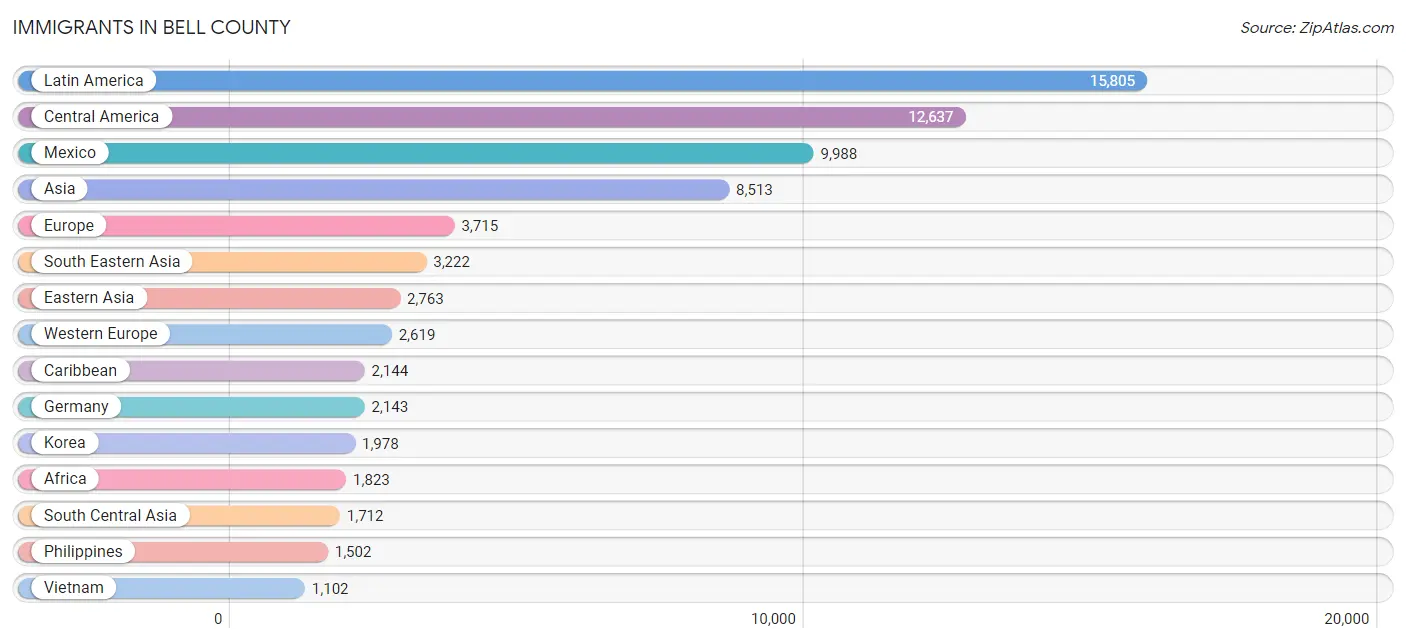
Immigrants in Bell County
The most numerous immigrant groups reported in Bell County came from Latin America (15,805 | 4.2%), Central America (12,637 | 3.4%), Mexico (9,988 | 2.7%), Asia (8,513 | 2.3%), and Europe (3,715 | 1.0%), together accounting for 13.6% of all Bell County residents.
| Immigration Origin | # Population | % Population |
| Africa | 1,823 | 0.5% |
| Albania | 34 | 0.0% |
| Argentina | 22 | 0.0% |
| Armenia | 5 | 0.0% |
| Asia | 8,513 | 2.3% |
| Australia | 22 | 0.0% |
| Austria | 3 | 0.0% |
| Bahamas | 74 | 0.0% |
| Bangladesh | 3 | 0.0% |
| Barbados | 10 | 0.0% |
| Belarus | 11 | 0.0% |
| Belgium | 18 | 0.0% |
| Belize | 67 | 0.0% |
| Bolivia | 31 | 0.0% |
| Bosnia and Herzegovina | 30 | 0.0% |
| Brazil | 266 | 0.1% |
| Cambodia | 161 | 0.0% |
| Cameroon | 6 | 0.0% |
| Canada | 200 | 0.1% |
| Caribbean | 2,144 | 0.6% |
| Central America | 12,637 | 3.4% |
| China | 576 | 0.2% |
| Colombia | 307 | 0.1% |
| Congo | 97 | 0.0% |
| Costa Rica | 19 | 0.0% |
| Cuba | 163 | 0.0% |
| Czechoslovakia | 76 | 0.0% |
| Denmark | 27 | 0.0% |
| Dominica | 1 | 0.0% |
| Dominican Republic | 534 | 0.1% |
| Eastern Africa | 412 | 0.1% |
| Eastern Asia | 2,763 | 0.7% |
| Eastern Europe | 562 | 0.2% |
| Ecuador | 103 | 0.0% |
| Egypt | 49 | 0.0% |
| El Salvador | 495 | 0.1% |
| England | 182 | 0.1% |
| Eritrea | 98 | 0.0% |
| Ethiopia | 54 | 0.0% |
| Europe | 3,715 | 1.0% |
| France | 141 | 0.0% |
| Germany | 2,143 | 0.6% |
| Ghana | 246 | 0.1% |
| Greece | 8 | 0.0% |
| Guatemala | 962 | 0.3% |
| Guyana | 25 | 0.0% |
| Haiti | 133 | 0.0% |
| Honduras | 169 | 0.1% |
| Hong Kong | 45 | 0.0% |
| Hungary | 49 | 0.0% |
| India | 925 | 0.3% |
| Indonesia | 11 | 0.0% |
| Iran | 36 | 0.0% |
| Iraq | 177 | 0.1% |
| Ireland | 13 | 0.0% |
| Italy | 19 | 0.0% |
| Jamaica | 841 | 0.2% |
| Japan | 209 | 0.1% |
| Jordan | 230 | 0.1% |
| Kenya | 177 | 0.1% |
| Korea | 1,978 | 0.5% |
| Kuwait | 22 | 0.0% |
| Laos | 61 | 0.0% |
| Latin America | 15,805 | 4.2% |
| Latvia | 13 | 0.0% |
| Lebanon | 4 | 0.0% |
| Liberia | 109 | 0.0% |
| Mexico | 9,988 | 2.7% |
| Micronesia | 311 | 0.1% |
| Middle Africa | 103 | 0.0% |
| Nepal | 646 | 0.2% |
| Netherlands | 314 | 0.1% |
| Nicaragua | 42 | 0.0% |
| Nigeria | 400 | 0.1% |
| Northern Africa | 142 | 0.0% |
| Northern Europe | 371 | 0.1% |
| Oceania | 491 | 0.1% |
| Pakistan | 102 | 0.0% |
| Panama | 895 | 0.2% |
| Peru | 186 | 0.1% |
| Philippines | 1,502 | 0.4% |
| Poland | 144 | 0.0% |
| Romania | 52 | 0.0% |
| Russia | 95 | 0.0% |
| Saudi Arabia | 211 | 0.1% |
| Scotland | 39 | 0.0% |
| Sierra Leone | 186 | 0.1% |
| South Africa | 51 | 0.0% |
| South America | 1,024 | 0.3% |
| South Central Asia | 1,712 | 0.5% |
| South Eastern Asia | 3,222 | 0.9% |
| Southern Europe | 118 | 0.0% |
| Spain | 91 | 0.0% |
| Syria | 118 | 0.0% |
| Taiwan | 248 | 0.1% |
| Thailand | 359 | 0.1% |
| Trinidad and Tobago | 260 | 0.1% |
| Turkey | 24 | 0.0% |
| Ukraine | 40 | 0.0% |
| Venezuela | 84 | 0.0% |
| Vietnam | 1,102 | 0.3% |
| Western Africa | 1,086 | 0.3% |
| Western Asia | 798 | 0.2% |
| Western Europe | 2,619 | 0.7% |
| Zimbabwe | 34 | 0.0% | View All 105 Rows |
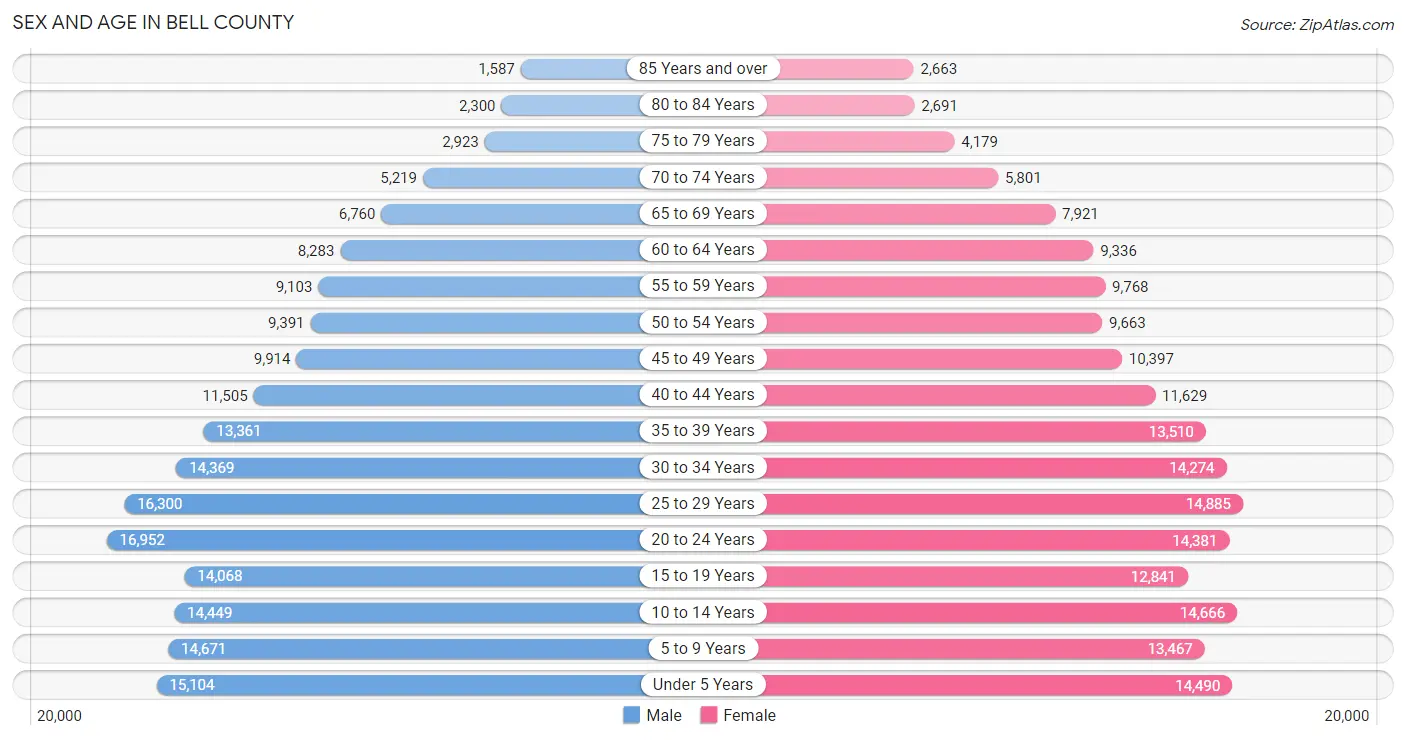
Sex and Age in Bell County
Sex and Age in Bell County
The most populous age groups in Bell County are 20 to 24 Years (16,952 | 9.1%) for men and 25 to 29 Years (14,885 | 8.0%) for women.
| Age Bracket | Male | Female |
| Under 5 Years | 15,104 (8.1%) | 14,490 (7.8%) |
| 5 to 9 Years | 14,671 (7.9%) | 13,467 (7.2%) |
| 10 to 14 Years | 14,449 (7.8%) | 14,666 (7.9%) |
| 15 to 19 Years | 14,068 (7.5%) | 12,841 (6.9%) |
| 20 to 24 Years | 16,952 (9.1%) | 14,381 (7.7%) |
| 25 to 29 Years | 16,300 (8.7%) | 14,885 (8.0%) |
| 30 to 34 Years | 14,369 (7.7%) | 14,274 (7.6%) |
| 35 to 39 Years | 13,361 (7.2%) | 13,510 (7.2%) |
| 40 to 44 Years | 11,505 (6.2%) | 11,629 (6.2%) |
| 45 to 49 Years | 9,914 (5.3%) | 10,397 (5.6%) |
| 50 to 54 Years | 9,391 (5.0%) | 9,663 (5.2%) |
| 55 to 59 Years | 9,103 (4.9%) | 9,768 (5.2%) |
| 60 to 64 Years | 8,283 (4.4%) | 9,336 (5.0%) |
| 65 to 69 Years | 6,760 (3.6%) | 7,921 (4.3%) |
| 70 to 74 Years | 5,219 (2.8%) | 5,801 (3.1%) |
| 75 to 79 Years | 2,923 (1.6%) | 4,179 (2.2%) |
| 80 to 84 Years | 2,300 (1.2%) | 2,691 (1.4%) |
| 85 Years and over | 1,587 (0.9%) | 2,663 (1.4%) |
| Total | 186,259 (100.0%) | 186,562 (100.0%) |
Families and Households in Bell County
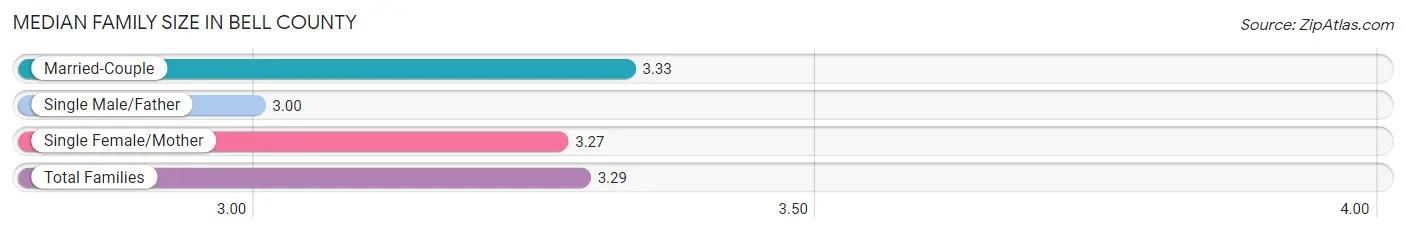
Median Family Size in Bell County
The median family size in Bell County is 3.29 persons per family, with married-couple families (63,087 | 69.3%) accounting for the largest median family size of 3.33 persons per family. On the other hand, single male/father families (6,485 | 7.1%) represent the smallest median family size with 3.00 persons per family.
| Family Type | # Families | Family Size |
| Married-Couple | 63,087 (69.3%) | 3.33 |
| Single Male/Father | 6,485 (7.1%) | 3.00 |
| Single Female/Mother | 21,409 (23.5%) | 3.27 |
| Total Families | 90,981 (100.0%) | 3.29 |
Median Household Size in Bell County
The median household size in Bell County is 2.69 persons per household, with single female/mother households (21,409 | 15.9%) accounting for the largest median household size of 3.46 persons per household. non-family households (43,514 | 32.4%) represent the smallest median household size with 1.25 persons per household.

| Household Type | # Households | Household Size |
| Married-Couple | 63,087 (46.9%) | 3.35 |
| Single Male/Father | 6,485 (4.8%) | 3.40 |
| Single Female/Mother | 21,409 (15.9%) | 3.46 |
| Non-family | 43,514 (32.4%) | 1.25 |
| Total Households | 134,495 (100.0%) | 2.69 |
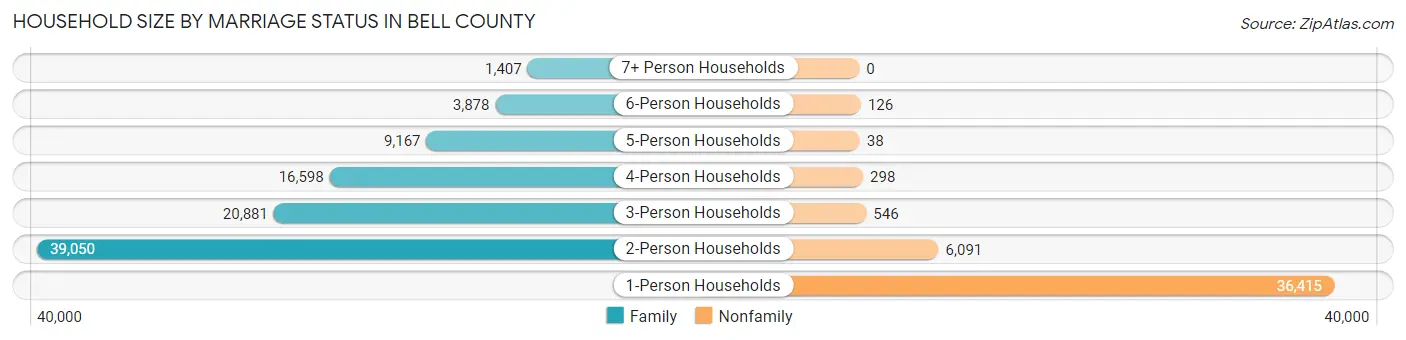
Household Size by Marriage Status in Bell County
Out of a total of 134,495 households in Bell County, 90,981 (67.6%) are family households, while 43,514 (32.4%) are nonfamily households. The most numerous type of family households are 2-person households, comprising 39,050, and the most common type of nonfamily households are 1-person households, comprising 36,415.
| Household Size | Family Households | Nonfamily Households |
| 1-Person Households | - | 36,415 (27.1%) |
| 2-Person Households | 39,050 (29.0%) | 6,091 (4.5%) |
| 3-Person Households | 20,881 (15.5%) | 546 (0.4%) |
| 4-Person Households | 16,598 (12.3%) | 298 (0.2%) |
| 5-Person Households | 9,167 (6.8%) | 38 (0.0%) |
| 6-Person Households | 3,878 (2.9%) | 126 (0.1%) |
| 7+ Person Households | 1,407 (1.1%) | 0 (0.0%) |
| Total | 90,981 (67.6%) | 43,514 (32.4%) |
Female Fertility in Bell County
Fertility by Age in Bell County
Average fertility rate in Bell County is 67.0 births per 1,000 women. Women in the age bracket of 20 to 34 years have the highest fertility rate with 111.0 births per 1,000 women. Women in the age bracket of 20 to 34 years acount for 77.3% of all women with births.

| Age Bracket | Women with Births | Births / 1,000 Women |
| 15 to 19 years | 160 (2.6%) | 12.0 |
| 20 to 34 years | 4,827 (77.3%) | 111.0 |
| 35 to 50 years | 1,256 (20.1%) | 34.0 |
| Total | 6,243 (100.0%) | 67.0 |
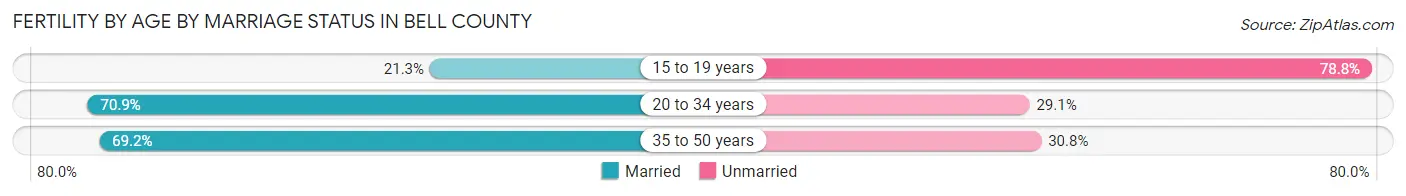
Fertility by Age by Marriage Status in Bell County
69.3% of women with births (6,243) in Bell County are married. The highest percentage of unmarried women with births falls into 15 to 19 years age bracket with 78.7% of them unmarried at the time of birth, while the lowest percentage of unmarried women with births belong to 20 to 34 years age bracket with 29.1% of them unmarried.
| Age Bracket | Married | Unmarried |
| 15 to 19 years | 34 (21.2%) | 126 (78.7%) |
| 20 to 34 years | 3,422 (70.9%) | 1,405 (29.1%) |
| 35 to 50 years | 869 (69.2%) | 387 (30.8%) |
| Total | 4,326 (69.3%) | 1,917 (30.7%) |
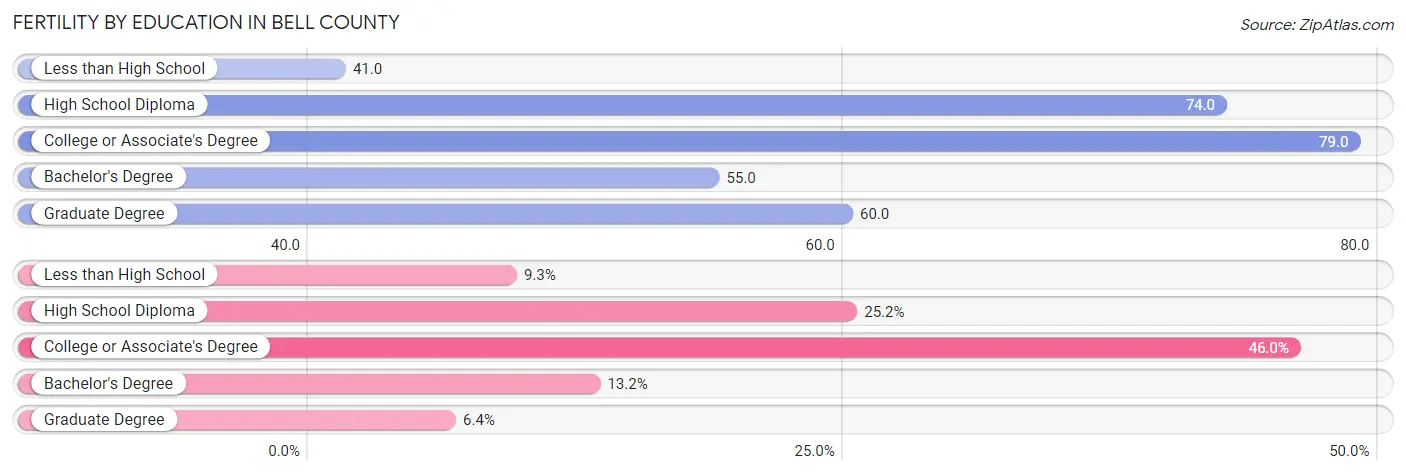
Fertility by Education in Bell County
Average fertility rate in Bell County is 67.0 births per 1,000 women. Women with the education attainment of college or associate's degree have the highest fertility rate of 79.0 births per 1,000 women, while women with the education attainment of less than high school have the lowest fertility at 41.0 births per 1,000 women. Women with the education attainment of college or associate's degree represent 46.0% of all women with births.
| Educational Attainment | Women with Births | Births / 1,000 Women |
| Less than High School | 578 (9.3%) | 41.0 |
| High School Diploma | 1,573 (25.2%) | 74.0 |
| College or Associate's Degree | 2,870 (46.0%) | 79.0 |
| Bachelor's Degree | 822 (13.2%) | 55.0 |
| Graduate Degree | 400 (6.4%) | 60.0 |
| Total | 6,243 (100.0%) | 67.0 |
Fertility by Education by Marriage Status in Bell County
30.7% of women with births in Bell County are unmarried. Women with the educational attainment of bachelor's degree are most likely to be married with 91.0% of them married at childbirth, while women with the educational attainment of less than high school are least likely to be married with 62.5% of them unmarried at childbirth.
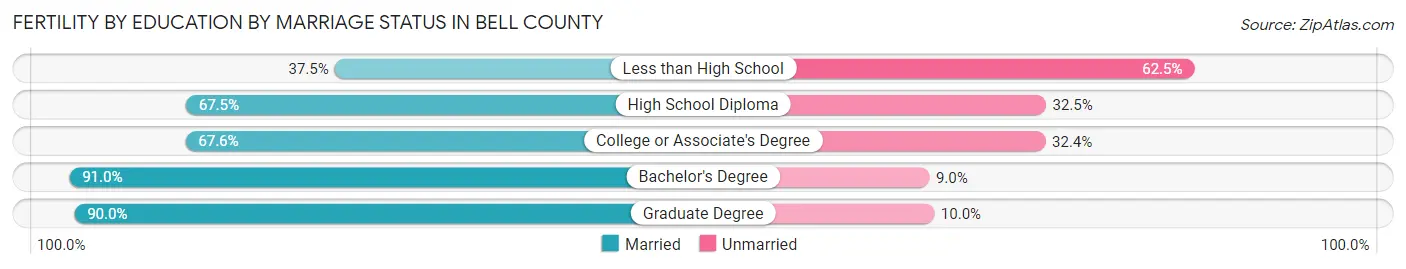
| Educational Attainment | Married | Unmarried |
| Less than High School | 217 (37.5%) | 361 (62.5%) |
| High School Diploma | 1,062 (67.5%) | 511 (32.5%) |
| College or Associate's Degree | 1,940 (67.6%) | 930 (32.4%) |
| Bachelor's Degree | 748 (91.0%) | 74 (9.0%) |
| Graduate Degree | 360 (90.0%) | 40 (10.0%) |
| Total | 4,326 (69.3%) | 1,917 (30.7%) |
Income in Bell County
Income Overview in Bell County
Per Capita Income in Bell County is $31,822, while median incomes of families and households are $75,314 and $62,858 respectively.
| Characteristic | Number | Measure |
| Per Capita Income | 372,821 | $31,822 |
| Median Family Income | 90,981 | $75,314 |
| Mean Family Income | 90,981 | $95,683 |
| Median Household Income | 134,495 | $62,858 |
| Mean Household Income | 134,495 | $83,348 |
| Income Deficit | 90,981 | $11,712 |
| Wage / Income Gap (%) | 372,821 | 29.83% |
| Wage / Income Gap ($) | 372,821 | 70.17¢ per $1 |
| Gini / Inequality Index | 372,821 | 0.45 |
Earnings by Sex in Bell County
Average Earnings in Bell County are $35,616, $41,579 for men and $29,178 for women, a difference of 29.8%.

| Sex | Number | Average Earnings |
| Male | 101,099 (53.1%) | $41,579 |
| Female | 89,436 (46.9%) | $29,178 |
| Total | 190,535 (100.0%) | $35,616 |
Earnings by Sex by Income Bracket in Bell County
The most common earnings brackets in Bell County are $100,000+ for men (11,234 | 11.1%) and $55,000 to $64,999 for women (6,914 | 7.7%).

| Income | Male | Female |
| $2,499 or less | 4,267 (4.2%) | 6,426 (7.2%) |
| $2,500 to $4,999 | 2,849 (2.8%) | 3,725 (4.2%) |
| $5,000 to $7,499 | 2,802 (2.8%) | 4,061 (4.5%) |
| $7,500 to $9,999 | 1,532 (1.5%) | 3,185 (3.6%) |
| $10,000 to $12,499 | 2,763 (2.7%) | 3,920 (4.4%) |
| $12,500 to $14,999 | 1,885 (1.9%) | 3,611 (4.0%) |
| $15,000 to $17,499 | 2,899 (2.9%) | 3,828 (4.3%) |
| $17,500 to $19,999 | 2,230 (2.2%) | 2,767 (3.1%) |
| $20,000 to $22,499 | 3,078 (3.0%) | 3,773 (4.2%) |
| $22,500 to $24,999 | 3,531 (3.5%) | 3,747 (4.2%) |
| $25,000 to $29,999 | 7,650 (7.6%) | 6,734 (7.5%) |
| $30,000 to $34,999 | 6,321 (6.2%) | 6,021 (6.7%) |
| $35,000 to $39,999 | 6,287 (6.2%) | 4,550 (5.1%) |
| $40,000 to $44,999 | 6,315 (6.2%) | 5,021 (5.6%) |
| $45,000 to $49,999 | 5,318 (5.3%) | 3,840 (4.3%) |
| $50,000 to $54,999 | 5,167 (5.1%) | 3,358 (3.7%) |
| $55,000 to $64,999 | 8,748 (8.6%) | 6,914 (7.7%) |
| $65,000 to $74,999 | 6,333 (6.3%) | 4,046 (4.5%) |
| $75,000 to $99,999 | 9,890 (9.8%) | 5,618 (6.3%) |
| $100,000+ | 11,234 (11.1%) | 4,291 (4.8%) |
| Total | 101,099 (100.0%) | 89,436 (100.0%) |
Earnings by Sex by Educational Attainment in Bell County
Average earnings in Bell County are $48,903 for men and $35,118 for women, a difference of 28.2%. Men with an educational attainment of graduate degree enjoy the highest average annual earnings of $81,155, while those with less than high school education earn the least with $32,074. Women with an educational attainment of graduate degree earn the most with the average annual earnings of $63,542, while those with less than high school education have the smallest earnings of $21,099.
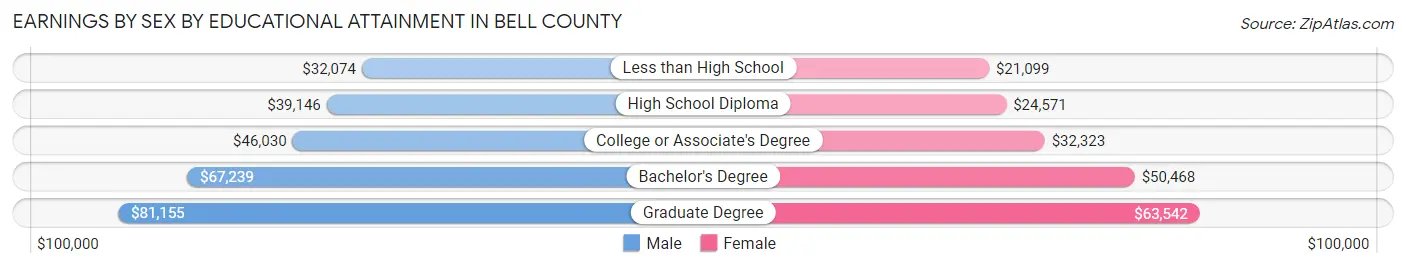
| Educational Attainment | Male Income | Female Income |
| Less than High School | $32,074 | $21,099 |
| High School Diploma | $39,146 | $24,571 |
| College or Associate's Degree | $46,030 | $32,323 |
| Bachelor's Degree | $67,239 | $50,468 |
| Graduate Degree | $81,155 | $63,542 |
| Total | $48,903 | $35,118 |
Family Income in Bell County
Family Income Brackets in Bell County
According to the Bell County family income data, there are 17,468 families falling into the $100,000 to $149,999 income range, which is the most common income bracket and makes up 19.2% of all families. Conversely, the $10,000 to $14,999 income bracket is the least frequent group with only 2,275 families (2.5%) belonging to this category.

| Income Bracket | # Families | % Families |
| Less than $10,000 | 3,457 | 3.8% |
| $10,000 to $14,999 | 2,275 | 2.5% |
| $15,000 to $24,999 | 5,368 | 5.9% |
| $25,000 to $34,999 | 7,097 | 7.8% |
| $35,000 to $49,999 | 11,282 | 12.4% |
| $50,000 to $74,999 | 15,831 | 17.4% |
| $75,000 to $99,999 | 14,921 | 16.4% |
| $100,000 to $149,999 | 17,468 | 19.2% |
| $150,000 to $199,999 | 7,278 | 8.0% |
| $200,000+ | 6,005 | 6.6% |
Family Income by Famaliy Size in Bell County
7+ person families (1,248 | 1.4%) account for the highest median family income in Bell County with $85,219 per family, while 2-person families (41,163 | 45.2%) have the highest median income of $35,349 per family member.

| Income Bracket | # Families | Median Income |
| 2-Person Families | 41,163 (45.2%) | $70,698 |
| 3-Person Families | 21,215 (23.3%) | $72,755 |
| 4-Person Families | 15,538 (17.1%) | $84,685 |
| 5-Person Families | 8,431 (9.3%) | $79,950 |
| 6-Person Families | 3,386 (3.7%) | $85,066 |
| 7+ Person Families | 1,248 (1.4%) | $85,219 |
| Total | 90,981 (100.0%) | $75,314 |
Family Income by Number of Earners in Bell County
The median family income in Bell County is $75,314, with families comprising 3+ earners (7,125) having the highest median family income of $138,032, while families with no earners (12,271) have the lowest median family income of $44,722, accounting for 7.8% and 13.5% of families, respectively.

| Number of Earners | # Families | Median Income |
| No Earners | 12,271 (13.5%) | $44,722 |
| 1 Earner | 33,627 (37.0%) | $54,124 |
| 2 Earners | 37,958 (41.7%) | $92,853 |
| 3+ Earners | 7,125 (7.8%) | $138,032 |
| Total | 90,981 (100.0%) | $75,314 |
Household Income in Bell County
Household Income Brackets in Bell County
With 25,151 households falling in the category, the $50,000 to $74,999 income range is the most frequent in Bell County, accounting for 18.7% of all households. In contrast, only 5,783 households (4.3%) fall into the $10,000 to $14,999 income bracket, making it the least populous group.

| Income Bracket | # Households | % Households |
| Less than $10,000 | 7,128 | 5.3% |
| $10,000 to $14,999 | 5,783 | 4.3% |
| $15,000 to $24,999 | 10,625 | 7.9% |
| $25,000 to $34,999 | 12,105 | 9.0% |
| $35,000 to $49,999 | 17,619 | 13.1% |
| $50,000 to $74,999 | 25,151 | 18.7% |
| $75,000 to $99,999 | 19,367 | 14.4% |
| $100,000 to $149,999 | 20,712 | 15.4% |
| $150,000 to $199,999 | 8,742 | 6.5% |
| $200,000+ | 6,994 | 5.2% |
Household Income by Householder Age in Bell County
The median household income in Bell County is $62,858, with the highest median household income of $75,863 found in the 45 to 64 years age bracket for the primary householder. A total of 42,915 households (31.9%) fall into this category. Meanwhile, the 15 to 24 years age bracket for the primary householder has the lowest median household income of $45,151, with 9,041 households (6.7%) in this group.
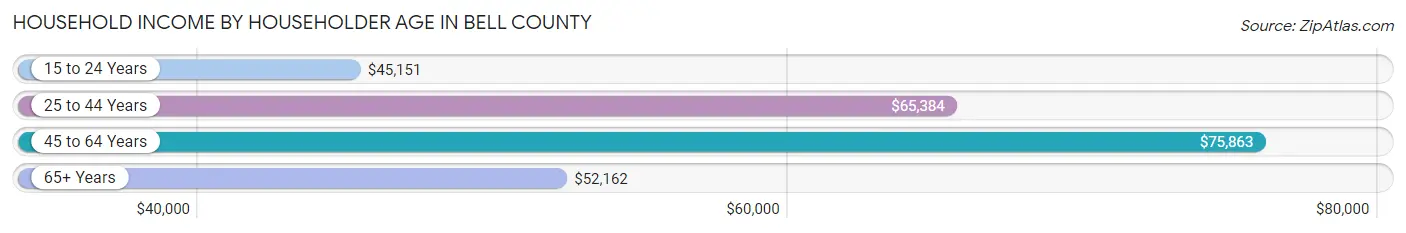
| Income Bracket | # Households | Median Income |
| 15 to 24 Years | 9,041 (6.7%) | $45,151 |
| 25 to 44 Years | 57,500 (42.7%) | $65,384 |
| 45 to 64 Years | 42,915 (31.9%) | $75,863 |
| 65+ Years | 25,039 (18.6%) | $52,162 |
| Total | 134,495 (100.0%) | $62,858 |
Poverty in Bell County
Income Below Poverty by Sex and Age in Bell County
With 12.3% poverty level for males and 17.0% for females among the residents of Bell County, 15 year old males and 12 to 14 year old females are the most vulnerable to poverty, with 627 males (24.7%) and 2,478 females (26.1%) in their respective age groups living below the poverty level.
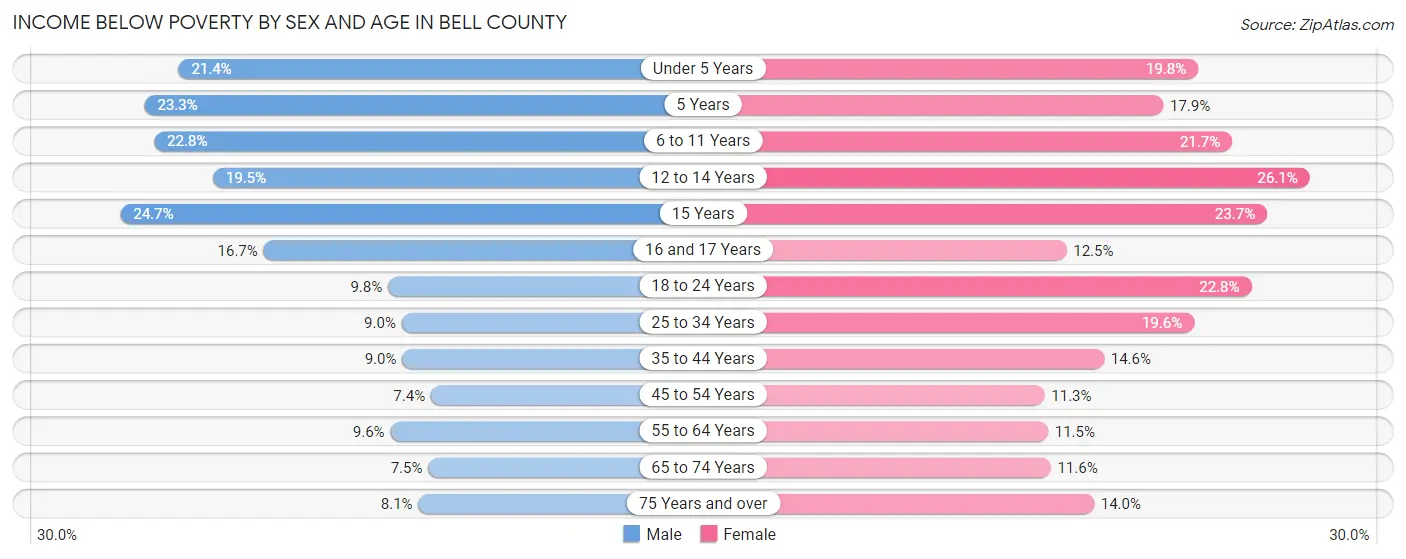
| Age Bracket | Male | Female |
| Under 5 Years | 3,187 (21.4%) | 2,815 (19.8%) |
| 5 Years | 712 (23.3%) | 438 (17.9%) |
| 6 to 11 Years | 3,781 (22.8%) | 3,450 (21.7%) |
| 12 to 14 Years | 1,637 (19.5%) | 2,478 (26.1%) |
| 15 Years | 627 (24.7%) | 589 (23.7%) |
| 16 and 17 Years | 910 (16.7%) | 653 (12.5%) |
| 18 to 24 Years | 1,802 (9.8%) | 3,947 (22.8%) |
| 25 to 34 Years | 2,688 (9.0%) | 5,688 (19.6%) |
| 35 to 44 Years | 2,176 (9.0%) | 3,659 (14.6%) |
| 45 to 54 Years | 1,410 (7.4%) | 2,261 (11.3%) |
| 55 to 64 Years | 1,662 (9.6%) | 2,178 (11.5%) |
| 65 to 74 Years | 885 (7.5%) | 1,572 (11.6%) |
| 75 Years and over | 518 (8.1%) | 1,265 (14.0%) |
| Total | 21,995 (12.3%) | 30,993 (17.0%) |
Income Above Poverty by Sex and Age in Bell County
According to the poverty statistics in Bell County, males aged 45 to 54 years and females aged 45 to 54 years are the age groups that are most secure financially, with 92.6% of males and 88.7% of females in these age groups living above the poverty line.

| Age Bracket | Male | Female |
| Under 5 Years | 11,685 (78.6%) | 11,370 (80.2%) |
| 5 Years | 2,340 (76.7%) | 2,010 (82.1%) |
| 6 to 11 Years | 12,808 (77.2%) | 12,424 (78.3%) |
| 12 to 14 Years | 6,750 (80.5%) | 7,035 (74.0%) |
| 15 Years | 1,915 (75.3%) | 1,898 (76.3%) |
| 16 and 17 Years | 4,543 (83.3%) | 4,570 (87.5%) |
| 18 to 24 Years | 16,668 (90.2%) | 13,361 (77.2%) |
| 25 to 34 Years | 27,192 (91.0%) | 23,320 (80.4%) |
| 35 to 44 Years | 22,085 (91.0%) | 21,414 (85.4%) |
| 45 to 54 Years | 17,731 (92.6%) | 17,787 (88.7%) |
| 55 to 64 Years | 15,589 (90.4%) | 16,811 (88.5%) |
| 65 to 74 Years | 10,890 (92.5%) | 11,955 (88.4%) |
| 75 Years and over | 5,897 (91.9%) | 7,751 (86.0%) |
| Total | 156,093 (87.6%) | 151,706 (83.0%) |
Income Below Poverty Among Married-Couple Families in Bell County
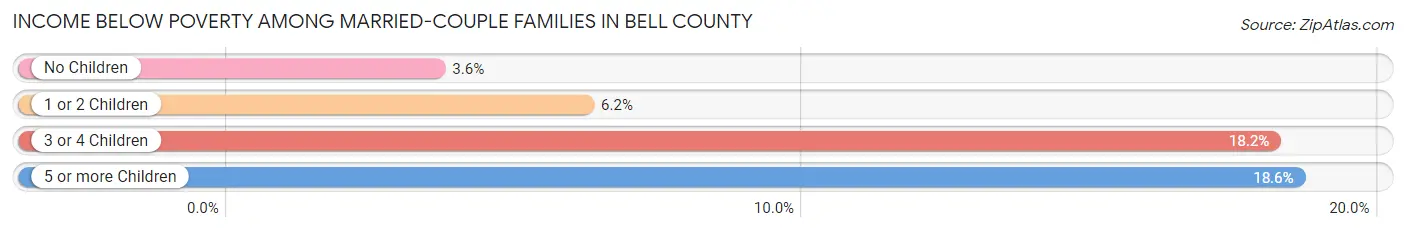
The poverty statistics for married-couple families in Bell County show that 6.1% or 3,821 of the total 63,087 families live below the poverty line. Families with 5 or more children have the highest poverty rate of 18.6%, comprising of 81 families. On the other hand, families with no children have the lowest poverty rate of 3.6%, which includes 1,240 families.
| Children | Above Poverty | Below Poverty |
| No Children | 33,089 (96.4%) | 1,240 (3.6%) |
| 1 or 2 Children | 20,729 (93.8%) | 1,370 (6.2%) |
| 3 or 4 Children | 5,093 (81.8%) | 1,130 (18.2%) |
| 5 or more Children | 355 (81.4%) | 81 (18.6%) |
| Total | 59,266 (93.9%) | 3,821 (6.1%) |
Income Below Poverty Among Single-Parent Households in Bell County
According to the poverty data in Bell County, 8.7% or 565 single-father households and 28.6% or 6,132 single-mother households are living below the poverty line. Among single-father households, those with 1 or 2 children have the highest poverty rate, with 343 households (9.9%) experiencing poverty. Likewise, among single-mother households, those with 5 or more children have the highest poverty rate, with 421 households (73.2%) falling below the poverty line.

| Children | Single Father | Single Mother |
| No Children | 182 (8.0%) | 603 (10.2%) |
| 1 or 2 Children | 343 (9.9%) | 3,764 (30.7%) |
| 3 or 4 Children | 40 (5.6%) | 1,344 (50.6%) |
| 5 or more Children | 0 (0.0%) | 421 (73.2%) |
| Total | 565 (8.7%) | 6,132 (28.6%) |
Income Below Poverty Among Married-Couple vs Single-Parent Households in Bell County
The poverty data for Bell County shows that 3,821 of the married-couple family households (6.1%) and 6,697 of the single-parent households (24.0%) are living below the poverty level. Within the married-couple family households, those with 5 or more children have the highest poverty rate, with 81 households (18.6%) falling below the poverty line. Among the single-parent households, those with 5 or more children have the highest poverty rate, with 421 household (69.5%) living below poverty.

| Children | Married-Couple Families | Single-Parent Households |
| No Children | 1,240 (3.6%) | 785 (9.6%) |
| 1 or 2 Children | 1,370 (6.2%) | 4,107 (26.1%) |
| 3 or 4 Children | 1,130 (18.2%) | 1,384 (41.1%) |
| 5 or more Children | 81 (18.6%) | 421 (69.5%) |
| Total | 3,821 (6.1%) | 6,697 (24.0%) |
Employment Characteristics in Bell County
Employment by Class of Employer in Bell County
Among the 168,459 employed individuals in Bell County, private company employees (94,563 | 56.1%), federal government employees (32,179 | 19.1%), and local government employees (12,812 | 7.6%) make up the most common classes of employment.

| Employer Class | # Employees | % Employees |
| Private Company Employees | 94,563 | 56.1% |
| Self-Employed (Incorporated) | 4,199 | 2.5% |
| Self-Employed (Not Incorporated) | 7,958 | 4.7% |
| Not-for-profit Organizations | 11,608 | 6.9% |
| Local Government Employees | 12,812 | 7.6% |
| State Government Employees | 4,809 | 2.9% |
| Federal Government Employees | 32,179 | 19.1% |
| Unpaid Family Workers | 331 | 0.2% |
| Total | 168,459 | 100.0% |
Employment Status by Age in Bell County
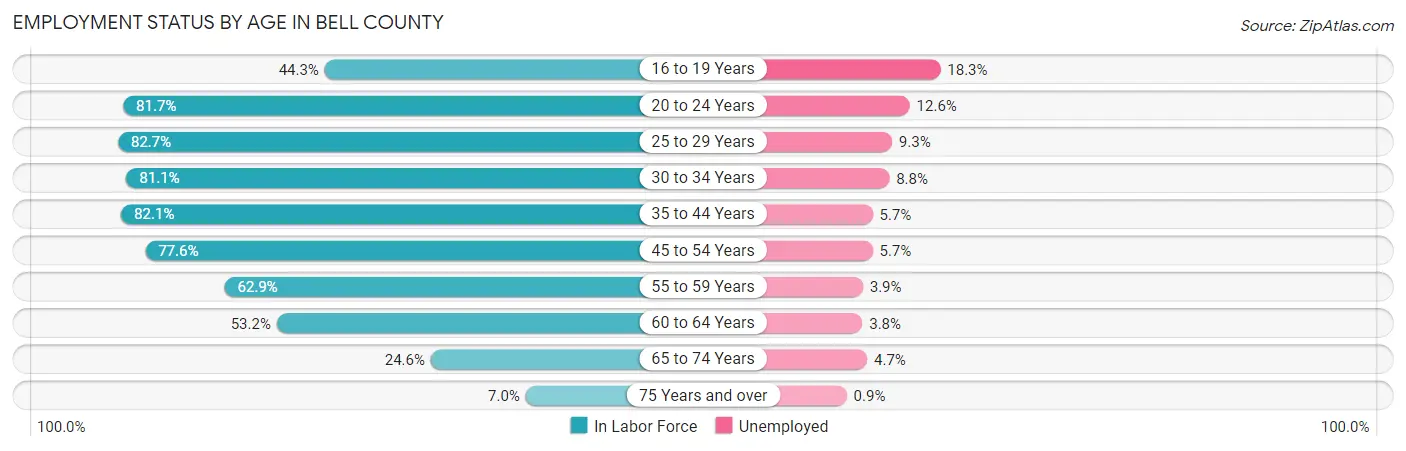
According to the labor force statistics for Bell County, out of the total population over 16 years of age (280,938), 65.7% or 184,576 individuals are in the labor force, with 7.7% or 14,212 of them unemployed. The age group with the highest labor force participation rate is 25 to 29 years, with 82.7% or 25,790 individuals in the labor force. Within the labor force, the 16 to 19 years age range has the highest percentage of unemployed individuals, with 18.3% or 1,773 of them being unemployed.
| Age Bracket | In Labor Force | Unemployed |
| 16 to 19 Years | 9,690 (44.3%) | 1,773 (18.3%) |
| 20 to 24 Years | 25,599 (81.7%) | 3,225 (12.6%) |
| 25 to 29 Years | 25,790 (82.7%) | 2,398 (9.3%) |
| 30 to 34 Years | 23,229 (81.1%) | 2,044 (8.8%) |
| 35 to 44 Years | 41,054 (82.1%) | 2,340 (5.7%) |
| 45 to 54 Years | 30,547 (77.6%) | 1,741 (5.7%) |
| 55 to 59 Years | 11,870 (62.9%) | 463 (3.9%) |
| 60 to 64 Years | 9,373 (53.2%) | 356 (3.8%) |
| 65 to 74 Years | 6,322 (24.6%) | 297 (4.7%) |
| 75 Years and over | 1,144 (7.0%) | 10 (0.9%) |
| Total | 184,576 (65.7%) | 14,212 (7.7%) |
Employment Status by Educational Attainment in Bell County
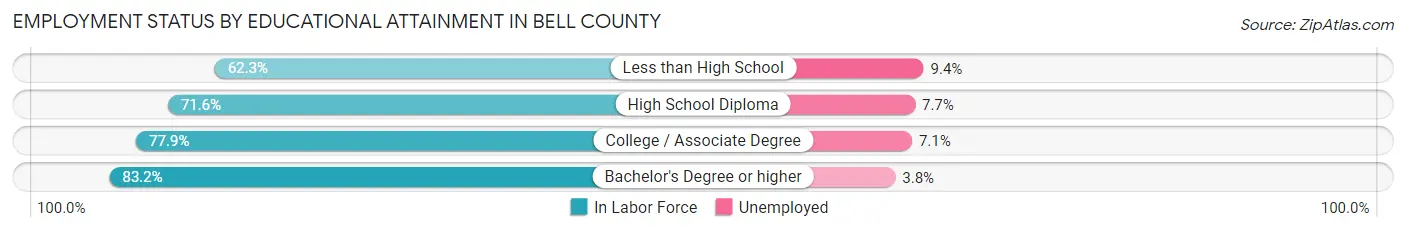
According to labor force statistics for Bell County, 76.4% of individuals (141,866) out of the total population between 25 and 64 years of age (185,688) are in the labor force, with 6.5% or 9,221 of them being unemployed. The group with the highest labor force participation rate are those with the educational attainment of bachelor's degree or higher, with 83.2% or 41,956 individuals in the labor force. Within the labor force, individuals with less than high school education have the highest percentage of unemployment, with 9.4% or 934 of them being unemployed.
| Educational Attainment | In Labor Force | Unemployed |
| Less than High School | 9,931 (62.3%) | 1,498 (9.4%) |
| High School Diploma | 33,182 (71.6%) | 3,568 (7.7%) |
| College / Associate Degree | 56,848 (77.9%) | 5,181 (7.1%) |
| Bachelor's Degree or higher | 41,956 (83.2%) | 1,916 (3.8%) |
| Total | 141,866 (76.4%) | 12,070 (6.5%) |
Employment Occupations by Sex in Bell County
Management, Business, Science and Arts Occupations
The most common Management, Business, Science and Arts occupations in Bell County are Community & Social Service (17,137 | 11.3%), Management (13,672 | 9.0%), Education Instruction & Library (11,077 | 7.3%), Health Diagnosing & Treating (10,792 | 7.1%), and Health Technologists (6,835 | 4.5%).

Management, Business, Science and Arts Occupations by Sex
Within the Management, Business, Science and Arts occupations in Bell County, the most male-oriented occupations are Architecture & Engineering (88.8%), Computers, Engineering & Science (72.4%), and Life, Physical & Social Science (69.6%), while the most female-oriented occupations are Legal Services & Support (76.1%), Health Diagnosing & Treating (73.7%), and Education Instruction & Library (73.0%).

| Occupation | Male | Female |
| Management | 7,413 (54.2%) | 6,259 (45.8%) |
| Business & Financial | 2,285 (41.5%) | 3,220 (58.5%) |
| Computers, Engineering & Science | 4,662 (72.4%) | 1,777 (27.6%) |
| Computers & Mathematics | 2,545 (66.4%) | 1,288 (33.6%) |
| Architecture & Engineering | 1,404 (88.8%) | 177 (11.2%) |
| Life, Physical & Social Science | 713 (69.6%) | 312 (30.4%) |
| Community & Social Service | 5,276 (30.8%) | 11,861 (69.2%) |
| Education, Arts & Media | 1,074 (35.4%) | 1,962 (64.6%) |
| Legal Services & Support | 254 (23.9%) | 810 (76.1%) |
| Education Instruction & Library | 2,989 (27.0%) | 8,088 (73.0%) |
| Arts, Media & Entertainment | 959 (48.9%) | 1,001 (51.1%) |
| Health Diagnosing & Treating | 2,844 (26.4%) | 7,948 (73.7%) |
| Health Technologists | 1,991 (29.1%) | 4,844 (70.9%) |
| Total (Category) | 22,480 (42.0%) | 31,065 (58.0%) |
| Total (Overall) | 76,778 (50.4%) | 75,595 (49.6%) |
Services Occupations
The most common Services occupations in Bell County are Food Preparation & Serving (9,885 | 6.5%), Cleaning & Maintenance (5,311 | 3.5%), Healthcare Support (5,040 | 3.3%), Personal Care & Service (4,444 | 2.9%), and Security & Protection (4,283 | 2.8%).

Services Occupations by Sex
Within the Services occupations in Bell County, the most male-oriented occupations are Law Enforcement (71.5%), Security & Protection (70.2%), and Firefighting & Prevention (68.8%), while the most female-oriented occupations are Healthcare Support (86.0%), Personal Care & Service (75.1%), and Food Preparation & Serving (61.5%).

| Occupation | Male | Female |
| Healthcare Support | 707 (14.0%) | 4,333 (86.0%) |
| Security & Protection | 3,005 (70.2%) | 1,278 (29.8%) |
| Firefighting & Prevention | 1,443 (68.8%) | 656 (31.2%) |
| Law Enforcement | 1,562 (71.5%) | 622 (28.5%) |
| Food Preparation & Serving | 3,811 (38.6%) | 6,074 (61.5%) |
| Cleaning & Maintenance | 3,178 (59.8%) | 2,133 (40.2%) |
| Personal Care & Service | 1,107 (24.9%) | 3,337 (75.1%) |
| Total (Category) | 11,808 (40.8%) | 17,155 (59.2%) |
| Total (Overall) | 76,778 (50.4%) | 75,595 (49.6%) |
Sales and Office Occupations
The most common Sales and Office occupations in Bell County are Office & Administration (18,934 | 12.4%), and Sales & Related (15,091 | 9.9%).

Sales and Office Occupations by Sex

| Occupation | Male | Female |
| Sales & Related | 7,371 (48.8%) | 7,720 (51.2%) |
| Office & Administration | 4,884 (25.8%) | 14,050 (74.2%) |
| Total (Category) | 12,255 (36.0%) | 21,770 (64.0%) |
| Total (Overall) | 76,778 (50.4%) | 75,595 (49.6%) |
Natural Resources, Construction and Maintenance Occupations
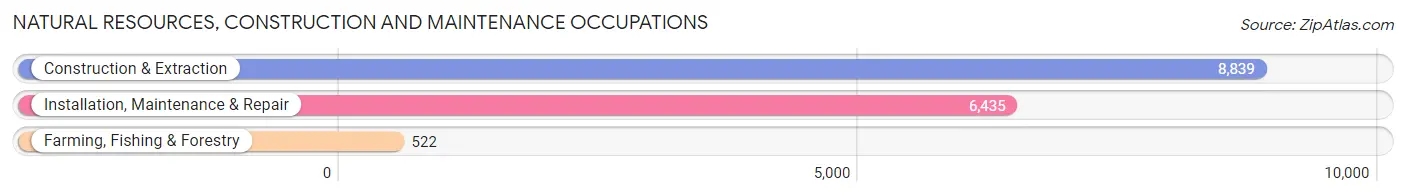
The most common Natural Resources, Construction and Maintenance occupations in Bell County are Construction & Extraction (8,839 | 5.8%), Installation, Maintenance & Repair (6,435 | 4.2%), and Farming, Fishing & Forestry (522 | 0.3%).
Natural Resources, Construction and Maintenance Occupations by Sex
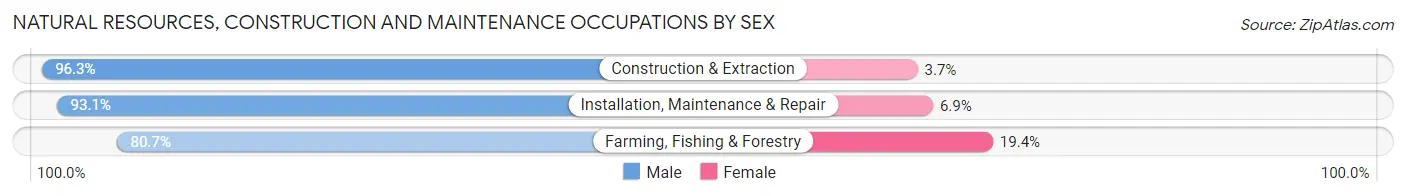
| Occupation | Male | Female |
| Farming, Fishing & Forestry | 421 (80.6%) | 101 (19.4%) |
| Construction & Extraction | 8,515 (96.3%) | 324 (3.7%) |
| Installation, Maintenance & Repair | 5,992 (93.1%) | 443 (6.9%) |
| Total (Category) | 14,928 (94.5%) | 868 (5.5%) |
| Total (Overall) | 76,778 (50.4%) | 75,595 (49.6%) |
Production, Transportation and Moving Occupations
The most common Production, Transportation and Moving occupations in Bell County are Material Moving (6,904 | 4.5%), Production (6,707 | 4.4%), and Transportation (6,433 | 4.2%).

Production, Transportation and Moving Occupations by Sex
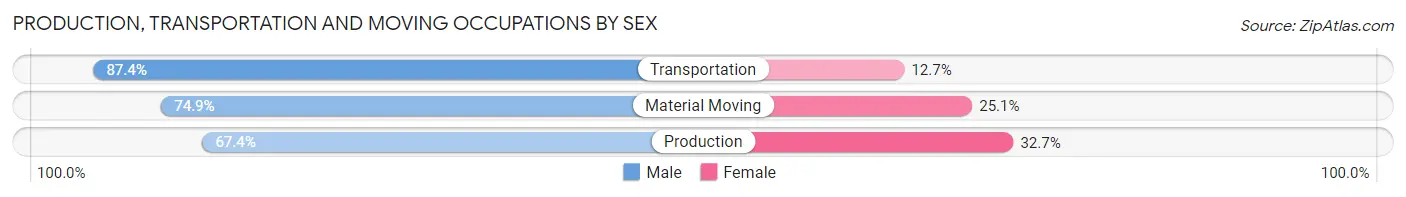
| Occupation | Male | Female |
| Production | 4,517 (67.3%) | 2,190 (32.7%) |
| Transportation | 5,619 (87.4%) | 814 (12.7%) |
| Material Moving | 5,171 (74.9%) | 1,733 (25.1%) |
| Total (Category) | 15,307 (76.4%) | 4,737 (23.6%) |
| Total (Overall) | 76,778 (50.4%) | 75,595 (49.6%) |
Employment Industries by Sex in Bell County
Employment Industries in Bell County
The major employment industries in Bell County include Health Care & Social Assistance (22,521 | 14.8%), Retail Trade (17,059 | 11.2%), Educational Services (15,974 | 10.5%), Accommodation & Food Services (13,045 | 8.6%), and Public Administration (12,225 | 8.0%).

Employment Industries by Sex in Bell County
The Bell County industries that see more men than women are Construction (92.7%), Mining, Quarrying, & Extraction (88.7%), and Utilities (82.9%), whereas the industries that tend to have a higher number of women are Finance & Insurance (74.9%), Health Care & Social Assistance (74.5%), and Educational Services (73.9%).

| Industry | Male | Female |
| Agriculture, Fishing & Hunting | 492 (80.5%) | 119 (19.5%) |
| Mining, Quarrying, & Extraction | 1,054 (88.7%) | 134 (11.3%) |
| Construction | 10,997 (92.7%) | 864 (7.3%) |
| Manufacturing | 5,898 (67.9%) | 2,784 (32.1%) |
| Wholesale Trade | 2,076 (75.2%) | 686 (24.8%) |
| Retail Trade | 9,334 (54.7%) | 7,725 (45.3%) |
| Transportation & Warehousing | 6,402 (75.6%) | 2,069 (24.4%) |
| Utilities | 919 (82.9%) | 189 (17.1%) |
| Information | 962 (48.3%) | 1,030 (51.7%) |
| Finance & Insurance | 1,295 (25.1%) | 3,861 (74.9%) |
| Real Estate, Rental & Leasing | 1,463 (46.3%) | 1,695 (53.7%) |
| Professional & Scientific | 3,911 (53.3%) | 3,422 (46.7%) |
| Enterprise Management | 122 (67.0%) | 60 (33.0%) |
| Administrative & Support | 4,209 (48.6%) | 4,449 (51.4%) |
| Educational Services | 4,176 (26.1%) | 11,798 (73.9%) |
| Health Care & Social Assistance | 5,753 (25.6%) | 16,768 (74.5%) |
| Arts, Entertainment & Recreation | 1,002 (46.8%) | 1,138 (53.2%) |
| Accommodation & Food Services | 5,417 (41.5%) | 7,628 (58.5%) |
| Public Administration | 6,711 (54.9%) | 5,514 (45.1%) |
| Total | 76,778 (50.4%) | 75,595 (49.6%) |
Education in Bell County
School Enrollment in Bell County
The most common levels of schooling among the 104,609 students in Bell County are college / undergraduate (23,742 | 22.7%), middle school (23,142 | 22.1%), and elementary school (21,355 | 20.4%).
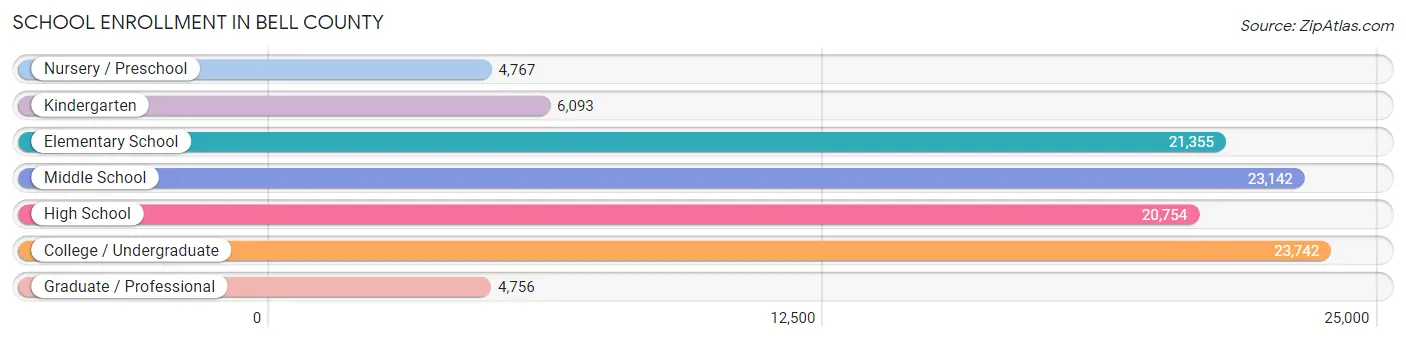
| School Level | # Students | % Students |
| Nursery / Preschool | 4,767 | 4.6% |
| Kindergarten | 6,093 | 5.8% |
| Elementary School | 21,355 | 20.4% |
| Middle School | 23,142 | 22.1% |
| High School | 20,754 | 19.8% |
| College / Undergraduate | 23,742 | 22.7% |
| Graduate / Professional | 4,756 | 4.5% |
| Total | 104,609 | 100.0% |
School Enrollment by Age by Funding Source in Bell County
Out of a total of 104,609 students who are enrolled in schools in Bell County, 13,808 (13.2%) attend a private institution, while the remaining 90,801 (86.8%) are enrolled in public schools. The age group of 3 to 4 year olds has the highest likelihood of being enrolled in private schools, with 1,322 (36.9% in the age bracket) enrolled. Conversely, the age group of 10 to 14 year olds has the lowest likelihood of being enrolled in a private school, with 25,911 (92.2% in the age bracket) attending a public institution.

| Age Bracket | Public School | Private School |
| 3 to 4 Year Olds | 2,264 (63.1%) | 1,322 (36.9%) |
| 5 to 9 Year Old | 23,379 (90.9%) | 2,353 (9.1%) |
| 10 to 14 Year Olds | 25,911 (92.2%) | 2,197 (7.8%) |
| 15 to 17 Year Olds | 13,826 (91.5%) | 1,287 (8.5%) |
| 18 to 19 Year Olds | 5,075 (77.5%) | 1,470 (22.5%) |
| 20 to 24 Year Olds | 6,696 (75.2%) | 2,202 (24.7%) |
| 25 to 34 Year Olds | 7,048 (81.8%) | 1,573 (18.2%) |
| 35 Years and over | 6,571 (82.1%) | 1,435 (17.9%) |
| Total | 90,801 (86.8%) | 13,808 (13.2%) |
Educational Attainment by Field of Study in Bell County
Business (12,819 | 19.6%), education (8,997 | 13.7%), arts & humanities (7,637 | 11.7%), science & technology (7,059 | 10.8%), and bio, nature & agricultural (4,907 | 7.5%) are the most common fields of study among 65,457 individuals in Bell County who have obtained a bachelor's degree or higher.
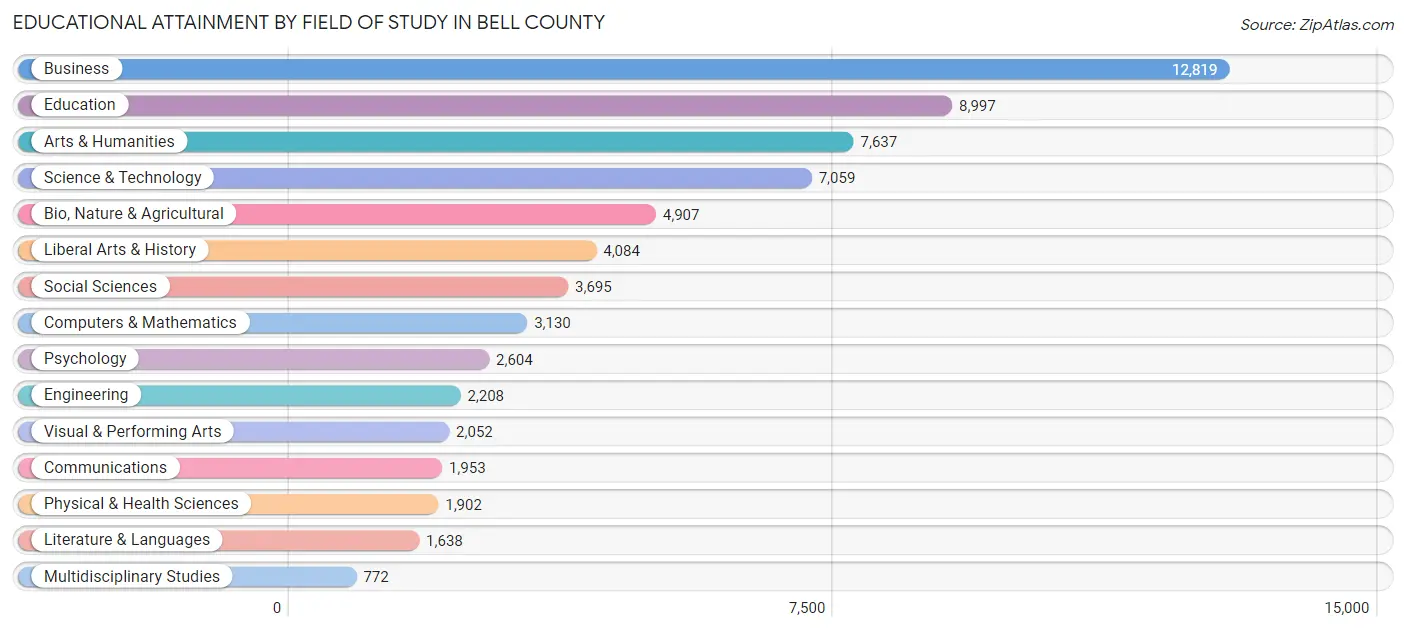
| Field of Study | # Graduates | % Graduates |
| Computers & Mathematics | 3,130 | 4.8% |
| Bio, Nature & Agricultural | 4,907 | 7.5% |
| Physical & Health Sciences | 1,902 | 2.9% |
| Psychology | 2,604 | 4.0% |
| Social Sciences | 3,695 | 5.6% |
| Engineering | 2,208 | 3.4% |
| Multidisciplinary Studies | 772 | 1.2% |
| Science & Technology | 7,059 | 10.8% |
| Business | 12,819 | 19.6% |
| Education | 8,997 | 13.7% |
| Literature & Languages | 1,638 | 2.5% |
| Liberal Arts & History | 4,084 | 6.2% |
| Visual & Performing Arts | 2,052 | 3.1% |
| Communications | 1,953 | 3.0% |
| Arts & Humanities | 7,637 | 11.7% |
| Total | 65,457 | 100.0% |
Transportation & Commute in Bell County
Vehicle Availability by Sex in Bell County
The most prevalent vehicle ownership categories in Bell County are males with 2 vehicles (39,309, accounting for 45.0%) and females with 2 vehicles (30,939, making up 52.3%).

| Vehicles Available | Male | Female |
| No Vehicle | 1,474 (1.7%) | 2,684 (3.6%) |
| 1 Vehicle | 17,787 (20.3%) | 17,960 (23.9%) |
| 2 Vehicles | 39,309 (45.0%) | 30,939 (41.2%) |
| 3 Vehicles | 19,144 (21.9%) | 15,535 (20.7%) |
| 4 Vehicles | 7,263 (8.3%) | 5,814 (7.7%) |
| 5 or more Vehicles | 2,449 (2.8%) | 2,155 (2.9%) |
| Total | 87,426 (100.0%) | 75,087 (100.0%) |
Commute Time in Bell County
The most frequently occuring commute durations in Bell County are 15 to 19 minutes (32,990 commuters, 21.2%), 10 to 14 minutes (28,127 commuters, 18.0%), and 20 to 24 minutes (21,366 commuters, 13.7%).

| Commute Time | # Commuters | % Commuters |
| Less than 5 Minutes | 4,784 | 3.1% |
| 5 to 9 Minutes | 19,372 | 12.4% |
| 10 to 14 Minutes | 28,127 | 18.0% |
| 15 to 19 Minutes | 32,990 | 21.2% |
| 20 to 24 Minutes | 21,366 | 13.7% |
| 25 to 29 Minutes | 8,440 | 5.4% |
| 30 to 34 Minutes | 13,778 | 8.8% |
| 35 to 39 Minutes | 3,322 | 2.1% |
| 40 to 44 Minutes | 3,336 | 2.1% |
| 45 to 59 Minutes | 8,935 | 5.7% |
| 60 to 89 Minutes | 7,903 | 5.1% |
| 90 or more Minutes | 3,440 | 2.2% |
Commute Time by Sex in Bell County
The most common commute times in Bell County are 15 to 19 minutes (17,039 commuters, 19.8%) for males and 15 to 19 minutes (15,951 commuters, 22.9%) for females.
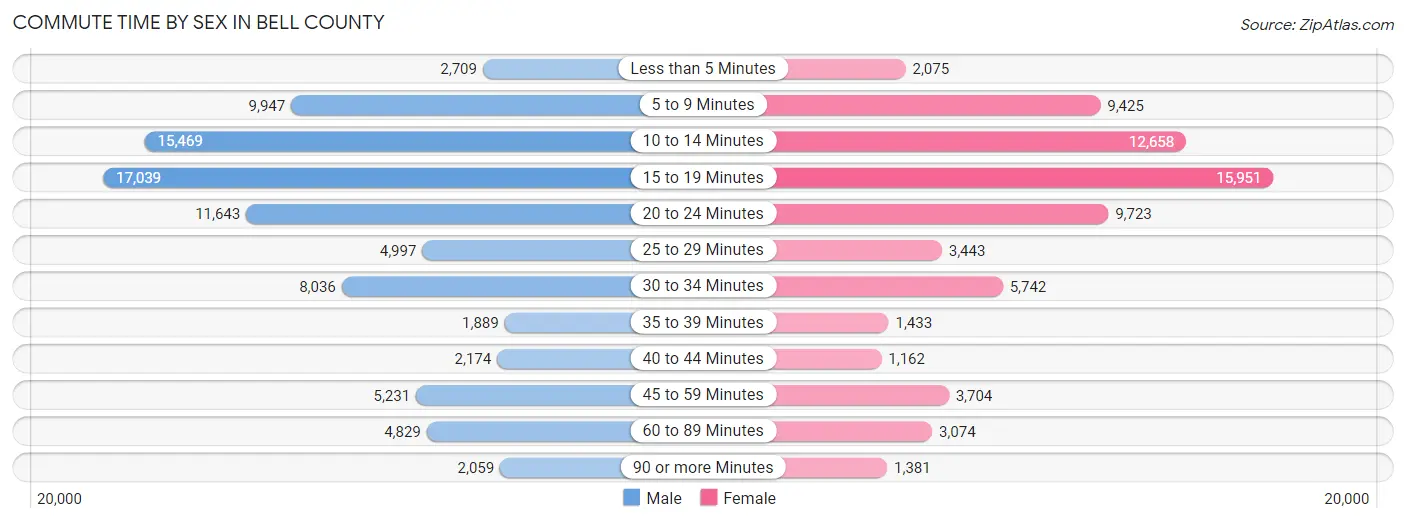
| Commute Time | Male | Female |
| Less than 5 Minutes | 2,709 (3.2%) | 2,075 (3.0%) |
| 5 to 9 Minutes | 9,947 (11.6%) | 9,425 (13.5%) |
| 10 to 14 Minutes | 15,469 (18.0%) | 12,658 (18.1%) |
| 15 to 19 Minutes | 17,039 (19.8%) | 15,951 (22.9%) |
| 20 to 24 Minutes | 11,643 (13.5%) | 9,723 (13.9%) |
| 25 to 29 Minutes | 4,997 (5.8%) | 3,443 (4.9%) |
| 30 to 34 Minutes | 8,036 (9.3%) | 5,742 (8.2%) |
| 35 to 39 Minutes | 1,889 (2.2%) | 1,433 (2.1%) |
| 40 to 44 Minutes | 2,174 (2.5%) | 1,162 (1.7%) |
| 45 to 59 Minutes | 5,231 (6.1%) | 3,704 (5.3%) |
| 60 to 89 Minutes | 4,829 (5.6%) | 3,074 (4.4%) |
| 90 or more Minutes | 2,059 (2.4%) | 1,381 (2.0%) |
Time of Departure to Work by Sex in Bell County
The most frequent times of departure to work in Bell County are 6:00 AM to 6:29 AM (10,287, 12.0%) for males and 7:00 AM to 7:29 AM (11,228, 16.1%) for females.
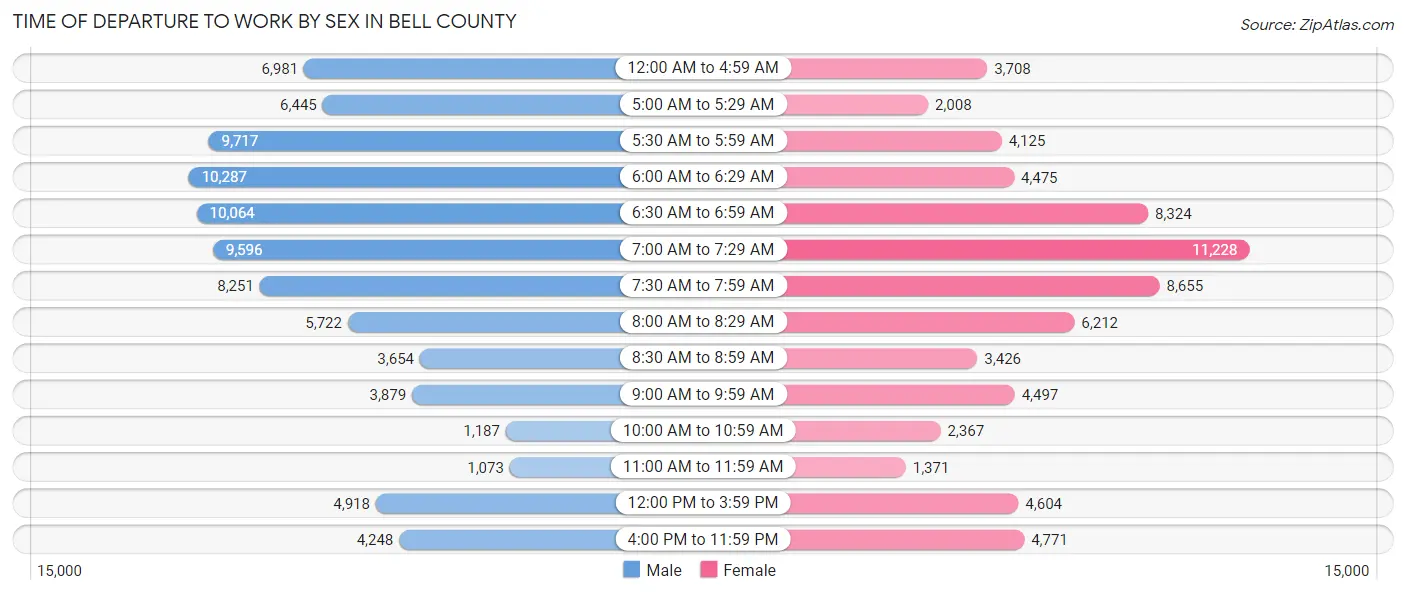
| Time of Departure | Male | Female |
| 12:00 AM to 4:59 AM | 6,981 (8.1%) | 3,708 (5.3%) |
| 5:00 AM to 5:29 AM | 6,445 (7.5%) | 2,008 (2.9%) |
| 5:30 AM to 5:59 AM | 9,717 (11.3%) | 4,125 (5.9%) |
| 6:00 AM to 6:29 AM | 10,287 (12.0%) | 4,475 (6.4%) |
| 6:30 AM to 6:59 AM | 10,064 (11.7%) | 8,324 (11.9%) |
| 7:00 AM to 7:29 AM | 9,596 (11.2%) | 11,228 (16.1%) |
| 7:30 AM to 7:59 AM | 8,251 (9.6%) | 8,655 (12.4%) |
| 8:00 AM to 8:29 AM | 5,722 (6.7%) | 6,212 (8.9%) |
| 8:30 AM to 8:59 AM | 3,654 (4.3%) | 3,426 (4.9%) |
| 9:00 AM to 9:59 AM | 3,879 (4.5%) | 4,497 (6.5%) |
| 10:00 AM to 10:59 AM | 1,187 (1.4%) | 2,367 (3.4%) |
| 11:00 AM to 11:59 AM | 1,073 (1.3%) | 1,371 (2.0%) |
| 12:00 PM to 3:59 PM | 4,918 (5.7%) | 4,604 (6.6%) |
| 4:00 PM to 11:59 PM | 4,248 (4.9%) | 4,771 (6.8%) |
| Total | 86,022 (100.0%) | 69,771 (100.0%) |
Housing Occupancy in Bell County
Occupancy by Ownership in Bell County
Of the total 134,495 dwellings in Bell County, owner-occupied units account for 73,362 (54.5%), while renter-occupied units make up 61,133 (45.5%).
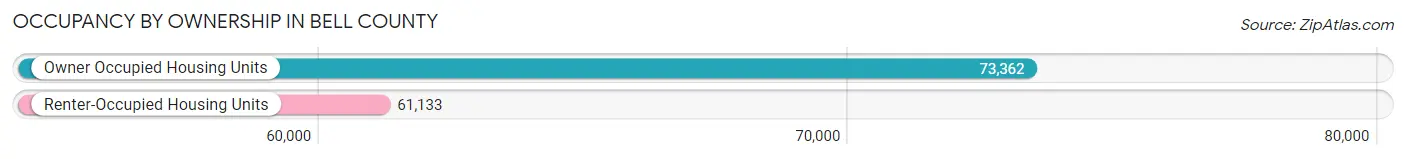
| Occupancy | # Housing Units | % Housing Units |
| Owner Occupied Housing Units | 73,362 | 54.5% |
| Renter-Occupied Housing Units | 61,133 | 45.5% |
| Total Occupied Housing Units | 134,495 | 100.0% |
Occupancy by Household Size in Bell County

| Household Size | # Housing Units | % Housing Units |
| 1-Person Household | 36,415 | 27.1% |
| 2-Person Household | 45,141 | 33.6% |
| 3-Person Household | 21,427 | 15.9% |
| 4+ Person Household | 31,512 | 23.4% |
| Total Housing Units | 134,495 | 100.0% |
Occupancy by Ownership by Household Size in Bell County

| Household Size | Owner-occupied | Renter-occupied |
| 1-Person Household | 14,738 (40.5%) | 21,677 (59.5%) |
| 2-Person Household | 27,419 (60.7%) | 17,722 (39.3%) |
| 3-Person Household | 11,970 (55.9%) | 9,457 (44.1%) |
| 4+ Person Household | 19,235 (61.0%) | 12,277 (39.0%) |
| Total Housing Units | 73,362 (54.5%) | 61,133 (45.5%) |
Occupancy by Educational Attainment in Bell County

| Household Size | Owner-occupied | Renter-occupied |
| Less than High School | 4,646 (44.8%) | 5,728 (55.2%) |
| High School Diploma | 13,796 (45.9%) | 16,260 (54.1%) |
| College/Associate Degree | 28,075 (51.0%) | 26,953 (49.0%) |
| Bachelor's Degree or higher | 26,845 (68.8%) | 12,192 (31.2%) |
Occupancy by Age of Householder in Bell County
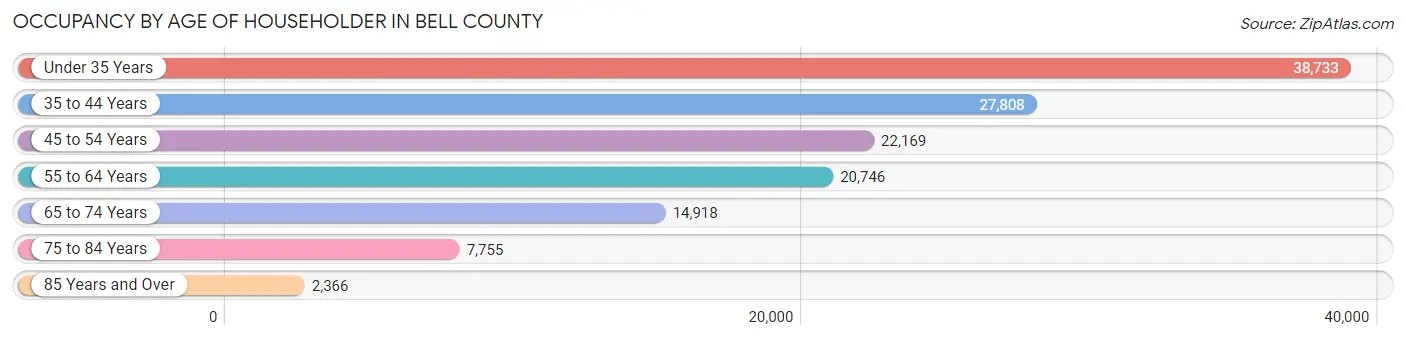
| Age Bracket | # Households | % Households |
| Under 35 Years | 38,733 | 28.8% |
| 35 to 44 Years | 27,808 | 20.7% |
| 45 to 54 Years | 22,169 | 16.5% |
| 55 to 64 Years | 20,746 | 15.4% |
| 65 to 74 Years | 14,918 | 11.1% |
| 75 to 84 Years | 7,755 | 5.8% |
| 85 Years and Over | 2,366 | 1.8% |
| Total | 134,495 | 100.0% |
Housing Finances in Bell County
Median Income by Occupancy in Bell County

| Occupancy Type | # Households | Median Income |
| Owner-Occupied | 73,362 (54.5%) | $84,311 |
| Renter-Occupied | 61,133 (45.5%) | $44,283 |
| Average | 134,495 (100.0%) | $62,858 |
Occupancy by Householder Income Bracket in Bell County

| Income Bracket | Owner-occupied | Renter-occupied |
| Less than $5,000 | 1,360 (1.8%) | 3,205 (5.2%) |
| $5,000 to $9,999 | 814 (1.1%) | 1,717 (2.8%) |
| $10,000 to $14,999 | 1,751 (2.4%) | 4,082 (6.7%) |
| $15,000 to $19,999 | 1,825 (2.5%) | 3,248 (5.3%) |
| $20,000 to $24,999 | 1,943 (2.6%) | 3,673 (6.0%) |
| $25,000 to $34,999 | 4,157 (5.7%) | 8,007 (13.1%) |
| $35,000 to $49,999 | 7,040 (9.6%) | 10,609 (17.3%) |
| $50,000 to $74,999 | 12,606 (17.2%) | 12,529 (20.5%) |
| $75,000 to $99,999 | 12,439 (17.0%) | 6,892 (11.3%) |
| $100,000 to $149,999 | 15,967 (21.8%) | 4,789 (7.8%) |
| $150,000 or more | 13,460 (18.3%) | 2,382 (3.9%) |
| Total | 73,362 (100.0%) | 61,133 (100.0%) |
Monthly Housing Cost Tiers in Bell County
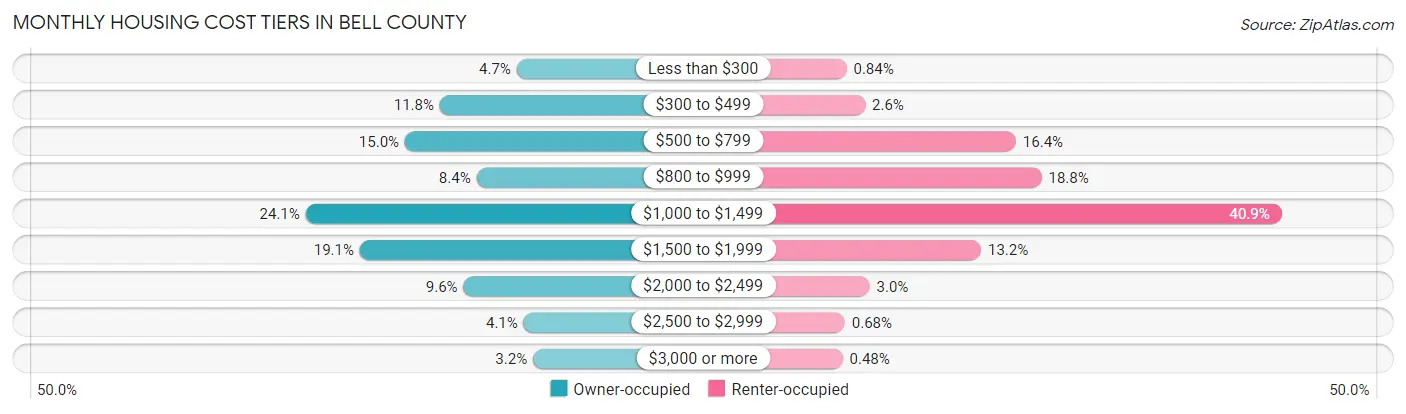
| Monthly Cost | Owner-occupied | Renter-occupied |
| Less than $300 | 3,445 (4.7%) | 514 (0.8%) |
| $300 to $499 | 8,643 (11.8%) | 1,556 (2.5%) |
| $500 to $799 | 10,997 (15.0%) | 10,044 (16.4%) |
| $800 to $999 | 6,163 (8.4%) | 11,487 (18.8%) |
| $1,000 to $1,499 | 17,702 (24.1%) | 24,996 (40.9%) |
| $1,500 to $1,999 | 14,038 (19.1%) | 8,079 (13.2%) |
| $2,000 to $2,499 | 7,046 (9.6%) | 1,811 (3.0%) |
| $2,500 to $2,999 | 2,982 (4.1%) | 413 (0.7%) |
| $3,000 or more | 2,346 (3.2%) | 292 (0.5%) |
| Total | 73,362 (100.0%) | 61,133 (100.0%) |
Physical Housing Characteristics in Bell County
Housing Structures in Bell County
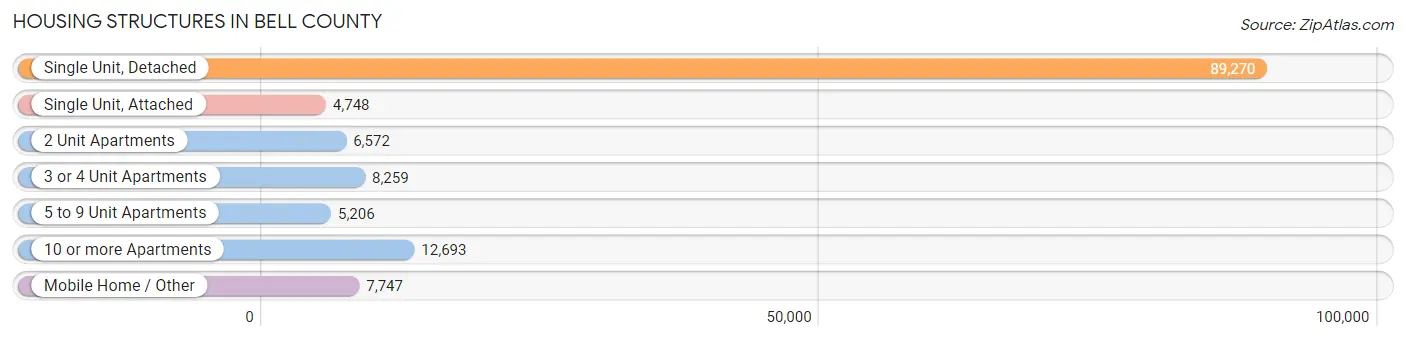
| Structure Type | # Housing Units | % Housing Units |
| Single Unit, Detached | 89,270 | 66.4% |
| Single Unit, Attached | 4,748 | 3.5% |
| 2 Unit Apartments | 6,572 | 4.9% |
| 3 or 4 Unit Apartments | 8,259 | 6.1% |
| 5 to 9 Unit Apartments | 5,206 | 3.9% |
| 10 or more Apartments | 12,693 | 9.4% |
| Mobile Home / Other | 7,747 | 5.8% |
| Total | 134,495 | 100.0% |
Housing Structures by Occupancy in Bell County

| Structure Type | Owner-occupied | Renter-occupied |
| Single Unit, Detached | 67,460 (75.6%) | 21,810 (24.4%) |
| Single Unit, Attached | 982 (20.7%) | 3,766 (79.3%) |
| 2 Unit Apartments | 187 (2.9%) | 6,385 (97.2%) |
| 3 or 4 Unit Apartments | 66 (0.8%) | 8,193 (99.2%) |
| 5 to 9 Unit Apartments | 7 (0.1%) | 5,199 (99.9%) |
| 10 or more Apartments | 73 (0.6%) | 12,620 (99.4%) |
| Mobile Home / Other | 4,587 (59.2%) | 3,160 (40.8%) |
| Total | 73,362 (54.5%) | 61,133 (45.5%) |
Housing Structures by Number of Rooms in Bell County

| Number of Rooms | Owner-occupied | Renter-occupied |
| 1 Room | 178 (0.2%) | 1,590 (2.6%) |
| 2 or 3 Rooms | 1,268 (1.7%) | 17,913 (29.3%) |
| 4 or 5 Rooms | 23,873 (32.5%) | 28,285 (46.3%) |
| 6 or 7 Rooms | 30,217 (41.2%) | 10,633 (17.4%) |
| 8 or more Rooms | 17,826 (24.3%) | 2,712 (4.4%) |
| Total | 73,362 (100.0%) | 61,133 (100.0%) |
Housing Structure by Heating Type in Bell County

| Heating Type | Owner-occupied | Renter-occupied |
| Utility Gas | 9,214 (12.6%) | 4,972 (8.1%) |
| Bottled, Tank, or LP Gas | 1,380 (1.9%) | 475 (0.8%) |
| Electricity | 61,364 (83.7%) | 54,988 (89.9%) |
| Fuel Oil or Kerosene | 135 (0.2%) | 64 (0.1%) |
| Coal or Coke | 0 (0.0%) | 0 (0.0%) |
| All other Fuels | 935 (1.3%) | 297 (0.5%) |
| No Fuel Used | 334 (0.5%) | 337 (0.5%) |
| Total | 73,362 (100.0%) | 61,133 (100.0%) |
Household Vehicle Usage in Bell County

| Vehicles per Household | Owner-occupied | Renter-occupied |
| No Vehicle | 1,631 (2.2%) | 6,215 (10.2%) |
| 1 Vehicle | 15,305 (20.9%) | 28,555 (46.7%) |
| 2 Vehicles | 33,715 (46.0%) | 20,600 (33.7%) |
| 3 or more Vehicles | 22,711 (31.0%) | 5,763 (9.4%) |
| Total | 73,362 (100.0%) | 61,133 (100.0%) |
Real Estate & Mortgages in Bell County
Real Estate and Mortgage Overview in Bell County
| Characteristic | Without Mortgage | With Mortgage |
| Housing Units | 26,831 | 46,531 |
| Median Property Value | $164,700 | $211,300 |
| Median Household Income | $68,851 | $9,864 |
| Monthly Housing Costs | $550 | $2,285 |
| Real Estate Taxes | $2,386 | $6,648 |
Property Value by Mortgage Status in Bell County

| Property Value | Without Mortgage | With Mortgage |
| Less than $50,000 | 2,921 (10.9%) | 1,378 (3.0%) |
| $50,000 to $99,999 | 4,005 (14.9%) | 2,842 (6.1%) |
| $100,000 to $299,999 | 14,976 (55.8%) | 32,147 (69.1%) |
| $300,000 to $499,999 | 3,320 (12.4%) | 7,913 (17.0%) |
| $500,000 to $749,999 | 1,026 (3.8%) | 1,626 (3.5%) |
| $750,000 to $999,999 | 282 (1.1%) | 387 (0.8%) |
| $1,000,000 or more | 301 (1.1%) | 238 (0.5%) |
| Total | 26,831 (100.0%) | 46,531 (100.0%) |
Household Income by Mortgage Status in Bell County

| Household Income | Without Mortgage | With Mortgage |
| Less than $10,000 | 1,126 (4.2%) | 362 (0.8%) |
| $10,000 to $24,999 | 3,598 (13.4%) | 1,048 (2.2%) |
| $25,000 to $34,999 | 2,140 (8.0%) | 1,921 (4.1%) |
| $35,000 to $49,999 | 3,374 (12.6%) | 2,017 (4.3%) |
| $50,000 to $74,999 | 4,479 (16.7%) | 3,666 (7.9%) |
| $75,000 to $99,999 | 4,147 (15.5%) | 8,127 (17.5%) |
| $100,000 to $149,999 | 4,371 (16.3%) | 8,292 (17.8%) |
| $150,000 or more | 3,596 (13.4%) | 11,596 (24.9%) |
| Total | 26,831 (100.0%) | 46,531 (100.0%) |
Property Value to Household Income Ratio in Bell County
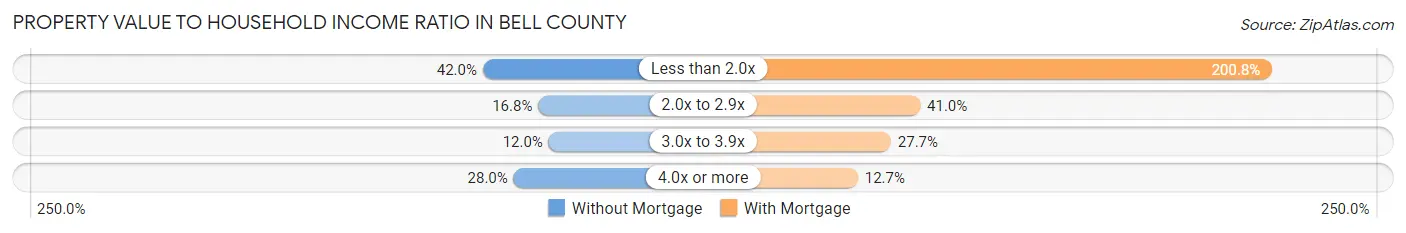
| Value-to-Income Ratio | Without Mortgage | With Mortgage |
| Less than 2.0x | 11,259 (42.0%) | 93,415 (200.8%) |
| 2.0x to 2.9x | 4,508 (16.8%) | 19,058 (41.0%) |
| 3.0x to 3.9x | 3,231 (12.0%) | 12,877 (27.7%) |
| 4.0x or more | 7,507 (28.0%) | 5,890 (12.7%) |
| Total | 26,831 (100.0%) | 46,531 (100.0%) |
Real Estate Taxes by Mortgage Status in Bell County

| Property Taxes | Without Mortgage | With Mortgage |
| Less than $800 | 4,202 (15.7%) | 396 (0.9%) |
| $800 to $1,499 | 3,168 (11.8%) | 2,523 (5.4%) |
| $800 to $1,499 | 15,828 (59.0%) | 2,821 (6.1%) |
| Total | 26,831 (100.0%) | 46,531 (100.0%) |
Health & Disability in Bell County
Health Insurance Coverage by Age in Bell County
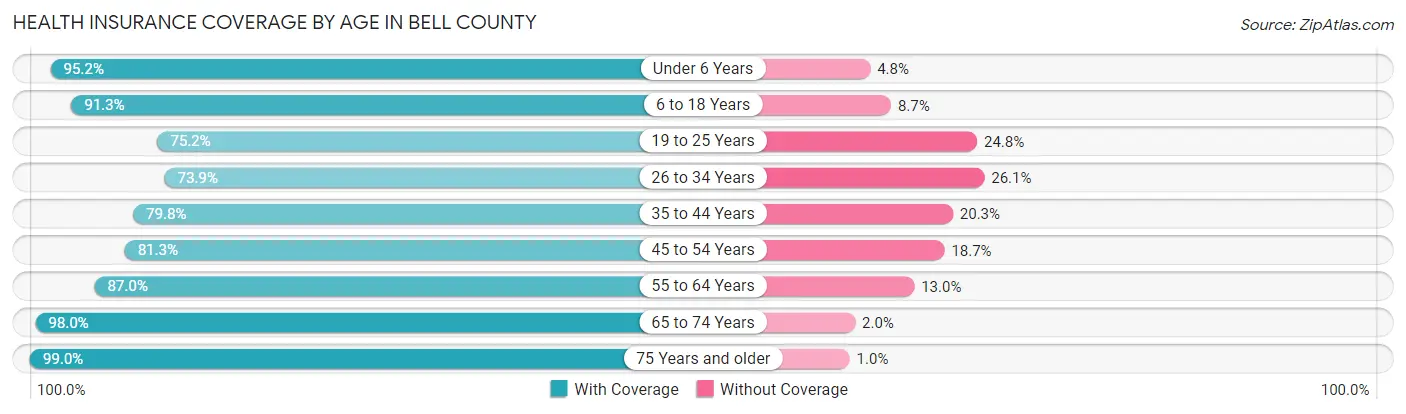
| Age Bracket | With Coverage | Without Coverage |
| Under 6 Years | 33,404 (95.2%) | 1,695 (4.8%) |
| 6 to 18 Years | 65,832 (91.3%) | 6,279 (8.7%) |
| 19 to 25 Years | 25,551 (75.2%) | 8,410 (24.8%) |
| 26 to 34 Years | 34,913 (73.9%) | 12,335 (26.1%) |
| 35 to 44 Years | 36,679 (79.7%) | 9,313 (20.3%) |
| 45 to 54 Years | 31,030 (81.3%) | 7,127 (18.7%) |
| 55 to 64 Years | 31,423 (87.0%) | 4,713 (13.0%) |
| 65 to 74 Years | 24,791 (98.0%) | 511 (2.0%) |
| 75 Years and older | 15,276 (99.0%) | 155 (1.0%) |
| Total | 298,899 (85.5%) | 50,538 (14.5%) |
Health Insurance Coverage by Citizenship Status in Bell County

| Citizenship Status | With Coverage | Without Coverage |
| Native Born | 33,404 (95.2%) | 1,695 (4.8%) |
| Foreign Born, Citizen | 65,832 (91.3%) | 6,279 (8.7%) |
| Foreign Born, not a Citizen | 25,551 (75.2%) | 8,410 (24.8%) |
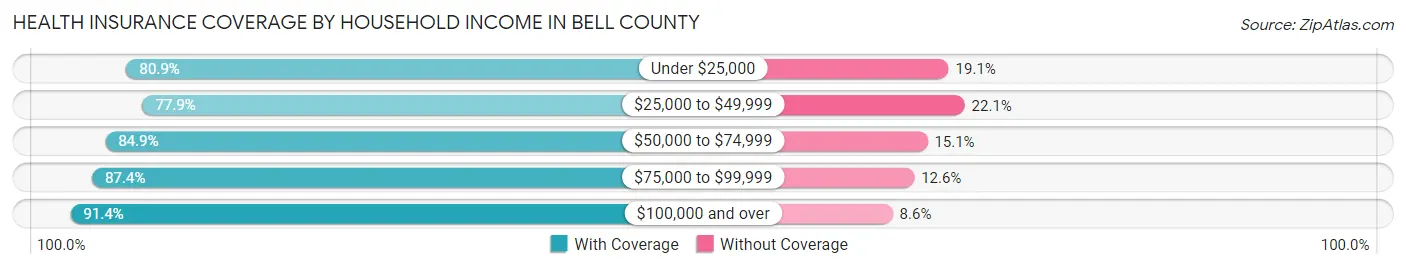
Health Insurance Coverage by Household Income in Bell County
| Household Income | With Coverage | Without Coverage |
| Under $25,000 | 37,870 (80.9%) | 8,930 (19.1%) |
| $25,000 to $49,999 | 53,179 (77.9%) | 15,071 (22.1%) |
| $50,000 to $74,999 | 50,275 (84.9%) | 8,947 (15.1%) |
| $75,000 to $99,999 | 47,453 (87.4%) | 6,858 (12.6%) |
| $100,000 and over | 108,179 (91.4%) | 10,171 (8.6%) |
Public vs Private Health Insurance Coverage by Age in Bell County
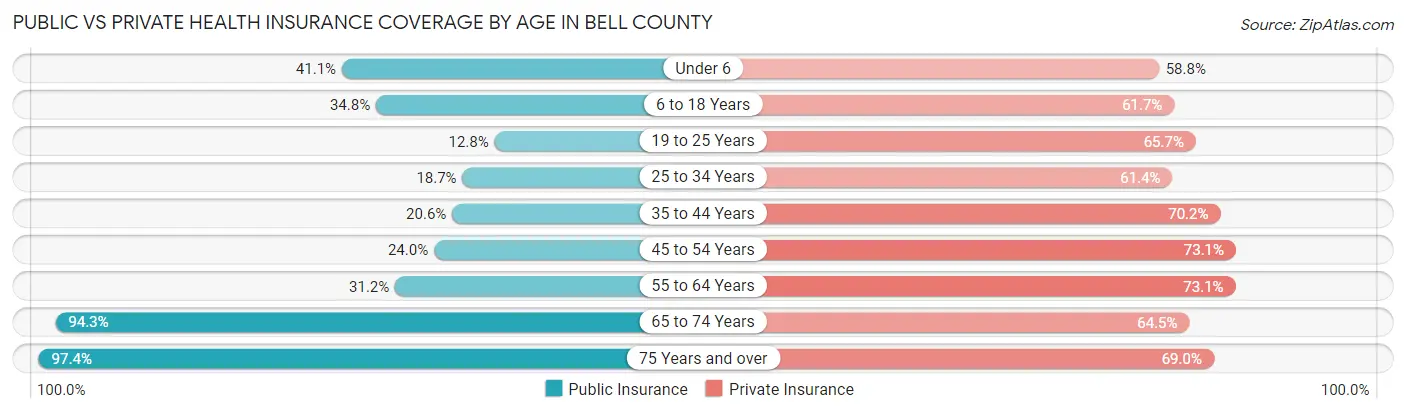
| Age Bracket | Public Insurance | Private Insurance |
| Under 6 | 14,426 (41.1%) | 20,650 (58.8%) |
| 6 to 18 Years | 25,079 (34.8%) | 44,482 (61.7%) |
| 19 to 25 Years | 4,338 (12.8%) | 22,309 (65.7%) |
| 25 to 34 Years | 8,850 (18.7%) | 28,991 (61.4%) |
| 35 to 44 Years | 9,494 (20.6%) | 32,306 (70.2%) |
| 45 to 54 Years | 9,163 (24.0%) | 27,907 (73.1%) |
| 55 to 64 Years | 11,286 (31.2%) | 26,397 (73.1%) |
| 65 to 74 Years | 23,856 (94.3%) | 16,323 (64.5%) |
| 75 Years and over | 15,027 (97.4%) | 10,652 (69.0%) |
| Total | 121,519 (34.8%) | 230,017 (65.8%) |
Disability Status by Sex by Age in Bell County

| Age Bracket | Male | Female |
| Under 5 Years | 221 (1.5%) | 191 (1.3%) |
| 5 to 17 Years | 3,705 (10.0%) | 2,428 (6.8%) |
| 18 to 34 Years | 4,429 (11.1%) | 3,964 (8.6%) |
| 35 to 64 Years | 11,105 (19.6%) | 10,010 (15.7%) |
| 65 to 74 Years | 3,889 (33.0%) | 3,595 (26.6%) |
| 75 Years and over | 3,539 (55.2%) | 4,815 (53.4%) |
Disability Class by Sex by Age in Bell County
Disability Class: Hearing Difficulty

| Age Bracket | Male | Female |
| Under 5 Years | 133 (0.9%) | 169 (1.2%) |
| 5 to 17 Years | 464 (1.3%) | 176 (0.5%) |
| 18 to 34 Years | 1,054 (2.6%) | 498 (1.1%) |
| 35 to 64 Years | 3,389 (6.0%) | 1,657 (2.6%) |
| 65 to 74 Years | 2,001 (17.0%) | 954 (7.0%) |
| 75 Years and over | 2,486 (38.8%) | 1,706 (18.9%) |
Disability Class: Vision Difficulty

| Age Bracket | Male | Female |
| Under 5 Years | 221 (1.5%) | 134 (0.9%) |
| 5 to 17 Years | 206 (0.6%) | 559 (1.6%) |
| 18 to 34 Years | 635 (1.6%) | 1,034 (2.2%) |
| 35 to 64 Years | 1,893 (3.3%) | 2,639 (4.2%) |
| 65 to 74 Years | 625 (5.3%) | 558 (4.1%) |
| 75 Years and over | 815 (12.7%) | 715 (7.9%) |
Disability Class: Cognitive Difficulty

| Age Bracket | Male | Female |
| 5 to 17 Years | 3,055 (8.2%) | 1,829 (5.1%) |
| 18 to 34 Years | 2,866 (7.2%) | 2,653 (5.8%) |
| 35 to 64 Years | 4,968 (8.8%) | 3,542 (5.6%) |
| 65 to 74 Years | 656 (5.6%) | 860 (6.4%) |
| 75 Years and over | 794 (12.4%) | 1,295 (14.4%) |
Disability Class: Ambulatory Difficulty

| Age Bracket | Male | Female |
| 5 to 17 Years | 206 (0.6%) | 404 (1.1%) |
| 18 to 34 Years | 826 (2.1%) | 653 (1.4%) |
| 35 to 64 Years | 5,084 (9.0%) | 5,386 (8.5%) |
| 65 to 74 Years | 2,121 (18.0%) | 2,557 (18.9%) |
| 75 Years and over | 2,005 (31.2%) | 3,472 (38.5%) |
Disability Class: Self-Care Difficulty

| Age Bracket | Male | Female |
| 5 to 17 Years | 726 (2.0%) | 563 (1.6%) |
| 18 to 34 Years | 394 (1.0%) | 392 (0.9%) |
| 35 to 64 Years | 2,235 (3.9%) | 1,869 (2.9%) |
| 65 to 74 Years | 395 (3.4%) | 797 (5.9%) |
| 75 Years and over | 671 (10.5%) | 1,311 (14.5%) |
Technology Access in Bell County
Computing Device Access in Bell County
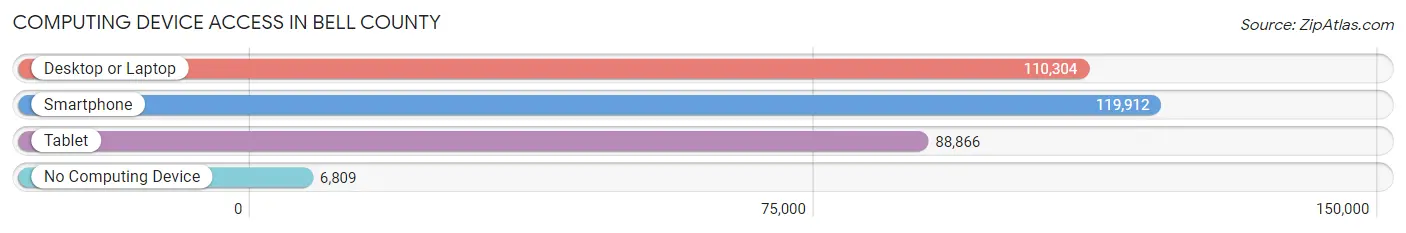
| Device Type | # Households | % Households |
| Desktop or Laptop | 110,304 | 82.0% |
| Smartphone | 119,912 | 89.2% |
| Tablet | 88,866 | 66.1% |
| No Computing Device | 6,809 | 5.1% |
| Total | 134,495 | 100.0% |
Internet Access in Bell County
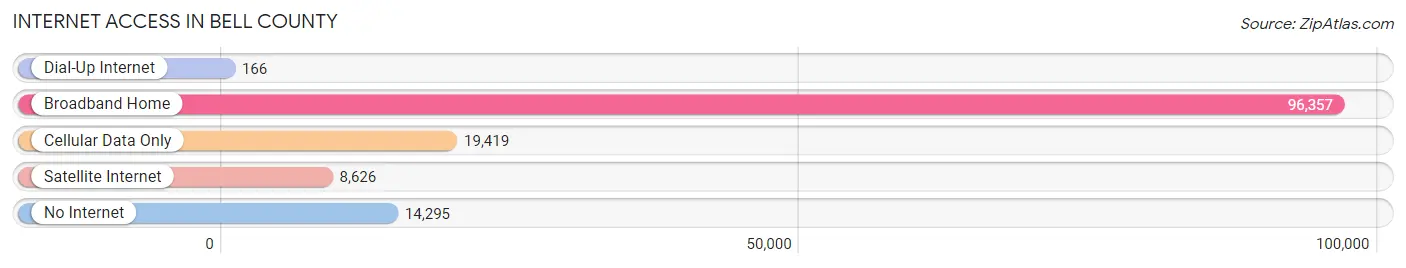
| Internet Type | # Households | % Households |
| Dial-Up Internet | 166 | 0.1% |
| Broadband Home | 96,357 | 71.6% |
| Cellular Data Only | 19,419 | 14.4% |
| Satellite Internet | 8,626 | 6.4% |
| No Internet | 14,295 | 10.6% |
| Total | 134,495 | 100.0% |
Bell County Summary
Bell County is located in Central Texas and is part of the Killeen-Temple-Fort Hood Metropolitan Statistical Area. The county is bordered by Coryell County to the north, Lampasas County to the west, Milam County to the east, and Williamson and Travis counties to the south. The county seat is Belton, and the largest city is Killeen. As of the 2010 census, the population of Bell County was 310,235, making it the 25th most populous county in Texas.
History
Bell County was created in 1850 from parts of Milam and Travis counties. It was named for Peter Hansborough Bell, the third governor of Texas. The county was originally populated by Native Americans, including the Tonkawa, Comanche, and Lipan Apache tribes. The first European settlers arrived in the area in the 1830s, and the county was organized in 1851.
The county experienced rapid growth in the late 19th and early 20th centuries, due to the arrival of the railroad and the establishment of Fort Hood in 1942. The population of the county increased from just over 10,000 in 1940 to over 100,000 by 1960.
Geography
Bell County covers an area of 1,088 square miles, making it the 33rd largest county in Texas. The county is located in Central Texas, and is part of the Killeen-Temple-Fort Hood Metropolitan Statistical Area. The county is bordered by Coryell County to the north, Lampasas County to the west, Milam County to the east, and Williamson and Travis counties to the south.
The terrain of Bell County is mostly flat, with some rolling hills in the western part of the county. The county is drained by the Leon River, which flows through the county from north to south. The county also contains several small lakes, including Stillhouse Hollow Lake, Belton Lake, and Lake Belton.
Economy
The economy of Bell County is largely driven by the military presence at Fort Hood. The base is the largest employer in the county, with over 40,000 employees. Other major employers in the county include the Killeen Independent School District, Scott & White Healthcare, and the Killeen-Temple Metropolitan Statistical Area.
The county also has a strong agricultural sector, with crops such as cotton, corn, wheat, and hay being grown in the area. The county is also home to several manufacturing companies, including the Killeen-based Bell Helicopter Textron.
Demographics
As of the 2010 census, the population of Bell County was 310,235, making it the 25th most populous county in Texas. The population was spread out, with 24.7% under the age of 18, 10.3% from 18 to 24, 28.2% from 25 to 44, 24.2% from 45 to 64, and 12.6% who were 65 years of age or older. The median age was 34.3 years.
The racial makeup of the county was 68.2% White, 19.2% Hispanic or Latino, 11.3% African American, 1.2% Native American, 1.7% Asian, 0.1% Pacific Islander, and 4.3% from two or more races. The median household income was $50,867, and the median family income was $60,817. The per capita income was $23,837.
Common Questions
What is the Total Population of Bell County?
Total Population of Bell County is 372,821.
What is the Total Male Population of Bell County?
Total Male Population of Bell County is 186,259.
What is the Total Female Population of Bell County?
Total Female Population of Bell County is 186,562.
What is the Ratio of Males per 100 Females in Bell County?
There are 99.84 Males per 100 Females in Bell County.
What is the Ratio of Females per 100 Males in Bell County?
There are 100.16 Females per 100 Males in Bell County.
What is the Median Population Age in Bell County?
Median Population Age in Bell County is 31.7 Years.
What is the Average Family Size in Bell County
Average Family Size in Bell County is 3.3 People.
What is the Average Household Size in Bell County
Average Household Size in Bell County is 2.7 People.
What is Per Capita Income in Bell County?
Per Capita income in Bell County is $31,822.
What is the Median Family Income in Bell County?
Median Family Income in Bell County is $75,314.
What is the Median Household income in Bell County?
Median Household Income in Bell County is $62,858.
What is Income or Wage Gap in Bell County?
Income or Wage Gap in Bell County is 29.8%.
Women in Bell County earn 70.2 cents for every dollar earned by a man.
What is Family Income Deficit in Bell County?
Family Income Deficit in Bell County is $11,712.
Families that are below poverty line in Bell County earn $11,712 less on average than the poverty threshold level.
What is Inequality or Gini Index in Bell County?
Inequality or Gini Index in Bell County is 0.45.
How Large is the Labor Force in Bell County?
There are 184,576 People in the Labor Forcein in Bell County.
What is the Percentage of People in the Labor Force in Bell County?
65.7% of People are in the Labor Force in Bell County.
What is the Unemployment Rate in Bell County?
Unemployment Rate in Bell County is 7.7%.