Harrison, TN
Harrison Map
Harrison Overview
8,313
TOTAL POPULATION
4,074
MALE POPULATION
4,239
FEMALE POPULATION
96.11
MALES / 100 FEMALES
104.05
FEMALES / 100 MALES
43.9
MEDIAN AGE
2.7
AVG FAMILY SIZE
2.4
AVG HOUSEHOLD SIZE
$39,146
PER CAPITA INCOME
$94,795
AVG FAMILY INCOME
$73,417
AVG HOUSEHOLD INCOME
27.9%
WAGE / INCOME GAP [ % ]
72.1¢/ $1
WAGE / INCOME GAP [ $ ]
0.37
INEQUALITY / GINI INDEX
4,830
LABOR FORCE [ PEOPLE ]
70.2%
PERCENT IN LABOR FORCE
1.8%
UNEMPLOYMENT RATE
Harrison Zip Codes
Harrison Area Codes
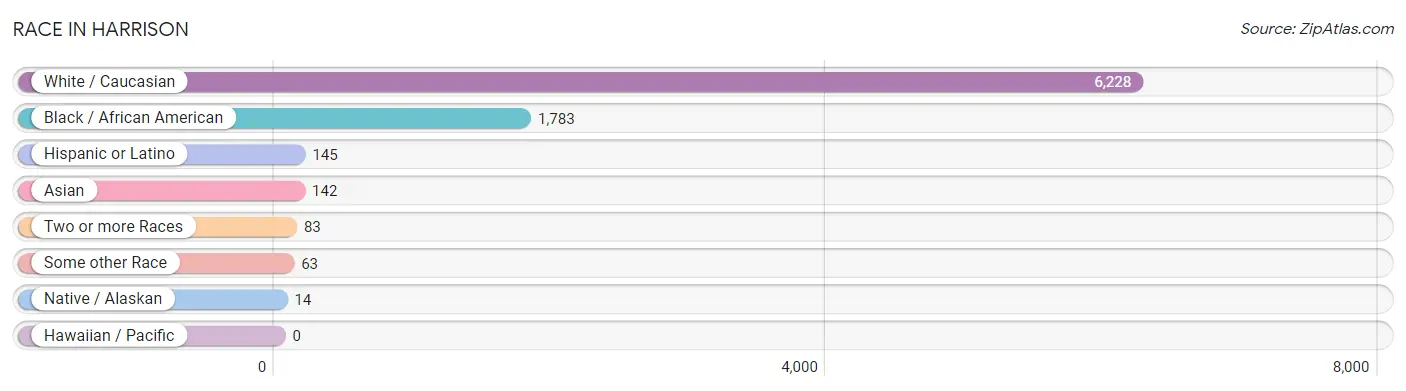
Race in Harrison
The most populous races in Harrison are White / Caucasian (6,228 | 74.9%), Black / African American (1,783 | 21.4%), and Hispanic or Latino (145 | 1.7%).
| Race | # Population | % Population |
| Asian | 142 | 1.7% |
| Black / African American | 1,783 | 21.4% |
| Hawaiian / Pacific | 0 | 0.0% |
| Hispanic or Latino | 145 | 1.7% |
| Native / Alaskan | 14 | 0.2% |
| White / Caucasian | 6,228 | 74.9% |
| Two or more Races | 83 | 1.0% |
| Some other Race | 63 | 0.8% |
| Total | 8,313 | 100.0% |
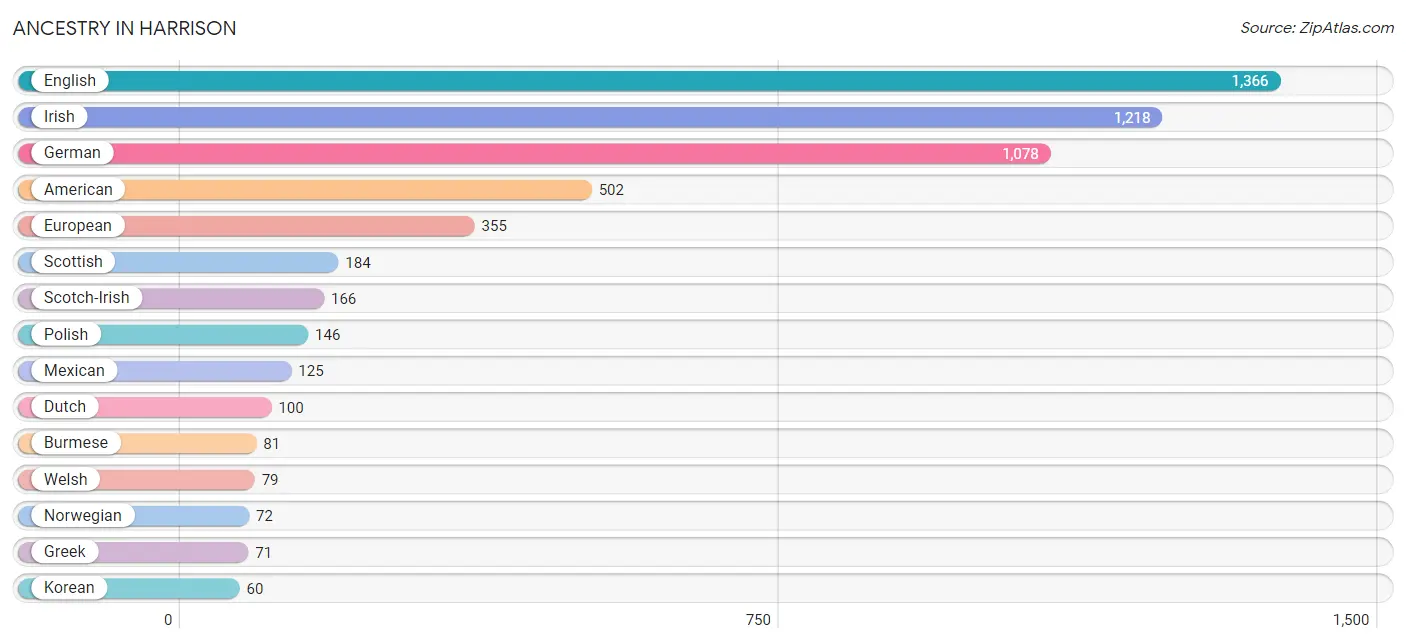
Ancestry in Harrison
The most populous ancestries reported in Harrison are English (1,366 | 16.4%), Irish (1,218 | 14.6%), German (1,078 | 13.0%), American (502 | 6.0%), and European (355 | 4.3%), together accounting for 54.4% of all Harrison residents.
| Ancestry | # Population | % Population |
| American | 502 | 6.0% |
| Arab | 40 | 0.5% |
| Burmese | 81 | 1.0% |
| Canadian | 6 | 0.1% |
| Celtic | 5 | 0.1% |
| Central American | 15 | 0.2% |
| Cherokee | 14 | 0.2% |
| Danish | 30 | 0.4% |
| Dutch | 100 | 1.2% |
| Eastern European | 22 | 0.3% |
| English | 1,366 | 16.4% |
| European | 355 | 4.3% |
| French | 58 | 0.7% |
| German | 1,078 | 13.0% |
| Greek | 71 | 0.9% |
| Irish | 1,218 | 14.6% |
| Italian | 25 | 0.3% |
| Korean | 60 | 0.7% |
| Lebanese | 23 | 0.3% |
| Mexican | 125 | 1.5% |
| Norwegian | 72 | 0.9% |
| Panamanian | 15 | 0.2% |
| Polish | 146 | 1.8% |
| Puerto Rican | 5 | 0.1% |
| Romanian | 22 | 0.3% |
| Scotch-Irish | 166 | 2.0% |
| Scottish | 184 | 2.2% |
| Sioux | 1 | 0.0% |
| Ukrainian | 55 | 0.7% |
| Welsh | 79 | 0.9% | View All 30 Rows |
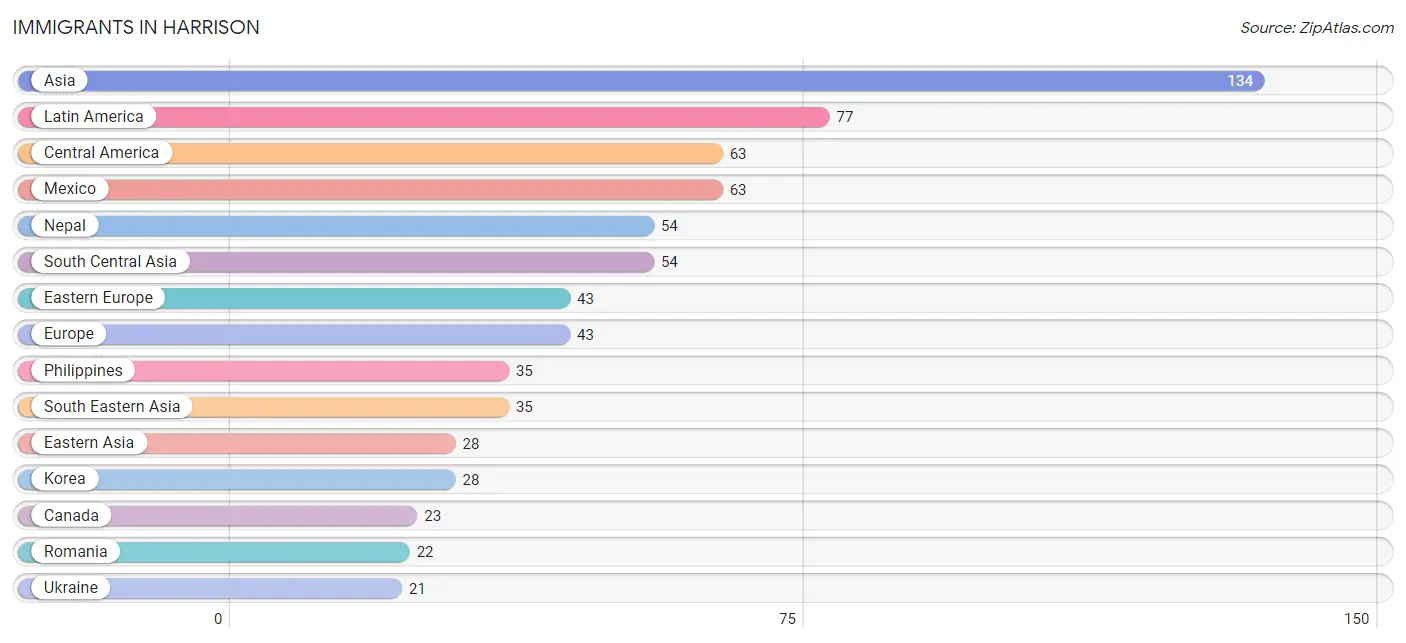
Immigrants in Harrison
The most numerous immigrant groups reported in Harrison came from Asia (134 | 1.6%), Latin America (77 | 0.9%), Central America (63 | 0.8%), Mexico (63 | 0.8%), and Nepal (54 | 0.6%), together accounting for 4.7% of all Harrison residents.
| Immigration Origin | # Population | % Population |
| Asia | 134 | 1.6% |
| Brazil | 14 | 0.2% |
| Canada | 23 | 0.3% |
| Central America | 63 | 0.8% |
| Eastern Asia | 28 | 0.3% |
| Eastern Europe | 43 | 0.5% |
| Europe | 43 | 0.5% |
| Jordan | 17 | 0.2% |
| Korea | 28 | 0.3% |
| Latin America | 77 | 0.9% |
| Mexico | 63 | 0.8% |
| Nepal | 54 | 0.6% |
| Philippines | 35 | 0.4% |
| Romania | 22 | 0.3% |
| South America | 14 | 0.2% |
| South Central Asia | 54 | 0.6% |
| South Eastern Asia | 35 | 0.4% |
| Ukraine | 21 | 0.3% |
| Western Asia | 17 | 0.2% | View All 19 Rows |
Sex and Age in Harrison
Sex and Age in Harrison
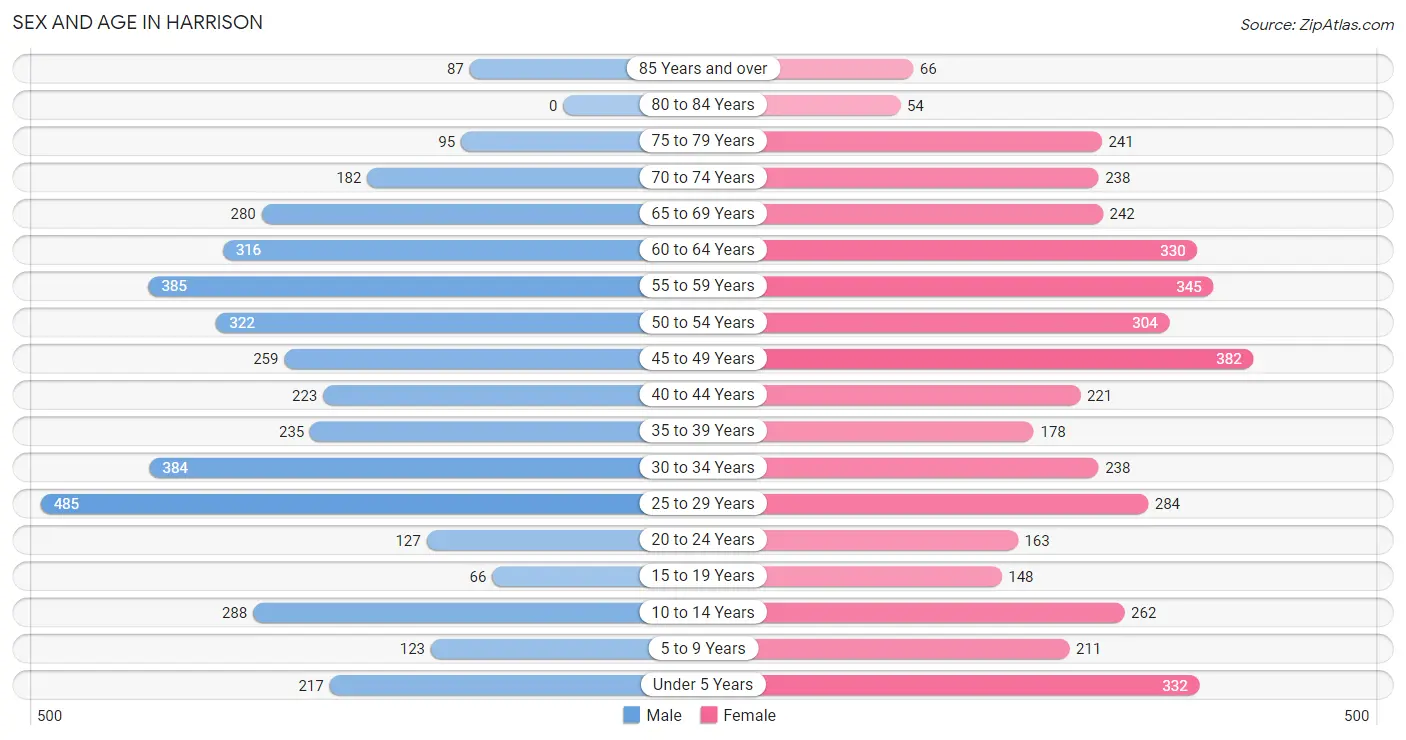
The most populous age groups in Harrison are 25 to 29 Years (485 | 11.9%) for men and 45 to 49 Years (382 | 9.0%) for women.
| Age Bracket | Male | Female |
| Under 5 Years | 217 (5.3%) | 332 (7.8%) |
| 5 to 9 Years | 123 (3.0%) | 211 (5.0%) |
| 10 to 14 Years | 288 (7.1%) | 262 (6.2%) |
| 15 to 19 Years | 66 (1.6%) | 148 (3.5%) |
| 20 to 24 Years | 127 (3.1%) | 163 (3.8%) |
| 25 to 29 Years | 485 (11.9%) | 284 (6.7%) |
| 30 to 34 Years | 384 (9.4%) | 238 (5.6%) |
| 35 to 39 Years | 235 (5.8%) | 178 (4.2%) |
| 40 to 44 Years | 223 (5.5%) | 221 (5.2%) |
| 45 to 49 Years | 259 (6.4%) | 382 (9.0%) |
| 50 to 54 Years | 322 (7.9%) | 304 (7.2%) |
| 55 to 59 Years | 385 (9.5%) | 345 (8.1%) |
| 60 to 64 Years | 316 (7.8%) | 330 (7.8%) |
| 65 to 69 Years | 280 (6.9%) | 242 (5.7%) |
| 70 to 74 Years | 182 (4.5%) | 238 (5.6%) |
| 75 to 79 Years | 95 (2.3%) | 241 (5.7%) |
| 80 to 84 Years | 0 (0.0%) | 54 (1.3%) |
| 85 Years and over | 87 (2.1%) | 66 (1.6%) |
| Total | 4,074 (100.0%) | 4,239 (100.0%) |
Families and Households in Harrison
Median Family Size in Harrison
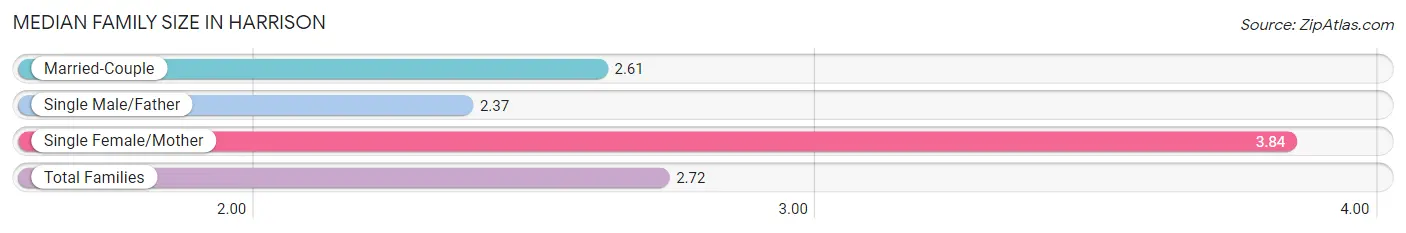
The median family size in Harrison is 2.72 persons per family, with single female/mother families (279 | 10.7%) accounting for the largest median family size of 3.84 persons per family. On the other hand, single male/father families (257 | 9.9%) represent the smallest median family size with 2.37 persons per family.
| Family Type | # Families | Family Size |
| Married-Couple | 2,064 (79.4%) | 2.61 |
| Single Male/Father | 257 (9.9%) | 2.37 |
| Single Female/Mother | 279 (10.7%) | 3.84 |
| Total Families | 2,600 (100.0%) | 2.72 |
Median Household Size in Harrison
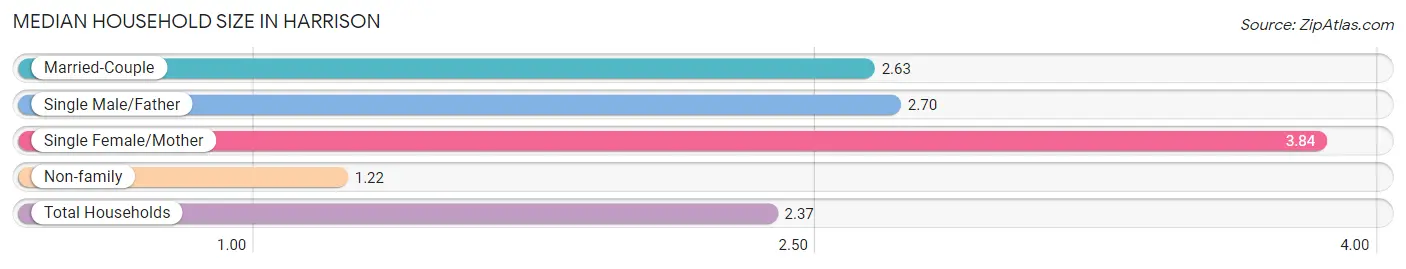
The median household size in Harrison is 2.37 persons per household, with single female/mother households (279 | 8.0%) accounting for the largest median household size of 3.84 persons per household. non-family households (908 | 25.9%) represent the smallest median household size with 1.22 persons per household.
| Household Type | # Households | Household Size |
| Married-Couple | 2,064 (58.8%) | 2.63 |
| Single Male/Father | 257 (7.3%) | 2.70 |
| Single Female/Mother | 279 (8.0%) | 3.84 |
| Non-family | 908 (25.9%) | 1.22 |
| Total Households | 3,508 (100.0%) | 2.37 |
Household Size by Marriage Status in Harrison
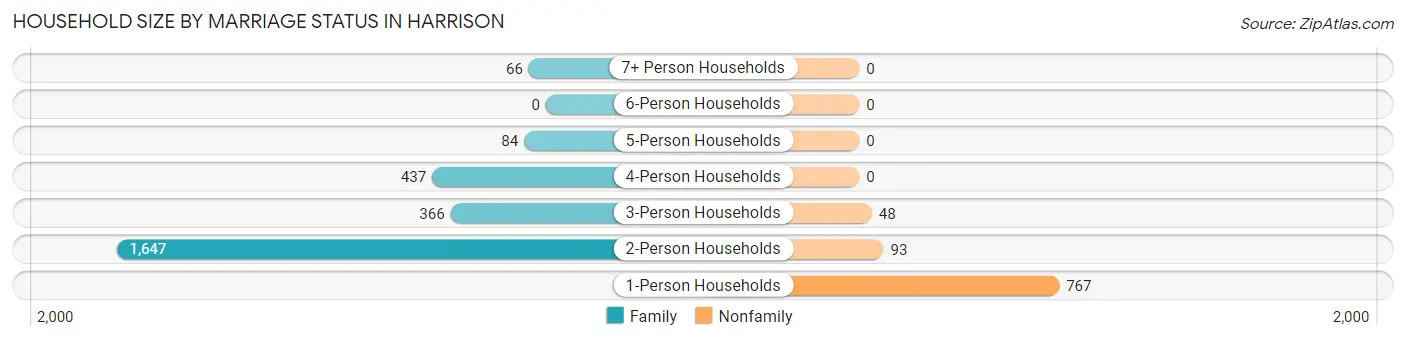
Out of a total of 3,508 households in Harrison, 2,600 (74.1%) are family households, while 908 (25.9%) are nonfamily households. The most numerous type of family households are 2-person households, comprising 1,647, and the most common type of nonfamily households are 1-person households, comprising 767.
| Household Size | Family Households | Nonfamily Households |
| 1-Person Households | - | 767 (21.9%) |
| 2-Person Households | 1,647 (46.9%) | 93 (2.6%) |
| 3-Person Households | 366 (10.4%) | 48 (1.4%) |
| 4-Person Households | 437 (12.5%) | 0 (0.0%) |
| 5-Person Households | 84 (2.4%) | 0 (0.0%) |
| 6-Person Households | 0 (0.0%) | 0 (0.0%) |
| 7+ Person Households | 66 (1.9%) | 0 (0.0%) |
| Total | 2,600 (74.1%) | 908 (25.9%) |
Female Fertility in Harrison
Fertility by Age in Harrison
Average fertility rate in Harrison is 56.0 births per 1,000 women. Women in the age bracket of 20 to 34 years have the highest fertility rate with 134.0 births per 1,000 women. Women in the age bracket of 20 to 34 years acount for 100.0% of all women with births.
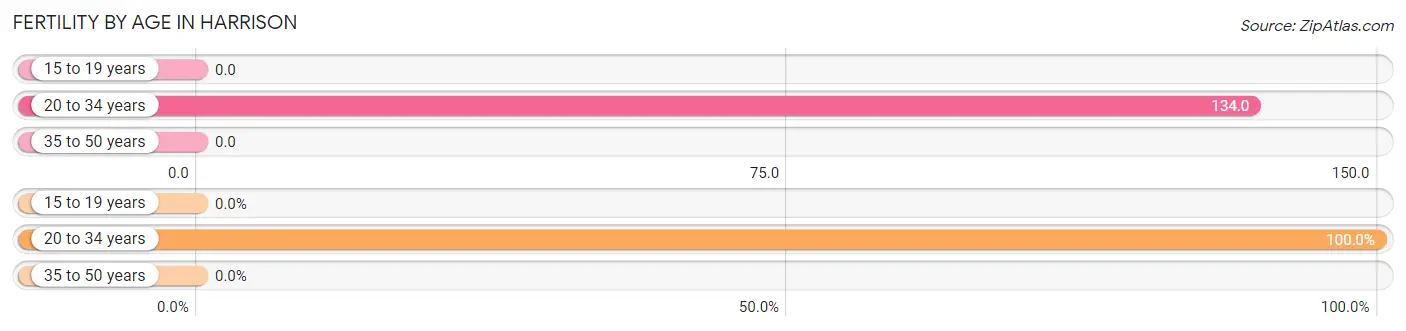
| Age Bracket | Women with Births | Births / 1,000 Women |
| 15 to 19 years | 0 (0.0%) | 0.0 |
| 20 to 34 years | 92 (100.0%) | 134.0 |
| 35 to 50 years | 0 (0.0%) | 0.0 |
| Total | 92 (100.0%) | 56.0 |
Fertility by Age by Marriage Status in Harrison
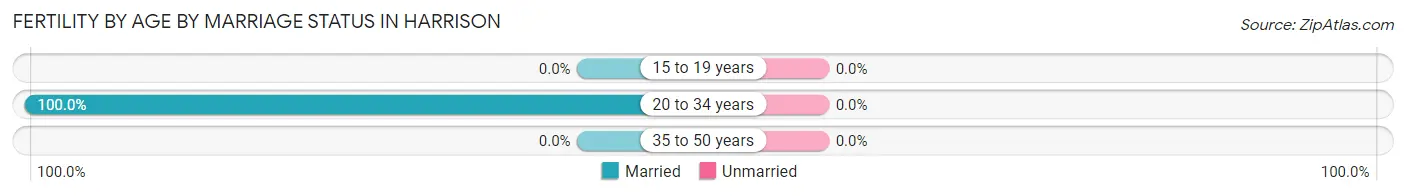
| Age Bracket | Married | Unmarried |
| 15 to 19 years | 0 (0.0%) | 0 (0.0%) |
| 20 to 34 years | 92 (100.0%) | 0 (0.0%) |
| 35 to 50 years | 0 (0.0%) | 0 (0.0%) |
| Total | 92 (100.0%) | 0 (0.0%) |
Fertility by Education in Harrison
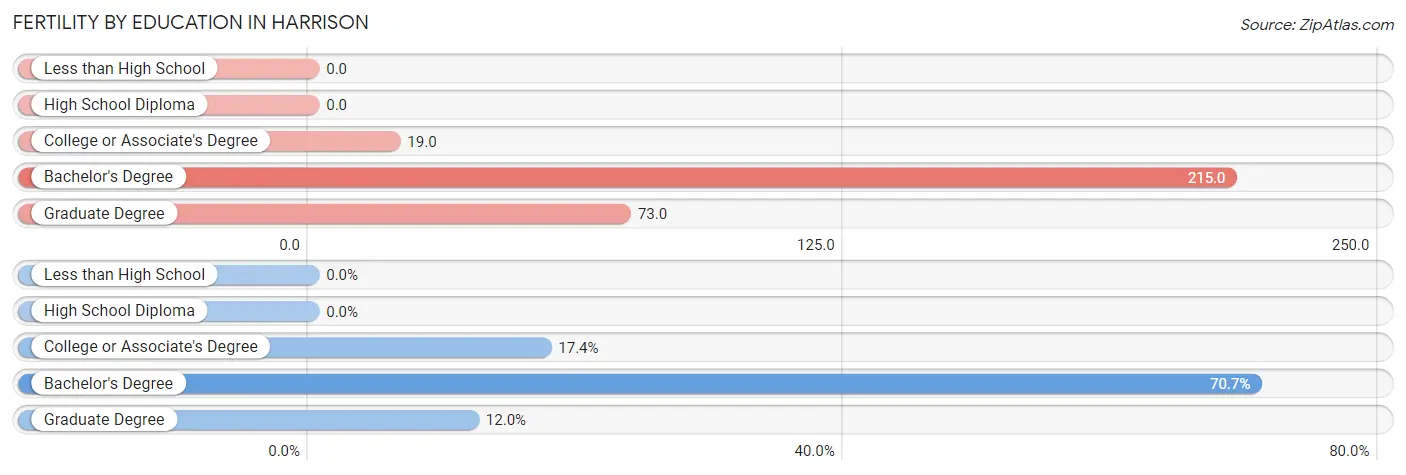
| Educational Attainment | Women with Births | Births / 1,000 Women |
| Less than High School | 0 (0.0%) | 0.0 |
| High School Diploma | 0 (0.0%) | 0.0 |
| College or Associate's Degree | 16 (17.4%) | 19.0 |
| Bachelor's Degree | 65 (70.7%) | 215.0 |
| Graduate Degree | 11 (12.0%) | 73.0 |
| Total | 92 (100.0%) | 56.0 |
Fertility by Education by Marriage Status in Harrison
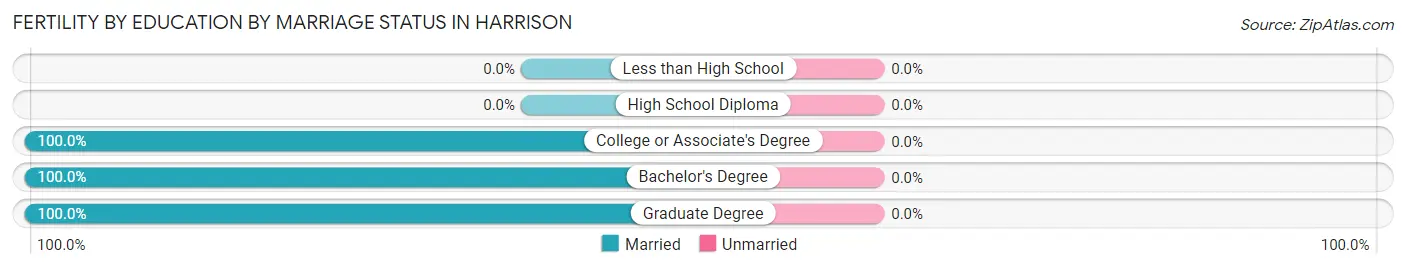
| Educational Attainment | Married | Unmarried |
| Less than High School | 0 (0.0%) | 0 (0.0%) |
| High School Diploma | 0 (0.0%) | 0 (0.0%) |
| College or Associate's Degree | 16 (100.0%) | 0 (0.0%) |
| Bachelor's Degree | 65 (100.0%) | 0 (0.0%) |
| Graduate Degree | 11 (100.0%) | 0 (0.0%) |
| Total | 92 (100.0%) | 0 (0.0%) |
Income in Harrison
Income Overview in Harrison
Per Capita Income in Harrison is $39,146, while median incomes of families and households are $94,795 and $73,417 respectively.
| Characteristic | Number | Measure |
| Per Capita Income | 8,313 | $39,146 |
| Median Family Income | 2,600 | $94,795 |
| Mean Family Income | 2,600 | $107,084 |
| Median Household Income | 3,508 | $73,417 |
| Mean Household Income | 3,508 | $91,019 |
| Income Deficit | 2,600 | $0 |
| Wage / Income Gap (%) | 8,313 | 27.86% |
| Wage / Income Gap ($) | 8,313 | 72.14¢ per $1 |
| Gini / Inequality Index | 8,313 | 0.37 |
Earnings by Sex in Harrison
Average Earnings in Harrison are $45,397, $50,636 for men and $36,528 for women, a difference of 27.9%.
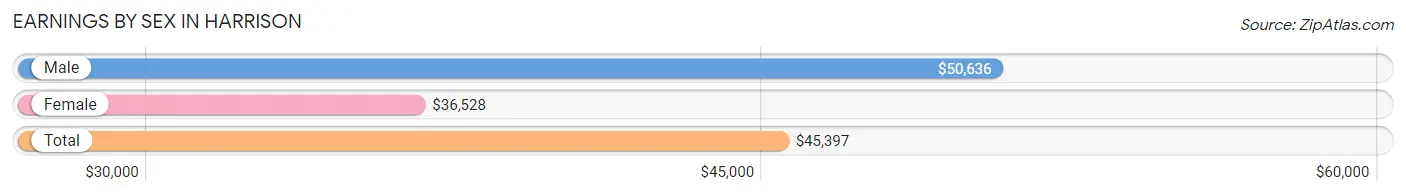
| Sex | Number | Average Earnings |
| Male | 2,778 (54.0%) | $50,636 |
| Female | 2,368 (46.0%) | $36,528 |
| Total | 5,146 (100.0%) | $45,397 |
Earnings by Sex by Income Bracket in Harrison
The most common earnings brackets in Harrison are $75,000 to $99,999 for men (468 | 16.9%) and $55,000 to $64,999 for women (286 | 12.1%).
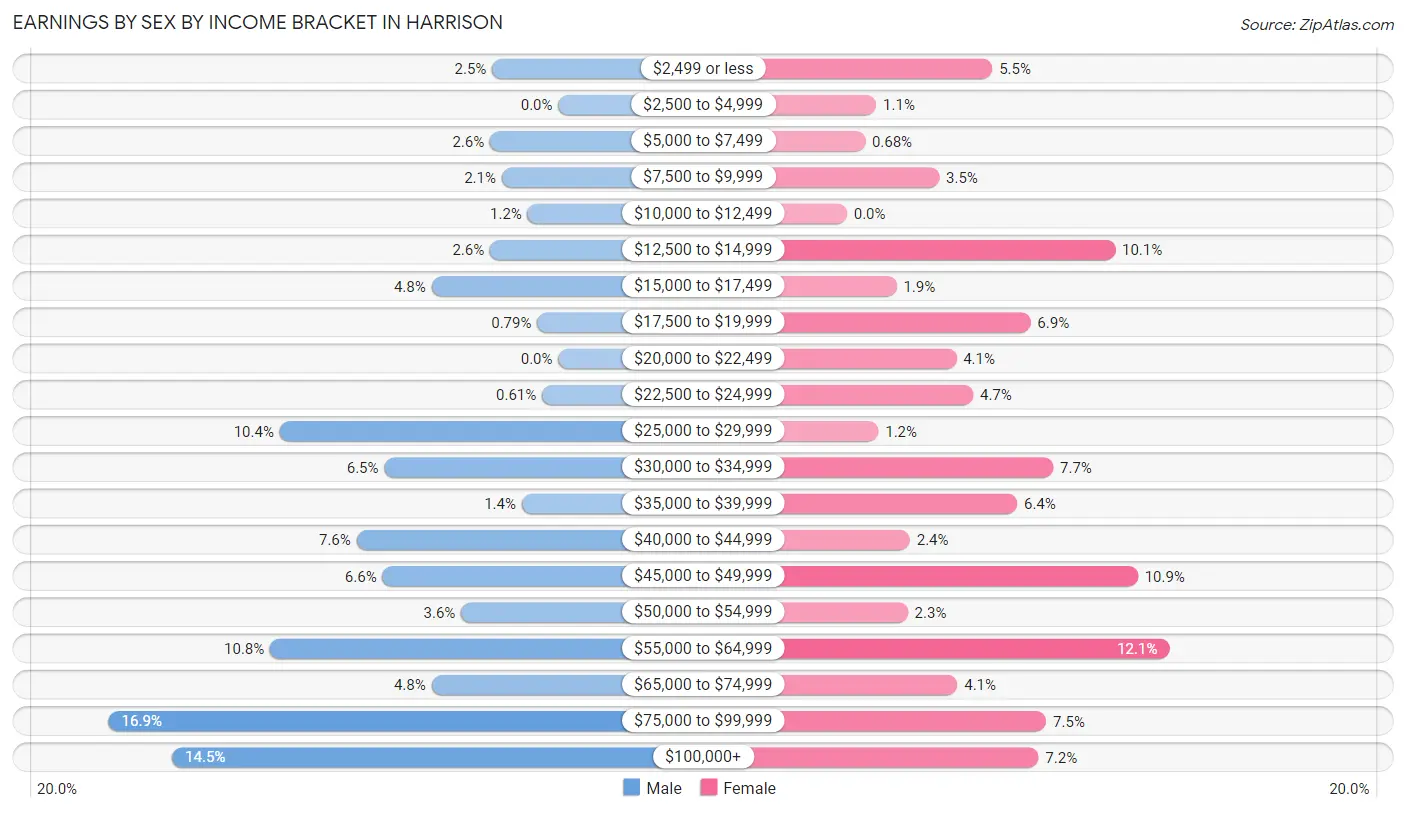
| Income | Male | Female |
| $2,499 or less | 69 (2.5%) | 129 (5.4%) |
| $2,500 to $4,999 | 0 (0.0%) | 26 (1.1%) |
| $5,000 to $7,499 | 71 (2.6%) | 16 (0.7%) |
| $7,500 to $9,999 | 59 (2.1%) | 82 (3.5%) |
| $10,000 to $12,499 | 32 (1.1%) | 0 (0.0%) |
| $12,500 to $14,999 | 71 (2.6%) | 238 (10.1%) |
| $15,000 to $17,499 | 132 (4.8%) | 44 (1.9%) |
| $17,500 to $19,999 | 22 (0.8%) | 163 (6.9%) |
| $20,000 to $22,499 | 0 (0.0%) | 97 (4.1%) |
| $22,500 to $24,999 | 17 (0.6%) | 112 (4.7%) |
| $25,000 to $29,999 | 290 (10.4%) | 28 (1.2%) |
| $30,000 to $34,999 | 181 (6.5%) | 183 (7.7%) |
| $35,000 to $39,999 | 38 (1.4%) | 151 (6.4%) |
| $40,000 to $44,999 | 210 (7.6%) | 56 (2.4%) |
| $45,000 to $49,999 | 183 (6.6%) | 258 (10.9%) |
| $50,000 to $54,999 | 101 (3.6%) | 54 (2.3%) |
| $55,000 to $64,999 | 300 (10.8%) | 286 (12.1%) |
| $65,000 to $74,999 | 132 (4.8%) | 98 (4.1%) |
| $75,000 to $99,999 | 468 (16.9%) | 177 (7.5%) |
| $100,000+ | 402 (14.5%) | 170 (7.2%) |
| Total | 2,778 (100.0%) | 2,368 (100.0%) |
Earnings by Sex by Educational Attainment in Harrison
Average earnings in Harrison are $54,728 for men and $42,098 for women, a difference of 23.1%. Men with an educational attainment of graduate degree enjoy the highest average annual earnings of $106,679, while those with college or associate's degree education earn the least with $41,721. Women with an educational attainment of graduate degree earn the most with the average annual earnings of $83,080, while those with high school diploma education have the smallest earnings of $21,705.
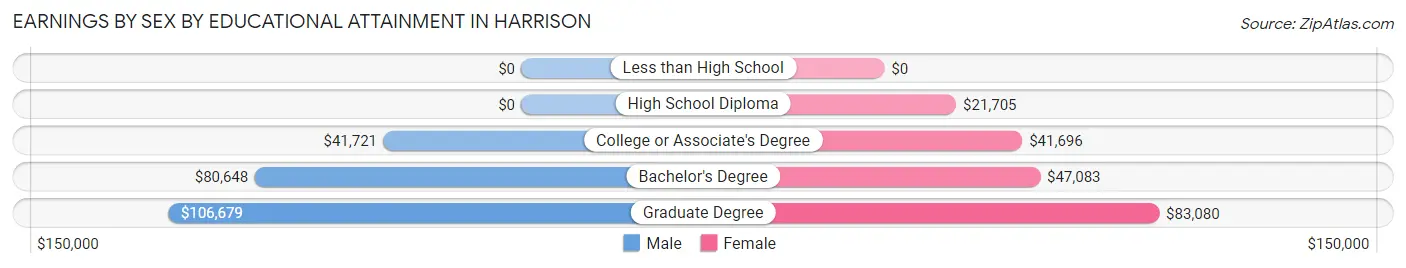
| Educational Attainment | Male Income | Female Income |
| Less than High School | - | - |
| High School Diploma | - | - |
| College or Associate's Degree | $41,721 | $41,696 |
| Bachelor's Degree | $80,648 | $47,083 |
| Graduate Degree | $106,679 | $83,080 |
| Total | $54,728 | $42,098 |
Family Income in Harrison
Family Income Brackets in Harrison
According to the Harrison family income data, there are 567 families falling into the $50,000 to $74,999 income range, which is the most common income bracket and makes up 21.8% of all families. Conversely, the $10,000 to $14,999 income bracket is the least frequent group with only 18 families (0.7%) belonging to this category.
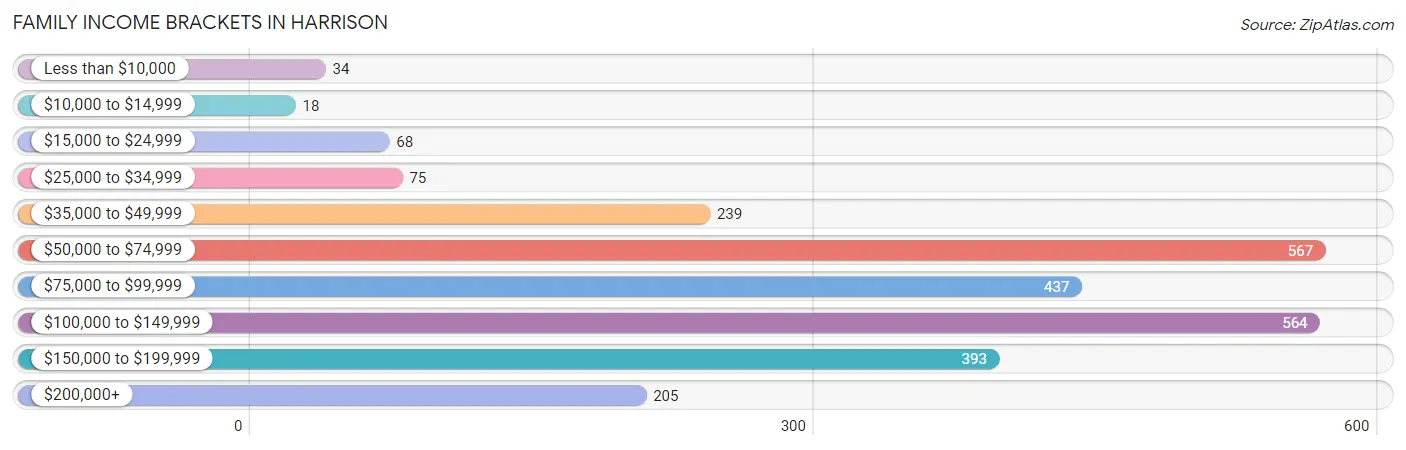
| Income Bracket | # Families | % Families |
| Less than $10,000 | 34 | 1.3% |
| $10,000 to $14,999 | 18 | 0.7% |
| $15,000 to $24,999 | 68 | 2.6% |
| $25,000 to $34,999 | 75 | 2.9% |
| $35,000 to $49,999 | 239 | 9.2% |
| $50,000 to $74,999 | 567 | 21.8% |
| $75,000 to $99,999 | 437 | 16.8% |
| $100,000 to $149,999 | 564 | 21.7% |
| $150,000 to $199,999 | 393 | 15.1% |
| $200,000+ | 205 | 7.9% |
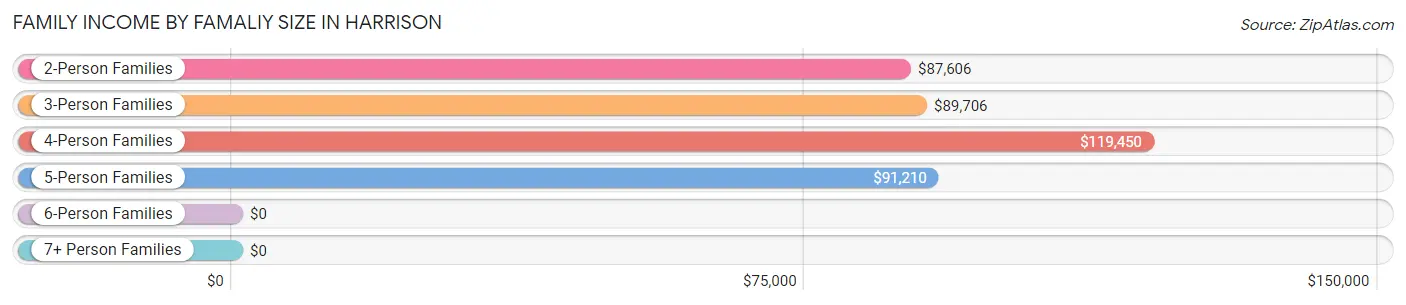
Family Income by Famaliy Size in Harrison
4-person families (365 | 14.0%) account for the highest median family income in Harrison with $119,450 per family, while 2-person families (1,705 | 65.6%) have the highest median income of $43,803 per family member.
| Income Bracket | # Families | Median Income |
| 2-Person Families | 1,705 (65.6%) | $87,606 |
| 3-Person Families | 380 (14.6%) | $89,706 |
| 4-Person Families | 365 (14.0%) | $119,450 |
| 5-Person Families | 84 (3.2%) | $91,210 |
| 6-Person Families | 0 (0.0%) | $0 |
| 7+ Person Families | 66 (2.5%) | $0 |
| Total | 2,600 (100.0%) | $94,795 |
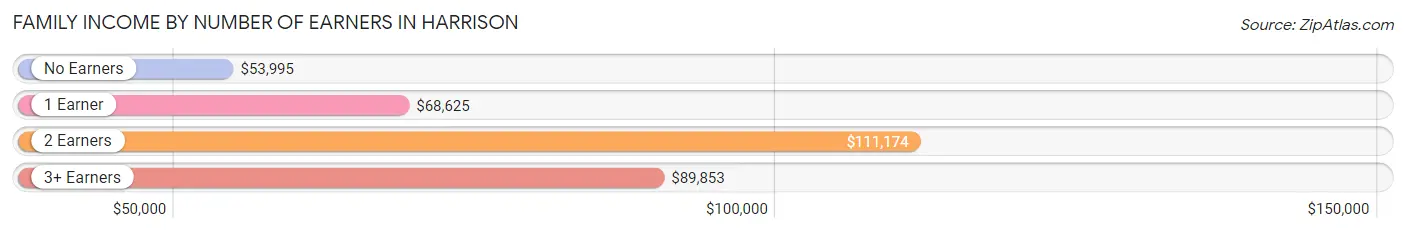
Family Income by Number of Earners in Harrison
The median family income in Harrison is $94,795, with families comprising 2 earners (1,387) having the highest median family income of $111,174, while families with no earners (299) have the lowest median family income of $53,995, accounting for 53.3% and 11.5% of families, respectively.
| Number of Earners | # Families | Median Income |
| No Earners | 299 (11.5%) | $53,995 |
| 1 Earner | 656 (25.2%) | $68,625 |
| 2 Earners | 1,387 (53.3%) | $111,174 |
| 3+ Earners | 258 (9.9%) | $89,853 |
| Total | 2,600 (100.0%) | $94,795 |
Household Income in Harrison
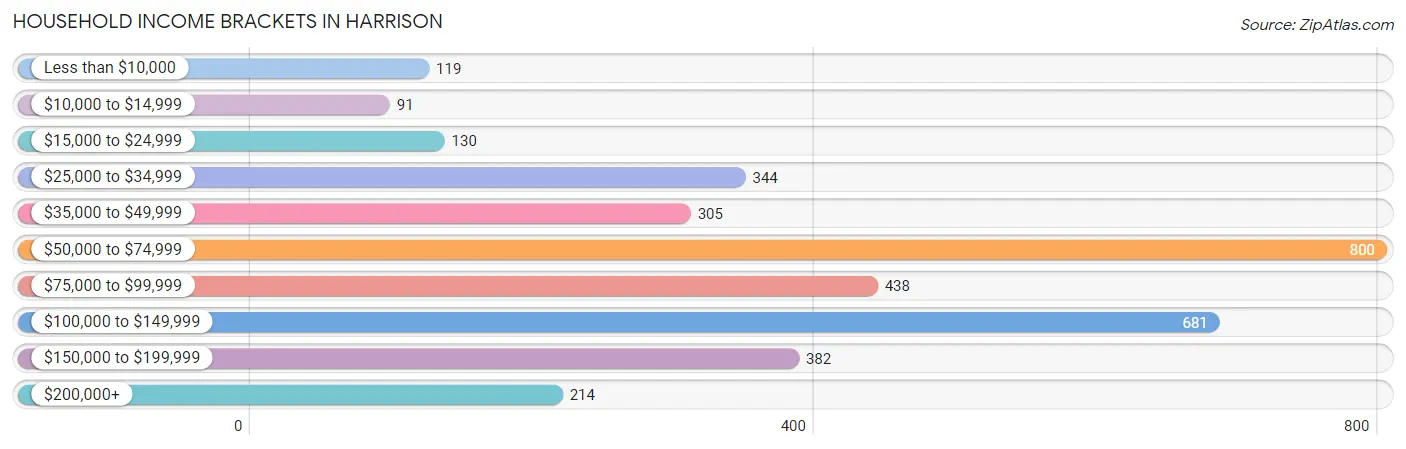
Household Income Brackets in Harrison
With 800 households falling in the category, the $50,000 to $74,999 income range is the most frequent in Harrison, accounting for 22.8% of all households. In contrast, only 91 households (2.6%) fall into the $10,000 to $14,999 income bracket, making it the least populous group.
| Income Bracket | # Households | % Households |
| Less than $10,000 | 119 | 3.4% |
| $10,000 to $14,999 | 91 | 2.6% |
| $15,000 to $24,999 | 130 | 3.7% |
| $25,000 to $34,999 | 344 | 9.8% |
| $35,000 to $49,999 | 305 | 8.7% |
| $50,000 to $74,999 | 800 | 22.8% |
| $75,000 to $99,999 | 438 | 12.5% |
| $100,000 to $149,999 | 681 | 19.4% |
| $150,000 to $199,999 | 382 | 10.9% |
| $200,000+ | 214 | 6.1% |
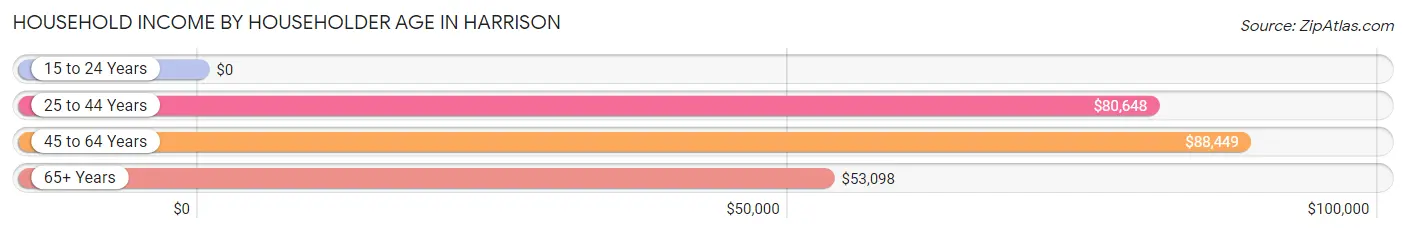
Household Income by Householder Age in Harrison
The median household income in Harrison is $73,417, with the highest median household income of $88,449 found in the 45 to 64 years age bracket for the primary householder. A total of 1,455 households (41.5%) fall into this category. Meanwhile, the 15 to 24 years age bracket for the primary householder has the lowest median household income of $0, with 31 households (0.9%) in this group.
| Income Bracket | # Households | Median Income |
| 15 to 24 Years | 31 (0.9%) | $0 |
| 25 to 44 Years | 1,108 (31.6%) | $80,648 |
| 45 to 64 Years | 1,455 (41.5%) | $88,449 |
| 65+ Years | 914 (26.1%) | $53,098 |
| Total | 3,508 (100.0%) | $73,417 |
Poverty in Harrison
Income Below Poverty by Sex and Age in Harrison
With 5.1% poverty level for males and 4.3% for females among the residents of Harrison, 55 to 64 year old males and 75 year old and over females are the most vulnerable to poverty, with 100 males (14.3%) and 80 females (22.2%) in their respective age groups living below the poverty level.
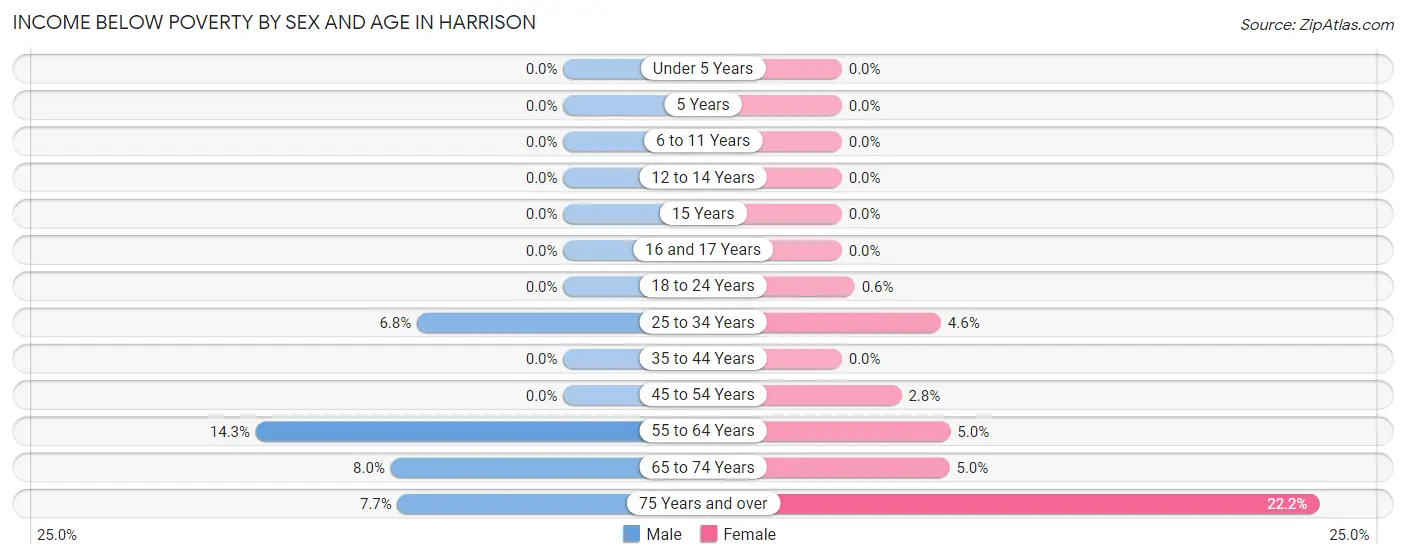
| Age Bracket | Male | Female |
| Under 5 Years | 0 (0.0%) | 0 (0.0%) |
| 5 Years | 0 (0.0%) | 0 (0.0%) |
| 6 to 11 Years | 0 (0.0%) | 0 (0.0%) |
| 12 to 14 Years | 0 (0.0%) | 0 (0.0%) |
| 15 Years | 0 (0.0%) | 0 (0.0%) |
| 16 and 17 Years | 0 (0.0%) | 0 (0.0%) |
| 18 to 24 Years | 0 (0.0%) | 1 (0.6%) |
| 25 to 34 Years | 59 (6.8%) | 24 (4.6%) |
| 35 to 44 Years | 0 (0.0%) | 0 (0.0%) |
| 45 to 54 Years | 0 (0.0%) | 19 (2.8%) |
| 55 to 64 Years | 100 (14.3%) | 34 (5.0%) |
| 65 to 74 Years | 37 (8.0%) | 24 (5.0%) |
| 75 Years and over | 14 (7.7%) | 80 (22.2%) |
| Total | 210 (5.1%) | 182 (4.3%) |
Income Above Poverty by Sex and Age in Harrison
According to the poverty statistics in Harrison, males aged under 5 years and females aged under 5 years are the age groups that are most secure financially, with 100.0% of males and 100.0% of females in these age groups living above the poverty line.
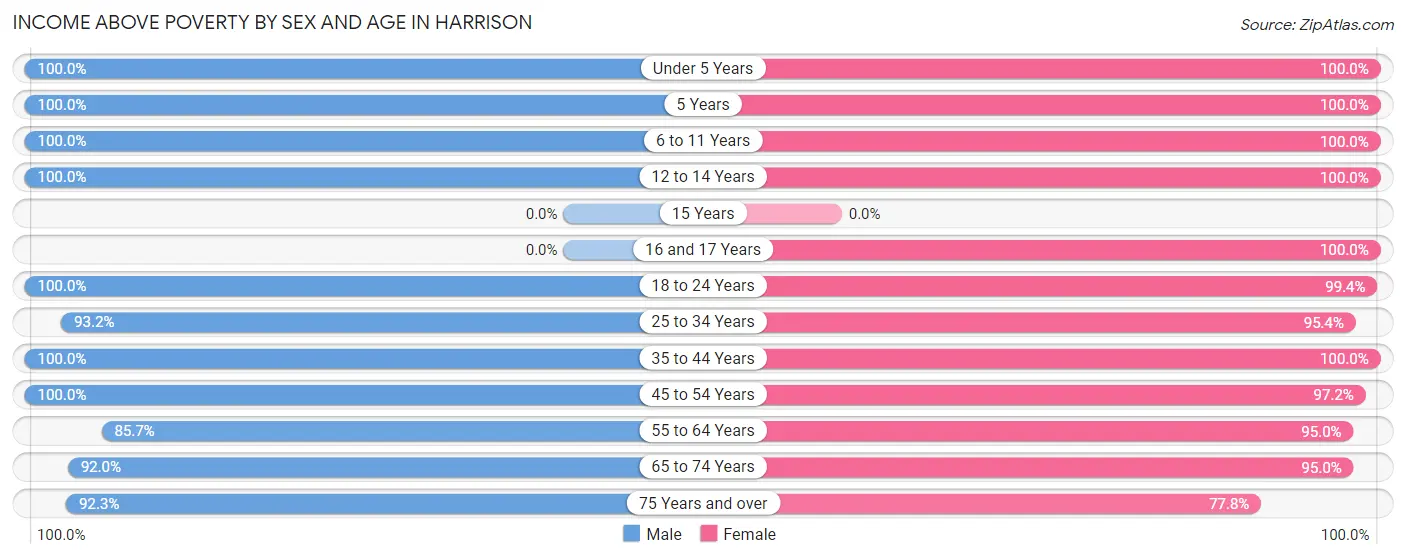
| Age Bracket | Male | Female |
| Under 5 Years | 217 (100.0%) | 332 (100.0%) |
| 5 Years | 43 (100.0%) | 21 (100.0%) |
| 6 to 11 Years | 297 (100.0%) | 328 (100.0%) |
| 12 to 14 Years | 71 (100.0%) | 124 (100.0%) |
| 15 Years | 0 (0.0%) | 0 (0.0%) |
| 16 and 17 Years | 0 (0.0%) | 143 (100.0%) |
| 18 to 24 Years | 193 (100.0%) | 167 (99.4%) |
| 25 to 34 Years | 810 (93.2%) | 498 (95.4%) |
| 35 to 44 Years | 458 (100.0%) | 399 (100.0%) |
| 45 to 54 Years | 581 (100.0%) | 667 (97.2%) |
| 55 to 64 Years | 601 (85.7%) | 641 (95.0%) |
| 65 to 74 Years | 425 (92.0%) | 456 (95.0%) |
| 75 Years and over | 168 (92.3%) | 281 (77.8%) |
| Total | 3,864 (94.9%) | 4,057 (95.7%) |
Income Below Poverty Among Married-Couple Families in Harrison
The poverty statistics for married-couple families in Harrison show that 2.9% or 59 of the total 2,064 families live below the poverty line. Families with no children have the highest poverty rate of 4.0%, comprising of 59 families. On the other hand, families with 1 or 2 children have the lowest poverty rate of 0.0%, which includes 0 families.
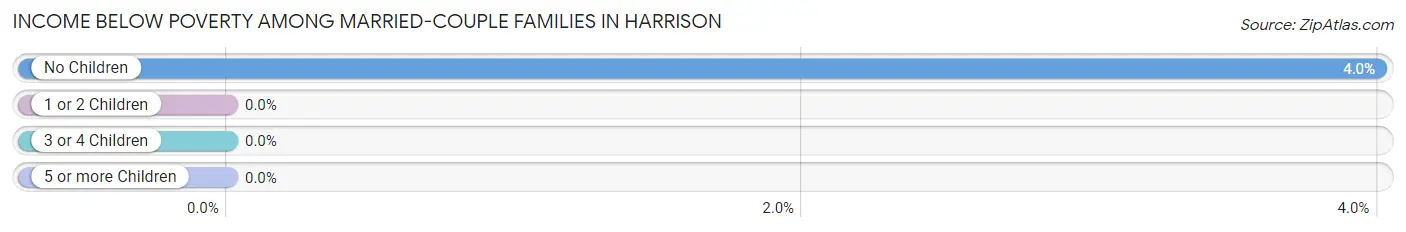
| Children | Above Poverty | Below Poverty |
| No Children | 1,416 (96.0%) | 59 (4.0%) |
| 1 or 2 Children | 529 (100.0%) | 0 (0.0%) |
| 3 or 4 Children | 60 (100.0%) | 0 (0.0%) |
| 5 or more Children | 0 (0.0%) | 0 (0.0%) |
| Total | 2,005 (97.1%) | 59 (2.9%) |
Income Below Poverty Among Single-Parent Households in Harrison
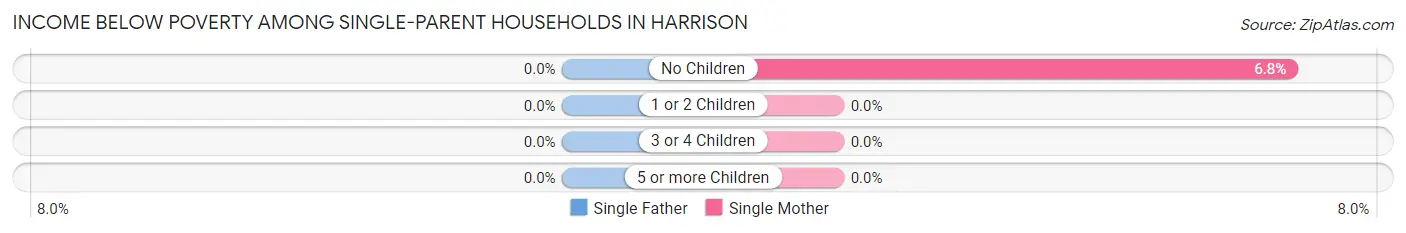
| Children | Single Father | Single Mother |
| No Children | 0 (0.0%) | 9 (6.8%) |
| 1 or 2 Children | 0 (0.0%) | 0 (0.0%) |
| 3 or 4 Children | 0 (0.0%) | 0 (0.0%) |
| 5 or more Children | 0 (0.0%) | 0 (0.0%) |
| Total | 0 (0.0%) | 9 (3.2%) |
Income Below Poverty Among Married-Couple vs Single-Parent Households in Harrison
The poverty data for Harrison shows that 59 of the married-couple family households (2.9%) and 9 of the single-parent households (1.7%) are living below the poverty level. Within the married-couple family households, those with no children have the highest poverty rate, with 59 households (4.0%) falling below the poverty line. Among the single-parent households, those with no children have the highest poverty rate, with 9 household (3.4%) living below poverty.
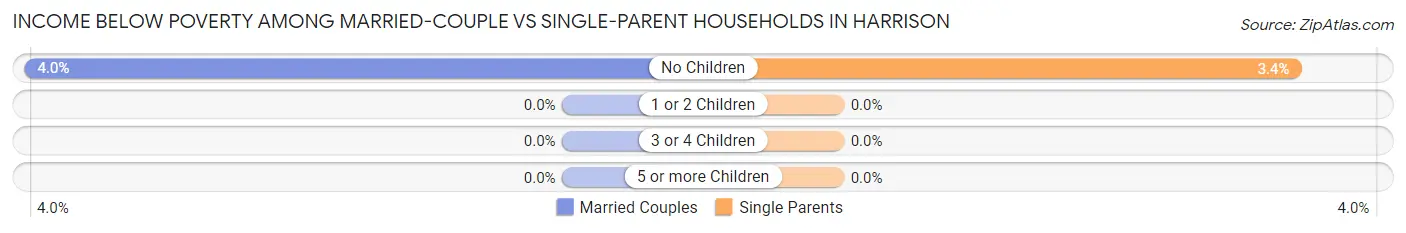
| Children | Married-Couple Families | Single-Parent Households |
| No Children | 59 (4.0%) | 9 (3.4%) |
| 1 or 2 Children | 0 (0.0%) | 0 (0.0%) |
| 3 or 4 Children | 0 (0.0%) | 0 (0.0%) |
| 5 or more Children | 0 (0.0%) | 0 (0.0%) |
| Total | 59 (2.9%) | 9 (1.7%) |
Employment Characteristics in Harrison
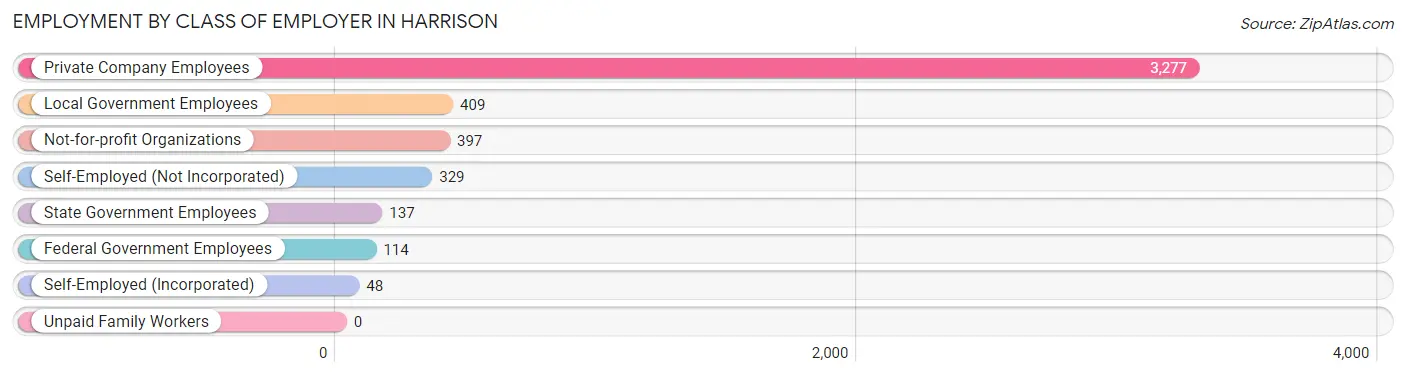
Employment by Class of Employer in Harrison
Among the 4,711 employed individuals in Harrison, private company employees (3,277 | 69.6%), local government employees (409 | 8.7%), and not-for-profit organizations (397 | 8.4%) make up the most common classes of employment.
| Employer Class | # Employees | % Employees |
| Private Company Employees | 3,277 | 69.6% |
| Self-Employed (Incorporated) | 48 | 1.0% |
| Self-Employed (Not Incorporated) | 329 | 7.0% |
| Not-for-profit Organizations | 397 | 8.4% |
| Local Government Employees | 409 | 8.7% |
| State Government Employees | 137 | 2.9% |
| Federal Government Employees | 114 | 2.4% |
| Unpaid Family Workers | 0 | 0.0% |
| Total | 4,711 | 100.0% |
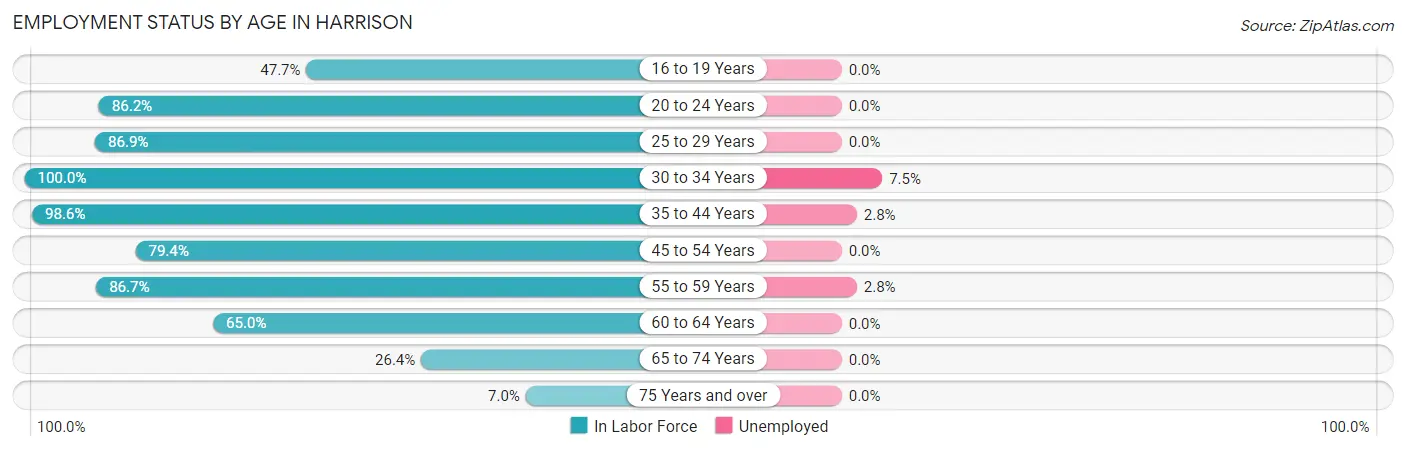
Employment Status by Age in Harrison
According to the labor force statistics for Harrison, out of the total population over 16 years of age (6,880), 70.2% or 4,830 individuals are in the labor force, with 1.8% or 87 of them unemployed. The age group with the highest labor force participation rate is 30 to 34 years, with 100.0% or 622 individuals in the labor force. Within the labor force, the 30 to 34 years age range has the highest percentage of unemployed individuals, with 7.5% or 47 of them being unemployed.
| Age Bracket | In Labor Force | Unemployed |
| 16 to 19 Years | 102 (47.7%) | 0 (0.0%) |
| 20 to 24 Years | 250 (86.2%) | 0 (0.0%) |
| 25 to 29 Years | 668 (86.9%) | 0 (0.0%) |
| 30 to 34 Years | 622 (100.0%) | 47 (7.5%) |
| 35 to 44 Years | 845 (98.6%) | 24 (2.8%) |
| 45 to 54 Years | 1,006 (79.4%) | 0 (0.0%) |
| 55 to 59 Years | 633 (86.7%) | 18 (2.8%) |
| 60 to 64 Years | 420 (65.0%) | 0 (0.0%) |
| 65 to 74 Years | 249 (26.4%) | 0 (0.0%) |
| 75 Years and over | 38 (7.0%) | 0 (0.0%) |
| Total | 4,830 (70.2%) | 87 (1.8%) |
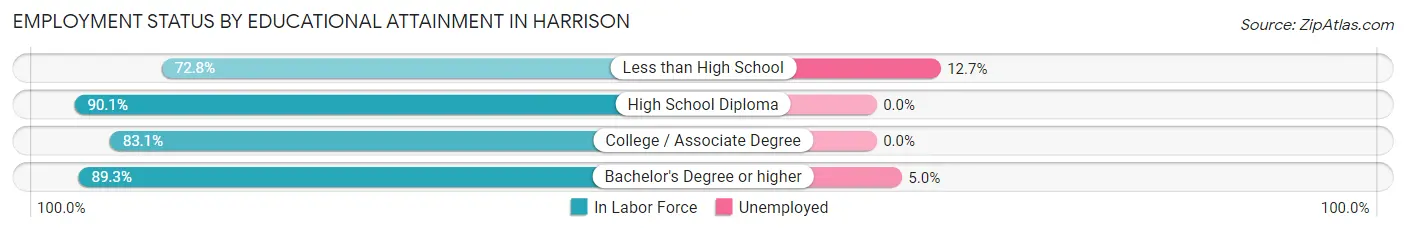
Employment Status by Educational Attainment in Harrison
According to labor force statistics for Harrison, 85.7% of individuals (4,192) out of the total population between 25 and 64 years of age (4,891) are in the labor force, with 2.1% or 88 of them being unemployed. The group with the highest labor force participation rate are those with the educational attainment of high school diploma, with 90.1% or 713 individuals in the labor force. Within the labor force, individuals with less than high school education have the highest percentage of unemployment, with 12.7% or 18 of them being unemployed.
| Educational Attainment | In Labor Force | Unemployed |
| Less than High School | 142 (72.8%) | 25 (12.7%) |
| High School Diploma | 713 (90.1%) | 0 (0.0%) |
| College / Associate Degree | 1,988 (83.1%) | 0 (0.0%) |
| Bachelor's Degree or higher | 1,351 (89.3%) | 76 (5.0%) |
| Total | 4,192 (85.7%) | 103 (2.1%) |
Employment Occupations by Sex in Harrison
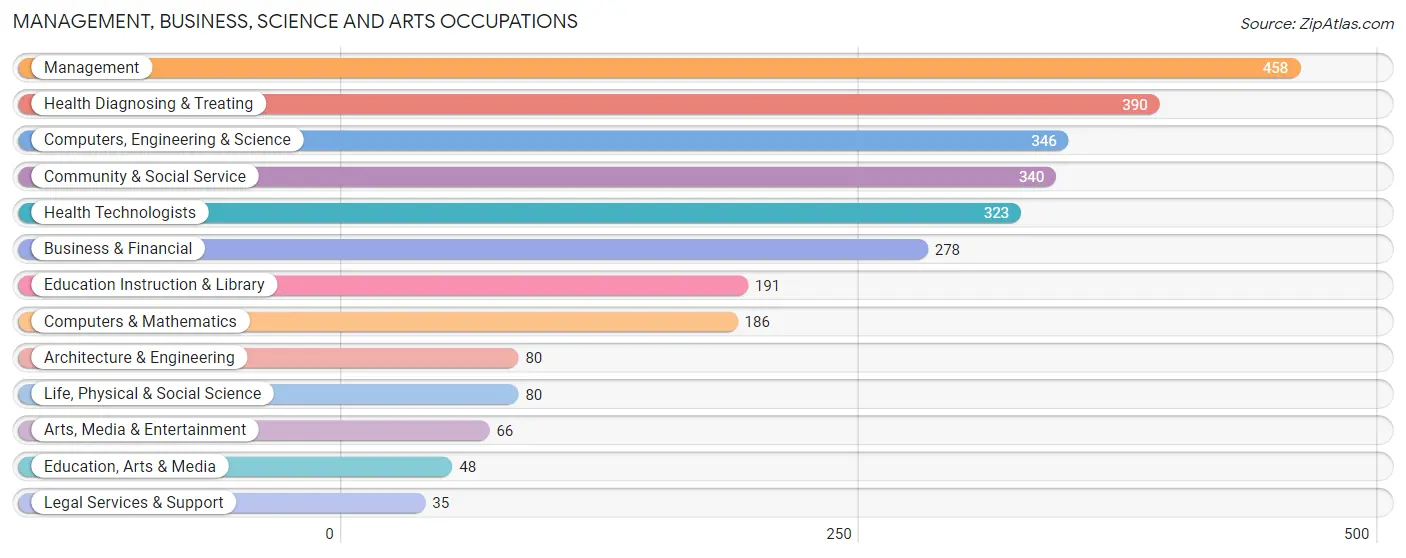
Management, Business, Science and Arts Occupations
The most common Management, Business, Science and Arts occupations in Harrison are Management (458 | 9.7%), Health Diagnosing & Treating (390 | 8.3%), Computers, Engineering & Science (346 | 7.3%), Community & Social Service (340 | 7.2%), and Health Technologists (323 | 6.9%).
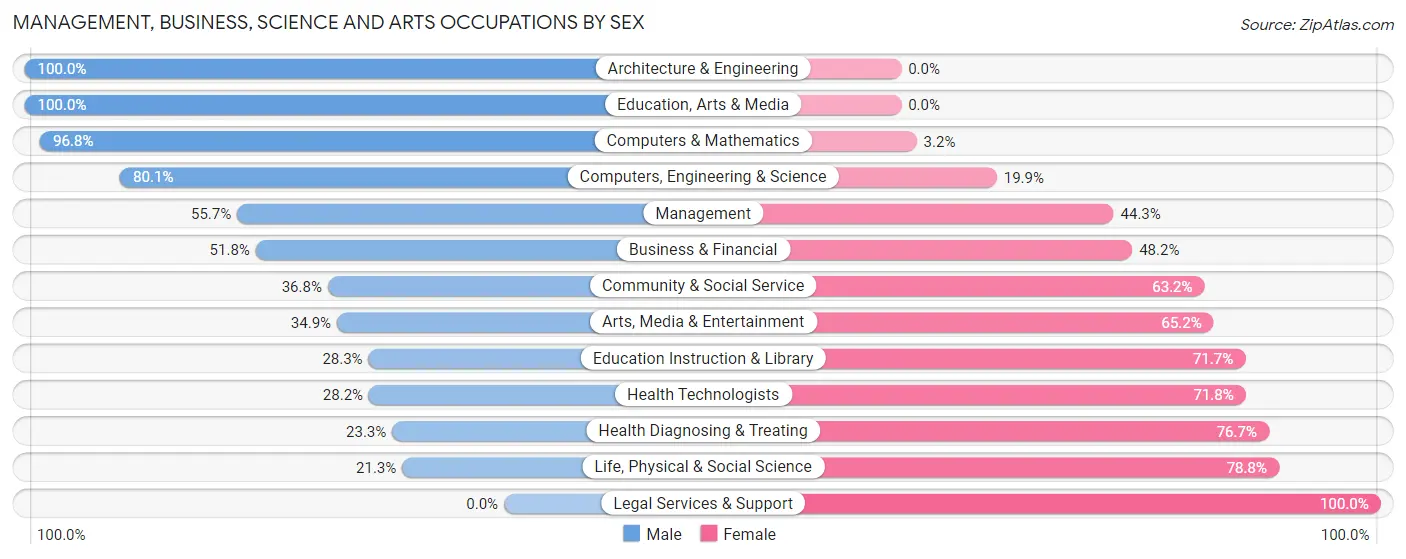
Management, Business, Science and Arts Occupations by Sex
Within the Management, Business, Science and Arts occupations in Harrison, the most male-oriented occupations are Architecture & Engineering (100.0%), Education, Arts & Media (100.0%), and Computers & Mathematics (96.8%), while the most female-oriented occupations are Legal Services & Support (100.0%), Life, Physical & Social Science (78.7%), and Health Diagnosing & Treating (76.7%).
| Occupation | Male | Female |
| Management | 255 (55.7%) | 203 (44.3%) |
| Business & Financial | 144 (51.8%) | 134 (48.2%) |
| Computers, Engineering & Science | 277 (80.1%) | 69 (19.9%) |
| Computers & Mathematics | 180 (96.8%) | 6 (3.2%) |
| Architecture & Engineering | 80 (100.0%) | 0 (0.0%) |
| Life, Physical & Social Science | 17 (21.2%) | 63 (78.7%) |
| Community & Social Service | 125 (36.8%) | 215 (63.2%) |
| Education, Arts & Media | 48 (100.0%) | 0 (0.0%) |
| Legal Services & Support | 0 (0.0%) | 35 (100.0%) |
| Education Instruction & Library | 54 (28.3%) | 137 (71.7%) |
| Arts, Media & Entertainment | 23 (34.8%) | 43 (65.1%) |
| Health Diagnosing & Treating | 91 (23.3%) | 299 (76.7%) |
| Health Technologists | 91 (28.2%) | 232 (71.8%) |
| Total (Category) | 892 (49.2%) | 920 (50.8%) |
| Total (Overall) | 2,655 (56.3%) | 2,060 (43.7%) |
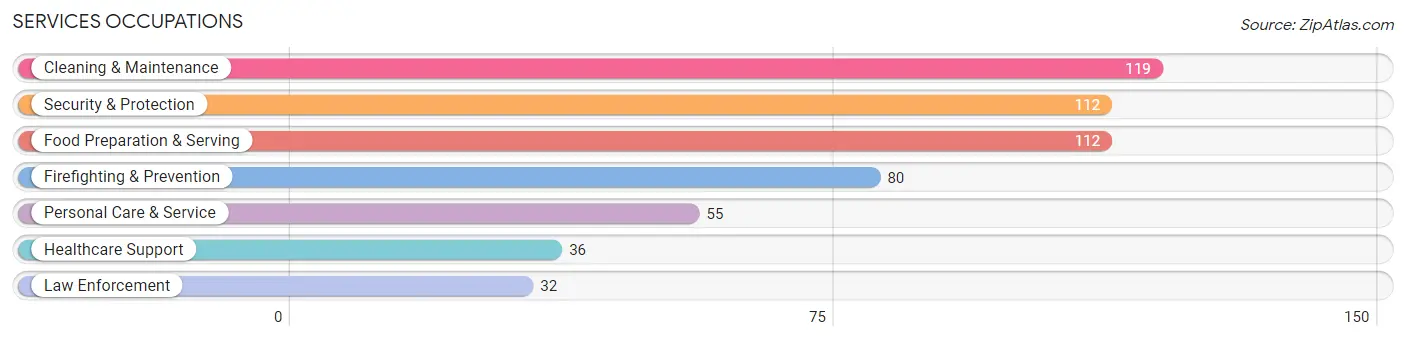
Services Occupations
The most common Services occupations in Harrison are Cleaning & Maintenance (119 | 2.5%), Security & Protection (112 | 2.4%), Food Preparation & Serving (112 | 2.4%), Firefighting & Prevention (80 | 1.7%), and Personal Care & Service (55 | 1.2%).
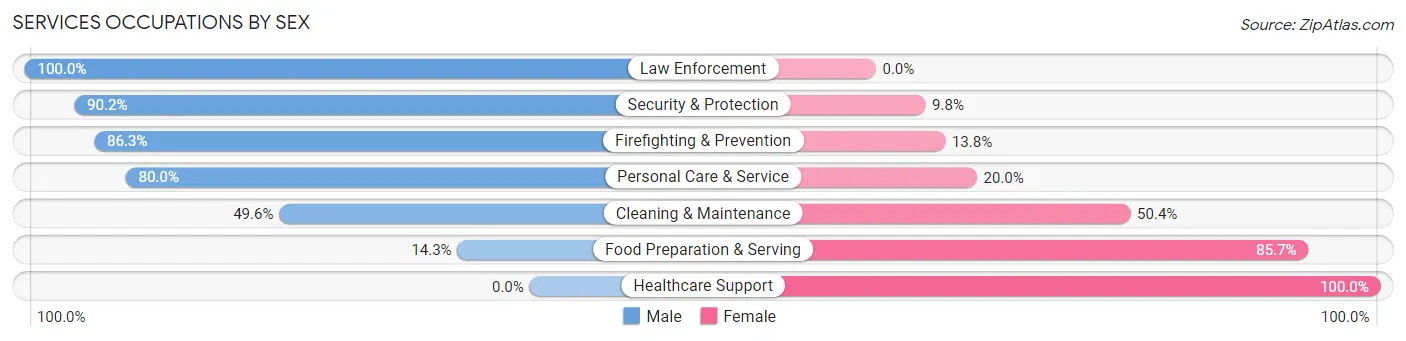
Services Occupations by Sex
Within the Services occupations in Harrison, the most male-oriented occupations are Law Enforcement (100.0%), Security & Protection (90.2%), and Firefighting & Prevention (86.3%), while the most female-oriented occupations are Healthcare Support (100.0%), Food Preparation & Serving (85.7%), and Cleaning & Maintenance (50.4%).
| Occupation | Male | Female |
| Healthcare Support | 0 (0.0%) | 36 (100.0%) |
| Security & Protection | 101 (90.2%) | 11 (9.8%) |
| Firefighting & Prevention | 69 (86.3%) | 11 (13.8%) |
| Law Enforcement | 32 (100.0%) | 0 (0.0%) |
| Food Preparation & Serving | 16 (14.3%) | 96 (85.7%) |
| Cleaning & Maintenance | 59 (49.6%) | 60 (50.4%) |
| Personal Care & Service | 44 (80.0%) | 11 (20.0%) |
| Total (Category) | 220 (50.7%) | 214 (49.3%) |
| Total (Overall) | 2,655 (56.3%) | 2,060 (43.7%) |
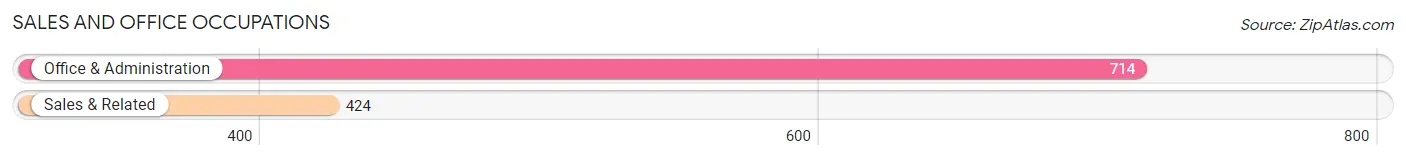
Sales and Office Occupations
The most common Sales and Office occupations in Harrison are Office & Administration (714 | 15.1%), and Sales & Related (424 | 9.0%).
Sales and Office Occupations by Sex
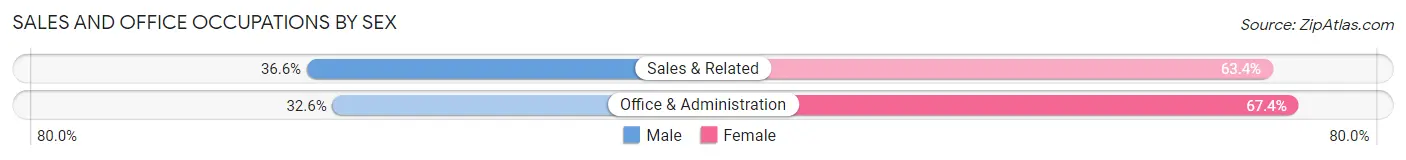
| Occupation | Male | Female |
| Sales & Related | 155 (36.6%) | 269 (63.4%) |
| Office & Administration | 233 (32.6%) | 481 (67.4%) |
| Total (Category) | 388 (34.1%) | 750 (65.9%) |
| Total (Overall) | 2,655 (56.3%) | 2,060 (43.7%) |
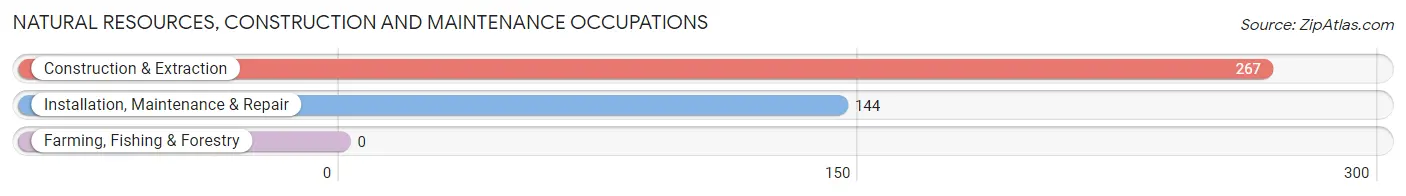
Natural Resources, Construction and Maintenance Occupations
The most common Natural Resources, Construction and Maintenance occupations in Harrison are Construction & Extraction (267 | 5.7%), and Installation, Maintenance & Repair (144 | 3.0%).
Natural Resources, Construction and Maintenance Occupations by Sex
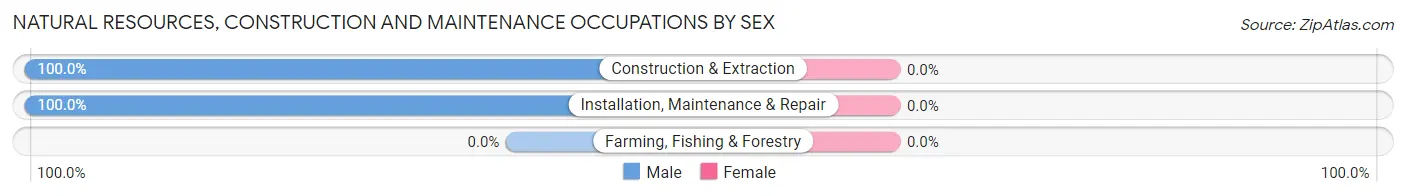
| Occupation | Male | Female |
| Farming, Fishing & Forestry | 0 (0.0%) | 0 (0.0%) |
| Construction & Extraction | 267 (100.0%) | 0 (0.0%) |
| Installation, Maintenance & Repair | 144 (100.0%) | 0 (0.0%) |
| Total (Category) | 411 (100.0%) | 0 (0.0%) |
| Total (Overall) | 2,655 (56.3%) | 2,060 (43.7%) |
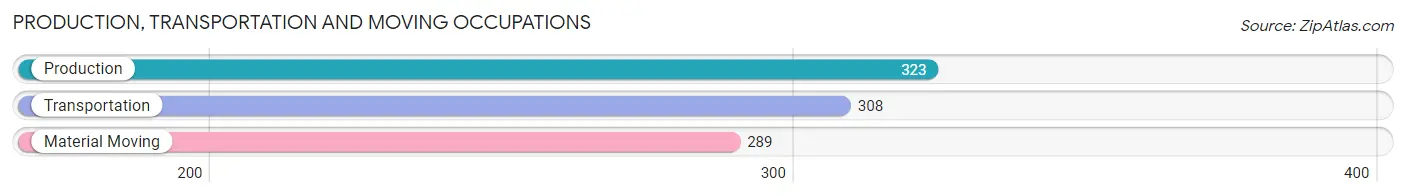
Production, Transportation and Moving Occupations
The most common Production, Transportation and Moving occupations in Harrison are Production (323 | 6.9%), Transportation (308 | 6.5%), and Material Moving (289 | 6.1%).
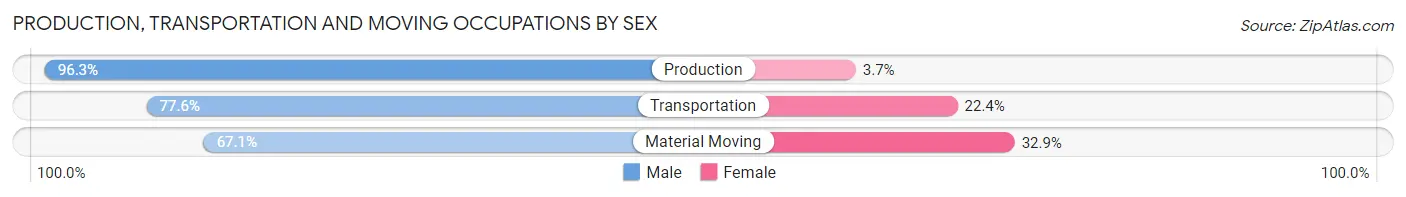
Production, Transportation and Moving Occupations by Sex
| Occupation | Male | Female |
| Production | 311 (96.3%) | 12 (3.7%) |
| Transportation | 239 (77.6%) | 69 (22.4%) |
| Material Moving | 194 (67.1%) | 95 (32.9%) |
| Total (Category) | 744 (80.9%) | 176 (19.1%) |
| Total (Overall) | 2,655 (56.3%) | 2,060 (43.7%) |
Employment Industries by Sex in Harrison
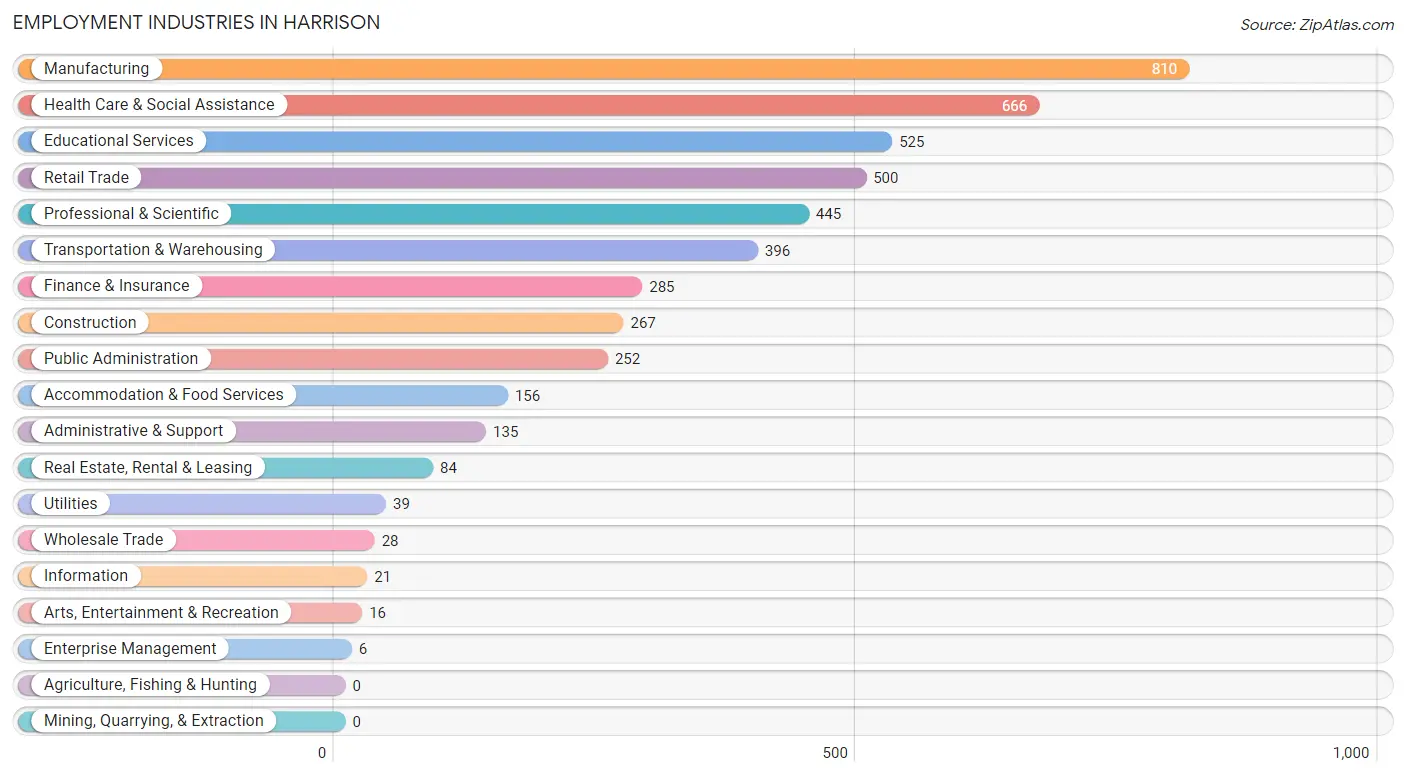
Employment Industries in Harrison
The major employment industries in Harrison include Manufacturing (810 | 17.2%), Health Care & Social Assistance (666 | 14.1%), Educational Services (525 | 11.1%), Retail Trade (500 | 10.6%), and Professional & Scientific (445 | 9.4%).
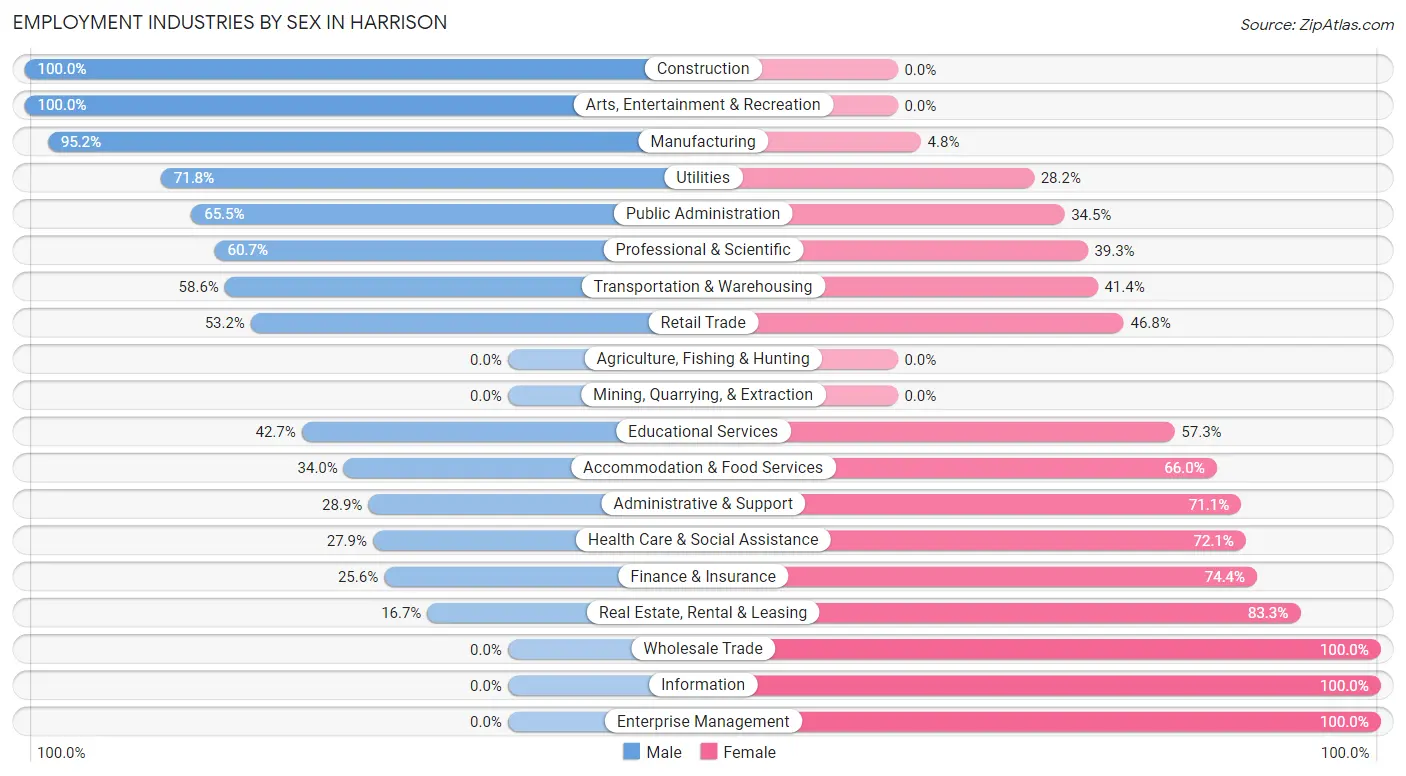
Employment Industries by Sex in Harrison
The Harrison industries that see more men than women are Construction (100.0%), Arts, Entertainment & Recreation (100.0%), and Manufacturing (95.2%), whereas the industries that tend to have a higher number of women are Wholesale Trade (100.0%), Information (100.0%), and Enterprise Management (100.0%).
| Industry | Male | Female |
| Agriculture, Fishing & Hunting | 0 (0.0%) | 0 (0.0%) |
| Mining, Quarrying, & Extraction | 0 (0.0%) | 0 (0.0%) |
| Construction | 267 (100.0%) | 0 (0.0%) |
| Manufacturing | 771 (95.2%) | 39 (4.8%) |
| Wholesale Trade | 0 (0.0%) | 28 (100.0%) |
| Retail Trade | 266 (53.2%) | 234 (46.8%) |
| Transportation & Warehousing | 232 (58.6%) | 164 (41.4%) |
| Utilities | 28 (71.8%) | 11 (28.2%) |
| Information | 0 (0.0%) | 21 (100.0%) |
| Finance & Insurance | 73 (25.6%) | 212 (74.4%) |
| Real Estate, Rental & Leasing | 14 (16.7%) | 70 (83.3%) |
| Professional & Scientific | 270 (60.7%) | 175 (39.3%) |
| Enterprise Management | 0 (0.0%) | 6 (100.0%) |
| Administrative & Support | 39 (28.9%) | 96 (71.1%) |
| Educational Services | 224 (42.7%) | 301 (57.3%) |
| Health Care & Social Assistance | 186 (27.9%) | 480 (72.1%) |
| Arts, Entertainment & Recreation | 16 (100.0%) | 0 (0.0%) |
| Accommodation & Food Services | 53 (34.0%) | 103 (66.0%) |
| Public Administration | 165 (65.5%) | 87 (34.5%) |
| Total | 2,655 (56.3%) | 2,060 (43.7%) |
Education in Harrison
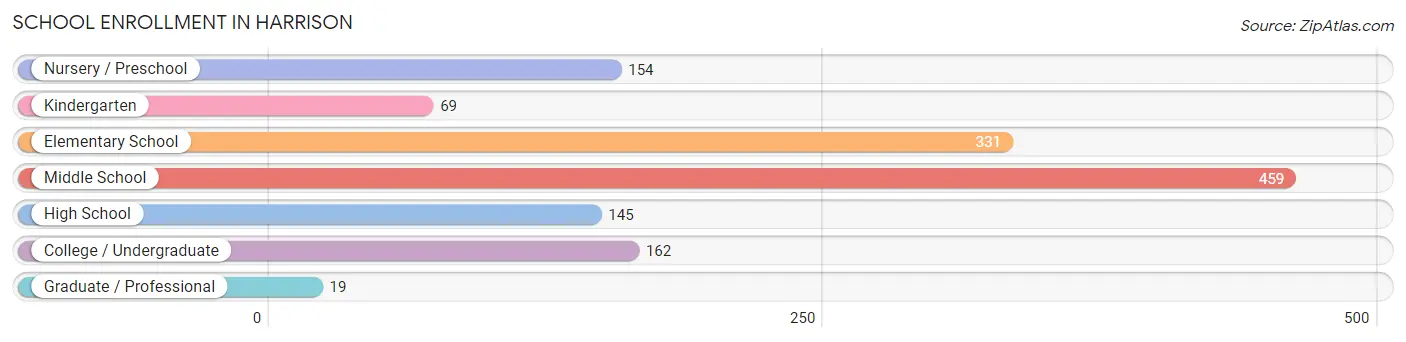
School Enrollment in Harrison
The most common levels of schooling among the 1,339 students in Harrison are middle school (459 | 34.3%), elementary school (331 | 24.7%), and college / undergraduate (162 | 12.1%).
| School Level | # Students | % Students |
| Nursery / Preschool | 154 | 11.5% |
| Kindergarten | 69 | 5.1% |
| Elementary School | 331 | 24.7% |
| Middle School | 459 | 34.3% |
| High School | 145 | 10.8% |
| College / Undergraduate | 162 | 12.1% |
| Graduate / Professional | 19 | 1.4% |
| Total | 1,339 | 100.0% |
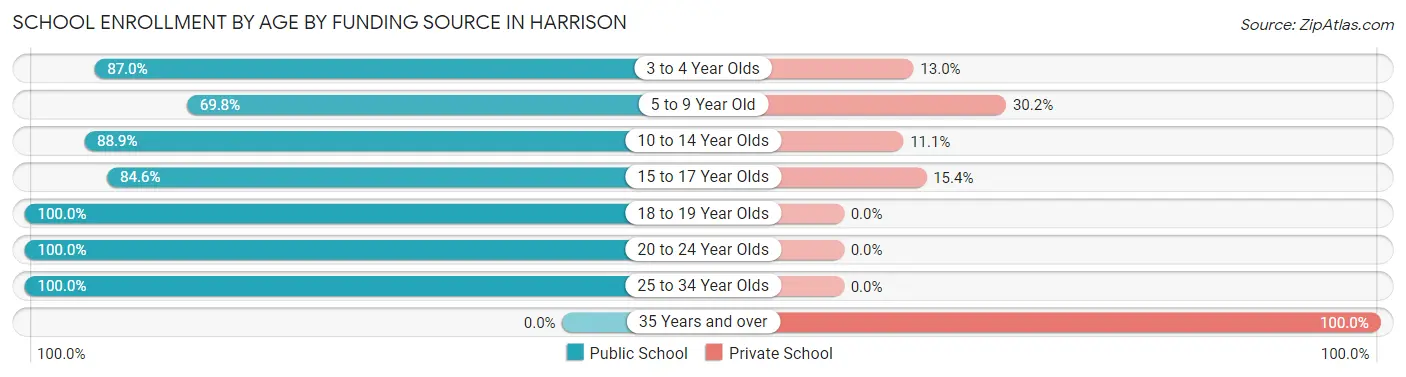
School Enrollment by Age by Funding Source in Harrison
Out of a total of 1,339 students who are enrolled in schools in Harrison, 230 (17.2%) attend a private institution, while the remaining 1,109 (82.8%) are enrolled in public schools. The age group of 35 years and over has the highest likelihood of being enrolled in private schools, with 33 (100.0% in the age bracket) enrolled. Conversely, the age group of 18 to 19 year olds has the lowest likelihood of being enrolled in a private school, with 42 (100.0% in the age bracket) attending a public institution.
| Age Bracket | Public School | Private School |
| 3 to 4 Year Olds | 134 (87.0%) | 20 (13.0%) |
| 5 to 9 Year Old | 217 (69.8%) | 94 (30.2%) |
| 10 to 14 Year Olds | 489 (88.9%) | 61 (11.1%) |
| 15 to 17 Year Olds | 121 (84.6%) | 22 (15.4%) |
| 18 to 19 Year Olds | 42 (100.0%) | 0 (0.0%) |
| 20 to 24 Year Olds | 53 (100.0%) | 0 (0.0%) |
| 25 to 34 Year Olds | 53 (100.0%) | 0 (0.0%) |
| 35 Years and over | 0 (0.0%) | 33 (100.0%) |
| Total | 1,109 (82.8%) | 230 (17.2%) |
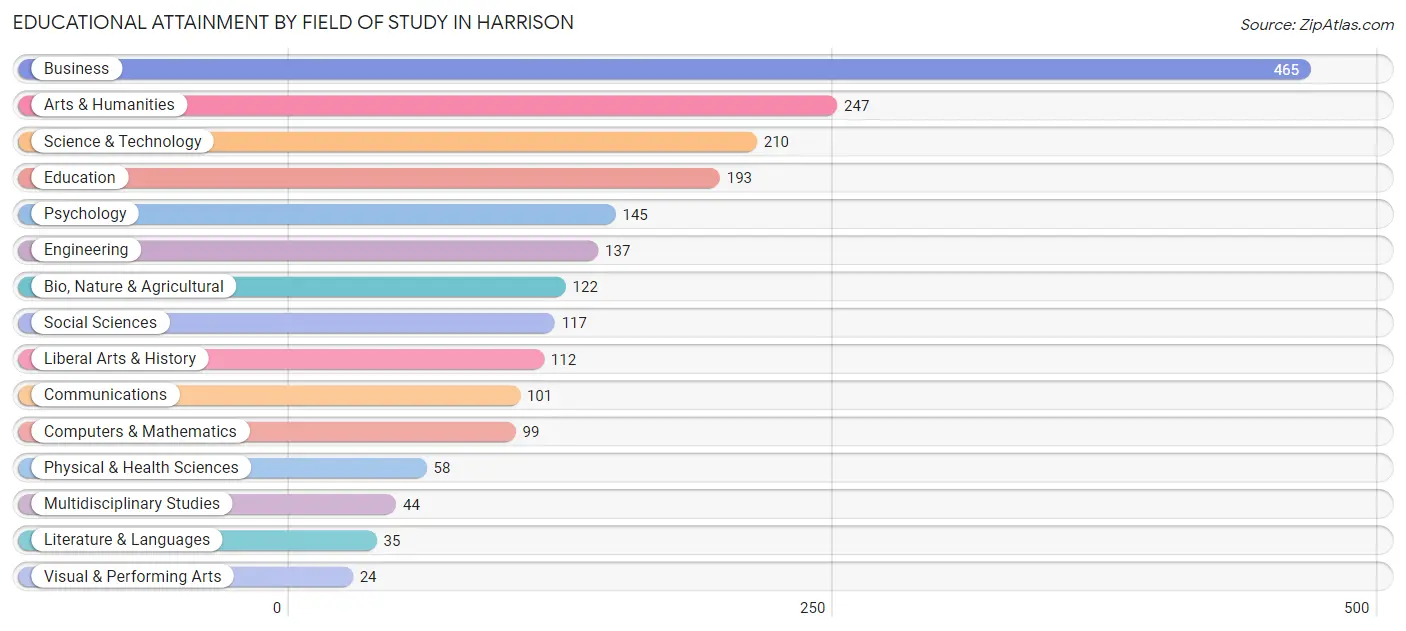
Educational Attainment by Field of Study in Harrison
Business (465 | 22.1%), arts & humanities (247 | 11.7%), science & technology (210 | 10.0%), education (193 | 9.1%), and psychology (145 | 6.9%) are the most common fields of study among 2,109 individuals in Harrison who have obtained a bachelor's degree or higher.
| Field of Study | # Graduates | % Graduates |
| Computers & Mathematics | 99 | 4.7% |
| Bio, Nature & Agricultural | 122 | 5.8% |
| Physical & Health Sciences | 58 | 2.8% |
| Psychology | 145 | 6.9% |
| Social Sciences | 117 | 5.6% |
| Engineering | 137 | 6.5% |
| Multidisciplinary Studies | 44 | 2.1% |
| Science & Technology | 210 | 10.0% |
| Business | 465 | 22.1% |
| Education | 193 | 9.1% |
| Literature & Languages | 35 | 1.7% |
| Liberal Arts & History | 112 | 5.3% |
| Visual & Performing Arts | 24 | 1.1% |
| Communications | 101 | 4.8% |
| Arts & Humanities | 247 | 11.7% |
| Total | 2,109 | 100.0% |
Transportation & Commute in Harrison
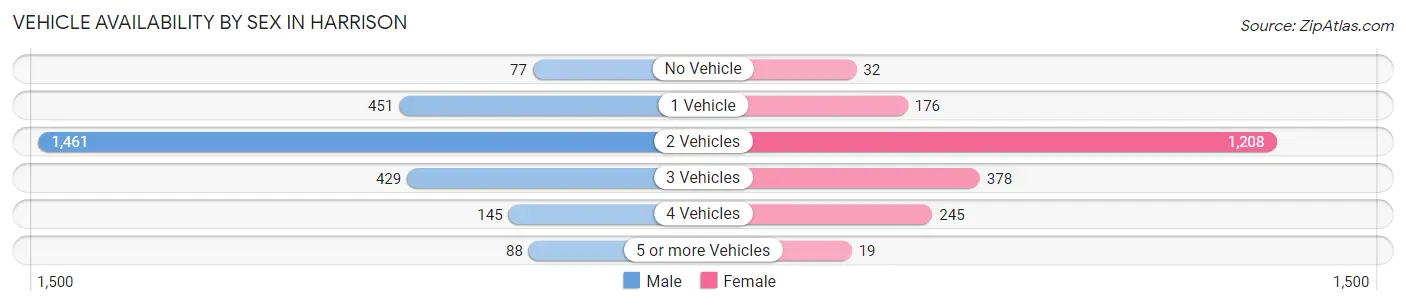
Vehicle Availability by Sex in Harrison
The most prevalent vehicle ownership categories in Harrison are males with 2 vehicles (1,461, accounting for 55.1%) and females with 2 vehicles (1,208, making up 71.0%).
| Vehicles Available | Male | Female |
| No Vehicle | 77 (2.9%) | 32 (1.5%) |
| 1 Vehicle | 451 (17.0%) | 176 (8.6%) |
| 2 Vehicles | 1,461 (55.1%) | 1,208 (58.7%) |
| 3 Vehicles | 429 (16.2%) | 378 (18.4%) |
| 4 Vehicles | 145 (5.5%) | 245 (11.9%) |
| 5 or more Vehicles | 88 (3.3%) | 19 (0.9%) |
| Total | 2,651 (100.0%) | 2,058 (100.0%) |
Commute Time in Harrison
The most frequently occuring commute durations in Harrison are 20 to 24 minutes (952 commuters, 22.6%), 15 to 19 minutes (796 commuters, 18.9%), and 30 to 34 minutes (689 commuters, 16.4%).
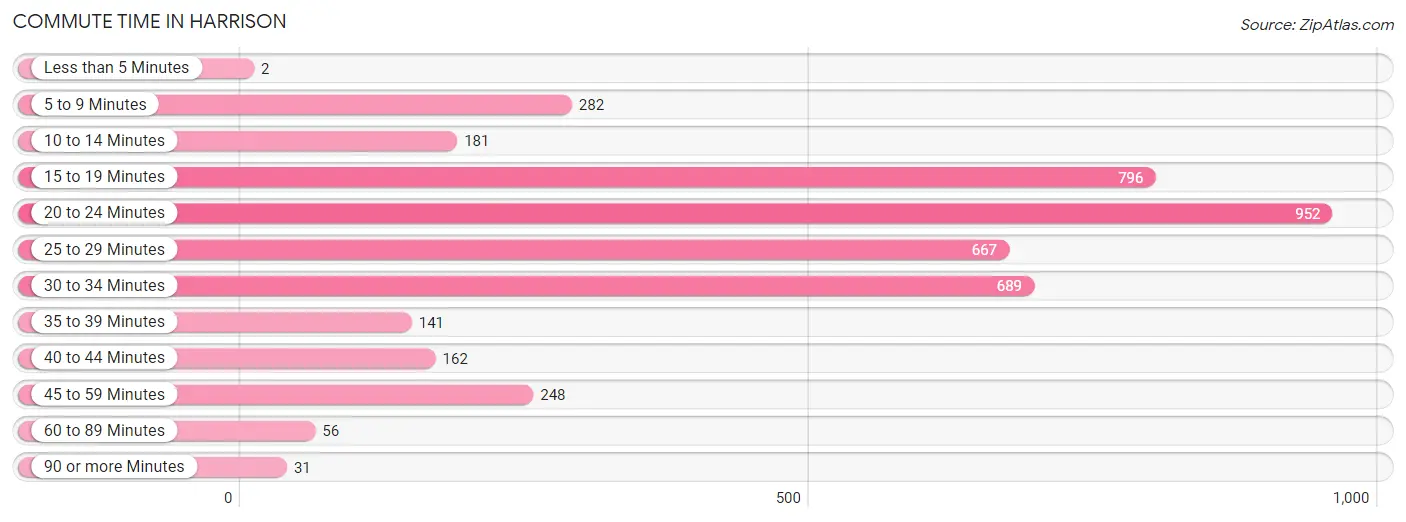
| Commute Time | # Commuters | % Commuters |
| Less than 5 Minutes | 2 | 0.1% |
| 5 to 9 Minutes | 282 | 6.7% |
| 10 to 14 Minutes | 181 | 4.3% |
| 15 to 19 Minutes | 796 | 18.9% |
| 20 to 24 Minutes | 952 | 22.6% |
| 25 to 29 Minutes | 667 | 15.9% |
| 30 to 34 Minutes | 689 | 16.4% |
| 35 to 39 Minutes | 141 | 3.4% |
| 40 to 44 Minutes | 162 | 3.8% |
| 45 to 59 Minutes | 248 | 5.9% |
| 60 to 89 Minutes | 56 | 1.3% |
| 90 or more Minutes | 31 | 0.7% |
Commute Time by Sex in Harrison
The most common commute times in Harrison are 15 to 19 minutes (542 commuters, 21.7%) for males and 20 to 24 minutes (621 commuters, 36.3%) for females.
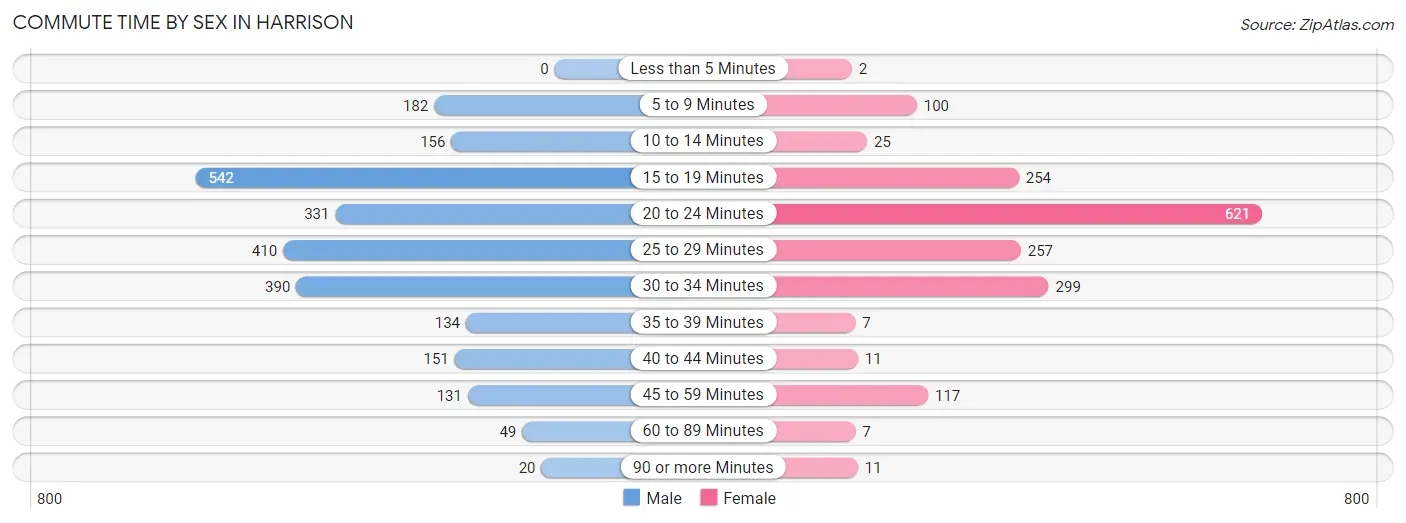
| Commute Time | Male | Female |
| Less than 5 Minutes | 0 (0.0%) | 2 (0.1%) |
| 5 to 9 Minutes | 182 (7.3%) | 100 (5.8%) |
| 10 to 14 Minutes | 156 (6.2%) | 25 (1.5%) |
| 15 to 19 Minutes | 542 (21.7%) | 254 (14.8%) |
| 20 to 24 Minutes | 331 (13.3%) | 621 (36.3%) |
| 25 to 29 Minutes | 410 (16.4%) | 257 (15.0%) |
| 30 to 34 Minutes | 390 (15.6%) | 299 (17.5%) |
| 35 to 39 Minutes | 134 (5.4%) | 7 (0.4%) |
| 40 to 44 Minutes | 151 (6.0%) | 11 (0.6%) |
| 45 to 59 Minutes | 131 (5.2%) | 117 (6.8%) |
| 60 to 89 Minutes | 49 (2.0%) | 7 (0.4%) |
| 90 or more Minutes | 20 (0.8%) | 11 (0.6%) |
Time of Departure to Work by Sex in Harrison
The most frequent times of departure to work in Harrison are 7:00 AM to 7:29 AM (519, 20.8%) for males and 7:30 AM to 7:59 AM (372, 21.7%) for females.
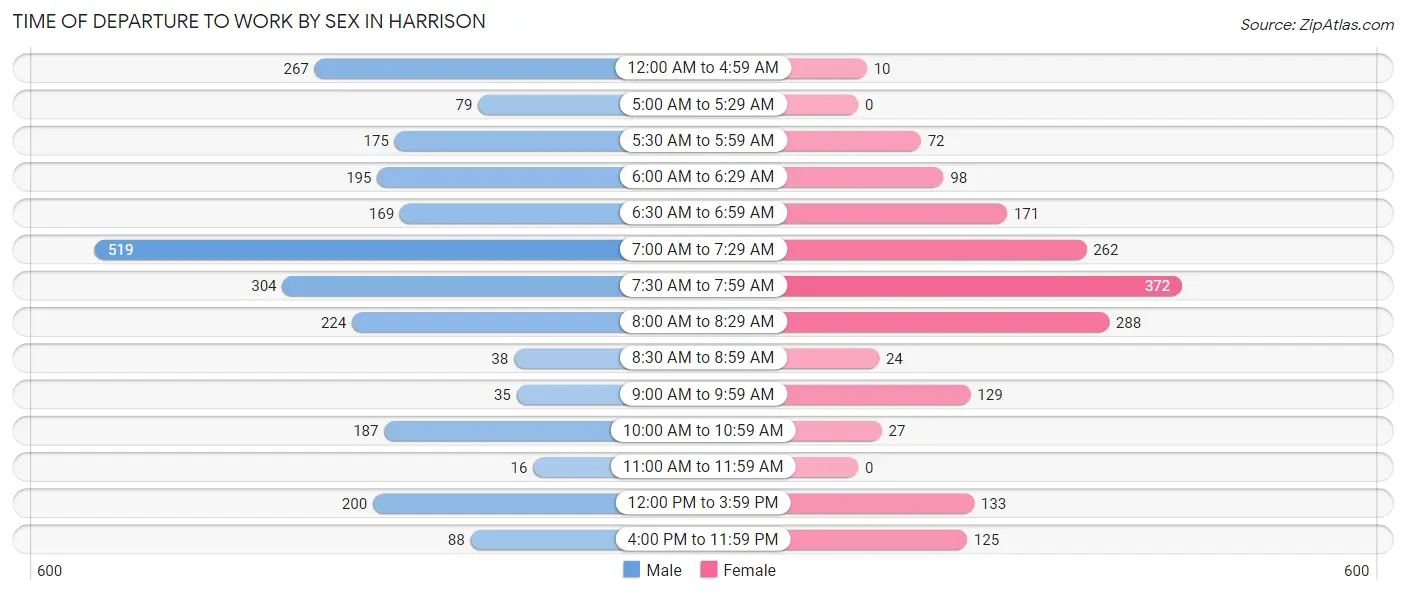
| Time of Departure | Male | Female |
| 12:00 AM to 4:59 AM | 267 (10.7%) | 10 (0.6%) |
| 5:00 AM to 5:29 AM | 79 (3.2%) | 0 (0.0%) |
| 5:30 AM to 5:59 AM | 175 (7.0%) | 72 (4.2%) |
| 6:00 AM to 6:29 AM | 195 (7.8%) | 98 (5.7%) |
| 6:30 AM to 6:59 AM | 169 (6.8%) | 171 (10.0%) |
| 7:00 AM to 7:29 AM | 519 (20.8%) | 262 (15.3%) |
| 7:30 AM to 7:59 AM | 304 (12.2%) | 372 (21.7%) |
| 8:00 AM to 8:29 AM | 224 (9.0%) | 288 (16.8%) |
| 8:30 AM to 8:59 AM | 38 (1.5%) | 24 (1.4%) |
| 9:00 AM to 9:59 AM | 35 (1.4%) | 129 (7.5%) |
| 10:00 AM to 10:59 AM | 187 (7.5%) | 27 (1.6%) |
| 11:00 AM to 11:59 AM | 16 (0.6%) | 0 (0.0%) |
| 12:00 PM to 3:59 PM | 200 (8.0%) | 133 (7.8%) |
| 4:00 PM to 11:59 PM | 88 (3.5%) | 125 (7.3%) |
| Total | 2,496 (100.0%) | 1,711 (100.0%) |
Housing Occupancy in Harrison
Occupancy by Ownership in Harrison
Of the total 3,508 dwellings in Harrison, owner-occupied units account for 2,512 (71.6%), while renter-occupied units make up 996 (28.4%).
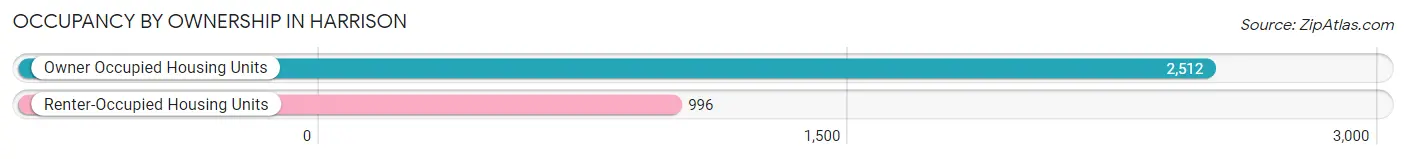
| Occupancy | # Housing Units | % Housing Units |
| Owner Occupied Housing Units | 2,512 | 71.6% |
| Renter-Occupied Housing Units | 996 | 28.4% |
| Total Occupied Housing Units | 3,508 | 100.0% |
Occupancy by Household Size in Harrison
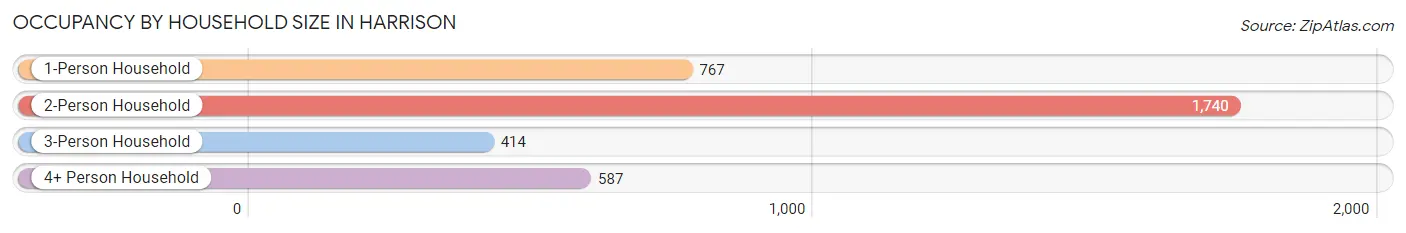
| Household Size | # Housing Units | % Housing Units |
| 1-Person Household | 767 | 21.9% |
| 2-Person Household | 1,740 | 49.6% |
| 3-Person Household | 414 | 11.8% |
| 4+ Person Household | 587 | 16.7% |
| Total Housing Units | 3,508 | 100.0% |
Occupancy by Ownership by Household Size in Harrison
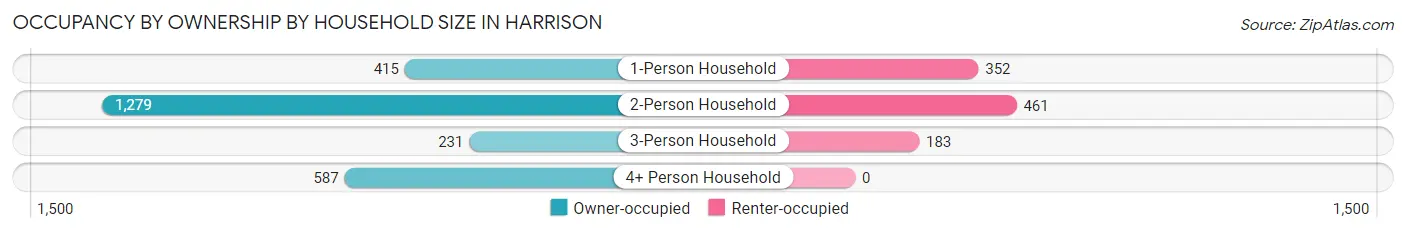
| Household Size | Owner-occupied | Renter-occupied |
| 1-Person Household | 415 (54.1%) | 352 (45.9%) |
| 2-Person Household | 1,279 (73.5%) | 461 (26.5%) |
| 3-Person Household | 231 (55.8%) | 183 (44.2%) |
| 4+ Person Household | 587 (100.0%) | 0 (0.0%) |
| Total Housing Units | 2,512 (71.6%) | 996 (28.4%) |
Occupancy by Educational Attainment in Harrison
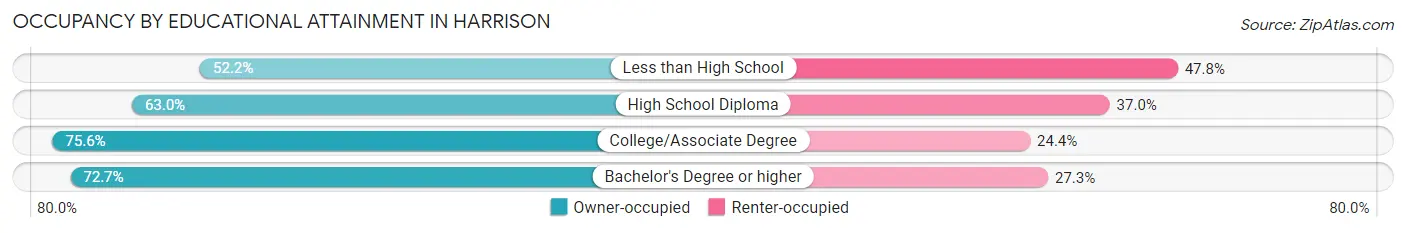
| Household Size | Owner-occupied | Renter-occupied |
| Less than High School | 84 (52.2%) | 77 (47.8%) |
| High School Diploma | 352 (63.0%) | 207 (37.0%) |
| College/Associate Degree | 1,278 (75.6%) | 413 (24.4%) |
| Bachelor's Degree or higher | 798 (72.7%) | 299 (27.3%) |
Occupancy by Age of Householder in Harrison
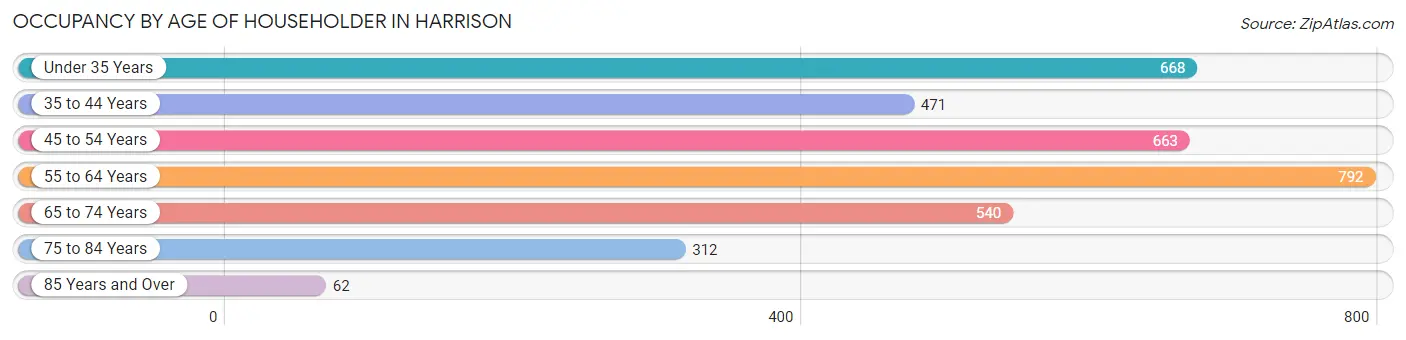
| Age Bracket | # Households | % Households |
| Under 35 Years | 668 | 19.0% |
| 35 to 44 Years | 471 | 13.4% |
| 45 to 54 Years | 663 | 18.9% |
| 55 to 64 Years | 792 | 22.6% |
| 65 to 74 Years | 540 | 15.4% |
| 75 to 84 Years | 312 | 8.9% |
| 85 Years and Over | 62 | 1.8% |
| Total | 3,508 | 100.0% |
Housing Finances in Harrison
Median Income by Occupancy in Harrison
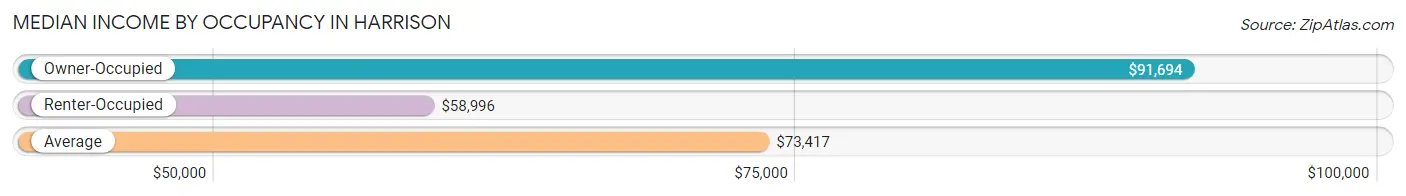
| Occupancy Type | # Households | Median Income |
| Owner-Occupied | 2,512 (71.6%) | $91,694 |
| Renter-Occupied | 996 (28.4%) | $58,996 |
| Average | 3,508 (100.0%) | $73,417 |
Occupancy by Householder Income Bracket in Harrison
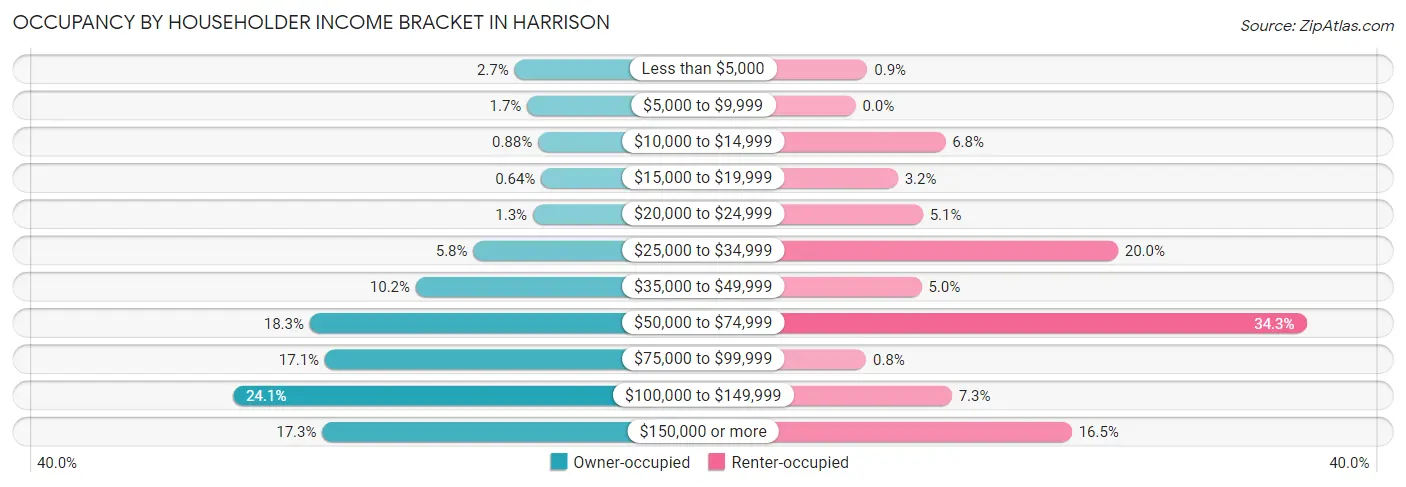
| Income Bracket | Owner-occupied | Renter-occupied |
| Less than $5,000 | 67 (2.7%) | 9 (0.9%) |
| $5,000 to $9,999 | 43 (1.7%) | 0 (0.0%) |
| $10,000 to $14,999 | 22 (0.9%) | 68 (6.8%) |
| $15,000 to $19,999 | 16 (0.6%) | 32 (3.2%) |
| $20,000 to $24,999 | 32 (1.3%) | 51 (5.1%) |
| $25,000 to $34,999 | 146 (5.8%) | 199 (20.0%) |
| $35,000 to $49,999 | 256 (10.2%) | 50 (5.0%) |
| $50,000 to $74,999 | 459 (18.3%) | 342 (34.3%) |
| $75,000 to $99,999 | 430 (17.1%) | 8 (0.8%) |
| $100,000 to $149,999 | 606 (24.1%) | 73 (7.3%) |
| $150,000 or more | 435 (17.3%) | 164 (16.5%) |
| Total | 2,512 (100.0%) | 996 (100.0%) |
Monthly Housing Cost Tiers in Harrison
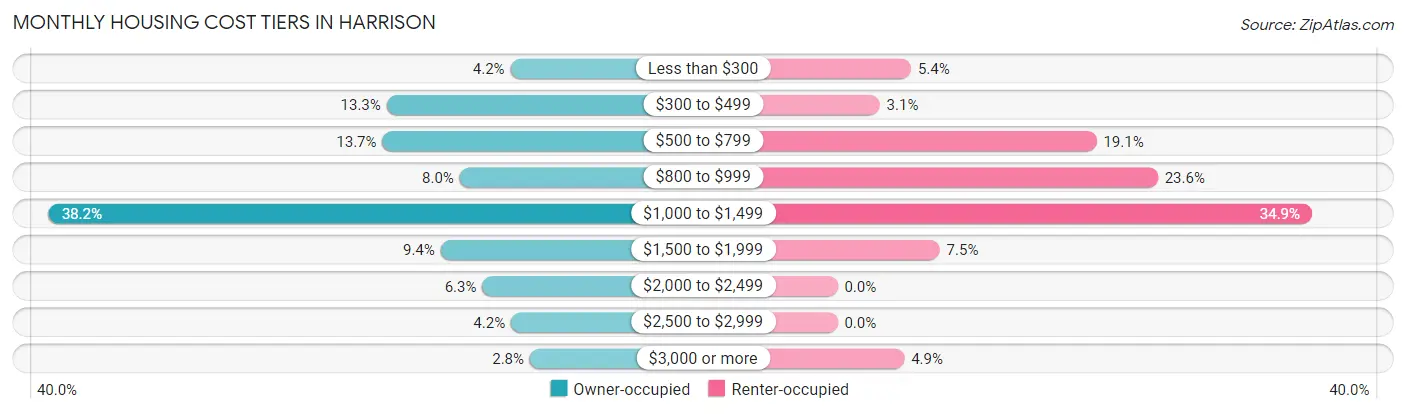
| Monthly Cost | Owner-occupied | Renter-occupied |
| Less than $300 | 106 (4.2%) | 54 (5.4%) |
| $300 to $499 | 335 (13.3%) | 31 (3.1%) |
| $500 to $799 | 343 (13.7%) | 190 (19.1%) |
| $800 to $999 | 200 (8.0%) | 235 (23.6%) |
| $1,000 to $1,499 | 960 (38.2%) | 348 (34.9%) |
| $1,500 to $1,999 | 235 (9.4%) | 75 (7.5%) |
| $2,000 to $2,499 | 158 (6.3%) | 0 (0.0%) |
| $2,500 to $2,999 | 105 (4.2%) | 0 (0.0%) |
| $3,000 or more | 70 (2.8%) | 49 (4.9%) |
| Total | 2,512 (100.0%) | 996 (100.0%) |
Physical Housing Characteristics in Harrison
Housing Structures in Harrison
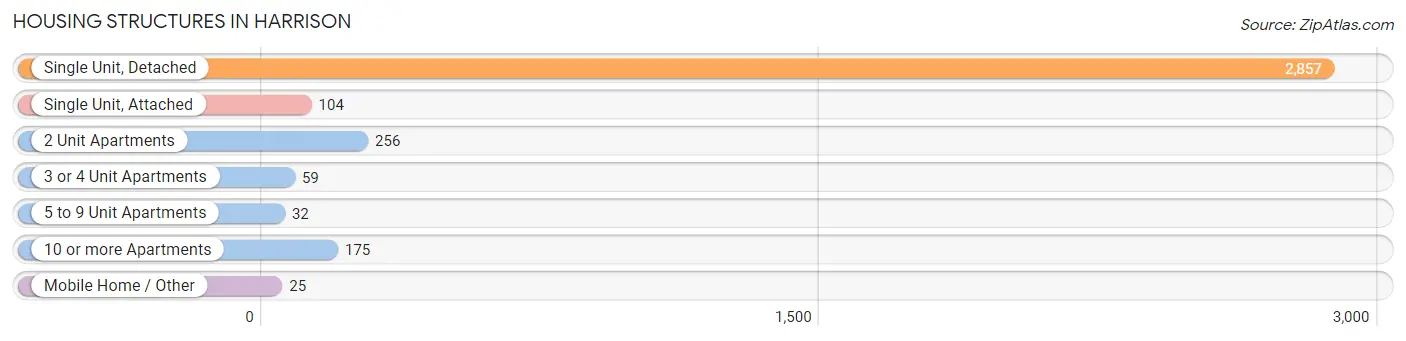
| Structure Type | # Housing Units | % Housing Units |
| Single Unit, Detached | 2,857 | 81.4% |
| Single Unit, Attached | 104 | 3.0% |
| 2 Unit Apartments | 256 | 7.3% |
| 3 or 4 Unit Apartments | 59 | 1.7% |
| 5 to 9 Unit Apartments | 32 | 0.9% |
| 10 or more Apartments | 175 | 5.0% |
| Mobile Home / Other | 25 | 0.7% |
| Total | 3,508 | 100.0% |
Housing Structures by Occupancy in Harrison
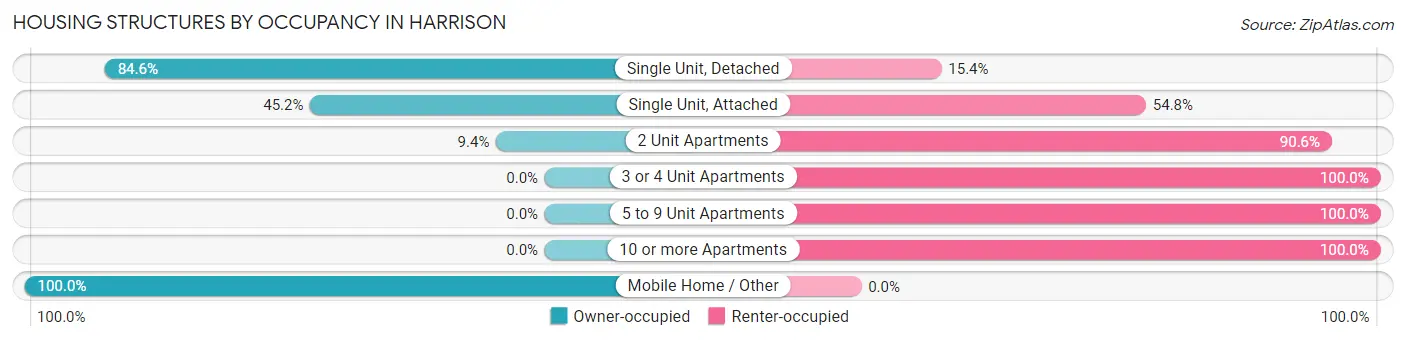
| Structure Type | Owner-occupied | Renter-occupied |
| Single Unit, Detached | 2,416 (84.6%) | 441 (15.4%) |
| Single Unit, Attached | 47 (45.2%) | 57 (54.8%) |
| 2 Unit Apartments | 24 (9.4%) | 232 (90.6%) |
| 3 or 4 Unit Apartments | 0 (0.0%) | 59 (100.0%) |
| 5 to 9 Unit Apartments | 0 (0.0%) | 32 (100.0%) |
| 10 or more Apartments | 0 (0.0%) | 175 (100.0%) |
| Mobile Home / Other | 25 (100.0%) | 0 (0.0%) |
| Total | 2,512 (71.6%) | 996 (28.4%) |
Housing Structures by Number of Rooms in Harrison
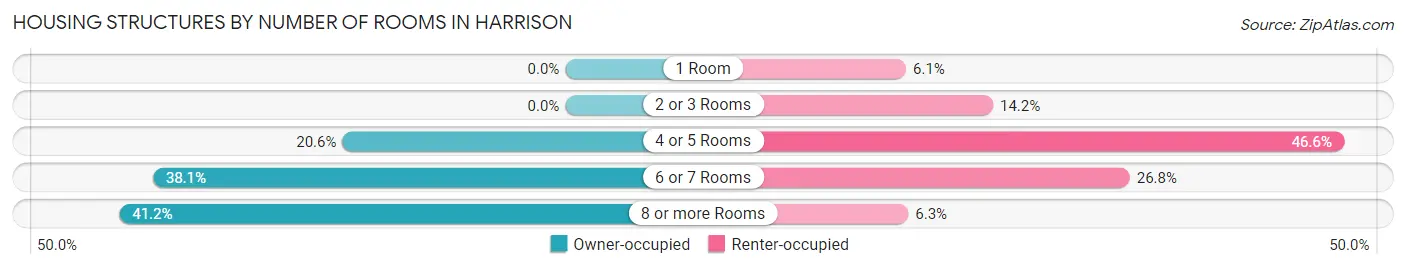
| Number of Rooms | Owner-occupied | Renter-occupied |
| 1 Room | 0 (0.0%) | 61 (6.1%) |
| 2 or 3 Rooms | 0 (0.0%) | 141 (14.2%) |
| 4 or 5 Rooms | 518 (20.6%) | 464 (46.6%) |
| 6 or 7 Rooms | 958 (38.1%) | 267 (26.8%) |
| 8 or more Rooms | 1,036 (41.2%) | 63 (6.3%) |
| Total | 2,512 (100.0%) | 996 (100.0%) |
Housing Structure by Heating Type in Harrison
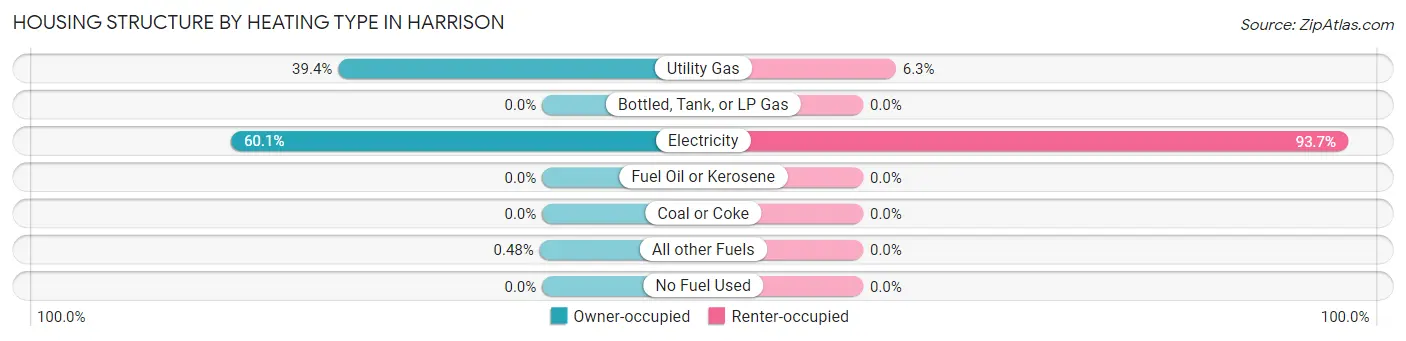
| Heating Type | Owner-occupied | Renter-occupied |
| Utility Gas | 990 (39.4%) | 63 (6.3%) |
| Bottled, Tank, or LP Gas | 0 (0.0%) | 0 (0.0%) |
| Electricity | 1,510 (60.1%) | 933 (93.7%) |
| Fuel Oil or Kerosene | 0 (0.0%) | 0 (0.0%) |
| Coal or Coke | 0 (0.0%) | 0 (0.0%) |
| All other Fuels | 12 (0.5%) | 0 (0.0%) |
| No Fuel Used | 0 (0.0%) | 0 (0.0%) |
| Total | 2,512 (100.0%) | 996 (100.0%) |
Household Vehicle Usage in Harrison
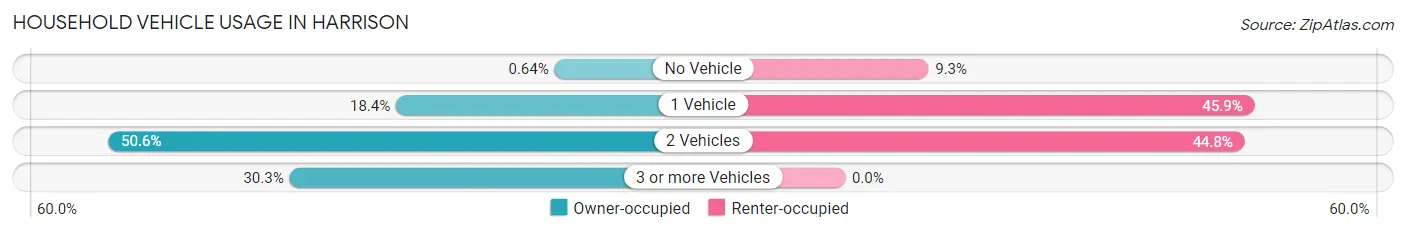
| Vehicles per Household | Owner-occupied | Renter-occupied |
| No Vehicle | 16 (0.6%) | 93 (9.3%) |
| 1 Vehicle | 462 (18.4%) | 457 (45.9%) |
| 2 Vehicles | 1,272 (50.6%) | 446 (44.8%) |
| 3 or more Vehicles | 762 (30.3%) | 0 (0.0%) |
| Total | 2,512 (100.0%) | 996 (100.0%) |
Real Estate & Mortgages in Harrison
Real Estate and Mortgage Overview in Harrison
| Characteristic | Without Mortgage | With Mortgage |
| Housing Units | 702 | 1,810 |
| Median Property Value | $213,100 | $219,000 |
| Median Household Income | $55,833 | $361 |
| Monthly Housing Costs | $467 | $59 |
| Real Estate Taxes | $1,329 | $54 |
Property Value by Mortgage Status in Harrison
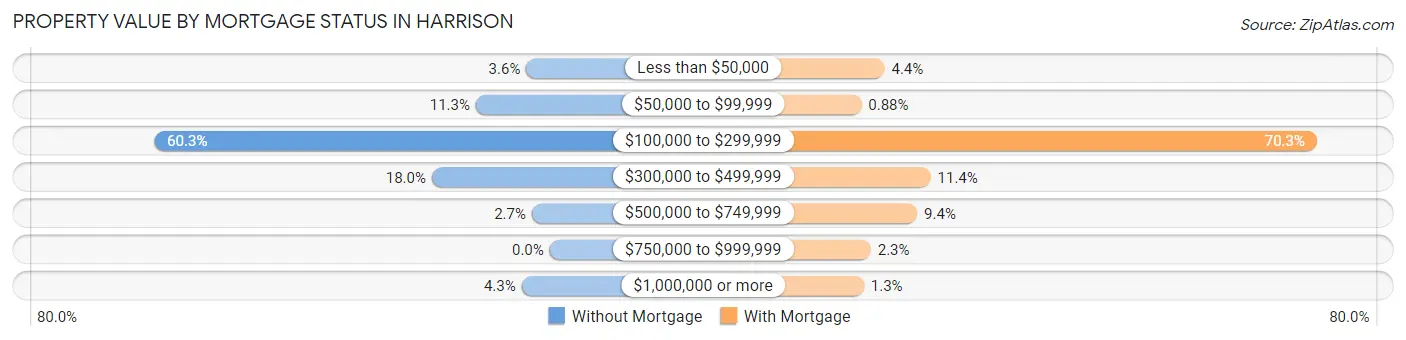
| Property Value | Without Mortgage | With Mortgage |
| Less than $50,000 | 25 (3.6%) | 80 (4.4%) |
| $50,000 to $99,999 | 79 (11.3%) | 16 (0.9%) |
| $100,000 to $299,999 | 423 (60.3%) | 1,272 (70.3%) |
| $300,000 to $499,999 | 126 (17.9%) | 207 (11.4%) |
| $500,000 to $749,999 | 19 (2.7%) | 170 (9.4%) |
| $750,000 to $999,999 | 0 (0.0%) | 42 (2.3%) |
| $1,000,000 or more | 30 (4.3%) | 23 (1.3%) |
| Total | 702 (100.0%) | 1,810 (100.0%) |
Household Income by Mortgage Status in Harrison
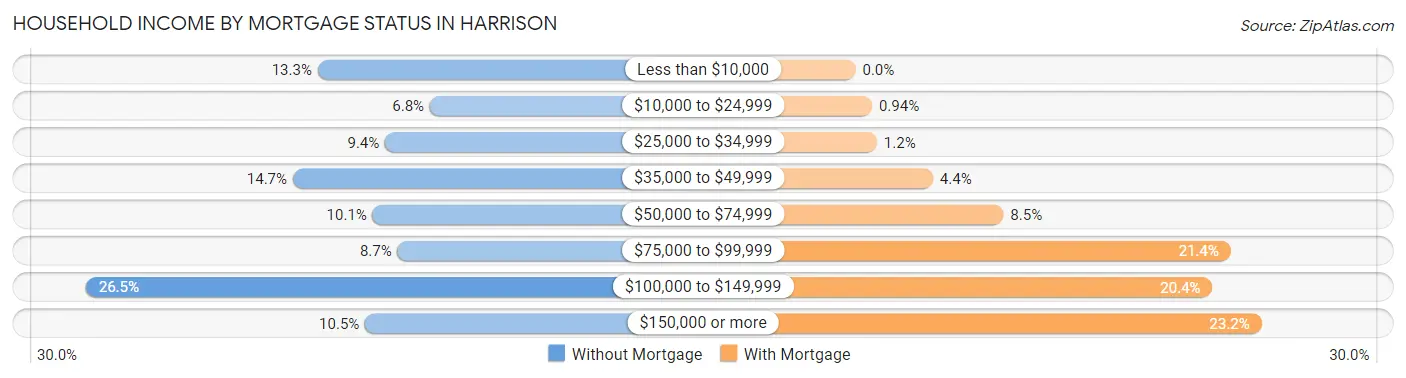
| Household Income | Without Mortgage | With Mortgage |
| Less than $10,000 | 93 (13.3%) | 0 (0.0%) |
| $10,000 to $24,999 | 48 (6.8%) | 17 (0.9%) |
| $25,000 to $34,999 | 66 (9.4%) | 22 (1.2%) |
| $35,000 to $49,999 | 103 (14.7%) | 80 (4.4%) |
| $50,000 to $74,999 | 71 (10.1%) | 153 (8.5%) |
| $75,000 to $99,999 | 61 (8.7%) | 388 (21.4%) |
| $100,000 to $149,999 | 186 (26.5%) | 369 (20.4%) |
| $150,000 or more | 74 (10.5%) | 420 (23.2%) |
| Total | 702 (100.0%) | 1,810 (100.0%) |
Property Value to Household Income Ratio in Harrison
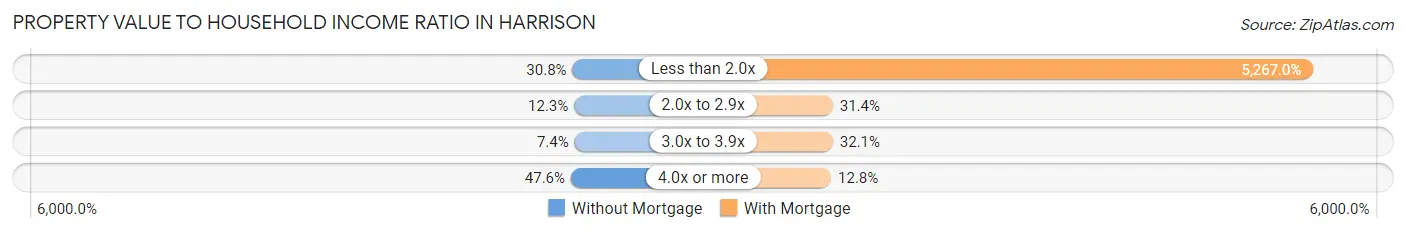
| Value-to-Income Ratio | Without Mortgage | With Mortgage |
| Less than 2.0x | 216 (30.8%) | 95,333 (5,267.0%) |
| 2.0x to 2.9x | 86 (12.2%) | 568 (31.4%) |
| 3.0x to 3.9x | 52 (7.4%) | 581 (32.1%) |
| 4.0x or more | 334 (47.6%) | 232 (12.8%) |
| Total | 702 (100.0%) | 1,810 (100.0%) |
Real Estate Taxes by Mortgage Status in Harrison
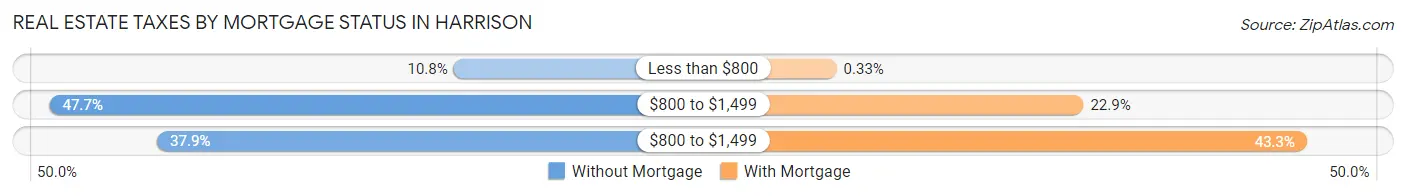
| Property Taxes | Without Mortgage | With Mortgage |
| Less than $800 | 76 (10.8%) | 6 (0.3%) |
| $800 to $1,499 | 335 (47.7%) | 414 (22.9%) |
| $800 to $1,499 | 266 (37.9%) | 783 (43.3%) |
| Total | 702 (100.0%) | 1,810 (100.0%) |
Health & Disability in Harrison
Health Insurance Coverage by Age in Harrison
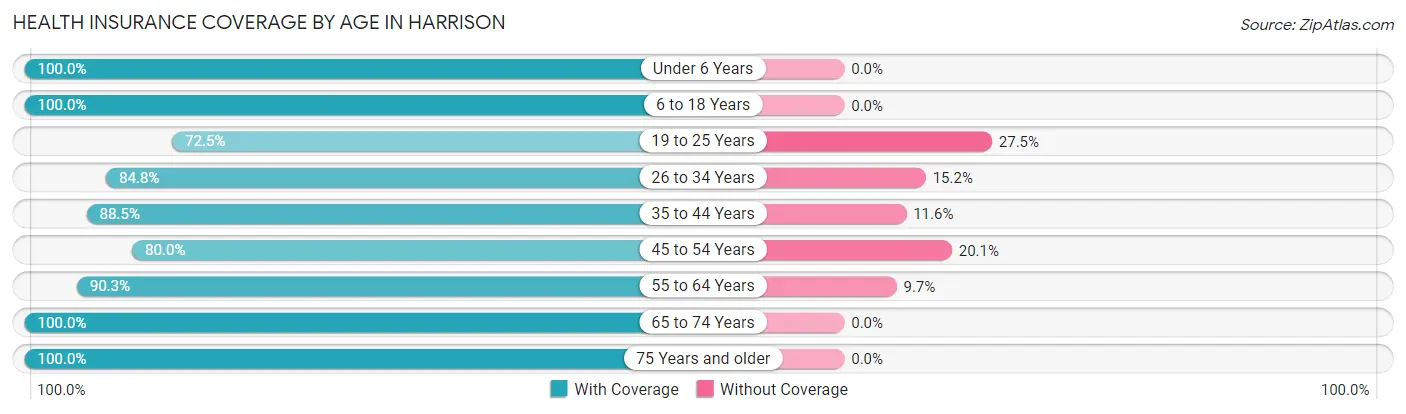
| Age Bracket | With Coverage | Without Coverage |
| Under 6 Years | 613 (100.0%) | 0 (0.0%) |
| 6 to 18 Years | 992 (100.0%) | 0 (0.0%) |
| 19 to 25 Years | 324 (72.5%) | 123 (27.5%) |
| 26 to 34 Years | 1,055 (84.8%) | 189 (15.2%) |
| 35 to 44 Years | 758 (88.4%) | 99 (11.6%) |
| 45 to 54 Years | 1,013 (79.9%) | 254 (20.1%) |
| 55 to 64 Years | 1,242 (90.3%) | 134 (9.7%) |
| 65 to 74 Years | 942 (100.0%) | 0 (0.0%) |
| 75 Years and older | 543 (100.0%) | 0 (0.0%) |
| Total | 7,482 (90.3%) | 799 (9.7%) |
Health Insurance Coverage by Citizenship Status in Harrison
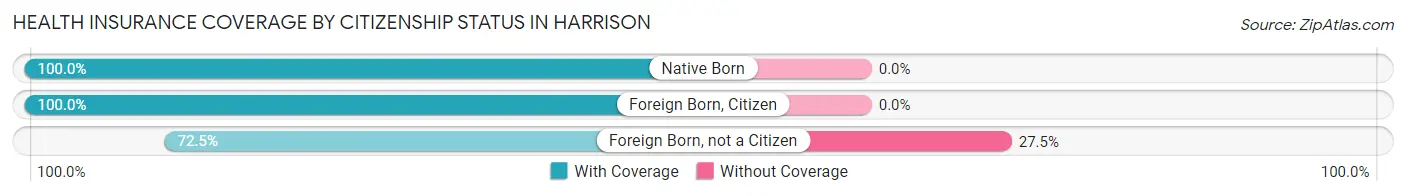
| Citizenship Status | With Coverage | Without Coverage |
| Native Born | 613 (100.0%) | 0 (0.0%) |
| Foreign Born, Citizen | 992 (100.0%) | 0 (0.0%) |
| Foreign Born, not a Citizen | 324 (72.5%) | 123 (27.5%) |
Health Insurance Coverage by Household Income in Harrison
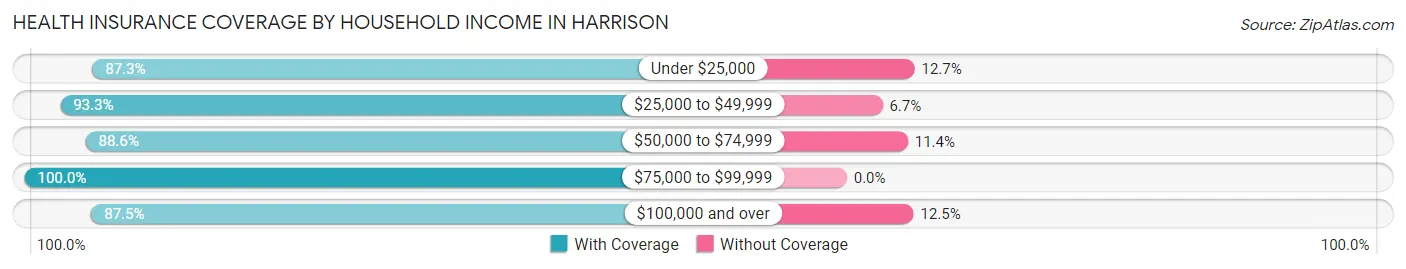
| Household Income | With Coverage | Without Coverage |
| Under $25,000 | 399 (87.3%) | 58 (12.7%) |
| $25,000 to $49,999 | 824 (93.3%) | 59 (6.7%) |
| $50,000 to $74,999 | 1,736 (88.6%) | 224 (11.4%) |
| $75,000 to $99,999 | 1,327 (100.0%) | 0 (0.0%) |
| $100,000 and over | 3,188 (87.5%) | 456 (12.5%) |
Public vs Private Health Insurance Coverage by Age in Harrison
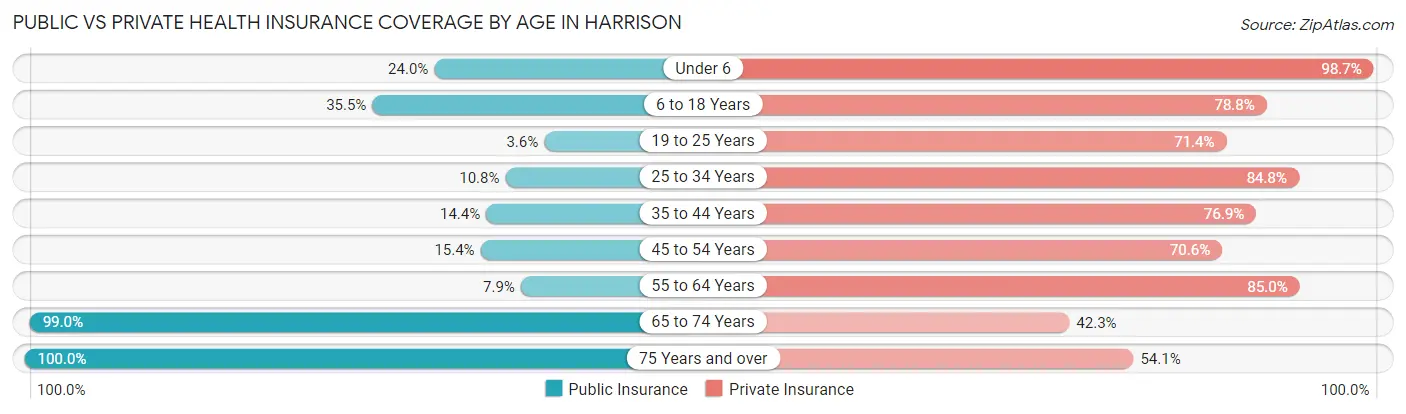
| Age Bracket | Public Insurance | Private Insurance |
| Under 6 | 147 (24.0%) | 605 (98.7%) |
| 6 to 18 Years | 352 (35.5%) | 782 (78.8%) |
| 19 to 25 Years | 16 (3.6%) | 319 (71.4%) |
| 25 to 34 Years | 134 (10.8%) | 1,055 (84.8%) |
| 35 to 44 Years | 123 (14.3%) | 659 (76.9%) |
| 45 to 54 Years | 195 (15.4%) | 894 (70.6%) |
| 55 to 64 Years | 109 (7.9%) | 1,169 (85.0%) |
| 65 to 74 Years | 933 (99.0%) | 398 (42.2%) |
| 75 Years and over | 543 (100.0%) | 294 (54.1%) |
| Total | 2,552 (30.8%) | 6,175 (74.6%) |
Disability Status by Sex by Age in Harrison
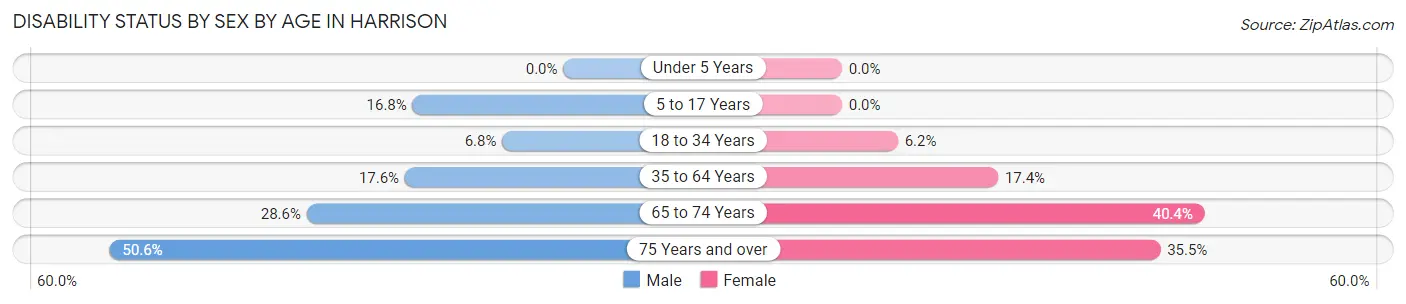
| Age Bracket | Male | Female |
| Under 5 Years | 0 (0.0%) | 0 (0.0%) |
| 5 to 17 Years | 69 (16.8%) | 0 (0.0%) |
| 18 to 34 Years | 70 (6.8%) | 43 (6.2%) |
| 35 to 64 Years | 307 (17.6%) | 306 (17.4%) |
| 65 to 74 Years | 132 (28.6%) | 194 (40.4%) |
| 75 Years and over | 92 (50.5%) | 128 (35.5%) |
Disability Class by Sex by Age in Harrison
Disability Class: Hearing Difficulty
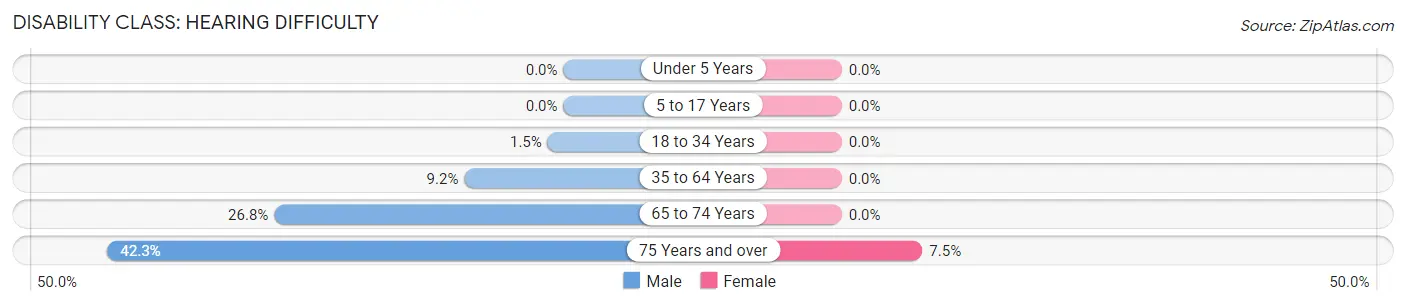
| Age Bracket | Male | Female |
| Under 5 Years | 0 (0.0%) | 0 (0.0%) |
| 5 to 17 Years | 0 (0.0%) | 0 (0.0%) |
| 18 to 34 Years | 15 (1.5%) | 0 (0.0%) |
| 35 to 64 Years | 160 (9.2%) | 0 (0.0%) |
| 65 to 74 Years | 124 (26.8%) | 0 (0.0%) |
| 75 Years and over | 77 (42.3%) | 27 (7.5%) |
Disability Class: Vision Difficulty
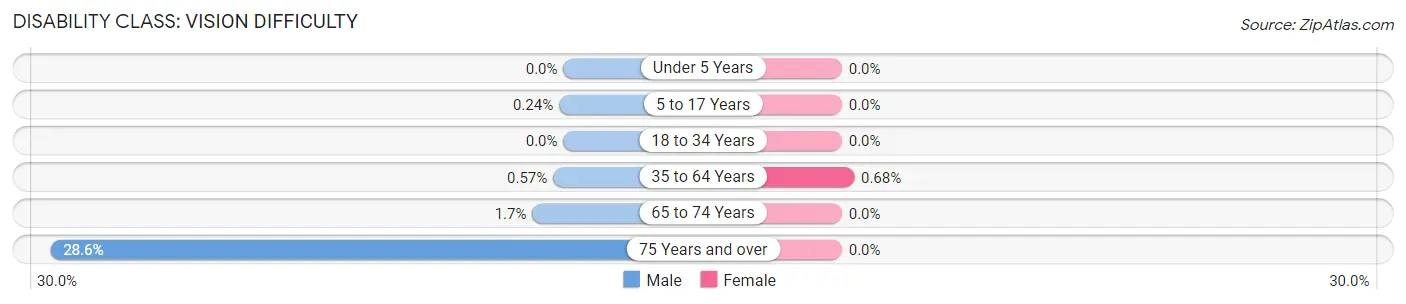
| Age Bracket | Male | Female |
| Under 5 Years | 0 (0.0%) | 0 (0.0%) |
| 5 to 17 Years | 1 (0.2%) | 0 (0.0%) |
| 18 to 34 Years | 0 (0.0%) | 0 (0.0%) |
| 35 to 64 Years | 10 (0.6%) | 12 (0.7%) |
| 65 to 74 Years | 8 (1.7%) | 0 (0.0%) |
| 75 Years and over | 52 (28.6%) | 0 (0.0%) |
Disability Class: Cognitive Difficulty
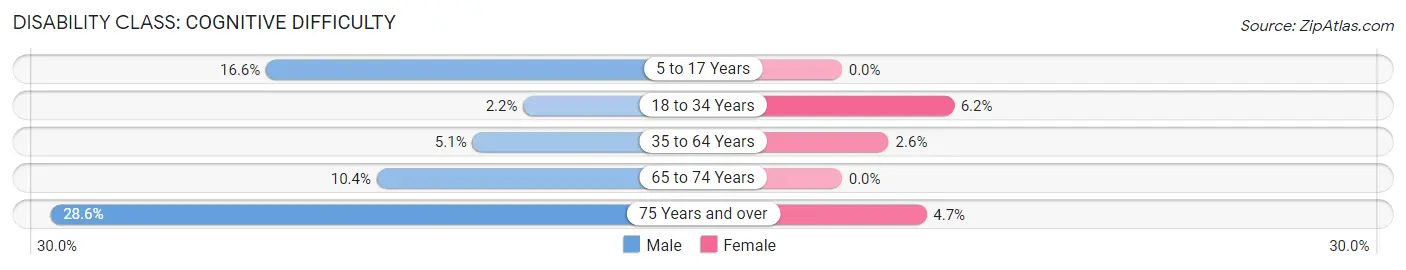
| Age Bracket | Male | Female |
| 5 to 17 Years | 68 (16.6%) | 0 (0.0%) |
| 18 to 34 Years | 23 (2.2%) | 43 (6.2%) |
| 35 to 64 Years | 88 (5.1%) | 46 (2.6%) |
| 65 to 74 Years | 48 (10.4%) | 0 (0.0%) |
| 75 Years and over | 52 (28.6%) | 17 (4.7%) |
Disability Class: Ambulatory Difficulty
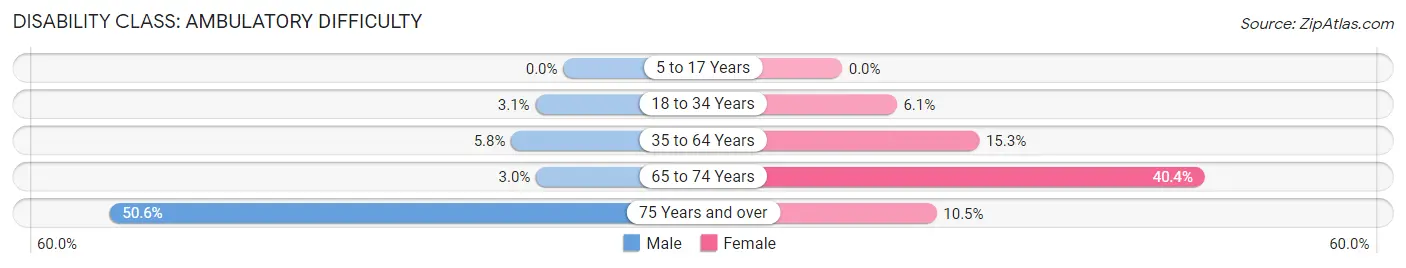
| Age Bracket | Male | Female |
| 5 to 17 Years | 0 (0.0%) | 0 (0.0%) |
| 18 to 34 Years | 32 (3.1%) | 42 (6.1%) |
| 35 to 64 Years | 101 (5.8%) | 269 (15.3%) |
| 65 to 74 Years | 14 (3.0%) | 194 (40.4%) |
| 75 Years and over | 92 (50.5%) | 38 (10.5%) |
Disability Class: Self-Care Difficulty
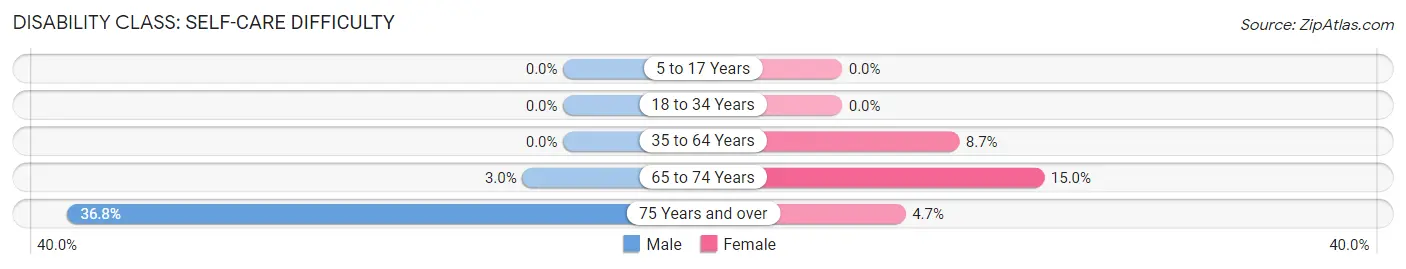
| Age Bracket | Male | Female |
| 5 to 17 Years | 0 (0.0%) | 0 (0.0%) |
| 18 to 34 Years | 0 (0.0%) | 0 (0.0%) |
| 35 to 64 Years | 0 (0.0%) | 153 (8.7%) |
| 65 to 74 Years | 14 (3.0%) | 72 (15.0%) |
| 75 Years and over | 67 (36.8%) | 17 (4.7%) |
Technology Access in Harrison
Computing Device Access in Harrison

| Device Type | # Households | % Households |
| Desktop or Laptop | 2,974 | 84.8% |
| Smartphone | 3,192 | 91.0% |
| Tablet | 2,426 | 69.2% |
| No Computing Device | 139 | 4.0% |
| Total | 3,508 | 100.0% |
Internet Access in Harrison
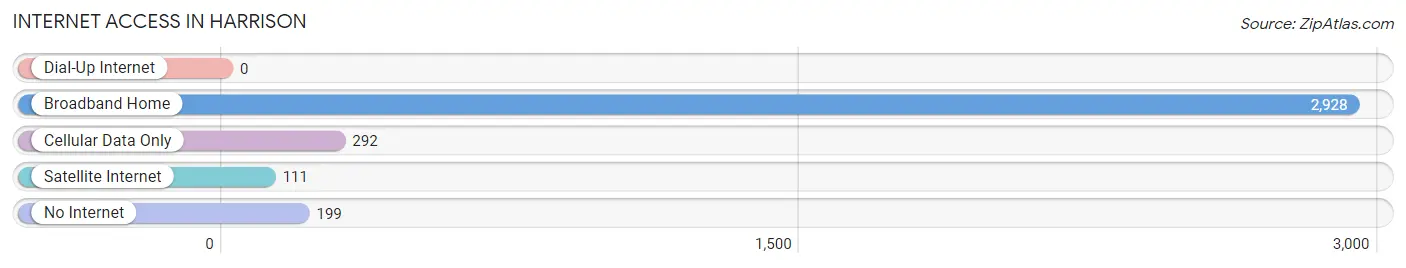
| Internet Type | # Households | % Households |
| Dial-Up Internet | 0 | 0.0% |
| Broadband Home | 2,928 | 83.5% |
| Cellular Data Only | 292 | 8.3% |
| Satellite Internet | 111 | 3.2% |
| No Internet | 199 | 5.7% |
| Total | 3,508 | 100.0% |
Harrison Summary
Harrison is a city located in Hamilton County, Tennessee. It is a suburb of Chattanooga and is part of the Chattanooga, TN-GA Metropolitan Statistical Area. The population was 7,769 at the 2010 census.
History
Harrison was founded in 1876 by James Harrison, a former Confederate soldier. The city was named after him. The city was incorporated in 1891.
In the early 1900s, Harrison was a thriving agricultural community. The city was known for its production of corn, wheat, and cotton. The city also had a thriving lumber industry.
In the 1950s, Harrison began to experience rapid growth due to the growth of the Chattanooga metropolitan area. The city was annexed by the city of Chattanooga in 1960.
Geography
Harrison is located in southeastern Hamilton County at 35°9′25″N 85°14′17″W (35.156890, -85.237945). It is bordered to the east by the city of Chattanooga and to the west by the unincorporated community of East Brainerd.
The city is situated in the foothills of the Appalachian Mountains. The city is located along the Tennessee River, which forms the northern border of the city.
Economy
Harrison is a bedroom community for Chattanooga. The city has a diverse economy, with a mix of manufacturing, retail, and service industries.
The city is home to several large employers, including Volkswagen, McKee Foods, and Shaw Industries. The city also has a growing technology sector, with several companies located in the city.
Demographics
As of the 2010 census, there were 7,769 people, 3,072 households, and 2,072 families residing in the city. The population density was 1,845.3 people per square mile (715.2/km2). There were 3,307 housing units at an average density of 776.3 per square mile (299.9/km2). The racial makeup of the city was 87.2% White, 8.2% African American, 0.3% Native American, 1.2% Asian, 0.1% Pacific Islander, 1.2% from other races, and 1.9% from two or more races. Hispanic or Latino of any race were 3.3% of the population.
There were 3,072 households, out of which 33.2% had children under the age of 18 living with them, 48.2% were married couples living together, 14.2% had a female householder with no husband present, and 32.7% were non-families. 27.2% of all households were made up of individuals, and 8.2% had someone living alone who was 65 years of age or older. The average household size was 2.51 and the average family size was 3.06.
In the city, the population was spread out, with 25.7% under the age of 18, 8.3% from 18 to 24, 30.2% from 25 to 44, 24.2% from 45 to 64, and 11.6% who were 65 years of age or older. The median age was 36 years. For every 100 females, there were 93.2 males. For every 100 females age 18 and over, there were 89.3 males.
The median income for a household in the city was $41,945, and the median income for a family was $50,945. Males had a median income of $36,945 versus $27,945 for females. The per capita income for the city was $20,945. About 8.2% of families and 10.2% of the population were below the poverty line, including 14.2% of those under age 18 and 8.2% of those age 65 or over.
Common Questions
What is the Total Population of Harrison?
Total Population of Harrison is 8,313.
What is the Total Male Population of Harrison?
Total Male Population of Harrison is 4,074.
What is the Total Female Population of Harrison?
Total Female Population of Harrison is 4,239.
What is the Ratio of Males per 100 Females in Harrison?
There are 96.11 Males per 100 Females in Harrison.
What is the Ratio of Females per 100 Males in Harrison?
There are 104.05 Females per 100 Males in Harrison.
What is the Median Population Age in Harrison?
Median Population Age in Harrison is 43.9 Years.
What is the Average Family Size in Harrison
Average Family Size in Harrison is 2.7 People.
What is the Average Household Size in Harrison
Average Household Size in Harrison is 2.4 People.
What is Per Capita Income in Harrison?
Per Capita income in Harrison is $39,146.
What is the Median Family Income in Harrison?
Median Family Income in Harrison is $94,795.
What is the Median Household income in Harrison?
Median Household Income in Harrison is $73,417.
What is Income or Wage Gap in Harrison?
Income or Wage Gap in Harrison is 27.9%.
Women in Harrison earn 72.1 cents for every dollar earned by a man.
What is Inequality or Gini Index in Harrison?
Inequality or Gini Index in Harrison is 0.37.
How Large is the Labor Force in Harrison?
There are 4,830 People in the Labor Forcein in Harrison.
What is the Percentage of People in the Labor Force in Harrison?
70.2% of People are in the Labor Force in Harrison.
What is the Unemployment Rate in Harrison?
Unemployment Rate in Harrison is 1.8%.