Garland, TN
Garland Map
Garland Overview
284
TOTAL POPULATION
141
MALE POPULATION
143
FEMALE POPULATION
98.60
MALES / 100 FEMALES
101.42
FEMALES / 100 MALES
44.0
MEDIAN AGE
2.5
AVG FAMILY SIZE
2.2
AVG HOUSEHOLD SIZE
$34,314
PER CAPITA INCOME
$90,114
AVG FAMILY INCOME
$70,625
AVG HOUSEHOLD INCOME
0.4%
WAGE / INCOME GAP [ % ]
99.6¢/ $1
WAGE / INCOME GAP [ $ ]
0.30
INEQUALITY / GINI INDEX
154
LABOR FORCE [ PEOPLE ]
64.4%
PERCENT IN LABOR FORCE
1.9%
UNEMPLOYMENT RATE
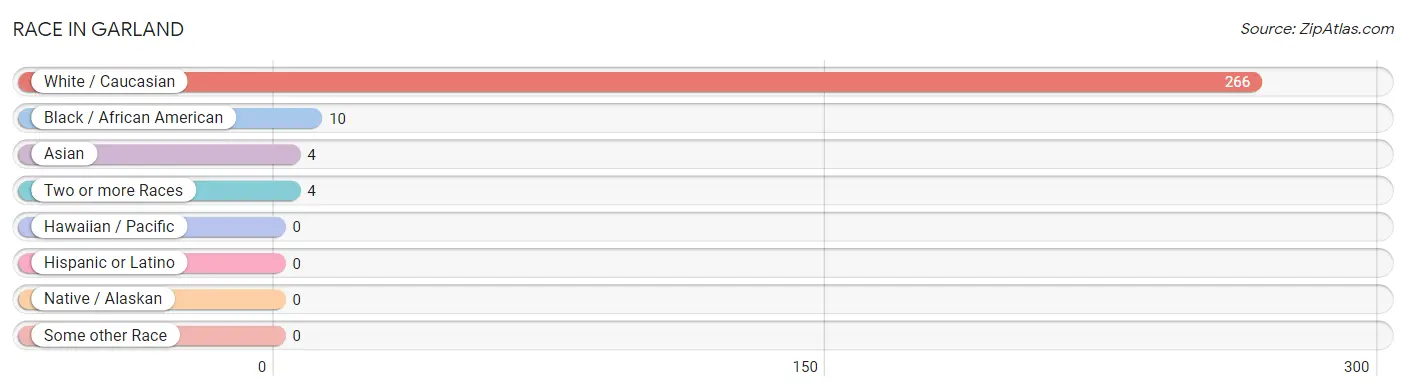
Race in Garland
The most populous races in Garland are White / Caucasian (266 | 93.7%), Black / African American (10 | 3.5%), and Asian (4 | 1.4%).
| Race | # Population | % Population |
| Asian | 4 | 1.4% |
| Black / African American | 10 | 3.5% |
| Hawaiian / Pacific | 0 | 0.0% |
| Hispanic or Latino | 0 | 0.0% |
| Native / Alaskan | 0 | 0.0% |
| White / Caucasian | 266 | 93.7% |
| Two or more Races | 4 | 1.4% |
| Some other Race | 0 | 0.0% |
| Total | 284 | 100.0% |
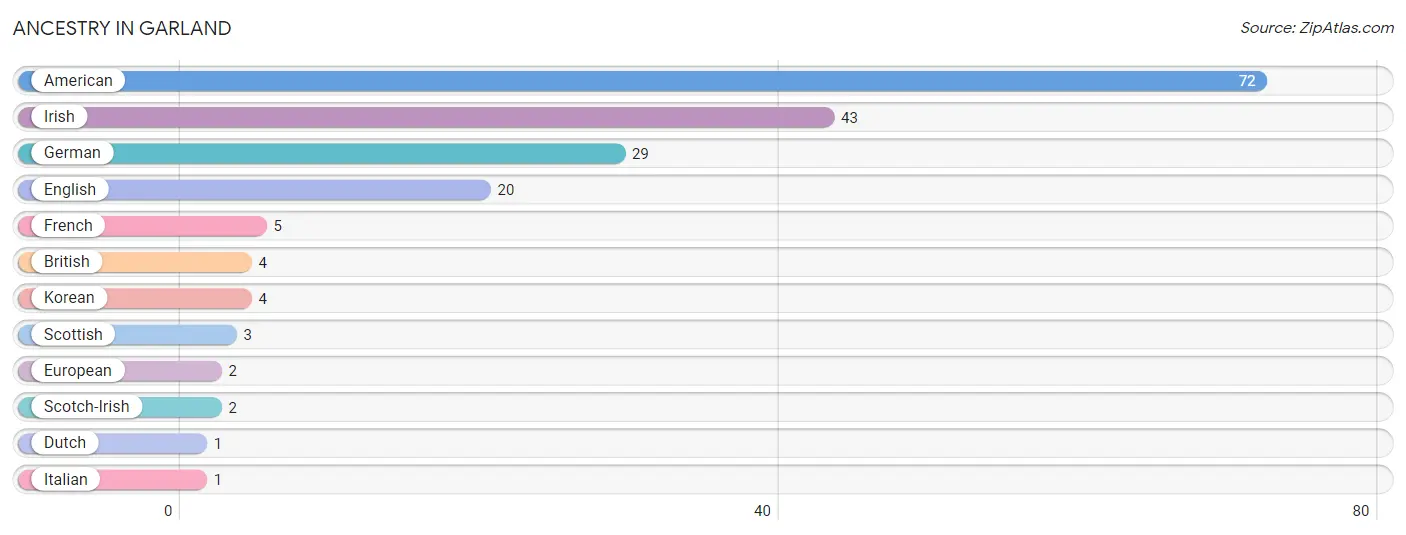
Ancestry in Garland
The most populous ancestries reported in Garland are American (72 | 25.4%), Irish (43 | 15.1%), German (29 | 10.2%), English (20 | 7.0%), and French (5 | 1.8%), together accounting for 59.5% of all Garland residents.
| Ancestry | # Population | % Population |
| American | 72 | 25.4% |
| British | 4 | 1.4% |
| Dutch | 1 | 0.4% |
| English | 20 | 7.0% |
| European | 2 | 0.7% |
| French | 5 | 1.8% |
| German | 29 | 10.2% |
| Irish | 43 | 15.1% |
| Italian | 1 | 0.4% |
| Korean | 4 | 1.4% |
| Scotch-Irish | 2 | 0.7% |
| Scottish | 3 | 1.1% | View All 12 Rows |
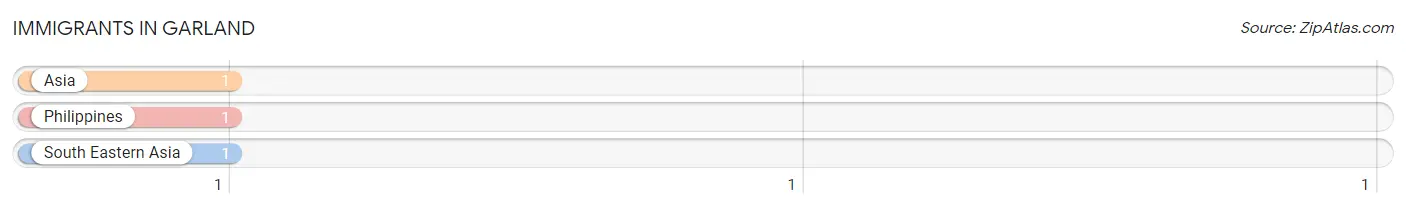
Immigrants in Garland
The most numerous immigrant groups reported in Garland came from Asia (1 | 0.4%), Philippines (1 | 0.4%), and South Eastern Asia (1 | 0.4%), together accounting for 1.1% of all Garland residents.
| Immigration Origin | # Population | % Population |
| Asia | 1 | 0.4% |
| Philippines | 1 | 0.4% |
| South Eastern Asia | 1 | 0.4% | View All 3 Rows |
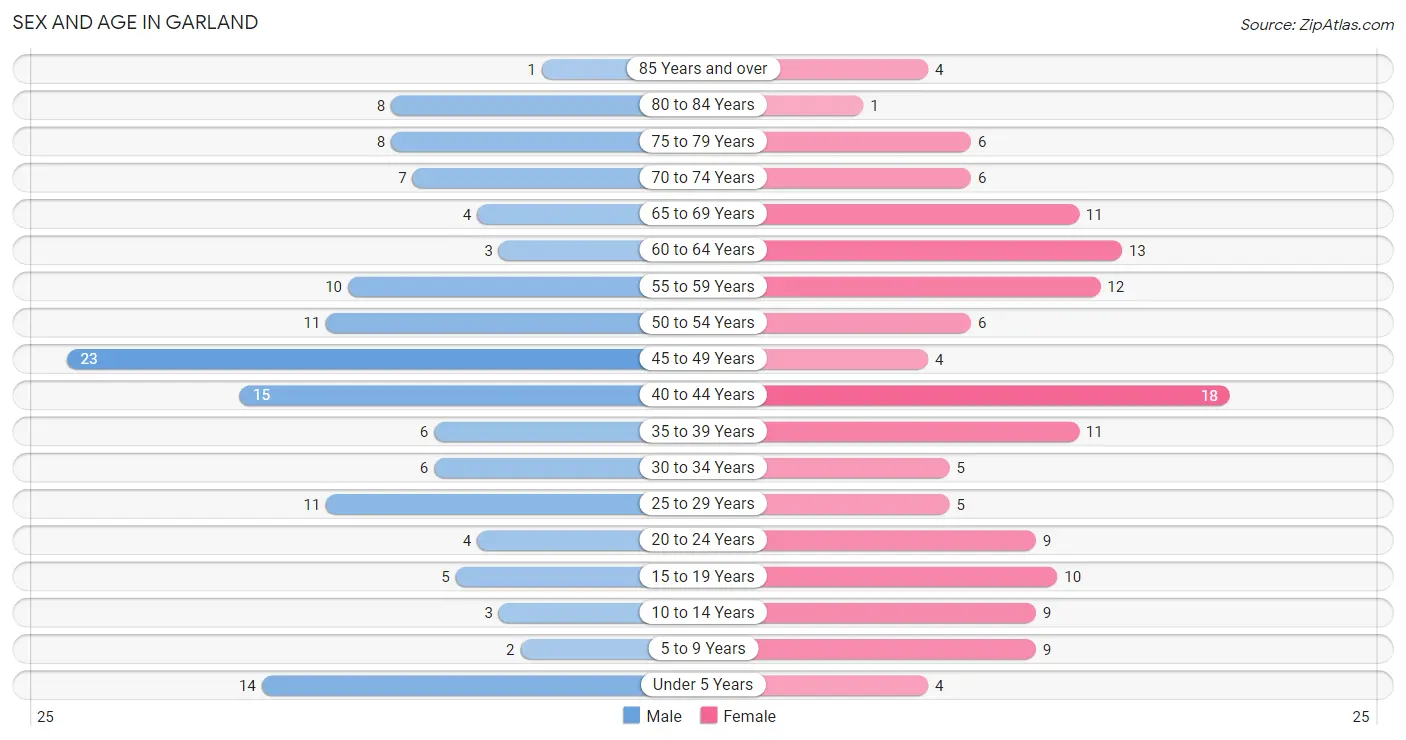
Sex and Age in Garland
Sex and Age in Garland
The most populous age groups in Garland are 45 to 49 Years (23 | 16.3%) for men and 40 to 44 Years (18 | 12.6%) for women.
| Age Bracket | Male | Female |
| Under 5 Years | 14 (9.9%) | 4 (2.8%) |
| 5 to 9 Years | 2 (1.4%) | 9 (6.3%) |
| 10 to 14 Years | 3 (2.1%) | 9 (6.3%) |
| 15 to 19 Years | 5 (3.5%) | 10 (7.0%) |
| 20 to 24 Years | 4 (2.8%) | 9 (6.3%) |
| 25 to 29 Years | 11 (7.8%) | 5 (3.5%) |
| 30 to 34 Years | 6 (4.3%) | 5 (3.5%) |
| 35 to 39 Years | 6 (4.3%) | 11 (7.7%) |
| 40 to 44 Years | 15 (10.6%) | 18 (12.6%) |
| 45 to 49 Years | 23 (16.3%) | 4 (2.8%) |
| 50 to 54 Years | 11 (7.8%) | 6 (4.2%) |
| 55 to 59 Years | 10 (7.1%) | 12 (8.4%) |
| 60 to 64 Years | 3 (2.1%) | 13 (9.1%) |
| 65 to 69 Years | 4 (2.8%) | 11 (7.7%) |
| 70 to 74 Years | 7 (5.0%) | 6 (4.2%) |
| 75 to 79 Years | 8 (5.7%) | 6 (4.2%) |
| 80 to 84 Years | 8 (5.7%) | 1 (0.7%) |
| 85 Years and over | 1 (0.7%) | 4 (2.8%) |
| Total | 141 (100.0%) | 143 (100.0%) |
Families and Households in Garland
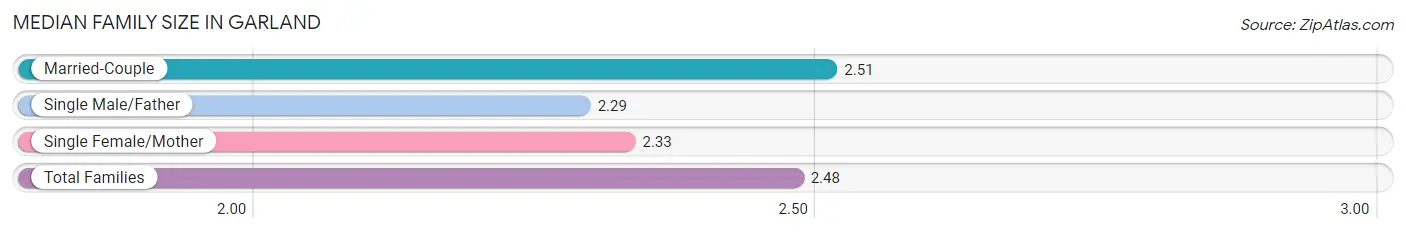
Median Family Size in Garland
The median family size in Garland is 2.48 persons per family, with married-couple families (82 | 83.7%) accounting for the largest median family size of 2.51 persons per family. On the other hand, single male/father families (7 | 7.1%) represent the smallest median family size with 2.29 persons per family.
| Family Type | # Families | Family Size |
| Married-Couple | 82 (83.7%) | 2.51 |
| Single Male/Father | 7 (7.1%) | 2.29 |
| Single Female/Mother | 9 (9.2%) | 2.33 |
| Total Families | 98 (100.0%) | 2.48 |
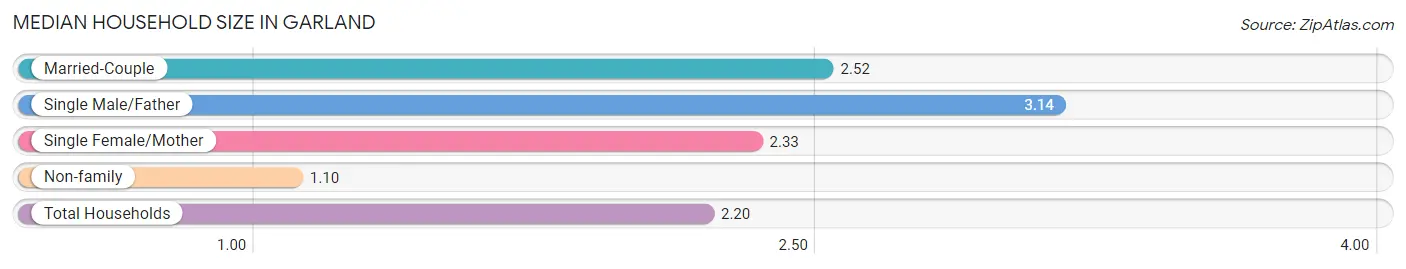
Median Household Size in Garland
The median household size in Garland is 2.20 persons per household, with single male/father households (7 | 5.4%) accounting for the largest median household size of 3.14 persons per household. non-family households (31 | 24.0%) represent the smallest median household size with 1.10 persons per household.
| Household Type | # Households | Household Size |
| Married-Couple | 82 (63.6%) | 2.52 |
| Single Male/Father | 7 (5.4%) | 3.14 |
| Single Female/Mother | 9 (7.0%) | 2.33 |
| Non-family | 31 (24.0%) | 1.10 |
| Total Households | 129 (100.0%) | 2.20 |
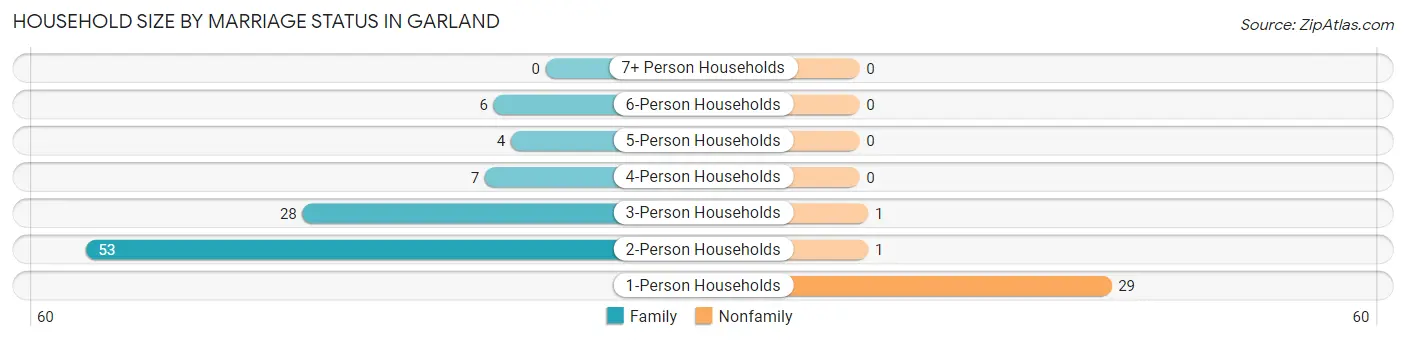
Household Size by Marriage Status in Garland
Out of a total of 129 households in Garland, 98 (76.0%) are family households, while 31 (24.0%) are nonfamily households. The most numerous type of family households are 2-person households, comprising 53, and the most common type of nonfamily households are 1-person households, comprising 29.
| Household Size | Family Households | Nonfamily Households |
| 1-Person Households | - | 29 (22.5%) |
| 2-Person Households | 53 (41.1%) | 1 (0.8%) |
| 3-Person Households | 28 (21.7%) | 1 (0.8%) |
| 4-Person Households | 7 (5.4%) | 0 (0.0%) |
| 5-Person Households | 4 (3.1%) | 0 (0.0%) |
| 6-Person Households | 6 (4.6%) | 0 (0.0%) |
| 7+ Person Households | 0 (0.0%) | 0 (0.0%) |
| Total | 98 (76.0%) | 31 (24.0%) |
Female Fertility in Garland
Fertility by Age in Garland
Average fertility rate in Garland is 227.0 births per 1,000 women. Women in the age bracket of 35 to 50 years have the highest fertility rate with 324.0 births per 1,000 women. Women in the age bracket of 35 to 50 years acount for 80.0% of all women with births.
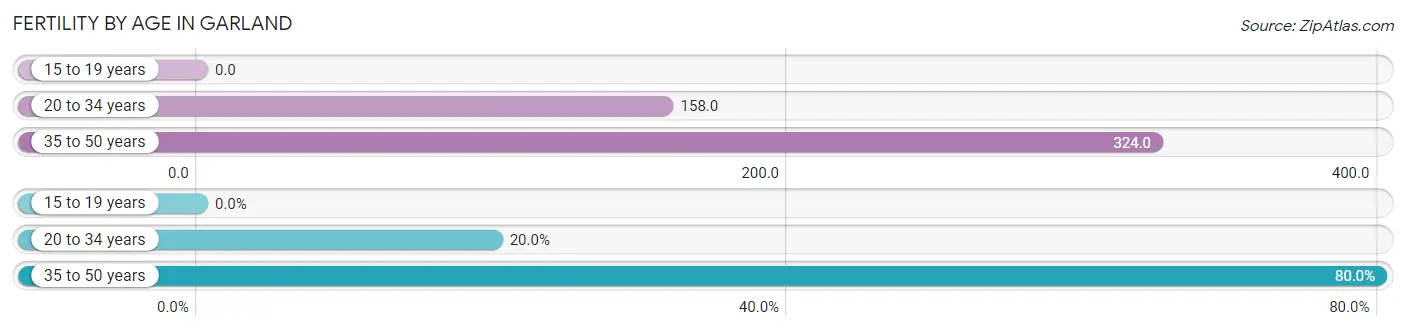
| Age Bracket | Women with Births | Births / 1,000 Women |
| 15 to 19 years | 0 (0.0%) | 0.0 |
| 20 to 34 years | 3 (20.0%) | 158.0 |
| 35 to 50 years | 12 (80.0%) | 324.0 |
| Total | 15 (100.0%) | 227.0 |
Fertility by Age by Marriage Status in Garland
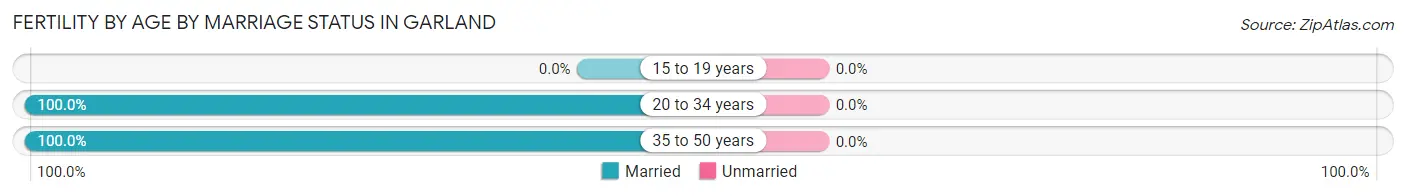
| Age Bracket | Married | Unmarried |
| 15 to 19 years | 0 (0.0%) | 0 (0.0%) |
| 20 to 34 years | 3 (100.0%) | 0 (0.0%) |
| 35 to 50 years | 12 (100.0%) | 0 (0.0%) |
| Total | 15 (100.0%) | 0 (0.0%) |
Fertility by Education in Garland
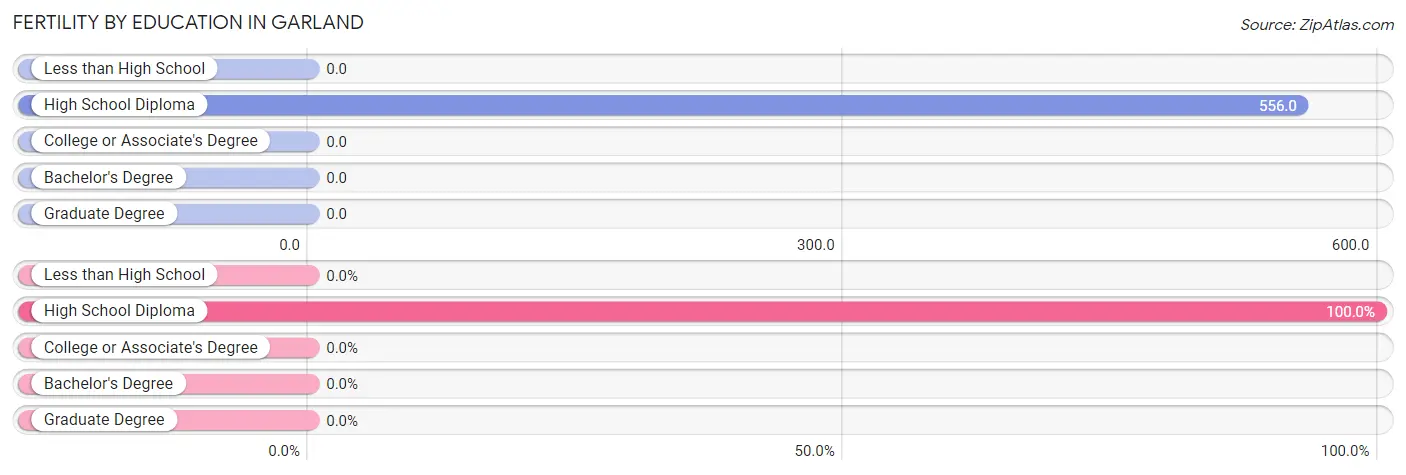
| Educational Attainment | Women with Births | Births / 1,000 Women |
| Less than High School | 0 (0.0%) | 0.0 |
| High School Diploma | 15 (100.0%) | 556.0 |
| College or Associate's Degree | 0 (0.0%) | 0.0 |
| Bachelor's Degree | 0 (0.0%) | 0.0 |
| Graduate Degree | 0 (0.0%) | 0.0 |
| Total | 15 (100.0%) | 227.0 |
Fertility by Education by Marriage Status in Garland
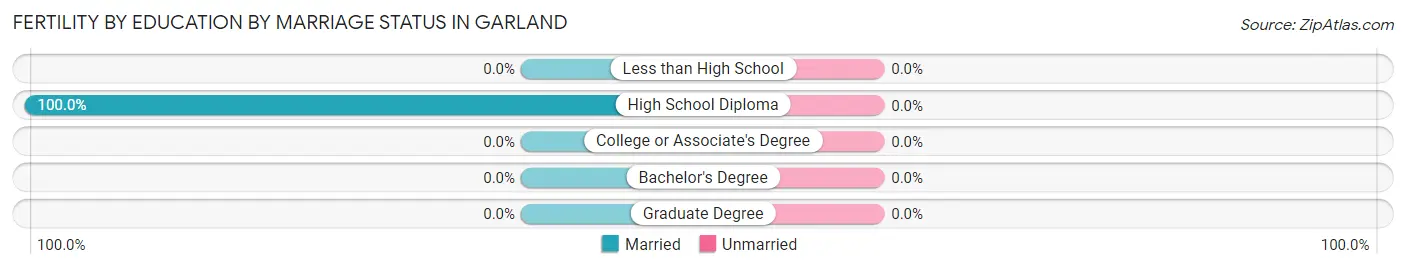
| Educational Attainment | Married | Unmarried |
| Less than High School | 0 (0.0%) | 0 (0.0%) |
| High School Diploma | 15 (100.0%) | 0 (0.0%) |
| College or Associate's Degree | 0 (0.0%) | 0 (0.0%) |
| Bachelor's Degree | 0 (0.0%) | 0 (0.0%) |
| Graduate Degree | 0 (0.0%) | 0 (0.0%) |
| Total | 15 (100.0%) | 0 (0.0%) |
Income in Garland
Income Overview in Garland
Per Capita Income in Garland is $34,314, while median incomes of families and households are $90,114 and $70,625 respectively.
| Characteristic | Number | Measure |
| Per Capita Income | 284 | $34,314 |
| Median Family Income | 98 | $90,114 |
| Mean Family Income | 98 | $85,711 |
| Median Household Income | 129 | $70,625 |
| Mean Household Income | 129 | $78,612 |
| Income Deficit | 98 | $0 |
| Wage / Income Gap (%) | 284 | 0.40% |
| Wage / Income Gap ($) | 284 | 99.60¢ per $1 |
| Gini / Inequality Index | 284 | 0.30 |
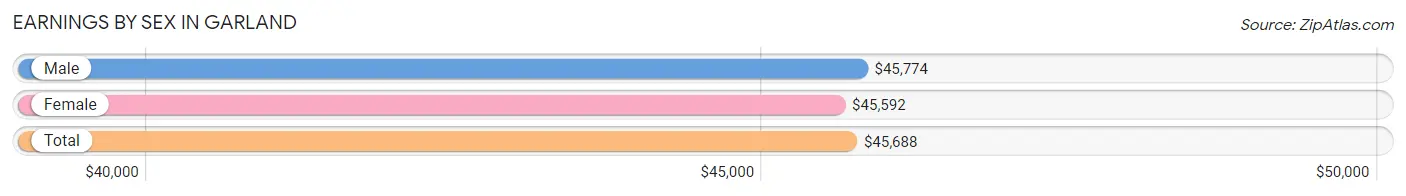
Earnings by Sex in Garland
Average Earnings in Garland are $45,688, $45,774 for men and $45,592 for women, a difference of 0.4%.
| Sex | Number | Average Earnings |
| Male | 87 (52.4%) | $45,774 |
| Female | 79 (47.6%) | $45,592 |
| Total | 166 (100.0%) | $45,688 |
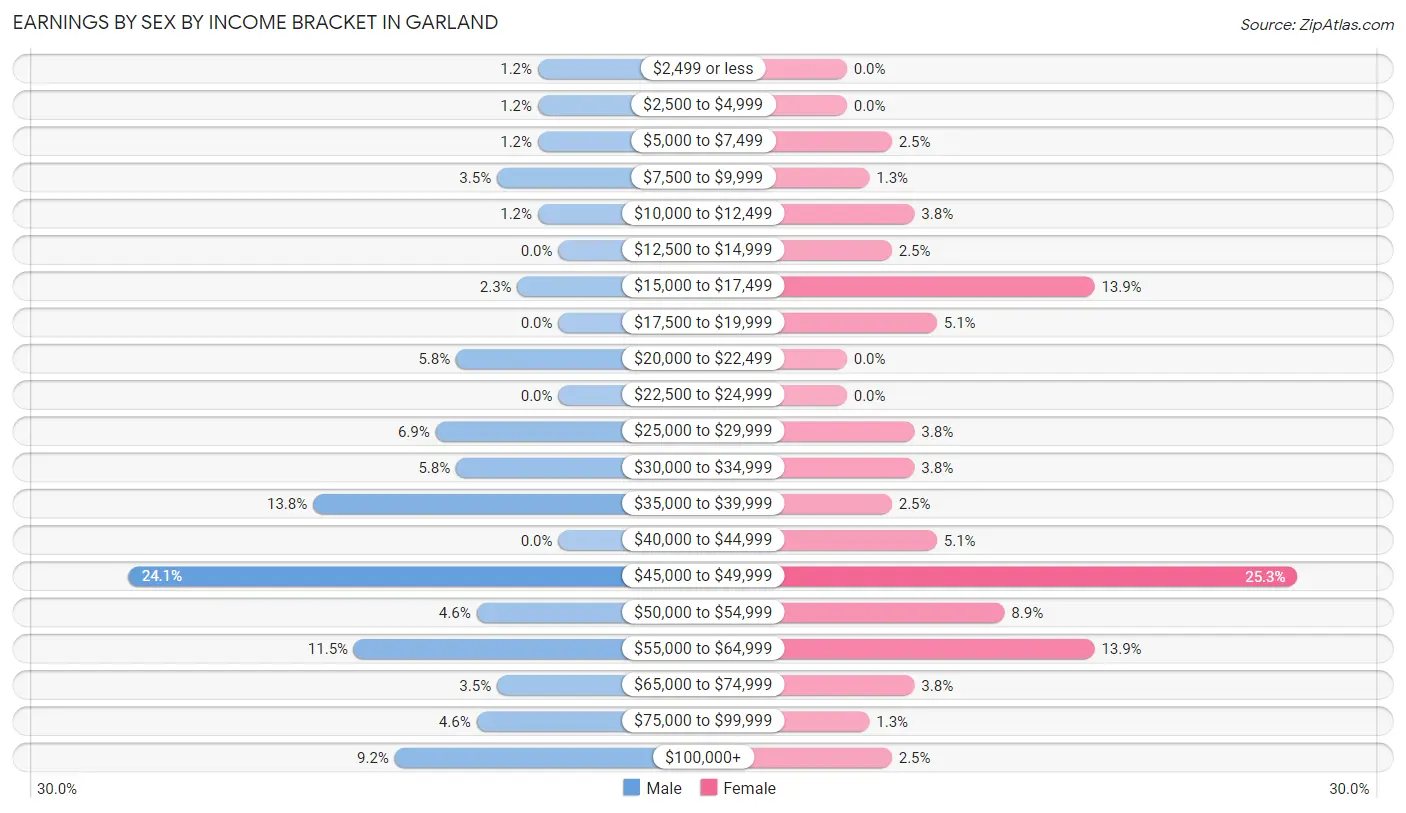
Earnings by Sex by Income Bracket in Garland
The most common earnings brackets in Garland are $45,000 to $49,999 for men (21 | 24.1%) and $45,000 to $49,999 for women (20 | 25.3%).
| Income | Male | Female |
| $2,499 or less | 1 (1.1%) | 0 (0.0%) |
| $2,500 to $4,999 | 1 (1.1%) | 0 (0.0%) |
| $5,000 to $7,499 | 1 (1.1%) | 2 (2.5%) |
| $7,500 to $9,999 | 3 (3.5%) | 1 (1.3%) |
| $10,000 to $12,499 | 1 (1.1%) | 3 (3.8%) |
| $12,500 to $14,999 | 0 (0.0%) | 2 (2.5%) |
| $15,000 to $17,499 | 2 (2.3%) | 11 (13.9%) |
| $17,500 to $19,999 | 0 (0.0%) | 4 (5.1%) |
| $20,000 to $22,499 | 5 (5.8%) | 0 (0.0%) |
| $22,500 to $24,999 | 0 (0.0%) | 0 (0.0%) |
| $25,000 to $29,999 | 6 (6.9%) | 3 (3.8%) |
| $30,000 to $34,999 | 5 (5.8%) | 3 (3.8%) |
| $35,000 to $39,999 | 12 (13.8%) | 2 (2.5%) |
| $40,000 to $44,999 | 0 (0.0%) | 4 (5.1%) |
| $45,000 to $49,999 | 21 (24.1%) | 20 (25.3%) |
| $50,000 to $54,999 | 4 (4.6%) | 7 (8.9%) |
| $55,000 to $64,999 | 10 (11.5%) | 11 (13.9%) |
| $65,000 to $74,999 | 3 (3.5%) | 3 (3.8%) |
| $75,000 to $99,999 | 4 (4.6%) | 1 (1.3%) |
| $100,000+ | 8 (9.2%) | 2 (2.5%) |
| Total | 87 (100.0%) | 79 (100.0%) |
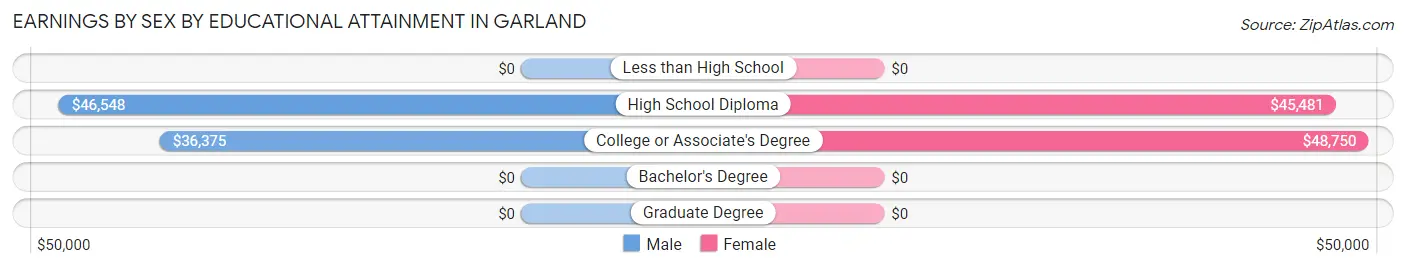
Earnings by Sex by Educational Attainment in Garland
Average earnings in Garland are $46,071 for men and $46,184 for women, a difference of 0.2%. Men with an educational attainment of high school diploma enjoy the highest average annual earnings of $46,548, while those with college or associate's degree education earn the least with $36,375. Women with an educational attainment of college or associate's degree earn the most with the average annual earnings of $48,750, while those with high school diploma education have the smallest earnings of $45,481.
| Educational Attainment | Male Income | Female Income |
| Less than High School | - | - |
| High School Diploma | $46,548 | $45,481 |
| College or Associate's Degree | $36,375 | $48,750 |
| Bachelor's Degree | - | - |
| Graduate Degree | - | - |
| Total | $46,071 | $46,184 |
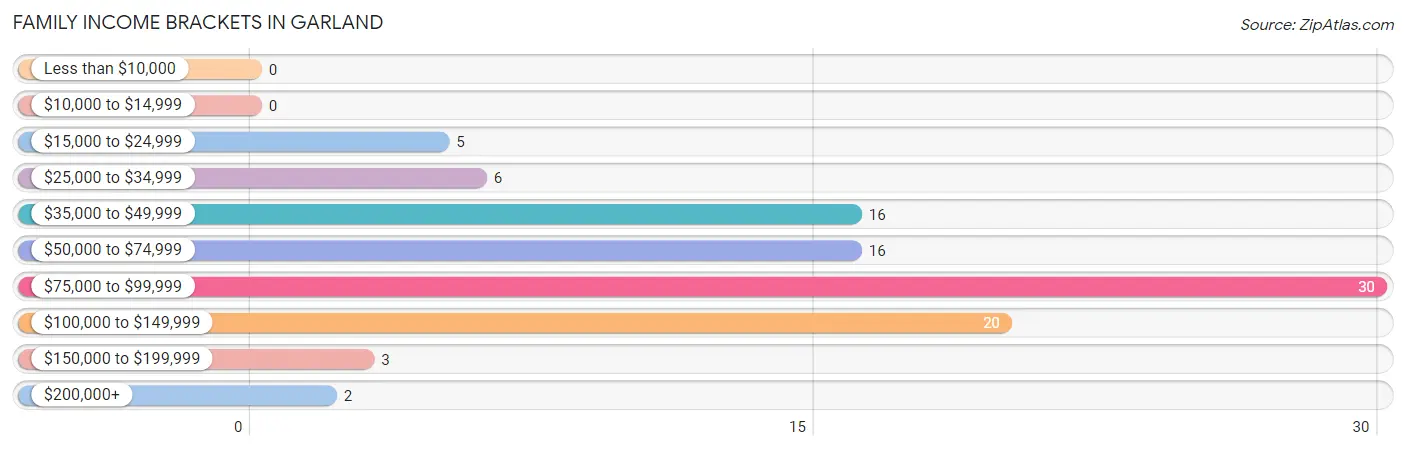
Family Income in Garland
Family Income Brackets in Garland
According to the Garland family income data, there are 30 families falling into the $75,000 to $99,999 income range, which is the most common income bracket and makes up 30.6% of all families.
| Income Bracket | # Families | % Families |
| Less than $10,000 | 0 | 0.0% |
| $10,000 to $14,999 | 0 | 0.0% |
| $15,000 to $24,999 | 5 | 5.1% |
| $25,000 to $34,999 | 6 | 6.1% |
| $35,000 to $49,999 | 16 | 16.3% |
| $50,000 to $74,999 | 16 | 16.3% |
| $75,000 to $99,999 | 30 | 30.6% |
| $100,000 to $149,999 | 20 | 20.4% |
| $150,000 to $199,999 | 3 | 3.1% |
| $200,000+ | 2 | 2.0% |
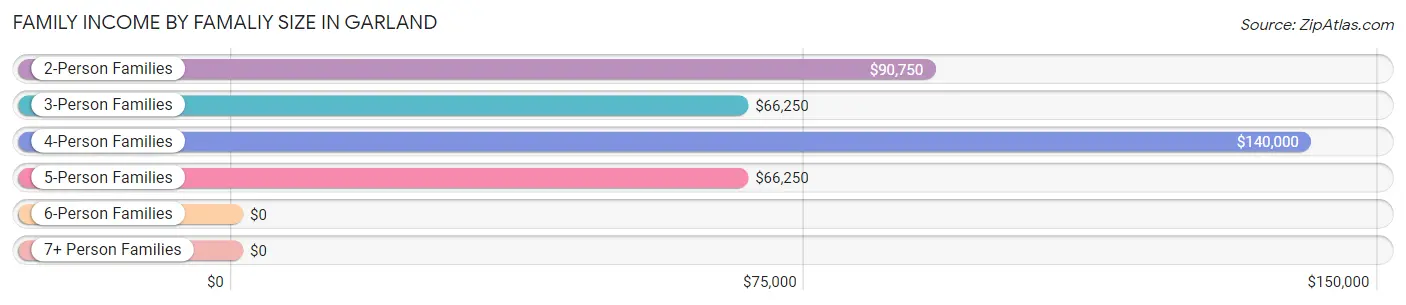
Family Income by Famaliy Size in Garland
4-person families (6 | 6.1%) account for the highest median family income in Garland with $140,000 per family, while 2-person families (58 | 59.2%) have the highest median income of $45,375 per family member.
| Income Bracket | # Families | Median Income |
| 2-Person Families | 58 (59.2%) | $90,750 |
| 3-Person Families | 24 (24.5%) | $66,250 |
| 4-Person Families | 6 (6.1%) | $140,000 |
| 5-Person Families | 6 (6.1%) | $66,250 |
| 6-Person Families | 4 (4.1%) | $0 |
| 7+ Person Families | 0 (0.0%) | $0 |
| Total | 98 (100.0%) | $90,114 |
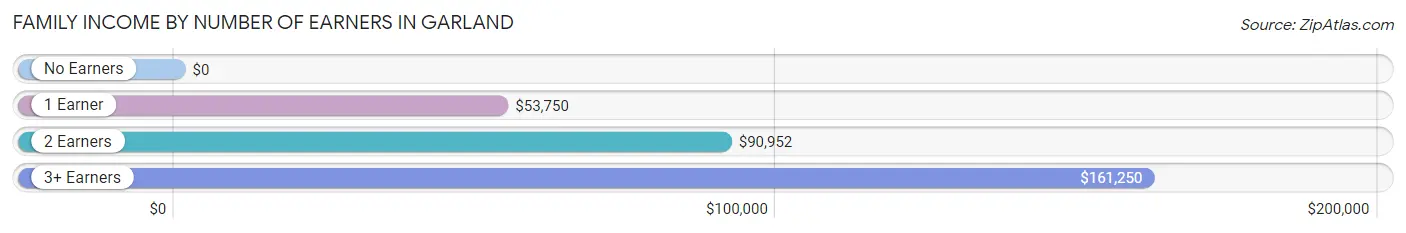
Family Income by Number of Earners in Garland
| Number of Earners | # Families | Median Income |
| No Earners | 17 (17.3%) | $0 |
| 1 Earner | 19 (19.4%) | $53,750 |
| 2 Earners | 56 (57.1%) | $90,952 |
| 3+ Earners | 6 (6.1%) | $161,250 |
| Total | 98 (100.0%) | $90,114 |
Household Income in Garland
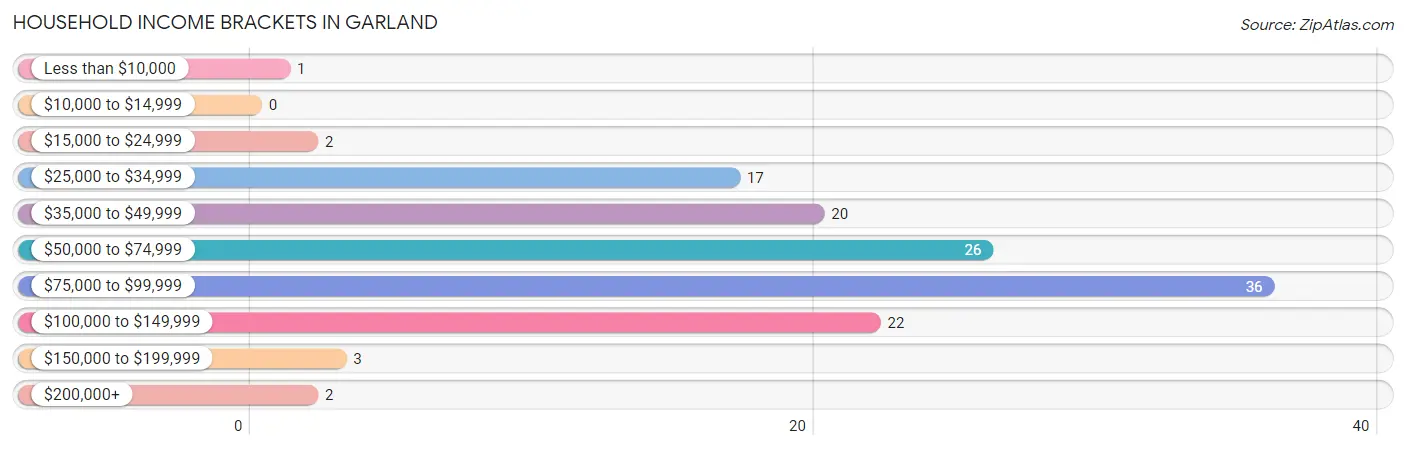
Household Income Brackets in Garland
With 36 households falling in the category, the $75,000 to $99,999 income range is the most frequent in Garland, accounting for 27.9% of all households.
| Income Bracket | # Households | % Households |
| Less than $10,000 | 1 | 0.8% |
| $10,000 to $14,999 | 0 | 0.0% |
| $15,000 to $24,999 | 2 | 1.6% |
| $25,000 to $34,999 | 17 | 13.2% |
| $35,000 to $49,999 | 20 | 15.5% |
| $50,000 to $74,999 | 26 | 20.2% |
| $75,000 to $99,999 | 36 | 27.9% |
| $100,000 to $149,999 | 22 | 17.1% |
| $150,000 to $199,999 | 3 | 2.3% |
| $200,000+ | 2 | 1.6% |
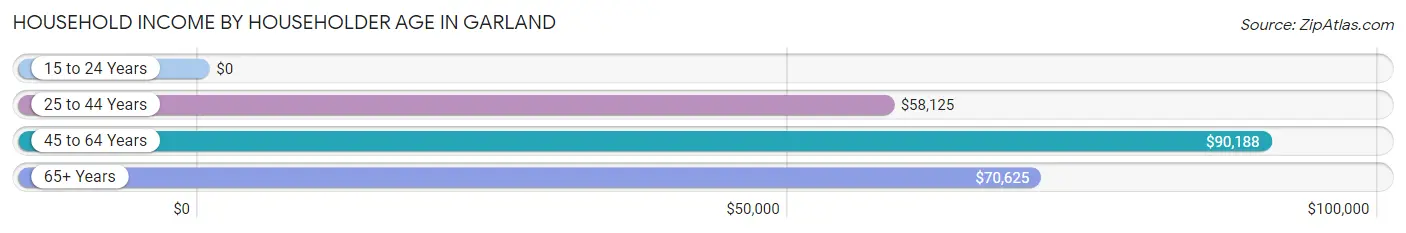
Household Income by Householder Age in Garland
The median household income in Garland is $70,625, with the highest median household income of $90,188 found in the 45 to 64 years age bracket for the primary householder. A total of 57 households (44.2%) fall into this category. Meanwhile, the 15 to 24 years age bracket for the primary householder has the lowest median household income of $0, with 2 households (1.5%) in this group.
| Income Bracket | # Households | Median Income |
| 15 to 24 Years | 2 (1.5%) | $0 |
| 25 to 44 Years | 35 (27.1%) | $58,125 |
| 45 to 64 Years | 57 (44.2%) | $90,188 |
| 65+ Years | 35 (27.1%) | $70,625 |
| Total | 129 (100.0%) | $70,625 |
Poverty in Garland
Income Below Poverty by Sex and Age in Garland
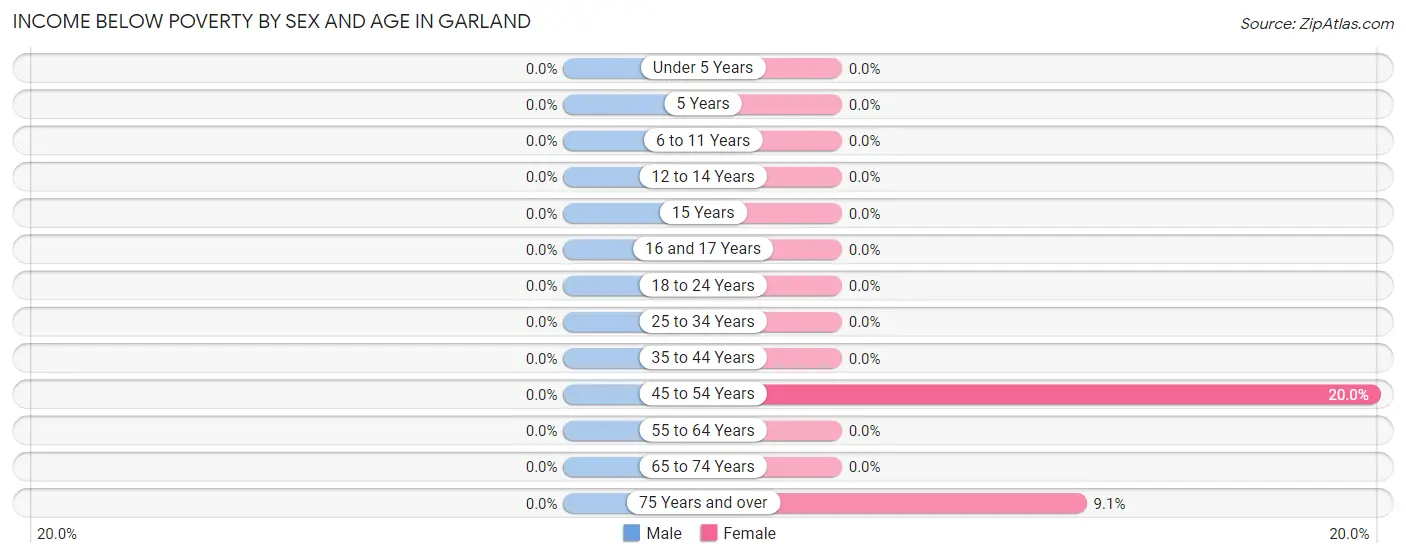
| Age Bracket | Male | Female |
| Under 5 Years | 0 (0.0%) | 0 (0.0%) |
| 5 Years | 0 (0.0%) | 0 (0.0%) |
| 6 to 11 Years | 0 (0.0%) | 0 (0.0%) |
| 12 to 14 Years | 0 (0.0%) | 0 (0.0%) |
| 15 Years | 0 (0.0%) | 0 (0.0%) |
| 16 and 17 Years | 0 (0.0%) | 0 (0.0%) |
| 18 to 24 Years | 0 (0.0%) | 0 (0.0%) |
| 25 to 34 Years | 0 (0.0%) | 0 (0.0%) |
| 35 to 44 Years | 0 (0.0%) | 0 (0.0%) |
| 45 to 54 Years | 0 (0.0%) | 2 (20.0%) |
| 55 to 64 Years | 0 (0.0%) | 0 (0.0%) |
| 65 to 74 Years | 0 (0.0%) | 0 (0.0%) |
| 75 Years and over | 0 (0.0%) | 1 (9.1%) |
| Total | 0 (0.0%) | 3 (2.1%) |
Income Above Poverty by Sex and Age in Garland
According to the poverty statistics in Garland, males aged under 5 years and females aged under 5 years are the age groups that are most secure financially, with 100.0% of males and 100.0% of females in these age groups living above the poverty line.
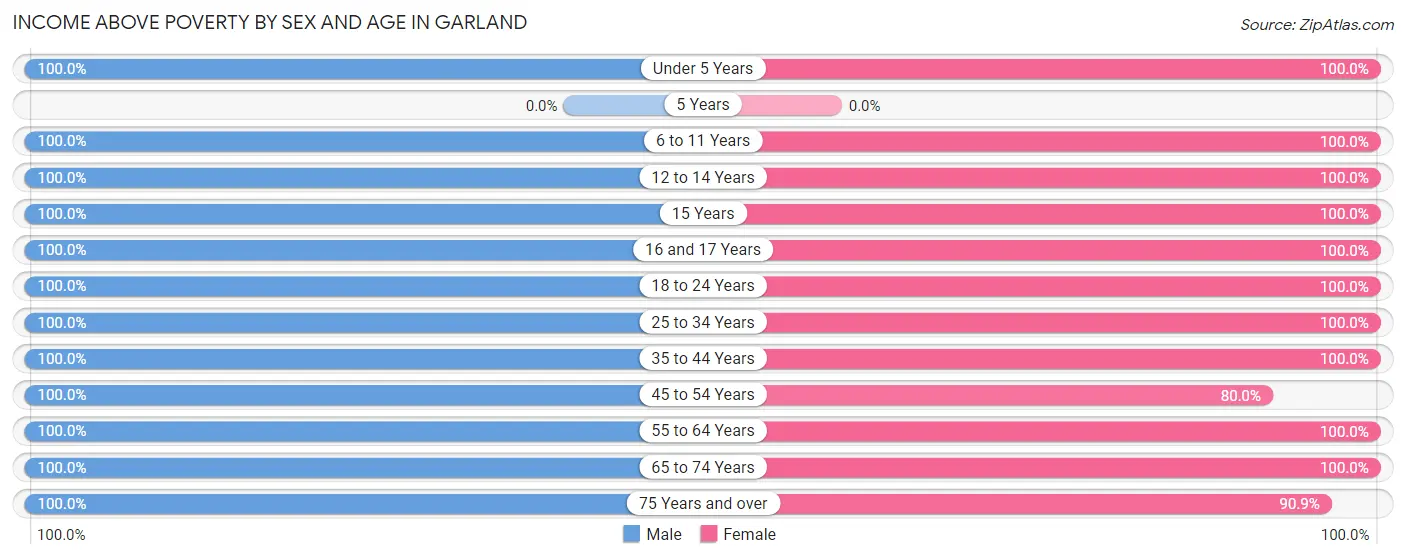
| Age Bracket | Male | Female |
| Under 5 Years | 14 (100.0%) | 4 (100.0%) |
| 5 Years | 0 (0.0%) | 0 (0.0%) |
| 6 to 11 Years | 3 (100.0%) | 12 (100.0%) |
| 12 to 14 Years | 2 (100.0%) | 5 (100.0%) |
| 15 Years | 2 (100.0%) | 2 (100.0%) |
| 16 and 17 Years | 1 (100.0%) | 6 (100.0%) |
| 18 to 24 Years | 6 (100.0%) | 11 (100.0%) |
| 25 to 34 Years | 17 (100.0%) | 10 (100.0%) |
| 35 to 44 Years | 21 (100.0%) | 29 (100.0%) |
| 45 to 54 Years | 34 (100.0%) | 8 (80.0%) |
| 55 to 64 Years | 13 (100.0%) | 25 (100.0%) |
| 65 to 74 Years | 11 (100.0%) | 17 (100.0%) |
| 75 Years and over | 17 (100.0%) | 10 (90.9%) |
| Total | 141 (100.0%) | 139 (97.9%) |
Income Below Poverty Among Married-Couple Families in Garland
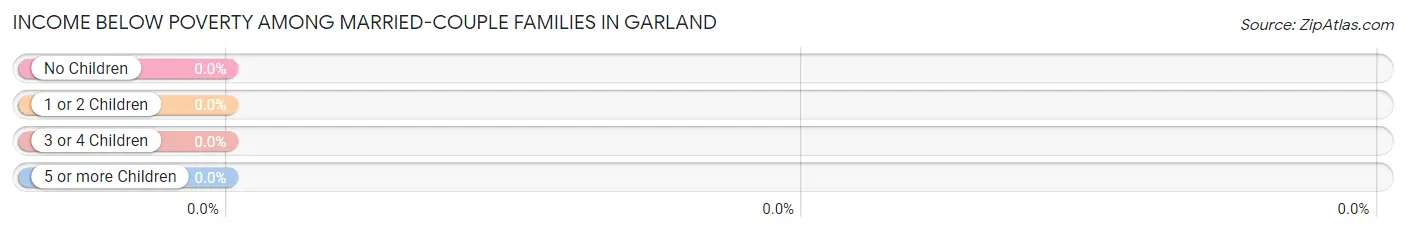
| Children | Above Poverty | Below Poverty |
| No Children | 56 (100.0%) | 0 (0.0%) |
| 1 or 2 Children | 16 (100.0%) | 0 (0.0%) |
| 3 or 4 Children | 10 (100.0%) | 0 (0.0%) |
| 5 or more Children | 0 (0.0%) | 0 (0.0%) |
| Total | 82 (100.0%) | 0 (0.0%) |
Income Below Poverty Among Single-Parent Households in Garland
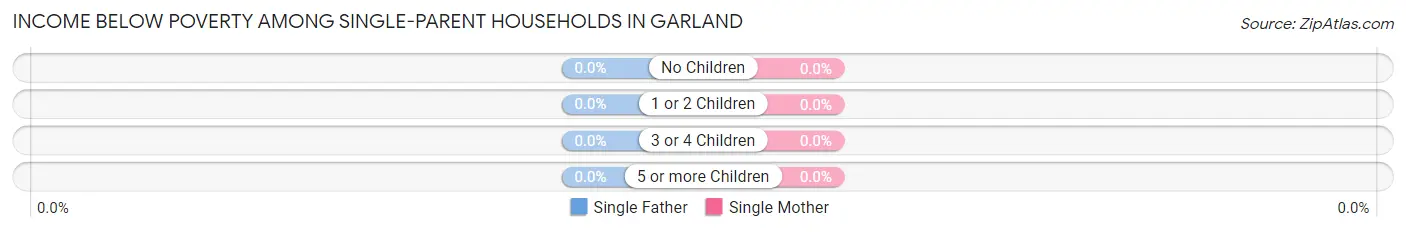
| Children | Single Father | Single Mother |
| No Children | 0 (0.0%) | 0 (0.0%) |
| 1 or 2 Children | 0 (0.0%) | 0 (0.0%) |
| 3 or 4 Children | 0 (0.0%) | 0 (0.0%) |
| 5 or more Children | 0 (0.0%) | 0 (0.0%) |
| Total | 0 (0.0%) | 0 (0.0%) |
Income Below Poverty Among Married-Couple vs Single-Parent Households in Garland
| Children | Married-Couple Families | Single-Parent Households |
| No Children | 0 (0.0%) | 0 (0.0%) |
| 1 or 2 Children | 0 (0.0%) | 0 (0.0%) |
| 3 or 4 Children | 0 (0.0%) | 0 (0.0%) |
| 5 or more Children | 0 (0.0%) | 0 (0.0%) |
| Total | 0 (0.0%) | 0 (0.0%) |
Employment Characteristics in Garland
Employment by Class of Employer in Garland
Among the 146 employed individuals in Garland, private company employees (70 | 47.9%), state government employees (23 | 15.8%), and self-employed (incorporated) (22 | 15.1%) make up the most common classes of employment.
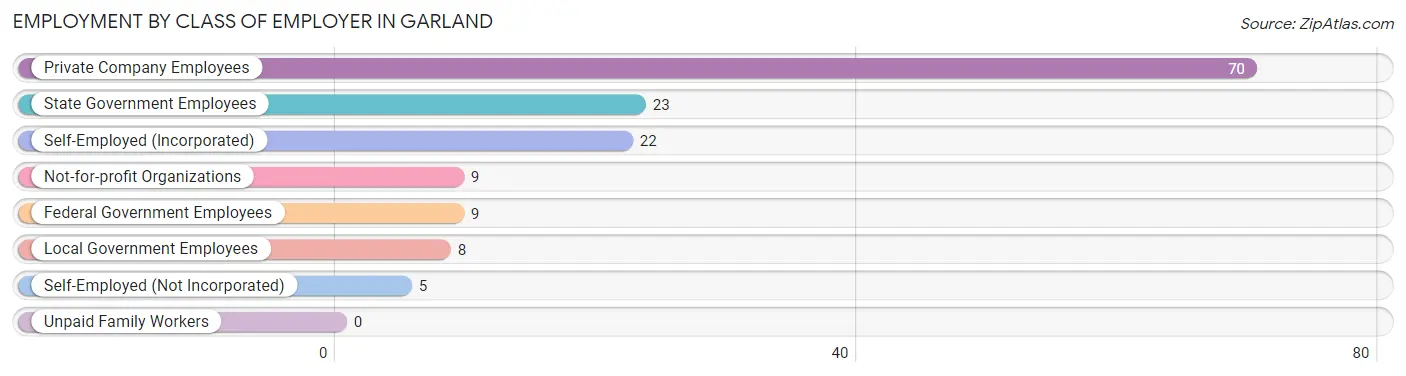
| Employer Class | # Employees | % Employees |
| Private Company Employees | 70 | 47.9% |
| Self-Employed (Incorporated) | 22 | 15.1% |
| Self-Employed (Not Incorporated) | 5 | 3.4% |
| Not-for-profit Organizations | 9 | 6.2% |
| Local Government Employees | 8 | 5.5% |
| State Government Employees | 23 | 15.8% |
| Federal Government Employees | 9 | 6.2% |
| Unpaid Family Workers | 0 | 0.0% |
| Total | 146 | 100.0% |
Employment Status by Age in Garland
According to the labor force statistics for Garland, out of the total population over 16 years of age (239), 64.4% or 154 individuals are in the labor force, with 1.9% or 3 of them unemployed. The age group with the highest labor force participation rate is 30 to 34 years, with 100.0% or 11 individuals in the labor force. Within the labor force, the 16 to 19 years age range has the highest percentage of unemployed individuals, with 100.0% or 2 of them being unemployed.
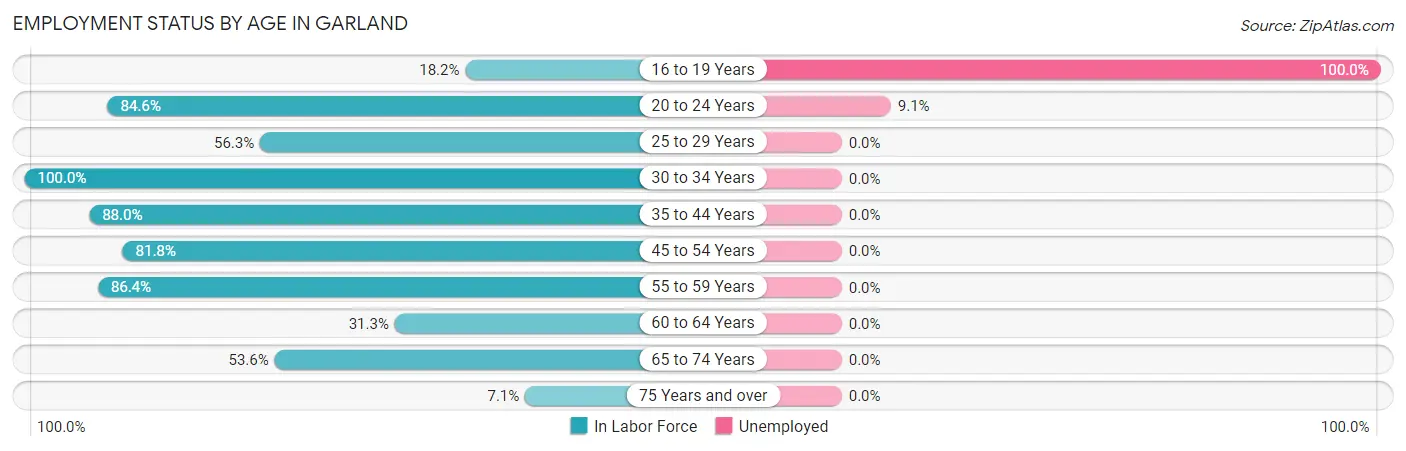
| Age Bracket | In Labor Force | Unemployed |
| 16 to 19 Years | 2 (18.2%) | 2 (100.0%) |
| 20 to 24 Years | 11 (84.6%) | 1 (9.1%) |
| 25 to 29 Years | 9 (56.3%) | 0 (0.0%) |
| 30 to 34 Years | 11 (100.0%) | 0 (0.0%) |
| 35 to 44 Years | 44 (88.0%) | 0 (0.0%) |
| 45 to 54 Years | 36 (81.8%) | 0 (0.0%) |
| 55 to 59 Years | 19 (86.4%) | 0 (0.0%) |
| 60 to 64 Years | 5 (31.3%) | 0 (0.0%) |
| 65 to 74 Years | 15 (53.6%) | 0 (0.0%) |
| 75 Years and over | 2 (7.1%) | 0 (0.0%) |
| Total | 154 (64.4%) | 3 (1.9%) |
Employment Status by Educational Attainment in Garland
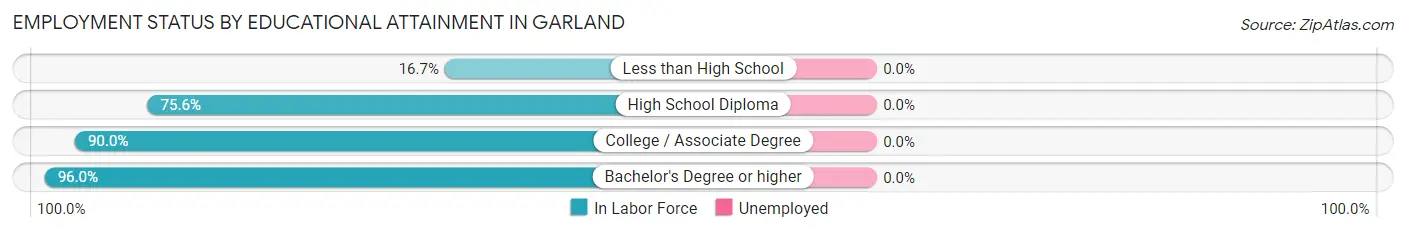
| Educational Attainment | In Labor Force | Unemployed |
| Less than High School | 2 (16.7%) | 0 (0.0%) |
| High School Diploma | 62 (75.6%) | 0 (0.0%) |
| College / Associate Degree | 36 (90.0%) | 0 (0.0%) |
| Bachelor's Degree or higher | 24 (96.0%) | 0 (0.0%) |
| Total | 124 (78.0%) | 0 (0.0%) |
Employment Occupations by Sex in Garland
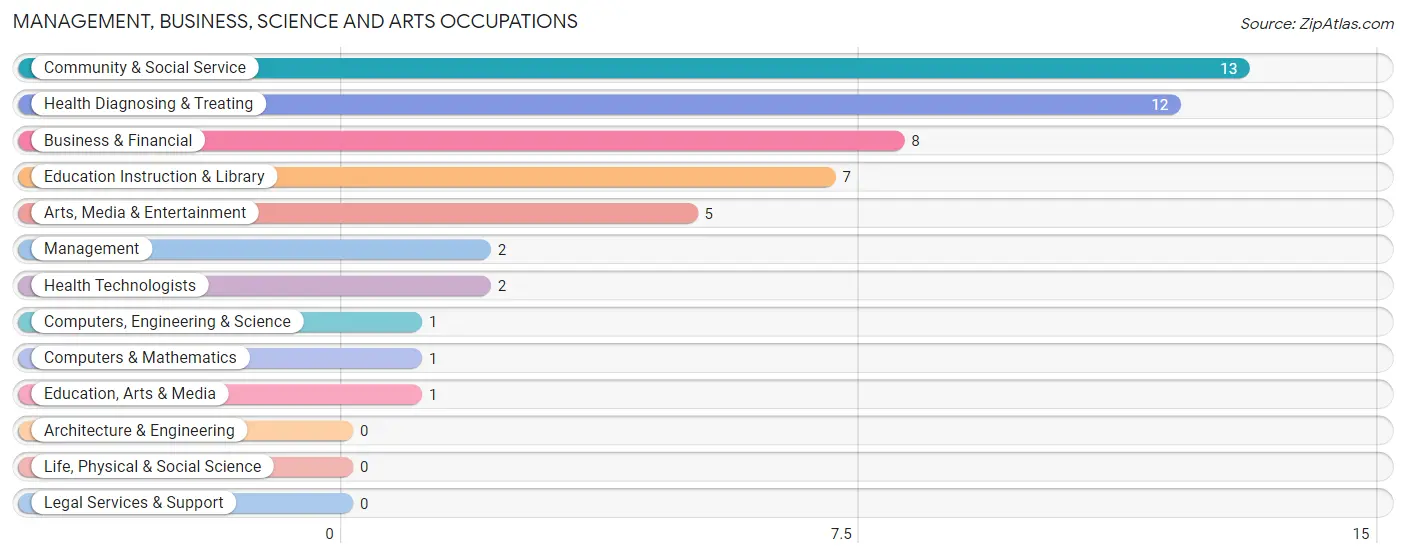
Management, Business, Science and Arts Occupations
The most common Management, Business, Science and Arts occupations in Garland are Community & Social Service (13 | 8.6%), Health Diagnosing & Treating (12 | 8.0%), Business & Financial (8 | 5.3%), Education Instruction & Library (7 | 4.6%), and Arts, Media & Entertainment (5 | 3.3%).
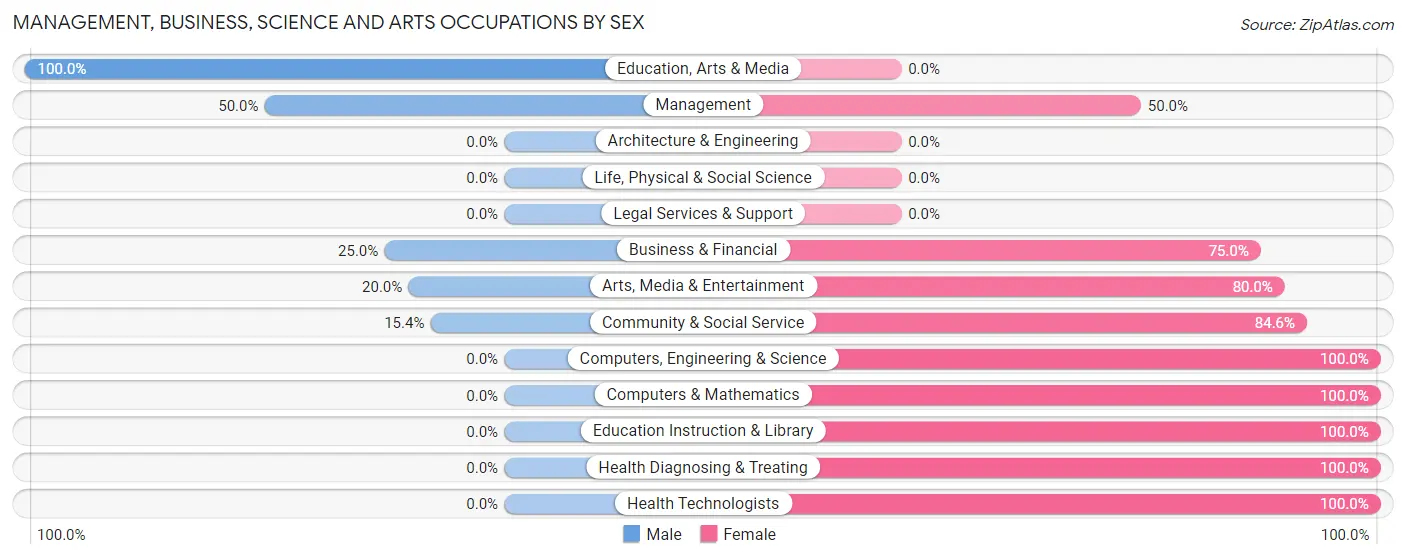
Management, Business, Science and Arts Occupations by Sex
Within the Management, Business, Science and Arts occupations in Garland, the most male-oriented occupations are Education, Arts & Media (100.0%), Management (50.0%), and Business & Financial (25.0%), while the most female-oriented occupations are Computers, Engineering & Science (100.0%), Computers & Mathematics (100.0%), and Education Instruction & Library (100.0%).
| Occupation | Male | Female |
| Management | 1 (50.0%) | 1 (50.0%) |
| Business & Financial | 2 (25.0%) | 6 (75.0%) |
| Computers, Engineering & Science | 0 (0.0%) | 1 (100.0%) |
| Computers & Mathematics | 0 (0.0%) | 1 (100.0%) |
| Architecture & Engineering | 0 (0.0%) | 0 (0.0%) |
| Life, Physical & Social Science | 0 (0.0%) | 0 (0.0%) |
| Community & Social Service | 2 (15.4%) | 11 (84.6%) |
| Education, Arts & Media | 1 (100.0%) | 0 (0.0%) |
| Legal Services & Support | 0 (0.0%) | 0 (0.0%) |
| Education Instruction & Library | 0 (0.0%) | 7 (100.0%) |
| Arts, Media & Entertainment | 1 (20.0%) | 4 (80.0%) |
| Health Diagnosing & Treating | 0 (0.0%) | 12 (100.0%) |
| Health Technologists | 0 (0.0%) | 2 (100.0%) |
| Total (Category) | 5 (13.9%) | 31 (86.1%) |
| Total (Overall) | 85 (56.3%) | 66 (43.7%) |
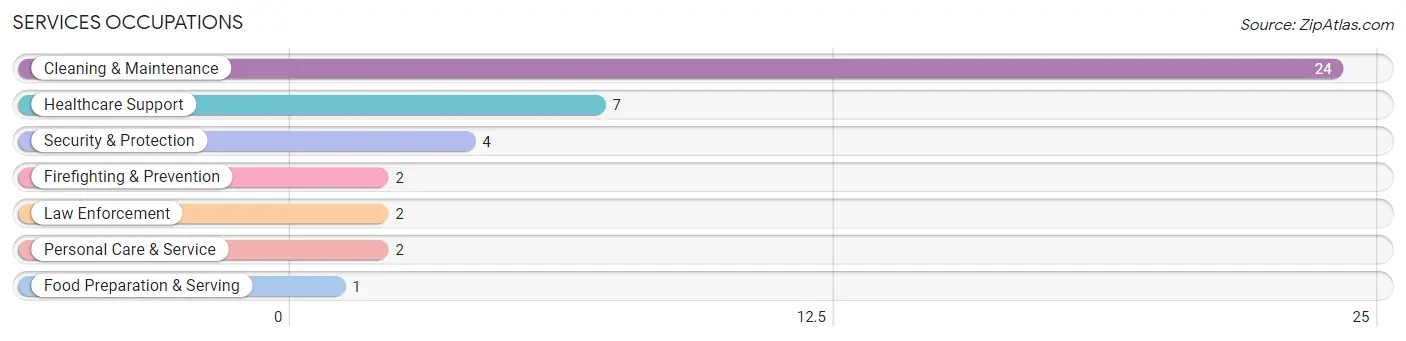
Services Occupations
The most common Services occupations in Garland are Cleaning & Maintenance (24 | 15.9%), Healthcare Support (7 | 4.6%), Security & Protection (4 | 2.6%), Firefighting & Prevention (2 | 1.3%), and Law Enforcement (2 | 1.3%).
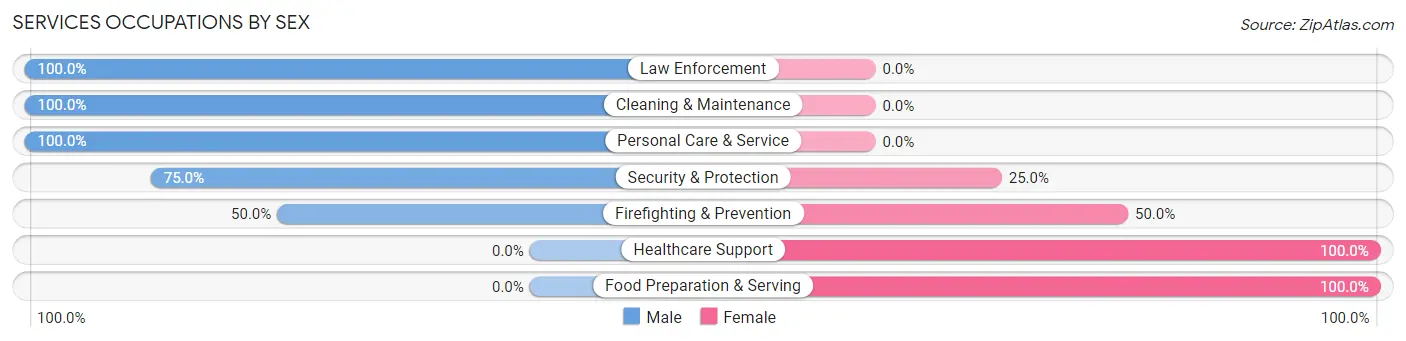
Services Occupations by Sex
Within the Services occupations in Garland, the most male-oriented occupations are Law Enforcement (100.0%), Cleaning & Maintenance (100.0%), and Personal Care & Service (100.0%), while the most female-oriented occupations are Healthcare Support (100.0%), Food Preparation & Serving (100.0%), and Firefighting & Prevention (50.0%).
| Occupation | Male | Female |
| Healthcare Support | 0 (0.0%) | 7 (100.0%) |
| Security & Protection | 3 (75.0%) | 1 (25.0%) |
| Firefighting & Prevention | 1 (50.0%) | 1 (50.0%) |
| Law Enforcement | 2 (100.0%) | 0 (0.0%) |
| Food Preparation & Serving | 0 (0.0%) | 1 (100.0%) |
| Cleaning & Maintenance | 24 (100.0%) | 0 (0.0%) |
| Personal Care & Service | 2 (100.0%) | 0 (0.0%) |
| Total (Category) | 29 (76.3%) | 9 (23.7%) |
| Total (Overall) | 85 (56.3%) | 66 (43.7%) |
Sales and Office Occupations
The most common Sales and Office occupations in Garland are Office & Administration (19 | 12.6%), and Sales & Related (3 | 2.0%).
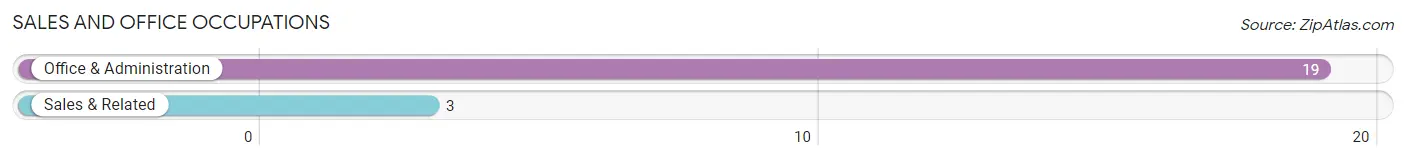
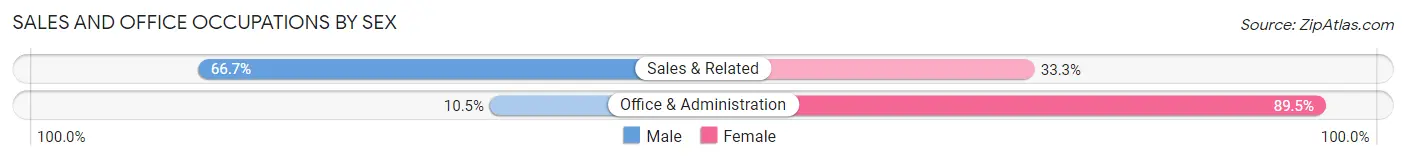
Sales and Office Occupations by Sex
| Occupation | Male | Female |
| Sales & Related | 2 (66.7%) | 1 (33.3%) |
| Office & Administration | 2 (10.5%) | 17 (89.5%) |
| Total (Category) | 4 (18.2%) | 18 (81.8%) |
| Total (Overall) | 85 (56.3%) | 66 (43.7%) |
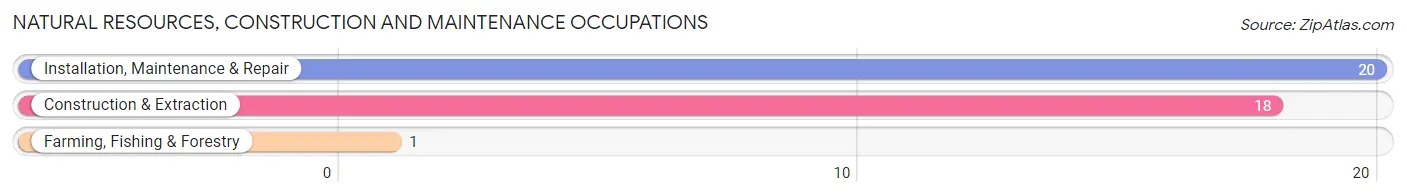
Natural Resources, Construction and Maintenance Occupations
The most common Natural Resources, Construction and Maintenance occupations in Garland are Installation, Maintenance & Repair (20 | 13.3%), Construction & Extraction (18 | 11.9%), and Farming, Fishing & Forestry (1 | 0.7%).
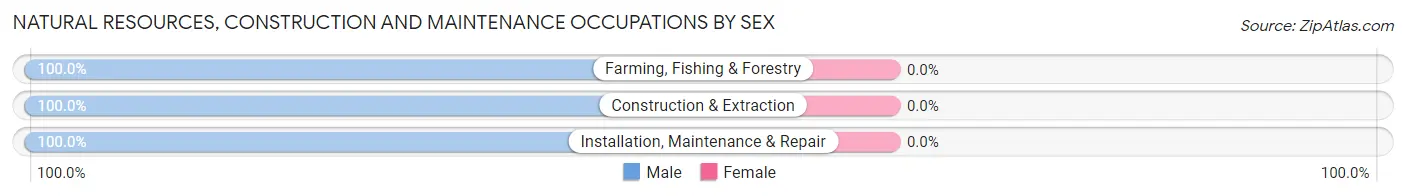
Natural Resources, Construction and Maintenance Occupations by Sex
| Occupation | Male | Female |
| Farming, Fishing & Forestry | 1 (100.0%) | 0 (0.0%) |
| Construction & Extraction | 18 (100.0%) | 0 (0.0%) |
| Installation, Maintenance & Repair | 20 (100.0%) | 0 (0.0%) |
| Total (Category) | 39 (100.0%) | 0 (0.0%) |
| Total (Overall) | 85 (56.3%) | 66 (43.7%) |
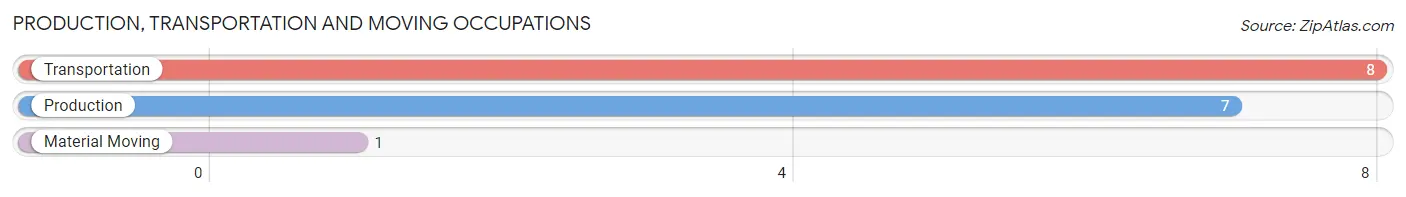
Production, Transportation and Moving Occupations
The most common Production, Transportation and Moving occupations in Garland are Transportation (8 | 5.3%), Production (7 | 4.6%), and Material Moving (1 | 0.7%).
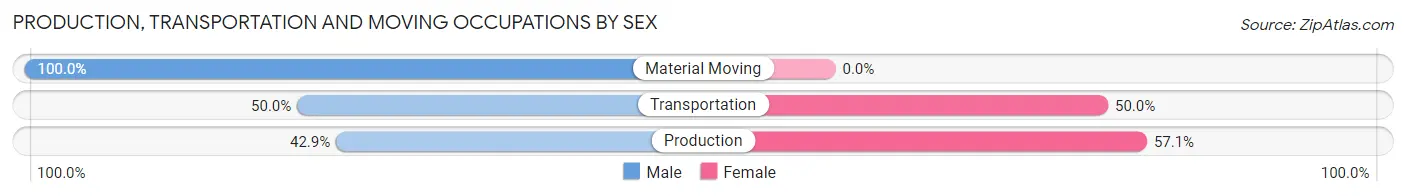
Production, Transportation and Moving Occupations by Sex
| Occupation | Male | Female |
| Production | 3 (42.9%) | 4 (57.1%) |
| Transportation | 4 (50.0%) | 4 (50.0%) |
| Material Moving | 1 (100.0%) | 0 (0.0%) |
| Total (Category) | 8 (50.0%) | 8 (50.0%) |
| Total (Overall) | 85 (56.3%) | 66 (43.7%) |
Employment Industries by Sex in Garland
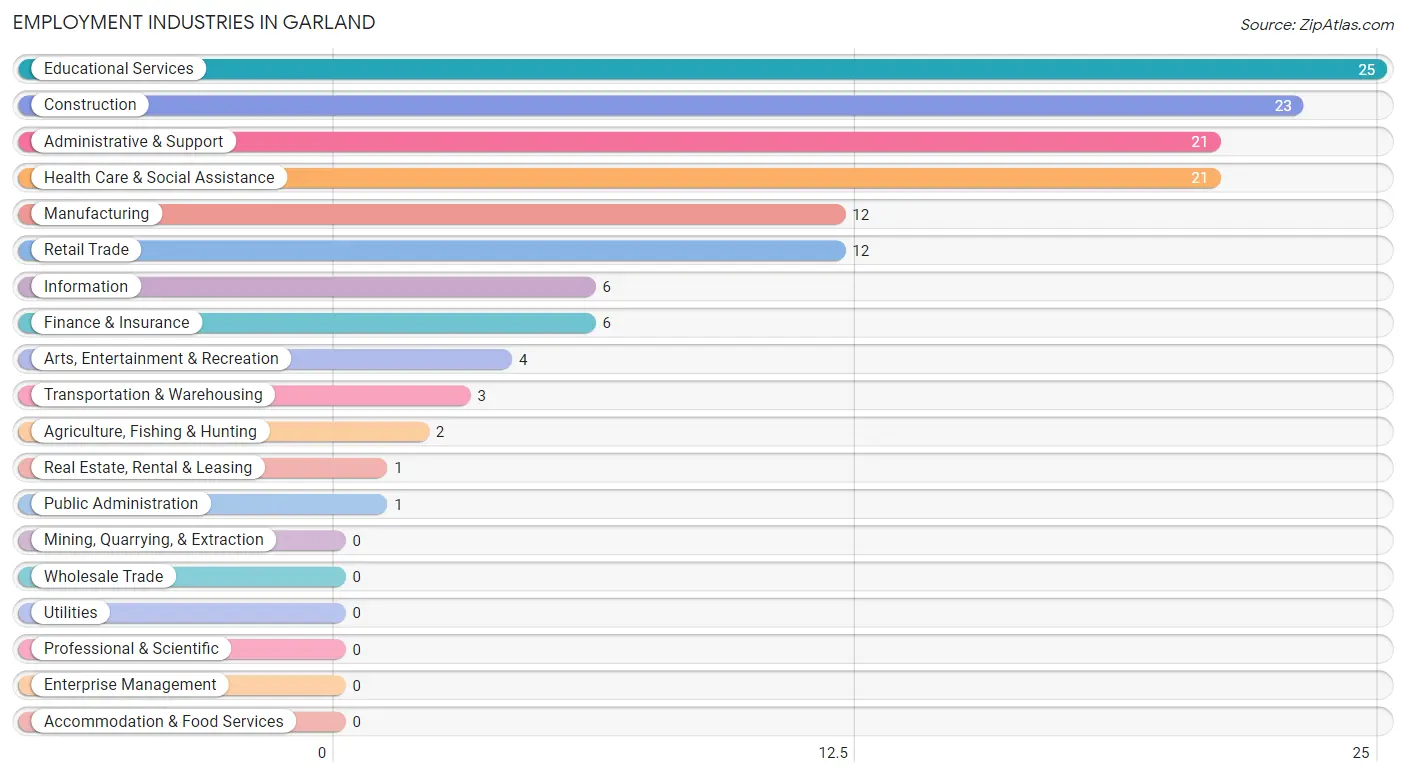
Employment Industries in Garland
The major employment industries in Garland include Educational Services (25 | 16.6%), Construction (23 | 15.2%), Administrative & Support (21 | 13.9%), Health Care & Social Assistance (21 | 13.9%), and Manufacturing (12 | 8.0%).
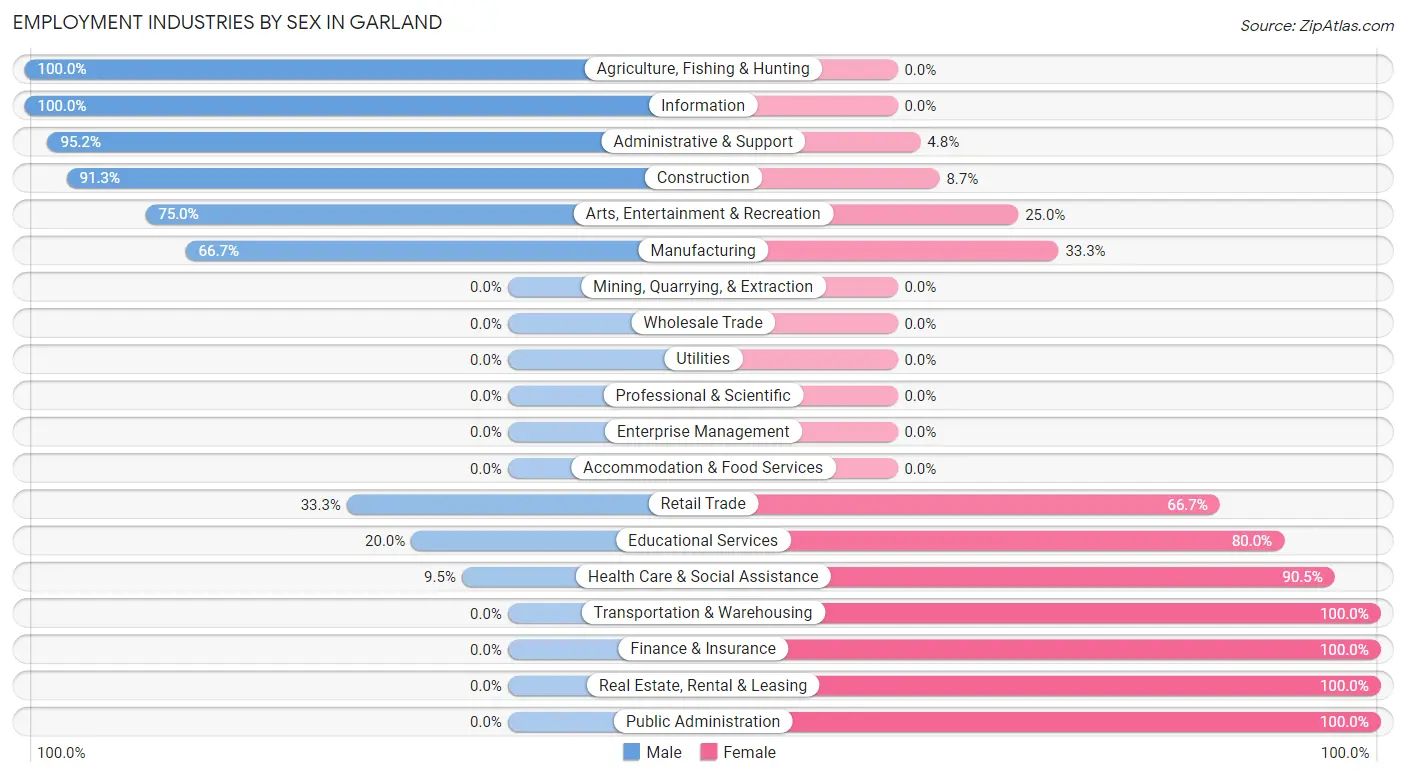
Employment Industries by Sex in Garland
The Garland industries that see more men than women are Agriculture, Fishing & Hunting (100.0%), Information (100.0%), and Administrative & Support (95.2%), whereas the industries that tend to have a higher number of women are Transportation & Warehousing (100.0%), Finance & Insurance (100.0%), and Real Estate, Rental & Leasing (100.0%).
| Industry | Male | Female |
| Agriculture, Fishing & Hunting | 2 (100.0%) | 0 (0.0%) |
| Mining, Quarrying, & Extraction | 0 (0.0%) | 0 (0.0%) |
| Construction | 21 (91.3%) | 2 (8.7%) |
| Manufacturing | 8 (66.7%) | 4 (33.3%) |
| Wholesale Trade | 0 (0.0%) | 0 (0.0%) |
| Retail Trade | 4 (33.3%) | 8 (66.7%) |
| Transportation & Warehousing | 0 (0.0%) | 3 (100.0%) |
| Utilities | 0 (0.0%) | 0 (0.0%) |
| Information | 6 (100.0%) | 0 (0.0%) |
| Finance & Insurance | 0 (0.0%) | 6 (100.0%) |
| Real Estate, Rental & Leasing | 0 (0.0%) | 1 (100.0%) |
| Professional & Scientific | 0 (0.0%) | 0 (0.0%) |
| Enterprise Management | 0 (0.0%) | 0 (0.0%) |
| Administrative & Support | 20 (95.2%) | 1 (4.8%) |
| Educational Services | 5 (20.0%) | 20 (80.0%) |
| Health Care & Social Assistance | 2 (9.5%) | 19 (90.5%) |
| Arts, Entertainment & Recreation | 3 (75.0%) | 1 (25.0%) |
| Accommodation & Food Services | 0 (0.0%) | 0 (0.0%) |
| Public Administration | 0 (0.0%) | 1 (100.0%) |
| Total | 85 (56.3%) | 66 (43.7%) |
Education in Garland
School Enrollment in Garland
The most common levels of schooling among the 53 students in Garland are elementary school (12 | 22.6%), college / undergraduate (12 | 22.6%), and high school (11 | 20.7%).
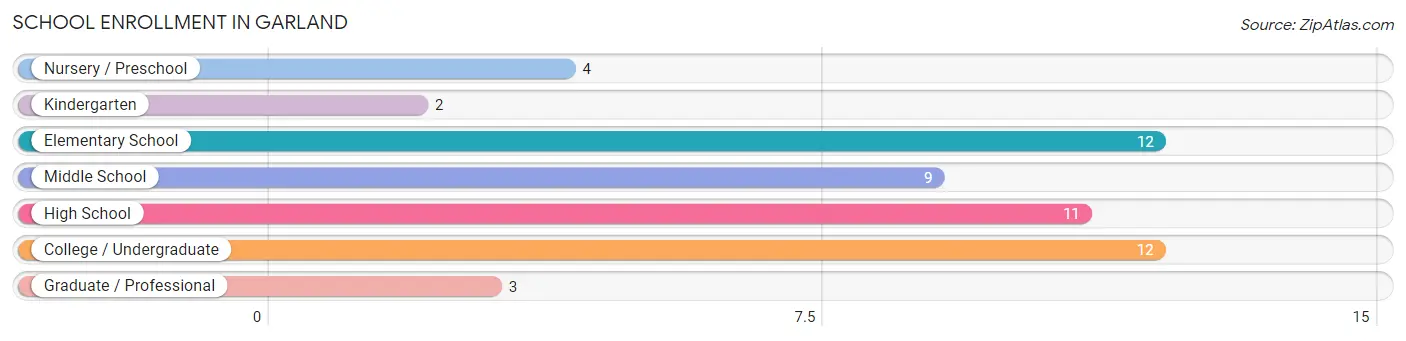
| School Level | # Students | % Students |
| Nursery / Preschool | 4 | 7.5% |
| Kindergarten | 2 | 3.8% |
| Elementary School | 12 | 22.6% |
| Middle School | 9 | 17.0% |
| High School | 11 | 20.7% |
| College / Undergraduate | 12 | 22.6% |
| Graduate / Professional | 3 | 5.7% |
| Total | 53 | 100.0% |
School Enrollment by Age by Funding Source in Garland
Out of a total of 53 students who are enrolled in schools in Garland, 7 (13.2%) attend a private institution, while the remaining 46 (86.8%) are enrolled in public schools. The age group of 3 to 4 year olds has the highest likelihood of being enrolled in private schools, with 4 (100.0% in the age bracket) enrolled. Conversely, the age group of 5 to 9 year old has the lowest likelihood of being enrolled in a private school, with 11 (100.0% in the age bracket) attending a public institution.
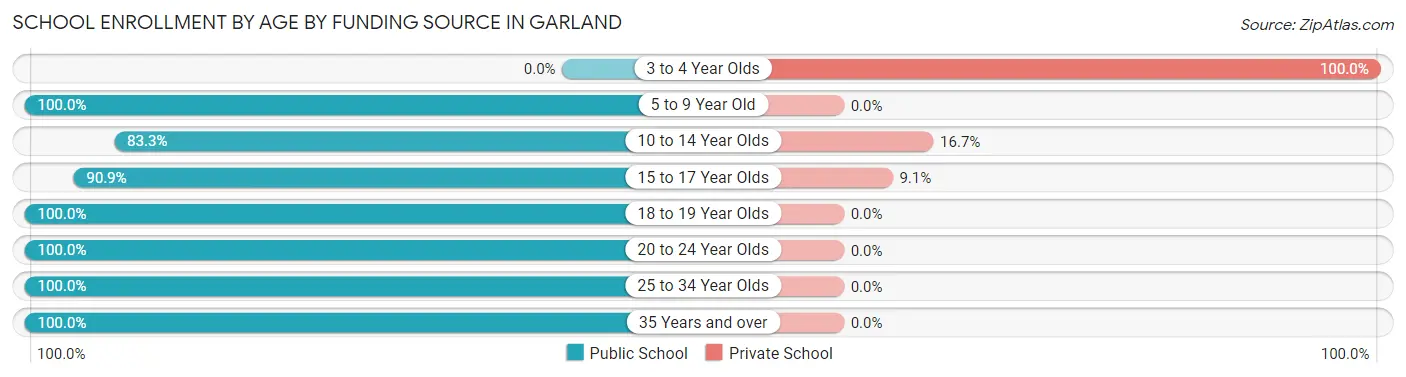
| Age Bracket | Public School | Private School |
| 3 to 4 Year Olds | 0 (0.0%) | 4 (100.0%) |
| 5 to 9 Year Old | 11 (100.0%) | 0 (0.0%) |
| 10 to 14 Year Olds | 10 (83.3%) | 2 (16.7%) |
| 15 to 17 Year Olds | 10 (90.9%) | 1 (9.1%) |
| 18 to 19 Year Olds | 2 (100.0%) | 0 (0.0%) |
| 20 to 24 Year Olds | 2 (100.0%) | 0 (0.0%) |
| 25 to 34 Year Olds | 9 (100.0%) | 0 (0.0%) |
| 35 Years and over | 2 (100.0%) | 0 (0.0%) |
| Total | 46 (86.8%) | 7 (13.2%) |
Educational Attainment by Field of Study in Garland
Education (7 | 25.0%), business (6 | 21.4%), science & technology (4 | 14.3%), bio, nature & agricultural (3 | 10.7%), and psychology (2 | 7.1%) are the most common fields of study among 28 individuals in Garland who have obtained a bachelor's degree or higher.
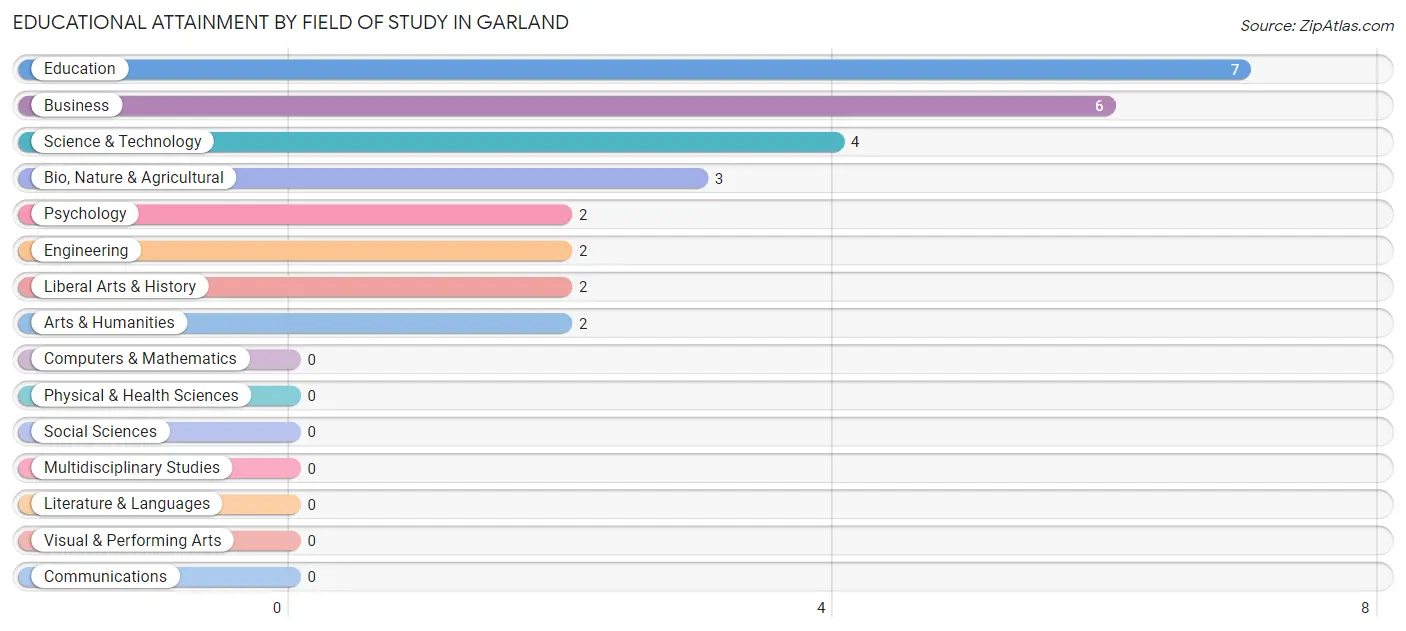
| Field of Study | # Graduates | % Graduates |
| Computers & Mathematics | 0 | 0.0% |
| Bio, Nature & Agricultural | 3 | 10.7% |
| Physical & Health Sciences | 0 | 0.0% |
| Psychology | 2 | 7.1% |
| Social Sciences | 0 | 0.0% |
| Engineering | 2 | 7.1% |
| Multidisciplinary Studies | 0 | 0.0% |
| Science & Technology | 4 | 14.3% |
| Business | 6 | 21.4% |
| Education | 7 | 25.0% |
| Literature & Languages | 0 | 0.0% |
| Liberal Arts & History | 2 | 7.1% |
| Visual & Performing Arts | 0 | 0.0% |
| Communications | 0 | 0.0% |
| Arts & Humanities | 2 | 7.1% |
| Total | 28 | 100.0% |
Transportation & Commute in Garland
Vehicle Availability by Sex in Garland
The most prevalent vehicle ownership categories in Garland are males with 3 vehicles (35, accounting for 42.2%) and females with 3 vehicles (27, making up 55.6%).
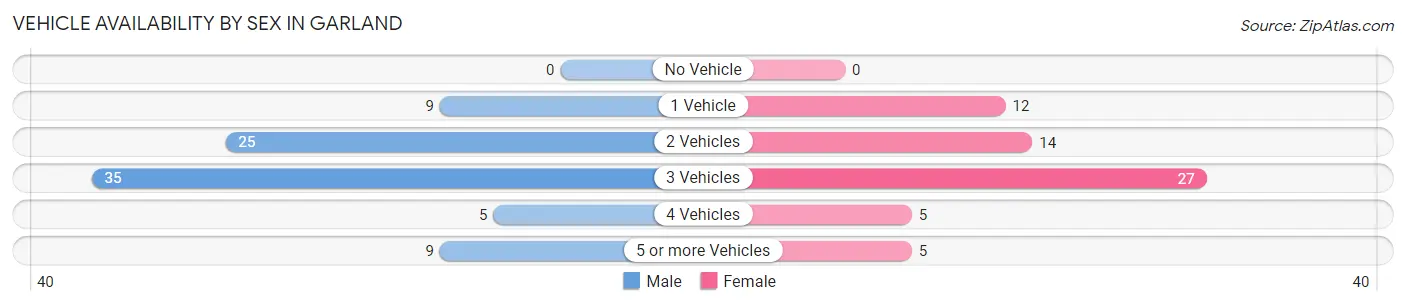
| Vehicles Available | Male | Female |
| No Vehicle | 0 (0.0%) | 0 (0.0%) |
| 1 Vehicle | 9 (10.8%) | 12 (19.1%) |
| 2 Vehicles | 25 (30.1%) | 14 (22.2%) |
| 3 Vehicles | 35 (42.2%) | 27 (42.9%) |
| 4 Vehicles | 5 (6.0%) | 5 (7.9%) |
| 5 or more Vehicles | 9 (10.8%) | 5 (7.9%) |
| Total | 83 (100.0%) | 63 (100.0%) |
Commute Time in Garland
The most frequently occuring commute durations in Garland are 30 to 34 minutes (29 commuters, 20.1%), 60 to 89 minutes (29 commuters, 20.1%), and 45 to 59 minutes (17 commuters, 11.8%).
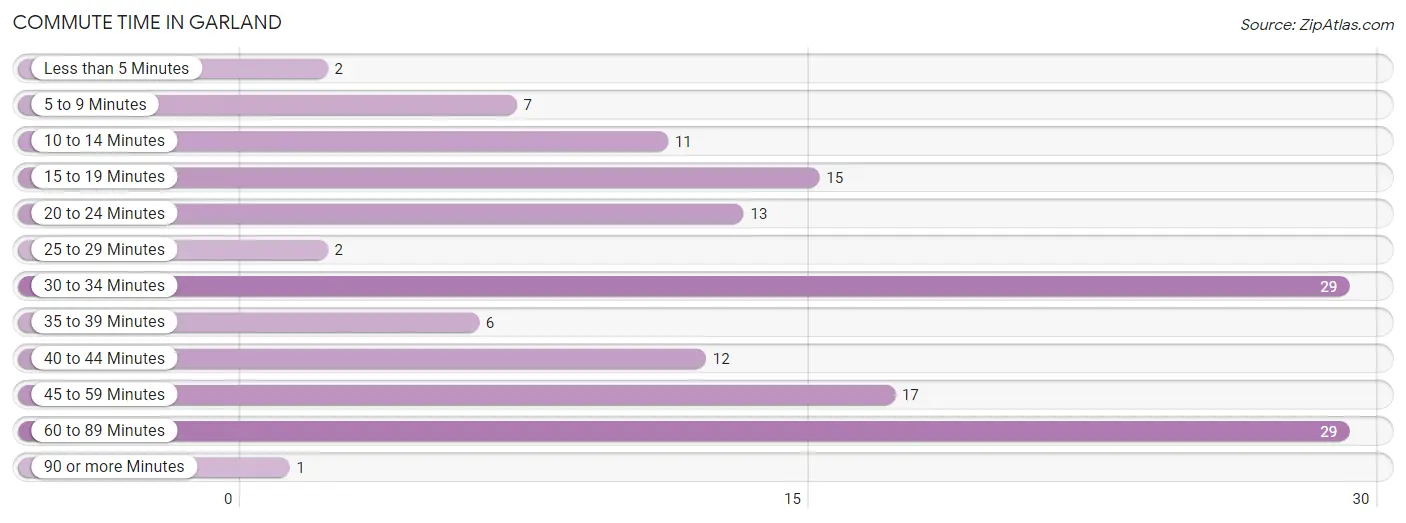
| Commute Time | # Commuters | % Commuters |
| Less than 5 Minutes | 2 | 1.4% |
| 5 to 9 Minutes | 7 | 4.9% |
| 10 to 14 Minutes | 11 | 7.6% |
| 15 to 19 Minutes | 15 | 10.4% |
| 20 to 24 Minutes | 13 | 9.0% |
| 25 to 29 Minutes | 2 | 1.4% |
| 30 to 34 Minutes | 29 | 20.1% |
| 35 to 39 Minutes | 6 | 4.2% |
| 40 to 44 Minutes | 12 | 8.3% |
| 45 to 59 Minutes | 17 | 11.8% |
| 60 to 89 Minutes | 29 | 20.1% |
| 90 or more Minutes | 1 | 0.7% |
Commute Time by Sex in Garland
The most common commute times in Garland are 30 to 34 minutes (26 commuters, 31.3%) for males and 60 to 89 minutes (14 commuters, 23.0%) for females.
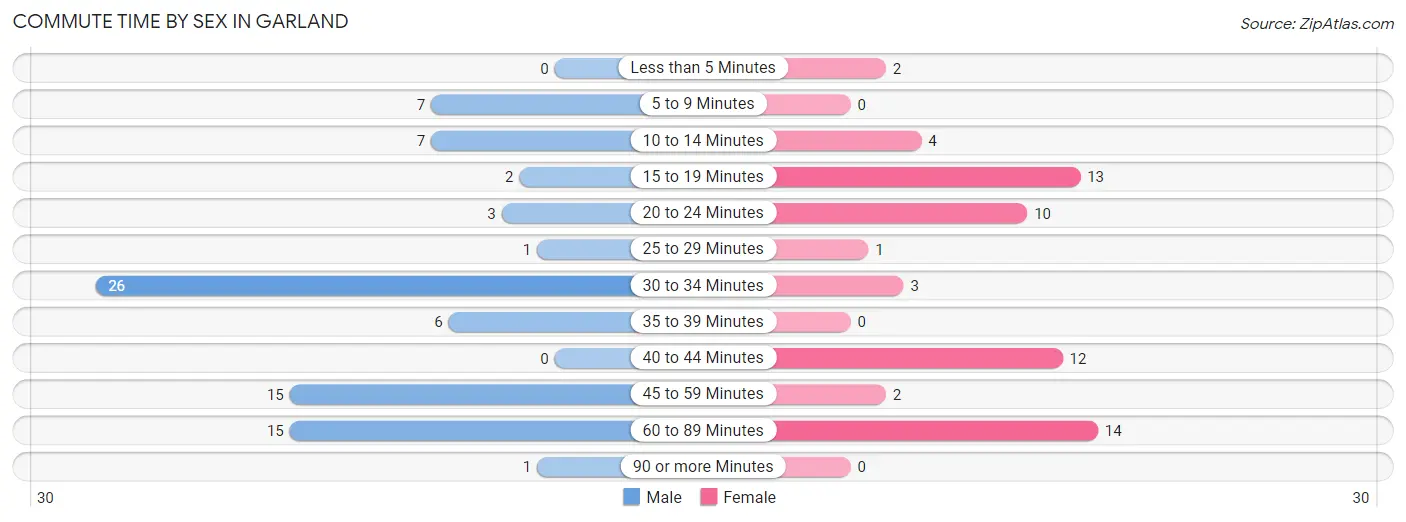
| Commute Time | Male | Female |
| Less than 5 Minutes | 0 (0.0%) | 2 (3.3%) |
| 5 to 9 Minutes | 7 (8.4%) | 0 (0.0%) |
| 10 to 14 Minutes | 7 (8.4%) | 4 (6.6%) |
| 15 to 19 Minutes | 2 (2.4%) | 13 (21.3%) |
| 20 to 24 Minutes | 3 (3.6%) | 10 (16.4%) |
| 25 to 29 Minutes | 1 (1.2%) | 1 (1.6%) |
| 30 to 34 Minutes | 26 (31.3%) | 3 (4.9%) |
| 35 to 39 Minutes | 6 (7.2%) | 0 (0.0%) |
| 40 to 44 Minutes | 0 (0.0%) | 12 (19.7%) |
| 45 to 59 Minutes | 15 (18.1%) | 2 (3.3%) |
| 60 to 89 Minutes | 15 (18.1%) | 14 (23.0%) |
| 90 or more Minutes | 1 (1.2%) | 0 (0.0%) |
Time of Departure to Work by Sex in Garland
The most frequent times of departure to work in Garland are 6:00 AM to 6:29 AM (21, 25.3%) for males and 6:30 AM to 6:59 AM (15, 24.6%) for females.
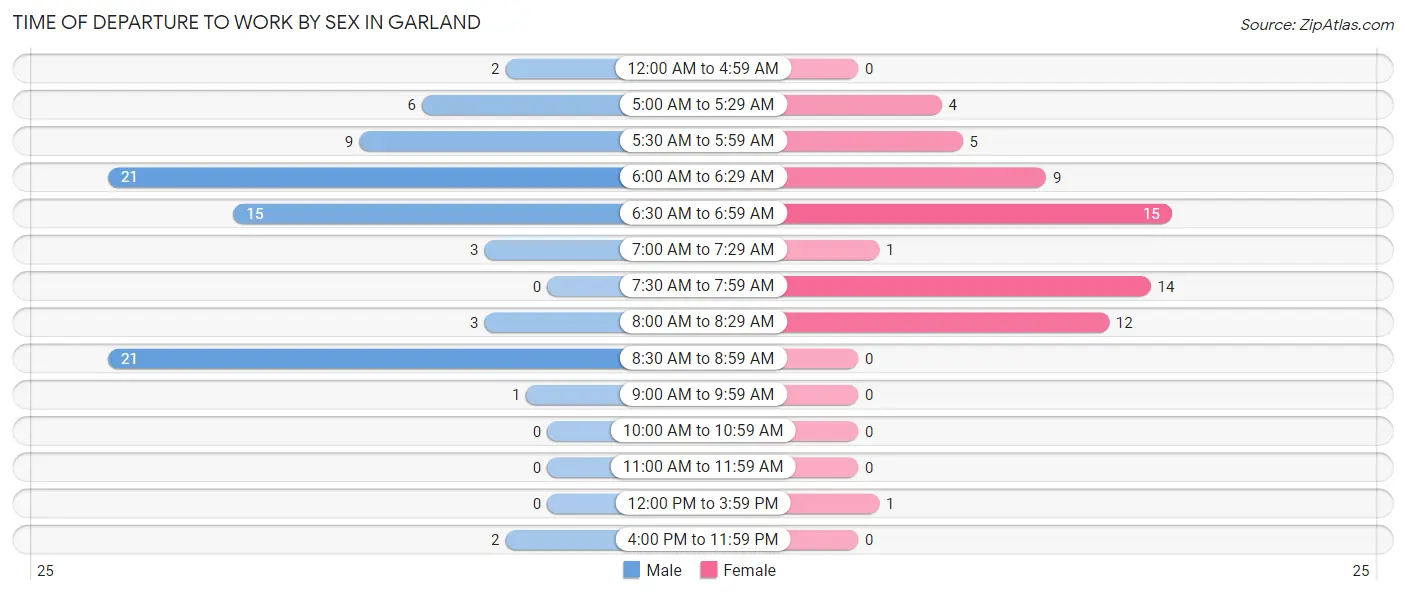
| Time of Departure | Male | Female |
| 12:00 AM to 4:59 AM | 2 (2.4%) | 0 (0.0%) |
| 5:00 AM to 5:29 AM | 6 (7.2%) | 4 (6.6%) |
| 5:30 AM to 5:59 AM | 9 (10.8%) | 5 (8.2%) |
| 6:00 AM to 6:29 AM | 21 (25.3%) | 9 (14.7%) |
| 6:30 AM to 6:59 AM | 15 (18.1%) | 15 (24.6%) |
| 7:00 AM to 7:29 AM | 3 (3.6%) | 1 (1.6%) |
| 7:30 AM to 7:59 AM | 0 (0.0%) | 14 (23.0%) |
| 8:00 AM to 8:29 AM | 3 (3.6%) | 12 (19.7%) |
| 8:30 AM to 8:59 AM | 21 (25.3%) | 0 (0.0%) |
| 9:00 AM to 9:59 AM | 1 (1.2%) | 0 (0.0%) |
| 10:00 AM to 10:59 AM | 0 (0.0%) | 0 (0.0%) |
| 11:00 AM to 11:59 AM | 0 (0.0%) | 0 (0.0%) |
| 12:00 PM to 3:59 PM | 0 (0.0%) | 1 (1.6%) |
| 4:00 PM to 11:59 PM | 2 (2.4%) | 0 (0.0%) |
| Total | 83 (100.0%) | 61 (100.0%) |
Housing Occupancy in Garland
Occupancy by Ownership in Garland
Of the total 129 dwellings in Garland, owner-occupied units account for 96 (74.4%), while renter-occupied units make up 33 (25.6%).
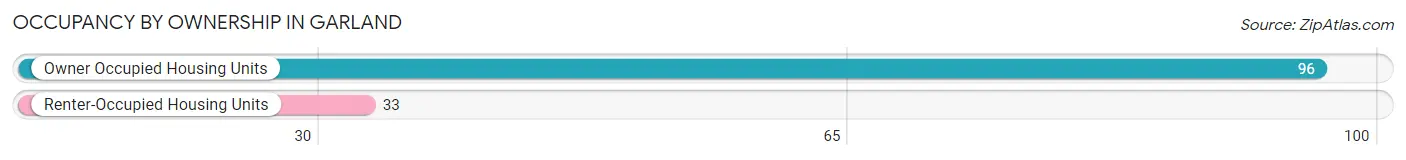
| Occupancy | # Housing Units | % Housing Units |
| Owner Occupied Housing Units | 96 | 74.4% |
| Renter-Occupied Housing Units | 33 | 25.6% |
| Total Occupied Housing Units | 129 | 100.0% |
Occupancy by Household Size in Garland
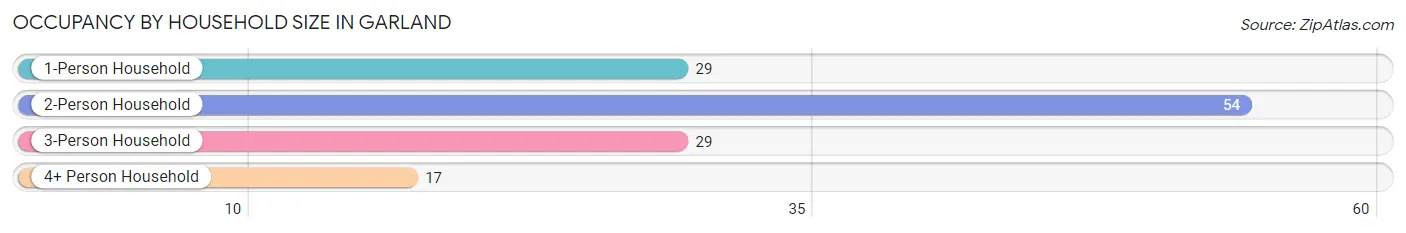
| Household Size | # Housing Units | % Housing Units |
| 1-Person Household | 29 | 22.5% |
| 2-Person Household | 54 | 41.9% |
| 3-Person Household | 29 | 22.5% |
| 4+ Person Household | 17 | 13.2% |
| Total Housing Units | 129 | 100.0% |
Occupancy by Ownership by Household Size in Garland
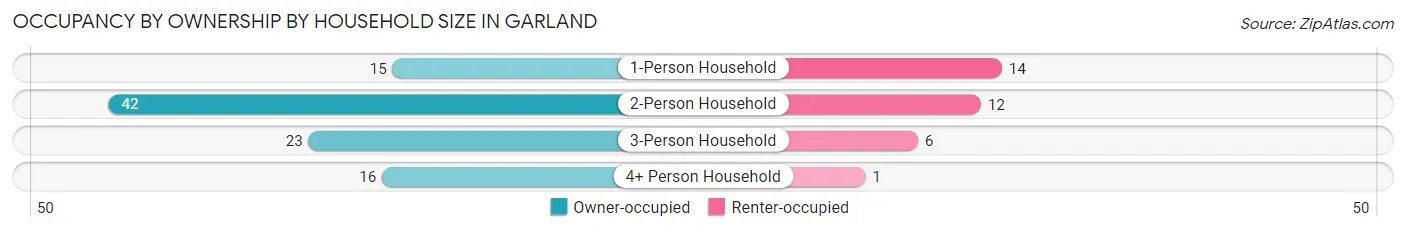
| Household Size | Owner-occupied | Renter-occupied |
| 1-Person Household | 15 (51.7%) | 14 (48.3%) |
| 2-Person Household | 42 (77.8%) | 12 (22.2%) |
| 3-Person Household | 23 (79.3%) | 6 (20.7%) |
| 4+ Person Household | 16 (94.1%) | 1 (5.9%) |
| Total Housing Units | 96 (74.4%) | 33 (25.6%) |
Occupancy by Educational Attainment in Garland
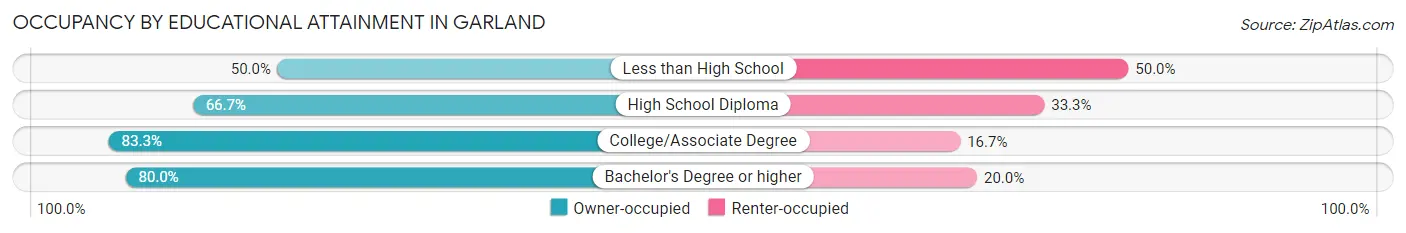
| Household Size | Owner-occupied | Renter-occupied |
| Less than High School | 3 (50.0%) | 3 (50.0%) |
| High School Diploma | 36 (66.7%) | 18 (33.3%) |
| College/Associate Degree | 45 (83.3%) | 9 (16.7%) |
| Bachelor's Degree or higher | 12 (80.0%) | 3 (20.0%) |
Occupancy by Age of Householder in Garland
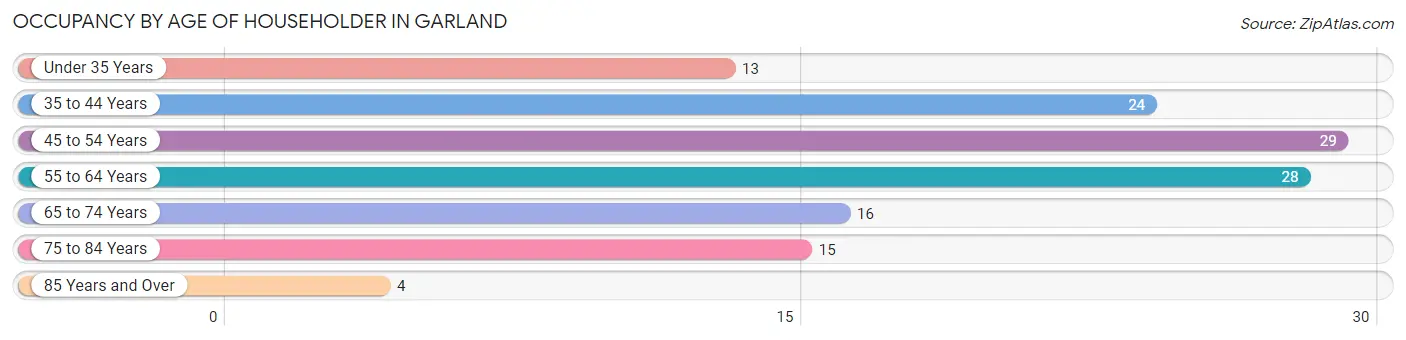
| Age Bracket | # Households | % Households |
| Under 35 Years | 13 | 10.1% |
| 35 to 44 Years | 24 | 18.6% |
| 45 to 54 Years | 29 | 22.5% |
| 55 to 64 Years | 28 | 21.7% |
| 65 to 74 Years | 16 | 12.4% |
| 75 to 84 Years | 15 | 11.6% |
| 85 Years and Over | 4 | 3.1% |
| Total | 129 | 100.0% |
Housing Finances in Garland
Median Income by Occupancy in Garland
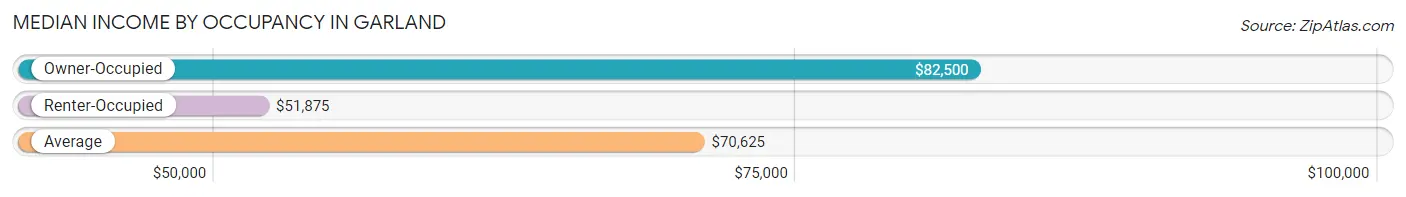
| Occupancy Type | # Households | Median Income |
| Owner-Occupied | 96 (74.4%) | $82,500 |
| Renter-Occupied | 33 (25.6%) | $51,875 |
| Average | 129 (100.0%) | $70,625 |
Occupancy by Householder Income Bracket in Garland
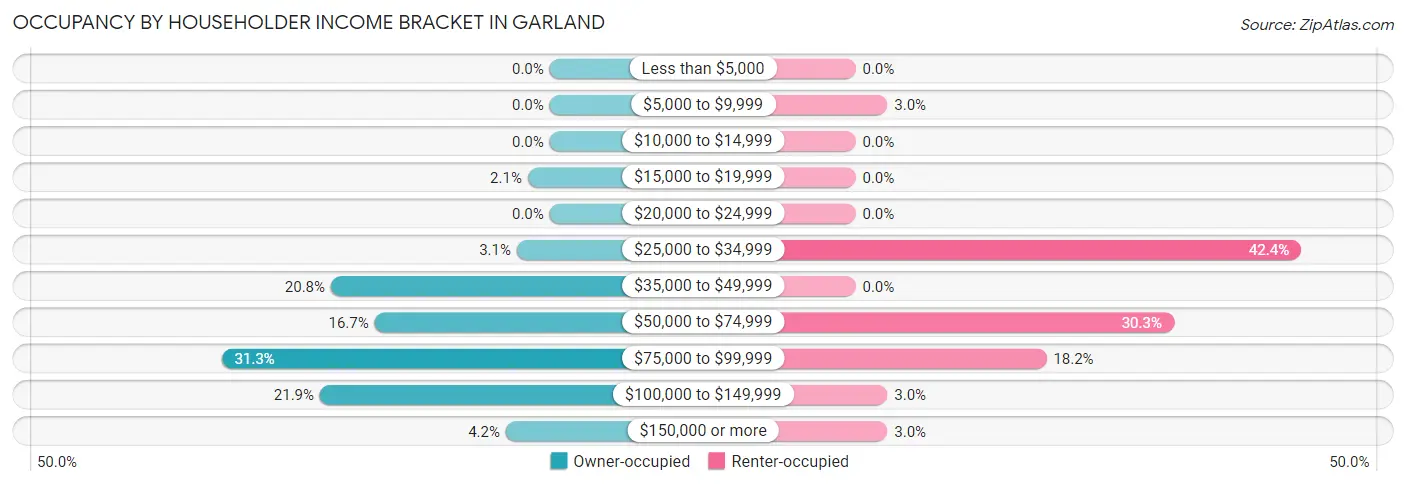
| Income Bracket | Owner-occupied | Renter-occupied |
| Less than $5,000 | 0 (0.0%) | 0 (0.0%) |
| $5,000 to $9,999 | 0 (0.0%) | 1 (3.0%) |
| $10,000 to $14,999 | 0 (0.0%) | 0 (0.0%) |
| $15,000 to $19,999 | 2 (2.1%) | 0 (0.0%) |
| $20,000 to $24,999 | 0 (0.0%) | 0 (0.0%) |
| $25,000 to $34,999 | 3 (3.1%) | 14 (42.4%) |
| $35,000 to $49,999 | 20 (20.8%) | 0 (0.0%) |
| $50,000 to $74,999 | 16 (16.7%) | 10 (30.3%) |
| $75,000 to $99,999 | 30 (31.2%) | 6 (18.2%) |
| $100,000 to $149,999 | 21 (21.9%) | 1 (3.0%) |
| $150,000 or more | 4 (4.2%) | 1 (3.0%) |
| Total | 96 (100.0%) | 33 (100.0%) |
Monthly Housing Cost Tiers in Garland
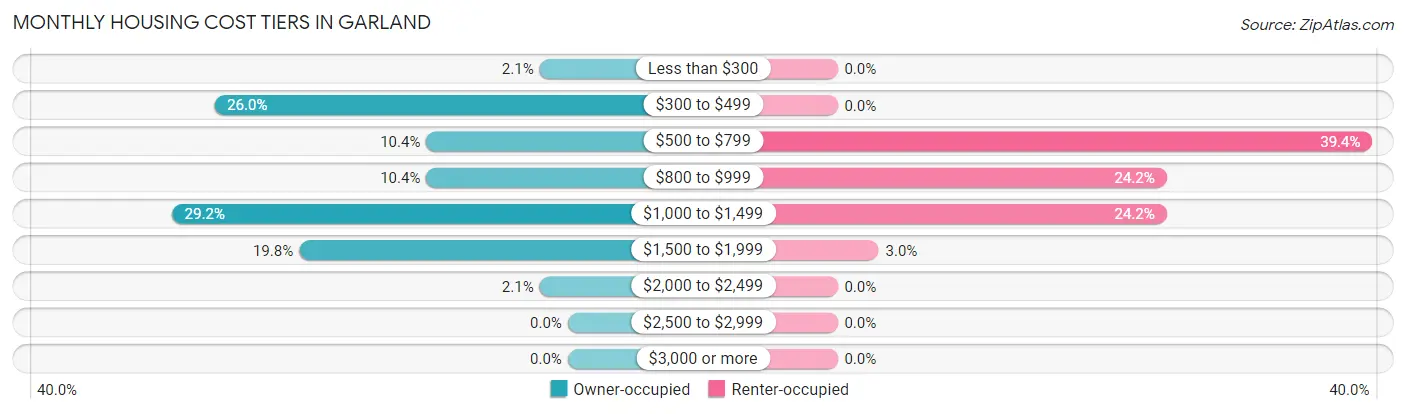
| Monthly Cost | Owner-occupied | Renter-occupied |
| Less than $300 | 2 (2.1%) | 0 (0.0%) |
| $300 to $499 | 25 (26.0%) | 0 (0.0%) |
| $500 to $799 | 10 (10.4%) | 13 (39.4%) |
| $800 to $999 | 10 (10.4%) | 8 (24.2%) |
| $1,000 to $1,499 | 28 (29.2%) | 8 (24.2%) |
| $1,500 to $1,999 | 19 (19.8%) | 1 (3.0%) |
| $2,000 to $2,499 | 2 (2.1%) | 0 (0.0%) |
| $2,500 to $2,999 | 0 (0.0%) | 0 (0.0%) |
| $3,000 or more | 0 (0.0%) | 0 (0.0%) |
| Total | 96 (100.0%) | 33 (100.0%) |
Physical Housing Characteristics in Garland
Housing Structures in Garland
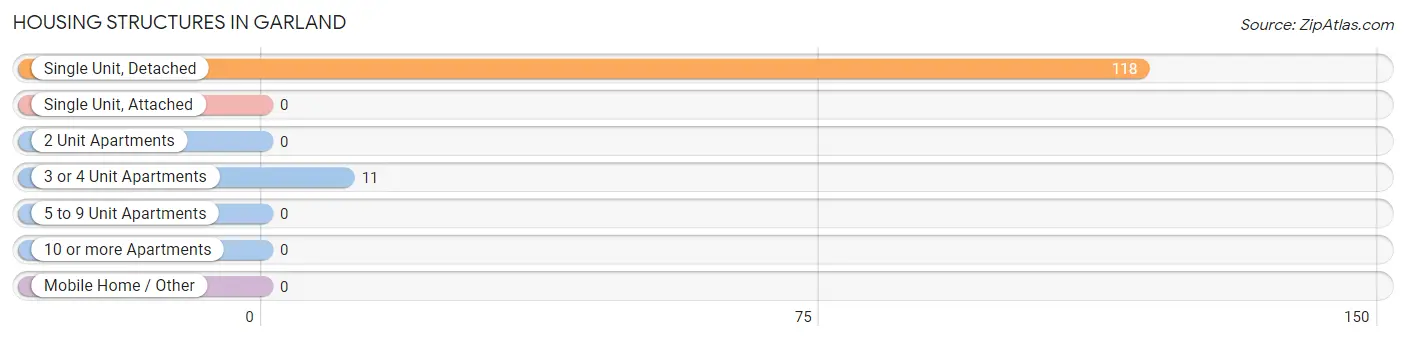
| Structure Type | # Housing Units | % Housing Units |
| Single Unit, Detached | 118 | 91.5% |
| Single Unit, Attached | 0 | 0.0% |
| 2 Unit Apartments | 0 | 0.0% |
| 3 or 4 Unit Apartments | 11 | 8.5% |
| 5 to 9 Unit Apartments | 0 | 0.0% |
| 10 or more Apartments | 0 | 0.0% |
| Mobile Home / Other | 0 | 0.0% |
| Total | 129 | 100.0% |
Housing Structures by Occupancy in Garland
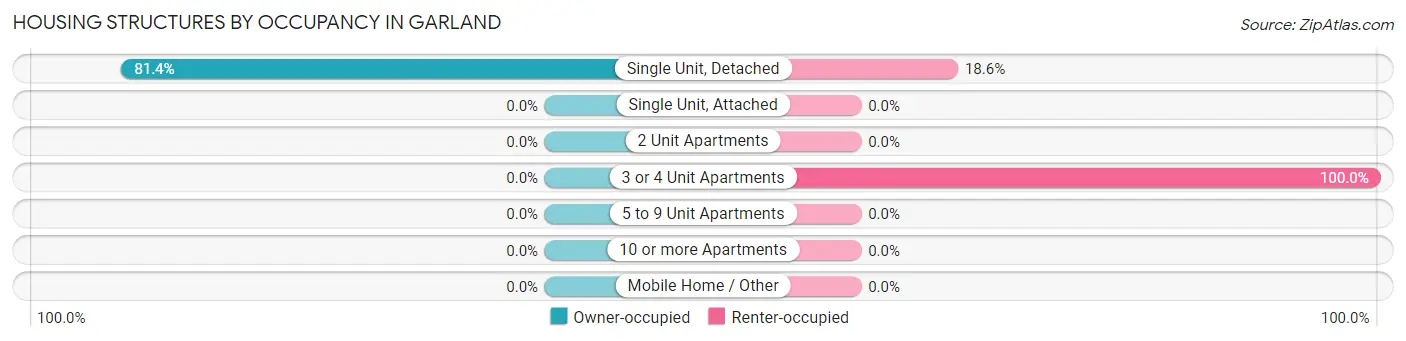
| Structure Type | Owner-occupied | Renter-occupied |
| Single Unit, Detached | 96 (81.4%) | 22 (18.6%) |
| Single Unit, Attached | 0 (0.0%) | 0 (0.0%) |
| 2 Unit Apartments | 0 (0.0%) | 0 (0.0%) |
| 3 or 4 Unit Apartments | 0 (0.0%) | 11 (100.0%) |
| 5 to 9 Unit Apartments | 0 (0.0%) | 0 (0.0%) |
| 10 or more Apartments | 0 (0.0%) | 0 (0.0%) |
| Mobile Home / Other | 0 (0.0%) | 0 (0.0%) |
| Total | 96 (74.4%) | 33 (25.6%) |
Housing Structures by Number of Rooms in Garland
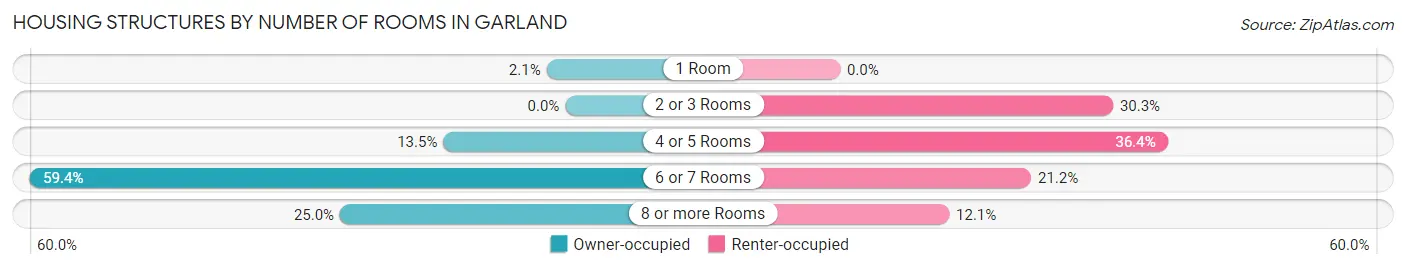
| Number of Rooms | Owner-occupied | Renter-occupied |
| 1 Room | 2 (2.1%) | 0 (0.0%) |
| 2 or 3 Rooms | 0 (0.0%) | 10 (30.3%) |
| 4 or 5 Rooms | 13 (13.5%) | 12 (36.4%) |
| 6 or 7 Rooms | 57 (59.4%) | 7 (21.2%) |
| 8 or more Rooms | 24 (25.0%) | 4 (12.1%) |
| Total | 96 (100.0%) | 33 (100.0%) |
Housing Structure by Heating Type in Garland
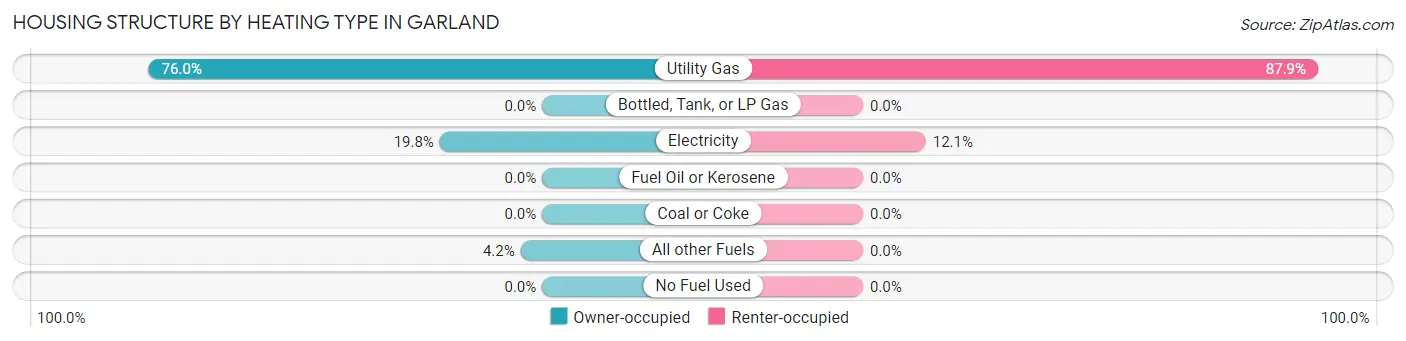
| Heating Type | Owner-occupied | Renter-occupied |
| Utility Gas | 73 (76.0%) | 29 (87.9%) |
| Bottled, Tank, or LP Gas | 0 (0.0%) | 0 (0.0%) |
| Electricity | 19 (19.8%) | 4 (12.1%) |
| Fuel Oil or Kerosene | 0 (0.0%) | 0 (0.0%) |
| Coal or Coke | 0 (0.0%) | 0 (0.0%) |
| All other Fuels | 4 (4.2%) | 0 (0.0%) |
| No Fuel Used | 0 (0.0%) | 0 (0.0%) |
| Total | 96 (100.0%) | 33 (100.0%) |
Household Vehicle Usage in Garland
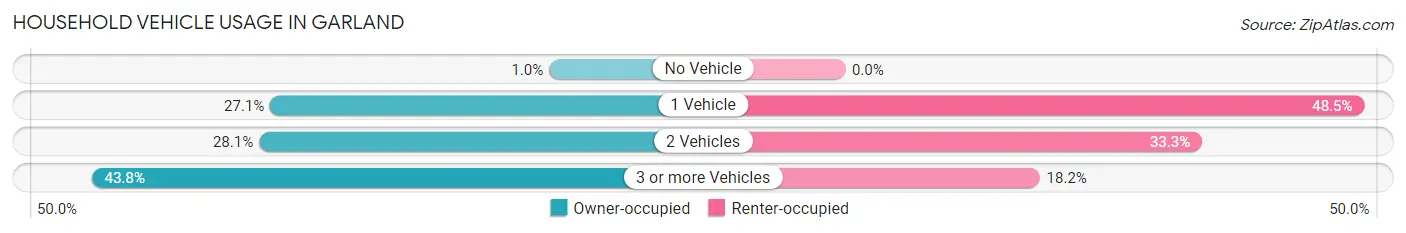
| Vehicles per Household | Owner-occupied | Renter-occupied |
| No Vehicle | 1 (1.0%) | 0 (0.0%) |
| 1 Vehicle | 26 (27.1%) | 16 (48.5%) |
| 2 Vehicles | 27 (28.1%) | 11 (33.3%) |
| 3 or more Vehicles | 42 (43.8%) | 6 (18.2%) |
| Total | 96 (100.0%) | 33 (100.0%) |
Real Estate & Mortgages in Garland
Real Estate and Mortgage Overview in Garland
| Characteristic | Without Mortgage | With Mortgage |
| Housing Units | 33 | 63 |
| Median Property Value | $159,400 | $192,500 |
| Median Household Income | $80,750 | $3 |
| Monthly Housing Costs | $419 | $0 |
| Real Estate Taxes | $757 | $10 |
Property Value by Mortgage Status in Garland
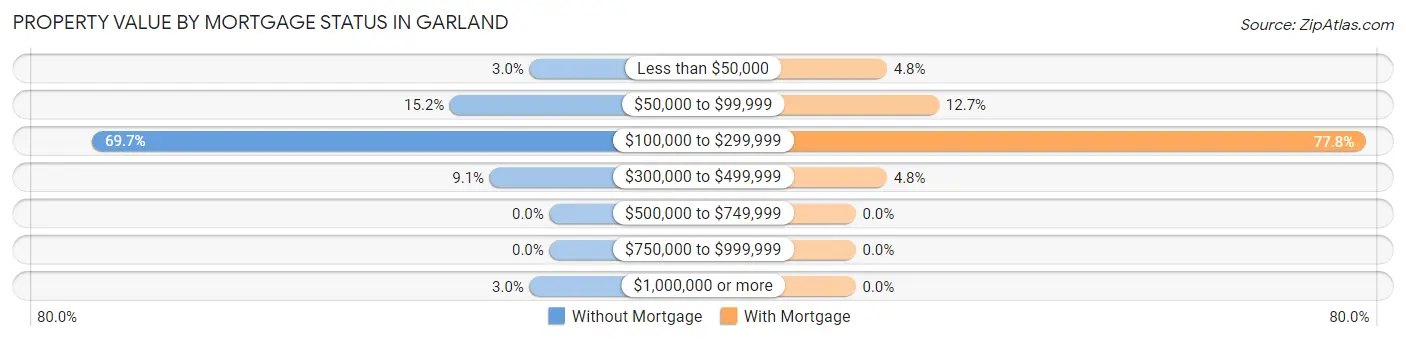
| Property Value | Without Mortgage | With Mortgage |
| Less than $50,000 | 1 (3.0%) | 3 (4.8%) |
| $50,000 to $99,999 | 5 (15.1%) | 8 (12.7%) |
| $100,000 to $299,999 | 23 (69.7%) | 49 (77.8%) |
| $300,000 to $499,999 | 3 (9.1%) | 3 (4.8%) |
| $500,000 to $749,999 | 0 (0.0%) | 0 (0.0%) |
| $750,000 to $999,999 | 0 (0.0%) | 0 (0.0%) |
| $1,000,000 or more | 1 (3.0%) | 0 (0.0%) |
| Total | 33 (100.0%) | 63 (100.0%) |
Household Income by Mortgage Status in Garland
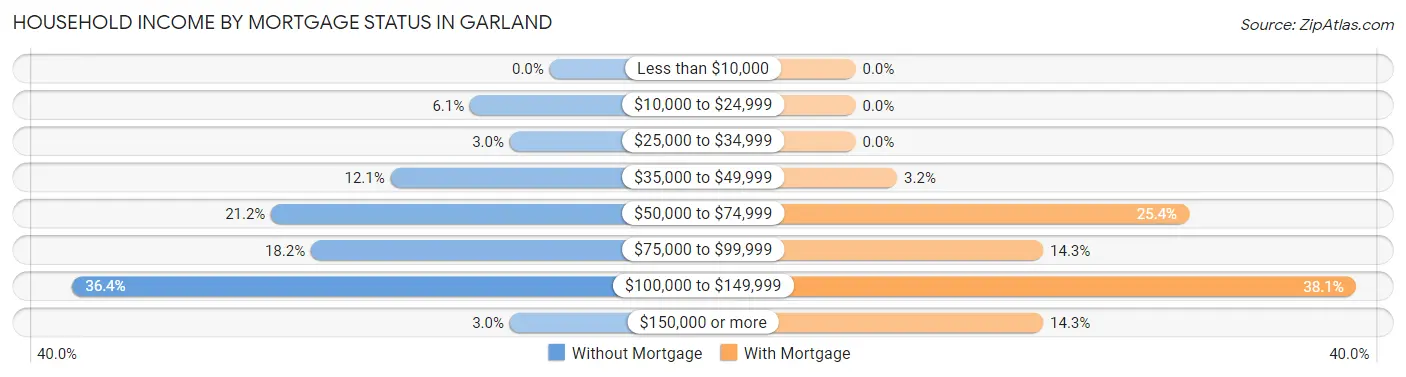
| Household Income | Without Mortgage | With Mortgage |
| Less than $10,000 | 0 (0.0%) | 0 (0.0%) |
| $10,000 to $24,999 | 2 (6.1%) | 0 (0.0%) |
| $25,000 to $34,999 | 1 (3.0%) | 0 (0.0%) |
| $35,000 to $49,999 | 4 (12.1%) | 2 (3.2%) |
| $50,000 to $74,999 | 7 (21.2%) | 16 (25.4%) |
| $75,000 to $99,999 | 6 (18.2%) | 9 (14.3%) |
| $100,000 to $149,999 | 12 (36.4%) | 24 (38.1%) |
| $150,000 or more | 1 (3.0%) | 9 (14.3%) |
| Total | 33 (100.0%) | 63 (100.0%) |
Property Value to Household Income Ratio in Garland
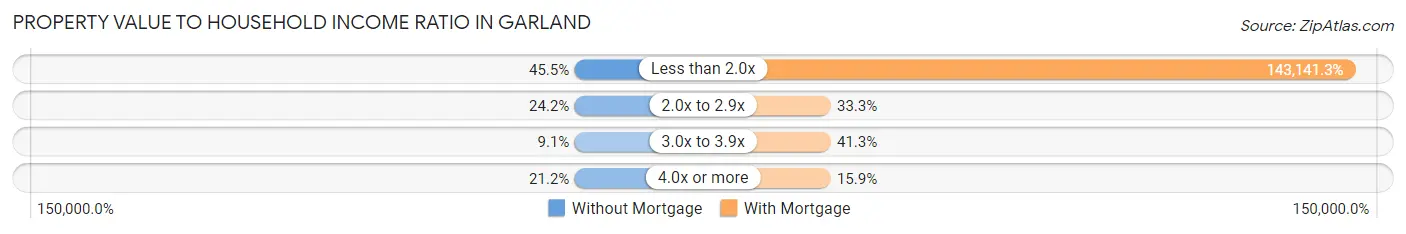
| Value-to-Income Ratio | Without Mortgage | With Mortgage |
| Less than 2.0x | 15 (45.5%) | 90,179 (143,141.3%) |
| 2.0x to 2.9x | 8 (24.2%) | 21 (33.3%) |
| 3.0x to 3.9x | 3 (9.1%) | 26 (41.3%) |
| 4.0x or more | 7 (21.2%) | 10 (15.9%) |
| Total | 33 (100.0%) | 63 (100.0%) |
Real Estate Taxes by Mortgage Status in Garland
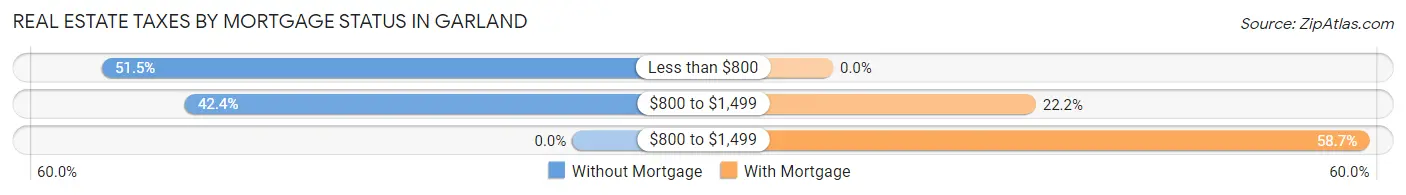
| Property Taxes | Without Mortgage | With Mortgage |
| Less than $800 | 17 (51.5%) | 0 (0.0%) |
| $800 to $1,499 | 14 (42.4%) | 14 (22.2%) |
| $800 to $1,499 | 0 (0.0%) | 37 (58.7%) |
| Total | 33 (100.0%) | 63 (100.0%) |
Health & Disability in Garland
Health Insurance Coverage by Age in Garland
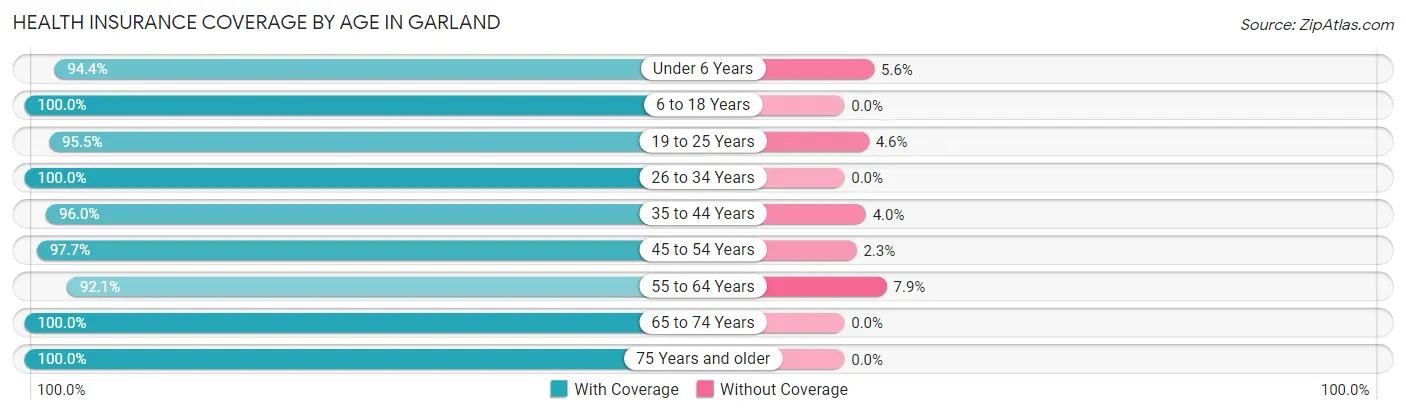
| Age Bracket | With Coverage | Without Coverage |
| Under 6 Years | 17 (94.4%) | 1 (5.6%) |
| 6 to 18 Years | 36 (100.0%) | 0 (0.0%) |
| 19 to 25 Years | 21 (95.5%) | 1 (4.5%) |
| 26 to 34 Years | 20 (100.0%) | 0 (0.0%) |
| 35 to 44 Years | 48 (96.0%) | 2 (4.0%) |
| 45 to 54 Years | 43 (97.7%) | 1 (2.3%) |
| 55 to 64 Years | 35 (92.1%) | 3 (7.9%) |
| 65 to 74 Years | 28 (100.0%) | 0 (0.0%) |
| 75 Years and older | 28 (100.0%) | 0 (0.0%) |
| Total | 276 (97.2%) | 8 (2.8%) |
Health Insurance Coverage by Citizenship Status in Garland
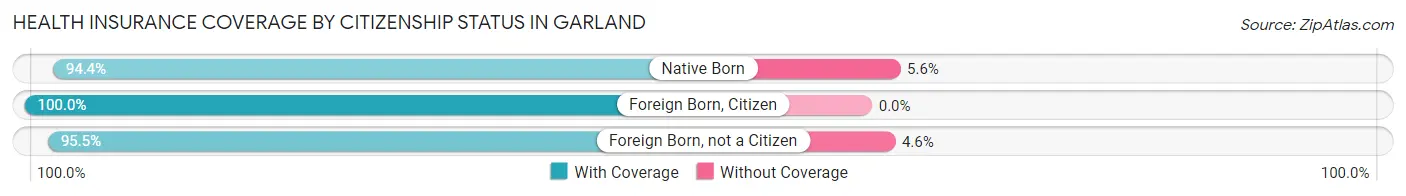
| Citizenship Status | With Coverage | Without Coverage |
| Native Born | 17 (94.4%) | 1 (5.6%) |
| Foreign Born, Citizen | 36 (100.0%) | 0 (0.0%) |
| Foreign Born, not a Citizen | 21 (95.5%) | 1 (4.5%) |
Health Insurance Coverage by Household Income in Garland
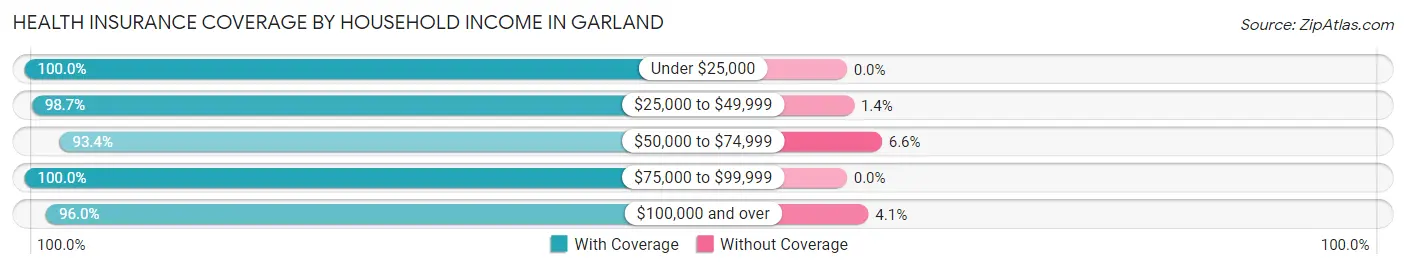
| Household Income | With Coverage | Without Coverage |
| Under $25,000 | 3 (100.0%) | 0 (0.0%) |
| $25,000 to $49,999 | 73 (98.7%) | 1 (1.3%) |
| $50,000 to $74,999 | 57 (93.4%) | 4 (6.6%) |
| $75,000 to $99,999 | 72 (100.0%) | 0 (0.0%) |
| $100,000 and over | 71 (96.0%) | 3 (4.1%) |
Public vs Private Health Insurance Coverage by Age in Garland
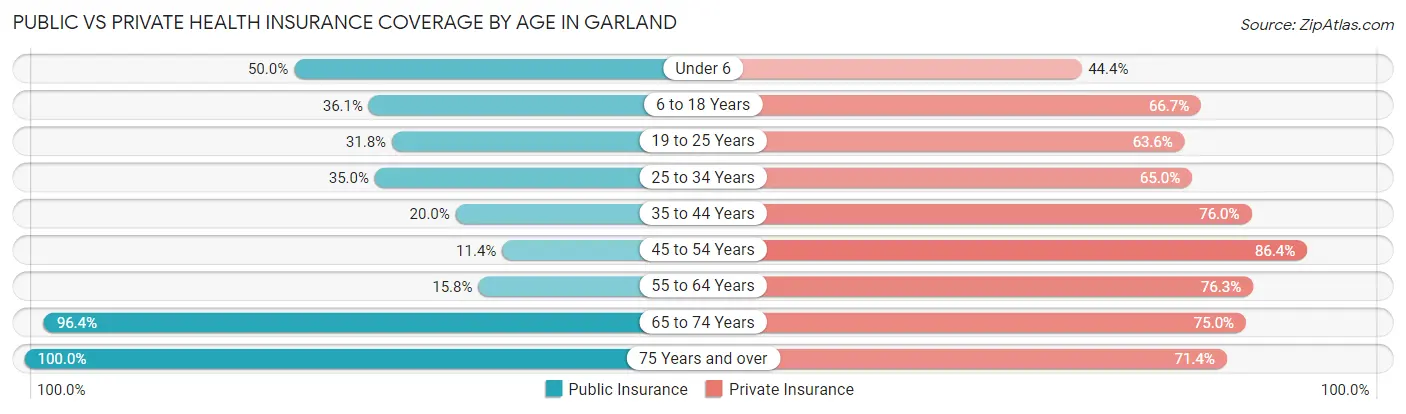
| Age Bracket | Public Insurance | Private Insurance |
| Under 6 | 9 (50.0%) | 8 (44.4%) |
| 6 to 18 Years | 13 (36.1%) | 24 (66.7%) |
| 19 to 25 Years | 7 (31.8%) | 14 (63.6%) |
| 25 to 34 Years | 7 (35.0%) | 13 (65.0%) |
| 35 to 44 Years | 10 (20.0%) | 38 (76.0%) |
| 45 to 54 Years | 5 (11.4%) | 38 (86.4%) |
| 55 to 64 Years | 6 (15.8%) | 29 (76.3%) |
| 65 to 74 Years | 27 (96.4%) | 21 (75.0%) |
| 75 Years and over | 28 (100.0%) | 20 (71.4%) |
| Total | 112 (39.4%) | 205 (72.2%) |
Disability Status by Sex by Age in Garland
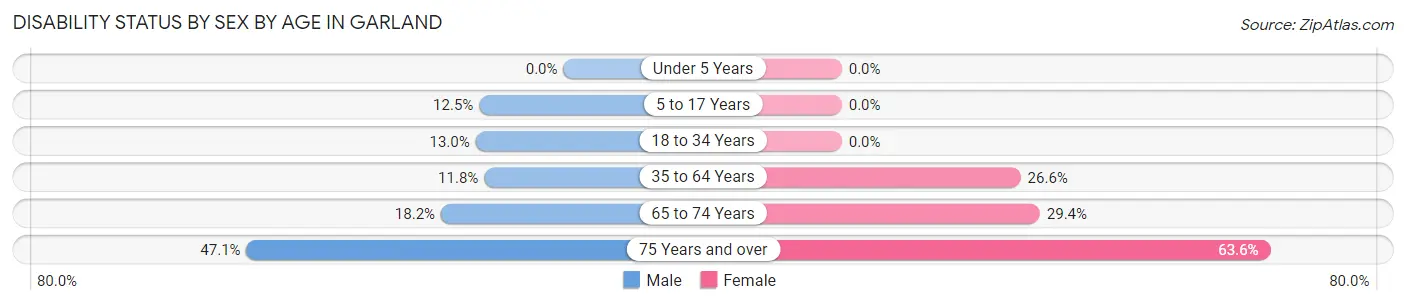
| Age Bracket | Male | Female |
| Under 5 Years | 0 (0.0%) | 0 (0.0%) |
| 5 to 17 Years | 1 (12.5%) | 0 (0.0%) |
| 18 to 34 Years | 3 (13.0%) | 0 (0.0%) |
| 35 to 64 Years | 8 (11.8%) | 17 (26.6%) |
| 65 to 74 Years | 2 (18.2%) | 5 (29.4%) |
| 75 Years and over | 8 (47.1%) | 7 (63.6%) |
Disability Class by Sex by Age in Garland
Disability Class: Hearing Difficulty
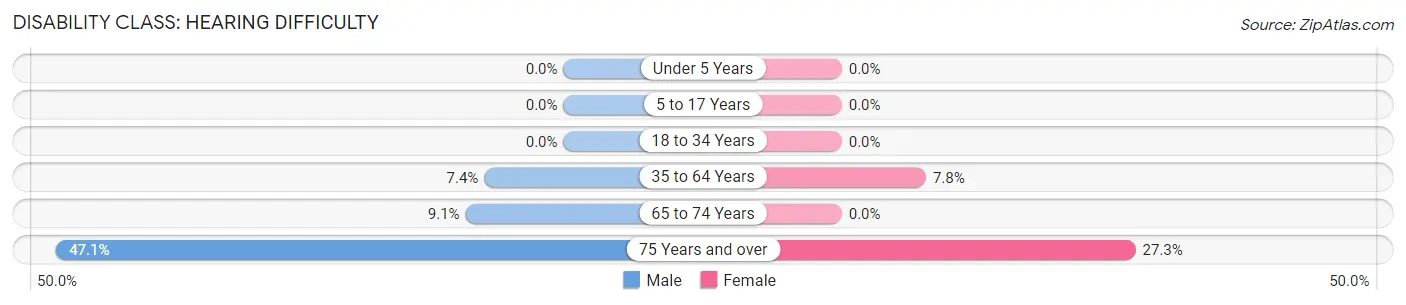
| Age Bracket | Male | Female |
| Under 5 Years | 0 (0.0%) | 0 (0.0%) |
| 5 to 17 Years | 0 (0.0%) | 0 (0.0%) |
| 18 to 34 Years | 0 (0.0%) | 0 (0.0%) |
| 35 to 64 Years | 5 (7.3%) | 5 (7.8%) |
| 65 to 74 Years | 1 (9.1%) | 0 (0.0%) |
| 75 Years and over | 8 (47.1%) | 3 (27.3%) |
Disability Class: Vision Difficulty
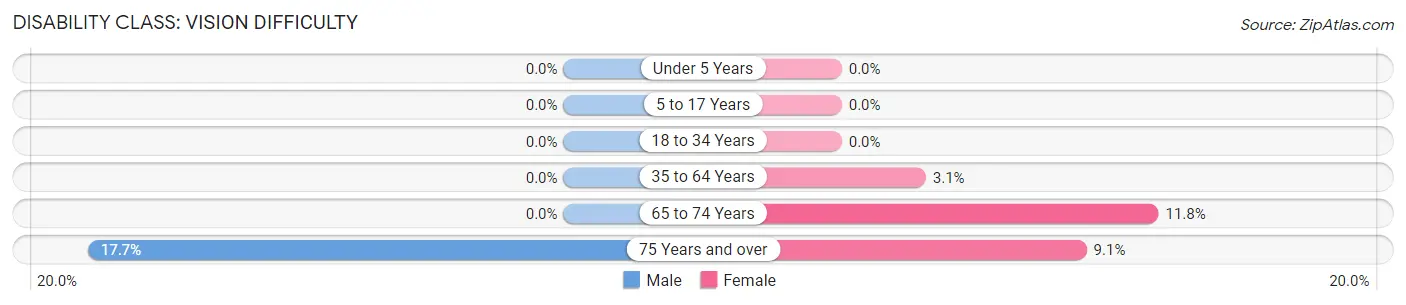
| Age Bracket | Male | Female |
| Under 5 Years | 0 (0.0%) | 0 (0.0%) |
| 5 to 17 Years | 0 (0.0%) | 0 (0.0%) |
| 18 to 34 Years | 0 (0.0%) | 0 (0.0%) |
| 35 to 64 Years | 0 (0.0%) | 2 (3.1%) |
| 65 to 74 Years | 0 (0.0%) | 2 (11.8%) |
| 75 Years and over | 3 (17.6%) | 1 (9.1%) |
Disability Class: Cognitive Difficulty
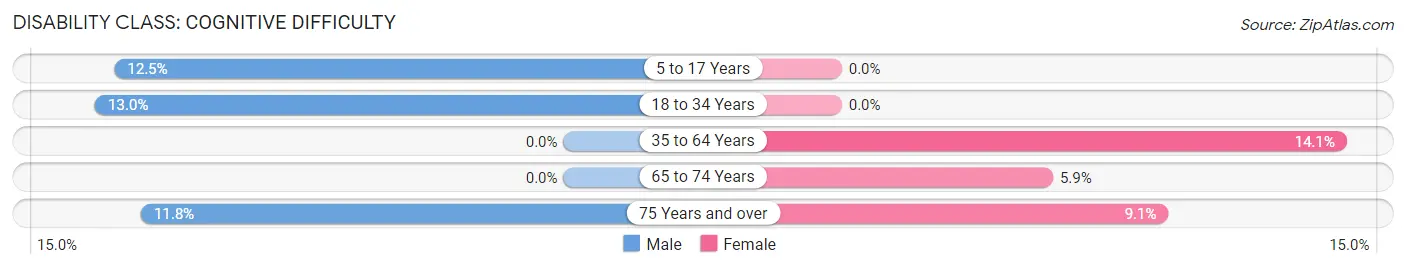
| Age Bracket | Male | Female |
| 5 to 17 Years | 1 (12.5%) | 0 (0.0%) |
| 18 to 34 Years | 3 (13.0%) | 0 (0.0%) |
| 35 to 64 Years | 0 (0.0%) | 9 (14.1%) |
| 65 to 74 Years | 0 (0.0%) | 1 (5.9%) |
| 75 Years and over | 2 (11.8%) | 1 (9.1%) |
Disability Class: Ambulatory Difficulty
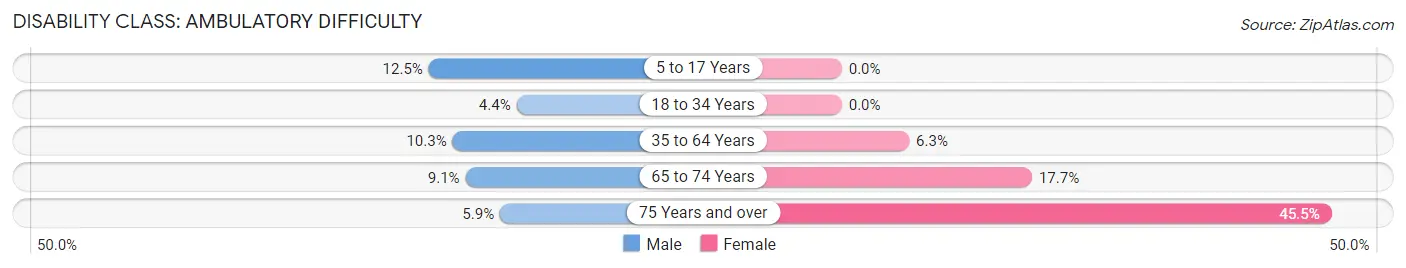
| Age Bracket | Male | Female |
| 5 to 17 Years | 1 (12.5%) | 0 (0.0%) |
| 18 to 34 Years | 1 (4.3%) | 0 (0.0%) |
| 35 to 64 Years | 7 (10.3%) | 4 (6.2%) |
| 65 to 74 Years | 1 (9.1%) | 3 (17.6%) |
| 75 Years and over | 1 (5.9%) | 5 (45.5%) |
Disability Class: Self-Care Difficulty
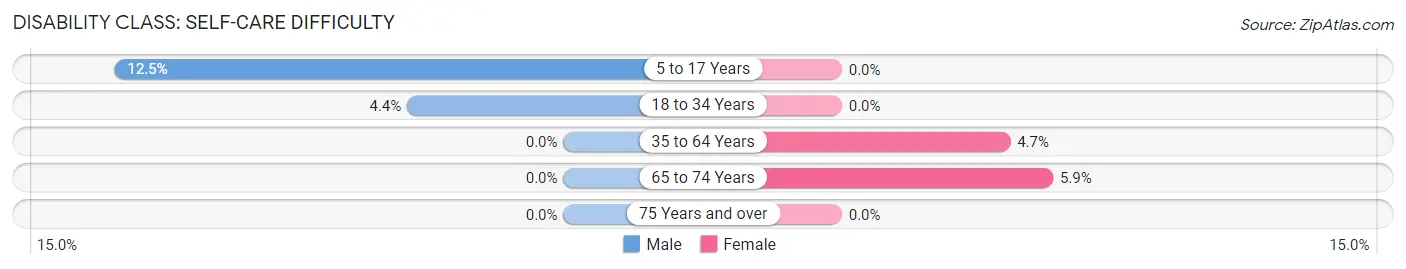
| Age Bracket | Male | Female |
| 5 to 17 Years | 1 (12.5%) | 0 (0.0%) |
| 18 to 34 Years | 1 (4.3%) | 0 (0.0%) |
| 35 to 64 Years | 0 (0.0%) | 3 (4.7%) |
| 65 to 74 Years | 0 (0.0%) | 1 (5.9%) |
| 75 Years and over | 0 (0.0%) | 0 (0.0%) |
Technology Access in Garland
Computing Device Access in Garland
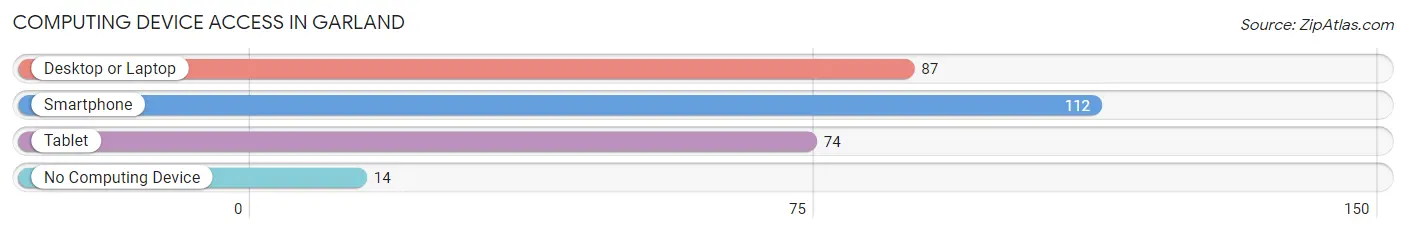
| Device Type | # Households | % Households |
| Desktop or Laptop | 87 | 67.4% |
| Smartphone | 112 | 86.8% |
| Tablet | 74 | 57.4% |
| No Computing Device | 14 | 10.8% |
| Total | 129 | 100.0% |
Internet Access in Garland
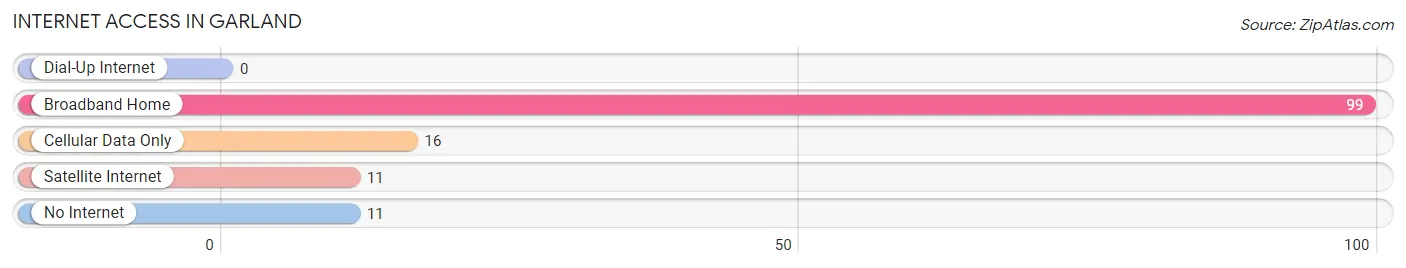
| Internet Type | # Households | % Households |
| Dial-Up Internet | 0 | 0.0% |
| Broadband Home | 99 | 76.7% |
| Cellular Data Only | 16 | 12.4% |
| Satellite Internet | 11 | 8.5% |
| No Internet | 11 | 8.5% |
| Total | 129 | 100.0% |
Garland Summary
Garland, Tennessee is a small town located in the western part of the state, in the foothills of the Appalachian Mountains. It is situated in the Sequatchie Valley, a narrow valley that runs through the Cumberland Plateau. The town is located about 25 miles east of Chattanooga and is part of the Chattanooga metropolitan area.
History
Garland was founded in 1836 by a group of settlers from North Carolina. The town was named after the nearby Garland Creek, which was named after a local Cherokee chief. The town was originally a farming community, but it soon became a center for the timber industry. The town was incorporated in 1887 and was home to several sawmills and lumber companies.
In the early 1900s, Garland began to experience a period of growth and prosperity. The town was home to several businesses, including a bank, a hotel, a newspaper, and a movie theater. The town also had a thriving music scene, with several local bands playing in the area.
In the 1950s, Garland began to experience a decline in population and economic activity. The timber industry had moved away, and the town was no longer a center of commerce. In the late 1970s, the town began to experience a resurgence, as new businesses moved into the area and the population began to grow again.
Geography
Garland is located in the Sequatchie Valley, a narrow valley that runs through the Cumberland Plateau. The town is situated at the intersection of two major highways, US-127 and US-41. The town is surrounded by rolling hills and mountains, and is located about 25 miles east of Chattanooga.
The climate in Garland is mild and humid, with temperatures ranging from the low 30s in the winter to the mid-80s in the summer. The town receives an average of 45 inches of rain per year, and snowfall is rare.
Economy
Garland’s economy is largely based on agriculture and tourism. The town is home to several farms, and the surrounding area is known for its production of corn, soybeans, and hay. The town is also home to several tourist attractions, including the Sequatchie Valley Railroad Museum and the Sequatchie Valley Scenic Byway.
The town is also home to several small businesses, including restaurants, shops, and a movie theater. The town is also home to a few manufacturing companies, including a furniture factory and a plastics factory.
Demographics
As of the 2010 census, the population of Garland was 1,845. The town is predominantly white, with about 90% of the population identifying as white. The median household income in the town is $35,000, and the median age is 40.
Garland is a small town with a close-knit community. The town is home to several churches, and the town’s residents are known for their hospitality and friendliness. The town is also home to several festivals and events throughout the year, including the Sequatchie Valley Music Festival and the Sequatchie Valley Bluegrass Festival.
Common Questions
What is the Total Population of Garland?
Total Population of Garland is 284.
What is the Total Male Population of Garland?
Total Male Population of Garland is 141.
What is the Total Female Population of Garland?
Total Female Population of Garland is 143.
What is the Ratio of Males per 100 Females in Garland?
There are 98.60 Males per 100 Females in Garland.
What is the Ratio of Females per 100 Males in Garland?
There are 101.42 Females per 100 Males in Garland.
What is the Median Population Age in Garland?
Median Population Age in Garland is 44.0 Years.
What is the Average Family Size in Garland
Average Family Size in Garland is 2.5 People.
What is the Average Household Size in Garland
Average Household Size in Garland is 2.2 People.
What is Per Capita Income in Garland?
Per Capita income in Garland is $34,314.
What is the Median Family Income in Garland?
Median Family Income in Garland is $90,114.
What is the Median Household income in Garland?
Median Household Income in Garland is $70,625.
What is Income or Wage Gap in Garland?
Income or Wage Gap in Garland is 0.4%.
Women in Garland earn 99.6 cents for every dollar earned by a man.
What is Inequality or Gini Index in Garland?
Inequality or Gini Index in Garland is 0.30.
How Large is the Labor Force in Garland?
There are 154 People in the Labor Forcein in Garland.
What is the Percentage of People in the Labor Force in Garland?
64.4% of People are in the Labor Force in Garland.
What is the Unemployment Rate in Garland?
Unemployment Rate in Garland is 1.9%.