Abbeville County, SC
Abbeville County Map

Abbeville County Overview
24,368
TOTAL POPULATION
11,865
MALE POPULATION
12,503
FEMALE POPULATION
94.90
MALES / 100 FEMALES
105.38
FEMALES / 100 MALES
44.5
MEDIAN AGE
3.0
AVG FAMILY SIZE
2.4
AVG HOUSEHOLD SIZE
$31,443
PER CAPITA INCOME
$66,592
AVG FAMILY INCOME
$49,759
AVG HOUSEHOLD INCOME
19.2%
WAGE / INCOME GAP [ % ]
80.8¢/ $1
WAGE / INCOME GAP [ $ ]
$11,521
FAMILY INCOME DEFICIT
0.49
INEQUALITY / GINI INDEX
10,405
LABOR FORCE [ PEOPLE ]
52.0%
PERCENT IN LABOR FORCE
2.8%
UNEMPLOYMENT RATE
Abbeville County Area Codes
Race in Abbeville County
The most populous races in Abbeville County are White / Caucasian (16,915 | 69.4%), Black / African American (6,372 | 26.2%), and Two or more Races (840 | 3.5%).

| Race | # Population | % Population |
| Asian | 58 | 0.2% |
| Black / African American | 6,372 | 26.2% |
| Hawaiian / Pacific | 0 | 0.0% |
| Hispanic or Latino | 441 | 1.8% |
| Native / Alaskan | 28 | 0.1% |
| White / Caucasian | 16,915 | 69.4% |
| Two or more Races | 840 | 3.5% |
| Some other Race | 155 | 0.6% |
| Total | 24,368 | 100.0% |
Ancestry in Abbeville County
The most populous ancestries reported in Abbeville County are American (2,248 | 9.2%), German (1,523 | 6.2%), Irish (1,450 | 5.9%), English (1,429 | 5.9%), and Scotch-Irish (555 | 2.3%), together accounting for 29.6% of all Abbeville County residents.

| Ancestry | # Population | % Population |
| African | 432 | 1.8% |
| Albanian | 22 | 0.1% |
| American | 2,248 | 9.2% |
| Arab | 13 | 0.1% |
| Argentinean | 13 | 0.1% |
| Australian | 7 | 0.0% |
| Austrian | 4 | 0.0% |
| Bhutanese | 5 | 0.0% |
| Blackfeet | 10 | 0.0% |
| Brazilian | 4 | 0.0% |
| British | 161 | 0.7% |
| Canadian | 24 | 0.1% |
| Central American | 51 | 0.2% |
| Cherokee | 51 | 0.2% |
| Choctaw | 6 | 0.0% |
| Colombian | 12 | 0.1% |
| Cuban | 69 | 0.3% |
| Czech | 1 | 0.0% |
| Danish | 6 | 0.0% |
| Dutch | 69 | 0.3% |
| English | 1,429 | 5.9% |
| European | 324 | 1.3% |
| Finnish | 5 | 0.0% |
| French | 354 | 1.5% |
| French Canadian | 23 | 0.1% |
| German | 1,523 | 6.2% |
| Greek | 52 | 0.2% |
| Guatemalan | 51 | 0.2% |
| Hungarian | 11 | 0.1% |
| Irish | 1,450 | 5.9% |
| Italian | 259 | 1.1% |
| Jamaican | 37 | 0.2% |
| Lebanese | 11 | 0.1% |
| Lithuanian | 6 | 0.0% |
| Mexican | 192 | 0.8% |
| Nigerian | 1 | 0.0% |
| Northern European | 11 | 0.1% |
| Norwegian | 20 | 0.1% |
| Pakistani | 5 | 0.0% |
| Polish | 219 | 0.9% |
| Portuguese | 13 | 0.1% |
| Puerto Rican | 37 | 0.2% |
| Russian | 31 | 0.1% |
| Scandinavian | 53 | 0.2% |
| Scotch-Irish | 555 | 2.3% |
| Scottish | 395 | 1.6% |
| Slovak | 2 | 0.0% |
| Slovene | 6 | 0.0% |
| South American | 28 | 0.1% |
| Spaniard | 59 | 0.2% |
| Sri Lankan | 3 | 0.0% |
| Subsaharan African | 444 | 1.8% |
| Swedish | 53 | 0.2% |
| Swiss | 47 | 0.2% |
| Thai | 53 | 0.2% |
| Ugandan | 6 | 0.0% |
| Ukrainian | 77 | 0.3% |
| Venezuelan | 3 | 0.0% |
| Welsh | 105 | 0.4% |
| Yugoslavian | 26 | 0.1% | View All 60 Rows |
Immigrants in Abbeville County
The most numerous immigrant groups reported in Abbeville County came from Latin America (230 | 0.9%), Europe (196 | 0.8%), Central America (178 | 0.7%), Mexico (145 | 0.6%), and Canada (137 | 0.6%), together accounting for 3.6% of all Abbeville County residents.

| Immigration Origin | # Population | % Population |
| Africa | 20 | 0.1% |
| Albania | 22 | 0.1% |
| Argentina | 11 | 0.1% |
| Asia | 53 | 0.2% |
| Brazil | 4 | 0.0% |
| Cameroon | 1 | 0.0% |
| Canada | 137 | 0.6% |
| Caribbean | 25 | 0.1% |
| Central America | 178 | 0.7% |
| Colombia | 12 | 0.1% |
| Congo | 8 | 0.0% |
| Cuba | 25 | 0.1% |
| Czechoslovakia | 2 | 0.0% |
| Eastern Africa | 6 | 0.0% |
| Eastern Europe | 111 | 0.5% |
| England | 18 | 0.1% |
| Europe | 196 | 0.8% |
| France | 1 | 0.0% |
| Germany | 21 | 0.1% |
| Greece | 19 | 0.1% |
| Guatemala | 33 | 0.1% |
| India | 53 | 0.2% |
| Latin America | 230 | 0.9% |
| Mexico | 145 | 0.6% |
| Middle Africa | 9 | 0.0% |
| Northern Europe | 37 | 0.2% |
| Poland | 2 | 0.0% |
| Russia | 41 | 0.2% |
| Scotland | 11 | 0.1% |
| South America | 27 | 0.1% |
| South Central Asia | 53 | 0.2% |
| Southern Europe | 26 | 0.1% |
| Spain | 7 | 0.0% |
| Sweden | 7 | 0.0% |
| Uganda | 6 | 0.0% |
| Ukraine | 44 | 0.2% |
| Western Africa | 5 | 0.0% |
| Western Europe | 22 | 0.1% | View All 38 Rows |
Sex and Age in Abbeville County
Sex and Age in Abbeville County
The most populous age groups in Abbeville County are 60 to 64 Years (909 | 7.7%) for men and 55 to 59 Years (987 | 7.9%) for women.

| Age Bracket | Male | Female |
| Under 5 Years | 582 (4.9%) | 594 (4.8%) |
| 5 to 9 Years | 614 (5.2%) | 709 (5.7%) |
| 10 to 14 Years | 836 (7.0%) | 702 (5.6%) |
| 15 to 19 Years | 851 (7.2%) | 881 (7.0%) |
| 20 to 24 Years | 799 (6.7%) | 651 (5.2%) |
| 25 to 29 Years | 581 (4.9%) | 698 (5.6%) |
| 30 to 34 Years | 573 (4.8%) | 605 (4.8%) |
| 35 to 39 Years | 698 (5.9%) | 524 (4.2%) |
| 40 to 44 Years | 612 (5.2%) | 801 (6.4%) |
| 45 to 49 Years | 732 (6.2%) | 729 (5.8%) |
| 50 to 54 Years | 800 (6.7%) | 840 (6.7%) |
| 55 to 59 Years | 818 (6.9%) | 987 (7.9%) |
| 60 to 64 Years | 909 (7.7%) | 845 (6.8%) |
| 65 to 69 Years | 729 (6.1%) | 848 (6.8%) |
| 70 to 74 Years | 789 (6.7%) | 829 (6.6%) |
| 75 to 79 Years | 436 (3.7%) | 461 (3.7%) |
| 80 to 84 Years | 281 (2.4%) | 351 (2.8%) |
| 85 Years and over | 225 (1.9%) | 448 (3.6%) |
| Total | 11,865 (100.0%) | 12,503 (100.0%) |
Families and Households in Abbeville County
Median Family Size in Abbeville County
The median family size in Abbeville County is 3.03 persons per family, with single female/mother families (1,156 | 18.4%) accounting for the largest median family size of 3.71 persons per family. On the other hand, single male/father families (435 | 6.9%) represent the smallest median family size with 2.82 persons per family.

| Family Type | # Families | Family Size |
| Married-Couple | 4,678 (74.6%) | 2.88 |
| Single Male/Father | 435 (6.9%) | 2.82 |
| Single Female/Mother | 1,156 (18.4%) | 3.71 |
| Total Families | 6,269 (100.0%) | 3.03 |
Median Household Size in Abbeville County
The median household size in Abbeville County is 2.43 persons per household, with single female/mother households (1,156 | 12.0%) accounting for the largest median household size of 3.86 persons per household. non-family households (3,351 | 34.8%) represent the smallest median household size with 1.19 persons per household.

| Household Type | # Households | Household Size |
| Married-Couple | 4,678 (48.6%) | 2.88 |
| Single Male/Father | 435 (4.5%) | 3.39 |
| Single Female/Mother | 1,156 (12.0%) | 3.86 |
| Non-family | 3,351 (34.8%) | 1.19 |
| Total Households | 9,620 (100.0%) | 2.43 |
Household Size by Marriage Status in Abbeville County
Out of a total of 9,620 households in Abbeville County, 6,269 (65.2%) are family households, while 3,351 (34.8%) are nonfamily households. The most numerous type of family households are 2-person households, comprising 3,585, and the most common type of nonfamily households are 1-person households, comprising 2,898.

| Household Size | Family Households | Nonfamily Households |
| 1-Person Households | - | 2,898 (30.1%) |
| 2-Person Households | 3,585 (37.3%) | 357 (3.7%) |
| 3-Person Households | 1,143 (11.9%) | 96 (1.0%) |
| 4-Person Households | 926 (9.6%) | 0 (0.0%) |
| 5-Person Households | 395 (4.1%) | 0 (0.0%) |
| 6-Person Households | 102 (1.1%) | 0 (0.0%) |
| 7+ Person Households | 118 (1.2%) | 0 (0.0%) |
| Total | 6,269 (65.2%) | 3,351 (34.8%) |
Female Fertility in Abbeville County
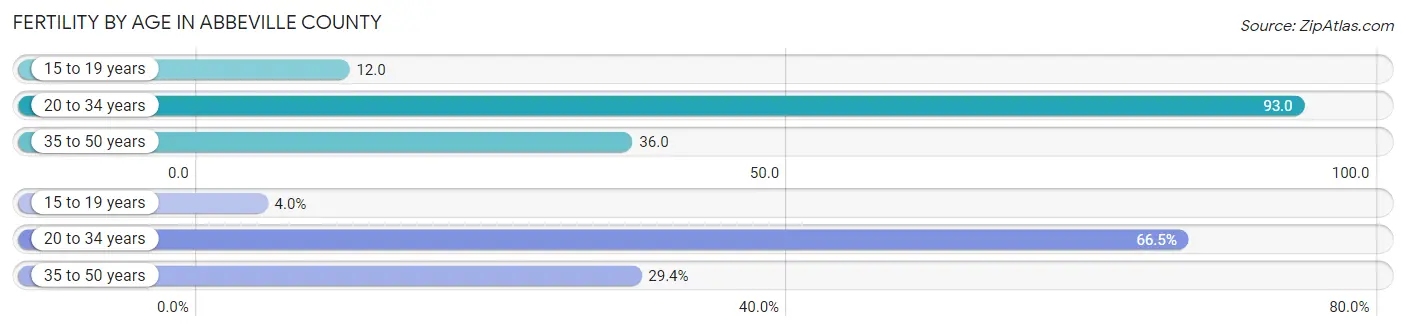
Fertility by Age in Abbeville County
Average fertility rate in Abbeville County is 54.0 births per 1,000 women. Women in the age bracket of 20 to 34 years have the highest fertility rate with 93.0 births per 1,000 women. Women in the age bracket of 20 to 34 years acount for 66.5% of all women with births.
| Age Bracket | Women with Births | Births / 1,000 Women |
| 15 to 19 years | 11 (4.0%) | 12.0 |
| 20 to 34 years | 181 (66.5%) | 93.0 |
| 35 to 50 years | 80 (29.4%) | 36.0 |
| Total | 272 (100.0%) | 54.0 |
Fertility by Age by Marriage Status in Abbeville County
80.1% of women with births (272) in Abbeville County are married. The highest percentage of unmarried women with births falls into 15 to 19 years age bracket with 100.0% of them unmarried at the time of birth, while the lowest percentage of unmarried women with births belong to 35 to 50 years age bracket with 1.2% of them unmarried.

| Age Bracket | Married | Unmarried |
| 15 to 19 years | 0 (0.0%) | 11 (100.0%) |
| 20 to 34 years | 139 (76.8%) | 42 (23.2%) |
| 35 to 50 years | 79 (98.8%) | 1 (1.3%) |
| Total | 218 (80.1%) | 54 (19.9%) |
Fertility by Education in Abbeville County

| Educational Attainment | Women with Births | Births / 1,000 Women |
| Less than High School | 0 (0.0%) | 0.0 |
| High School Diploma | 98 (36.0%) | 68.0 |
| College or Associate's Degree | 157 (57.7%) | 90.0 |
| Bachelor's Degree | 6 (2.2%) | 8.0 |
| Graduate Degree | 11 (4.0%) | 42.0 |
| Total | 272 (100.0%) | 54.0 |
Fertility by Education by Marriage Status in Abbeville County
19.9% of women with births in Abbeville County are unmarried. Women with the educational attainment of bachelor's degree are most likely to be married with 100.0% of them married at childbirth, while women with the educational attainment of college or associate's degree are least likely to be married with 23.6% of them unmarried at childbirth.

| Educational Attainment | Married | Unmarried |
| Less than High School | 0 (0.0%) | 0 (0.0%) |
| High School Diploma | 82 (83.7%) | 16 (16.3%) |
| College or Associate's Degree | 120 (76.4%) | 37 (23.6%) |
| Bachelor's Degree | 6 (100.0%) | 0 (0.0%) |
| Graduate Degree | 10 (90.9%) | 1 (9.1%) |
| Total | 218 (80.1%) | 54 (19.9%) |
Income in Abbeville County
Income Overview in Abbeville County
Per Capita Income in Abbeville County is $31,443, while median incomes of families and households are $66,592 and $49,759 respectively.
| Characteristic | Number | Measure |
| Per Capita Income | 24,368 | $31,443 |
| Median Family Income | 6,269 | $66,592 |
| Mean Family Income | 6,269 | $81,455 |
| Median Household Income | 9,620 | $49,759 |
| Mean Household Income | 9,620 | $75,391 |
| Income Deficit | 6,269 | $11,521 |
| Wage / Income Gap (%) | 24,368 | 19.24% |
| Wage / Income Gap ($) | 24,368 | 80.76¢ per $1 |
| Gini / Inequality Index | 24,368 | 0.49 |
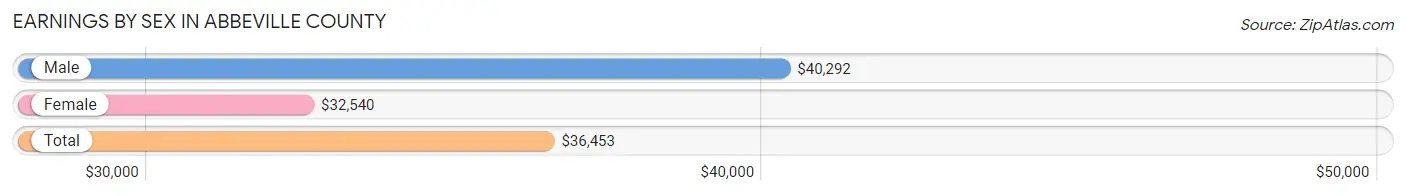
Earnings by Sex in Abbeville County
Average Earnings in Abbeville County are $36,453, $40,292 for men and $32,540 for women, a difference of 19.2%.
| Sex | Number | Average Earnings |
| Male | 5,837 (52.0%) | $40,292 |
| Female | 5,386 (48.0%) | $32,540 |
| Total | 11,223 (100.0%) | $36,453 |
Earnings by Sex by Income Bracket in Abbeville County
The most common earnings brackets in Abbeville County are $100,000+ for men (713 | 12.2%) and $35,000 to $39,999 for women (448 | 8.3%).

| Income | Male | Female |
| $2,499 or less | 174 (3.0%) | 237 (4.4%) |
| $2,500 to $4,999 | 307 (5.3%) | 234 (4.3%) |
| $5,000 to $7,499 | 124 (2.1%) | 314 (5.8%) |
| $7,500 to $9,999 | 160 (2.7%) | 140 (2.6%) |
| $10,000 to $12,499 | 143 (2.5%) | 225 (4.2%) |
| $12,500 to $14,999 | 53 (0.9%) | 163 (3.0%) |
| $15,000 to $17,499 | 213 (3.6%) | 338 (6.3%) |
| $17,500 to $19,999 | 77 (1.3%) | 200 (3.7%) |
| $20,000 to $22,499 | 95 (1.6%) | 174 (3.2%) |
| $22,500 to $24,999 | 90 (1.5%) | 207 (3.8%) |
| $25,000 to $29,999 | 332 (5.7%) | 319 (5.9%) |
| $30,000 to $34,999 | 610 (10.4%) | 389 (7.2%) |
| $35,000 to $39,999 | 504 (8.6%) | 448 (8.3%) |
| $40,000 to $44,999 | 471 (8.1%) | 385 (7.1%) |
| $45,000 to $49,999 | 313 (5.4%) | 358 (6.7%) |
| $50,000 to $54,999 | 237 (4.1%) | 196 (3.6%) |
| $55,000 to $64,999 | 422 (7.2%) | 388 (7.2%) |
| $65,000 to $74,999 | 286 (4.9%) | 174 (3.2%) |
| $75,000 to $99,999 | 513 (8.8%) | 385 (7.1%) |
| $100,000+ | 713 (12.2%) | 112 (2.1%) |
| Total | 5,837 (100.0%) | 5,386 (100.0%) |
Earnings by Sex by Educational Attainment in Abbeville County
Average earnings in Abbeville County are $42,867 for men and $36,104 for women, a difference of 15.8%. Men with an educational attainment of graduate degree enjoy the highest average annual earnings of $68,487, while those with high school diploma education earn the least with $37,886. Women with an educational attainment of graduate degree earn the most with the average annual earnings of $61,979, while those with high school diploma education have the smallest earnings of $27,210.

| Educational Attainment | Male Income | Female Income |
| Less than High School | $38,309 | $39,224 |
| High School Diploma | $37,886 | $27,210 |
| College or Associate's Degree | $55,799 | $36,786 |
| Bachelor's Degree | $41,035 | $41,778 |
| Graduate Degree | $68,487 | $61,979 |
| Total | $42,867 | $36,104 |
Family Income in Abbeville County
Family Income Brackets in Abbeville County
According to the Abbeville County family income data, there are 1,197 families falling into the $50,000 to $74,999 income range, which is the most common income bracket and makes up 19.1% of all families. Conversely, the $10,000 to $14,999 income bracket is the least frequent group with only 188 families (3.0%) belonging to this category.

| Income Bracket | # Families | % Families |
| Less than $10,000 | 244 | 3.9% |
| $10,000 to $14,999 | 188 | 3.0% |
| $15,000 to $24,999 | 401 | 6.4% |
| $25,000 to $34,999 | 552 | 8.8% |
| $35,000 to $49,999 | 871 | 13.9% |
| $50,000 to $74,999 | 1,197 | 19.1% |
| $75,000 to $99,999 | 959 | 15.3% |
| $100,000 to $149,999 | 1,066 | 17.0% |
| $150,000 to $199,999 | 589 | 9.4% |
| $200,000+ | 201 | 3.2% |
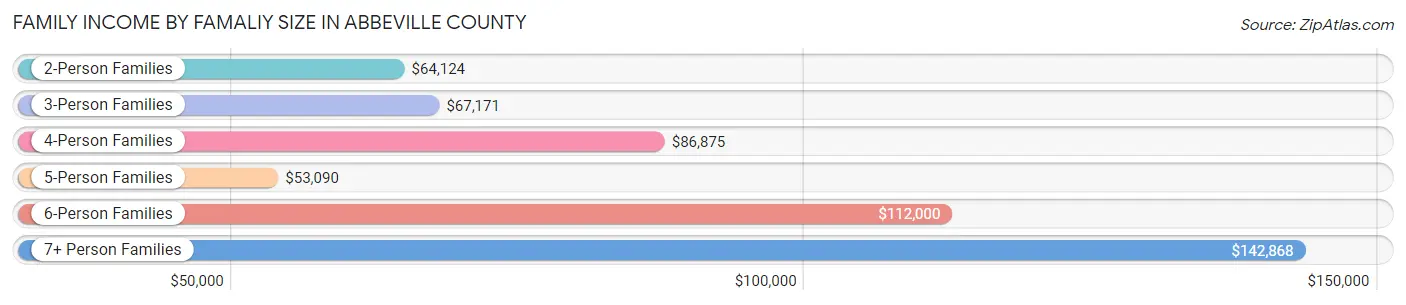
Family Income by Famaliy Size in Abbeville County
7+ person families (101 | 1.6%) account for the highest median family income in Abbeville County with $142,868 per family, while 2-person families (3,689 | 58.9%) have the highest median income of $32,062 per family member.
| Income Bracket | # Families | Median Income |
| 2-Person Families | 3,689 (58.9%) | $64,124 |
| 3-Person Families | 1,268 (20.2%) | $67,171 |
| 4-Person Families | 742 (11.8%) | $86,875 |
| 5-Person Families | 363 (5.8%) | $53,090 |
| 6-Person Families | 106 (1.7%) | $112,000 |
| 7+ Person Families | 101 (1.6%) | $142,868 |
| Total | 6,269 (100.0%) | $66,592 |
Family Income by Number of Earners in Abbeville County
The median family income in Abbeville County is $66,592, with families comprising 3+ earners (341) having the highest median family income of $142,770, while families with no earners (1,609) have the lowest median family income of $41,792, accounting for 5.4% and 25.7% of families, respectively.

| Number of Earners | # Families | Median Income |
| No Earners | 1,609 (25.7%) | $41,792 |
| 1 Earner | 2,038 (32.5%) | $49,766 |
| 2 Earners | 2,281 (36.4%) | $95,820 |
| 3+ Earners | 341 (5.4%) | $142,770 |
| Total | 6,269 (100.0%) | $66,592 |
Household Income in Abbeville County
Household Income Brackets in Abbeville County
With 1,520 households falling in the category, the $50,000 to $74,999 income range is the most frequent in Abbeville County, accounting for 15.8% of all households. In contrast, only 414 households (4.3%) fall into the $200,000+ income bracket, making it the least populous group.

| Income Bracket | # Households | % Households |
| Less than $10,000 | 673 | 7.0% |
| $10,000 to $14,999 | 616 | 6.4% |
| $15,000 to $24,999 | 924 | 9.6% |
| $25,000 to $34,999 | 1,106 | 11.5% |
| $35,000 to $49,999 | 1,510 | 15.7% |
| $50,000 to $74,999 | 1,520 | 15.8% |
| $75,000 to $99,999 | 1,010 | 10.5% |
| $100,000 to $149,999 | 1,212 | 12.6% |
| $150,000 to $199,999 | 635 | 6.6% |
| $200,000+ | 414 | 4.3% |
Household Income by Householder Age in Abbeville County
The median household income in Abbeville County is $49,759, with the highest median household income of $68,305 found in the 45 to 64 years age bracket for the primary householder. A total of 3,550 households (36.9%) fall into this category. Meanwhile, the 15 to 24 years age bracket for the primary householder has the lowest median household income of $22,153, with 246 households (2.6%) in this group.

| Income Bracket | # Households | Median Income |
| 15 to 24 Years | 246 (2.6%) | $22,153 |
| 25 to 44 Years | 2,355 (24.5%) | $52,872 |
| 45 to 64 Years | 3,550 (36.9%) | $68,305 |
| 65+ Years | 3,469 (36.1%) | $41,589 |
| Total | 9,620 (100.0%) | $49,759 |
Poverty in Abbeville County
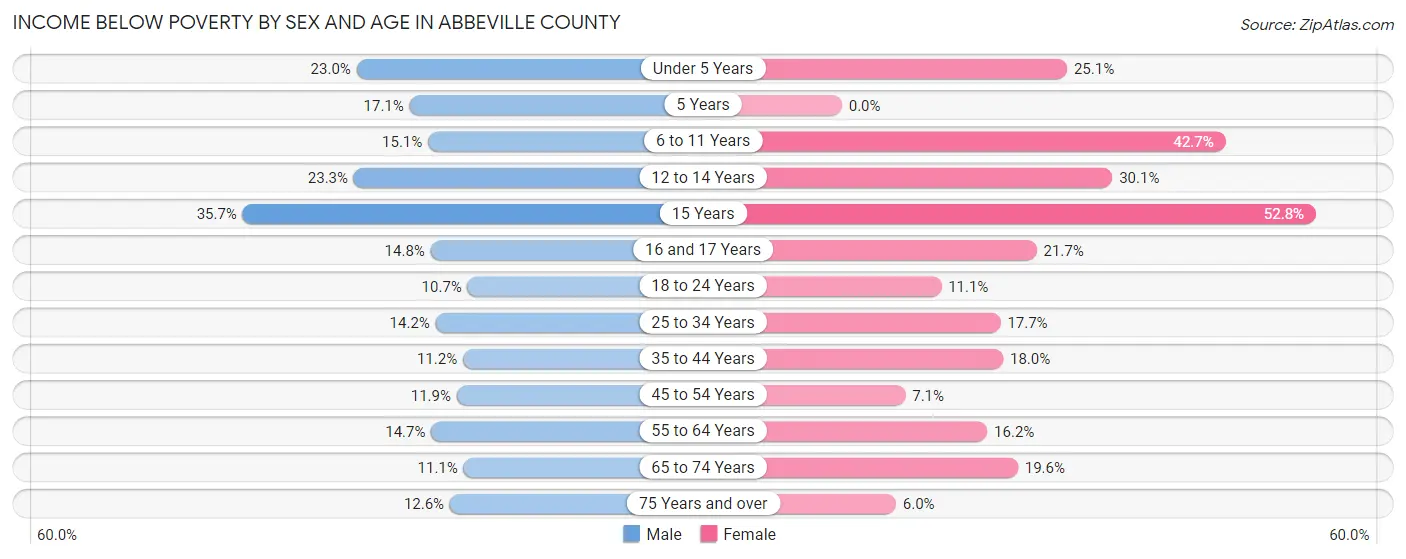
Income Below Poverty by Sex and Age in Abbeville County
With 14.1% poverty level for males and 17.7% for females among the residents of Abbeville County, 15 year old males and 15 year old females are the most vulnerable to poverty, with 70 males (35.7%) and 66 females (52.8%) in their respective age groups living below the poverty level.
| Age Bracket | Male | Female |
| Under 5 Years | 134 (23.0%) | 149 (25.1%) |
| 5 Years | 19 (17.1%) | 0 (0.0%) |
| 6 to 11 Years | 141 (15.1%) | 326 (42.7%) |
| 12 to 14 Years | 94 (23.3%) | 175 (30.1%) |
| 15 Years | 70 (35.7%) | 66 (52.8%) |
| 16 and 17 Years | 30 (14.8%) | 59 (21.7%) |
| 18 to 24 Years | 98 (10.7%) | 96 (11.1%) |
| 25 to 34 Years | 162 (14.2%) | 230 (17.7%) |
| 35 to 44 Years | 144 (11.2%) | 238 (18.0%) |
| 45 to 54 Years | 180 (11.9%) | 111 (7.1%) |
| 55 to 64 Years | 254 (14.7%) | 295 (16.2%) |
| 65 to 74 Years | 168 (11.1%) | 323 (19.6%) |
| 75 Years and over | 119 (12.6%) | 71 (6.0%) |
| Total | 1,613 (14.1%) | 2,139 (17.7%) |
Income Above Poverty by Sex and Age in Abbeville County
According to the poverty statistics in Abbeville County, males aged 18 to 24 years and females aged 5 years are the age groups that are most secure financially, with 89.3% of males and 100.0% of females in these age groups living above the poverty line.
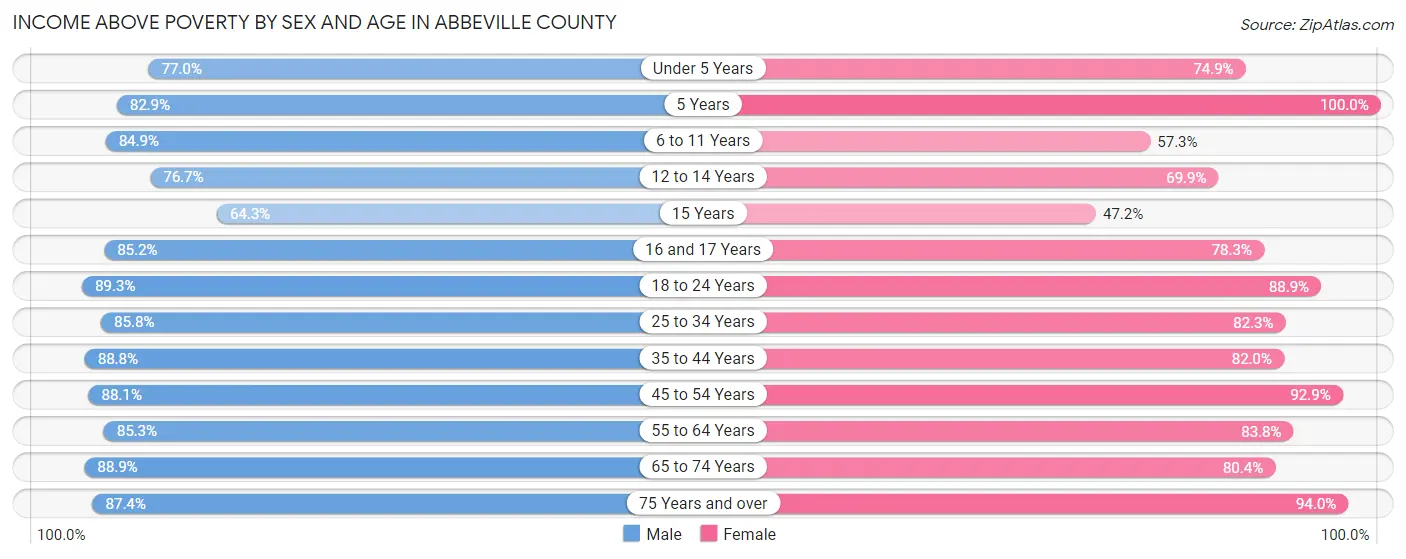
| Age Bracket | Male | Female |
| Under 5 Years | 448 (77.0%) | 445 (74.9%) |
| 5 Years | 92 (82.9%) | 67 (100.0%) |
| 6 to 11 Years | 795 (84.9%) | 437 (57.3%) |
| 12 to 14 Years | 309 (76.7%) | 406 (69.9%) |
| 15 Years | 126 (64.3%) | 59 (47.2%) |
| 16 and 17 Years | 173 (85.2%) | 213 (78.3%) |
| 18 to 24 Years | 821 (89.3%) | 771 (88.9%) |
| 25 to 34 Years | 977 (85.8%) | 1,072 (82.3%) |
| 35 to 44 Years | 1,144 (88.8%) | 1,087 (82.0%) |
| 45 to 54 Years | 1,337 (88.1%) | 1,458 (92.9%) |
| 55 to 64 Years | 1,473 (85.3%) | 1,527 (83.8%) |
| 65 to 74 Years | 1,344 (88.9%) | 1,325 (80.4%) |
| 75 Years and over | 823 (87.4%) | 1,108 (94.0%) |
| Total | 9,862 (85.9%) | 9,975 (82.3%) |
Income Below Poverty Among Married-Couple Families in Abbeville County
The poverty statistics for married-couple families in Abbeville County show that 6.6% or 310 of the total 4,678 families live below the poverty line. Families with 3 or 4 children have the highest poverty rate of 37.6%, comprising of 102 families. On the other hand, families with 5 or more children have the lowest poverty rate of 0.0%, which includes 0 families.

| Children | Above Poverty | Below Poverty |
| No Children | 3,131 (95.3%) | 155 (4.7%) |
| 1 or 2 Children | 1,064 (95.3%) | 53 (4.7%) |
| 3 or 4 Children | 169 (62.4%) | 102 (37.6%) |
| 5 or more Children | 4 (100.0%) | 0 (0.0%) |
| Total | 4,368 (93.4%) | 310 (6.6%) |
Income Below Poverty Among Single-Parent Households in Abbeville County
According to the poverty data in Abbeville County, 18.6% or 81 single-father households and 27.2% or 314 single-mother households are living below the poverty line. Among single-father households, those with 1 or 2 children have the highest poverty rate, with 62 households (33.9%) experiencing poverty. Likewise, among single-mother households, those with 3 or 4 children have the highest poverty rate, with 105 households (50.0%) falling below the poverty line.

| Children | Single Father | Single Mother |
| No Children | 19 (7.5%) | 56 (11.3%) |
| 1 or 2 Children | 62 (33.9%) | 153 (34.0%) |
| 3 or 4 Children | 0 (0.0%) | 105 (50.0%) |
| 5 or more Children | 0 (0.0%) | 0 (0.0%) |
| Total | 81 (18.6%) | 314 (27.2%) |
Income Below Poverty Among Married-Couple vs Single-Parent Households in Abbeville County
The poverty data for Abbeville County shows that 310 of the married-couple family households (6.6%) and 395 of the single-parent households (24.8%) are living below the poverty level. Within the married-couple family households, those with 3 or 4 children have the highest poverty rate, with 102 households (37.6%) falling below the poverty line. Among the single-parent households, those with 3 or 4 children have the highest poverty rate, with 105 household (50.0%) living below poverty.
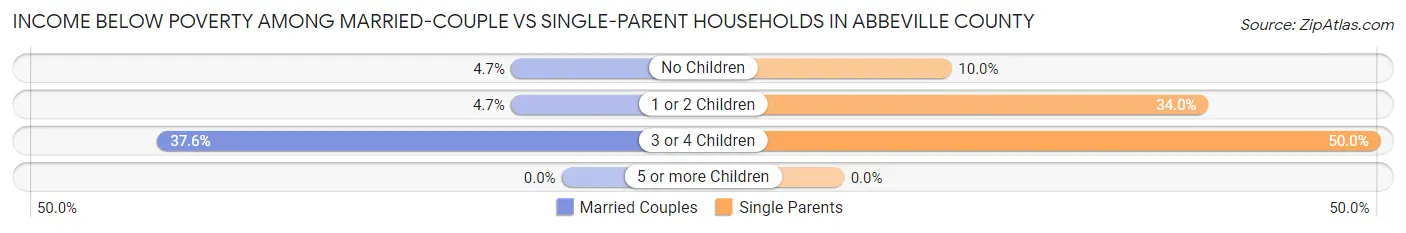
| Children | Married-Couple Families | Single-Parent Households |
| No Children | 155 (4.7%) | 75 (10.0%) |
| 1 or 2 Children | 53 (4.7%) | 215 (34.0%) |
| 3 or 4 Children | 102 (37.6%) | 105 (50.0%) |
| 5 or more Children | 0 (0.0%) | 0 (0.0%) |
| Total | 310 (6.6%) | 395 (24.8%) |
Employment Characteristics in Abbeville County
Employment by Class of Employer in Abbeville County
Among the 9,815 employed individuals in Abbeville County, private company employees (6,971 | 71.0%), local government employees (919 | 9.4%), and not-for-profit organizations (650 | 6.6%) make up the most common classes of employment.

| Employer Class | # Employees | % Employees |
| Private Company Employees | 6,971 | 71.0% |
| Self-Employed (Incorporated) | 237 | 2.4% |
| Self-Employed (Not Incorporated) | 356 | 3.6% |
| Not-for-profit Organizations | 650 | 6.6% |
| Local Government Employees | 919 | 9.4% |
| State Government Employees | 605 | 6.2% |
| Federal Government Employees | 77 | 0.8% |
| Unpaid Family Workers | 0 | 0.0% |
| Total | 9,815 | 100.0% |
Employment Status by Age in Abbeville County
According to the labor force statistics for Abbeville County, out of the total population over 16 years of age (20,010), 52.0% or 10,405 individuals are in the labor force, with 2.8% or 291 of them unemployed. The age group with the highest labor force participation rate is 30 to 34 years, with 90.3% or 1,064 individuals in the labor force. Within the labor force, the 30 to 34 years age range has the highest percentage of unemployed individuals, with 10.0% or 106 of them being unemployed.

| Age Bracket | In Labor Force | Unemployed |
| 16 to 19 Years | 238 (16.9%) | 12 (5.0%) |
| 20 to 24 Years | 966 (66.6%) | 74 (7.7%) |
| 25 to 29 Years | 1,007 (78.7%) | 3 (0.3%) |
| 30 to 34 Years | 1,064 (90.3%) | 106 (10.0%) |
| 35 to 44 Years | 2,142 (81.3%) | 30 (1.4%) |
| 45 to 54 Years | 2,258 (72.8%) | 32 (1.4%) |
| 55 to 59 Years | 1,226 (67.9%) | 25 (2.0%) |
| 60 to 64 Years | 859 (49.0%) | 16 (1.9%) |
| 65 to 74 Years | 556 (17.4%) | 0 (0.0%) |
| 75 Years and over | 95 (4.3%) | 0 (0.0%) |
| Total | 10,405 (52.0%) | 291 (2.8%) |
Employment Status by Educational Attainment in Abbeville County
According to labor force statistics for Abbeville County, 72.8% of individuals (8,555) out of the total population between 25 and 64 years of age (11,752) are in the labor force, with 2.4% or 205 of them being unemployed. The group with the highest labor force participation rate are those with the educational attainment of bachelor's degree or higher, with 83.2% or 1,864 individuals in the labor force. Within the labor force, individuals with less than high school education have the highest percentage of unemployment, with 7.8% or 74 of them being unemployed.

| Educational Attainment | In Labor Force | Unemployed |
| Less than High School | 952 (66.0%) | 113 (7.8%) |
| High School Diploma | 3,005 (66.1%) | 55 (1.2%) |
| College / Associate Degree | 2,730 (77.5%) | 88 (2.5%) |
| Bachelor's Degree or higher | 1,864 (83.2%) | 38 (1.7%) |
| Total | 8,555 (72.8%) | 282 (2.4%) |
Employment Occupations by Sex in Abbeville County
Management, Business, Science and Arts Occupations
The most common Management, Business, Science and Arts occupations in Abbeville County are Management (1,163 | 11.5%), Community & Social Service (812 | 8.0%), Education Instruction & Library (655 | 6.5%), Health Diagnosing & Treating (651 | 6.4%), and Computers, Engineering & Science (421 | 4.2%).

Management, Business, Science and Arts Occupations by Sex
Within the Management, Business, Science and Arts occupations in Abbeville County, the most male-oriented occupations are Architecture & Engineering (90.3%), Computers, Engineering & Science (74.6%), and Education, Arts & Media (70.3%), while the most female-oriented occupations are Legal Services & Support (100.0%), Health Diagnosing & Treating (87.1%), and Health Technologists (86.2%).

| Occupation | Male | Female |
| Management | 661 (56.8%) | 502 (43.2%) |
| Business & Financial | 82 (41.0%) | 118 (59.0%) |
| Computers, Engineering & Science | 314 (74.6%) | 107 (25.4%) |
| Computers & Mathematics | 147 (68.1%) | 69 (31.9%) |
| Architecture & Engineering | 158 (90.3%) | 17 (9.7%) |
| Life, Physical & Social Science | 9 (30.0%) | 21 (70.0%) |
| Community & Social Service | 205 (25.3%) | 607 (74.8%) |
| Education, Arts & Media | 71 (70.3%) | 30 (29.7%) |
| Legal Services & Support | 0 (0.0%) | 25 (100.0%) |
| Education Instruction & Library | 114 (17.4%) | 541 (82.6%) |
| Arts, Media & Entertainment | 20 (64.5%) | 11 (35.5%) |
| Health Diagnosing & Treating | 84 (12.9%) | 567 (87.1%) |
| Health Technologists | 44 (13.8%) | 274 (86.2%) |
| Total (Category) | 1,346 (41.4%) | 1,901 (58.6%) |
| Total (Overall) | 5,386 (53.2%) | 4,728 (46.8%) |
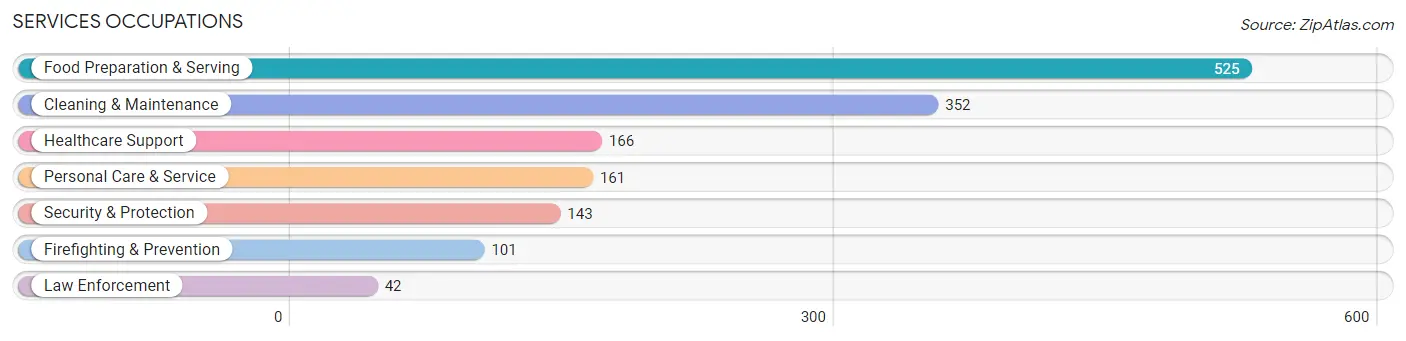
Services Occupations
The most common Services occupations in Abbeville County are Food Preparation & Serving (525 | 5.2%), Cleaning & Maintenance (352 | 3.5%), Healthcare Support (166 | 1.6%), Personal Care & Service (161 | 1.6%), and Security & Protection (143 | 1.4%).
Services Occupations by Sex
Within the Services occupations in Abbeville County, the most male-oriented occupations are Firefighting & Prevention (100.0%), Security & Protection (94.4%), and Law Enforcement (80.9%), while the most female-oriented occupations are Healthcare Support (94.0%), Personal Care & Service (62.7%), and Food Preparation & Serving (52.2%).
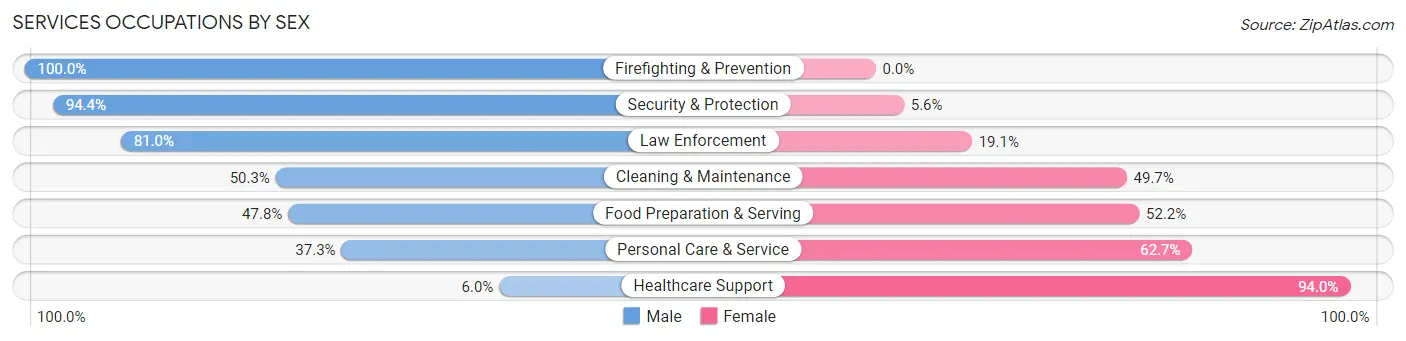
| Occupation | Male | Female |
| Healthcare Support | 10 (6.0%) | 156 (94.0%) |
| Security & Protection | 135 (94.4%) | 8 (5.6%) |
| Firefighting & Prevention | 101 (100.0%) | 0 (0.0%) |
| Law Enforcement | 34 (80.9%) | 8 (19.1%) |
| Food Preparation & Serving | 251 (47.8%) | 274 (52.2%) |
| Cleaning & Maintenance | 177 (50.3%) | 175 (49.7%) |
| Personal Care & Service | 60 (37.3%) | 101 (62.7%) |
| Total (Category) | 633 (47.0%) | 714 (53.0%) |
| Total (Overall) | 5,386 (53.2%) | 4,728 (46.8%) |
Sales and Office Occupations
The most common Sales and Office occupations in Abbeville County are Sales & Related (992 | 9.8%), and Office & Administration (897 | 8.9%).

Sales and Office Occupations by Sex

| Occupation | Male | Female |
| Sales & Related | 478 (48.2%) | 514 (51.8%) |
| Office & Administration | 94 (10.5%) | 803 (89.5%) |
| Total (Category) | 572 (30.3%) | 1,317 (69.7%) |
| Total (Overall) | 5,386 (53.2%) | 4,728 (46.8%) |
Natural Resources, Construction and Maintenance Occupations
The most common Natural Resources, Construction and Maintenance occupations in Abbeville County are Construction & Extraction (610 | 6.0%), Installation, Maintenance & Repair (460 | 4.5%), and Farming, Fishing & Forestry (15 | 0.2%).

Natural Resources, Construction and Maintenance Occupations by Sex
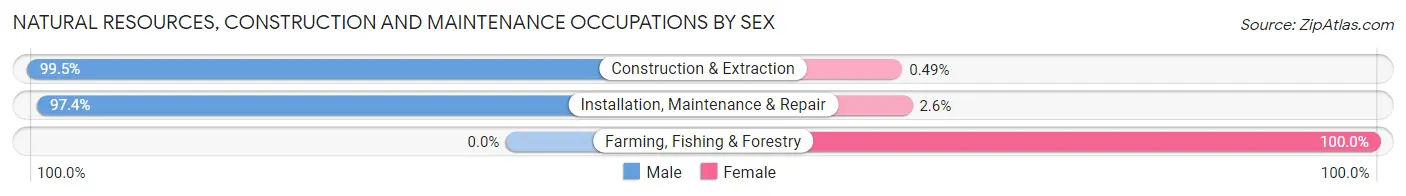
| Occupation | Male | Female |
| Farming, Fishing & Forestry | 0 (0.0%) | 15 (100.0%) |
| Construction & Extraction | 607 (99.5%) | 3 (0.5%) |
| Installation, Maintenance & Repair | 448 (97.4%) | 12 (2.6%) |
| Total (Category) | 1,055 (97.2%) | 30 (2.8%) |
| Total (Overall) | 5,386 (53.2%) | 4,728 (46.8%) |
Production, Transportation and Moving Occupations
The most common Production, Transportation and Moving occupations in Abbeville County are Production (1,698 | 16.8%), Material Moving (496 | 4.9%), and Transportation (352 | 3.5%).

Production, Transportation and Moving Occupations by Sex

| Occupation | Male | Female |
| Production | 1,118 (65.8%) | 580 (34.2%) |
| Transportation | 234 (66.5%) | 118 (33.5%) |
| Material Moving | 428 (86.3%) | 68 (13.7%) |
| Total (Category) | 1,780 (69.9%) | 766 (30.1%) |
| Total (Overall) | 5,386 (53.2%) | 4,728 (46.8%) |
Employment Industries by Sex in Abbeville County
Employment Industries in Abbeville County
The major employment industries in Abbeville County include Manufacturing (2,486 | 24.6%), Health Care & Social Assistance (1,349 | 13.3%), Retail Trade (1,175 | 11.6%), Educational Services (1,161 | 11.5%), and Construction (842 | 8.3%).

Employment Industries by Sex in Abbeville County
The Abbeville County industries that see more men than women are Construction (97.9%), Agriculture, Fishing & Hunting (85.9%), and Real Estate, Rental & Leasing (82.4%), whereas the industries that tend to have a higher number of women are Enterprise Management (100.0%), Health Care & Social Assistance (81.1%), and Educational Services (72.0%).
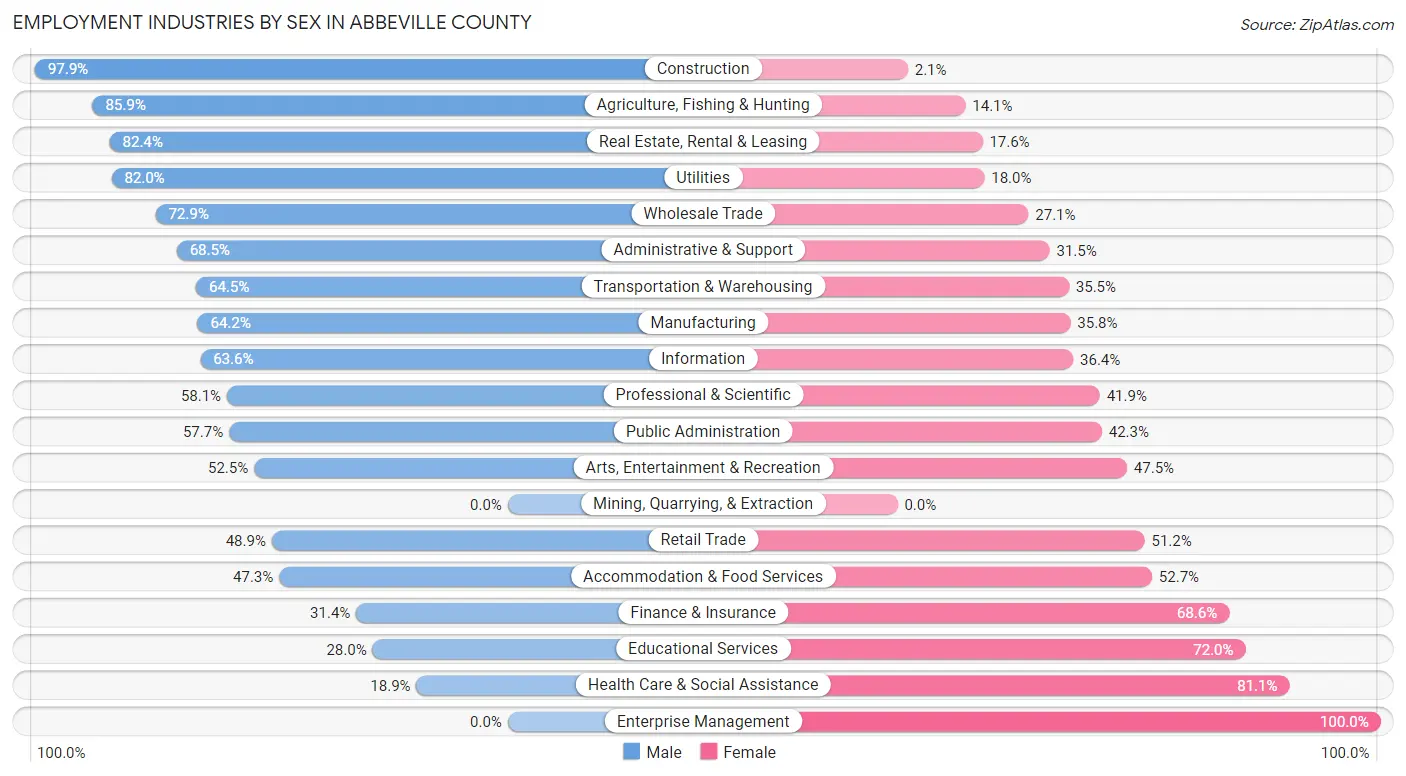
| Industry | Male | Female |
| Agriculture, Fishing & Hunting | 55 (85.9%) | 9 (14.1%) |
| Mining, Quarrying, & Extraction | 0 (0.0%) | 0 (0.0%) |
| Construction | 824 (97.9%) | 18 (2.1%) |
| Manufacturing | 1,596 (64.2%) | 890 (35.8%) |
| Wholesale Trade | 78 (72.9%) | 29 (27.1%) |
| Retail Trade | 574 (48.8%) | 601 (51.1%) |
| Transportation & Warehousing | 269 (64.5%) | 148 (35.5%) |
| Utilities | 73 (82.0%) | 16 (18.0%) |
| Information | 105 (63.6%) | 60 (36.4%) |
| Finance & Insurance | 48 (31.4%) | 105 (68.6%) |
| Real Estate, Rental & Leasing | 103 (82.4%) | 22 (17.6%) |
| Professional & Scientific | 186 (58.1%) | 134 (41.9%) |
| Enterprise Management | 0 (0.0%) | 3 (100.0%) |
| Administrative & Support | 161 (68.5%) | 74 (31.5%) |
| Educational Services | 325 (28.0%) | 836 (72.0%) |
| Health Care & Social Assistance | 255 (18.9%) | 1,094 (81.1%) |
| Arts, Entertainment & Recreation | 63 (52.5%) | 57 (47.5%) |
| Accommodation & Food Services | 265 (47.3%) | 295 (52.7%) |
| Public Administration | 165 (57.7%) | 121 (42.3%) |
| Total | 5,386 (53.2%) | 4,728 (46.8%) |
Education in Abbeville County
School Enrollment in Abbeville County
The most common levels of schooling among the 5,452 students in Abbeville County are high school (1,438 | 26.4%), college / undergraduate (1,207 | 22.1%), and middle school (1,020 | 18.7%).

| School Level | # Students | % Students |
| Nursery / Preschool | 194 | 3.6% |
| Kindergarten | 470 | 8.6% |
| Elementary School | 935 | 17.2% |
| Middle School | 1,020 | 18.7% |
| High School | 1,438 | 26.4% |
| College / Undergraduate | 1,207 | 22.1% |
| Graduate / Professional | 188 | 3.5% |
| Total | 5,452 | 100.0% |
School Enrollment by Age by Funding Source in Abbeville County
Out of a total of 5,452 students who are enrolled in schools in Abbeville County, 1,249 (22.9%) attend a private institution, while the remaining 4,203 (77.1%) are enrolled in public schools. The age group of 20 to 24 year olds has the highest likelihood of being enrolled in private schools, with 338 (52.7% in the age bracket) enrolled. Conversely, the age group of 35 years and over has the lowest likelihood of being enrolled in a private school, with 178 (87.7% in the age bracket) attending a public institution.

| Age Bracket | Public School | Private School |
| 3 to 4 Year Olds | 134 (71.7%) | 53 (28.3%) |
| 5 to 9 Year Old | 979 (81.6%) | 221 (18.4%) |
| 10 to 14 Year Olds | 1,191 (84.5%) | 218 (15.5%) |
| 15 to 17 Year Olds | 669 (85.7%) | 112 (14.3%) |
| 18 to 19 Year Olds | 649 (72.9%) | 241 (27.1%) |
| 20 to 24 Year Olds | 303 (47.3%) | 338 (52.7%) |
| 25 to 34 Year Olds | 102 (72.3%) | 39 (27.7%) |
| 35 Years and over | 178 (87.7%) | 25 (12.3%) |
| Total | 4,203 (77.1%) | 1,249 (22.9%) |
Educational Attainment by Field of Study in Abbeville County
Business (823 | 23.3%), education (671 | 19.0%), science & technology (343 | 9.7%), liberal arts & history (262 | 7.4%), and psychology (242 | 6.9%) are the most common fields of study among 3,529 individuals in Abbeville County who have obtained a bachelor's degree or higher.

| Field of Study | # Graduates | % Graduates |
| Computers & Mathematics | 99 | 2.8% |
| Bio, Nature & Agricultural | 157 | 4.4% |
| Physical & Health Sciences | 129 | 3.7% |
| Psychology | 242 | 6.9% |
| Social Sciences | 214 | 6.1% |
| Engineering | 103 | 2.9% |
| Multidisciplinary Studies | 27 | 0.8% |
| Science & Technology | 343 | 9.7% |
| Business | 823 | 23.3% |
| Education | 671 | 19.0% |
| Literature & Languages | 194 | 5.5% |
| Liberal Arts & History | 262 | 7.4% |
| Visual & Performing Arts | 39 | 1.1% |
| Communications | 35 | 1.0% |
| Arts & Humanities | 191 | 5.4% |
| Total | 3,529 | 100.0% |
Transportation & Commute in Abbeville County
Vehicle Availability by Sex in Abbeville County
The most prevalent vehicle ownership categories in Abbeville County are males with 2 vehicles (1,902, accounting for 36.6%) and females with 2 vehicles (1,303, making up 42.3%).
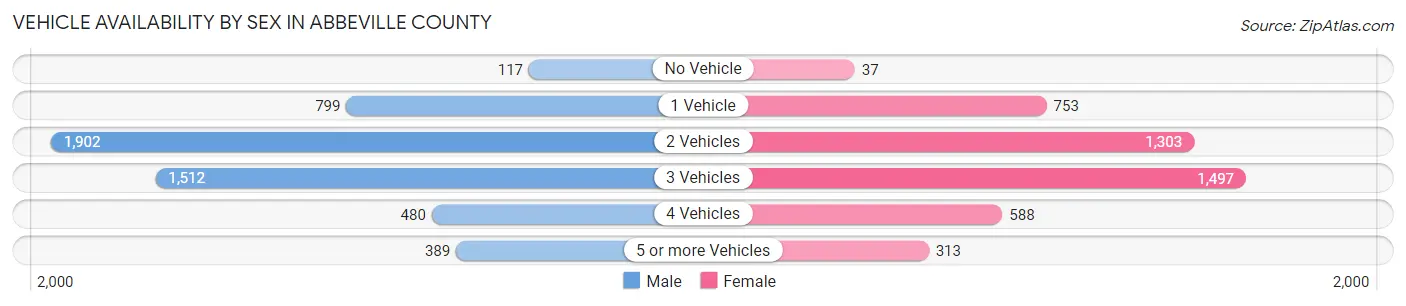
| Vehicles Available | Male | Female |
| No Vehicle | 117 (2.2%) | 37 (0.8%) |
| 1 Vehicle | 799 (15.4%) | 753 (16.8%) |
| 2 Vehicles | 1,902 (36.6%) | 1,303 (29.0%) |
| 3 Vehicles | 1,512 (29.1%) | 1,497 (33.3%) |
| 4 Vehicles | 480 (9.2%) | 588 (13.1%) |
| 5 or more Vehicles | 389 (7.5%) | 313 (7.0%) |
| Total | 5,199 (100.0%) | 4,491 (100.0%) |
Commute Time in Abbeville County
The most frequently occuring commute durations in Abbeville County are 15 to 19 minutes (1,456 commuters, 15.3%), 45 to 59 minutes (1,366 commuters, 14.4%), and 10 to 14 minutes (1,218 commuters, 12.8%).

| Commute Time | # Commuters | % Commuters |
| Less than 5 Minutes | 227 | 2.4% |
| 5 to 9 Minutes | 738 | 7.8% |
| 10 to 14 Minutes | 1,218 | 12.8% |
| 15 to 19 Minutes | 1,456 | 15.3% |
| 20 to 24 Minutes | 808 | 8.5% |
| 25 to 29 Minutes | 808 | 8.5% |
| 30 to 34 Minutes | 1,168 | 12.3% |
| 35 to 39 Minutes | 431 | 4.5% |
| 40 to 44 Minutes | 500 | 5.3% |
| 45 to 59 Minutes | 1,366 | 14.4% |
| 60 to 89 Minutes | 610 | 6.4% |
| 90 or more Minutes | 157 | 1.7% |
Commute Time by Sex in Abbeville County
The most common commute times in Abbeville County are 15 to 19 minutes (1,008 commuters, 19.6%) for males and 30 to 34 minutes (748 commuters, 17.3%) for females.

| Commute Time | Male | Female |
| Less than 5 Minutes | 134 (2.6%) | 93 (2.1%) |
| 5 to 9 Minutes | 293 (5.7%) | 445 (10.3%) |
| 10 to 14 Minutes | 647 (12.6%) | 571 (13.2%) |
| 15 to 19 Minutes | 1,008 (19.6%) | 448 (10.3%) |
| 20 to 24 Minutes | 395 (7.7%) | 413 (9.5%) |
| 25 to 29 Minutes | 341 (6.6%) | 467 (10.8%) |
| 30 to 34 Minutes | 420 (8.1%) | 748 (17.3%) |
| 35 to 39 Minutes | 185 (3.6%) | 246 (5.7%) |
| 40 to 44 Minutes | 345 (6.7%) | 155 (3.6%) |
| 45 to 59 Minutes | 869 (16.9%) | 497 (11.5%) |
| 60 to 89 Minutes | 390 (7.6%) | 220 (5.1%) |
| 90 or more Minutes | 130 (2.5%) | 27 (0.6%) |
Time of Departure to Work by Sex in Abbeville County
The most frequent times of departure to work in Abbeville County are 7:00 AM to 7:29 AM (1,155, 22.4%) for males and 7:00 AM to 7:29 AM (1,008, 23.3%) for females.

| Time of Departure | Male | Female |
| 12:00 AM to 4:59 AM | 169 (3.3%) | 162 (3.7%) |
| 5:00 AM to 5:29 AM | 297 (5.8%) | 118 (2.7%) |
| 5:30 AM to 5:59 AM | 564 (10.9%) | 292 (6.7%) |
| 6:00 AM to 6:29 AM | 489 (9.5%) | 178 (4.1%) |
| 6:30 AM to 6:59 AM | 626 (12.1%) | 315 (7.3%) |
| 7:00 AM to 7:29 AM | 1,155 (22.4%) | 1,008 (23.3%) |
| 7:30 AM to 7:59 AM | 707 (13.7%) | 803 (18.5%) |
| 8:00 AM to 8:29 AM | 218 (4.2%) | 353 (8.2%) |
| 8:30 AM to 8:59 AM | 125 (2.4%) | 93 (2.1%) |
| 9:00 AM to 9:59 AM | 121 (2.4%) | 235 (5.4%) |
| 10:00 AM to 10:59 AM | 23 (0.4%) | 20 (0.5%) |
| 11:00 AM to 11:59 AM | 54 (1.1%) | 12 (0.3%) |
| 12:00 PM to 3:59 PM | 419 (8.1%) | 278 (6.4%) |
| 4:00 PM to 11:59 PM | 190 (3.7%) | 463 (10.7%) |
| Total | 5,157 (100.0%) | 4,330 (100.0%) |
Housing Occupancy in Abbeville County
Occupancy by Ownership in Abbeville County
Of the total 9,620 dwellings in Abbeville County, owner-occupied units account for 7,313 (76.0%), while renter-occupied units make up 2,307 (24.0%).
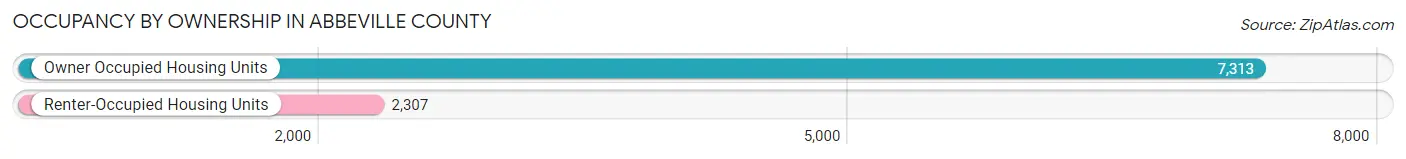
| Occupancy | # Housing Units | % Housing Units |
| Owner Occupied Housing Units | 7,313 | 76.0% |
| Renter-Occupied Housing Units | 2,307 | 24.0% |
| Total Occupied Housing Units | 9,620 | 100.0% |
Occupancy by Household Size in Abbeville County

| Household Size | # Housing Units | % Housing Units |
| 1-Person Household | 2,898 | 30.1% |
| 2-Person Household | 3,942 | 41.0% |
| 3-Person Household | 1,239 | 12.9% |
| 4+ Person Household | 1,541 | 16.0% |
| Total Housing Units | 9,620 | 100.0% |
Occupancy by Ownership by Household Size in Abbeville County

| Household Size | Owner-occupied | Renter-occupied |
| 1-Person Household | 1,827 (63.0%) | 1,071 (37.0%) |
| 2-Person Household | 3,286 (83.4%) | 656 (16.6%) |
| 3-Person Household | 955 (77.1%) | 284 (22.9%) |
| 4+ Person Household | 1,245 (80.8%) | 296 (19.2%) |
| Total Housing Units | 7,313 (76.0%) | 2,307 (24.0%) |
Occupancy by Educational Attainment in Abbeville County

| Household Size | Owner-occupied | Renter-occupied |
| Less than High School | 811 (59.6%) | 550 (40.4%) |
| High School Diploma | 2,591 (75.5%) | 841 (24.5%) |
| College/Associate Degree | 2,320 (79.4%) | 600 (20.5%) |
| Bachelor's Degree or higher | 1,591 (83.4%) | 316 (16.6%) |
Occupancy by Age of Householder in Abbeville County

| Age Bracket | # Households | % Households |
| Under 35 Years | 1,307 | 13.6% |
| 35 to 44 Years | 1,294 | 13.5% |
| 45 to 54 Years | 1,626 | 16.9% |
| 55 to 64 Years | 1,924 | 20.0% |
| 65 to 74 Years | 2,041 | 21.2% |
| 75 to 84 Years | 1,018 | 10.6% |
| 85 Years and Over | 410 | 4.3% |
| Total | 9,620 | 100.0% |
Housing Finances in Abbeville County
Median Income by Occupancy in Abbeville County

| Occupancy Type | # Households | Median Income |
| Owner-Occupied | 7,313 (76.0%) | $61,418 |
| Renter-Occupied | 2,307 (24.0%) | $30,659 |
| Average | 9,620 (100.0%) | $49,759 |
Occupancy by Householder Income Bracket in Abbeville County

| Income Bracket | Owner-occupied | Renter-occupied |
| Less than $5,000 | 239 (3.3%) | 197 (8.5%) |
| $5,000 to $9,999 | 82 (1.1%) | 153 (6.6%) |
| $10,000 to $14,999 | 229 (3.1%) | 386 (16.7%) |
| $15,000 to $19,999 | 399 (5.5%) | 71 (3.1%) |
| $20,000 to $24,999 | 312 (4.3%) | 141 (6.1%) |
| $25,000 to $34,999 | 810 (11.1%) | 297 (12.9%) |
| $35,000 to $49,999 | 1,081 (14.8%) | 431 (18.7%) |
| $50,000 to $74,999 | 1,177 (16.1%) | 342 (14.8%) |
| $75,000 to $99,999 | 967 (13.2%) | 43 (1.9%) |
| $100,000 to $149,999 | 1,037 (14.2%) | 176 (7.6%) |
| $150,000 or more | 980 (13.4%) | 70 (3.0%) |
| Total | 7,313 (100.0%) | 2,307 (100.0%) |
Monthly Housing Cost Tiers in Abbeville County

| Monthly Cost | Owner-occupied | Renter-occupied |
| Less than $300 | 1,108 (15.1%) | 126 (5.5%) |
| $300 to $499 | 1,727 (23.6%) | 378 (16.4%) |
| $500 to $799 | 1,565 (21.4%) | 456 (19.8%) |
| $800 to $999 | 779 (10.6%) | 441 (19.1%) |
| $1,000 to $1,499 | 1,328 (18.2%) | 407 (17.6%) |
| $1,500 to $1,999 | 447 (6.1%) | 29 (1.3%) |
| $2,000 to $2,499 | 155 (2.1%) | 16 (0.7%) |
| $2,500 to $2,999 | 118 (1.6%) | 0 (0.0%) |
| $3,000 or more | 86 (1.2%) | 8 (0.4%) |
| Total | 7,313 (100.0%) | 2,307 (100.0%) |
Physical Housing Characteristics in Abbeville County
Housing Structures in Abbeville County

| Structure Type | # Housing Units | % Housing Units |
| Single Unit, Detached | 6,293 | 65.4% |
| Single Unit, Attached | 36 | 0.4% |
| 2 Unit Apartments | 248 | 2.6% |
| 3 or 4 Unit Apartments | 438 | 4.5% |
| 5 to 9 Unit Apartments | 288 | 3.0% |
| 10 or more Apartments | 51 | 0.5% |
| Mobile Home / Other | 2,266 | 23.6% |
| Total | 9,620 | 100.0% |
Housing Structures by Occupancy in Abbeville County

| Structure Type | Owner-occupied | Renter-occupied |
| Single Unit, Detached | 5,358 (85.1%) | 935 (14.9%) |
| Single Unit, Attached | 36 (100.0%) | 0 (0.0%) |
| 2 Unit Apartments | 0 (0.0%) | 248 (100.0%) |
| 3 or 4 Unit Apartments | 22 (5.0%) | 416 (95.0%) |
| 5 to 9 Unit Apartments | 0 (0.0%) | 288 (100.0%) |
| 10 or more Apartments | 3 (5.9%) | 48 (94.1%) |
| Mobile Home / Other | 1,894 (83.6%) | 372 (16.4%) |
| Total | 7,313 (76.0%) | 2,307 (24.0%) |
Housing Structures by Number of Rooms in Abbeville County

| Number of Rooms | Owner-occupied | Renter-occupied |
| 1 Room | 66 (0.9%) | 48 (2.1%) |
| 2 or 3 Rooms | 208 (2.8%) | 463 (20.1%) |
| 4 or 5 Rooms | 2,684 (36.7%) | 1,158 (50.2%) |
| 6 or 7 Rooms | 2,697 (36.9%) | 526 (22.8%) |
| 8 or more Rooms | 1,658 (22.7%) | 112 (4.9%) |
| Total | 7,313 (100.0%) | 2,307 (100.0%) |
Housing Structure by Heating Type in Abbeville County

| Heating Type | Owner-occupied | Renter-occupied |
| Utility Gas | 1,577 (21.6%) | 691 (29.9%) |
| Bottled, Tank, or LP Gas | 396 (5.4%) | 117 (5.1%) |
| Electricity | 5,023 (68.7%) | 1,454 (63.0%) |
| Fuel Oil or Kerosene | 48 (0.7%) | 0 (0.0%) |
| Coal or Coke | 0 (0.0%) | 0 (0.0%) |
| All other Fuels | 254 (3.5%) | 39 (1.7%) |
| No Fuel Used | 15 (0.2%) | 6 (0.3%) |
| Total | 7,313 (100.0%) | 2,307 (100.0%) |
Household Vehicle Usage in Abbeville County

| Vehicles per Household | Owner-occupied | Renter-occupied |
| No Vehicle | 236 (3.2%) | 393 (17.0%) |
| 1 Vehicle | 1,561 (21.3%) | 1,074 (46.6%) |
| 2 Vehicles | 2,710 (37.1%) | 689 (29.9%) |
| 3 or more Vehicles | 2,806 (38.4%) | 151 (6.6%) |
| Total | 7,313 (100.0%) | 2,307 (100.0%) |
Real Estate & Mortgages in Abbeville County
Real Estate and Mortgage Overview in Abbeville County
| Characteristic | Without Mortgage | With Mortgage |
| Housing Units | 4,229 | 3,084 |
| Median Property Value | $106,100 | $134,600 |
| Median Household Income | $51,151 | $490 |
| Monthly Housing Costs | $407 | $79 |
| Real Estate Taxes | $550 | $32 |
Property Value by Mortgage Status in Abbeville County
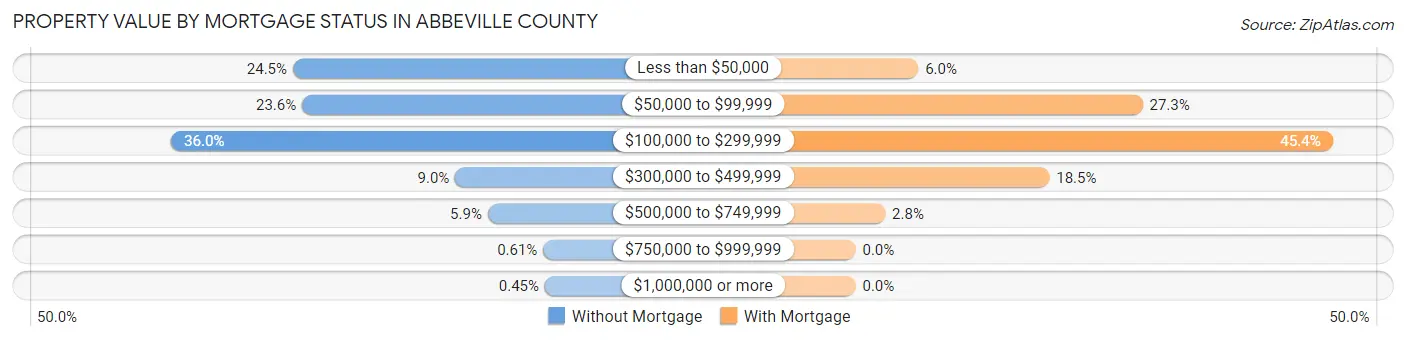
| Property Value | Without Mortgage | With Mortgage |
| Less than $50,000 | 1,034 (24.4%) | 184 (6.0%) |
| $50,000 to $99,999 | 997 (23.6%) | 843 (27.3%) |
| $100,000 to $299,999 | 1,524 (36.0%) | 1,401 (45.4%) |
| $300,000 to $499,999 | 380 (9.0%) | 569 (18.4%) |
| $500,000 to $749,999 | 249 (5.9%) | 87 (2.8%) |
| $750,000 to $999,999 | 26 (0.6%) | 0 (0.0%) |
| $1,000,000 or more | 19 (0.4%) | 0 (0.0%) |
| Total | 4,229 (100.0%) | 3,084 (100.0%) |
Household Income by Mortgage Status in Abbeville County

| Household Income | Without Mortgage | With Mortgage |
| Less than $10,000 | 256 (6.0%) | 38 (1.2%) |
| $10,000 to $24,999 | 582 (13.8%) | 65 (2.1%) |
| $25,000 to $34,999 | 563 (13.3%) | 358 (11.6%) |
| $35,000 to $49,999 | 673 (15.9%) | 247 (8.0%) |
| $50,000 to $74,999 | 741 (17.5%) | 408 (13.2%) |
| $75,000 to $99,999 | 480 (11.4%) | 436 (14.1%) |
| $100,000 to $149,999 | 444 (10.5%) | 487 (15.8%) |
| $150,000 or more | 490 (11.6%) | 593 (19.2%) |
| Total | 4,229 (100.0%) | 3,084 (100.0%) |
Property Value to Household Income Ratio in Abbeville County

| Value-to-Income Ratio | Without Mortgage | With Mortgage |
| Less than 2.0x | 1,982 (46.9%) | 76,029 (2,465.3%) |
| 2.0x to 2.9x | 658 (15.6%) | 1,260 (40.9%) |
| 3.0x to 3.9x | 442 (10.4%) | 772 (25.0%) |
| 4.0x or more | 1,036 (24.5%) | 340 (11.0%) |
| Total | 4,229 (100.0%) | 3,084 (100.0%) |
Real Estate Taxes by Mortgage Status in Abbeville County

| Property Taxes | Without Mortgage | With Mortgage |
| Less than $800 | 2,624 (62.1%) | 14 (0.4%) |
| $800 to $1,499 | 932 (22.0%) | 1,514 (49.1%) |
| $800 to $1,499 | 527 (12.5%) | 1,190 (38.6%) |
| Total | 4,229 (100.0%) | 3,084 (100.0%) |
Health & Disability in Abbeville County
Health Insurance Coverage by Age in Abbeville County

| Age Bracket | With Coverage | Without Coverage |
| Under 6 Years | 1,202 (88.8%) | 152 (11.2%) |
| 6 to 18 Years | 3,811 (94.2%) | 234 (5.8%) |
| 19 to 25 Years | 1,889 (87.5%) | 271 (12.6%) |
| 26 to 34 Years | 1,564 (74.6%) | 534 (25.5%) |
| 35 to 44 Years | 2,230 (85.3%) | 383 (14.7%) |
| 45 to 54 Years | 2,513 (81.4%) | 573 (18.6%) |
| 55 to 64 Years | 3,150 (88.8%) | 399 (11.2%) |
| 65 to 74 Years | 3,160 (100.0%) | 0 (0.0%) |
| 75 Years and older | 2,121 (100.0%) | 0 (0.0%) |
| Total | 21,640 (89.5%) | 2,546 (10.5%) |
Health Insurance Coverage by Citizenship Status in Abbeville County

| Citizenship Status | With Coverage | Without Coverage |
| Native Born | 1,202 (88.8%) | 152 (11.2%) |
| Foreign Born, Citizen | 3,811 (94.2%) | 234 (5.8%) |
| Foreign Born, not a Citizen | 1,889 (87.5%) | 271 (12.6%) |
Health Insurance Coverage by Household Income in Abbeville County

| Household Income | With Coverage | Without Coverage |
| Under $25,000 | 3,383 (89.1%) | 415 (10.9%) |
| $25,000 to $49,999 | 4,928 (89.0%) | 610 (11.0%) |
| $50,000 to $74,999 | 3,088 (85.1%) | 541 (14.9%) |
| $75,000 to $99,999 | 2,853 (95.6%) | 132 (4.4%) |
| $100,000 and over | 6,640 (89.1%) | 809 (10.9%) |
Public vs Private Health Insurance Coverage by Age in Abbeville County
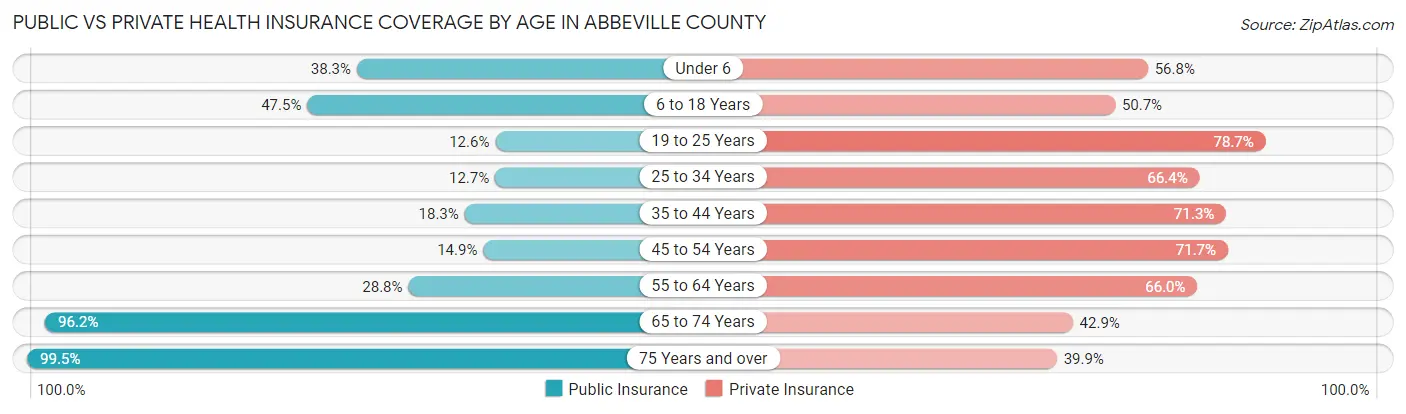
| Age Bracket | Public Insurance | Private Insurance |
| Under 6 | 519 (38.3%) | 769 (56.8%) |
| 6 to 18 Years | 1,923 (47.5%) | 2,051 (50.7%) |
| 19 to 25 Years | 273 (12.6%) | 1,699 (78.7%) |
| 25 to 34 Years | 266 (12.7%) | 1,393 (66.4%) |
| 35 to 44 Years | 479 (18.3%) | 1,864 (71.3%) |
| 45 to 54 Years | 459 (14.9%) | 2,211 (71.7%) |
| 55 to 64 Years | 1,021 (28.8%) | 2,342 (66.0%) |
| 65 to 74 Years | 3,040 (96.2%) | 1,354 (42.8%) |
| 75 Years and over | 2,111 (99.5%) | 846 (39.9%) |
| Total | 10,091 (41.7%) | 14,529 (60.1%) |
Disability Status by Sex by Age in Abbeville County

| Age Bracket | Male | Female |
| Under 5 Years | 0 (0.0%) | 0 (0.0%) |
| 5 to 17 Years | 203 (11.0%) | 55 (3.0%) |
| 18 to 34 Years | 100 (4.2%) | 89 (3.6%) |
| 35 to 64 Years | 522 (11.5%) | 555 (11.8%) |
| 65 to 74 Years | 478 (31.6%) | 320 (19.4%) |
| 75 Years and over | 326 (34.6%) | 357 (30.3%) |
Disability Class by Sex by Age in Abbeville County
Disability Class: Hearing Difficulty

| Age Bracket | Male | Female |
| Under 5 Years | 0 (0.0%) | 0 (0.0%) |
| 5 to 17 Years | 0 (0.0%) | 0 (0.0%) |
| 18 to 34 Years | 25 (1.1%) | 1 (0.0%) |
| 35 to 64 Years | 191 (4.2%) | 42 (0.9%) |
| 65 to 74 Years | 216 (14.3%) | 37 (2.2%) |
| 75 Years and over | 159 (16.9%) | 161 (13.7%) |
Disability Class: Vision Difficulty

| Age Bracket | Male | Female |
| Under 5 Years | 0 (0.0%) | 0 (0.0%) |
| 5 to 17 Years | 8 (0.4%) | 40 (2.2%) |
| 18 to 34 Years | 9 (0.4%) | 3 (0.1%) |
| 35 to 64 Years | 117 (2.6%) | 76 (1.6%) |
| 65 to 74 Years | 21 (1.4%) | 98 (5.9%) |
| 75 Years and over | 71 (7.5%) | 74 (6.3%) |
Disability Class: Cognitive Difficulty

| Age Bracket | Male | Female |
| 5 to 17 Years | 174 (9.4%) | 4 (0.2%) |
| 18 to 34 Years | 66 (2.8%) | 41 (1.7%) |
| 35 to 64 Years | 268 (5.9%) | 227 (4.8%) |
| 65 to 74 Years | 57 (3.8%) | 117 (7.1%) |
| 75 Years and over | 63 (6.7%) | 125 (10.6%) |
Disability Class: Ambulatory Difficulty

| Age Bracket | Male | Female |
| 5 to 17 Years | 21 (1.1%) | 11 (0.6%) |
| 18 to 34 Years | 0 (0.0%) | 47 (1.9%) |
| 35 to 64 Years | 220 (4.9%) | 373 (7.9%) |
| 65 to 74 Years | 182 (12.0%) | 170 (10.3%) |
| 75 Years and over | 194 (20.6%) | 344 (29.2%) |
Disability Class: Self-Care Difficulty
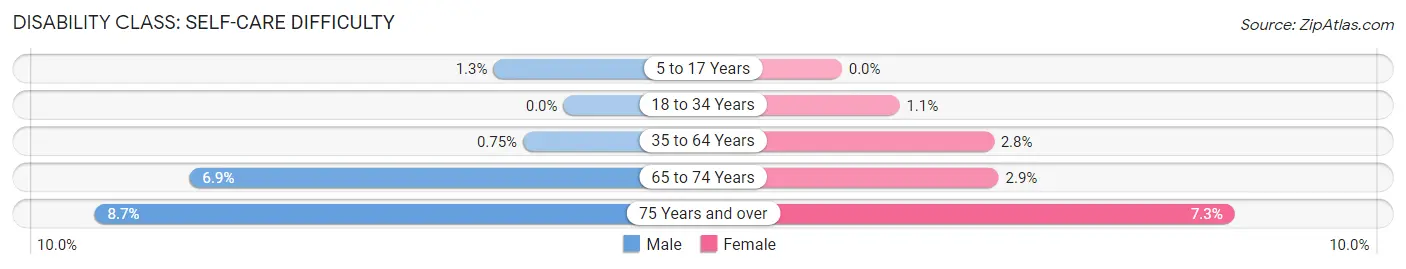
| Age Bracket | Male | Female |
| 5 to 17 Years | 24 (1.3%) | 0 (0.0%) |
| 18 to 34 Years | 0 (0.0%) | 26 (1.1%) |
| 35 to 64 Years | 34 (0.7%) | 133 (2.8%) |
| 65 to 74 Years | 105 (6.9%) | 48 (2.9%) |
| 75 Years and over | 82 (8.7%) | 86 (7.3%) |
Technology Access in Abbeville County
Computing Device Access in Abbeville County

| Device Type | # Households | % Households |
| Desktop or Laptop | 6,374 | 66.3% |
| Smartphone | 7,510 | 78.1% |
| Tablet | 4,962 | 51.6% |
| No Computing Device | 1,106 | 11.5% |
| Total | 9,620 | 100.0% |
Internet Access in Abbeville County

| Internet Type | # Households | % Households |
| Dial-Up Internet | 11 | 0.1% |
| Broadband Home | 5,969 | 62.1% |
| Cellular Data Only | 1,227 | 12.8% |
| Satellite Internet | 402 | 4.2% |
| No Internet | 2,286 | 23.8% |
| Total | 9,620 | 100.0% |
Abbeville County Summary
Abbeville County, South Carolina is located in the Upstate region of the state and is part of the Greenwood, South Carolina Metropolitan Statistical Area. The county was established in 1785 and is named after the French town of Abbeville. As of the 2010 census, the population of Abbeville County was 25,417.
Geography
Abbeville County is located in the Upstate region of South Carolina and is bordered by Greenwood County to the north, Laurens County to the east, McCormick County to the south, and Anderson County to the west. The county covers an area of 517 square miles and is located in the Piedmont region of the state. The terrain is mostly rolling hills and the county is home to several rivers, including the Savannah River, the Little River, and the Long Cane Creek. The highest point in the county is located at the summit of Mount Bethel, which has an elevation of 1,068 feet.
Climate
Abbeville County has a humid subtropical climate, with hot, humid summers and mild winters. The average annual temperature is around 63°F, with an average high of around 87°F in the summer and an average low of around 39°F in the winter. The average annual precipitation is around 46 inches, with the majority of the precipitation occurring in the summer months.
Demographics
As of the 2010 census, there were 25,417 people, 9,945 households, and 6,945 families living in Abbeville County. The population density was 49.3 people per square mile. The racial makeup of the county was 68.2% White, 28.7% African American, 0.3% Native American, 0.4% Asian, 0.1% Pacific Islander, 0.7% from other races, and 1.5% from two or more races. Hispanic or Latino of any race were 2.2% of the population.
The median income for a household in the county was $35,945 and the median income for a family was $44,945. The per capita income for the county was $18,945. About 17.2% of the population was below the poverty line.
Economy
The economy of Abbeville County is largely based on agriculture and manufacturing. The county is home to several large farms, which produce a variety of crops, including corn, soybeans, cotton, and tobacco. The county is also home to several manufacturing companies, including a paper mill, a textile mill, and a furniture factory.
The county is also home to several tourist attractions, including the Abbeville Opera House, the Abbeville County Museum, and the Abbeville County Historical Society. The county is also home to several parks, including the Abbeville County Park, the Abbeville County Nature Preserve, and the Abbeville County Wildlife Management Area.
Conclusion
Abbeville County, South Carolina is a rural county located in the Upstate region of the state. The county is home to a population of 25,417 and has a humid subtropical climate. The economy of the county is largely based on agriculture and manufacturing, and the county is home to several tourist attractions. Abbeville County is a great place to live and work, and offers a variety of activities and attractions for residents and visitors alike.
Common Questions
What is the Total Population of Abbeville County?
Total Population of Abbeville County is 24,368.
What is the Total Male Population of Abbeville County?
Total Male Population of Abbeville County is 11,865.
What is the Total Female Population of Abbeville County?
Total Female Population of Abbeville County is 12,503.
What is the Ratio of Males per 100 Females in Abbeville County?
There are 94.90 Males per 100 Females in Abbeville County.
What is the Ratio of Females per 100 Males in Abbeville County?
There are 105.38 Females per 100 Males in Abbeville County.
What is the Median Population Age in Abbeville County?
Median Population Age in Abbeville County is 44.5 Years.
What is the Average Family Size in Abbeville County
Average Family Size in Abbeville County is 3.0 People.
What is the Average Household Size in Abbeville County
Average Household Size in Abbeville County is 2.4 People.
What is Per Capita Income in Abbeville County?
Per Capita income in Abbeville County is $31,443.
What is the Median Family Income in Abbeville County?
Median Family Income in Abbeville County is $66,592.
What is the Median Household income in Abbeville County?
Median Household Income in Abbeville County is $49,759.
What is Income or Wage Gap in Abbeville County?
Income or Wage Gap in Abbeville County is 19.2%.
Women in Abbeville County earn 80.8 cents for every dollar earned by a man.
What is Family Income Deficit in Abbeville County?
Family Income Deficit in Abbeville County is $11,521.
Families that are below poverty line in Abbeville County earn $11,521 less on average than the poverty threshold level.
What is Inequality or Gini Index in Abbeville County?
Inequality or Gini Index in Abbeville County is 0.49.
How Large is the Labor Force in Abbeville County?
There are 10,405 People in the Labor Forcein in Abbeville County.
What is the Percentage of People in the Labor Force in Abbeville County?
52.0% of People are in the Labor Force in Abbeville County.
What is the Unemployment Rate in Abbeville County?
Unemployment Rate in Abbeville County is 2.8%.