Immigrants from Austria vs Laotian Male Poverty
COMPARE
Immigrants from Austria
Laotian
Male Poverty
Male Poverty Comparison
Immigrants from Austria
Laotians
10.0%
MALE POVERTY
98.5/ 100
METRIC RATING
54th/ 347
METRIC RANK
10.5%
MALE POVERTY
91.2/ 100
METRIC RATING
107th/ 347
METRIC RANK
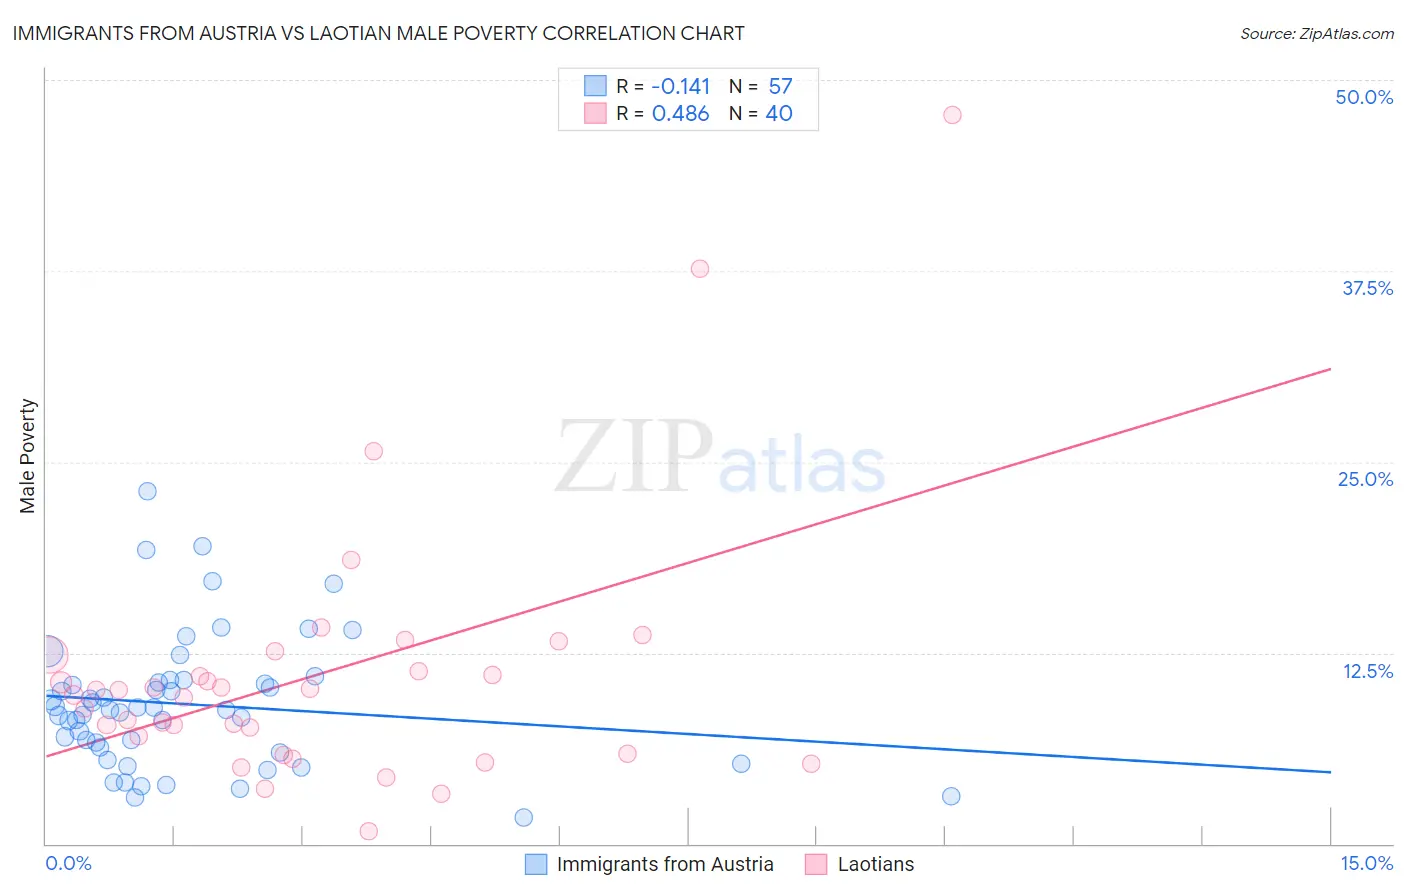
Immigrants from Austria vs Laotian Male Poverty Correlation Chart
The statistical analysis conducted on geographies consisting of 167,922,169 people shows a poor negative correlation between the proportion of Immigrants from Austria and poverty level among males in the United States with a correlation coefficient (R) of -0.141 and weighted average of 10.0%. Similarly, the statistical analysis conducted on geographies consisting of 224,721,860 people shows a moderate positive correlation between the proportion of Laotians and poverty level among males in the United States with a correlation coefficient (R) of 0.486 and weighted average of 10.5%, a difference of 5.0%.
Male Poverty Correlation Summary
| Measurement | Immigrants from Austria | Laotian |
| Minimum | 1.7% | 0.78% |
| Maximum | 23.1% | 47.7% |
| Range | 21.4% | 46.9% |
| Mean | 9.1% | 11.0% |
| Median | 8.7% | 9.9% |
| Interquartile 25% (IQ1) | 6.2% | 6.5% |
| Interquartile 75% (IQ3) | 10.6% | 11.8% |
| Interquartile Range (IQR) | 4.5% | 5.4% |
| Standard Deviation (Sample) | 4.4% | 8.6% |
| Standard Deviation (Population) | 4.3% | 8.5% |
Similar Demographics by Male Poverty
Demographics Similar to Immigrants from Austria by Male Poverty
In terms of male poverty, the demographic groups most similar to Immigrants from Austria are Immigrants from Czechoslovakia (10.0%, a difference of 0.28%), German (10.1%, a difference of 0.29%), Asian (10.0%, a difference of 0.35%), Immigrants from Croatia (10.0%, a difference of 0.44%), and Immigrants from Bulgaria (10.1%, a difference of 0.50%).
| Demographics | Rating | Rank | Male Poverty |
| Immigrants | Singapore | 98.8 /100 | #47 | Exceptional 10.0% |
| Immigrants | Japan | 98.8 /100 | #48 | Exceptional 10.0% |
| Slovenes | 98.8 /100 | #49 | Exceptional 10.0% |
| Immigrants | Philippines | 98.7 /100 | #50 | Exceptional 10.0% |
| Immigrants | Croatia | 98.7 /100 | #51 | Exceptional 10.0% |
| Asians | 98.7 /100 | #52 | Exceptional 10.0% |
| Immigrants | Czechoslovakia | 98.6 /100 | #53 | Exceptional 10.0% |
| Immigrants | Austria | 98.5 /100 | #54 | Exceptional 10.0% |
| Germans | 98.3 /100 | #55 | Exceptional 10.1% |
| Immigrants | Bulgaria | 98.2 /100 | #56 | Exceptional 10.1% |
| Estonians | 98.1 /100 | #57 | Exceptional 10.1% |
| Scandinavians | 98.0 /100 | #58 | Exceptional 10.1% |
| Immigrants | Europe | 97.9 /100 | #59 | Exceptional 10.1% |
| Ukrainians | 97.9 /100 | #60 | Exceptional 10.1% |
| Austrians | 97.8 /100 | #61 | Exceptional 10.1% |
Demographics Similar to Laotians by Male Poverty
In terms of male poverty, the demographic groups most similar to Laotians are Immigrants from Southern Europe (10.5%, a difference of 0.010%), Portuguese (10.6%, a difference of 0.070%), Canadian (10.5%, a difference of 0.12%), Welsh (10.5%, a difference of 0.13%), and Slavic (10.5%, a difference of 0.14%).
| Demographics | Rating | Rank | Male Poverty |
| Immigrants | Latvia | 92.8 /100 | #100 | Exceptional 10.5% |
| Immigrants | Zimbabwe | 92.0 /100 | #101 | Exceptional 10.5% |
| French Canadians | 91.9 /100 | #102 | Exceptional 10.5% |
| Slavs | 91.7 /100 | #103 | Exceptional 10.5% |
| Welsh | 91.6 /100 | #104 | Exceptional 10.5% |
| Canadians | 91.6 /100 | #105 | Exceptional 10.5% |
| Immigrants | Southern Europe | 91.3 /100 | #106 | Exceptional 10.5% |
| Laotians | 91.2 /100 | #107 | Exceptional 10.5% |
| Portuguese | 91.0 /100 | #108 | Exceptional 10.6% |
| Albanians | 90.6 /100 | #109 | Exceptional 10.6% |
| Argentineans | 90.1 /100 | #110 | Exceptional 10.6% |
| Immigrants | Argentina | 89.8 /100 | #111 | Excellent 10.6% |
| Immigrants | Turkey | 89.5 /100 | #112 | Excellent 10.6% |
| Palestinians | 89.1 /100 | #113 | Excellent 10.6% |
| Immigrants | Brazil | 89.0 /100 | #114 | Excellent 10.6% |