Zip Codes with the Highest Percentage of Population Employed in Food Preparation & Serving in Erie, PA
RELATED REPORTS & OPTIONS
Food Preparation & Serving
Erie
Compare Zip Codes
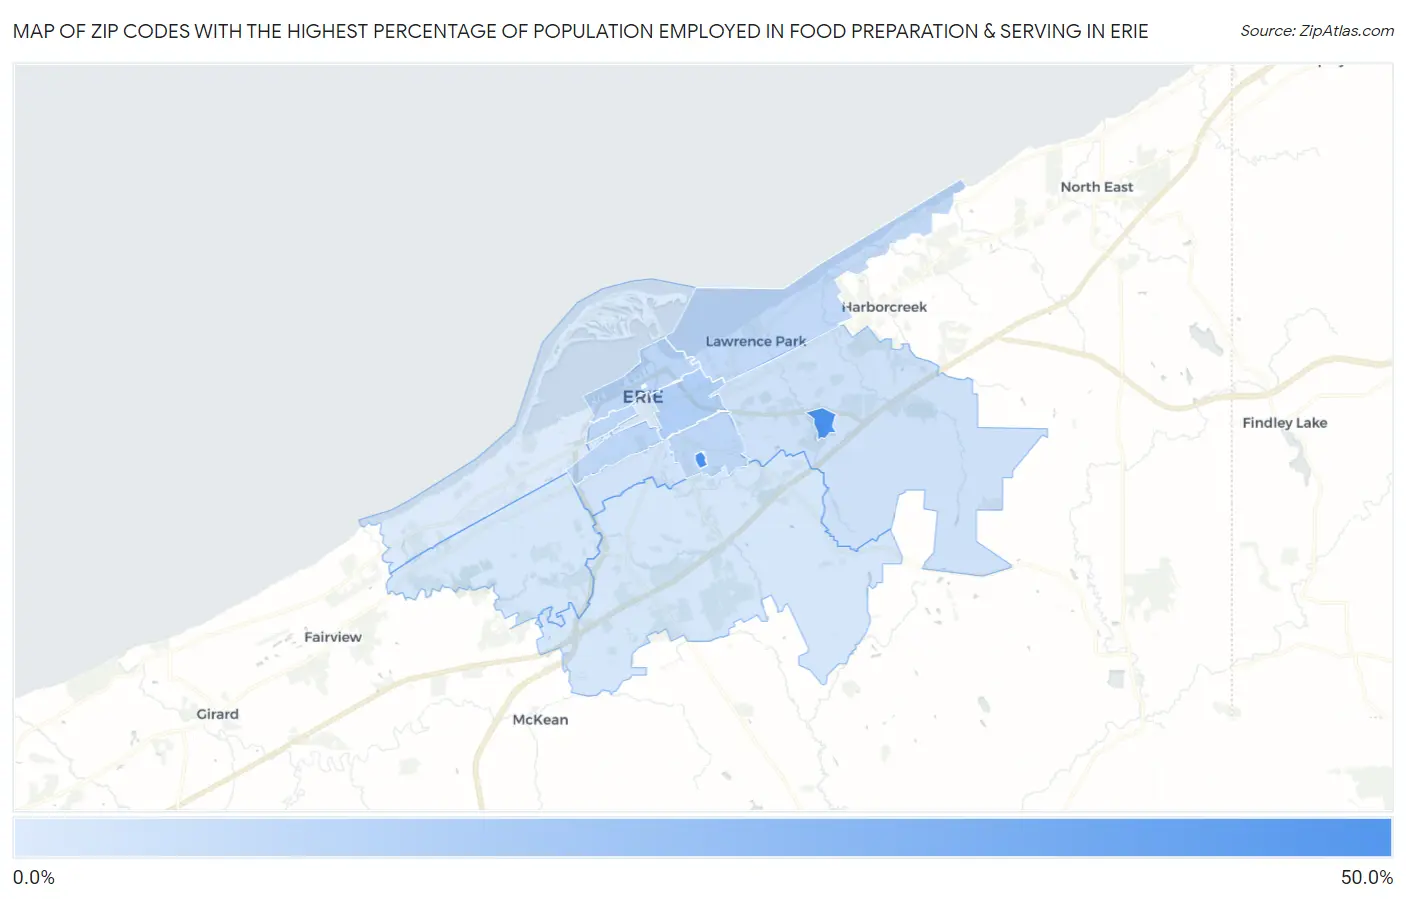
Map of Zip Codes with the Highest Percentage of Population Employed in Food Preparation & Serving in Erie
0.0%
50.0%
Zip Codes with the Highest Percentage of Population Employed in Food Preparation & Serving in Erie, PA
| Zip Code | % Employed | vs State | vs National | |
| 1. | 16546 | 40.5% | 5.0%(+35.5)#8 | 5.3%(+35.2)#100 |
| 2. | 16563 | 39.0% | 5.0%(+33.9)#9 | 5.3%(+33.7)#110 |
| 3. | 16503 | 12.4% | 5.0%(+7.35)#95 | 5.3%(+7.11)#1,542 |
| 4. | 16504 | 9.8% | 5.0%(+4.80)#148 | 5.3%(+4.55)#2,760 |
| 5. | 16507 | 9.8% | 5.0%(+4.72)#152 | 5.3%(+4.48)#2,831 |
| 6. | 16502 | 9.7% | 5.0%(+4.65)#155 | 5.3%(+4.41)#2,890 |
| 7. | 16511 | 8.9% | 5.0%(+3.81)#183 | 5.3%(+3.57)#3,660 |
| 8. | 16510 | 5.7% | 5.0%(+0.642)#566 | 5.3%(+0.400)#10,403 |
| 9. | 16508 | 5.2% | 5.0%(+0.185)#673 | 5.3%(-0.058)#12,030 |
| 10. | 16506 | 4.3% | 5.0%(-0.720)#931 | 5.3%(-0.962)#15,771 |
| 11. | 16509 | 4.3% | 5.0%(-0.731)#933 | 5.3%(-0.974)#15,831 |
| 12. | 16501 | 3.6% | 5.0%(-1.47)#1,093 | 5.3%(-1.71)#18,891 |
| 13. | 16505 | 2.7% | 5.0%(-2.34)#1,273 | 5.3%(-2.58)#22,410 |
1
Common Questions
What are the Top 10 Zip Codes with the Highest Percentage of Population Employed in Food Preparation & Serving in Erie, PA?
Top 10 Zip Codes with the Highest Percentage of Population Employed in Food Preparation & Serving in Erie, PA are:
What zip code has the Highest Percentage of Population Employed in Food Preparation & Serving in Erie, PA?
16546 has the Highest Percentage of Population Employed in Food Preparation & Serving in Erie, PA with 40.5%.
What is the Percentage of Population Employed in Food Preparation & Serving in Erie, PA?
Percentage of Population Employed in Food Preparation & Serving in Erie is 9.1%.
What is the Percentage of Population Employed in Food Preparation & Serving in Pennsylvania?
Percentage of Population Employed in Food Preparation & Serving in Pennsylvania is 5.0%.
What is the Percentage of Population Employed in Food Preparation & Serving in the United States?
Percentage of Population Employed in Food Preparation & Serving in the United States is 5.3%.