Cities with the Most Immigrants from Cuba in Pennsylvania
RELATED REPORTS & OPTIONS
Cuba
Pennsylvania
Compare Cities
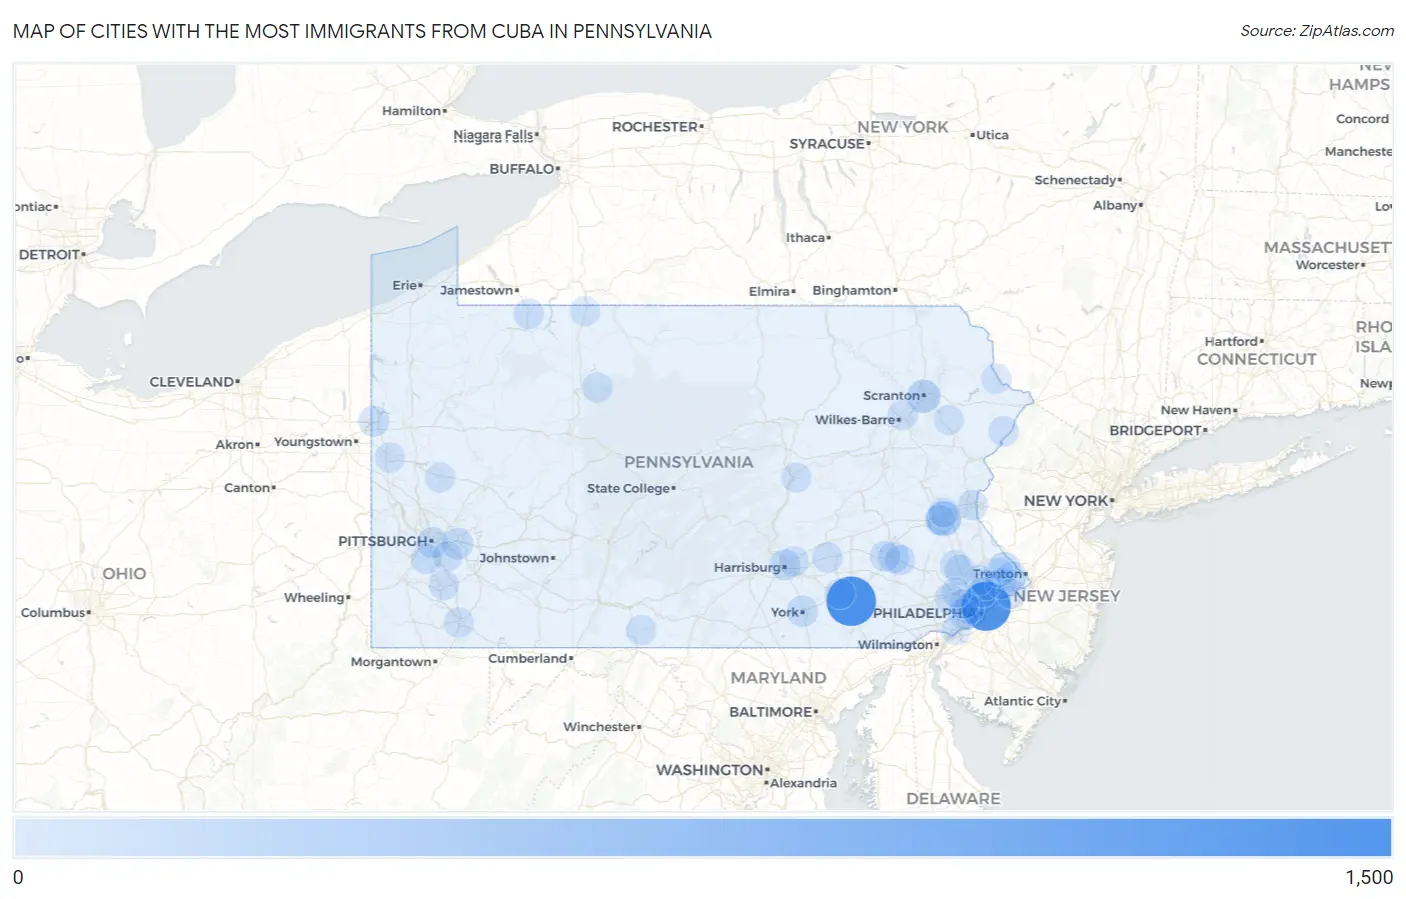
Map of Cities with the Most Immigrants from Cuba in Pennsylvania
0
1,500
Cities with the Most Immigrants from Cuba in Pennsylvania
| City | Cuba | vs State | vs National | |
| 1. | Lancaster | 1,095 | 6,036(18.14%)#1 | 1,325,277(0.08%)#137 |
| 2. | Philadelphia | 1,076 | 6,036(17.83%)#2 | 1,325,277(0.08%)#138 |
| 3. | Allentown | 251 | 6,036(4.16%)#3 | 1,325,277(0.02%)#357 |
| 4. | Scranton | 173 | 6,036(2.87%)#4 | 1,325,277(0.01%)#473 |
| 5. | Perkasie Borough | 124 | 6,036(2.05%)#5 | 1,325,277(0.01%)#604 |
| 6. | Ephrata Borough | 115 | 6,036(1.91%)#6 | 1,325,277(0.01%)#642 |
| 7. | Monroeville | 69 | 6,036(1.14%)#7 | 1,325,277(0.01%)#928 |
| 8. | Bridgeport Borough | 68 | 6,036(1.13%)#8 | 1,325,277(0.01%)#941 |
| 9. | York | 63 | 6,036(1.04%)#9 | 1,325,277(0.00%)#986 |
| 10. | Pittsburgh | 61 | 6,036(1.01%)#10 | 1,325,277(0.00%)#1,003 |
| 11. | Reading | 55 | 6,036(0.91%)#11 | 1,325,277(0.00%)#1,075 |
| 12. | Harrisburg | 51 | 6,036(0.84%)#12 | 1,325,277(0.00%)#1,131 |
| 13. | Trevose | 48 | 6,036(0.80%)#13 | 1,325,277(0.00%)#1,185 |
| 14. | Newtown Grant | 47 | 6,036(0.78%)#14 | 1,325,277(0.00%)#1,205 |
| 15. | Akron Borough | 40 | 6,036(0.66%)#15 | 1,325,277(0.00%)#1,321 |
| 16. | St. Davids | 38 | 6,036(0.63%)#16 | 1,325,277(0.00%)#1,371 |
| 17. | Devon | 34 | 6,036(0.56%)#17 | 1,325,277(0.00%)#1,465 |
| 18. | Sharon | 32 | 6,036(0.53%)#18 | 1,325,277(0.00%)#1,519 |
| 19. | Norristown Borough | 30 | 6,036(0.50%)#19 | 1,325,277(0.00%)#1,560 |
| 20. | Bethel Park | 29 | 6,036(0.48%)#20 | 1,325,277(0.00%)#1,589 |
| 21. | Easton | 28 | 6,036(0.46%)#21 | 1,325,277(0.00%)#1,611 |
| 22. | Woodbourne | 27 | 6,036(0.45%)#22 | 1,325,277(0.00%)#1,650 |
| 23. | Penn Wynne | 25 | 6,036(0.41%)#23 | 1,325,277(0.00%)#1,704 |
| 24. | New Hope Borough | 25 | 6,036(0.41%)#24 | 1,325,277(0.00%)#1,710 |
| 25. | Phoenixville Borough | 24 | 6,036(0.40%)#25 | 1,325,277(0.00%)#1,728 |
| 26. | Whitfield | 22 | 6,036(0.36%)#26 | 1,325,277(0.00%)#1,813 |
| 27. | Annville | 22 | 6,036(0.36%)#27 | 1,325,277(0.00%)#1,814 |
| 28. | Clearfield Borough | 21 | 6,036(0.35%)#28 | 1,325,277(0.00%)#1,859 |
| 29. | Reiffton | 21 | 6,036(0.35%)#29 | 1,325,277(0.00%)#1,866 |
| 30. | Highspire Borough | 20 | 6,036(0.33%)#30 | 1,325,277(0.00%)#1,912 |
| 31. | Kulpsville | 19 | 6,036(0.31%)#31 | 1,325,277(0.00%)#1,943 |
| 32. | Pocono Ranch Lands | 19 | 6,036(0.31%)#32 | 1,325,277(0.00%)#1,953 |
| 33. | Drexel Hill | 18 | 6,036(0.30%)#33 | 1,325,277(0.00%)#1,963 |
| 34. | Lansdale Borough | 18 | 6,036(0.30%)#34 | 1,325,277(0.00%)#1,973 |
| 35. | Willow Grove | 18 | 6,036(0.30%)#35 | 1,325,277(0.00%)#1,979 |
| 36. | St Marys | 18 | 6,036(0.30%)#36 | 1,325,277(0.00%)#1,981 |
| 37. | Plum Borough | 17 | 6,036(0.28%)#37 | 1,325,277(0.00%)#2,021 |
| 38. | Dorneyville | 17 | 6,036(0.28%)#38 | 1,325,277(0.00%)#2,045 |
| 39. | Seven Fields Borough | 15 | 6,036(0.25%)#39 | 1,325,277(0.00%)#2,154 |
| 40. | Columbia Borough | 14 | 6,036(0.23%)#40 | 1,325,277(0.00%)#2,200 |
| 41. | Fountain Hill Borough | 13 | 6,036(0.22%)#41 | 1,325,277(0.00%)#2,267 |
| 42. | Landisville | 13 | 6,036(0.22%)#42 | 1,325,277(0.00%)#2,281 |
| 43. | Adamstown Borough | 13 | 6,036(0.22%)#43 | 1,325,277(0.00%)#2,282 |
| 44. | Russell | 13 | 6,036(0.22%)#44 | 1,325,277(0.00%)#2,289 |
| 45. | Morrisville Borough | 12 | 6,036(0.20%)#45 | 1,325,277(0.00%)#2,341 |
| 46. | Carlisle Borough | 11 | 6,036(0.18%)#46 | 1,325,277(0.00%)#2,389 |
| 47. | Monessen | 10 | 6,036(0.17%)#47 | 1,325,277(0.00%)#2,490 |
| 48. | Harleysville | 9 | 6,036(0.15%)#48 | 1,325,277(0.00%)#2,580 |
| 49. | Bradford | 9 | 6,036(0.15%)#49 | 1,325,277(0.00%)#2,584 |
| 50. | Richboro | 9 | 6,036(0.15%)#50 | 1,325,277(0.00%)#2,588 |
| 51. | Maple Glen | 9 | 6,036(0.15%)#51 | 1,325,277(0.00%)#2,589 |
| 52. | Narberth Borough | 9 | 6,036(0.15%)#52 | 1,325,277(0.00%)#2,598 |
| 53. | Trappe Borough | 9 | 6,036(0.15%)#53 | 1,325,277(0.00%)#2,601 |
| 54. | Richland Borough | 9 | 6,036(0.15%)#54 | 1,325,277(0.00%)#2,613 |
| 55. | Gouldsboro | 9 | 6,036(0.15%)#55 | 1,325,277(0.00%)#2,618 |
| 56. | New Castle | 8 | 6,036(0.13%)#56 | 1,325,277(0.00%)#2,651 |
| 57. | Fullerton | 8 | 6,036(0.13%)#57 | 1,325,277(0.00%)#2,656 |
| 58. | Homeacre Lyndora | 8 | 6,036(0.13%)#58 | 1,325,277(0.00%)#2,671 |
| 59. | Wyncote | 8 | 6,036(0.13%)#59 | 1,325,277(0.00%)#2,682 |
| 60. | Chester | 7 | 6,036(0.12%)#60 | 1,325,277(0.00%)#2,725 |
| 61. | Mckeesport | 7 | 6,036(0.12%)#61 | 1,325,277(0.00%)#2,738 |
| 62. | Bryn Mawr | 7 | 6,036(0.12%)#62 | 1,325,277(0.00%)#2,764 |
| 63. | Ebensburg Borough | 7 | 6,036(0.12%)#63 | 1,325,277(0.00%)#2,776 |
| 64. | Needmore | 7 | 6,036(0.12%)#64 | 1,325,277(0.00%)#2,802 |
| 65. | King Of Prussia | 6 | 6,036(0.10%)#65 | 1,325,277(0.00%)#2,819 |
| 66. | Colonial Park | 6 | 6,036(0.10%)#66 | 1,325,277(0.00%)#2,825 |
| 67. | Whitehall Borough | 6 | 6,036(0.10%)#67 | 1,325,277(0.00%)#2,828 |
| 68. | West Elizabeth Borough | 6 | 6,036(0.10%)#68 | 1,325,277(0.00%)#2,869 |
| 69. | Souderton Borough | 5 | 6,036(0.08%)#69 | 1,325,277(0.00%)#2,901 |
| 70. | Ambler Borough | 5 | 6,036(0.08%)#70 | 1,325,277(0.00%)#2,903 |
| 71. | Plains | 5 | 6,036(0.08%)#71 | 1,325,277(0.00%)#2,907 |
| 72. | New Britain Borough | 5 | 6,036(0.08%)#72 | 1,325,277(0.00%)#2,914 |
| 73. | South Uniontown | 5 | 6,036(0.08%)#73 | 1,325,277(0.00%)#2,931 |
| 74. | Masthope | 5 | 6,036(0.08%)#74 | 1,325,277(0.00%)#2,942 |
| 75. | Sunbury | 4 | 6,036(0.07%)#75 | 1,325,277(0.00%)#2,977 |
| 76. | St Lawrence Borough | 4 | 6,036(0.07%)#76 | 1,325,277(0.00%)#2,996 |
| 77. | Croydon | 3 | 6,036(0.05%)#77 | 1,325,277(0.00%)#3,027 |
| 78. | Riegelsville Borough | 3 | 6,036(0.05%)#78 | 1,325,277(0.00%)#3,066 |
| 79. | Dalton Borough | 2 | 6,036(0.03%)#79 | 1,325,277(0.00%)#3,123 |
| 80. | Deer Lake Borough | 2 | 6,036(0.03%)#80 | 1,325,277(0.00%)#3,132 |
| 81. | Bear Creek Village Borough | 2 | 6,036(0.03%)#81 | 1,325,277(0.00%)#3,148 |
| 82. | Darlington Borough | 2 | 6,036(0.03%)#82 | 1,325,277(0.00%)#3,153 |
| 83. | Gettysburg Borough | 1 | 6,036(0.02%)#83 | 1,325,277(0.00%)#3,173 |
| 84. | Clarks Green Borough | 1 | 6,036(0.02%)#84 | 1,325,277(0.00%)#3,195 |
| 85. | Wellsville Borough | 1 | 6,036(0.02%)#85 | 1,325,277(0.00%)#3,220 |
Common Questions
What are the Top 10 Cities with the Most Immigrants from Cuba in Pennsylvania?
Top 10 Cities with the Most Immigrants from Cuba in Pennsylvania are:
#1
1,095
#2
1,076
#3
251
#4
173
#5
69
#6
63
#7
61
#8
55
#9
51
#10
48
What city has the Most Immigrants from Cuba in Pennsylvania?
Lancaster has the Most Immigrants from Cuba in Pennsylvania with 1,095.
What is the Total Immigrants from Cuba in the State of Pennsylvania?
Total Immigrants from Cuba in Pennsylvania is 6,036.
What is the Total Immigrants from Cuba in the United States?
Total Immigrants from Cuba in the United States is 1,325,277.