Cove, OR
Cove Map
Cove Overview
676
TOTAL POPULATION
349
MALE POPULATION
327
FEMALE POPULATION
106.73
MALES / 100 FEMALES
93.70
FEMALES / 100 MALES
45.4
MEDIAN AGE
2.8
AVG FAMILY SIZE
2.1
AVG HOUSEHOLD SIZE
$35,958
PER CAPITA INCOME
$75,833
AVG FAMILY INCOME
$66,382
AVG HOUSEHOLD INCOME
36.5%
WAGE / INCOME GAP [ % ]
63.5¢/ $1
WAGE / INCOME GAP [ $ ]
0.38
INEQUALITY / GINI INDEX
257
LABOR FORCE [ PEOPLE ]
42.1%
PERCENT IN LABOR FORCE
2.3%
UNEMPLOYMENT RATE
Cove Zip Codes
Cove Area Codes
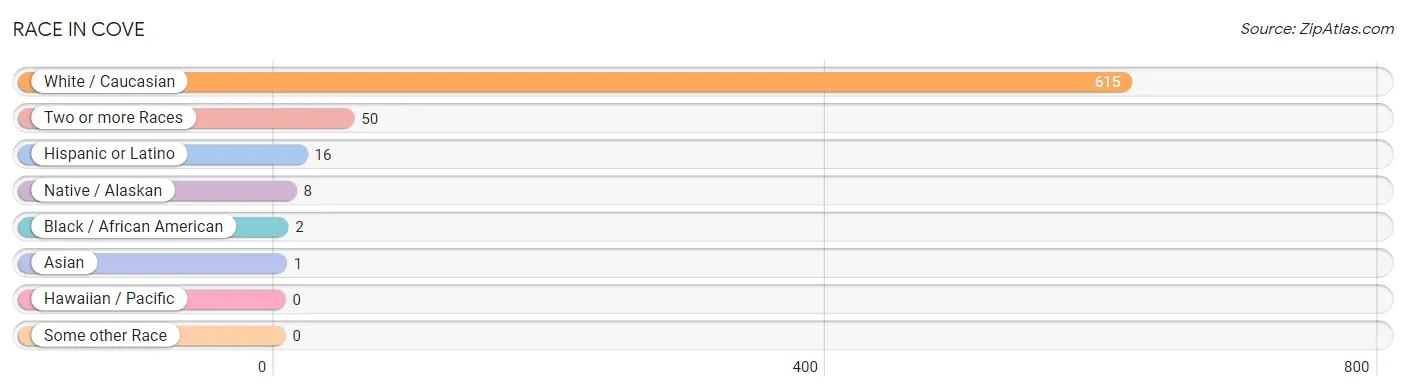
Race in Cove
The most populous races in Cove are White / Caucasian (615 | 91.0%), Two or more Races (50 | 7.4%), and Hispanic or Latino (16 | 2.4%).
| Race | # Population | % Population |
| Asian | 1 | 0.2% |
| Black / African American | 2 | 0.3% |
| Hawaiian / Pacific | 0 | 0.0% |
| Hispanic or Latino | 16 | 2.4% |
| Native / Alaskan | 8 | 1.2% |
| White / Caucasian | 615 | 91.0% |
| Two or more Races | 50 | 7.4% |
| Some other Race | 0 | 0.0% |
| Total | 676 | 100.0% |
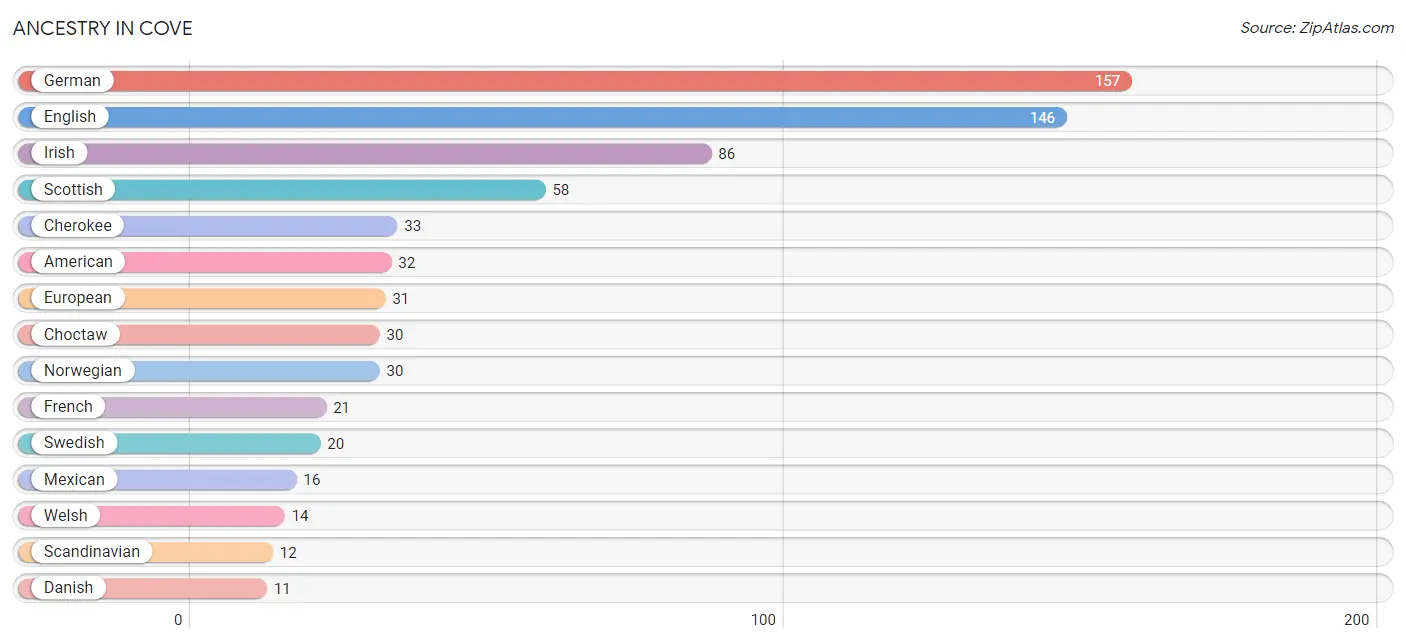
Ancestry in Cove
The most populous ancestries reported in Cove are German (157 | 23.2%), English (146 | 21.6%), Irish (86 | 12.7%), Scottish (58 | 8.6%), and Cherokee (33 | 4.9%), together accounting for 71.0% of all Cove residents.
| Ancestry | # Population | % Population |
| American | 32 | 4.7% |
| Basque | 6 | 0.9% |
| Blackfeet | 1 | 0.2% |
| British | 5 | 0.7% |
| Cherokee | 33 | 4.9% |
| Choctaw | 30 | 4.4% |
| Danish | 11 | 1.6% |
| Dutch | 2 | 0.3% |
| Eastern European | 6 | 0.9% |
| English | 146 | 21.6% |
| European | 31 | 4.6% |
| French | 21 | 3.1% |
| German | 157 | 23.2% |
| Indian (Asian) | 1 | 0.2% |
| Irish | 86 | 12.7% |
| Italian | 10 | 1.5% |
| Latvian | 2 | 0.3% |
| Mexican | 16 | 2.4% |
| Northern European | 6 | 0.9% |
| Norwegian | 30 | 4.4% |
| Polish | 11 | 1.6% |
| Portuguese | 1 | 0.2% |
| Russian | 2 | 0.3% |
| Scandinavian | 12 | 1.8% |
| Scotch-Irish | 4 | 0.6% |
| Scottish | 58 | 8.6% |
| Swedish | 20 | 3.0% |
| Swiss | 3 | 0.4% |
| Ukrainian | 2 | 0.3% |
| Welsh | 14 | 2.1% | View All 30 Rows |
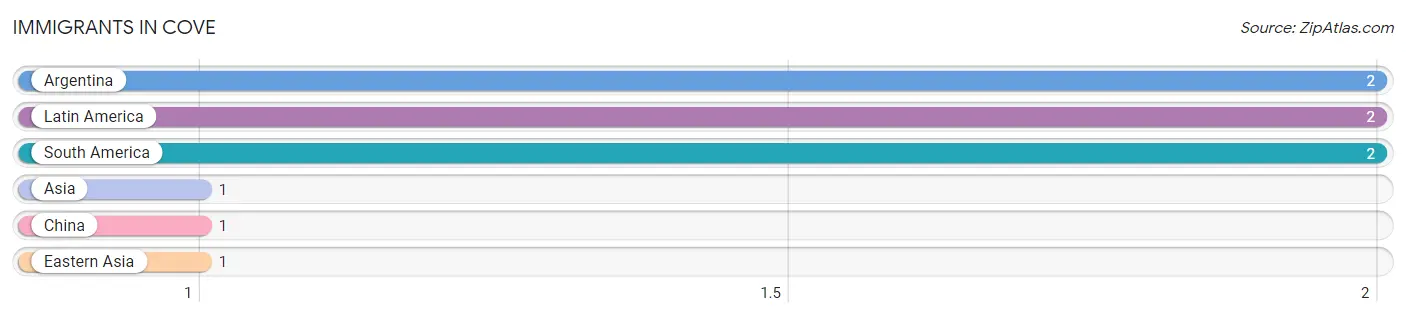
Immigrants in Cove
The most numerous immigrant groups reported in Cove came from Argentina (2 | 0.3%), Latin America (2 | 0.3%), South America (2 | 0.3%), Asia (1 | 0.2%), and China (1 | 0.2%), together accounting for 1.2% of all Cove residents.
| Immigration Origin | # Population | % Population |
| Argentina | 2 | 0.3% |
| Asia | 1 | 0.2% |
| China | 1 | 0.2% |
| Eastern Asia | 1 | 0.2% |
| Latin America | 2 | 0.3% |
| South America | 2 | 0.3% | View All 6 Rows |
Sex and Age in Cove
Sex and Age in Cove
The most populous age groups in Cove are 15 to 19 Years (70 | 20.1%) for men and 20 to 24 Years (48 | 14.7%) for women.
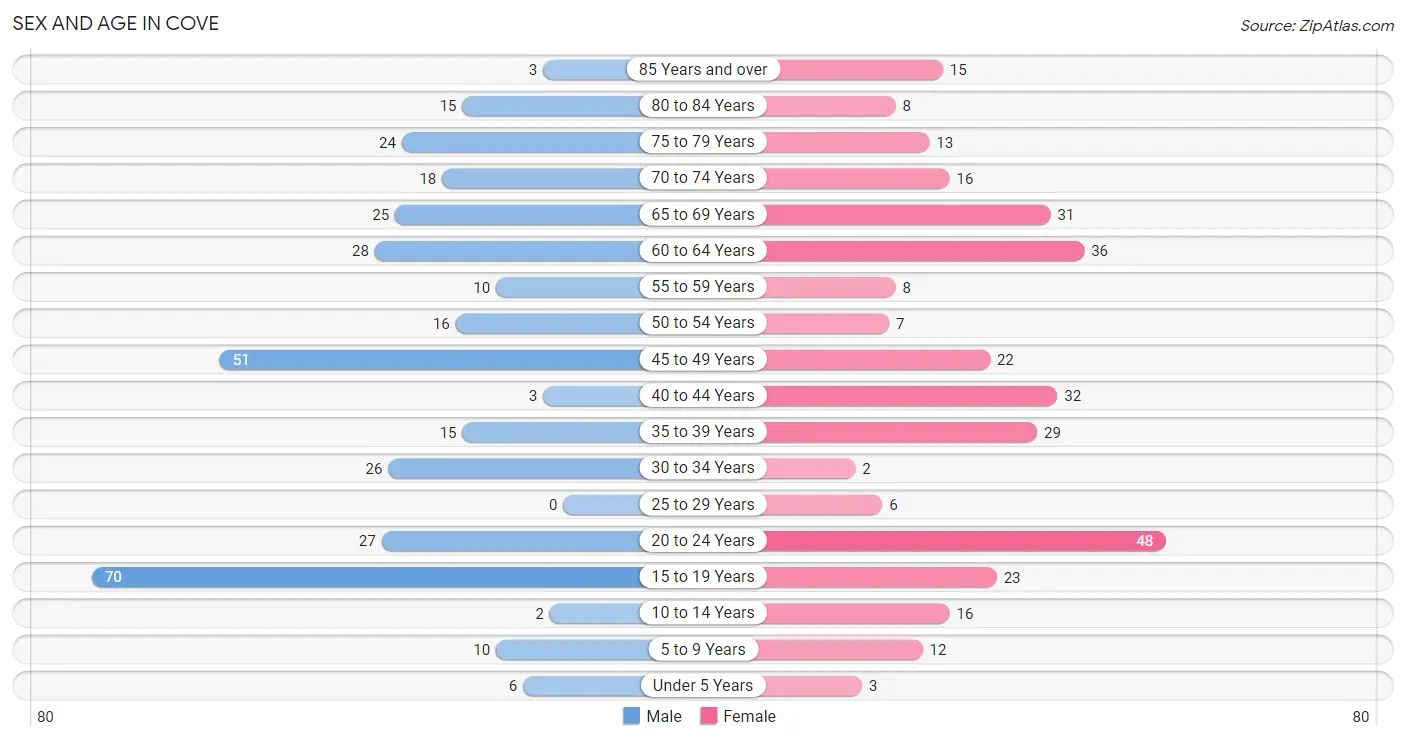
| Age Bracket | Male | Female |
| Under 5 Years | 6 (1.7%) | 3 (0.9%) |
| 5 to 9 Years | 10 (2.9%) | 12 (3.7%) |
| 10 to 14 Years | 2 (0.6%) | 16 (4.9%) |
| 15 to 19 Years | 70 (20.1%) | 23 (7.0%) |
| 20 to 24 Years | 27 (7.7%) | 48 (14.7%) |
| 25 to 29 Years | 0 (0.0%) | 6 (1.8%) |
| 30 to 34 Years | 26 (7.4%) | 2 (0.6%) |
| 35 to 39 Years | 15 (4.3%) | 29 (8.9%) |
| 40 to 44 Years | 3 (0.9%) | 32 (9.8%) |
| 45 to 49 Years | 51 (14.6%) | 22 (6.7%) |
| 50 to 54 Years | 16 (4.6%) | 7 (2.1%) |
| 55 to 59 Years | 10 (2.9%) | 8 (2.5%) |
| 60 to 64 Years | 28 (8.0%) | 36 (11.0%) |
| 65 to 69 Years | 25 (7.2%) | 31 (9.5%) |
| 70 to 74 Years | 18 (5.2%) | 16 (4.9%) |
| 75 to 79 Years | 24 (6.9%) | 13 (4.0%) |
| 80 to 84 Years | 15 (4.3%) | 8 (2.5%) |
| 85 Years and over | 3 (0.9%) | 15 (4.6%) |
| Total | 349 (100.0%) | 327 (100.0%) |
Families and Households in Cove
Median Family Size in Cove
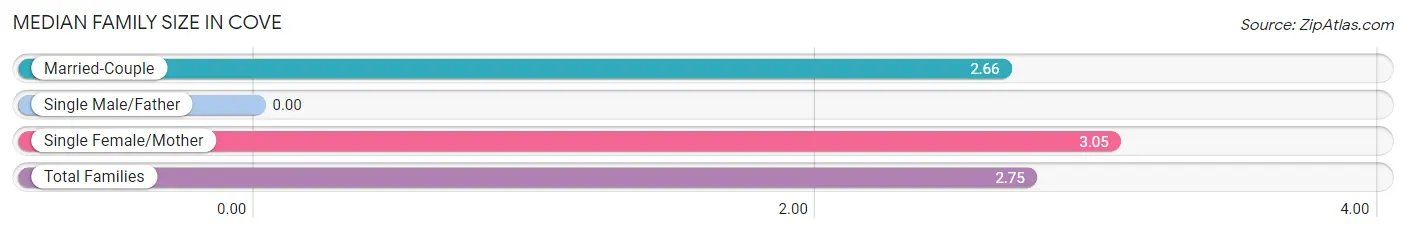
| Family Type | # Families | Family Size |
| Married-Couple | 136 (78.2%) | 2.66 |
| Single Male/Father | 0 (0.0%) | - |
| Single Female/Mother | 38 (21.8%) | 3.05 |
| Total Families | 174 (100.0%) | 2.75 |
Median Household Size in Cove
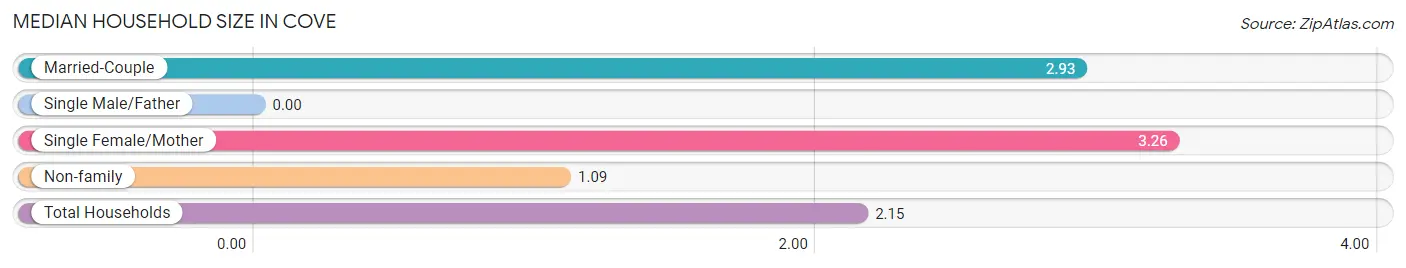
| Household Type | # Households | Household Size |
| Married-Couple | 136 (43.2%) | 2.93 |
| Single Male/Father | 0 (0.0%) | - |
| Single Female/Mother | 38 (12.1%) | 3.26 |
| Non-family | 141 (44.8%) | 1.09 |
| Total Households | 315 (100.0%) | 2.15 |
Household Size by Marriage Status in Cove
Out of a total of 315 households in Cove, 174 (55.2%) are family households, while 141 (44.8%) are nonfamily households. The most numerous type of family households are 2-person households, comprising 85, and the most common type of nonfamily households are 1-person households, comprising 130.
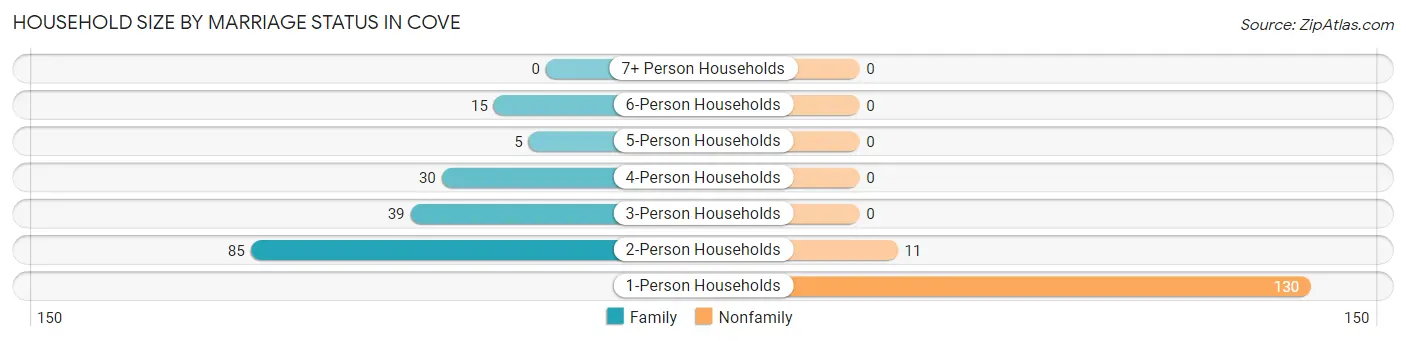
| Household Size | Family Households | Nonfamily Households |
| 1-Person Households | - | 130 (41.3%) |
| 2-Person Households | 85 (27.0%) | 11 (3.5%) |
| 3-Person Households | 39 (12.4%) | 0 (0.0%) |
| 4-Person Households | 30 (9.5%) | 0 (0.0%) |
| 5-Person Households | 5 (1.6%) | 0 (0.0%) |
| 6-Person Households | 15 (4.8%) | 0 (0.0%) |
| 7+ Person Households | 0 (0.0%) | 0 (0.0%) |
| Total | 174 (55.2%) | 141 (44.8%) |
Female Fertility in Cove
Fertility by Age in Cove
Average fertility rate in Cove is 86.0 births per 1,000 women. Women in the age bracket of 20 to 34 years have the highest fertility rate with 250.0 births per 1,000 women. Women in the age bracket of 20 to 34 years acount for 100.0% of all women with births.
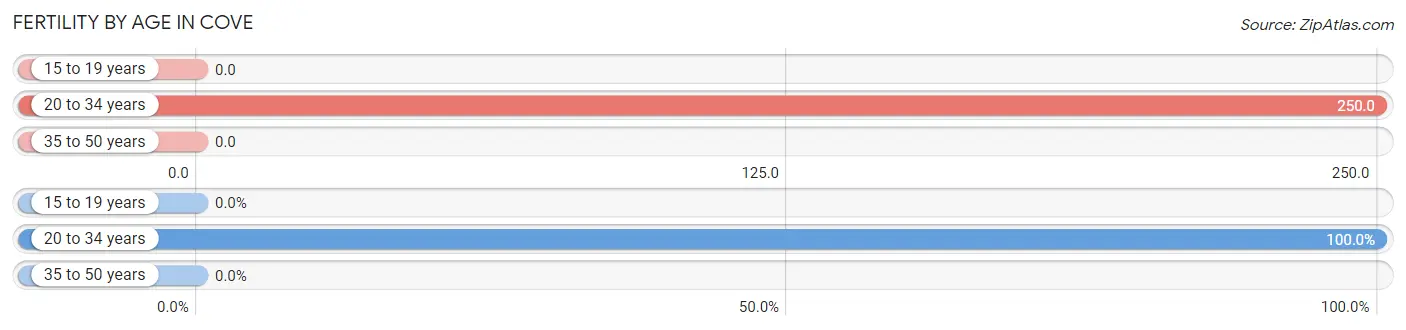
| Age Bracket | Women with Births | Births / 1,000 Women |
| 15 to 19 years | 0 (0.0%) | 0.0 |
| 20 to 34 years | 14 (100.0%) | 250.0 |
| 35 to 50 years | 0 (0.0%) | 0.0 |
| Total | 14 (100.0%) | 86.0 |
Fertility by Age by Marriage Status in Cove
50.0% of women with births (14) in Cove are married. The highest percentage of unmarried women with births falls into 20 to 34 years age bracket with 50.0% of them unmarried at the time of birth, while the lowest percentage of unmarried women with births belong to 20 to 34 years age bracket with 50.0% of them unmarried.
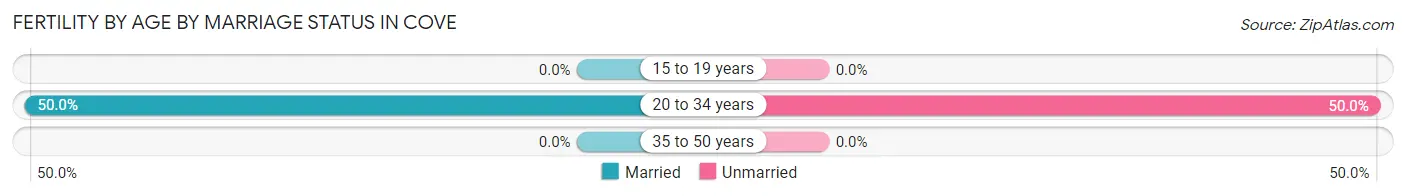
| Age Bracket | Married | Unmarried |
| 15 to 19 years | 0 (0.0%) | 0 (0.0%) |
| 20 to 34 years | 7 (50.0%) | 7 (50.0%) |
| 35 to 50 years | 0 (0.0%) | 0 (0.0%) |
| Total | 7 (50.0%) | 7 (50.0%) |
Fertility by Education in Cove
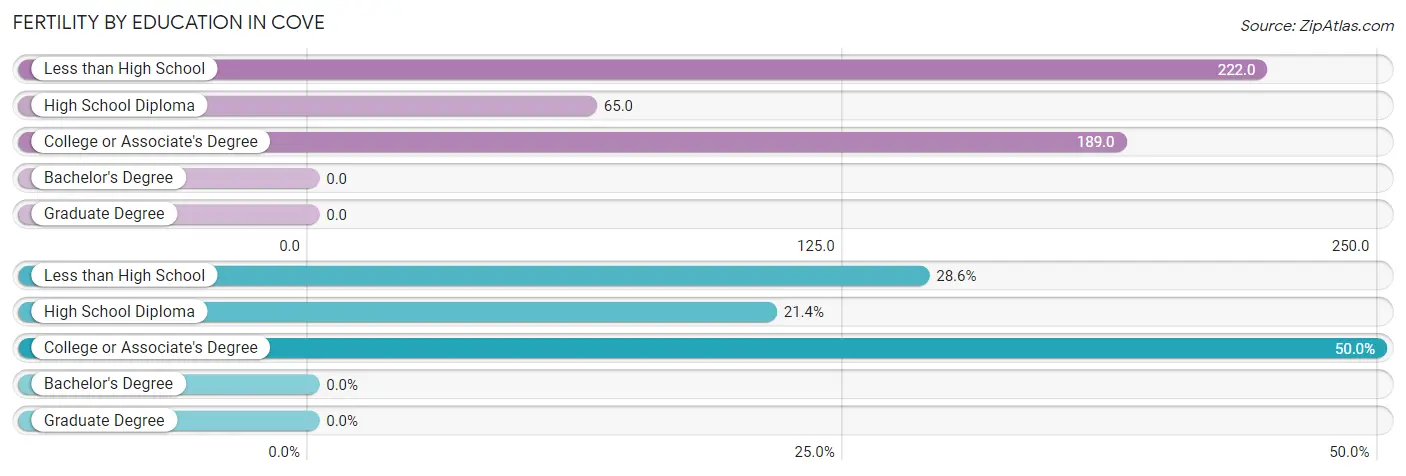
| Educational Attainment | Women with Births | Births / 1,000 Women |
| Less than High School | 4 (28.6%) | 222.0 |
| High School Diploma | 3 (21.4%) | 65.0 |
| College or Associate's Degree | 7 (50.0%) | 189.0 |
| Bachelor's Degree | 0 (0.0%) | 0.0 |
| Graduate Degree | 0 (0.0%) | 0.0 |
| Total | 14 (100.0%) | 86.0 |
Fertility by Education by Marriage Status in Cove
50.0% of women with births in Cove are unmarried. Women with the educational attainment of college or associate's degree are most likely to be married with 100.0% of them married at childbirth, while women with the educational attainment of less than high school are least likely to be married with 100.0% of them unmarried at childbirth.
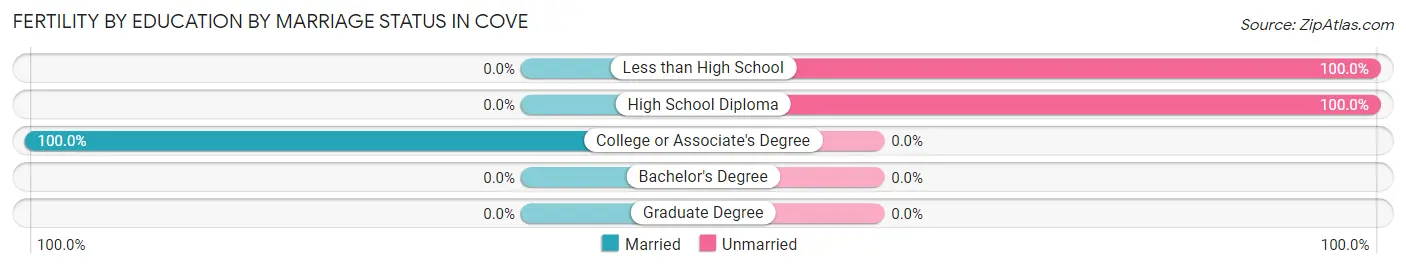
| Educational Attainment | Married | Unmarried |
| Less than High School | 0 (0.0%) | 4 (100.0%) |
| High School Diploma | 0 (0.0%) | 3 (100.0%) |
| College or Associate's Degree | 7 (100.0%) | 0 (0.0%) |
| Bachelor's Degree | 0 (0.0%) | 0 (0.0%) |
| Graduate Degree | 0 (0.0%) | 0 (0.0%) |
| Total | 7 (50.0%) | 7 (50.0%) |
Income in Cove
Income Overview in Cove
Per Capita Income in Cove is $35,958, while median incomes of families and households are $75,833 and $66,382 respectively.
| Characteristic | Number | Measure |
| Per Capita Income | 676 | $35,958 |
| Median Family Income | 174 | $75,833 |
| Mean Family Income | 174 | $93,817 |
| Median Household Income | 315 | $66,382 |
| Mean Household Income | 315 | $74,798 |
| Income Deficit | 174 | $0 |
| Wage / Income Gap (%) | 676 | 36.52% |
| Wage / Income Gap ($) | 676 | 63.48¢ per $1 |
| Gini / Inequality Index | 676 | 0.38 |
Earnings by Sex in Cove
Average Earnings in Cove are $46,650, $55,625 for men and $35,313 for women, a difference of 36.5%.
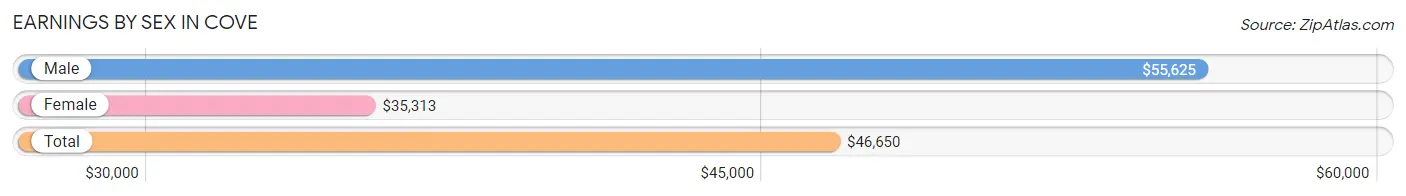
| Sex | Number | Average Earnings |
| Male | 147 (49.8%) | $55,625 |
| Female | 148 (50.2%) | $35,313 |
| Total | 295 (100.0%) | $46,650 |
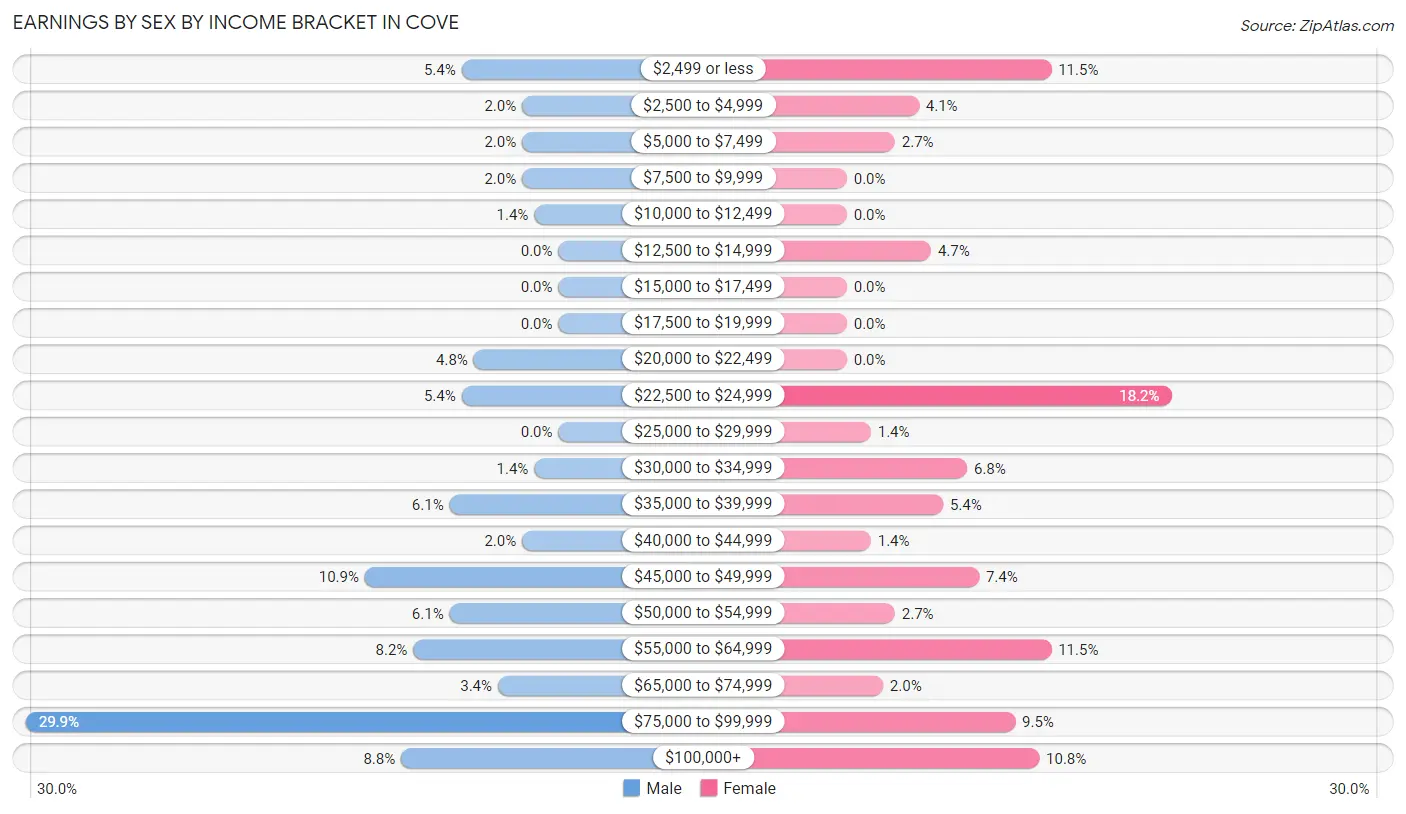
Earnings by Sex by Income Bracket in Cove
The most common earnings brackets in Cove are $75,000 to $99,999 for men (44 | 29.9%) and $22,500 to $24,999 for women (27 | 18.2%).
| Income | Male | Female |
| $2,499 or less | 8 (5.4%) | 17 (11.5%) |
| $2,500 to $4,999 | 3 (2.0%) | 6 (4.1%) |
| $5,000 to $7,499 | 3 (2.0%) | 4 (2.7%) |
| $7,500 to $9,999 | 3 (2.0%) | 0 (0.0%) |
| $10,000 to $12,499 | 2 (1.4%) | 0 (0.0%) |
| $12,500 to $14,999 | 0 (0.0%) | 7 (4.7%) |
| $15,000 to $17,499 | 0 (0.0%) | 0 (0.0%) |
| $17,500 to $19,999 | 0 (0.0%) | 0 (0.0%) |
| $20,000 to $22,499 | 7 (4.8%) | 0 (0.0%) |
| $22,500 to $24,999 | 8 (5.4%) | 27 (18.2%) |
| $25,000 to $29,999 | 0 (0.0%) | 2 (1.3%) |
| $30,000 to $34,999 | 2 (1.4%) | 10 (6.8%) |
| $35,000 to $39,999 | 9 (6.1%) | 8 (5.4%) |
| $40,000 to $44,999 | 3 (2.0%) | 2 (1.3%) |
| $45,000 to $49,999 | 16 (10.9%) | 11 (7.4%) |
| $50,000 to $54,999 | 9 (6.1%) | 4 (2.7%) |
| $55,000 to $64,999 | 12 (8.2%) | 17 (11.5%) |
| $65,000 to $74,999 | 5 (3.4%) | 3 (2.0%) |
| $75,000 to $99,999 | 44 (29.9%) | 14 (9.5%) |
| $100,000+ | 13 (8.8%) | 16 (10.8%) |
| Total | 147 (100.0%) | 148 (100.0%) |
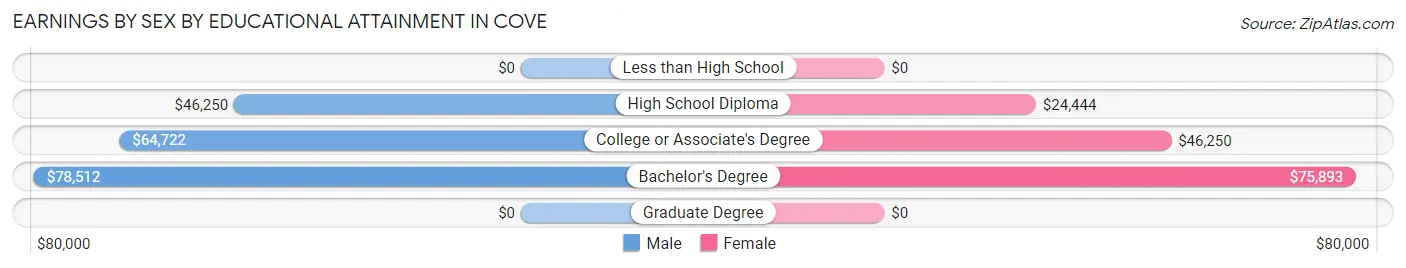
Earnings by Sex by Educational Attainment in Cove
Average earnings in Cove are $74,167 for men and $44,375 for women, a difference of 40.2%. Men with an educational attainment of bachelor's degree enjoy the highest average annual earnings of $78,512, while those with high school diploma education earn the least with $46,250. Women with an educational attainment of bachelor's degree earn the most with the average annual earnings of $75,893, while those with high school diploma education have the smallest earnings of $24,444.
| Educational Attainment | Male Income | Female Income |
| Less than High School | - | - |
| High School Diploma | $46,250 | $24,444 |
| College or Associate's Degree | $64,722 | $46,250 |
| Bachelor's Degree | $78,512 | $75,893 |
| Graduate Degree | - | - |
| Total | $74,167 | $44,375 |
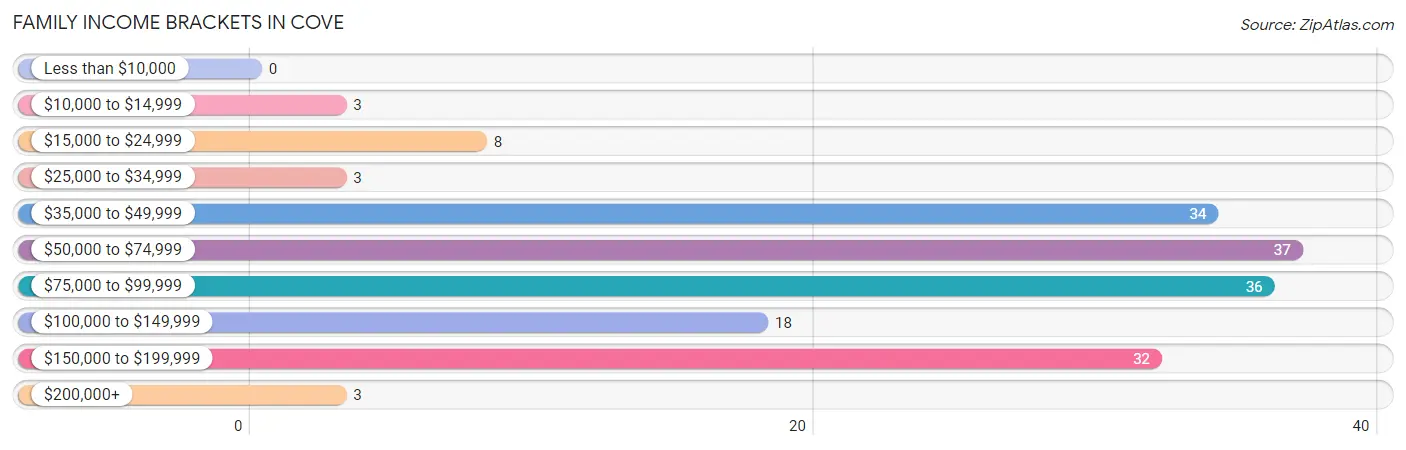
Family Income in Cove
Family Income Brackets in Cove
According to the Cove family income data, there are 37 families falling into the $50,000 to $74,999 income range, which is the most common income bracket and makes up 21.3% of all families.
| Income Bracket | # Families | % Families |
| Less than $10,000 | 0 | 0.0% |
| $10,000 to $14,999 | 3 | 1.7% |
| $15,000 to $24,999 | 8 | 4.6% |
| $25,000 to $34,999 | 3 | 1.7% |
| $35,000 to $49,999 | 34 | 19.5% |
| $50,000 to $74,999 | 37 | 21.3% |
| $75,000 to $99,999 | 36 | 20.7% |
| $100,000 to $149,999 | 18 | 10.3% |
| $150,000 to $199,999 | 32 | 18.4% |
| $200,000+ | 3 | 1.7% |
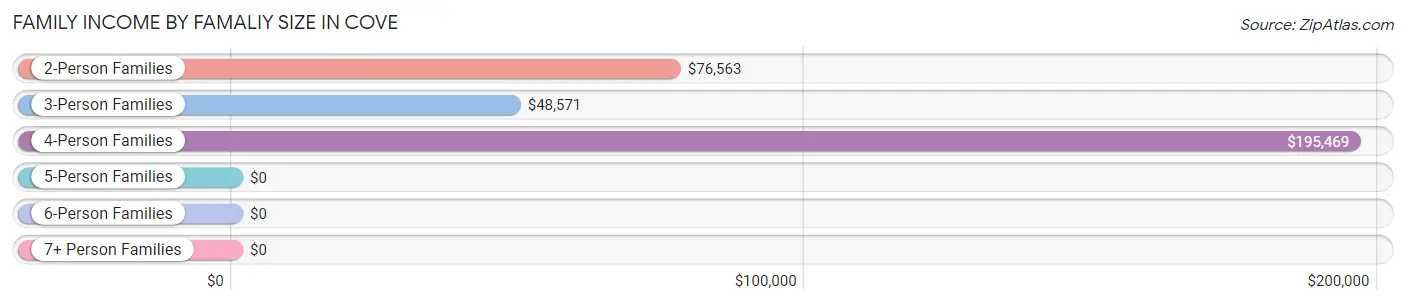
Family Income by Famaliy Size in Cove
4-person families (26 | 14.9%) account for the highest median family income in Cove with $195,469 per family, while 4-person families (26 | 14.9%) have the highest median income of $48,867 per family member.
| Income Bracket | # Families | Median Income |
| 2-Person Families | 87 (50.0%) | $76,563 |
| 3-Person Families | 56 (32.2%) | $48,571 |
| 4-Person Families | 26 (14.9%) | $195,469 |
| 5-Person Families | 5 (2.9%) | $0 |
| 6-Person Families | 0 (0.0%) | $0 |
| 7+ Person Families | 0 (0.0%) | $0 |
| Total | 174 (100.0%) | $75,833 |
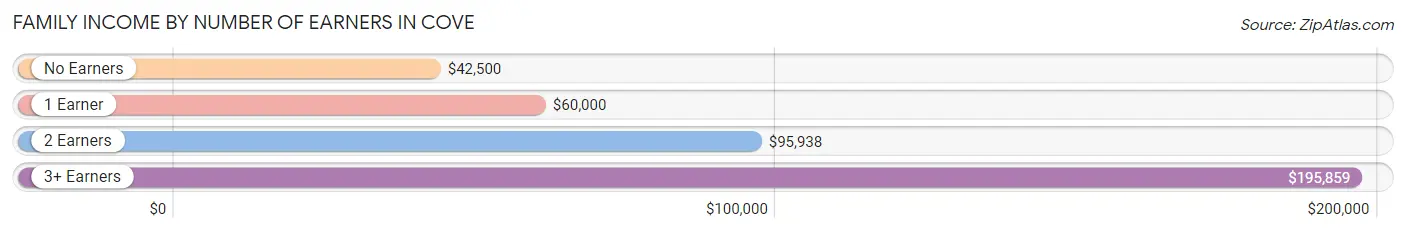
Family Income by Number of Earners in Cove
The median family income in Cove is $75,833, with families comprising 3+ earners (21) having the highest median family income of $195,859, while families with no earners (42) have the lowest median family income of $42,500, accounting for 12.1% and 24.1% of families, respectively.
| Number of Earners | # Families | Median Income |
| No Earners | 42 (24.1%) | $42,500 |
| 1 Earner | 46 (26.4%) | $60,000 |
| 2 Earners | 65 (37.4%) | $95,938 |
| 3+ Earners | 21 (12.1%) | $195,859 |
| Total | 174 (100.0%) | $75,833 |
Household Income in Cove
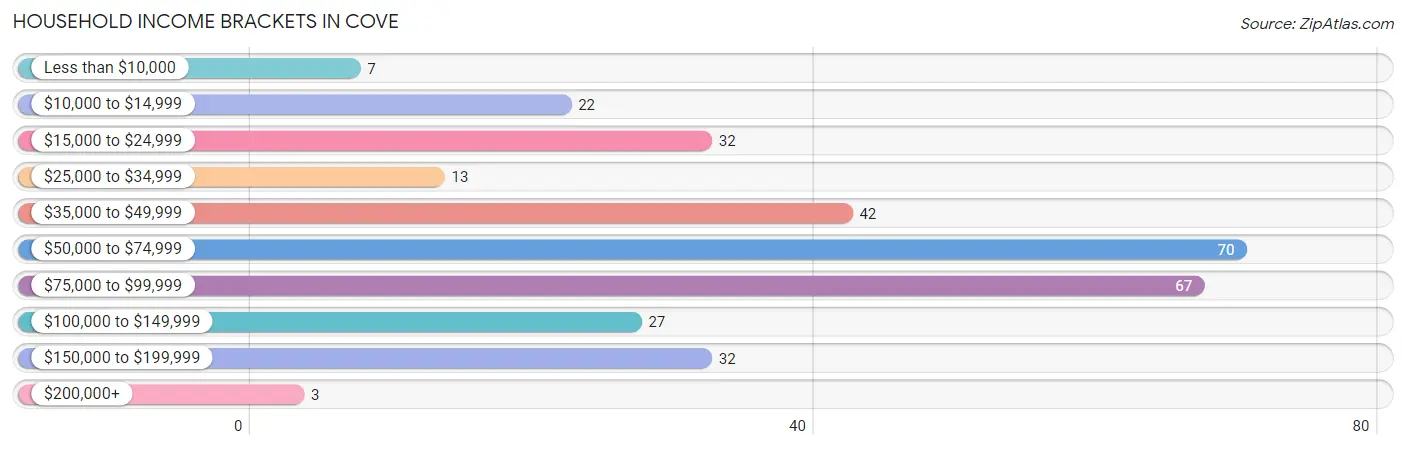
Household Income Brackets in Cove
With 70 households falling in the category, the $50,000 to $74,999 income range is the most frequent in Cove, accounting for 22.2% of all households. In contrast, only 3 households (0.9%) fall into the $200,000+ income bracket, making it the least populous group.
| Income Bracket | # Households | % Households |
| Less than $10,000 | 7 | 2.2% |
| $10,000 to $14,999 | 22 | 7.0% |
| $15,000 to $24,999 | 32 | 10.2% |
| $25,000 to $34,999 | 13 | 4.1% |
| $35,000 to $49,999 | 42 | 13.3% |
| $50,000 to $74,999 | 70 | 22.2% |
| $75,000 to $99,999 | 67 | 21.3% |
| $100,000 to $149,999 | 27 | 8.6% |
| $150,000 to $199,999 | 32 | 10.2% |
| $200,000+ | 3 | 1.0% |
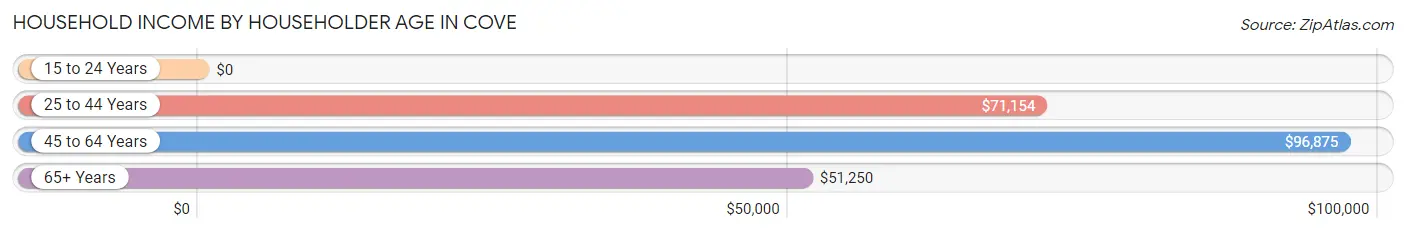
Household Income by Householder Age in Cove
The median household income in Cove is $66,382, with the highest median household income of $96,875 found in the 45 to 64 years age bracket for the primary householder. A total of 89 households (28.2%) fall into this category. Meanwhile, the 15 to 24 years age bracket for the primary householder has the lowest median household income of $0, with 24 households (7.6%) in this group.
| Income Bracket | # Households | Median Income |
| 15 to 24 Years | 24 (7.6%) | $0 |
| 25 to 44 Years | 86 (27.3%) | $71,154 |
| 45 to 64 Years | 89 (28.2%) | $96,875 |
| 65+ Years | 116 (36.8%) | $51,250 |
| Total | 315 (100.0%) | $66,382 |
Poverty in Cove
Income Below Poverty by Sex and Age in Cove
With 7.4% poverty level for males and 16.8% for females among the residents of Cove, 18 to 24 year old males and 18 to 24 year old females are the most vulnerable to poverty, with 12 males (20.3%) and 31 females (54.4%) in their respective age groups living below the poverty level.
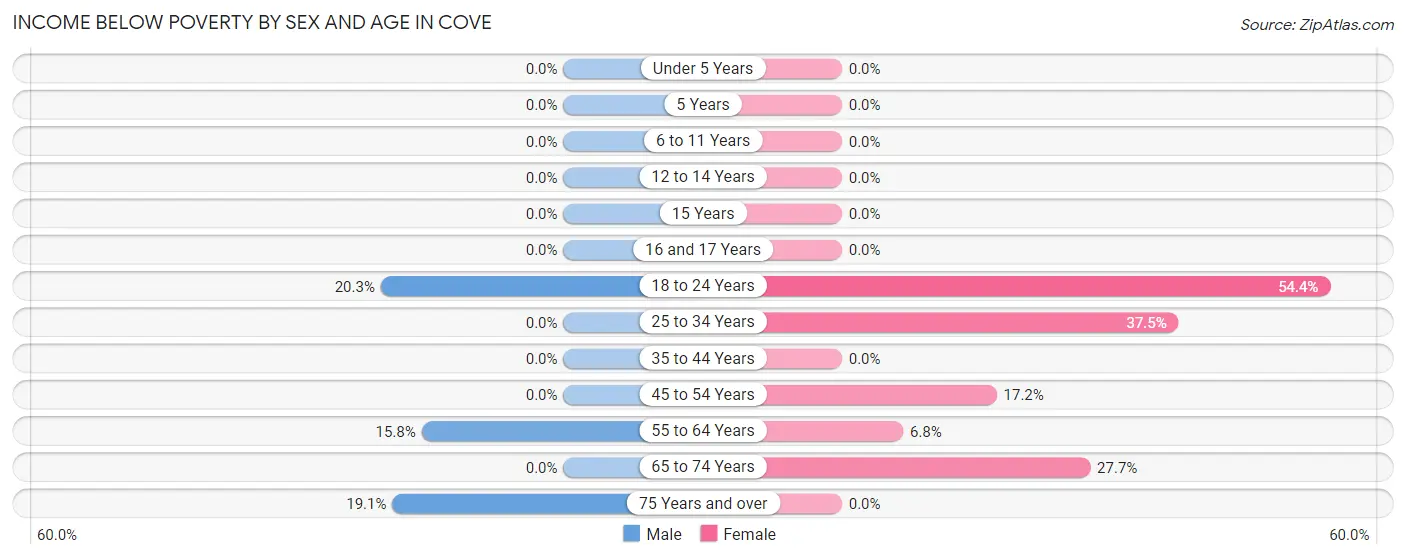
| Age Bracket | Male | Female |
| Under 5 Years | 0 (0.0%) | 0 (0.0%) |
| 5 Years | 0 (0.0%) | 0 (0.0%) |
| 6 to 11 Years | 0 (0.0%) | 0 (0.0%) |
| 12 to 14 Years | 0 (0.0%) | 0 (0.0%) |
| 15 Years | 0 (0.0%) | 0 (0.0%) |
| 16 and 17 Years | 0 (0.0%) | 0 (0.0%) |
| 18 to 24 Years | 12 (20.3%) | 31 (54.4%) |
| 25 to 34 Years | 0 (0.0%) | 3 (37.5%) |
| 35 to 44 Years | 0 (0.0%) | 0 (0.0%) |
| 45 to 54 Years | 0 (0.0%) | 5 (17.2%) |
| 55 to 64 Years | 6 (15.8%) | 3 (6.8%) |
| 65 to 74 Years | 0 (0.0%) | 13 (27.7%) |
| 75 Years and over | 8 (19.1%) | 0 (0.0%) |
| Total | 26 (7.4%) | 55 (16.8%) |
Income Above Poverty by Sex and Age in Cove
According to the poverty statistics in Cove, males aged under 5 years and females aged under 5 years are the age groups that are most secure financially, with 100.0% of males and 100.0% of females in these age groups living above the poverty line.
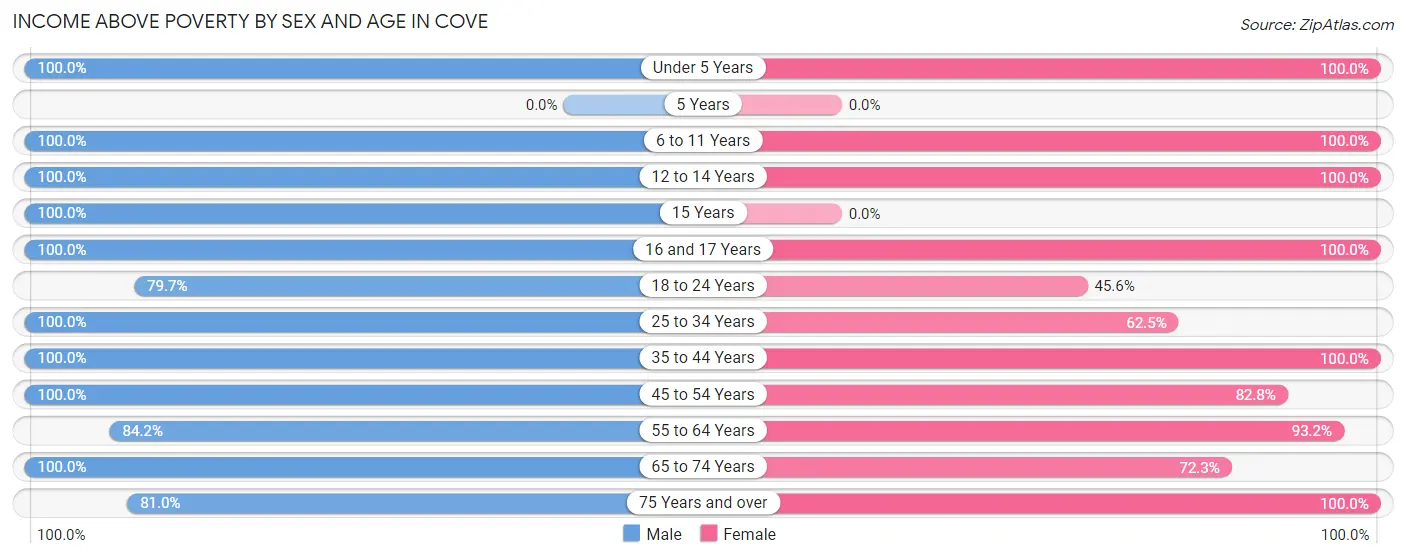
| Age Bracket | Male | Female |
| Under 5 Years | 6 (100.0%) | 3 (100.0%) |
| 5 Years | 0 (0.0%) | 0 (0.0%) |
| 6 to 11 Years | 10 (100.0%) | 20 (100.0%) |
| 12 to 14 Years | 2 (100.0%) | 8 (100.0%) |
| 15 Years | 16 (100.0%) | 0 (0.0%) |
| 16 and 17 Years | 22 (100.0%) | 14 (100.0%) |
| 18 to 24 Years | 47 (79.7%) | 26 (45.6%) |
| 25 to 34 Years | 26 (100.0%) | 5 (62.5%) |
| 35 to 44 Years | 18 (100.0%) | 61 (100.0%) |
| 45 to 54 Years | 67 (100.0%) | 24 (82.8%) |
| 55 to 64 Years | 32 (84.2%) | 41 (93.2%) |
| 65 to 74 Years | 43 (100.0%) | 34 (72.3%) |
| 75 Years and over | 34 (80.9%) | 36 (100.0%) |
| Total | 323 (92.5%) | 272 (83.2%) |
Income Below Poverty Among Married-Couple Families in Cove
| Children | Above Poverty | Below Poverty |
| No Children | 91 (100.0%) | 0 (0.0%) |
| 1 or 2 Children | 43 (100.0%) | 0 (0.0%) |
| 3 or 4 Children | 2 (100.0%) | 0 (0.0%) |
| 5 or more Children | 0 (0.0%) | 0 (0.0%) |
| Total | 136 (100.0%) | 0 (0.0%) |
Income Below Poverty Among Single-Parent Households in Cove
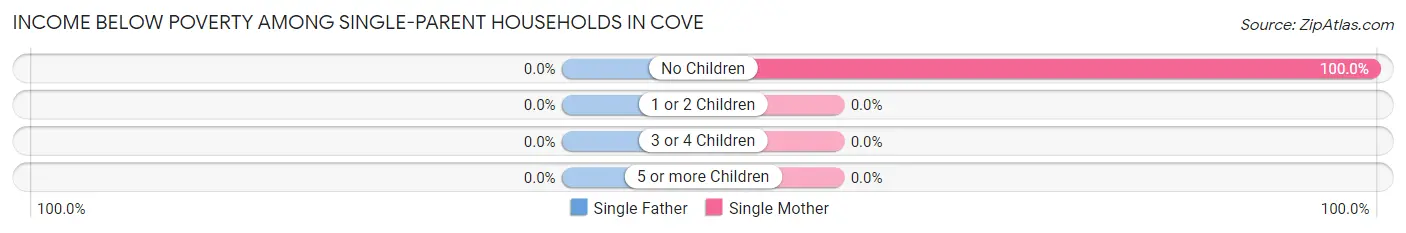
| Children | Single Father | Single Mother |
| No Children | 0 (0.0%) | 3 (100.0%) |
| 1 or 2 Children | 0 (0.0%) | 0 (0.0%) |
| 3 or 4 Children | 0 (0.0%) | 0 (0.0%) |
| 5 or more Children | 0 (0.0%) | 0 (0.0%) |
| Total | 0 (0.0%) | 3 (7.9%) |
Income Below Poverty Among Married-Couple vs Single-Parent Households in Cove
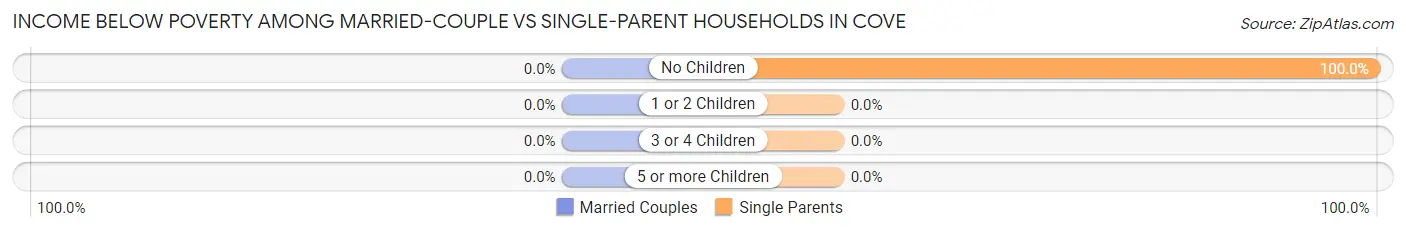
| Children | Married-Couple Families | Single-Parent Households |
| No Children | 0 (0.0%) | 3 (100.0%) |
| 1 or 2 Children | 0 (0.0%) | 0 (0.0%) |
| 3 or 4 Children | 0 (0.0%) | 0 (0.0%) |
| 5 or more Children | 0 (0.0%) | 0 (0.0%) |
| Total | 0 (0.0%) | 3 (7.9%) |
Employment Characteristics in Cove
Employment by Class of Employer in Cove
Among the 251 employed individuals in Cove, private company employees (116 | 46.2%), local government employees (56 | 22.3%), and not-for-profit organizations (43 | 17.1%) make up the most common classes of employment.
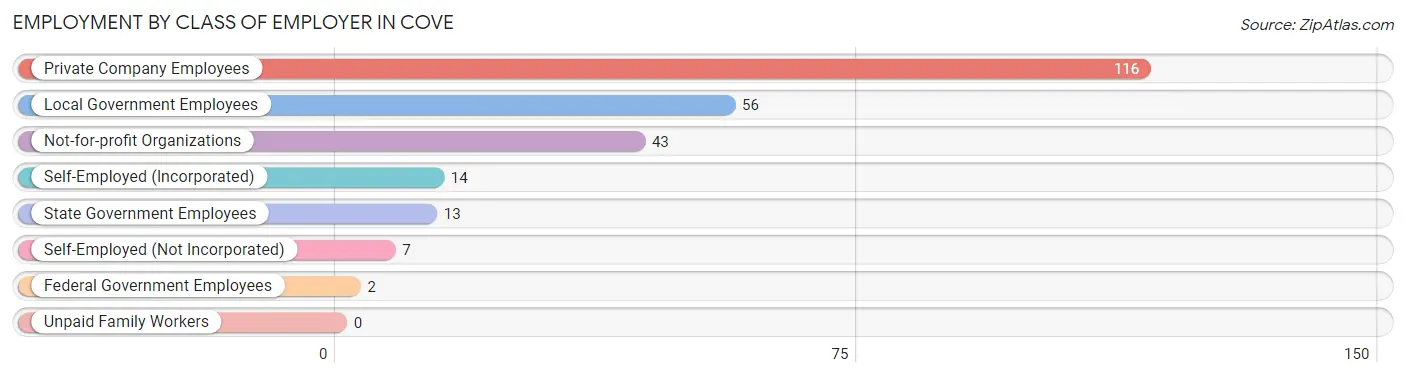
| Employer Class | # Employees | % Employees |
| Private Company Employees | 116 | 46.2% |
| Self-Employed (Incorporated) | 14 | 5.6% |
| Self-Employed (Not Incorporated) | 7 | 2.8% |
| Not-for-profit Organizations | 43 | 17.1% |
| Local Government Employees | 56 | 22.3% |
| State Government Employees | 13 | 5.2% |
| Federal Government Employees | 2 | 0.8% |
| Unpaid Family Workers | 0 | 0.0% |
| Total | 251 | 100.0% |
Employment Status by Age in Cove
According to the labor force statistics for Cove, out of the total population over 16 years of age (611), 42.1% or 257 individuals are in the labor force, with 2.3% or 6 of them unemployed. The age group with the highest labor force participation rate is 30 to 34 years, with 92.9% or 26 individuals in the labor force. Within the labor force, the 16 to 19 years age range has the highest percentage of unemployed individuals, with 23.1% or 3 of them being unemployed.
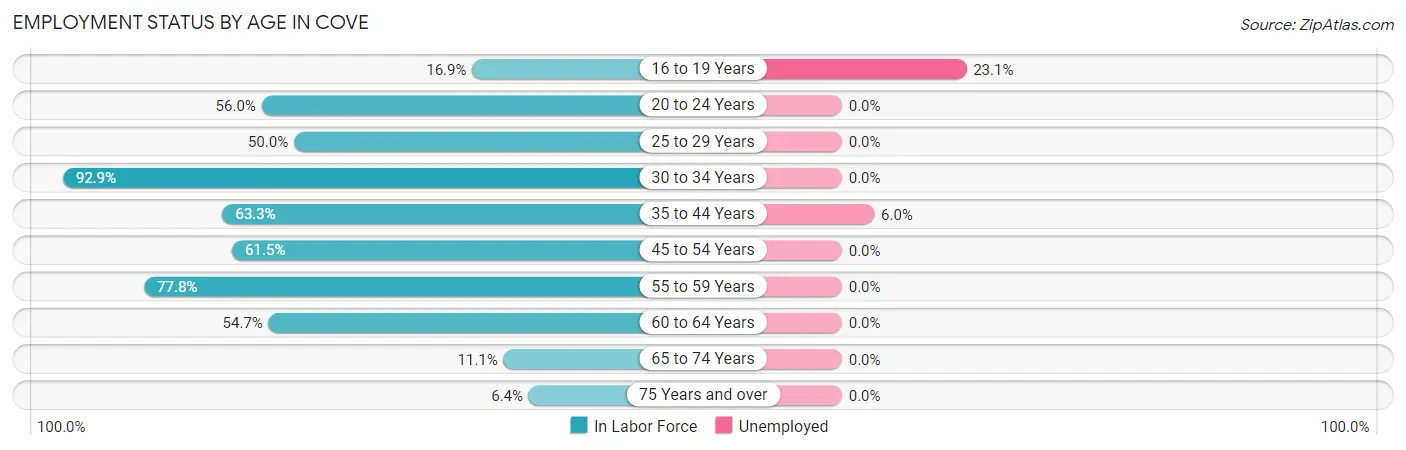
| Age Bracket | In Labor Force | Unemployed |
| 16 to 19 Years | 13 (16.9%) | 3 (23.1%) |
| 20 to 24 Years | 42 (56.0%) | 0 (0.0%) |
| 25 to 29 Years | 3 (50.0%) | 0 (0.0%) |
| 30 to 34 Years | 26 (92.9%) | 0 (0.0%) |
| 35 to 44 Years | 50 (63.3%) | 3 (6.0%) |
| 45 to 54 Years | 59 (61.5%) | 0 (0.0%) |
| 55 to 59 Years | 14 (77.8%) | 0 (0.0%) |
| 60 to 64 Years | 35 (54.7%) | 0 (0.0%) |
| 65 to 74 Years | 10 (11.1%) | 0 (0.0%) |
| 75 Years and over | 5 (6.4%) | 0 (0.0%) |
| Total | 257 (42.1%) | 6 (2.3%) |
Employment Status by Educational Attainment in Cove
According to labor force statistics for Cove, 64.3% of individuals (187) out of the total population between 25 and 64 years of age (291) are in the labor force, with 1.6% or 3 of them being unemployed. The group with the highest labor force participation rate are those with the educational attainment of college / associate degree, with 76.4% or 81 individuals in the labor force. Within the labor force, individuals with high school diploma education have the highest percentage of unemployment, with 8.8% or 3 of them being unemployed.
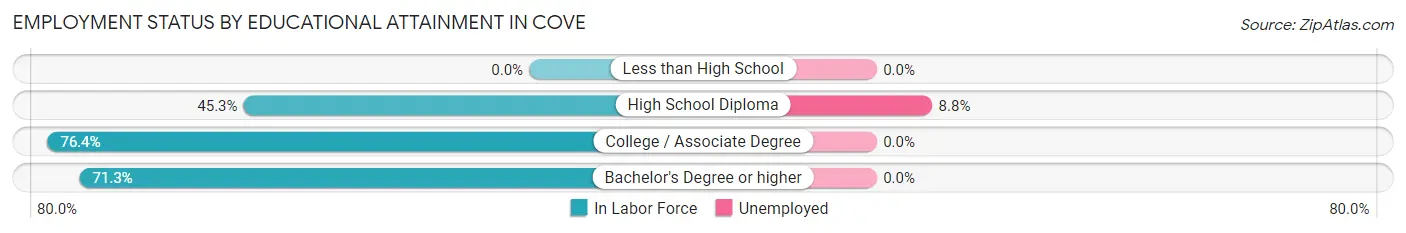
| Educational Attainment | In Labor Force | Unemployed |
| Less than High School | 0 (0.0%) | 0 (0.0%) |
| High School Diploma | 34 (45.3%) | 7 (8.8%) |
| College / Associate Degree | 81 (76.4%) | 0 (0.0%) |
| Bachelor's Degree or higher | 72 (71.3%) | 0 (0.0%) |
| Total | 187 (64.3%) | 5 (1.6%) |
Employment Occupations by Sex in Cove
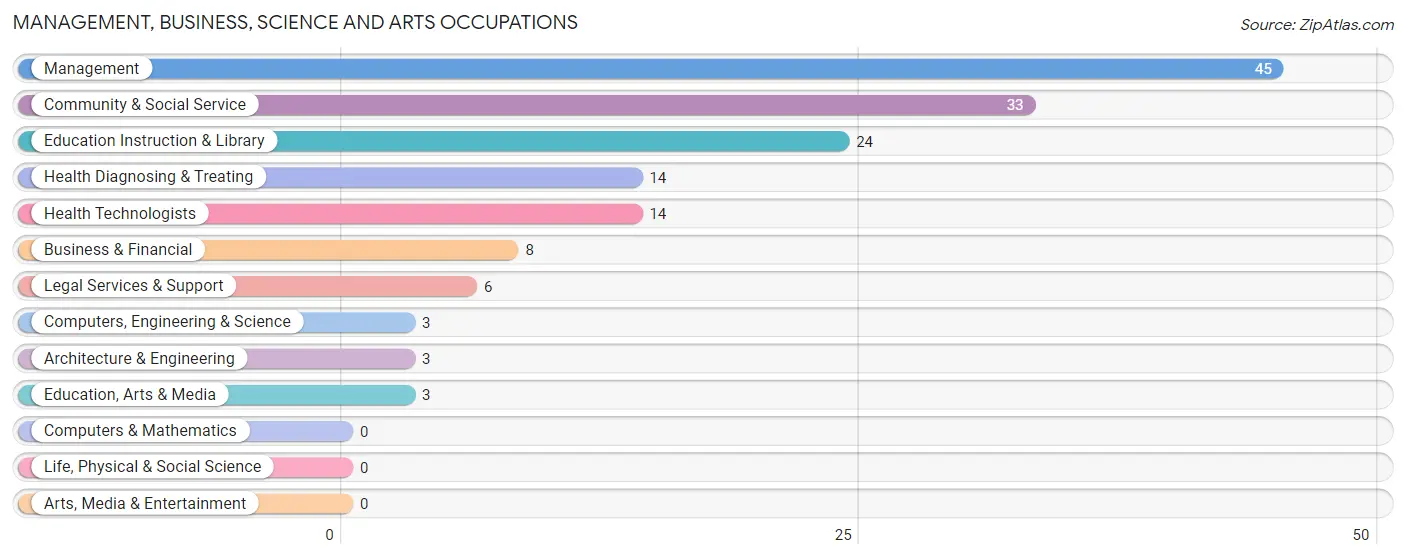
Management, Business, Science and Arts Occupations
The most common Management, Business, Science and Arts occupations in Cove are Management (45 | 17.9%), Community & Social Service (33 | 13.2%), Education Instruction & Library (24 | 9.6%), Health Diagnosing & Treating (14 | 5.6%), and Health Technologists (14 | 5.6%).
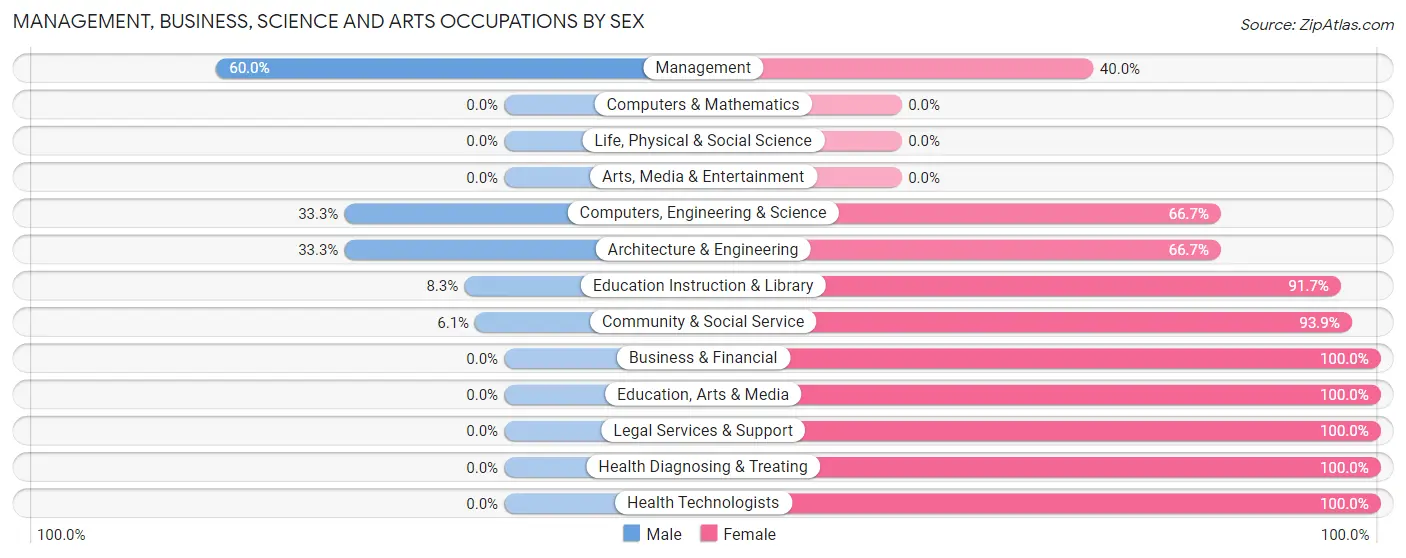
Management, Business, Science and Arts Occupations by Sex
Within the Management, Business, Science and Arts occupations in Cove, the most male-oriented occupations are Management (60.0%), Computers, Engineering & Science (33.3%), and Architecture & Engineering (33.3%), while the most female-oriented occupations are Business & Financial (100.0%), Education, Arts & Media (100.0%), and Legal Services & Support (100.0%).
| Occupation | Male | Female |
| Management | 27 (60.0%) | 18 (40.0%) |
| Business & Financial | 0 (0.0%) | 8 (100.0%) |
| Computers, Engineering & Science | 1 (33.3%) | 2 (66.7%) |
| Computers & Mathematics | 0 (0.0%) | 0 (0.0%) |
| Architecture & Engineering | 1 (33.3%) | 2 (66.7%) |
| Life, Physical & Social Science | 0 (0.0%) | 0 (0.0%) |
| Community & Social Service | 2 (6.1%) | 31 (93.9%) |
| Education, Arts & Media | 0 (0.0%) | 3 (100.0%) |
| Legal Services & Support | 0 (0.0%) | 6 (100.0%) |
| Education Instruction & Library | 2 (8.3%) | 22 (91.7%) |
| Arts, Media & Entertainment | 0 (0.0%) | 0 (0.0%) |
| Health Diagnosing & Treating | 0 (0.0%) | 14 (100.0%) |
| Health Technologists | 0 (0.0%) | 14 (100.0%) |
| Total (Category) | 30 (29.1%) | 73 (70.9%) |
| Total (Overall) | 133 (53.0%) | 118 (47.0%) |
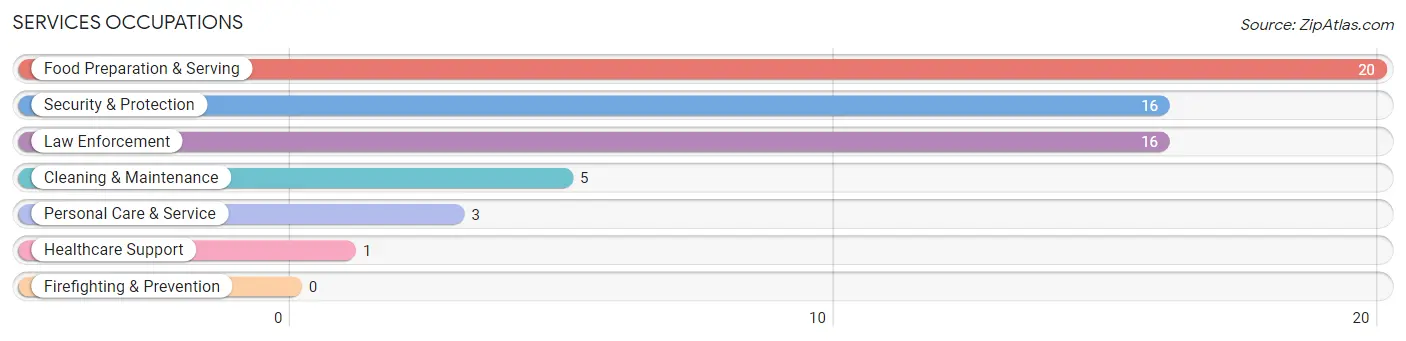
Services Occupations
The most common Services occupations in Cove are Food Preparation & Serving (20 | 8.0%), Security & Protection (16 | 6.4%), Law Enforcement (16 | 6.4%), Cleaning & Maintenance (5 | 2.0%), and Personal Care & Service (3 | 1.2%).
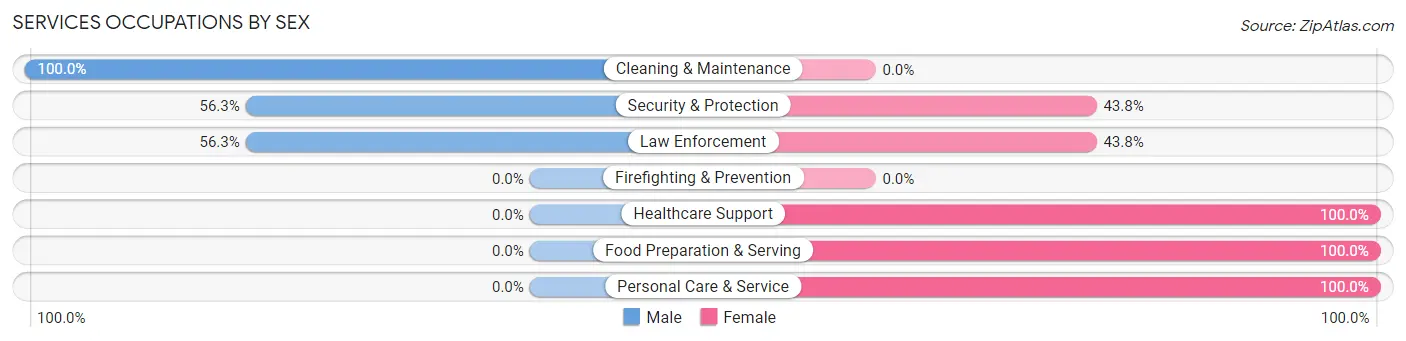
Services Occupations by Sex
Within the Services occupations in Cove, the most male-oriented occupations are Cleaning & Maintenance (100.0%), Security & Protection (56.2%), and Law Enforcement (56.2%), while the most female-oriented occupations are Healthcare Support (100.0%), Food Preparation & Serving (100.0%), and Personal Care & Service (100.0%).
| Occupation | Male | Female |
| Healthcare Support | 0 (0.0%) | 1 (100.0%) |
| Security & Protection | 9 (56.2%) | 7 (43.8%) |
| Firefighting & Prevention | 0 (0.0%) | 0 (0.0%) |
| Law Enforcement | 9 (56.2%) | 7 (43.8%) |
| Food Preparation & Serving | 0 (0.0%) | 20 (100.0%) |
| Cleaning & Maintenance | 5 (100.0%) | 0 (0.0%) |
| Personal Care & Service | 0 (0.0%) | 3 (100.0%) |
| Total (Category) | 14 (31.1%) | 31 (68.9%) |
| Total (Overall) | 133 (53.0%) | 118 (47.0%) |
Sales and Office Occupations
The most common Sales and Office occupations in Cove are Sales & Related (20 | 8.0%), and Office & Administration (19 | 7.6%).
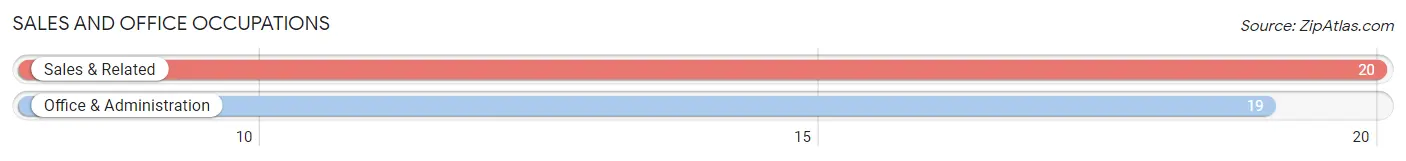
Sales and Office Occupations by Sex
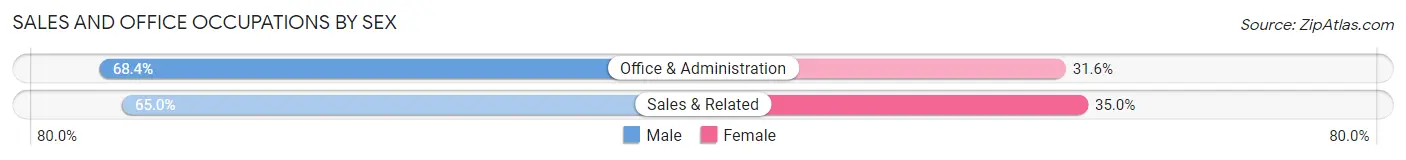
| Occupation | Male | Female |
| Sales & Related | 13 (65.0%) | 7 (35.0%) |
| Office & Administration | 13 (68.4%) | 6 (31.6%) |
| Total (Category) | 26 (66.7%) | 13 (33.3%) |
| Total (Overall) | 133 (53.0%) | 118 (47.0%) |
Natural Resources, Construction and Maintenance Occupations
The most common Natural Resources, Construction and Maintenance occupations in Cove are Construction & Extraction (19 | 7.6%), Installation, Maintenance & Repair (19 | 7.6%), and Farming, Fishing & Forestry (3 | 1.2%).
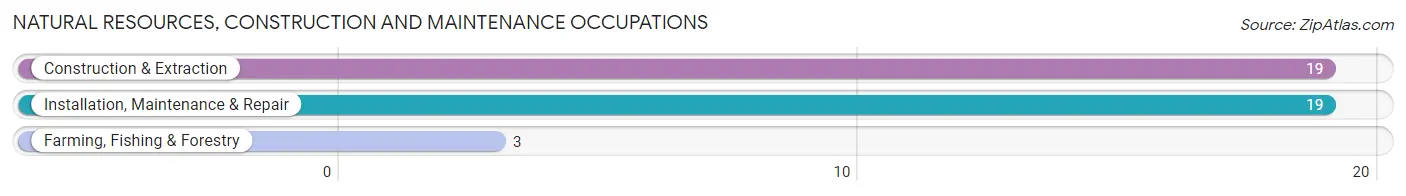
Natural Resources, Construction and Maintenance Occupations by Sex
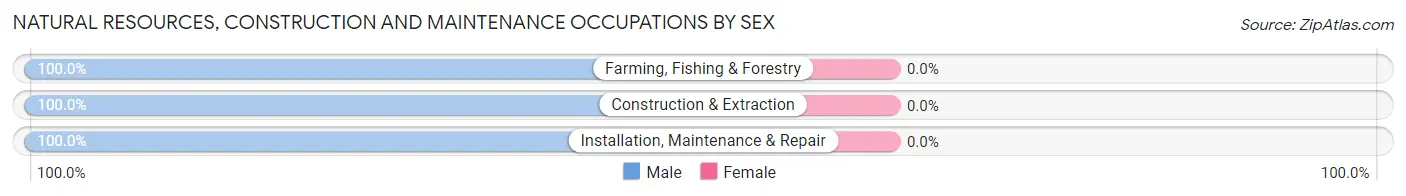
| Occupation | Male | Female |
| Farming, Fishing & Forestry | 3 (100.0%) | 0 (0.0%) |
| Construction & Extraction | 19 (100.0%) | 0 (0.0%) |
| Installation, Maintenance & Repair | 19 (100.0%) | 0 (0.0%) |
| Total (Category) | 41 (100.0%) | 0 (0.0%) |
| Total (Overall) | 133 (53.0%) | 118 (47.0%) |
Production, Transportation and Moving Occupations
The most common Production, Transportation and Moving occupations in Cove are , and Production (23 | 9.2%).
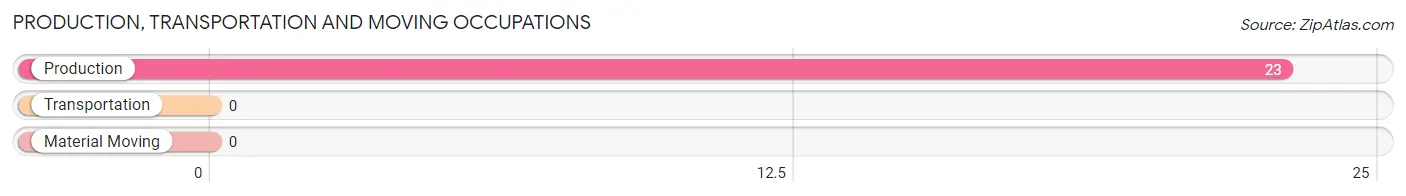
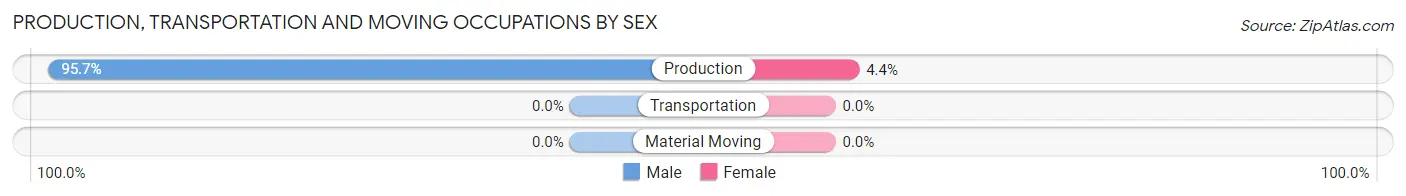
Production, Transportation and Moving Occupations by Sex
| Occupation | Male | Female |
| Production | 22 (95.7%) | 1 (4.3%) |
| Transportation | 0 (0.0%) | 0 (0.0%) |
| Material Moving | 0 (0.0%) | 0 (0.0%) |
| Total (Category) | 22 (95.7%) | 1 (4.3%) |
| Total (Overall) | 133 (53.0%) | 118 (47.0%) |
Employment Industries by Sex in Cove
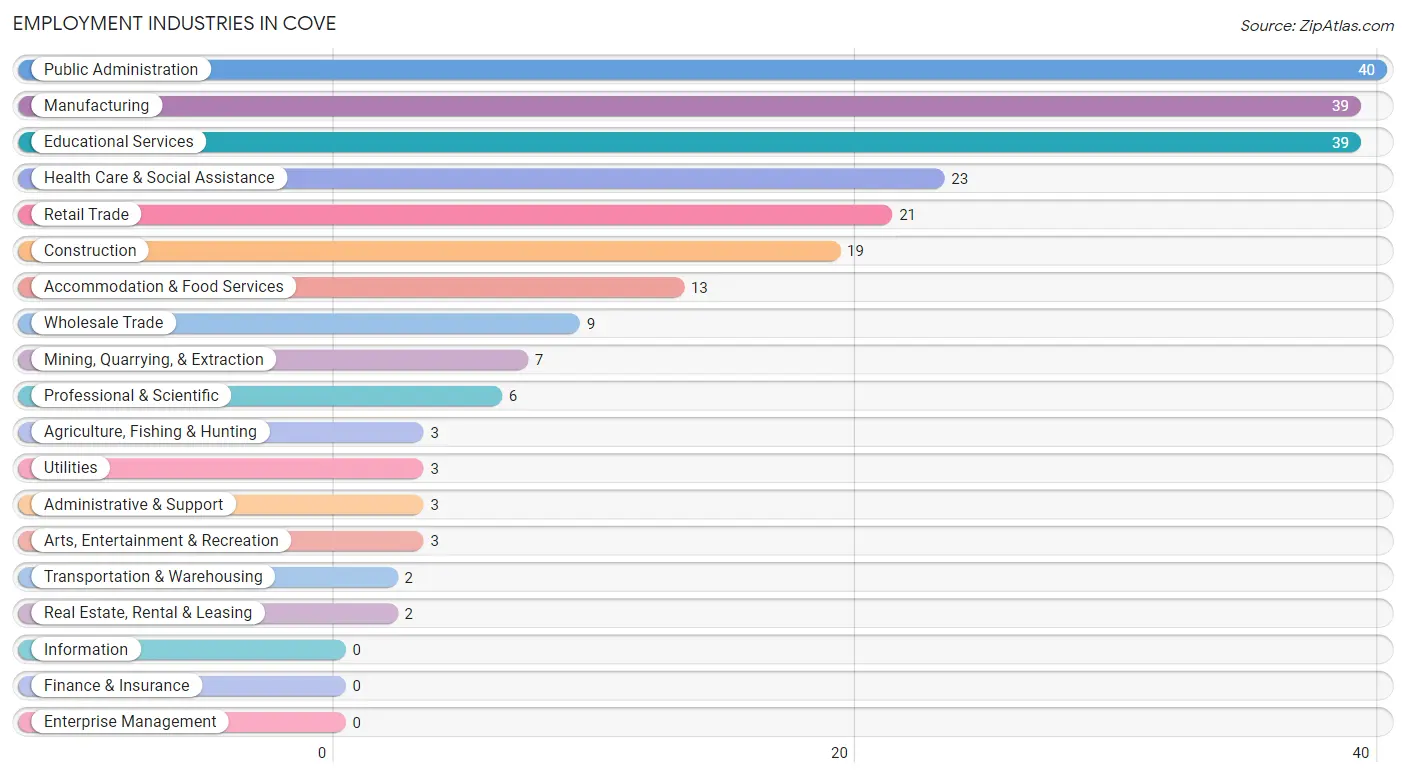
Employment Industries in Cove
The major employment industries in Cove include Public Administration (40 | 15.9%), Manufacturing (39 | 15.5%), Educational Services (39 | 15.5%), Health Care & Social Assistance (23 | 9.2%), and Retail Trade (21 | 8.4%).
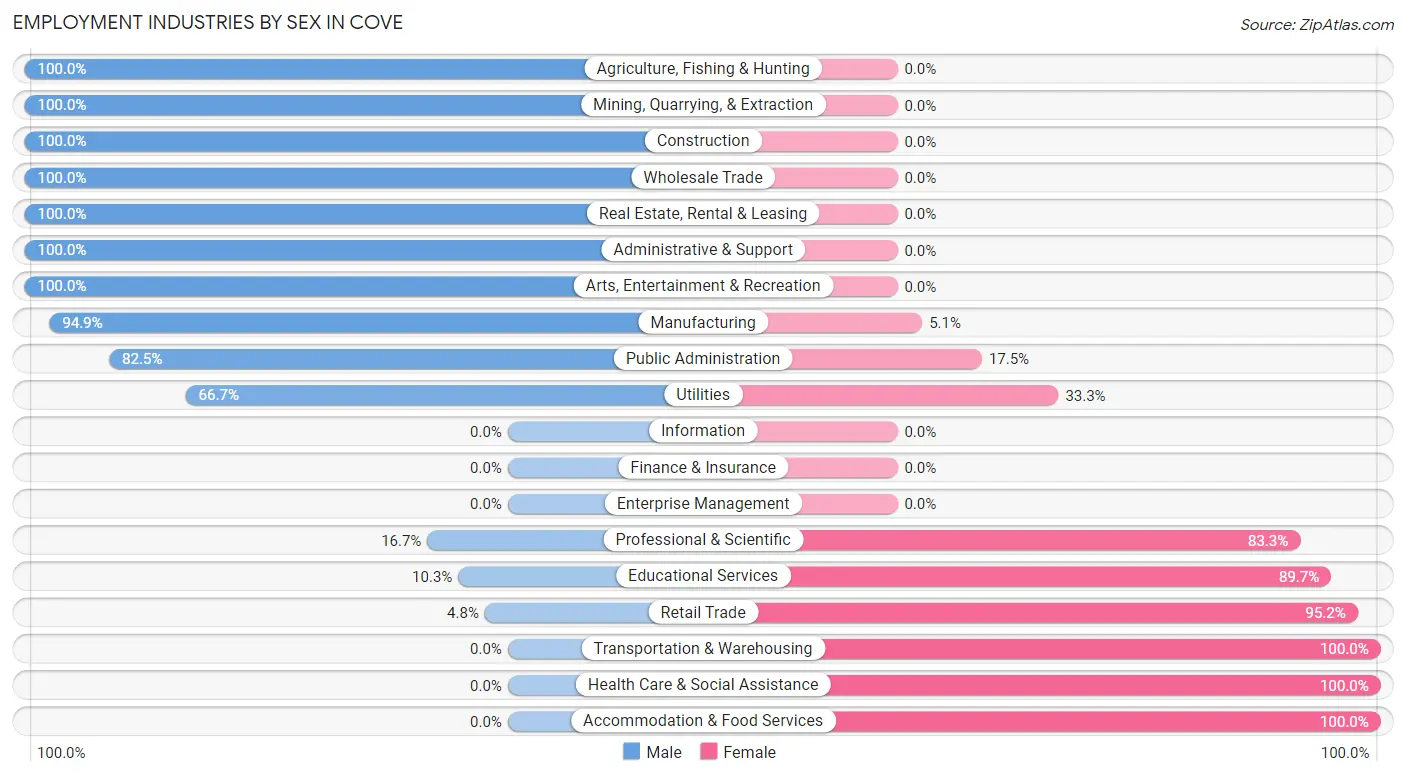
Employment Industries by Sex in Cove
The Cove industries that see more men than women are Agriculture, Fishing & Hunting (100.0%), Mining, Quarrying, & Extraction (100.0%), and Construction (100.0%), whereas the industries that tend to have a higher number of women are Transportation & Warehousing (100.0%), Health Care & Social Assistance (100.0%), and Accommodation & Food Services (100.0%).
| Industry | Male | Female |
| Agriculture, Fishing & Hunting | 3 (100.0%) | 0 (0.0%) |
| Mining, Quarrying, & Extraction | 7 (100.0%) | 0 (0.0%) |
| Construction | 19 (100.0%) | 0 (0.0%) |
| Manufacturing | 37 (94.9%) | 2 (5.1%) |
| Wholesale Trade | 9 (100.0%) | 0 (0.0%) |
| Retail Trade | 1 (4.8%) | 20 (95.2%) |
| Transportation & Warehousing | 0 (0.0%) | 2 (100.0%) |
| Utilities | 2 (66.7%) | 1 (33.3%) |
| Information | 0 (0.0%) | 0 (0.0%) |
| Finance & Insurance | 0 (0.0%) | 0 (0.0%) |
| Real Estate, Rental & Leasing | 2 (100.0%) | 0 (0.0%) |
| Professional & Scientific | 1 (16.7%) | 5 (83.3%) |
| Enterprise Management | 0 (0.0%) | 0 (0.0%) |
| Administrative & Support | 3 (100.0%) | 0 (0.0%) |
| Educational Services | 4 (10.3%) | 35 (89.7%) |
| Health Care & Social Assistance | 0 (0.0%) | 23 (100.0%) |
| Arts, Entertainment & Recreation | 3 (100.0%) | 0 (0.0%) |
| Accommodation & Food Services | 0 (0.0%) | 13 (100.0%) |
| Public Administration | 33 (82.5%) | 7 (17.5%) |
| Total | 133 (53.0%) | 118 (47.0%) |
Education in Cove
School Enrollment in Cove
The most common levels of schooling among the 118 students in Cove are high school (57 | 48.3%), elementary school (20 | 17.0%), and college / undergraduate (17 | 14.4%).
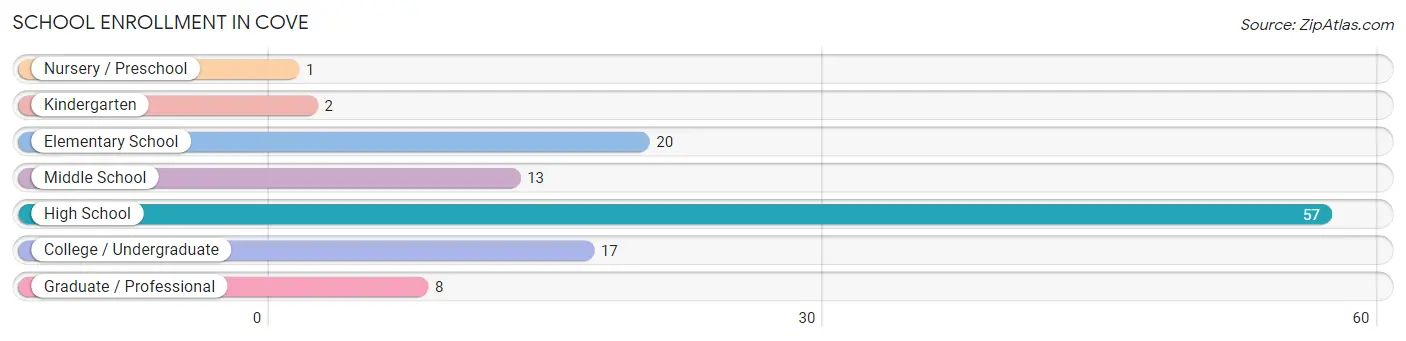
| School Level | # Students | % Students |
| Nursery / Preschool | 1 | 0.9% |
| Kindergarten | 2 | 1.7% |
| Elementary School | 20 | 17.0% |
| Middle School | 13 | 11.0% |
| High School | 57 | 48.3% |
| College / Undergraduate | 17 | 14.4% |
| Graduate / Professional | 8 | 6.8% |
| Total | 118 | 100.0% |
School Enrollment by Age by Funding Source in Cove
Out of a total of 118 students who are enrolled in schools in Cove, 8 (6.8%) attend a private institution, while the remaining 110 (93.2%) are enrolled in public schools. The age group of 3 to 4 year olds has the highest likelihood of being enrolled in private schools, with 1 (100.0% in the age bracket) enrolled. Conversely, the age group of 5 to 9 year old has the lowest likelihood of being enrolled in a private school, with 22 (100.0% in the age bracket) attending a public institution.
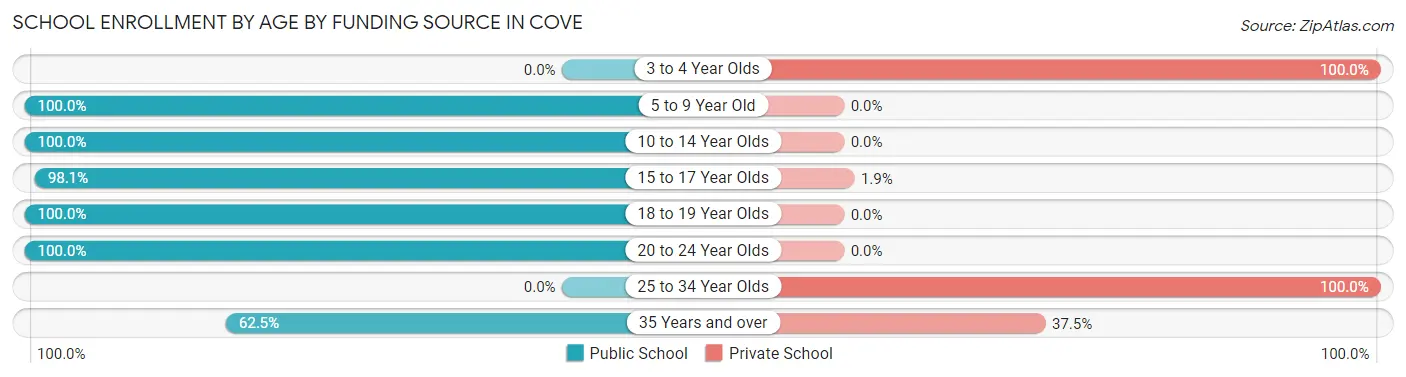
| Age Bracket | Public School | Private School |
| 3 to 4 Year Olds | 0 (0.0%) | 1 (100.0%) |
| 5 to 9 Year Old | 22 (100.0%) | 0 (0.0%) |
| 10 to 14 Year Olds | 18 (100.0%) | 0 (0.0%) |
| 15 to 17 Year Olds | 51 (98.1%) | 1 (1.9%) |
| 18 to 19 Year Olds | 3 (100.0%) | 0 (0.0%) |
| 20 to 24 Year Olds | 11 (100.0%) | 0 (0.0%) |
| 25 to 34 Year Olds | 0 (0.0%) | 3 (100.0%) |
| 35 Years and over | 5 (62.5%) | 3 (37.5%) |
| Total | 110 (93.2%) | 8 (6.8%) |
Educational Attainment by Field of Study in Cove
Bio, nature & agricultural (37 | 25.9%), science & technology (37 | 25.9%), psychology (21 | 14.7%), education (15 | 10.5%), and communications (13 | 9.1%) are the most common fields of study among 143 individuals in Cove who have obtained a bachelor's degree or higher.
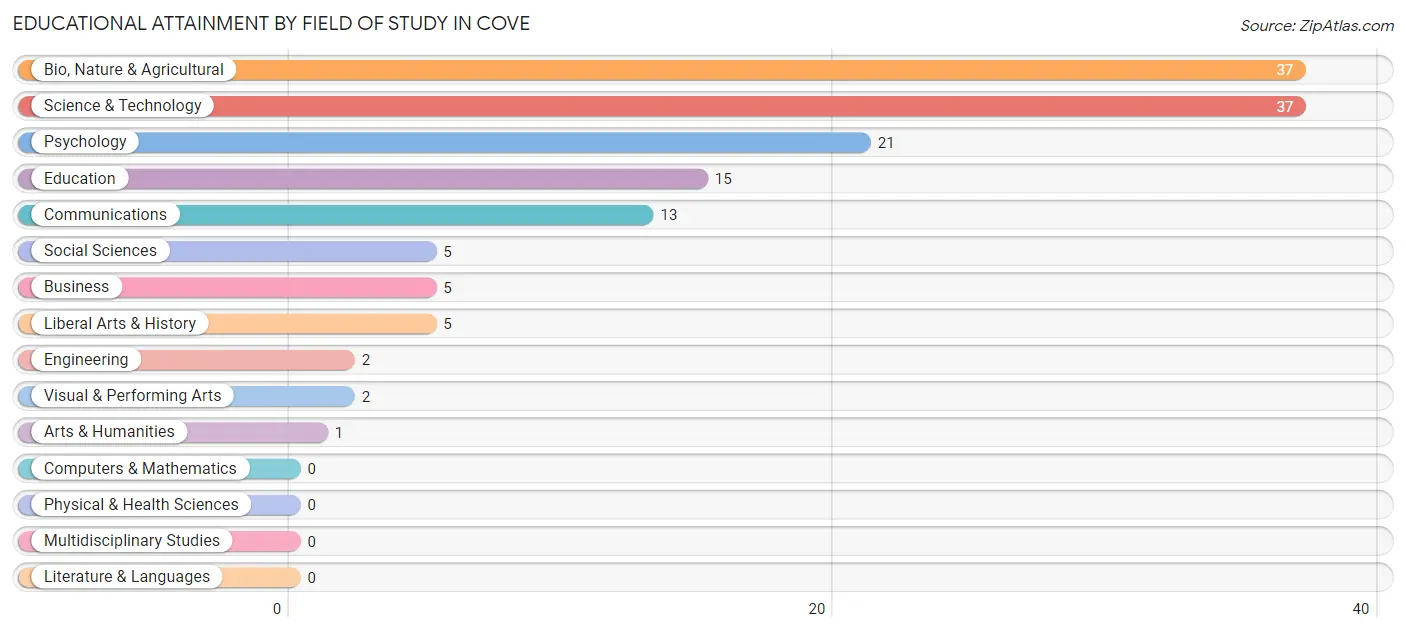
| Field of Study | # Graduates | % Graduates |
| Computers & Mathematics | 0 | 0.0% |
| Bio, Nature & Agricultural | 37 | 25.9% |
| Physical & Health Sciences | 0 | 0.0% |
| Psychology | 21 | 14.7% |
| Social Sciences | 5 | 3.5% |
| Engineering | 2 | 1.4% |
| Multidisciplinary Studies | 0 | 0.0% |
| Science & Technology | 37 | 25.9% |
| Business | 5 | 3.5% |
| Education | 15 | 10.5% |
| Literature & Languages | 0 | 0.0% |
| Liberal Arts & History | 5 | 3.5% |
| Visual & Performing Arts | 2 | 1.4% |
| Communications | 13 | 9.1% |
| Arts & Humanities | 1 | 0.7% |
| Total | 143 | 100.0% |
Transportation & Commute in Cove
Vehicle Availability by Sex in Cove
The most prevalent vehicle ownership categories in Cove are males with 3 vehicles (73, accounting for 54.9%) and females with 3 vehicles (67, making up 61.9%).
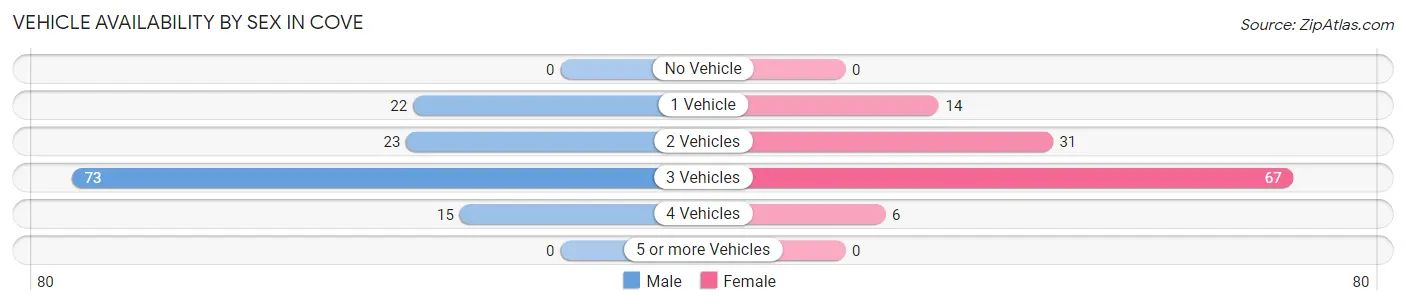
| Vehicles Available | Male | Female |
| No Vehicle | 0 (0.0%) | 0 (0.0%) |
| 1 Vehicle | 22 (16.5%) | 14 (11.9%) |
| 2 Vehicles | 23 (17.3%) | 31 (26.3%) |
| 3 Vehicles | 73 (54.9%) | 67 (56.8%) |
| 4 Vehicles | 15 (11.3%) | 6 (5.1%) |
| 5 or more Vehicles | 0 (0.0%) | 0 (0.0%) |
| Total | 133 (100.0%) | 118 (100.0%) |
Commute Time in Cove
The most frequently occuring commute durations in Cove are 20 to 24 minutes (61 commuters, 25.2%), 30 to 34 minutes (43 commuters, 17.8%), and 15 to 19 minutes (41 commuters, 16.9%).
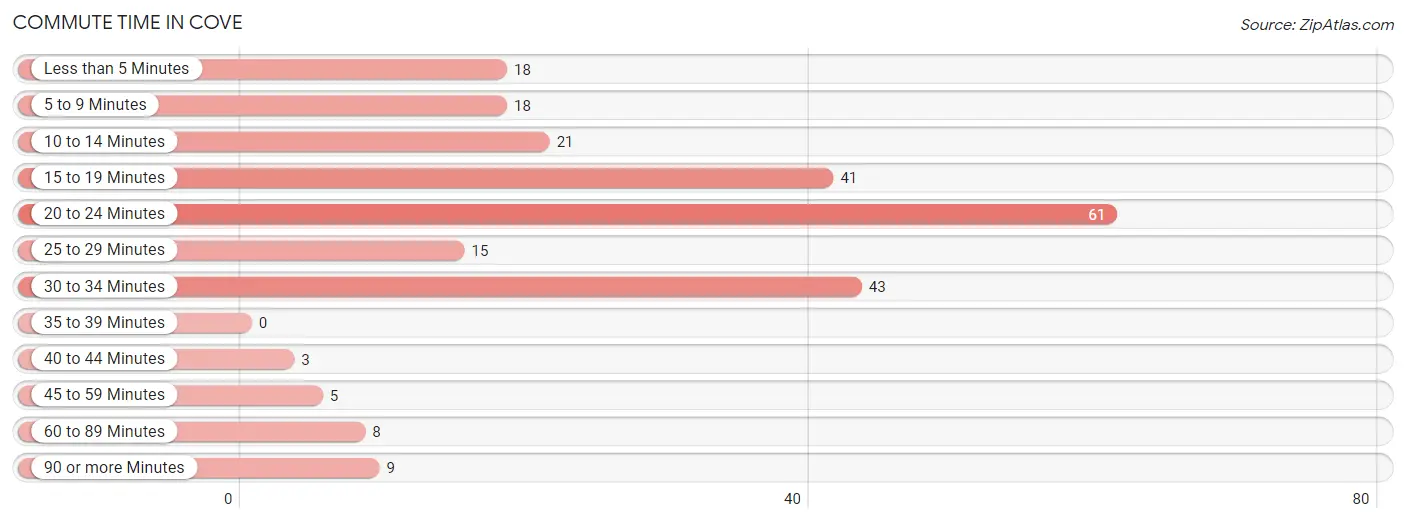
| Commute Time | # Commuters | % Commuters |
| Less than 5 Minutes | 18 | 7.4% |
| 5 to 9 Minutes | 18 | 7.4% |
| 10 to 14 Minutes | 21 | 8.7% |
| 15 to 19 Minutes | 41 | 16.9% |
| 20 to 24 Minutes | 61 | 25.2% |
| 25 to 29 Minutes | 15 | 6.2% |
| 30 to 34 Minutes | 43 | 17.8% |
| 35 to 39 Minutes | 0 | 0.0% |
| 40 to 44 Minutes | 3 | 1.2% |
| 45 to 59 Minutes | 5 | 2.1% |
| 60 to 89 Minutes | 8 | 3.3% |
| 90 or more Minutes | 9 | 3.7% |
Commute Time by Sex in Cove
The most common commute times in Cove are 20 to 24 minutes (34 commuters, 26.0%) for males and 30 to 34 minutes (37 commuters, 33.3%) for females.
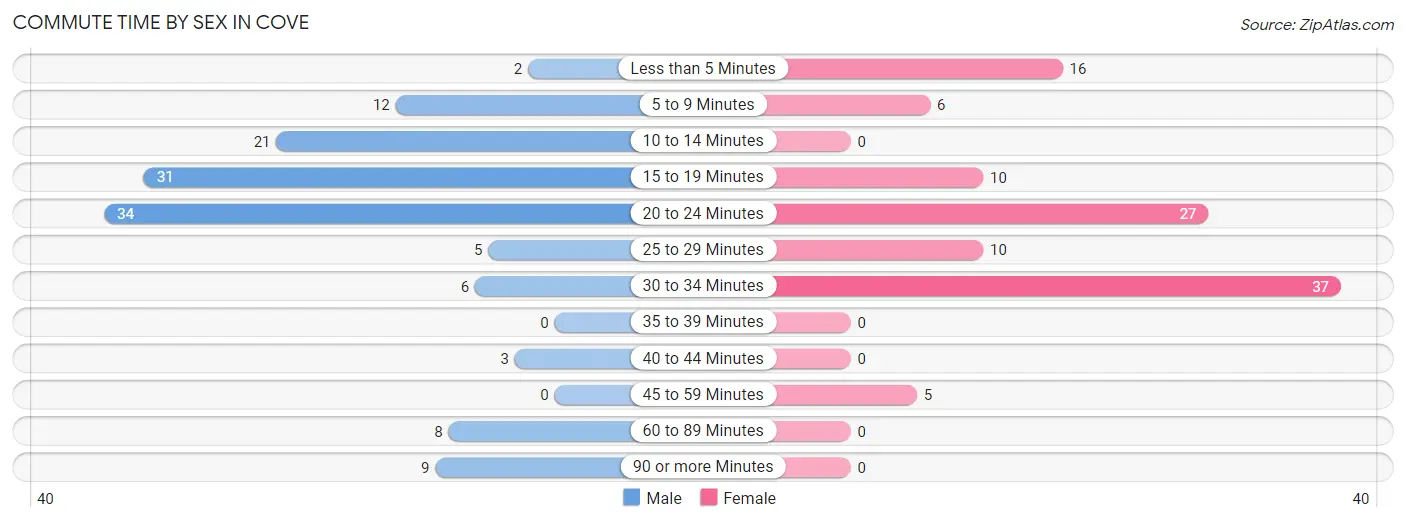
| Commute Time | Male | Female |
| Less than 5 Minutes | 2 (1.5%) | 16 (14.4%) |
| 5 to 9 Minutes | 12 (9.2%) | 6 (5.4%) |
| 10 to 14 Minutes | 21 (16.0%) | 0 (0.0%) |
| 15 to 19 Minutes | 31 (23.7%) | 10 (9.0%) |
| 20 to 24 Minutes | 34 (26.0%) | 27 (24.3%) |
| 25 to 29 Minutes | 5 (3.8%) | 10 (9.0%) |
| 30 to 34 Minutes | 6 (4.6%) | 37 (33.3%) |
| 35 to 39 Minutes | 0 (0.0%) | 0 (0.0%) |
| 40 to 44 Minutes | 3 (2.3%) | 0 (0.0%) |
| 45 to 59 Minutes | 0 (0.0%) | 5 (4.5%) |
| 60 to 89 Minutes | 8 (6.1%) | 0 (0.0%) |
| 90 or more Minutes | 9 (6.9%) | 0 (0.0%) |
Time of Departure to Work by Sex in Cove
The most frequent times of departure to work in Cove are 12:00 AM to 4:59 AM (40, 30.5%) for males and 9:00 AM to 9:59 AM (32, 28.8%) for females.

| Time of Departure | Male | Female |
| 12:00 AM to 4:59 AM | 40 (30.5%) | 10 (9.0%) |
| 5:00 AM to 5:29 AM | 3 (2.3%) | 0 (0.0%) |
| 5:30 AM to 5:59 AM | 3 (2.3%) | 4 (3.6%) |
| 6:00 AM to 6:29 AM | 26 (19.9%) | 2 (1.8%) |
| 6:30 AM to 6:59 AM | 16 (12.2%) | 24 (21.6%) |
| 7:00 AM to 7:29 AM | 25 (19.1%) | 2 (1.8%) |
| 7:30 AM to 7:59 AM | 7 (5.3%) | 16 (14.4%) |
| 8:00 AM to 8:29 AM | 0 (0.0%) | 0 (0.0%) |
| 8:30 AM to 8:59 AM | 0 (0.0%) | 13 (11.7%) |
| 9:00 AM to 9:59 AM | 2 (1.5%) | 32 (28.8%) |
| 10:00 AM to 10:59 AM | 0 (0.0%) | 0 (0.0%) |
| 11:00 AM to 11:59 AM | 0 (0.0%) | 0 (0.0%) |
| 12:00 PM to 3:59 PM | 0 (0.0%) | 0 (0.0%) |
| 4:00 PM to 11:59 PM | 9 (6.9%) | 8 (7.2%) |
| Total | 131 (100.0%) | 111 (100.0%) |
Housing Occupancy in Cove
Occupancy by Ownership in Cove
Of the total 315 dwellings in Cove, owner-occupied units account for 243 (77.1%), while renter-occupied units make up 72 (22.9%).
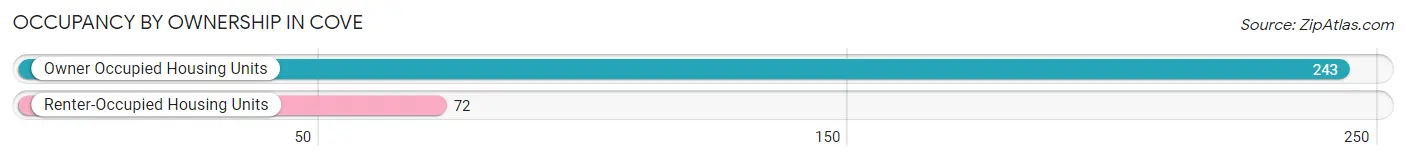
| Occupancy | # Housing Units | % Housing Units |
| Owner Occupied Housing Units | 243 | 77.1% |
| Renter-Occupied Housing Units | 72 | 22.9% |
| Total Occupied Housing Units | 315 | 100.0% |
Occupancy by Household Size in Cove
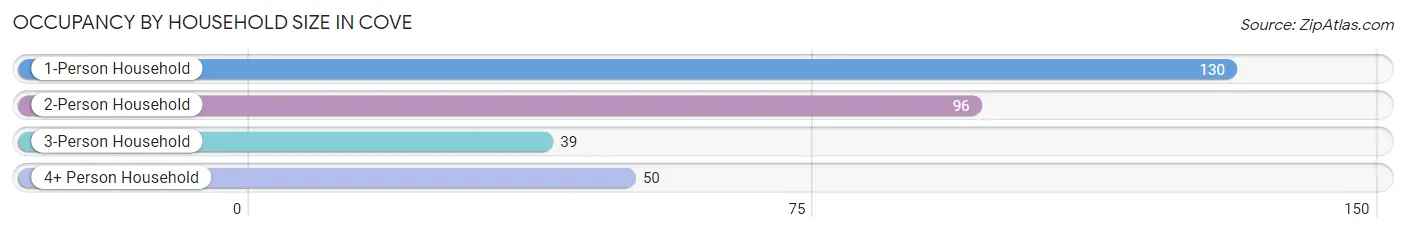
| Household Size | # Housing Units | % Housing Units |
| 1-Person Household | 130 | 41.3% |
| 2-Person Household | 96 | 30.5% |
| 3-Person Household | 39 | 12.4% |
| 4+ Person Household | 50 | 15.9% |
| Total Housing Units | 315 | 100.0% |
Occupancy by Ownership by Household Size in Cove
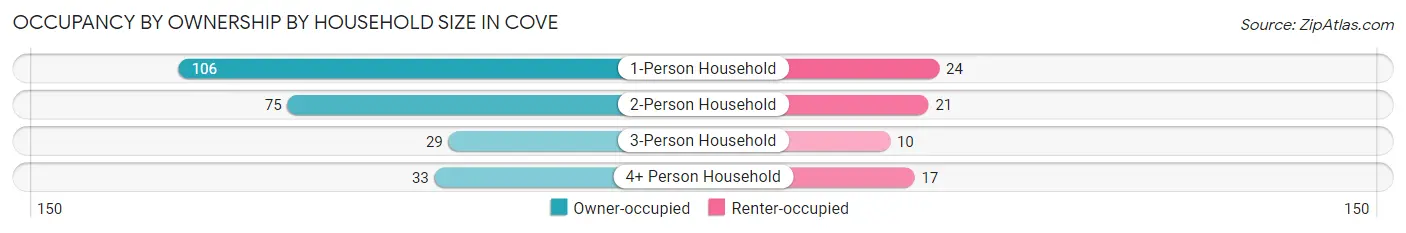
| Household Size | Owner-occupied | Renter-occupied |
| 1-Person Household | 106 (81.5%) | 24 (18.5%) |
| 2-Person Household | 75 (78.1%) | 21 (21.9%) |
| 3-Person Household | 29 (74.4%) | 10 (25.6%) |
| 4+ Person Household | 33 (66.0%) | 17 (34.0%) |
| Total Housing Units | 243 (77.1%) | 72 (22.9%) |
Occupancy by Educational Attainment in Cove
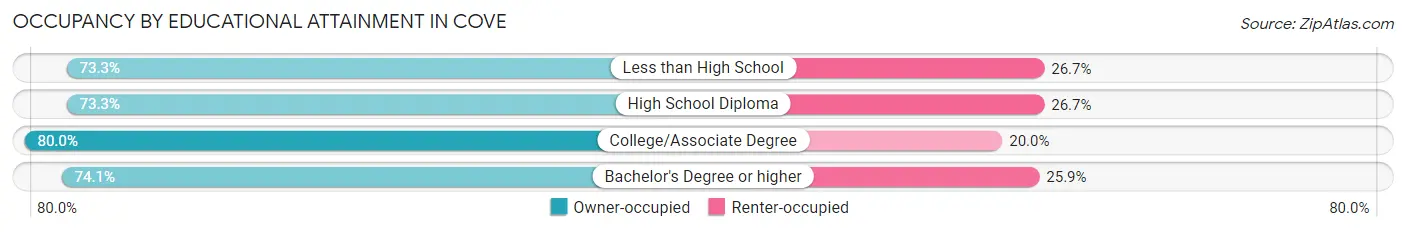
| Household Size | Owner-occupied | Renter-occupied |
| Less than High School | 11 (73.3%) | 4 (26.7%) |
| High School Diploma | 33 (73.3%) | 12 (26.7%) |
| College/Associate Degree | 136 (80.0%) | 34 (20.0%) |
| Bachelor's Degree or higher | 63 (74.1%) | 22 (25.9%) |
Occupancy by Age of Householder in Cove
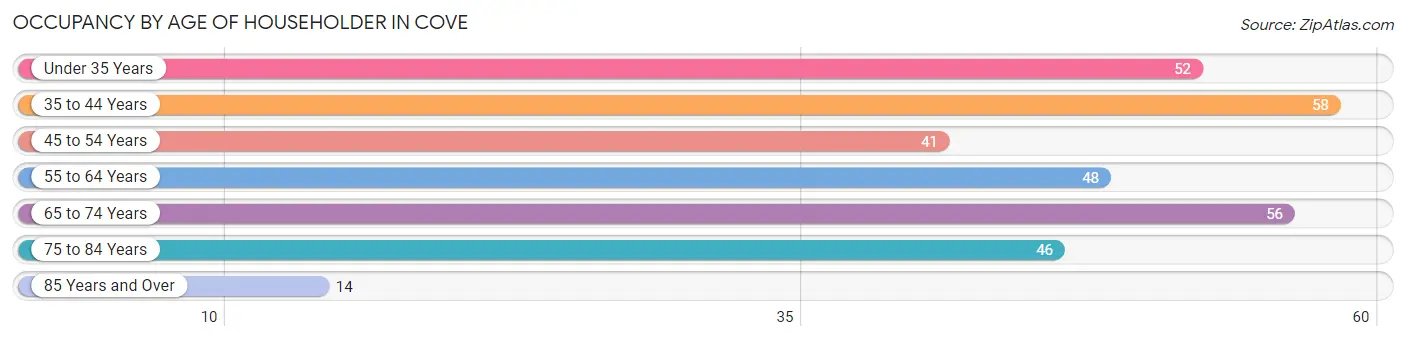
| Age Bracket | # Households | % Households |
| Under 35 Years | 52 | 16.5% |
| 35 to 44 Years | 58 | 18.4% |
| 45 to 54 Years | 41 | 13.0% |
| 55 to 64 Years | 48 | 15.2% |
| 65 to 74 Years | 56 | 17.8% |
| 75 to 84 Years | 46 | 14.6% |
| 85 Years and Over | 14 | 4.4% |
| Total | 315 | 100.0% |
Housing Finances in Cove
Median Income by Occupancy in Cove
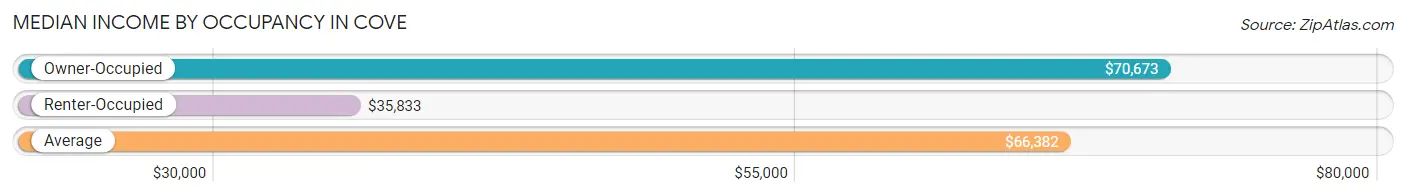
| Occupancy Type | # Households | Median Income |
| Owner-Occupied | 243 (77.1%) | $70,673 |
| Renter-Occupied | 72 (22.9%) | $35,833 |
| Average | 315 (100.0%) | $66,382 |
Occupancy by Householder Income Bracket in Cove
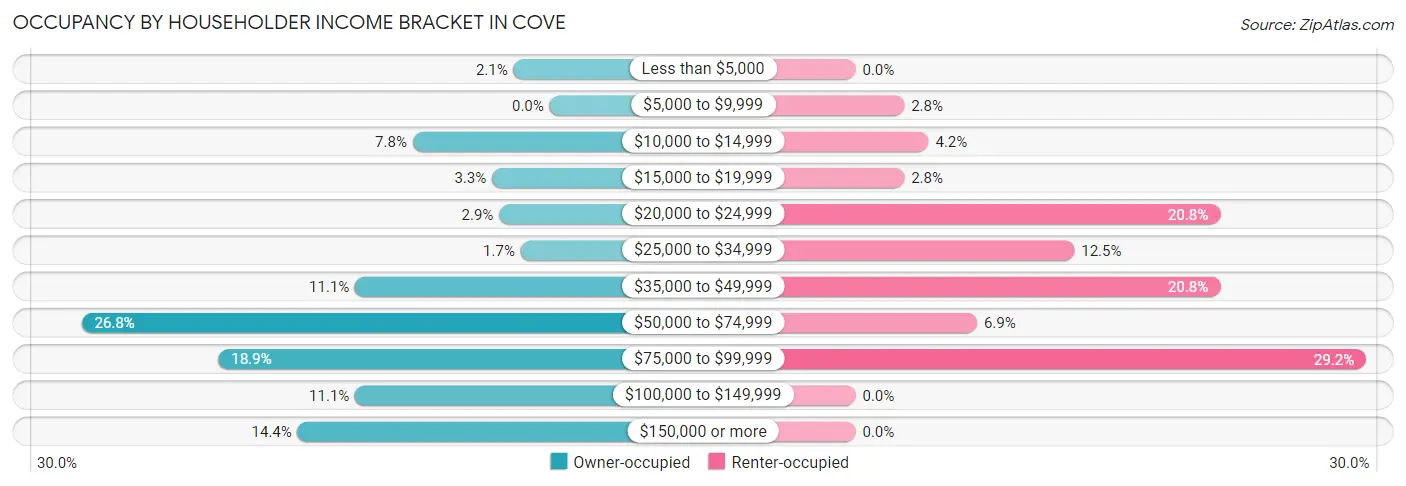
| Income Bracket | Owner-occupied | Renter-occupied |
| Less than $5,000 | 5 (2.1%) | 0 (0.0%) |
| $5,000 to $9,999 | 0 (0.0%) | 2 (2.8%) |
| $10,000 to $14,999 | 19 (7.8%) | 3 (4.2%) |
| $15,000 to $19,999 | 8 (3.3%) | 2 (2.8%) |
| $20,000 to $24,999 | 7 (2.9%) | 15 (20.8%) |
| $25,000 to $34,999 | 4 (1.7%) | 9 (12.5%) |
| $35,000 to $49,999 | 27 (11.1%) | 15 (20.8%) |
| $50,000 to $74,999 | 65 (26.8%) | 5 (6.9%) |
| $75,000 to $99,999 | 46 (18.9%) | 21 (29.2%) |
| $100,000 to $149,999 | 27 (11.1%) | 0 (0.0%) |
| $150,000 or more | 35 (14.4%) | 0 (0.0%) |
| Total | 243 (100.0%) | 72 (100.0%) |
Monthly Housing Cost Tiers in Cove
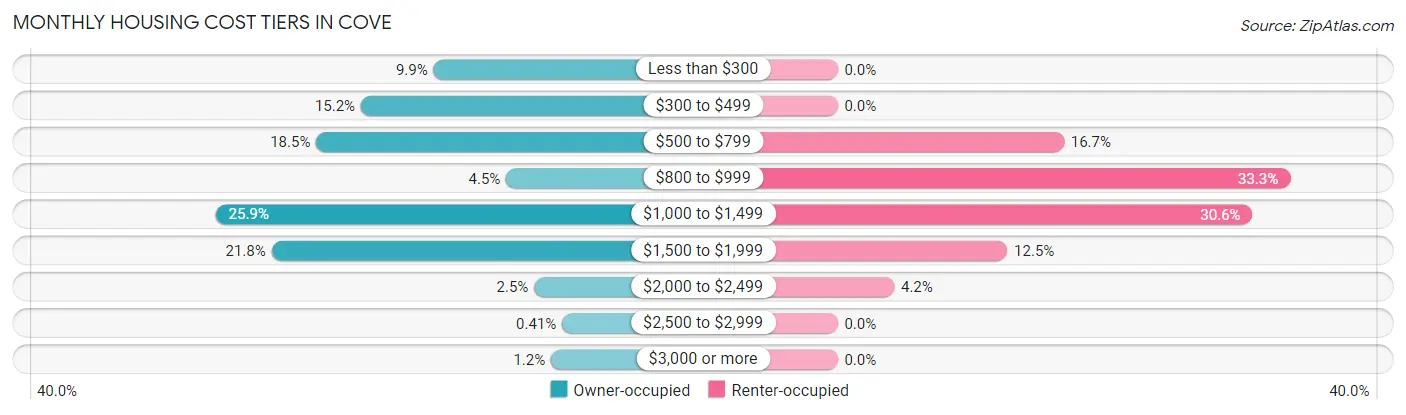
| Monthly Cost | Owner-occupied | Renter-occupied |
| Less than $300 | 24 (9.9%) | 0 (0.0%) |
| $300 to $499 | 37 (15.2%) | 0 (0.0%) |
| $500 to $799 | 45 (18.5%) | 12 (16.7%) |
| $800 to $999 | 11 (4.5%) | 24 (33.3%) |
| $1,000 to $1,499 | 63 (25.9%) | 22 (30.6%) |
| $1,500 to $1,999 | 53 (21.8%) | 9 (12.5%) |
| $2,000 to $2,499 | 6 (2.5%) | 3 (4.2%) |
| $2,500 to $2,999 | 1 (0.4%) | 0 (0.0%) |
| $3,000 or more | 3 (1.2%) | 0 (0.0%) |
| Total | 243 (100.0%) | 72 (100.0%) |
Physical Housing Characteristics in Cove
Housing Structures in Cove
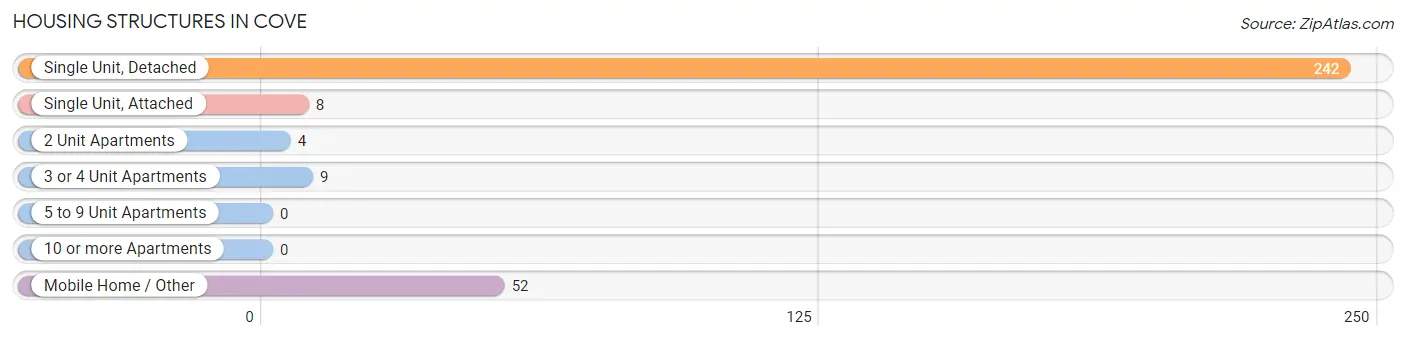
| Structure Type | # Housing Units | % Housing Units |
| Single Unit, Detached | 242 | 76.8% |
| Single Unit, Attached | 8 | 2.5% |
| 2 Unit Apartments | 4 | 1.3% |
| 3 or 4 Unit Apartments | 9 | 2.9% |
| 5 to 9 Unit Apartments | 0 | 0.0% |
| 10 or more Apartments | 0 | 0.0% |
| Mobile Home / Other | 52 | 16.5% |
| Total | 315 | 100.0% |
Housing Structures by Occupancy in Cove
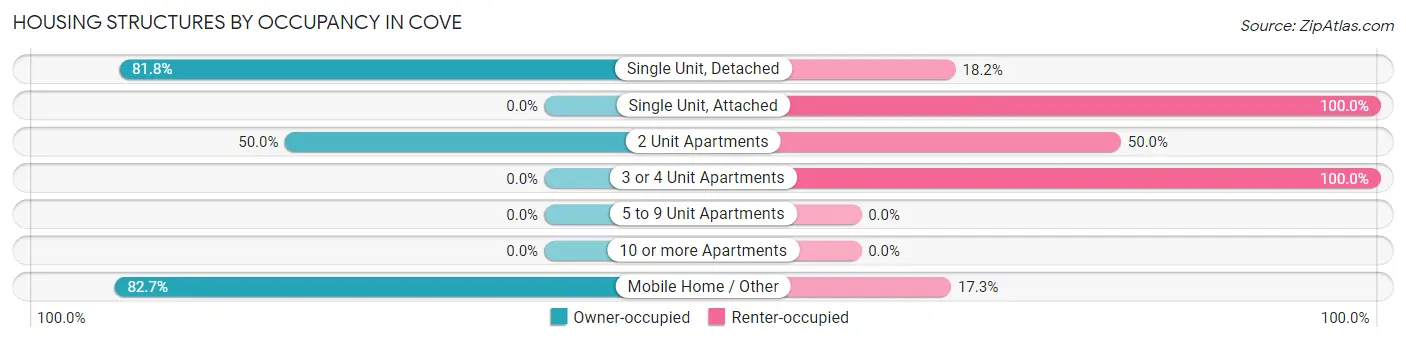
| Structure Type | Owner-occupied | Renter-occupied |
| Single Unit, Detached | 198 (81.8%) | 44 (18.2%) |
| Single Unit, Attached | 0 (0.0%) | 8 (100.0%) |
| 2 Unit Apartments | 2 (50.0%) | 2 (50.0%) |
| 3 or 4 Unit Apartments | 0 (0.0%) | 9 (100.0%) |
| 5 to 9 Unit Apartments | 0 (0.0%) | 0 (0.0%) |
| 10 or more Apartments | 0 (0.0%) | 0 (0.0%) |
| Mobile Home / Other | 43 (82.7%) | 9 (17.3%) |
| Total | 243 (77.1%) | 72 (22.9%) |
Housing Structures by Number of Rooms in Cove
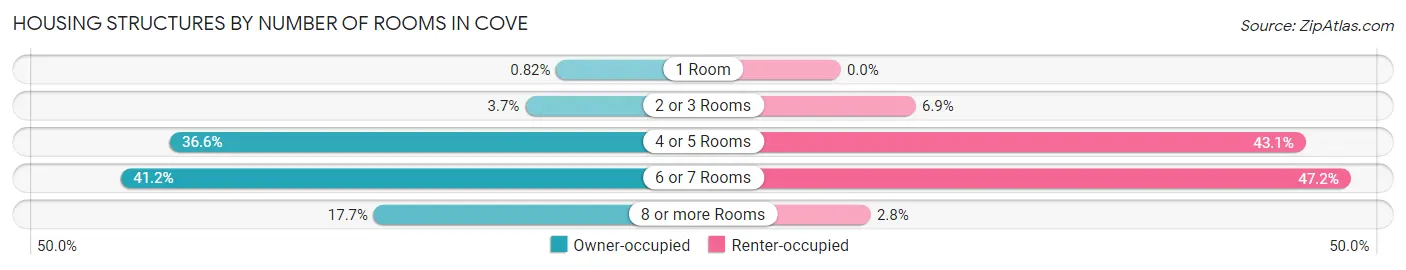
| Number of Rooms | Owner-occupied | Renter-occupied |
| 1 Room | 2 (0.8%) | 0 (0.0%) |
| 2 or 3 Rooms | 9 (3.7%) | 5 (6.9%) |
| 4 or 5 Rooms | 89 (36.6%) | 31 (43.1%) |
| 6 or 7 Rooms | 100 (41.1%) | 34 (47.2%) |
| 8 or more Rooms | 43 (17.7%) | 2 (2.8%) |
| Total | 243 (100.0%) | 72 (100.0%) |
Housing Structure by Heating Type in Cove
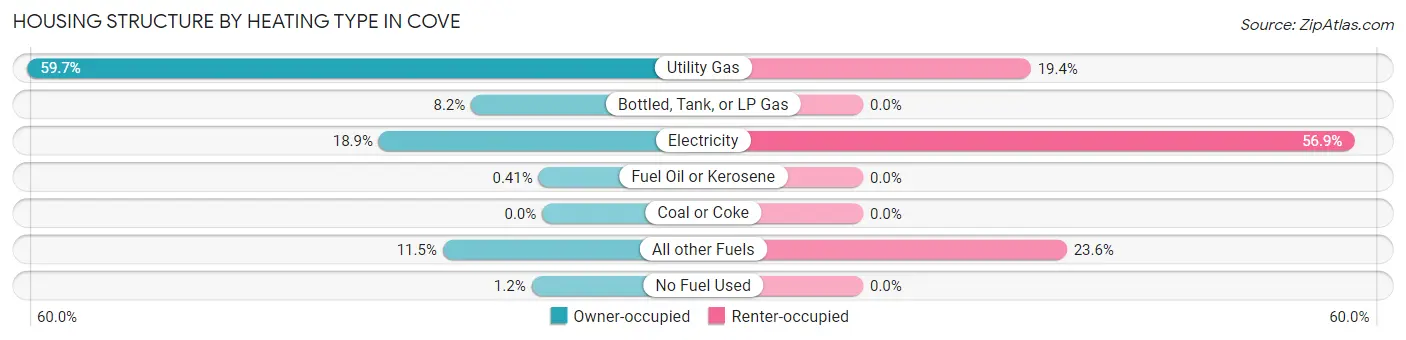
| Heating Type | Owner-occupied | Renter-occupied |
| Utility Gas | 145 (59.7%) | 14 (19.4%) |
| Bottled, Tank, or LP Gas | 20 (8.2%) | 0 (0.0%) |
| Electricity | 46 (18.9%) | 41 (56.9%) |
| Fuel Oil or Kerosene | 1 (0.4%) | 0 (0.0%) |
| Coal or Coke | 0 (0.0%) | 0 (0.0%) |
| All other Fuels | 28 (11.5%) | 17 (23.6%) |
| No Fuel Used | 3 (1.2%) | 0 (0.0%) |
| Total | 243 (100.0%) | 72 (100.0%) |
Household Vehicle Usage in Cove

| Vehicles per Household | Owner-occupied | Renter-occupied |
| No Vehicle | 3 (1.2%) | 0 (0.0%) |
| 1 Vehicle | 50 (20.6%) | 31 (43.1%) |
| 2 Vehicles | 90 (37.0%) | 15 (20.8%) |
| 3 or more Vehicles | 100 (41.1%) | 26 (36.1%) |
| Total | 243 (100.0%) | 72 (100.0%) |
Real Estate & Mortgages in Cove
Real Estate and Mortgage Overview in Cove
| Characteristic | Without Mortgage | With Mortgage |
| Housing Units | 105 | 138 |
| Median Property Value | $233,800 | $208,300 |
| Median Household Income | $67,031 | $22 |
| Monthly Housing Costs | $479 | $3 |
| Real Estate Taxes | $1,750 | $0 |
Property Value by Mortgage Status in Cove
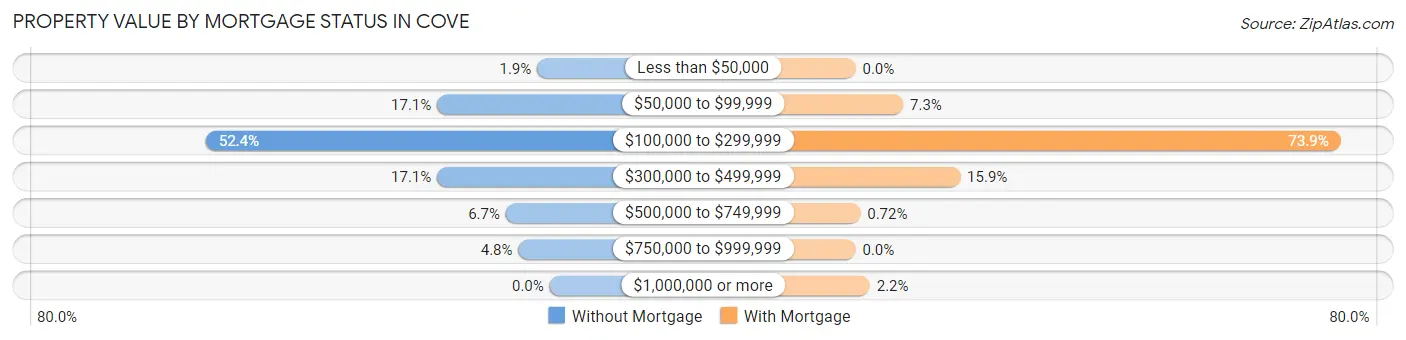
| Property Value | Without Mortgage | With Mortgage |
| Less than $50,000 | 2 (1.9%) | 0 (0.0%) |
| $50,000 to $99,999 | 18 (17.1%) | 10 (7.2%) |
| $100,000 to $299,999 | 55 (52.4%) | 102 (73.9%) |
| $300,000 to $499,999 | 18 (17.1%) | 22 (15.9%) |
| $500,000 to $749,999 | 7 (6.7%) | 1 (0.7%) |
| $750,000 to $999,999 | 5 (4.8%) | 0 (0.0%) |
| $1,000,000 or more | 0 (0.0%) | 3 (2.2%) |
| Total | 105 (100.0%) | 138 (100.0%) |
Household Income by Mortgage Status in Cove
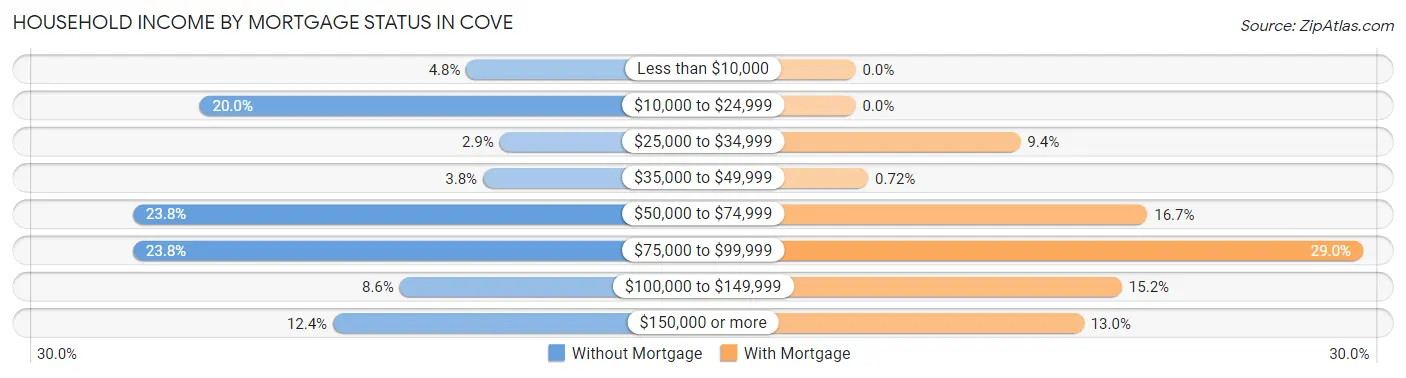
| Household Income | Without Mortgage | With Mortgage |
| Less than $10,000 | 5 (4.8%) | 0 (0.0%) |
| $10,000 to $24,999 | 21 (20.0%) | 0 (0.0%) |
| $25,000 to $34,999 | 3 (2.9%) | 13 (9.4%) |
| $35,000 to $49,999 | 4 (3.8%) | 1 (0.7%) |
| $50,000 to $74,999 | 25 (23.8%) | 23 (16.7%) |
| $75,000 to $99,999 | 25 (23.8%) | 40 (29.0%) |
| $100,000 to $149,999 | 9 (8.6%) | 21 (15.2%) |
| $150,000 or more | 13 (12.4%) | 18 (13.0%) |
| Total | 105 (100.0%) | 138 (100.0%) |
Property Value to Household Income Ratio in Cove
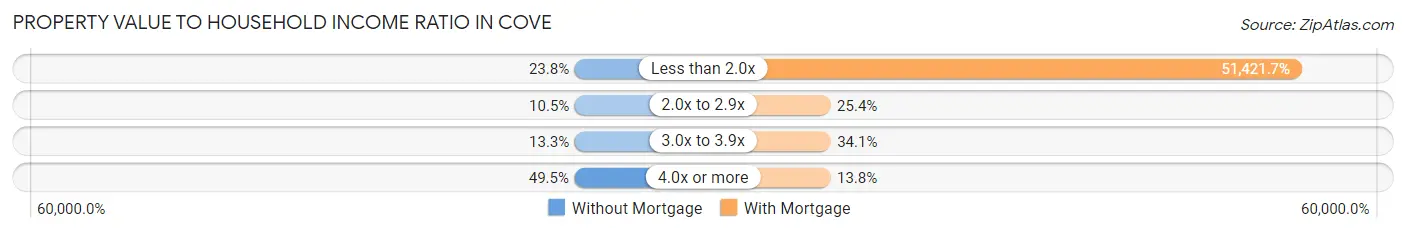
| Value-to-Income Ratio | Without Mortgage | With Mortgage |
| Less than 2.0x | 25 (23.8%) | 70,962 (51,421.7%) |
| 2.0x to 2.9x | 11 (10.5%) | 35 (25.4%) |
| 3.0x to 3.9x | 14 (13.3%) | 47 (34.1%) |
| 4.0x or more | 52 (49.5%) | 19 (13.8%) |
| Total | 105 (100.0%) | 138 (100.0%) |
Real Estate Taxes by Mortgage Status in Cove
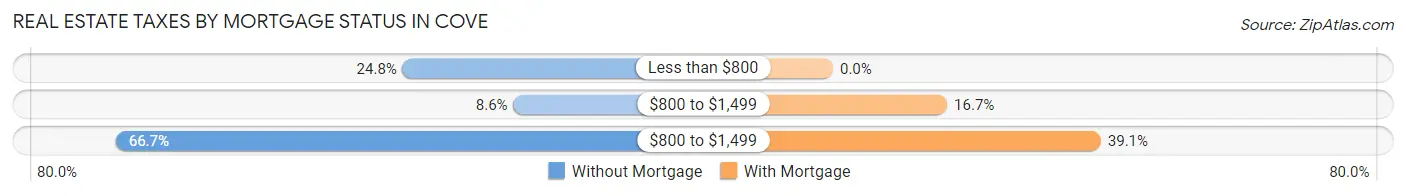
| Property Taxes | Without Mortgage | With Mortgage |
| Less than $800 | 26 (24.8%) | 0 (0.0%) |
| $800 to $1,499 | 9 (8.6%) | 23 (16.7%) |
| $800 to $1,499 | 70 (66.7%) | 54 (39.1%) |
| Total | 105 (100.0%) | 138 (100.0%) |
Health & Disability in Cove
Health Insurance Coverage by Age in Cove
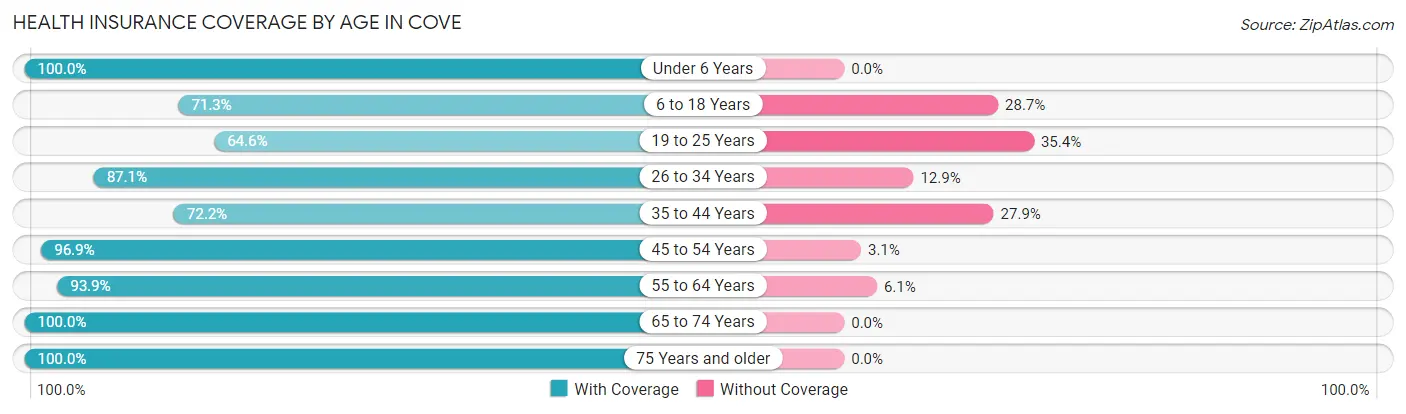
| Age Bracket | With Coverage | Without Coverage |
| Under 6 Years | 9 (100.0%) | 0 (0.0%) |
| 6 to 18 Years | 92 (71.3%) | 37 (28.7%) |
| 19 to 25 Years | 53 (64.6%) | 29 (35.4%) |
| 26 to 34 Years | 27 (87.1%) | 4 (12.9%) |
| 35 to 44 Years | 57 (72.2%) | 22 (27.9%) |
| 45 to 54 Years | 93 (96.9%) | 3 (3.1%) |
| 55 to 64 Years | 77 (93.9%) | 5 (6.1%) |
| 65 to 74 Years | 90 (100.0%) | 0 (0.0%) |
| 75 Years and older | 78 (100.0%) | 0 (0.0%) |
| Total | 576 (85.2%) | 100 (14.8%) |
Health Insurance Coverage by Citizenship Status in Cove
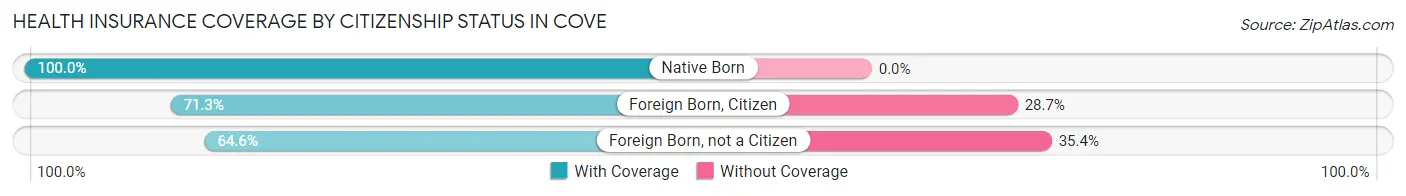
| Citizenship Status | With Coverage | Without Coverage |
| Native Born | 9 (100.0%) | 0 (0.0%) |
| Foreign Born, Citizen | 92 (71.3%) | 37 (28.7%) |
| Foreign Born, not a Citizen | 53 (64.6%) | 29 (35.4%) |
Health Insurance Coverage by Household Income in Cove
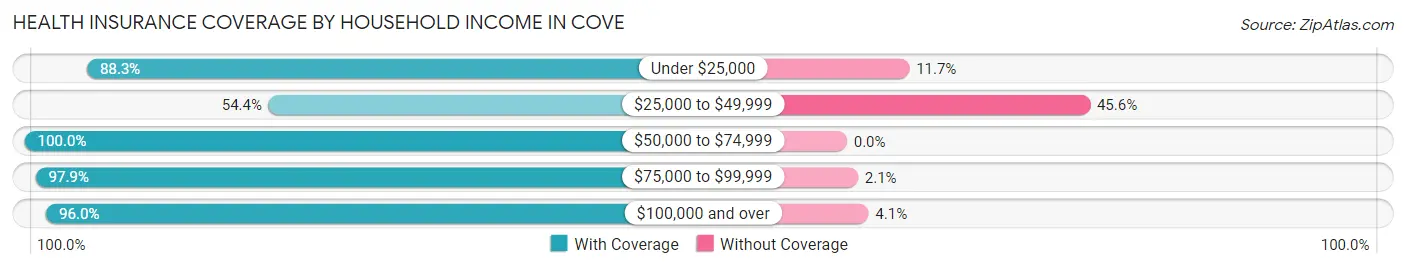
| Household Income | With Coverage | Without Coverage |
| Under $25,000 | 68 (88.3%) | 9 (11.7%) |
| $25,000 to $49,999 | 98 (54.4%) | 82 (45.6%) |
| $50,000 to $74,999 | 126 (100.0%) | 0 (0.0%) |
| $75,000 to $99,999 | 142 (97.9%) | 3 (2.1%) |
| $100,000 and over | 142 (96.0%) | 6 (4.1%) |
Public vs Private Health Insurance Coverage by Age in Cove
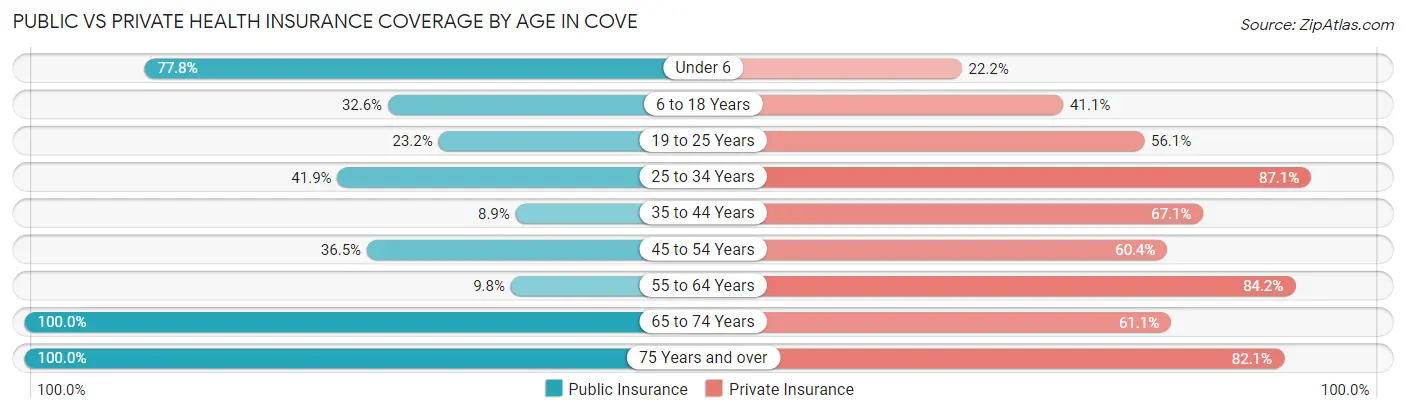
| Age Bracket | Public Insurance | Private Insurance |
| Under 6 | 7 (77.8%) | 2 (22.2%) |
| 6 to 18 Years | 42 (32.6%) | 53 (41.1%) |
| 19 to 25 Years | 19 (23.2%) | 46 (56.1%) |
| 25 to 34 Years | 13 (41.9%) | 27 (87.1%) |
| 35 to 44 Years | 7 (8.9%) | 53 (67.1%) |
| 45 to 54 Years | 35 (36.5%) | 58 (60.4%) |
| 55 to 64 Years | 8 (9.8%) | 69 (84.2%) |
| 65 to 74 Years | 90 (100.0%) | 55 (61.1%) |
| 75 Years and over | 78 (100.0%) | 64 (82.1%) |
| Total | 299 (44.2%) | 427 (63.2%) |
Disability Status by Sex by Age in Cove
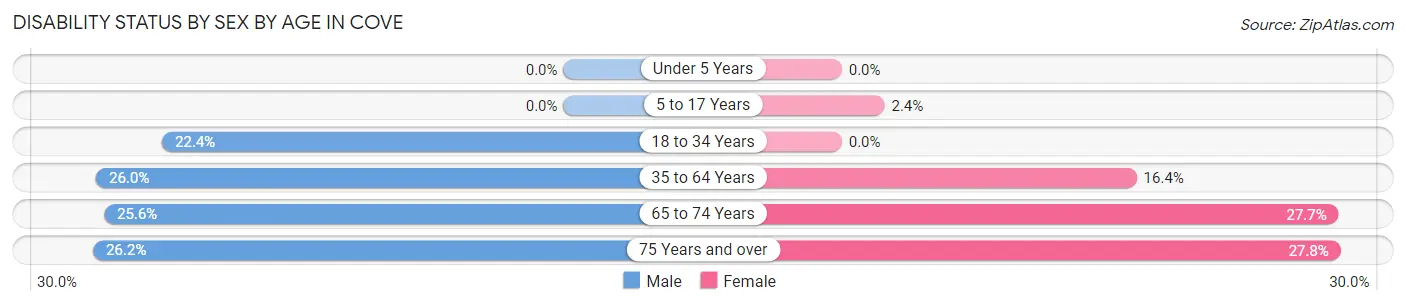
| Age Bracket | Male | Female |
| Under 5 Years | 0 (0.0%) | 0 (0.0%) |
| 5 to 17 Years | 0 (0.0%) | 1 (2.4%) |
| 18 to 34 Years | 19 (22.4%) | 0 (0.0%) |
| 35 to 64 Years | 32 (26.0%) | 22 (16.4%) |
| 65 to 74 Years | 11 (25.6%) | 13 (27.7%) |
| 75 Years and over | 11 (26.2%) | 10 (27.8%) |
Disability Class by Sex by Age in Cove
Disability Class: Hearing Difficulty
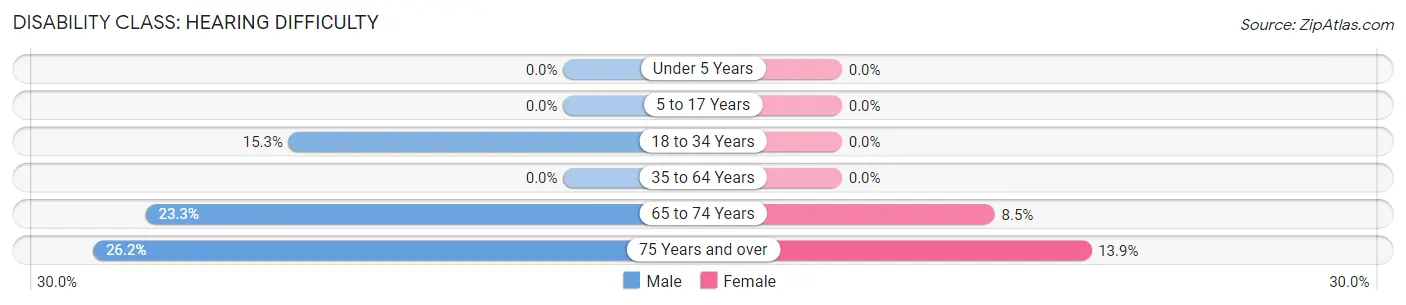
| Age Bracket | Male | Female |
| Under 5 Years | 0 (0.0%) | 0 (0.0%) |
| 5 to 17 Years | 0 (0.0%) | 0 (0.0%) |
| 18 to 34 Years | 13 (15.3%) | 0 (0.0%) |
| 35 to 64 Years | 0 (0.0%) | 0 (0.0%) |
| 65 to 74 Years | 10 (23.3%) | 4 (8.5%) |
| 75 Years and over | 11 (26.2%) | 5 (13.9%) |
Disability Class: Vision Difficulty
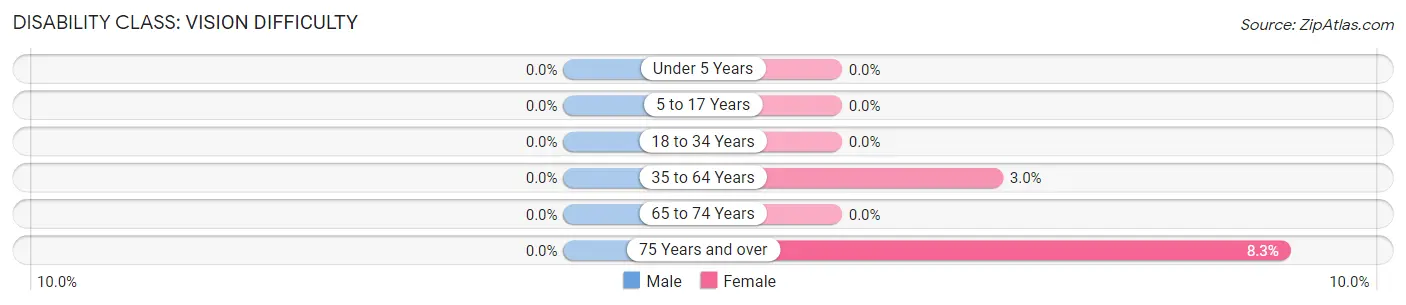
| Age Bracket | Male | Female |
| Under 5 Years | 0 (0.0%) | 0 (0.0%) |
| 5 to 17 Years | 0 (0.0%) | 0 (0.0%) |
| 18 to 34 Years | 0 (0.0%) | 0 (0.0%) |
| 35 to 64 Years | 0 (0.0%) | 4 (3.0%) |
| 65 to 74 Years | 0 (0.0%) | 0 (0.0%) |
| 75 Years and over | 0 (0.0%) | 3 (8.3%) |
Disability Class: Cognitive Difficulty
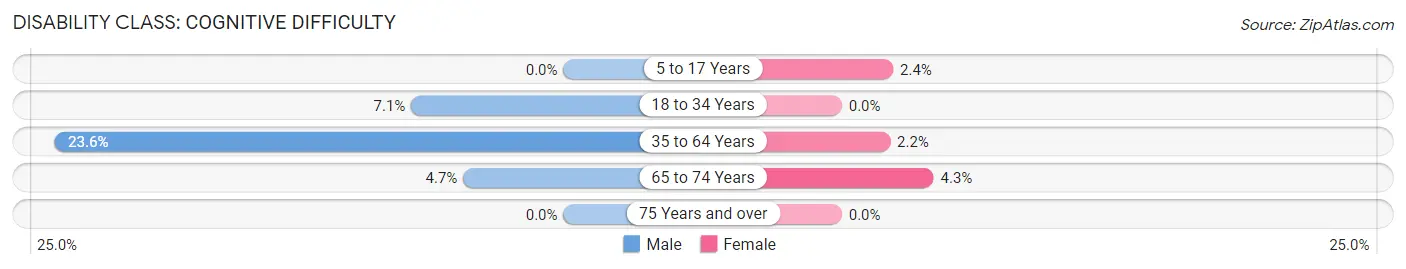
| Age Bracket | Male | Female |
| 5 to 17 Years | 0 (0.0%) | 1 (2.4%) |
| 18 to 34 Years | 6 (7.1%) | 0 (0.0%) |
| 35 to 64 Years | 29 (23.6%) | 3 (2.2%) |
| 65 to 74 Years | 2 (4.6%) | 2 (4.3%) |
| 75 Years and over | 0 (0.0%) | 0 (0.0%) |
Disability Class: Ambulatory Difficulty
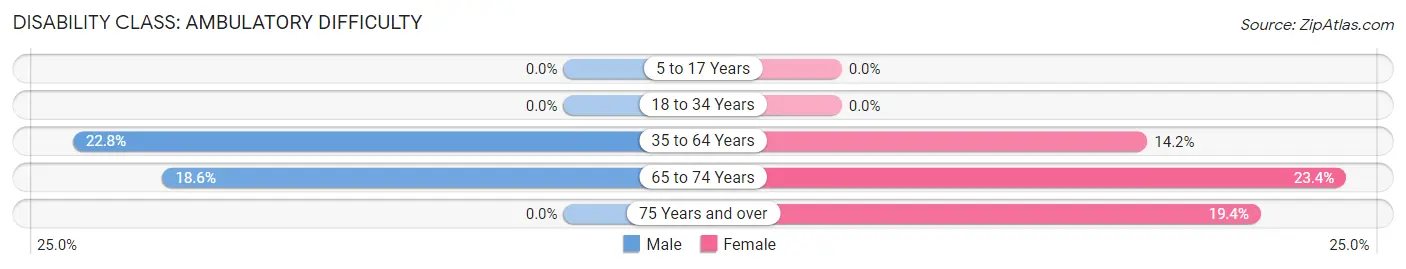
| Age Bracket | Male | Female |
| 5 to 17 Years | 0 (0.0%) | 0 (0.0%) |
| 18 to 34 Years | 0 (0.0%) | 0 (0.0%) |
| 35 to 64 Years | 28 (22.8%) | 19 (14.2%) |
| 65 to 74 Years | 8 (18.6%) | 11 (23.4%) |
| 75 Years and over | 0 (0.0%) | 7 (19.4%) |
Disability Class: Self-Care Difficulty
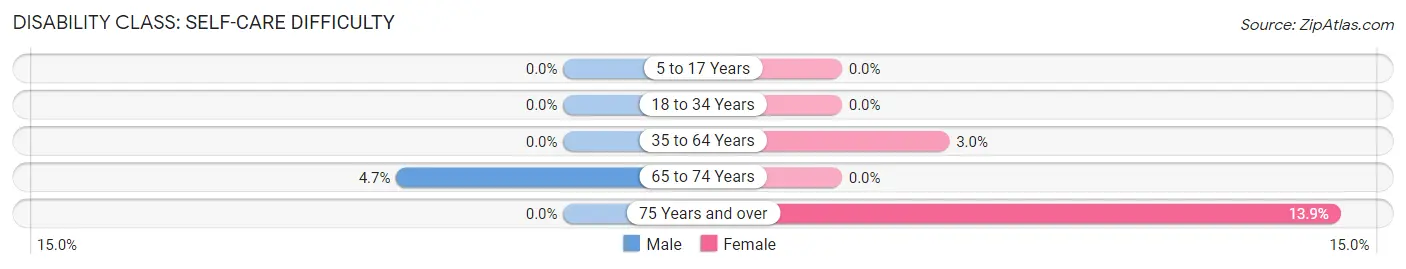
| Age Bracket | Male | Female |
| 5 to 17 Years | 0 (0.0%) | 0 (0.0%) |
| 18 to 34 Years | 0 (0.0%) | 0 (0.0%) |
| 35 to 64 Years | 0 (0.0%) | 4 (3.0%) |
| 65 to 74 Years | 2 (4.6%) | 0 (0.0%) |
| 75 Years and over | 0 (0.0%) | 5 (13.9%) |
Technology Access in Cove
Computing Device Access in Cove
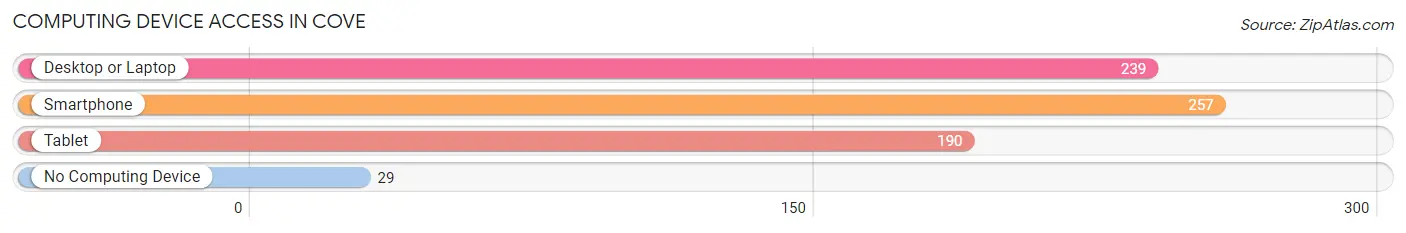
| Device Type | # Households | % Households |
| Desktop or Laptop | 239 | 75.9% |
| Smartphone | 257 | 81.6% |
| Tablet | 190 | 60.3% |
| No Computing Device | 29 | 9.2% |
| Total | 315 | 100.0% |
Internet Access in Cove
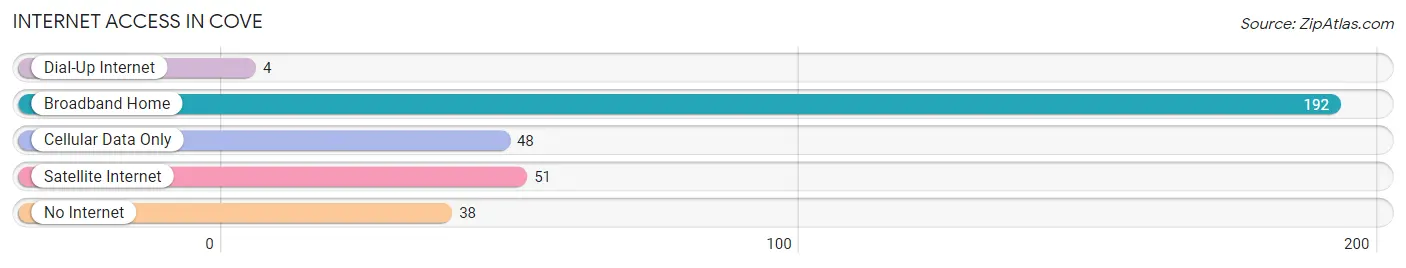
| Internet Type | # Households | % Households |
| Dial-Up Internet | 4 | 1.3% |
| Broadband Home | 192 | 61.0% |
| Cellular Data Only | 48 | 15.2% |
| Satellite Internet | 51 | 16.2% |
| No Internet | 38 | 12.1% |
| Total | 315 | 100.0% |
Cove Summary
Cove, Oregon is a small city located in Union County, Oregon. It is situated in the Grande Ronde Valley, at the base of the Blue Mountains. The city is located about 25 miles east of La Grande, Oregon, and about 50 miles south of Pendleton, Oregon. The population of Cove was 1,093 at the 2010 census.
History
The area that is now Cove was first settled in the late 1860s by homesteaders. The first post office was established in 1871, and the city was officially incorporated in 1891. The city was named after the nearby Cove Creek, which was named by early settlers for its shape.
The city of Cove was an important stop on the Oregon Trail, and the first school in the area was established in 1872. The city was also home to a number of businesses, including a hotel, a general store, a blacksmith shop, and a sawmill.
Geography
Cove is located in the Grande Ronde Valley, at the base of the Blue Mountains. The city is situated at an elevation of 2,845 feet above sea level. The city is located about 25 miles east of La Grande, Oregon, and about 50 miles south of Pendleton, Oregon.
The city of Cove is surrounded by rolling hills and farmland. The nearby Blue Mountains provide a scenic backdrop to the city. The city is located in a semi-arid climate, with hot summers and cold winters.
Economy
The economy of Cove is largely based on agriculture and timber. The city is home to a number of farms, and the surrounding area is home to a number of timber companies. The city is also home to a number of small businesses, including restaurants, retail stores, and service providers.
Demographics
As of the 2010 census, the population of Cove was 1,093. The racial makeup of the city was 94.2% White, 0.7% African American, 0.7% Native American, 0.3% Asian, 0.1% Pacific Islander, 1.2% from other races, and 2.9% from two or more races. Hispanic or Latino of any race were 4.2% of the population.
The median income for a household in Cove was $35,938, and the median income for a family was $41,250. The per capita income for the city was $17,845. About 11.2% of families and 14.2% of the population were below the poverty line, including 18.2% of those under age 18 and 8.3% of those age 65 or over.
Common Questions
What is the Total Population of Cove?
Total Population of Cove is 676.
What is the Total Male Population of Cove?
Total Male Population of Cove is 349.
What is the Total Female Population of Cove?
Total Female Population of Cove is 327.
What is the Ratio of Males per 100 Females in Cove?
There are 106.73 Males per 100 Females in Cove.
What is the Ratio of Females per 100 Males in Cove?
There are 93.70 Females per 100 Males in Cove.
What is the Median Population Age in Cove?
Median Population Age in Cove is 45.4 Years.
What is the Average Family Size in Cove
Average Family Size in Cove is 2.8 People.
What is the Average Household Size in Cove
Average Household Size in Cove is 2.1 People.
What is Per Capita Income in Cove?
Per Capita income in Cove is $35,958.
What is the Median Family Income in Cove?
Median Family Income in Cove is $75,833.
What is the Median Household income in Cove?
Median Household Income in Cove is $66,382.
What is Income or Wage Gap in Cove?
Income or Wage Gap in Cove is 36.5%.
Women in Cove earn 63.5 cents for every dollar earned by a man.
What is Inequality or Gini Index in Cove?
Inequality or Gini Index in Cove is 0.38.
How Large is the Labor Force in Cove?
There are 257 People in the Labor Forcein in Cove.
What is the Percentage of People in the Labor Force in Cove?
42.1% of People are in the Labor Force in Cove.
What is the Unemployment Rate in Cove?
Unemployment Rate in Cove is 2.3%.