Moriches, NY
Moriches Map
Moriches Overview
2,626
TOTAL POPULATION
1,323
MALE POPULATION
1,303
FEMALE POPULATION
101.53
MALES / 100 FEMALES
98.49
FEMALES / 100 MALES
47.6
MEDIAN AGE
2.5
AVG FAMILY SIZE
2.1
AVG HOUSEHOLD SIZE
$41,845
PER CAPITA INCOME
$110,139
AVG FAMILY INCOME
$78,469
AVG HOUSEHOLD INCOME
4.3%
WAGE / INCOME GAP [ % ]
95.7¢/ $1
WAGE / INCOME GAP [ $ ]
0.40
INEQUALITY / GINI INDEX
1,222
LABOR FORCE [ PEOPLE ]
54.3%
PERCENT IN LABOR FORCE
3.8%
UNEMPLOYMENT RATE
Moriches Zip Codes
Moriches Area Codes
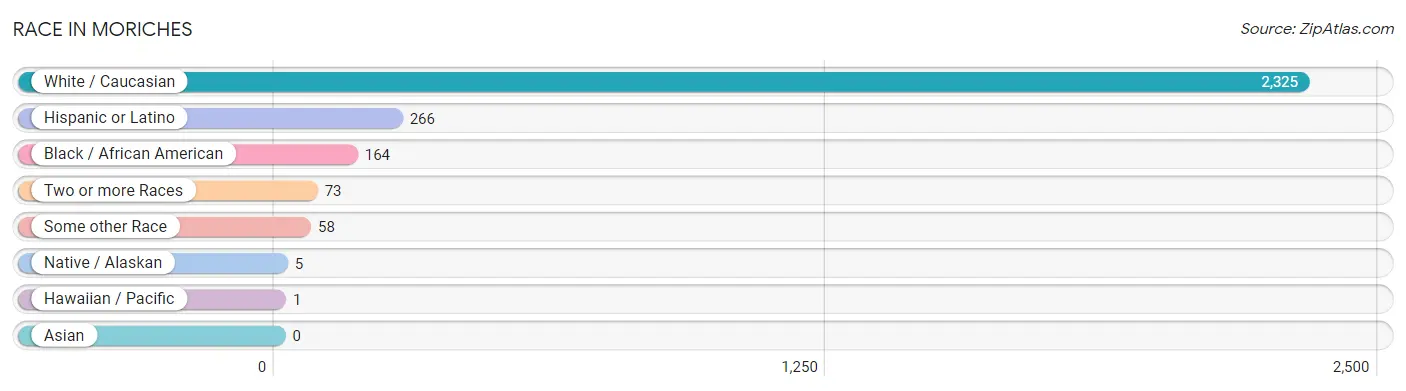
Race in Moriches
The most populous races in Moriches are White / Caucasian (2,325 | 88.5%), Hispanic or Latino (266 | 10.1%), and Black / African American (164 | 6.2%).
| Race | # Population | % Population |
| Asian | 0 | 0.0% |
| Black / African American | 164 | 6.2% |
| Hawaiian / Pacific | 1 | 0.0% |
| Hispanic or Latino | 266 | 10.1% |
| Native / Alaskan | 5 | 0.2% |
| White / Caucasian | 2,325 | 88.5% |
| Two or more Races | 73 | 2.8% |
| Some other Race | 58 | 2.2% |
| Total | 2,626 | 100.0% |
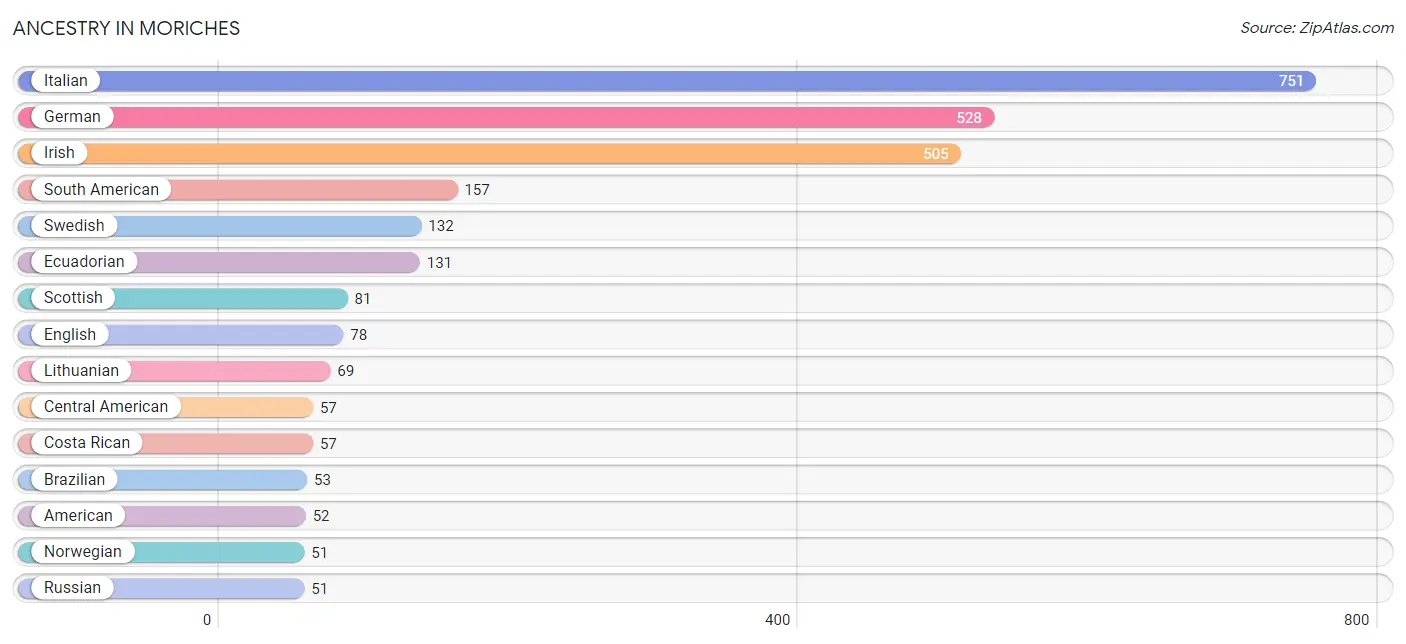
Ancestry in Moriches
The most populous ancestries reported in Moriches are Italian (751 | 28.6%), German (528 | 20.1%), Irish (505 | 19.2%), South American (157 | 6.0%), and Swedish (132 | 5.0%), together accounting for 78.9% of all Moriches residents.
| Ancestry | # Population | % Population |
| American | 52 | 2.0% |
| Arab | 5 | 0.2% |
| Armenian | 8 | 0.3% |
| Brazilian | 53 | 2.0% |
| British | 8 | 0.3% |
| Central American | 57 | 2.2% |
| Colombian | 26 | 1.0% |
| Costa Rican | 57 | 2.2% |
| Czech | 26 | 1.0% |
| Dominican | 13 | 0.5% |
| Dutch | 12 | 0.5% |
| Eastern European | 12 | 0.5% |
| Ecuadorian | 131 | 5.0% |
| English | 78 | 3.0% |
| European | 13 | 0.5% |
| French | 38 | 1.5% |
| German | 528 | 20.1% |
| Greek | 50 | 1.9% |
| Irish | 505 | 19.2% |
| Iroquois | 10 | 0.4% |
| Italian | 751 | 28.6% |
| Lebanese | 5 | 0.2% |
| Lithuanian | 69 | 2.6% |
| Norwegian | 51 | 1.9% |
| Polish | 45 | 1.7% |
| Puerto Rican | 12 | 0.5% |
| Russian | 51 | 1.9% |
| Samoan | 1 | 0.0% |
| Scottish | 81 | 3.1% |
| South American | 157 | 6.0% |
| Swedish | 132 | 5.0% | View All 31 Rows |
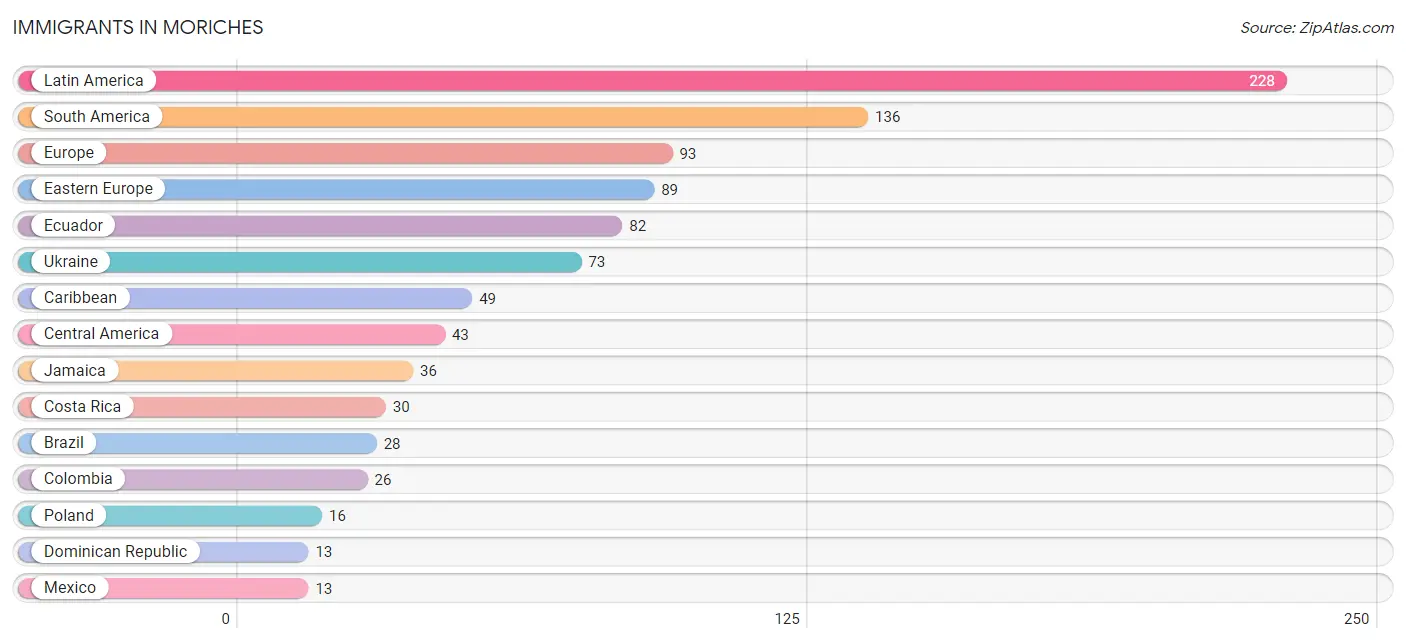
Immigrants in Moriches
The most numerous immigrant groups reported in Moriches came from Latin America (228 | 8.7%), South America (136 | 5.2%), Europe (93 | 3.5%), Eastern Europe (89 | 3.4%), and Ecuador (82 | 3.1%), together accounting for 23.9% of all Moriches residents.
| Immigration Origin | # Population | % Population |
| Brazil | 28 | 1.1% |
| Caribbean | 49 | 1.9% |
| Central America | 43 | 1.6% |
| Colombia | 26 | 1.0% |
| Costa Rica | 30 | 1.1% |
| Dominican Republic | 13 | 0.5% |
| Eastern Europe | 89 | 3.4% |
| Ecuador | 82 | 3.1% |
| Europe | 93 | 3.5% |
| Germany | 2 | 0.1% |
| Italy | 2 | 0.1% |
| Jamaica | 36 | 1.4% |
| Latin America | 228 | 8.7% |
| Mexico | 13 | 0.5% |
| Poland | 16 | 0.6% |
| South America | 136 | 5.2% |
| Southern Europe | 2 | 0.1% |
| Ukraine | 73 | 2.8% |
| Western Europe | 2 | 0.1% | View All 19 Rows |
Sex and Age in Moriches
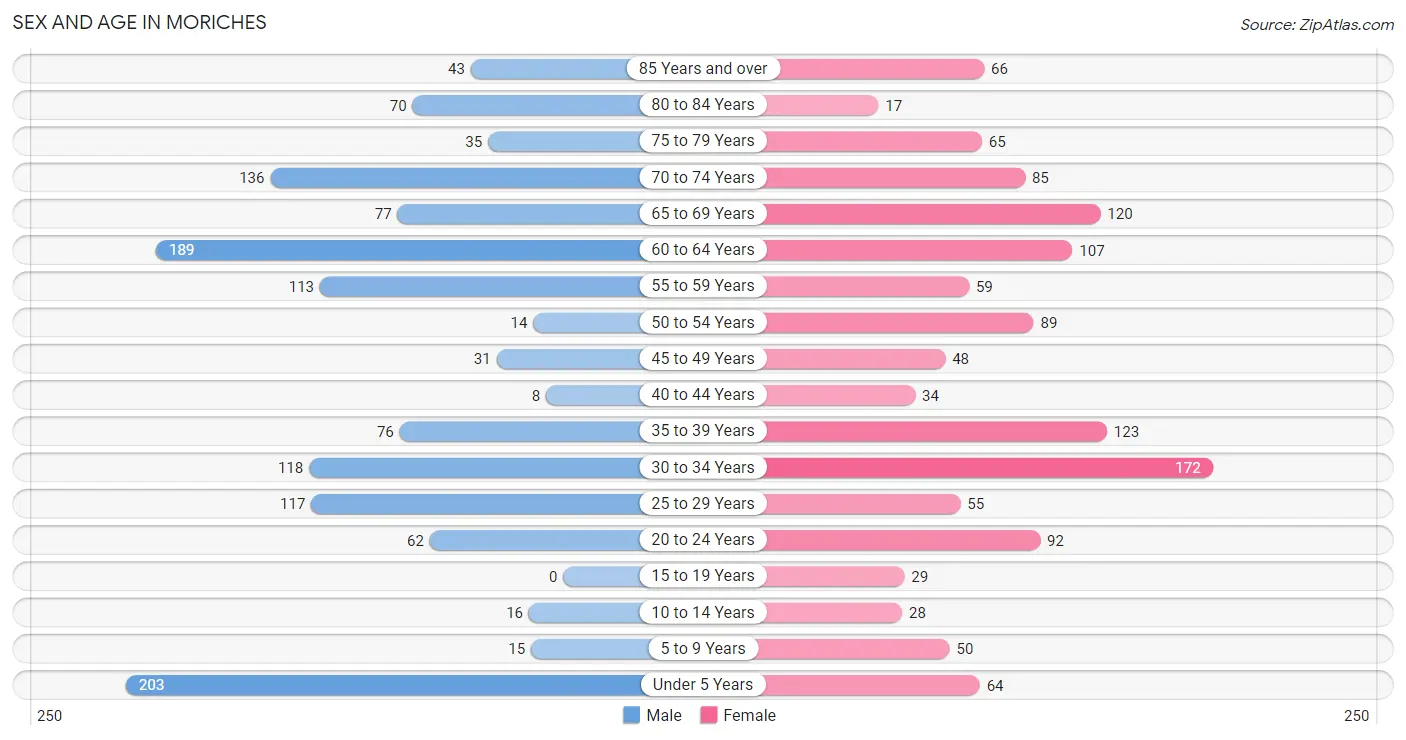
Sex and Age in Moriches
The most populous age groups in Moriches are Under 5 Years (203 | 15.3%) for men and 30 to 34 Years (172 | 13.2%) for women.
| Age Bracket | Male | Female |
| Under 5 Years | 203 (15.3%) | 64 (4.9%) |
| 5 to 9 Years | 15 (1.1%) | 50 (3.8%) |
| 10 to 14 Years | 16 (1.2%) | 28 (2.1%) |
| 15 to 19 Years | 0 (0.0%) | 29 (2.2%) |
| 20 to 24 Years | 62 (4.7%) | 92 (7.1%) |
| 25 to 29 Years | 117 (8.8%) | 55 (4.2%) |
| 30 to 34 Years | 118 (8.9%) | 172 (13.2%) |
| 35 to 39 Years | 76 (5.7%) | 123 (9.4%) |
| 40 to 44 Years | 8 (0.6%) | 34 (2.6%) |
| 45 to 49 Years | 31 (2.3%) | 48 (3.7%) |
| 50 to 54 Years | 14 (1.1%) | 89 (6.8%) |
| 55 to 59 Years | 113 (8.5%) | 59 (4.5%) |
| 60 to 64 Years | 189 (14.3%) | 107 (8.2%) |
| 65 to 69 Years | 77 (5.8%) | 120 (9.2%) |
| 70 to 74 Years | 136 (10.3%) | 85 (6.5%) |
| 75 to 79 Years | 35 (2.6%) | 65 (5.0%) |
| 80 to 84 Years | 70 (5.3%) | 17 (1.3%) |
| 85 Years and over | 43 (3.3%) | 66 (5.1%) |
| Total | 1,323 (100.0%) | 1,303 (100.0%) |
Families and Households in Moriches
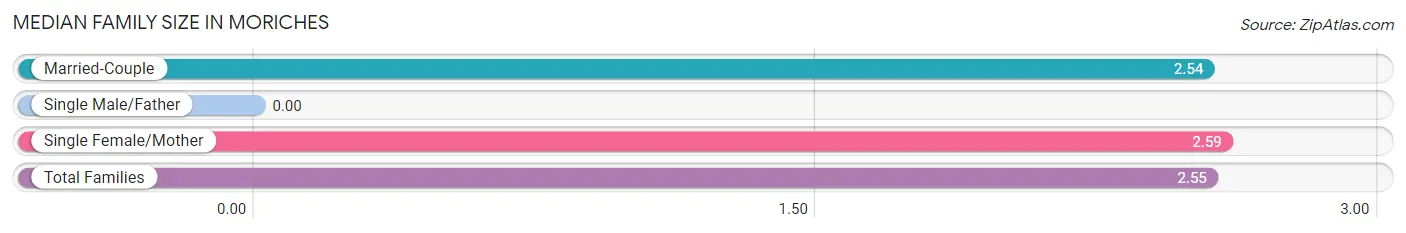
Median Family Size in Moriches
| Family Type | # Families | Family Size |
| Married-Couple | 624 (78.6%) | 2.54 |
| Single Male/Father | 0 (0.0%) | - |
| Single Female/Mother | 170 (21.4%) | 2.59 |
| Total Families | 794 (100.0%) | 2.55 |
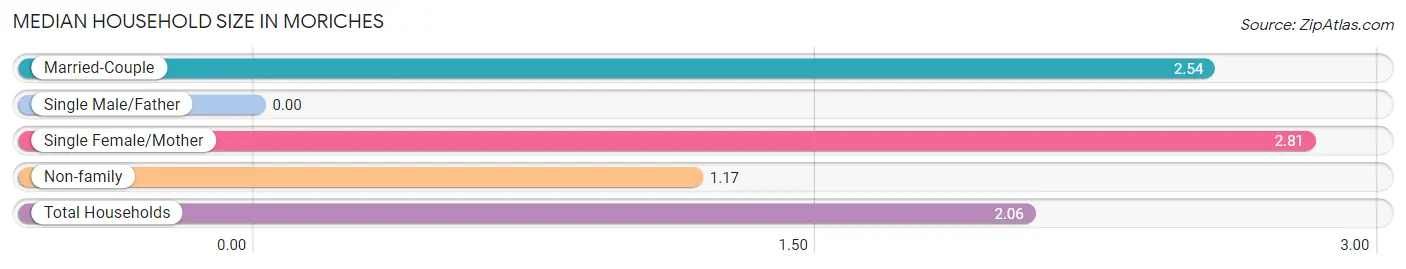
Median Household Size in Moriches
| Household Type | # Households | Household Size |
| Married-Couple | 624 (49.2%) | 2.54 |
| Single Male/Father | 0 (0.0%) | - |
| Single Female/Mother | 170 (13.4%) | 2.81 |
| Non-family | 475 (37.4%) | 1.17 |
| Total Households | 1,269 (100.0%) | 2.06 |
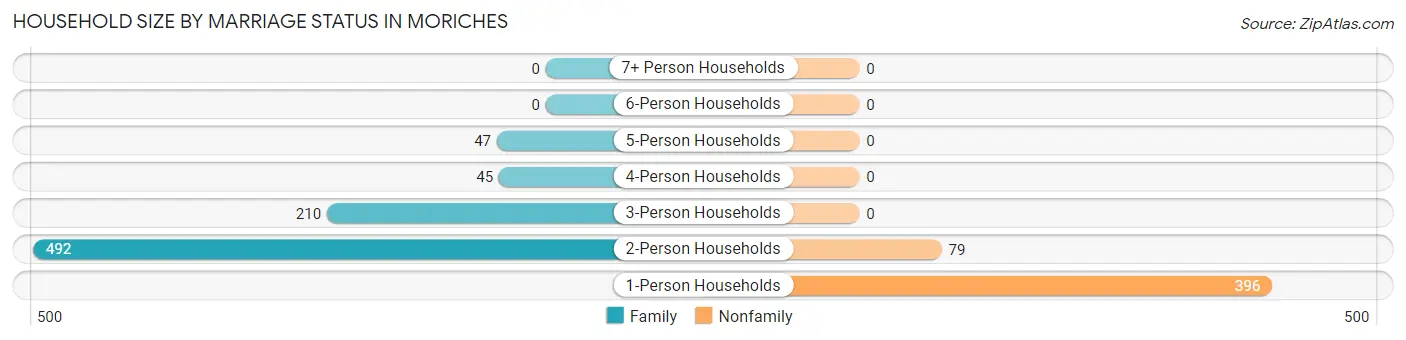
Household Size by Marriage Status in Moriches
Out of a total of 1,269 households in Moriches, 794 (62.6%) are family households, while 475 (37.4%) are nonfamily households. The most numerous type of family households are 2-person households, comprising 492, and the most common type of nonfamily households are 1-person households, comprising 396.
| Household Size | Family Households | Nonfamily Households |
| 1-Person Households | - | 396 (31.2%) |
| 2-Person Households | 492 (38.8%) | 79 (6.2%) |
| 3-Person Households | 210 (16.6%) | 0 (0.0%) |
| 4-Person Households | 45 (3.5%) | 0 (0.0%) |
| 5-Person Households | 47 (3.7%) | 0 (0.0%) |
| 6-Person Households | 0 (0.0%) | 0 (0.0%) |
| 7+ Person Households | 0 (0.0%) | 0 (0.0%) |
| Total | 794 (62.6%) | 475 (37.4%) |
Female Fertility in Moriches
Fertility by Age in Moriches
Average fertility rate in Moriches is 75.0 births per 1,000 women. Women in the age bracket of 20 to 34 years have the highest fertility rate with 141.0 births per 1,000 women. Women in the age bracket of 20 to 34 years acount for 100.0% of all women with births.
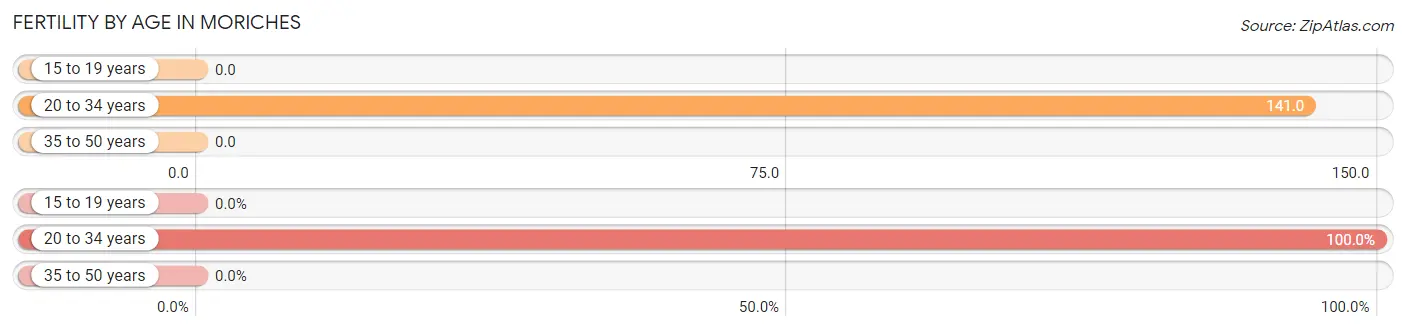
| Age Bracket | Women with Births | Births / 1,000 Women |
| 15 to 19 years | 0 (0.0%) | 0.0 |
| 20 to 34 years | 45 (100.0%) | 141.0 |
| 35 to 50 years | 0 (0.0%) | 0.0 |
| Total | 45 (100.0%) | 75.0 |
Fertility by Age by Marriage Status in Moriches
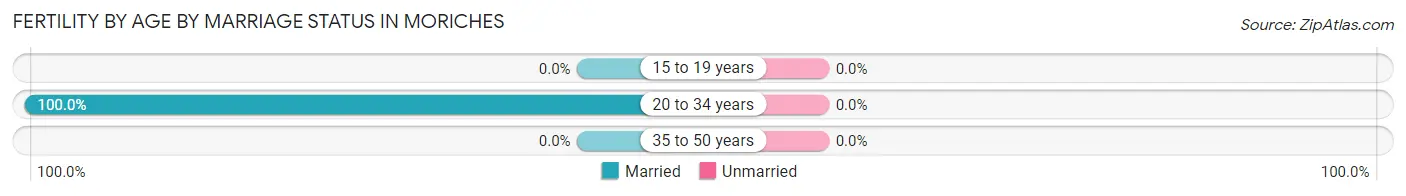
| Age Bracket | Married | Unmarried |
| 15 to 19 years | 0 (0.0%) | 0 (0.0%) |
| 20 to 34 years | 45 (100.0%) | 0 (0.0%) |
| 35 to 50 years | 0 (0.0%) | 0 (0.0%) |
| Total | 45 (100.0%) | 0 (0.0%) |
Fertility by Education in Moriches
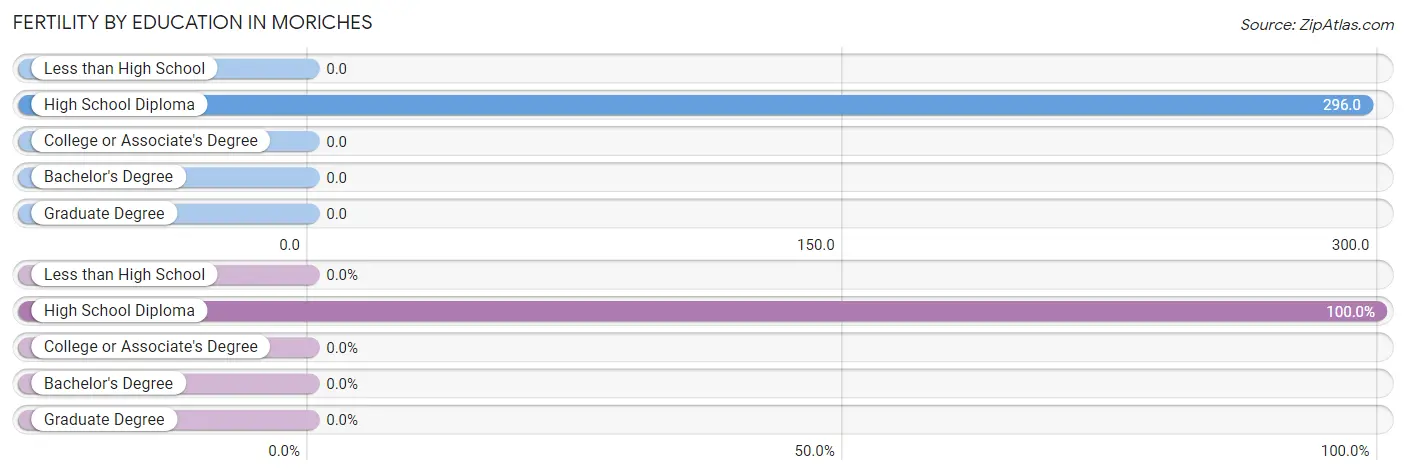
| Educational Attainment | Women with Births | Births / 1,000 Women |
| Less than High School | 0 (0.0%) | 0.0 |
| High School Diploma | 45 (100.0%) | 296.0 |
| College or Associate's Degree | 0 (0.0%) | 0.0 |
| Bachelor's Degree | 0 (0.0%) | 0.0 |
| Graduate Degree | 0 (0.0%) | 0.0 |
| Total | 45 (100.0%) | 75.0 |
Fertility by Education by Marriage Status in Moriches
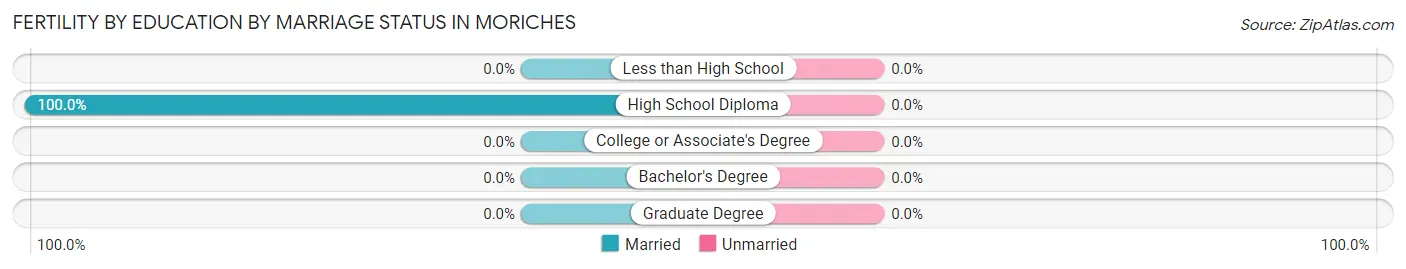
| Educational Attainment | Married | Unmarried |
| Less than High School | 0 (0.0%) | 0 (0.0%) |
| High School Diploma | 45 (100.0%) | 0 (0.0%) |
| College or Associate's Degree | 0 (0.0%) | 0 (0.0%) |
| Bachelor's Degree | 0 (0.0%) | 0 (0.0%) |
| Graduate Degree | 0 (0.0%) | 0 (0.0%) |
| Total | 45 (100.0%) | 0 (0.0%) |
Income in Moriches
Income Overview in Moriches
Per Capita Income in Moriches is $41,845, while median incomes of families and households are $110,139 and $78,469 respectively.
| Characteristic | Number | Measure |
| Per Capita Income | 2,626 | $41,845 |
| Median Family Income | 794 | $110,139 |
| Mean Family Income | 794 | $106,801 |
| Median Household Income | 1,269 | $78,469 |
| Mean Household Income | 1,269 | $86,148 |
| Income Deficit | 794 | $0 |
| Wage / Income Gap (%) | 2,626 | 4.25% |
| Wage / Income Gap ($) | 2,626 | 95.75¢ per $1 |
| Gini / Inequality Index | 2,626 | 0.40 |
Earnings by Sex in Moriches
Average Earnings in Moriches are $59,538, $59,014 for men and $61,635 for women, a difference of 4.3%.
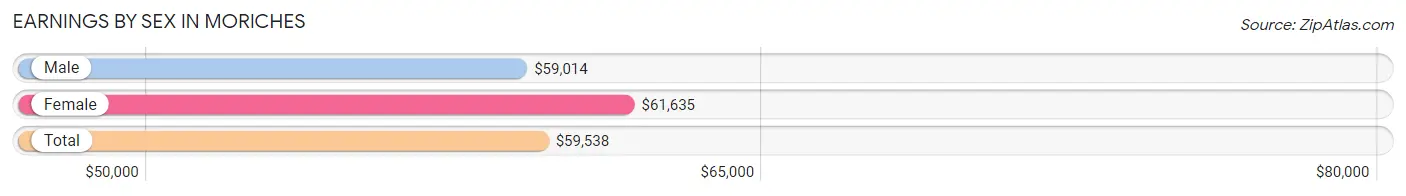
| Sex | Number | Average Earnings |
| Male | 673 (55.1%) | $59,014 |
| Female | 549 (44.9%) | $61,635 |
| Total | 1,222 (100.0%) | $59,538 |
Earnings by Sex by Income Bracket in Moriches
The most common earnings brackets in Moriches are $75,000 to $99,999 for men (180 | 26.8%) and $75,000 to $99,999 for women (150 | 27.3%).
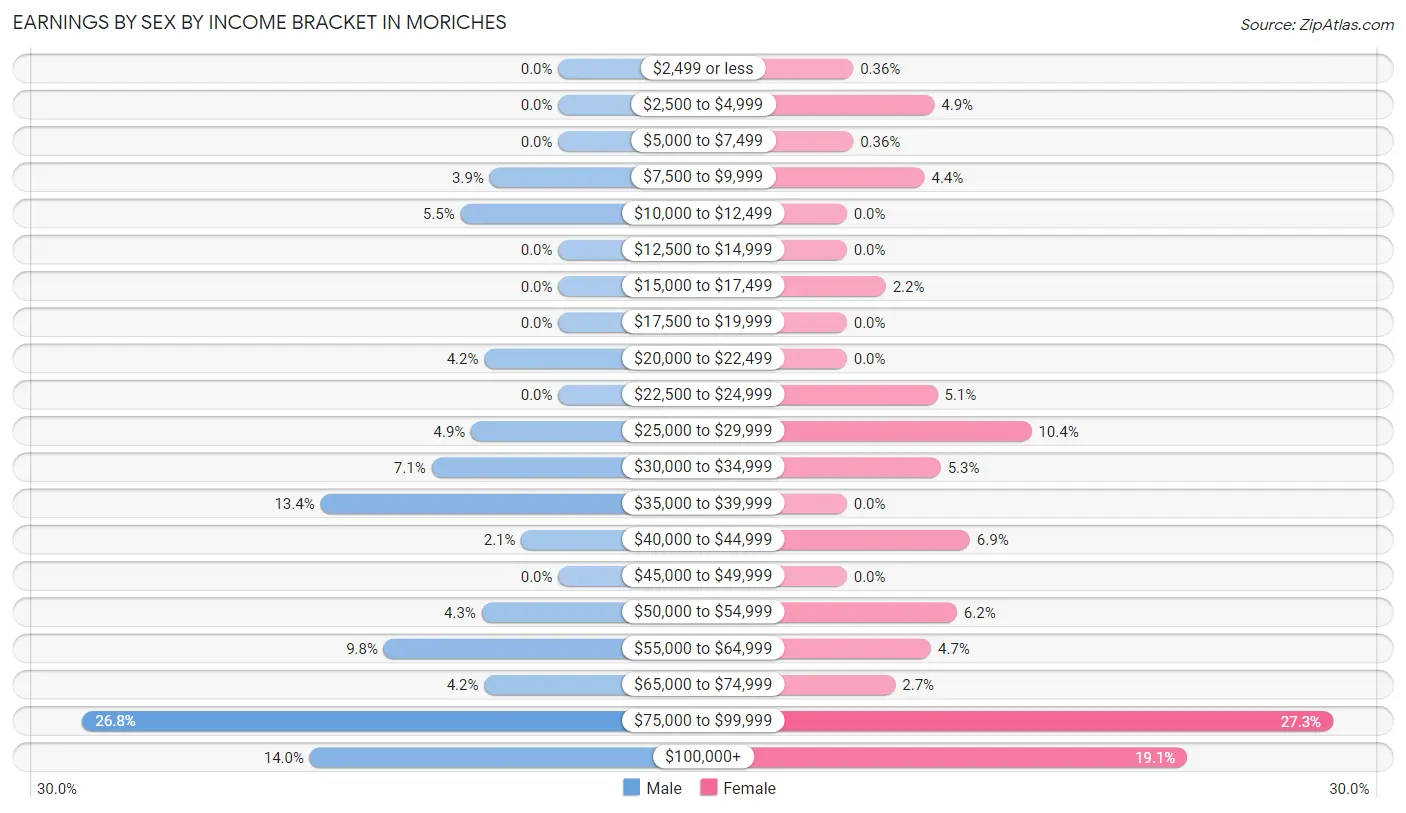
| Income | Male | Female |
| $2,499 or less | 0 (0.0%) | 2 (0.4%) |
| $2,500 to $4,999 | 0 (0.0%) | 27 (4.9%) |
| $5,000 to $7,499 | 0 (0.0%) | 2 (0.4%) |
| $7,500 to $9,999 | 26 (3.9%) | 24 (4.4%) |
| $10,000 to $12,499 | 37 (5.5%) | 0 (0.0%) |
| $12,500 to $14,999 | 0 (0.0%) | 0 (0.0%) |
| $15,000 to $17,499 | 0 (0.0%) | 12 (2.2%) |
| $17,500 to $19,999 | 0 (0.0%) | 0 (0.0%) |
| $20,000 to $22,499 | 28 (4.2%) | 0 (0.0%) |
| $22,500 to $24,999 | 0 (0.0%) | 28 (5.1%) |
| $25,000 to $29,999 | 33 (4.9%) | 57 (10.4%) |
| $30,000 to $34,999 | 48 (7.1%) | 29 (5.3%) |
| $35,000 to $39,999 | 90 (13.4%) | 0 (0.0%) |
| $40,000 to $44,999 | 14 (2.1%) | 38 (6.9%) |
| $45,000 to $49,999 | 0 (0.0%) | 0 (0.0%) |
| $50,000 to $54,999 | 29 (4.3%) | 34 (6.2%) |
| $55,000 to $64,999 | 66 (9.8%) | 26 (4.7%) |
| $65,000 to $74,999 | 28 (4.2%) | 15 (2.7%) |
| $75,000 to $99,999 | 180 (26.8%) | 150 (27.3%) |
| $100,000+ | 94 (14.0%) | 105 (19.1%) |
| Total | 673 (100.0%) | 549 (100.0%) |
Earnings by Sex by Educational Attainment in Moriches
Average earnings in Moriches are $59,976 for men and $78,344 for women, a difference of 23.4%. Men with an educational attainment of bachelor's degree enjoy the highest average annual earnings of $71,250, while those with college or associate's degree education earn the least with $60,417. Women with an educational attainment of bachelor's degree earn the most with the average annual earnings of $115,278, while those with college or associate's degree education have the smallest earnings of $44,125.
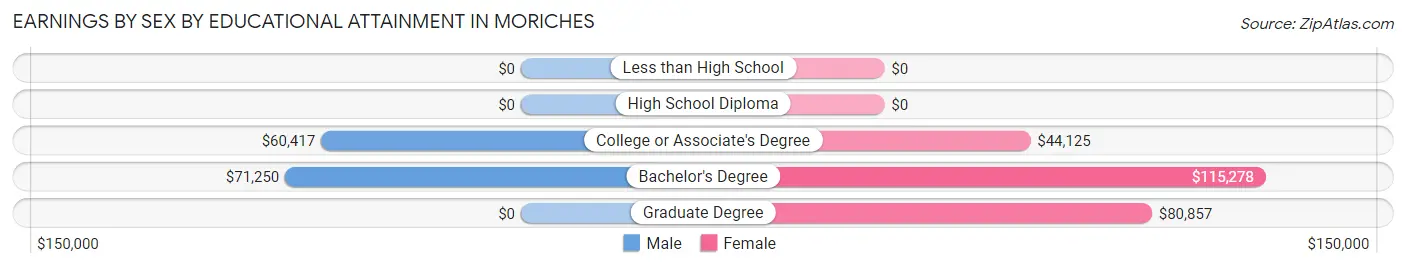
| Educational Attainment | Male Income | Female Income |
| Less than High School | - | - |
| High School Diploma | - | - |
| College or Associate's Degree | $60,417 | $44,125 |
| Bachelor's Degree | $71,250 | $115,278 |
| Graduate Degree | - | - |
| Total | $59,976 | $78,344 |
Family Income in Moriches
Family Income Brackets in Moriches
According to the Moriches family income data, there are 260 families falling into the $100,000 to $149,999 income range, which is the most common income bracket and makes up 32.8% of all families.
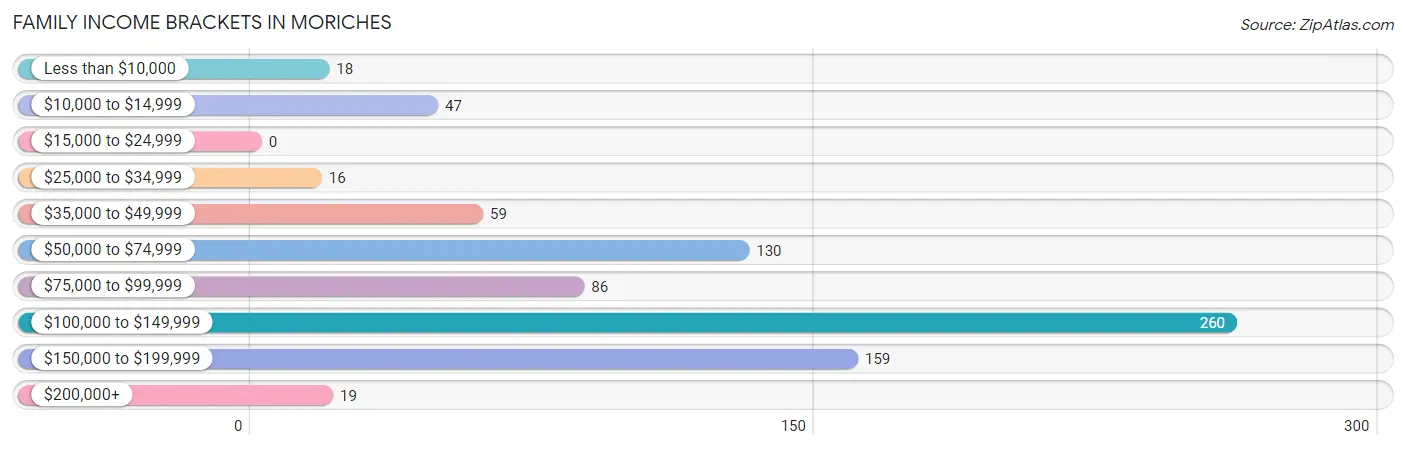
| Income Bracket | # Families | % Families |
| Less than $10,000 | 18 | 2.3% |
| $10,000 to $14,999 | 47 | 5.9% |
| $15,000 to $24,999 | 0 | 0.0% |
| $25,000 to $34,999 | 16 | 2.0% |
| $35,000 to $49,999 | 59 | 7.4% |
| $50,000 to $74,999 | 130 | 16.4% |
| $75,000 to $99,999 | 86 | 10.8% |
| $100,000 to $149,999 | 260 | 32.7% |
| $150,000 to $199,999 | 159 | 20.0% |
| $200,000+ | 19 | 2.4% |
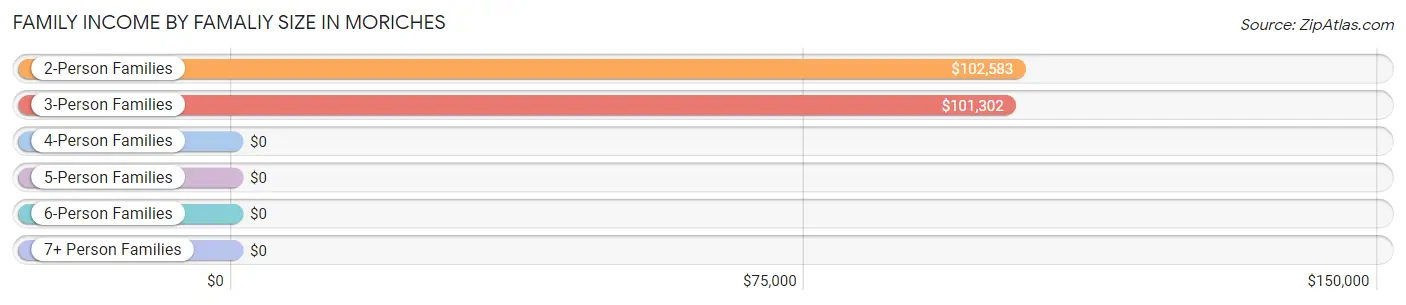
Family Income by Famaliy Size in Moriches
2-person families (529 | 66.6%) account for the highest median family income in Moriches with $102,583 per family, while 2-person families (529 | 66.6%) have the highest median income of $51,292 per family member.
| Income Bracket | # Families | Median Income |
| 2-Person Families | 529 (66.6%) | $102,583 |
| 3-Person Families | 173 (21.8%) | $101,302 |
| 4-Person Families | 45 (5.7%) | $0 |
| 5-Person Families | 47 (5.9%) | $0 |
| 6-Person Families | 0 (0.0%) | $0 |
| 7+ Person Families | 0 (0.0%) | $0 |
| Total | 794 (100.0%) | $110,139 |
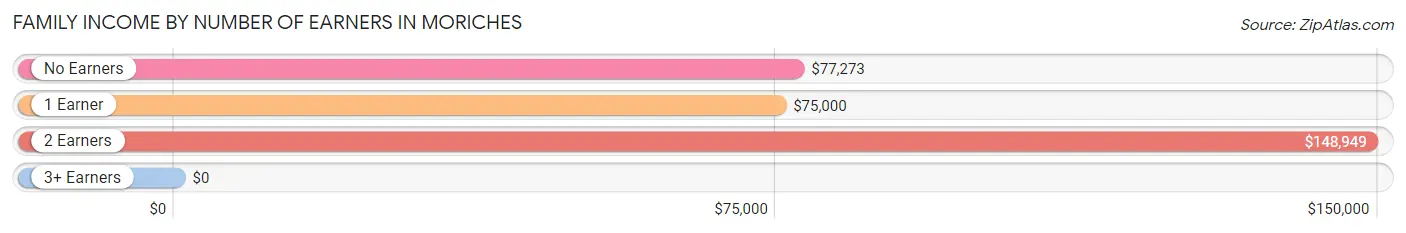
Family Income by Number of Earners in Moriches
| Number of Earners | # Families | Median Income |
| No Earners | 236 (29.7%) | $77,273 |
| 1 Earner | 230 (29.0%) | $75,000 |
| 2 Earners | 309 (38.9%) | $148,949 |
| 3+ Earners | 19 (2.4%) | $0 |
| Total | 794 (100.0%) | $110,139 |
Household Income in Moriches
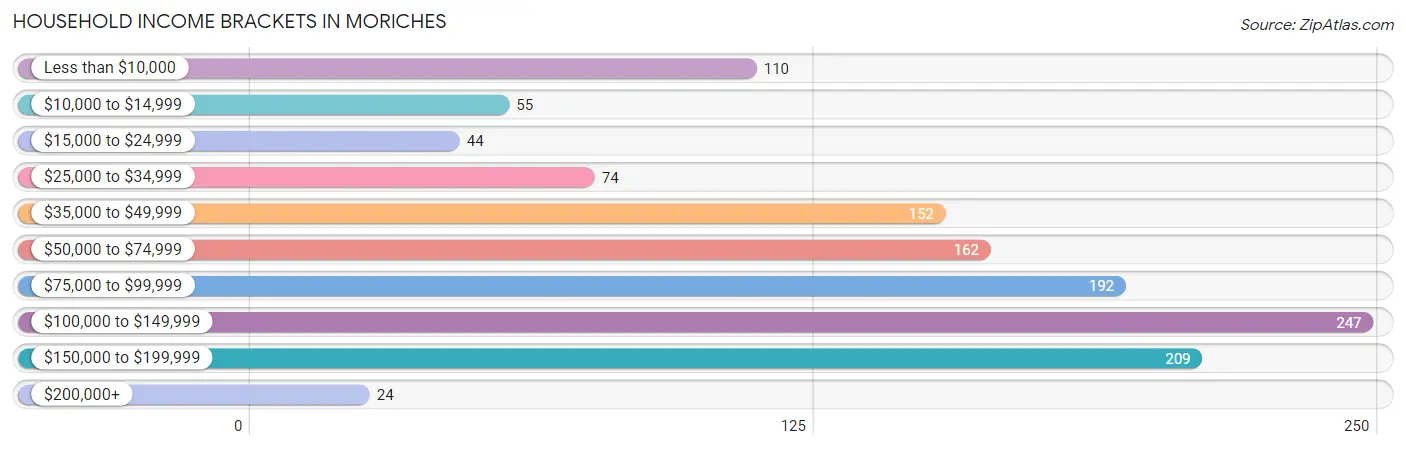
Household Income Brackets in Moriches
With 247 households falling in the category, the $100,000 to $149,999 income range is the most frequent in Moriches, accounting for 19.5% of all households. In contrast, only 24 households (1.9%) fall into the $200,000+ income bracket, making it the least populous group.
| Income Bracket | # Households | % Households |
| Less than $10,000 | 110 | 8.7% |
| $10,000 to $14,999 | 55 | 4.3% |
| $15,000 to $24,999 | 44 | 3.5% |
| $25,000 to $34,999 | 74 | 5.8% |
| $35,000 to $49,999 | 152 | 12.0% |
| $50,000 to $74,999 | 162 | 12.8% |
| $75,000 to $99,999 | 192 | 15.1% |
| $100,000 to $149,999 | 247 | 19.5% |
| $150,000 to $199,999 | 209 | 16.5% |
| $200,000+ | 24 | 1.9% |
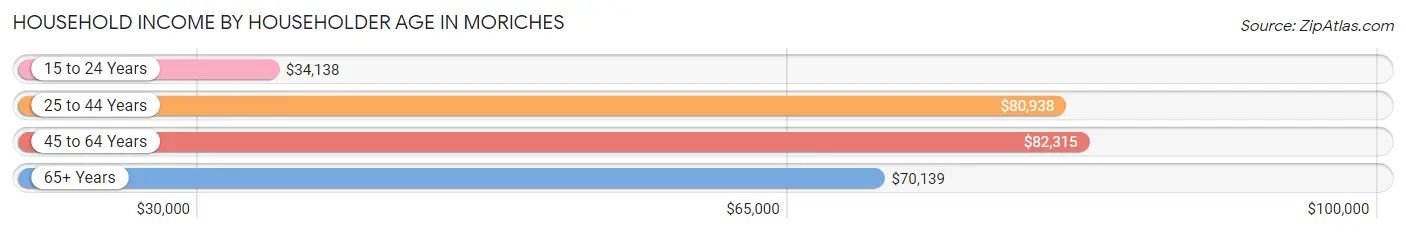
Household Income by Householder Age in Moriches
The median household income in Moriches is $78,469, with the highest median household income of $82,315 found in the 45 to 64 years age bracket for the primary householder. A total of 414 households (32.6%) fall into this category. Meanwhile, the 15 to 24 years age bracket for the primary householder has the lowest median household income of $34,138, with 96 households (7.6%) in this group.
| Income Bracket | # Households | Median Income |
| 15 to 24 Years | 96 (7.6%) | $34,138 |
| 25 to 44 Years | 319 (25.1%) | $80,938 |
| 45 to 64 Years | 414 (32.6%) | $82,315 |
| 65+ Years | 440 (34.7%) | $70,139 |
| Total | 1,269 (100.0%) | $78,469 |
Poverty in Moriches
Income Below Poverty by Sex and Age in Moriches
With 15.1% poverty level for males and 13.2% for females among the residents of Moriches, 6 to 11 year old males and 55 to 64 year old females are the most vulnerable to poverty, with 15 males (100.0%) and 72 females (43.4%) in their respective age groups living below the poverty level.
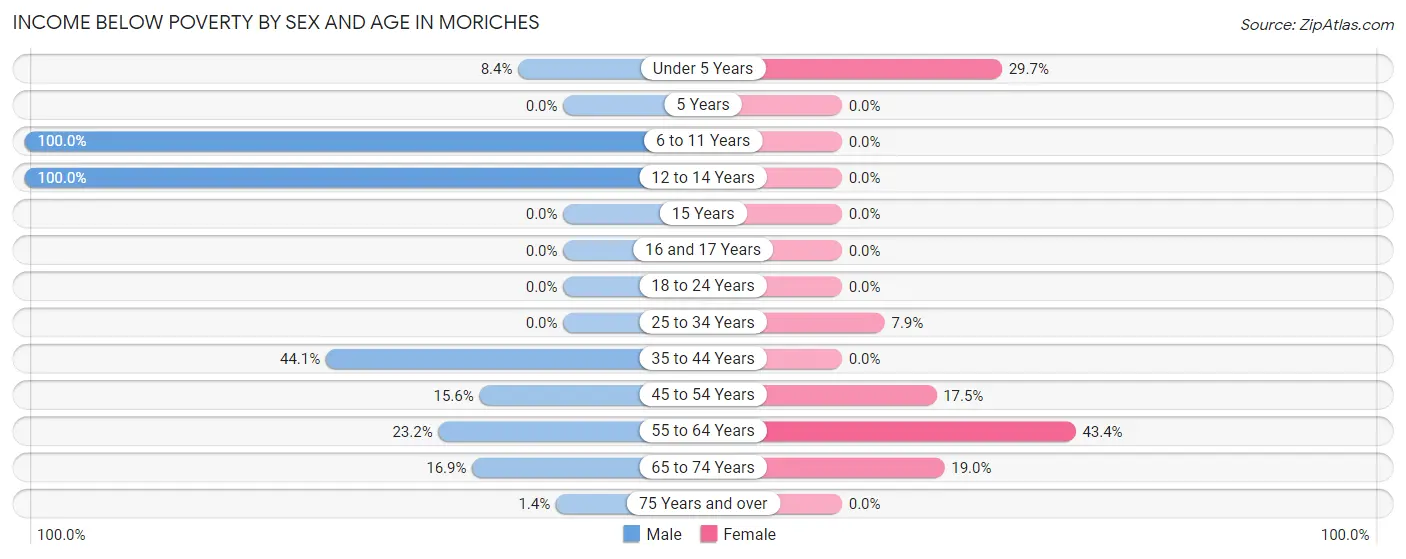
| Age Bracket | Male | Female |
| Under 5 Years | 17 (8.4%) | 19 (29.7%) |
| 5 Years | 0 (0.0%) | 0 (0.0%) |
| 6 to 11 Years | 15 (100.0%) | 0 (0.0%) |
| 12 to 14 Years | 16 (100.0%) | 0 (0.0%) |
| 15 Years | 0 (0.0%) | 0 (0.0%) |
| 16 and 17 Years | 0 (0.0%) | 0 (0.0%) |
| 18 to 24 Years | 0 (0.0%) | 0 (0.0%) |
| 25 to 34 Years | 0 (0.0%) | 18 (7.9%) |
| 35 to 44 Years | 37 (44.1%) | 0 (0.0%) |
| 45 to 54 Years | 7 (15.6%) | 24 (17.5%) |
| 55 to 64 Years | 70 (23.2%) | 72 (43.4%) |
| 65 to 74 Years | 36 (16.9%) | 39 (19.0%) |
| 75 Years and over | 2 (1.3%) | 0 (0.0%) |
| Total | 200 (15.1%) | 172 (13.2%) |
Income Above Poverty by Sex and Age in Moriches
According to the poverty statistics in Moriches, males aged 18 to 24 years and females aged 5 years are the age groups that are most secure financially, with 100.0% of males and 100.0% of females in these age groups living above the poverty line.
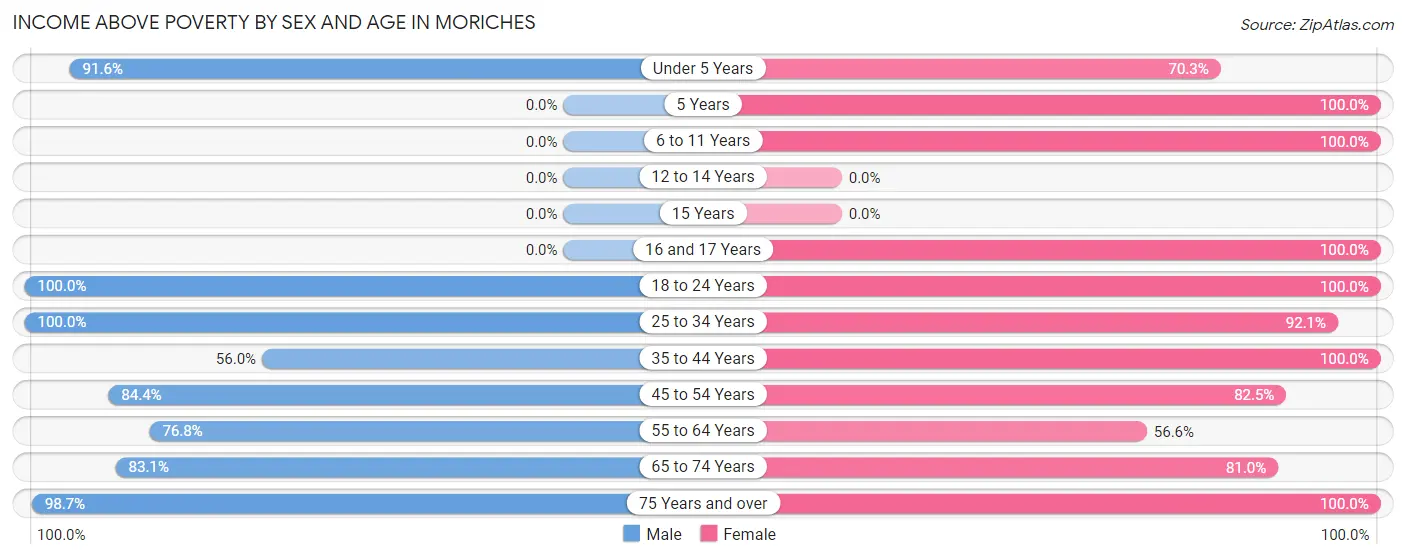
| Age Bracket | Male | Female |
| Under 5 Years | 186 (91.6%) | 45 (70.3%) |
| 5 Years | 0 (0.0%) | 22 (100.0%) |
| 6 to 11 Years | 0 (0.0%) | 56 (100.0%) |
| 12 to 14 Years | 0 (0.0%) | 0 (0.0%) |
| 15 Years | 0 (0.0%) | 0 (0.0%) |
| 16 and 17 Years | 0 (0.0%) | 29 (100.0%) |
| 18 to 24 Years | 62 (100.0%) | 92 (100.0%) |
| 25 to 34 Years | 235 (100.0%) | 209 (92.1%) |
| 35 to 44 Years | 47 (55.9%) | 157 (100.0%) |
| 45 to 54 Years | 38 (84.4%) | 113 (82.5%) |
| 55 to 64 Years | 232 (76.8%) | 94 (56.6%) |
| 65 to 74 Years | 177 (83.1%) | 166 (81.0%) |
| 75 Years and over | 146 (98.7%) | 148 (100.0%) |
| Total | 1,123 (84.9%) | 1,131 (86.8%) |
Income Below Poverty Among Married-Couple Families in Moriches
The poverty statistics for married-couple families in Moriches show that 7.5% or 47 of the total 624 families live below the poverty line. Families with no children have the highest poverty rate of 10.0%, comprising of 47 families. On the other hand, families with 1 or 2 children have the lowest poverty rate of 0.0%, which includes 0 families.
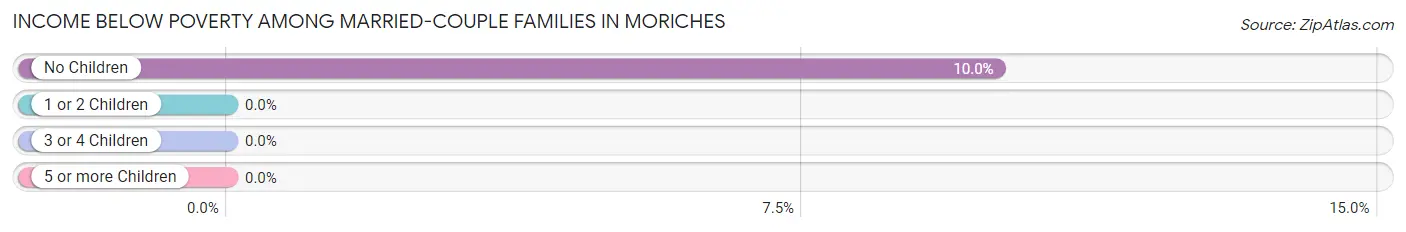
| Children | Above Poverty | Below Poverty |
| No Children | 422 (90.0%) | 47 (10.0%) |
| 1 or 2 Children | 126 (100.0%) | 0 (0.0%) |
| 3 or 4 Children | 29 (100.0%) | 0 (0.0%) |
| 5 or more Children | 0 (0.0%) | 0 (0.0%) |
| Total | 577 (92.5%) | 47 (7.5%) |
Income Below Poverty Among Single-Parent Households in Moriches
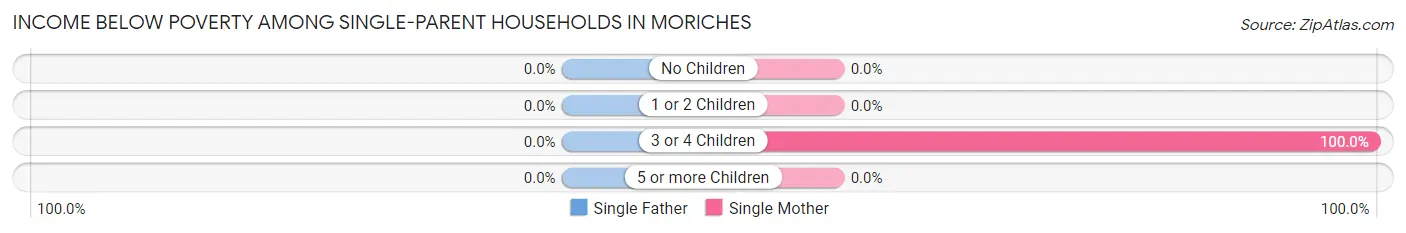
| Children | Single Father | Single Mother |
| No Children | 0 (0.0%) | 0 (0.0%) |
| 1 or 2 Children | 0 (0.0%) | 0 (0.0%) |
| 3 or 4 Children | 0 (0.0%) | 18 (100.0%) |
| 5 or more Children | 0 (0.0%) | 0 (0.0%) |
| Total | 0 (0.0%) | 18 (10.6%) |
Income Below Poverty Among Married-Couple vs Single-Parent Households in Moriches
The poverty data for Moriches shows that 47 of the married-couple family households (7.5%) and 18 of the single-parent households (10.6%) are living below the poverty level. Within the married-couple family households, those with no children have the highest poverty rate, with 47 households (10.0%) falling below the poverty line. Among the single-parent households, those with 3 or 4 children have the highest poverty rate, with 18 household (100.0%) living below poverty.
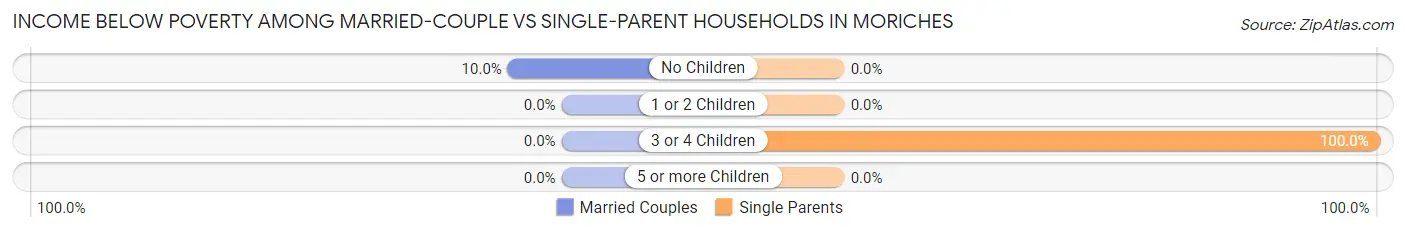
| Children | Married-Couple Families | Single-Parent Households |
| No Children | 47 (10.0%) | 0 (0.0%) |
| 1 or 2 Children | 0 (0.0%) | 0 (0.0%) |
| 3 or 4 Children | 0 (0.0%) | 18 (100.0%) |
| 5 or more Children | 0 (0.0%) | 0 (0.0%) |
| Total | 47 (7.5%) | 18 (10.6%) |
Employment Characteristics in Moriches
Employment by Class of Employer in Moriches
Among the 1,136 employed individuals in Moriches, private company employees (718 | 63.2%), state government employees (118 | 10.4%), and not-for-profit organizations (70 | 6.2%) make up the most common classes of employment.
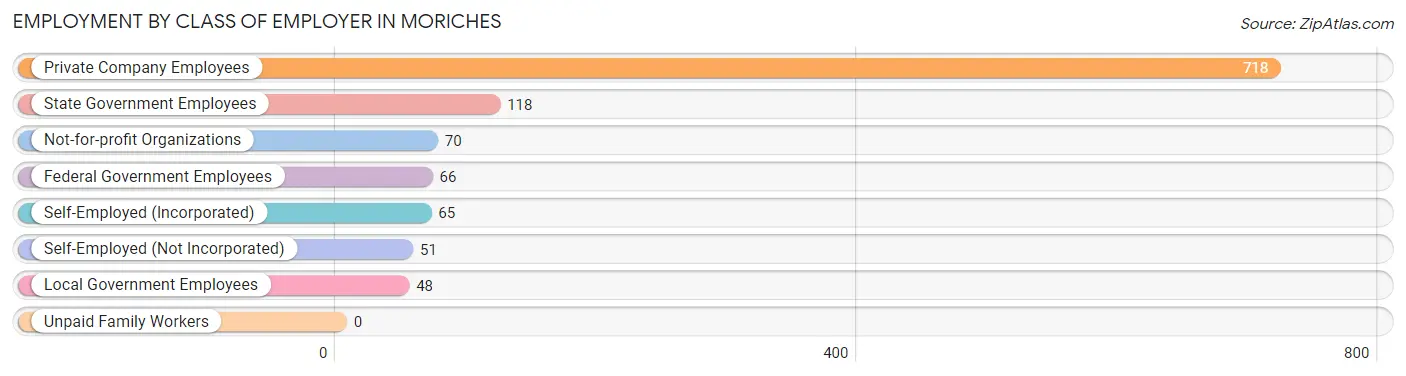
| Employer Class | # Employees | % Employees |
| Private Company Employees | 718 | 63.2% |
| Self-Employed (Incorporated) | 65 | 5.7% |
| Self-Employed (Not Incorporated) | 51 | 4.5% |
| Not-for-profit Organizations | 70 | 6.2% |
| Local Government Employees | 48 | 4.2% |
| State Government Employees | 118 | 10.4% |
| Federal Government Employees | 66 | 5.8% |
| Unpaid Family Workers | 0 | 0.0% |
| Total | 1,136 | 100.0% |
Employment Status by Age in Moriches
According to the labor force statistics for Moriches, out of the total population over 16 years of age (2,250), 54.3% or 1,222 individuals are in the labor force, with 3.8% or 46 of them unemployed. The age group with the highest labor force participation rate is 20 to 24 years, with 100.0% or 154 individuals in the labor force. Within the labor force, the 25 to 29 years age range has the highest percentage of unemployed individuals, with 17.1% or 20 of them being unemployed.
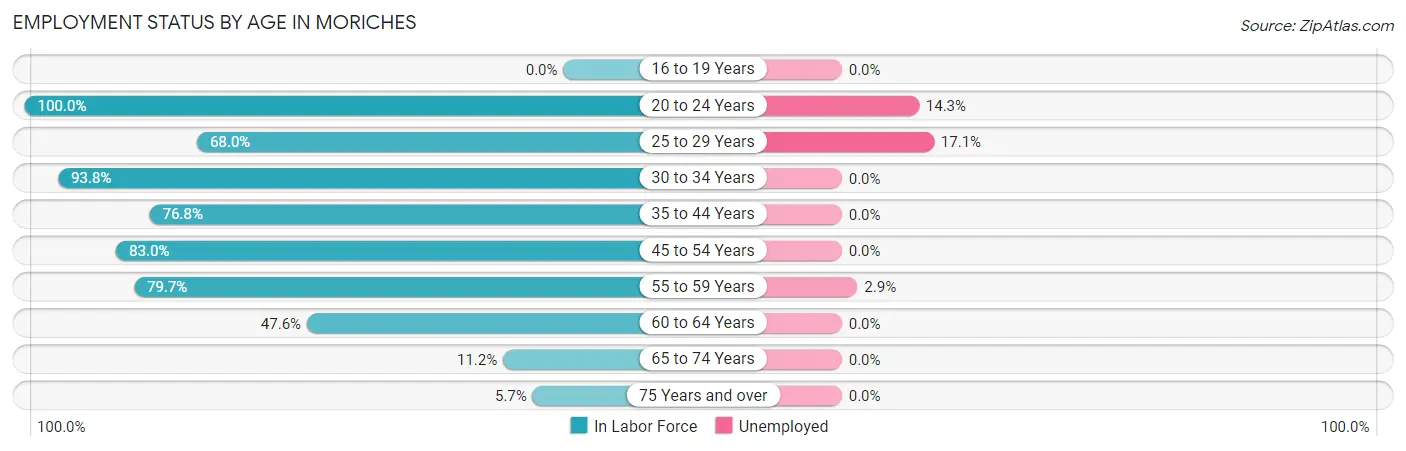
| Age Bracket | In Labor Force | Unemployed |
| 16 to 19 Years | 0 (0.0%) | 0 (0.0%) |
| 20 to 24 Years | 154 (100.0%) | 22 (14.3%) |
| 25 to 29 Years | 117 (68.0%) | 20 (17.1%) |
| 30 to 34 Years | 272 (93.8%) | 0 (0.0%) |
| 35 to 44 Years | 185 (76.8%) | 0 (0.0%) |
| 45 to 54 Years | 151 (83.0%) | 0 (0.0%) |
| 55 to 59 Years | 137 (79.7%) | 4 (2.9%) |
| 60 to 64 Years | 141 (47.6%) | 0 (0.0%) |
| 65 to 74 Years | 47 (11.2%) | 0 (0.0%) |
| 75 Years and over | 17 (5.7%) | 0 (0.0%) |
| Total | 1,222 (54.3%) | 46 (3.8%) |
Employment Status by Educational Attainment in Moriches
According to labor force statistics for Moriches, 74.1% of individuals (1,003) out of the total population between 25 and 64 years of age (1,353) are in the labor force, with 2.4% or 24 of them being unemployed. The group with the highest labor force participation rate are those with the educational attainment of bachelor's degree or higher, with 90.1% or 400 individuals in the labor force. Within the labor force, individuals with college / associate degree education have the highest percentage of unemployment, with 6.4% or 20 of them being unemployed.
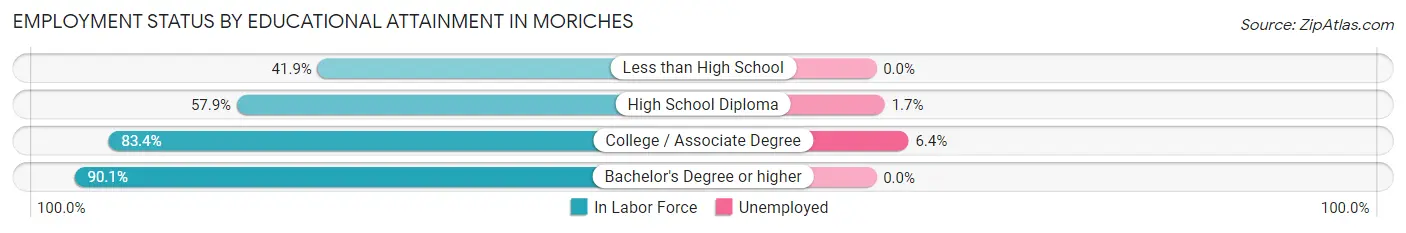
| Educational Attainment | In Labor Force | Unemployed |
| Less than High School | 49 (41.9%) | 0 (0.0%) |
| High School Diploma | 242 (57.9%) | 7 (1.7%) |
| College / Associate Degree | 312 (83.4%) | 24 (6.4%) |
| Bachelor's Degree or higher | 400 (90.1%) | 0 (0.0%) |
| Total | 1,003 (74.1%) | 32 (2.4%) |
Employment Occupations by Sex in Moriches
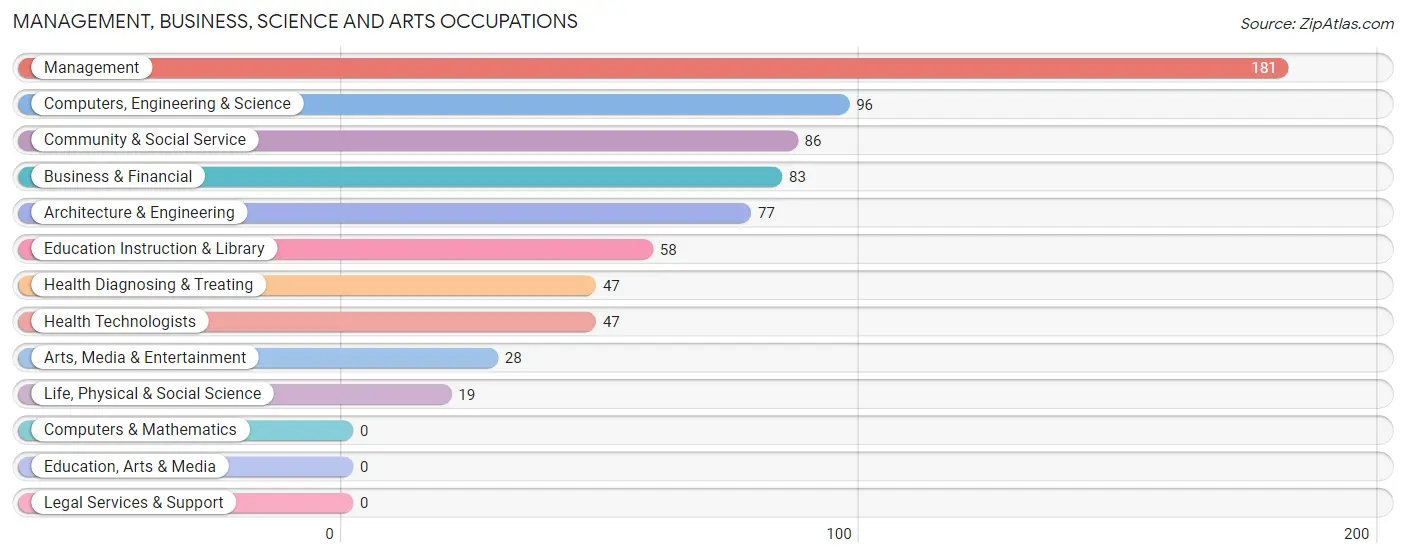
Management, Business, Science and Arts Occupations
The most common Management, Business, Science and Arts occupations in Moriches are Management (181 | 15.4%), Computers, Engineering & Science (96 | 8.2%), Community & Social Service (86 | 7.3%), Business & Financial (83 | 7.1%), and Architecture & Engineering (77 | 6.6%).
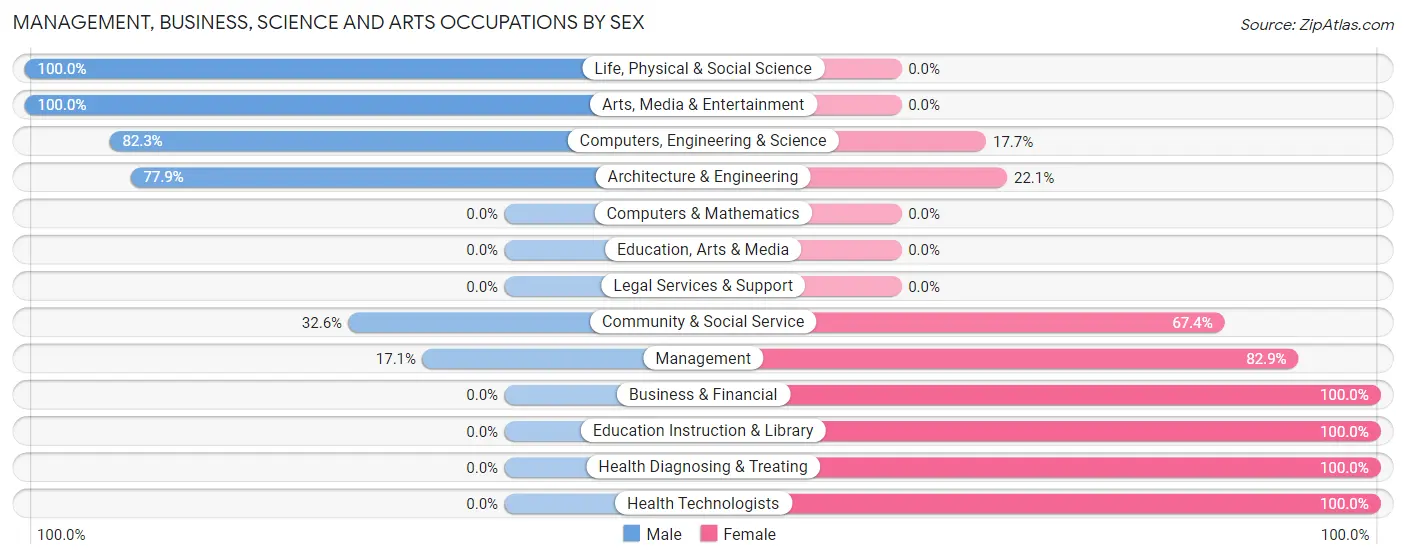
Management, Business, Science and Arts Occupations by Sex
Within the Management, Business, Science and Arts occupations in Moriches, the most male-oriented occupations are Life, Physical & Social Science (100.0%), Arts, Media & Entertainment (100.0%), and Computers, Engineering & Science (82.3%), while the most female-oriented occupations are Business & Financial (100.0%), Education Instruction & Library (100.0%), and Health Diagnosing & Treating (100.0%).
| Occupation | Male | Female |
| Management | 31 (17.1%) | 150 (82.9%) |
| Business & Financial | 0 (0.0%) | 83 (100.0%) |
| Computers, Engineering & Science | 79 (82.3%) | 17 (17.7%) |
| Computers & Mathematics | 0 (0.0%) | 0 (0.0%) |
| Architecture & Engineering | 60 (77.9%) | 17 (22.1%) |
| Life, Physical & Social Science | 19 (100.0%) | 0 (0.0%) |
| Community & Social Service | 28 (32.6%) | 58 (67.4%) |
| Education, Arts & Media | 0 (0.0%) | 0 (0.0%) |
| Legal Services & Support | 0 (0.0%) | 0 (0.0%) |
| Education Instruction & Library | 0 (0.0%) | 58 (100.0%) |
| Arts, Media & Entertainment | 28 (100.0%) | 0 (0.0%) |
| Health Diagnosing & Treating | 0 (0.0%) | 47 (100.0%) |
| Health Technologists | 0 (0.0%) | 47 (100.0%) |
| Total (Category) | 138 (28.0%) | 355 (72.0%) |
| Total (Overall) | 631 (53.7%) | 544 (46.3%) |
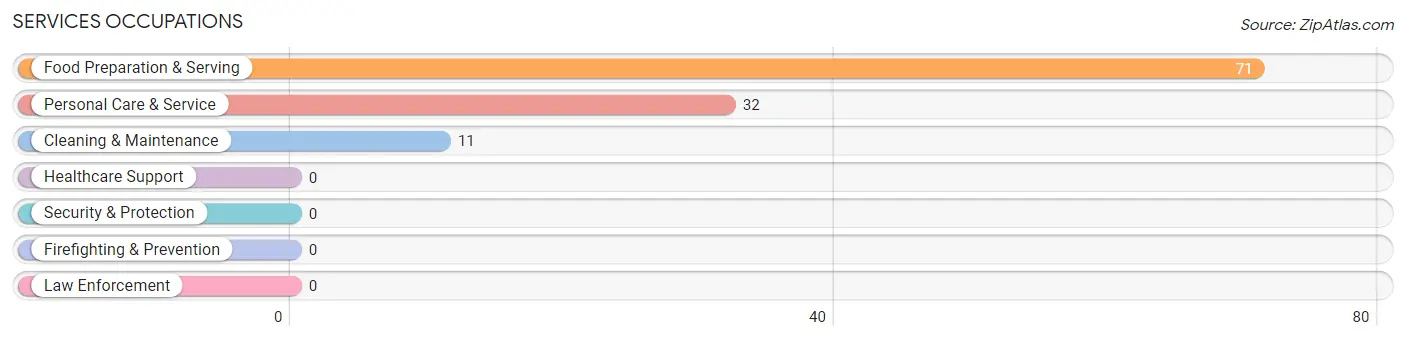
Services Occupations
The most common Services occupations in Moriches are Food Preparation & Serving (71 | 6.0%), Personal Care & Service (32 | 2.7%), and Cleaning & Maintenance (11 | 0.9%).
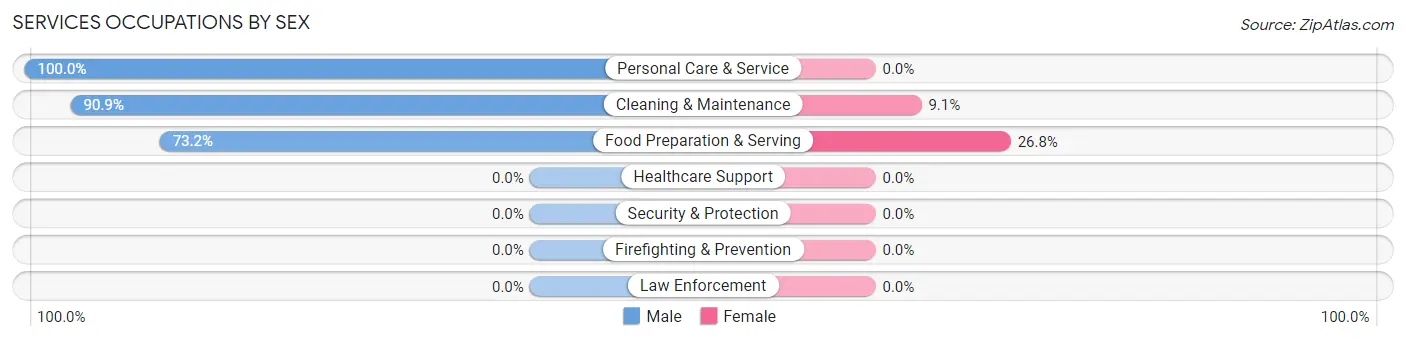
Services Occupations by Sex
Within the Services occupations in Moriches, the most male-oriented occupations are Personal Care & Service (100.0%), Cleaning & Maintenance (90.9%), and Food Preparation & Serving (73.2%), while the most female-oriented occupations are Food Preparation & Serving (26.8%), and Cleaning & Maintenance (9.1%).
| Occupation | Male | Female |
| Healthcare Support | 0 (0.0%) | 0 (0.0%) |
| Security & Protection | 0 (0.0%) | 0 (0.0%) |
| Firefighting & Prevention | 0 (0.0%) | 0 (0.0%) |
| Law Enforcement | 0 (0.0%) | 0 (0.0%) |
| Food Preparation & Serving | 52 (73.2%) | 19 (26.8%) |
| Cleaning & Maintenance | 10 (90.9%) | 1 (9.1%) |
| Personal Care & Service | 32 (100.0%) | 0 (0.0%) |
| Total (Category) | 94 (82.5%) | 20 (17.5%) |
| Total (Overall) | 631 (53.7%) | 544 (46.3%) |
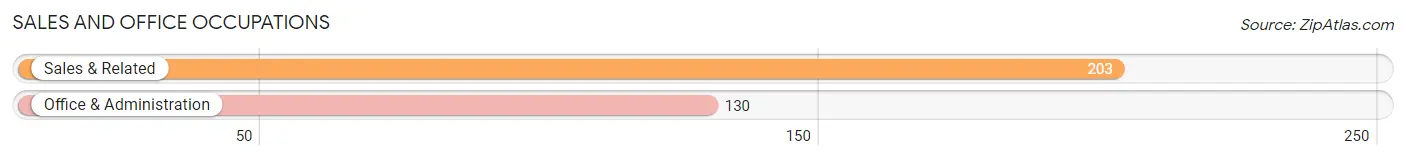
Sales and Office Occupations
The most common Sales and Office occupations in Moriches are Sales & Related (203 | 17.3%), and Office & Administration (130 | 11.1%).
Sales and Office Occupations by Sex
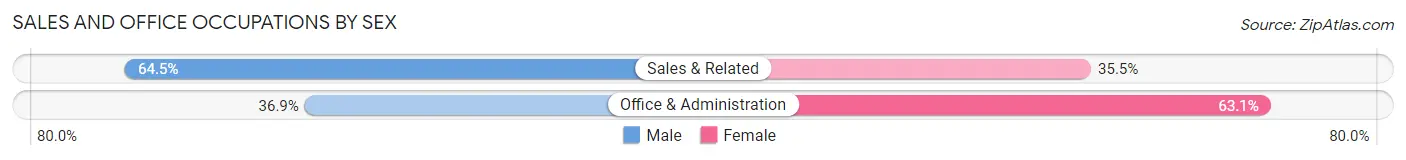
| Occupation | Male | Female |
| Sales & Related | 131 (64.5%) | 72 (35.5%) |
| Office & Administration | 48 (36.9%) | 82 (63.1%) |
| Total (Category) | 179 (53.7%) | 154 (46.3%) |
| Total (Overall) | 631 (53.7%) | 544 (46.3%) |
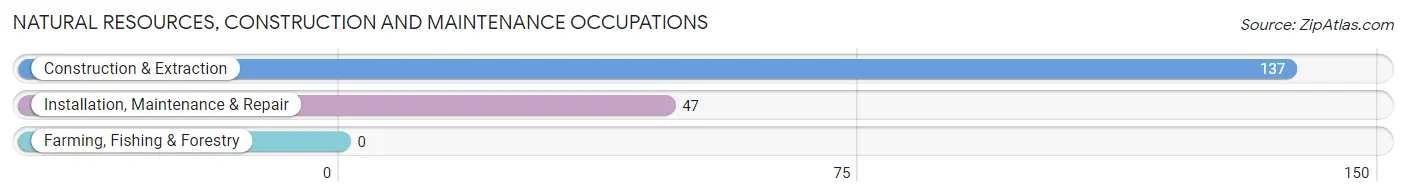
Natural Resources, Construction and Maintenance Occupations
The most common Natural Resources, Construction and Maintenance occupations in Moriches are Construction & Extraction (137 | 11.7%), and Installation, Maintenance & Repair (47 | 4.0%).
Natural Resources, Construction and Maintenance Occupations by Sex
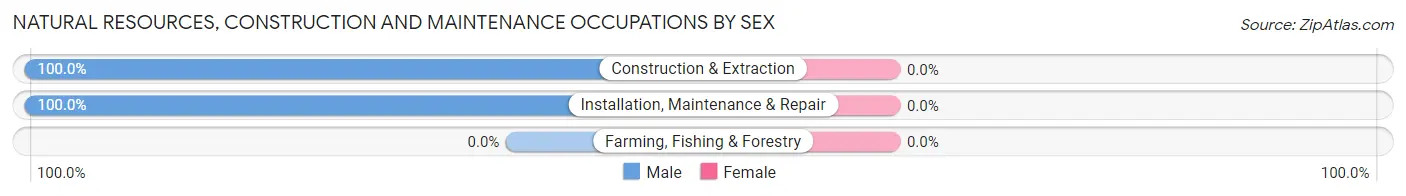
| Occupation | Male | Female |
| Farming, Fishing & Forestry | 0 (0.0%) | 0 (0.0%) |
| Construction & Extraction | 137 (100.0%) | 0 (0.0%) |
| Installation, Maintenance & Repair | 47 (100.0%) | 0 (0.0%) |
| Total (Category) | 184 (100.0%) | 0 (0.0%) |
| Total (Overall) | 631 (53.7%) | 544 (46.3%) |
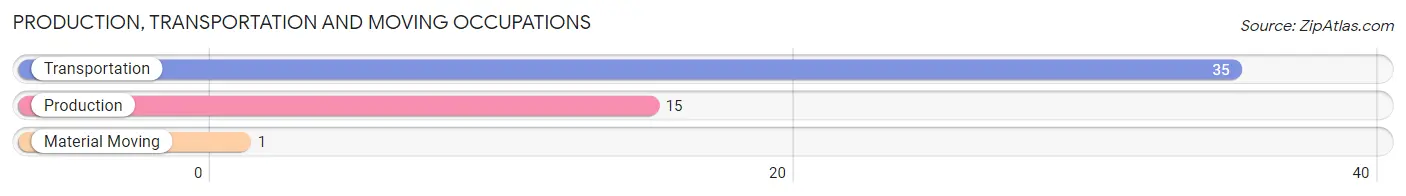
Production, Transportation and Moving Occupations
The most common Production, Transportation and Moving occupations in Moriches are Transportation (35 | 3.0%), Production (15 | 1.3%), and Material Moving (1 | 0.1%).
Production, Transportation and Moving Occupations by Sex
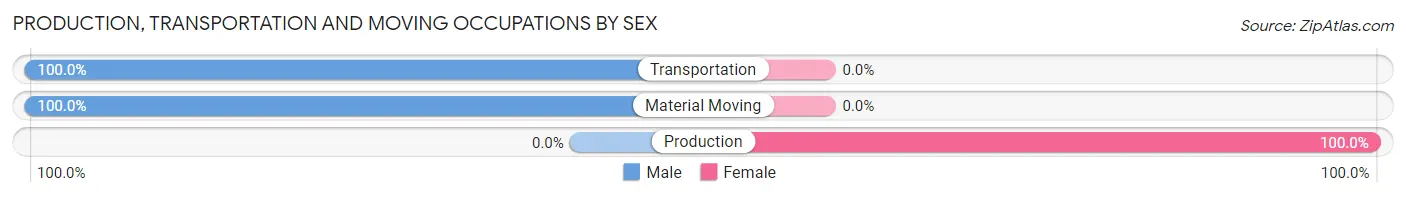
| Occupation | Male | Female |
| Production | 0 (0.0%) | 15 (100.0%) |
| Transportation | 35 (100.0%) | 0 (0.0%) |
| Material Moving | 1 (100.0%) | 0 (0.0%) |
| Total (Category) | 36 (70.6%) | 15 (29.4%) |
| Total (Overall) | 631 (53.7%) | 544 (46.3%) |
Employment Industries by Sex in Moriches
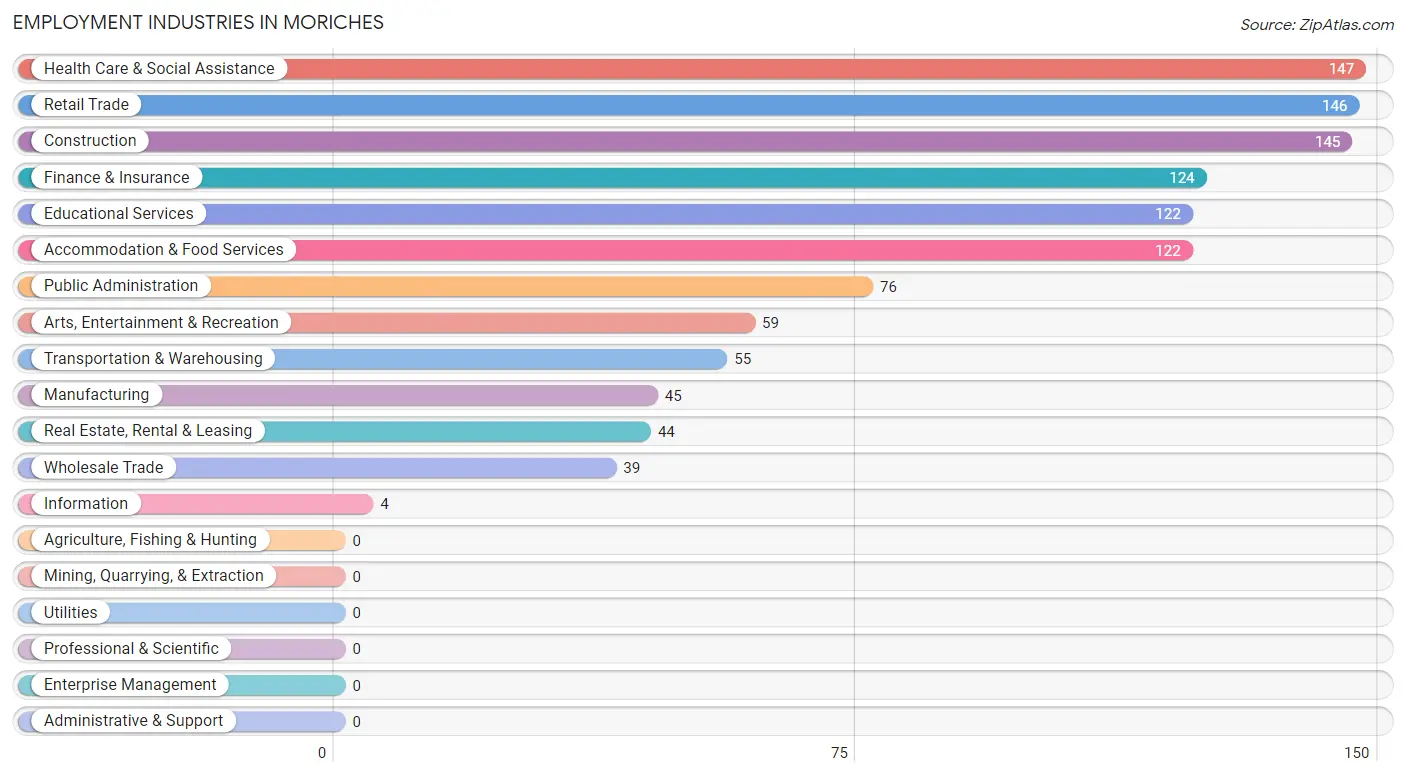
Employment Industries in Moriches
The major employment industries in Moriches include Health Care & Social Assistance (147 | 12.5%), Retail Trade (146 | 12.4%), Construction (145 | 12.3%), Finance & Insurance (124 | 10.5%), and Educational Services (122 | 10.4%).
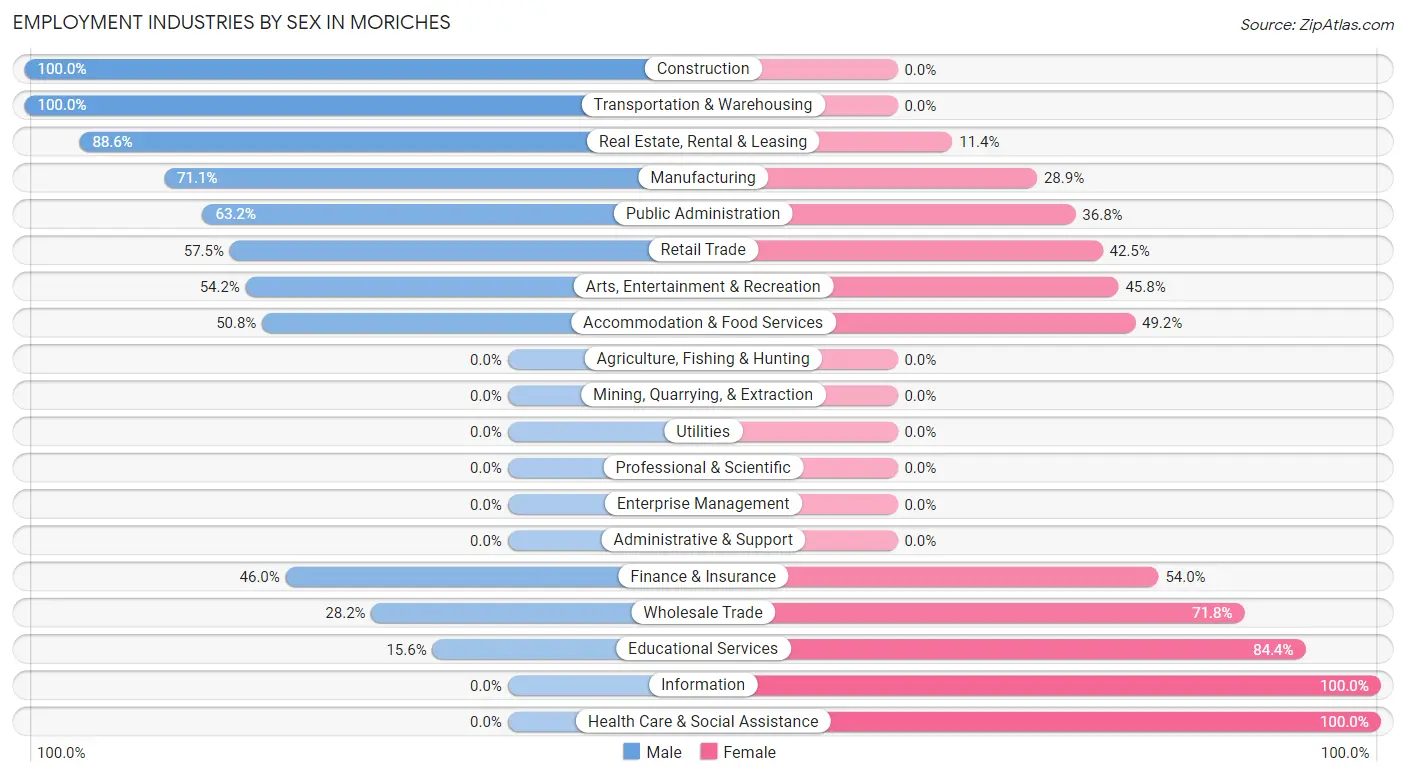
Employment Industries by Sex in Moriches
The Moriches industries that see more men than women are Construction (100.0%), Transportation & Warehousing (100.0%), and Real Estate, Rental & Leasing (88.6%), whereas the industries that tend to have a higher number of women are Information (100.0%), Health Care & Social Assistance (100.0%), and Educational Services (84.4%).
| Industry | Male | Female |
| Agriculture, Fishing & Hunting | 0 (0.0%) | 0 (0.0%) |
| Mining, Quarrying, & Extraction | 0 (0.0%) | 0 (0.0%) |
| Construction | 145 (100.0%) | 0 (0.0%) |
| Manufacturing | 32 (71.1%) | 13 (28.9%) |
| Wholesale Trade | 11 (28.2%) | 28 (71.8%) |
| Retail Trade | 84 (57.5%) | 62 (42.5%) |
| Transportation & Warehousing | 55 (100.0%) | 0 (0.0%) |
| Utilities | 0 (0.0%) | 0 (0.0%) |
| Information | 0 (0.0%) | 4 (100.0%) |
| Finance & Insurance | 57 (46.0%) | 67 (54.0%) |
| Real Estate, Rental & Leasing | 39 (88.6%) | 5 (11.4%) |
| Professional & Scientific | 0 (0.0%) | 0 (0.0%) |
| Enterprise Management | 0 (0.0%) | 0 (0.0%) |
| Administrative & Support | 0 (0.0%) | 0 (0.0%) |
| Educational Services | 19 (15.6%) | 103 (84.4%) |
| Health Care & Social Assistance | 0 (0.0%) | 147 (100.0%) |
| Arts, Entertainment & Recreation | 32 (54.2%) | 27 (45.8%) |
| Accommodation & Food Services | 62 (50.8%) | 60 (49.2%) |
| Public Administration | 48 (63.2%) | 28 (36.8%) |
| Total | 631 (53.7%) | 544 (46.3%) |
Education in Moriches
School Enrollment in Moriches
The most common levels of schooling among the 246 students in Moriches are college / undergraduate (69 | 28.1%), nursery / preschool (47 | 19.1%), and middle school (44 | 17.9%).
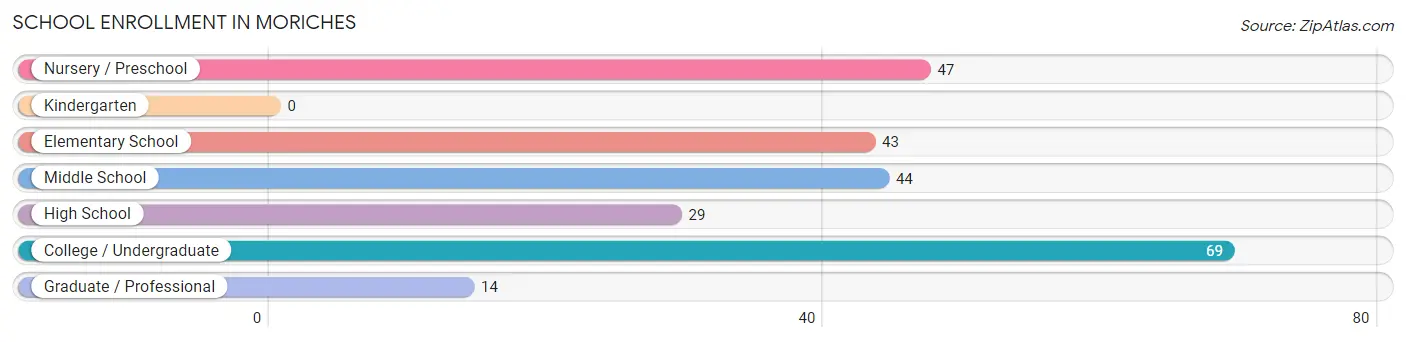
| School Level | # Students | % Students |
| Nursery / Preschool | 47 | 19.1% |
| Kindergarten | 0 | 0.0% |
| Elementary School | 43 | 17.5% |
| Middle School | 44 | 17.9% |
| High School | 29 | 11.8% |
| College / Undergraduate | 69 | 28.1% |
| Graduate / Professional | 14 | 5.7% |
| Total | 246 | 100.0% |
School Enrollment by Age by Funding Source in Moriches
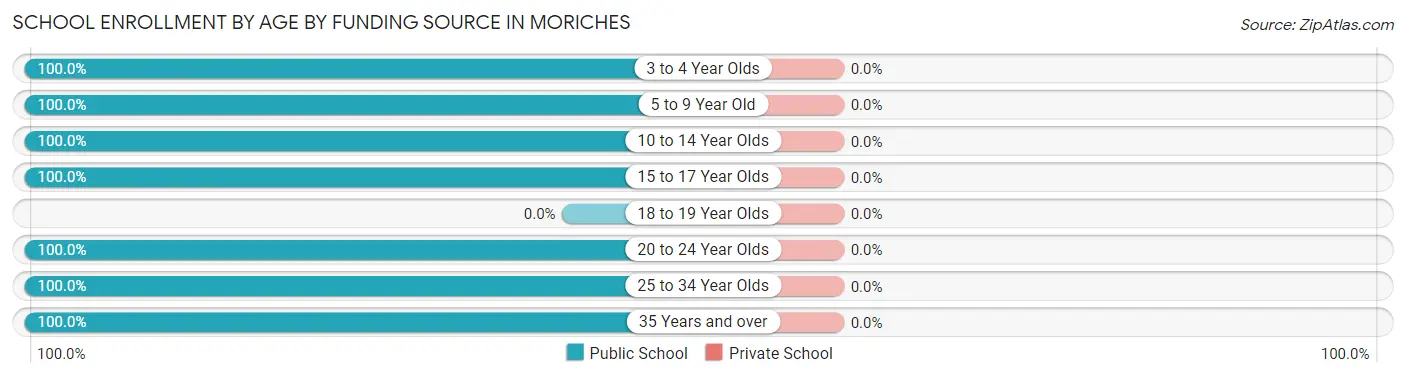
| Age Bracket | Public School | Private School |
| 3 to 4 Year Olds | 25 (100.0%) | 0 (0.0%) |
| 5 to 9 Year Old | 65 (100.0%) | 0 (0.0%) |
| 10 to 14 Year Olds | 44 (100.0%) | 0 (0.0%) |
| 15 to 17 Year Olds | 29 (100.0%) | 0 (0.0%) |
| 18 to 19 Year Olds | 0 (0.0%) | 0 (0.0%) |
| 20 to 24 Year Olds | 41 (100.0%) | 0 (0.0%) |
| 25 to 34 Year Olds | 28 (100.0%) | 0 (0.0%) |
| 35 Years and over | 14 (100.0%) | 0 (0.0%) |
| Total | 246 (100.0%) | 0 (0.0%) |
Educational Attainment by Field of Study in Moriches
Business (120 | 16.3%), science & technology (96 | 13.0%), social sciences (92 | 12.5%), education (75 | 10.2%), and physical & health sciences (70 | 9.5%) are the most common fields of study among 736 individuals in Moriches who have obtained a bachelor's degree or higher.
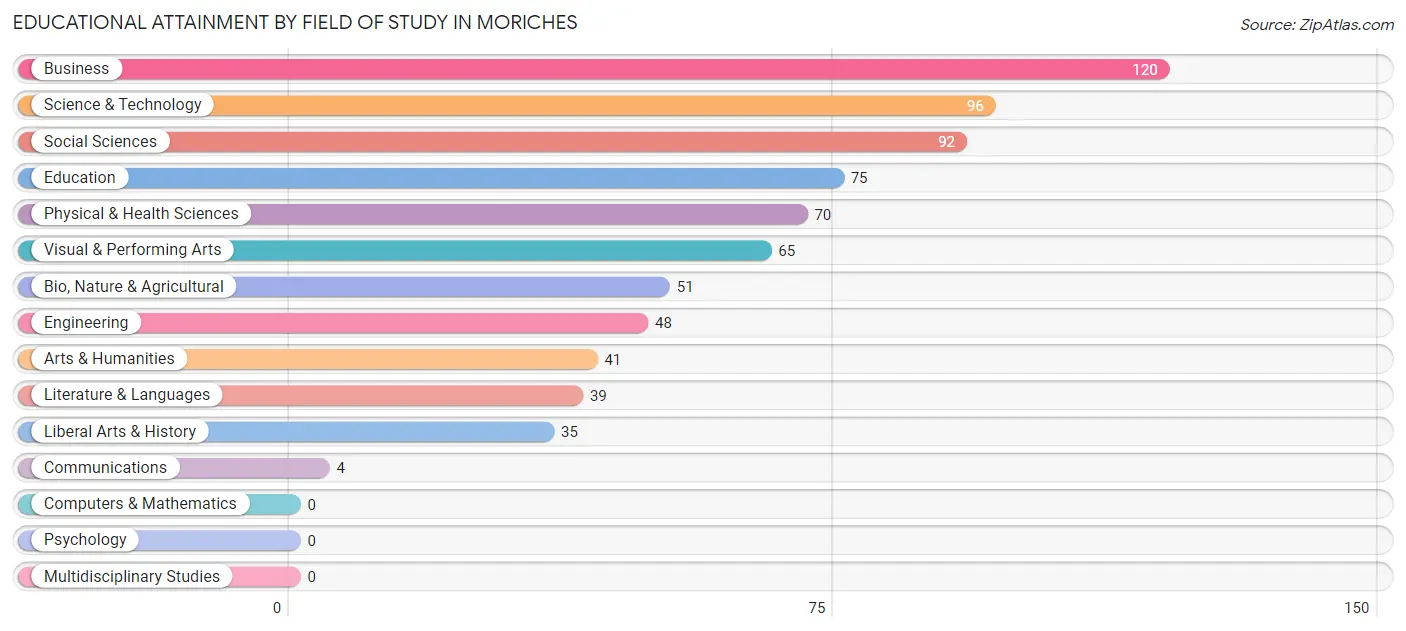
| Field of Study | # Graduates | % Graduates |
| Computers & Mathematics | 0 | 0.0% |
| Bio, Nature & Agricultural | 51 | 6.9% |
| Physical & Health Sciences | 70 | 9.5% |
| Psychology | 0 | 0.0% |
| Social Sciences | 92 | 12.5% |
| Engineering | 48 | 6.5% |
| Multidisciplinary Studies | 0 | 0.0% |
| Science & Technology | 96 | 13.0% |
| Business | 120 | 16.3% |
| Education | 75 | 10.2% |
| Literature & Languages | 39 | 5.3% |
| Liberal Arts & History | 35 | 4.8% |
| Visual & Performing Arts | 65 | 8.8% |
| Communications | 4 | 0.5% |
| Arts & Humanities | 41 | 5.6% |
| Total | 736 | 100.0% |
Transportation & Commute in Moriches
Vehicle Availability by Sex in Moriches
The most prevalent vehicle ownership categories in Moriches are males with 2 vehicles (242, accounting for 40.9%) and females with 2 vehicles (167, making up 44.7%).
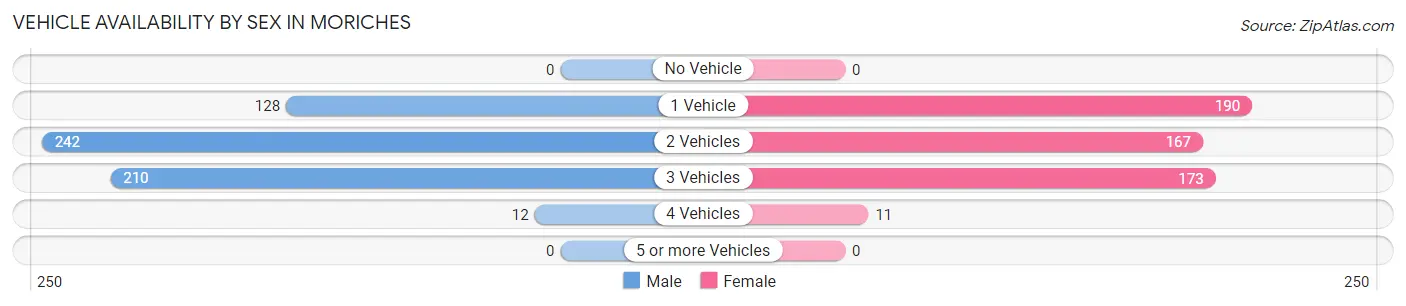
| Vehicles Available | Male | Female |
| No Vehicle | 0 (0.0%) | 0 (0.0%) |
| 1 Vehicle | 128 (21.6%) | 190 (35.1%) |
| 2 Vehicles | 242 (40.9%) | 167 (30.9%) |
| 3 Vehicles | 210 (35.5%) | 173 (32.0%) |
| 4 Vehicles | 12 (2.0%) | 11 (2.0%) |
| 5 or more Vehicles | 0 (0.0%) | 0 (0.0%) |
| Total | 592 (100.0%) | 541 (100.0%) |
Commute Time in Moriches
The most frequently occuring commute durations in Moriches are 20 to 24 minutes (265 commuters, 23.9%), 30 to 34 minutes (175 commuters, 15.8%), and 25 to 29 minutes (144 commuters, 13.0%).
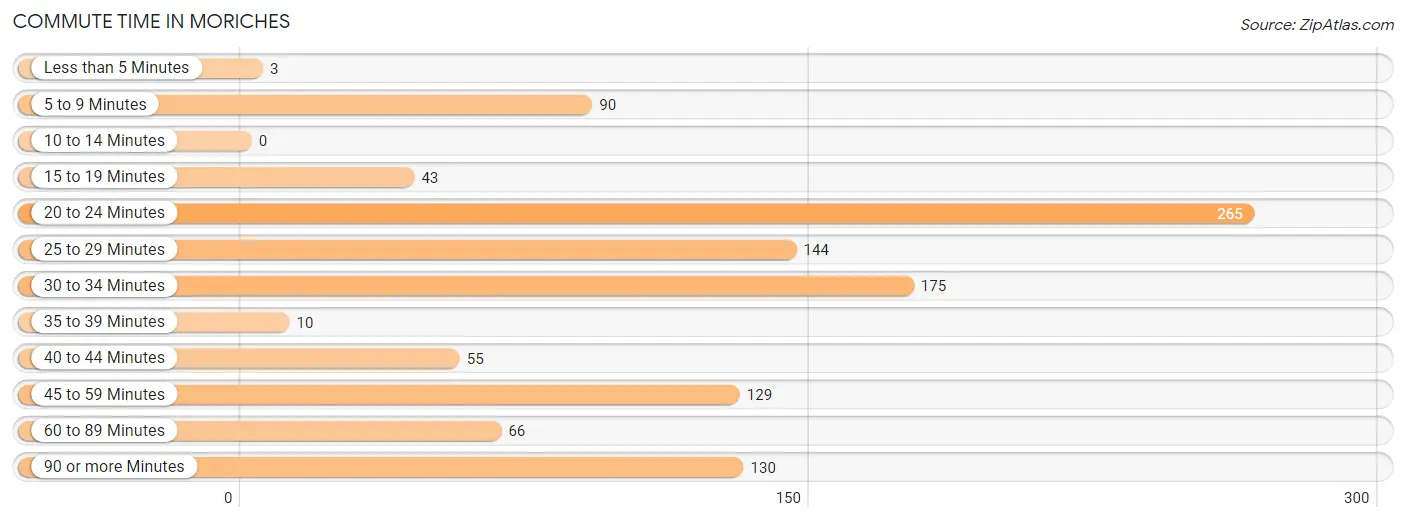
| Commute Time | # Commuters | % Commuters |
| Less than 5 Minutes | 3 | 0.3% |
| 5 to 9 Minutes | 90 | 8.1% |
| 10 to 14 Minutes | 0 | 0.0% |
| 15 to 19 Minutes | 43 | 3.9% |
| 20 to 24 Minutes | 265 | 23.9% |
| 25 to 29 Minutes | 144 | 13.0% |
| 30 to 34 Minutes | 175 | 15.8% |
| 35 to 39 Minutes | 10 | 0.9% |
| 40 to 44 Minutes | 55 | 5.0% |
| 45 to 59 Minutes | 129 | 11.6% |
| 60 to 89 Minutes | 66 | 5.9% |
| 90 or more Minutes | 130 | 11.7% |
Commute Time by Sex in Moriches
The most common commute times in Moriches are 20 to 24 minutes (147 commuters, 24.8%) for males and 20 to 24 minutes (118 commuters, 22.8%) for females.
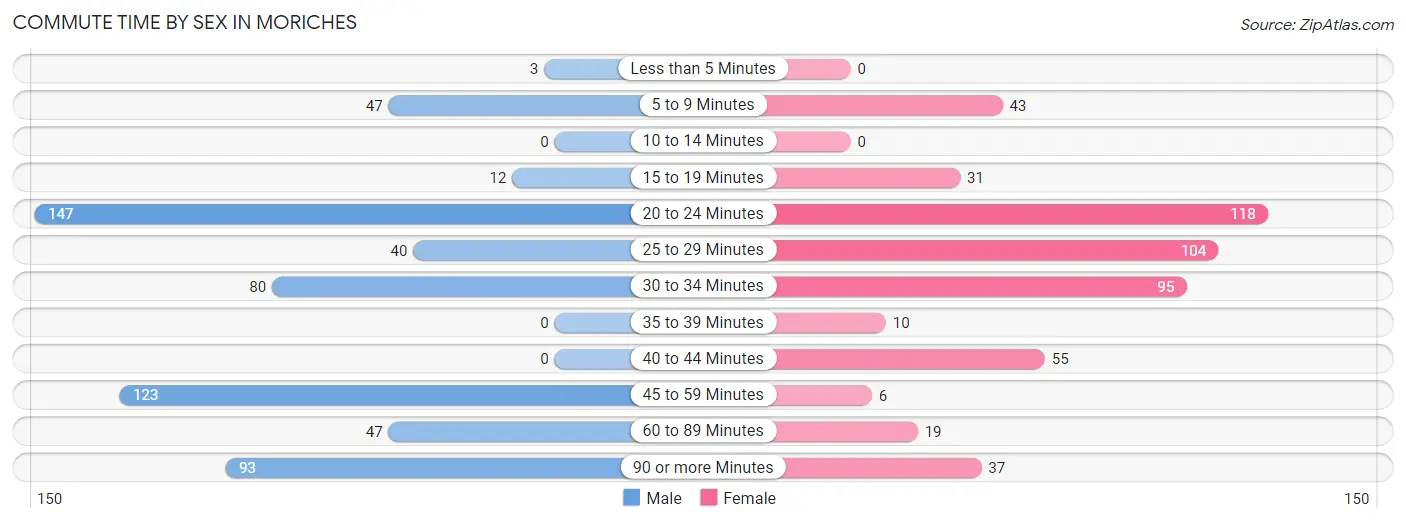
| Commute Time | Male | Female |
| Less than 5 Minutes | 3 (0.5%) | 0 (0.0%) |
| 5 to 9 Minutes | 47 (7.9%) | 43 (8.3%) |
| 10 to 14 Minutes | 0 (0.0%) | 0 (0.0%) |
| 15 to 19 Minutes | 12 (2.0%) | 31 (6.0%) |
| 20 to 24 Minutes | 147 (24.8%) | 118 (22.8%) |
| 25 to 29 Minutes | 40 (6.8%) | 104 (20.1%) |
| 30 to 34 Minutes | 80 (13.5%) | 95 (18.3%) |
| 35 to 39 Minutes | 0 (0.0%) | 10 (1.9%) |
| 40 to 44 Minutes | 0 (0.0%) | 55 (10.6%) |
| 45 to 59 Minutes | 123 (20.8%) | 6 (1.2%) |
| 60 to 89 Minutes | 47 (7.9%) | 19 (3.7%) |
| 90 or more Minutes | 93 (15.7%) | 37 (7.1%) |
Time of Departure to Work by Sex in Moriches
The most frequent times of departure to work in Moriches are 7:00 AM to 7:29 AM (151, 25.5%) for males and 7:30 AM to 7:59 AM (80, 15.4%) for females.
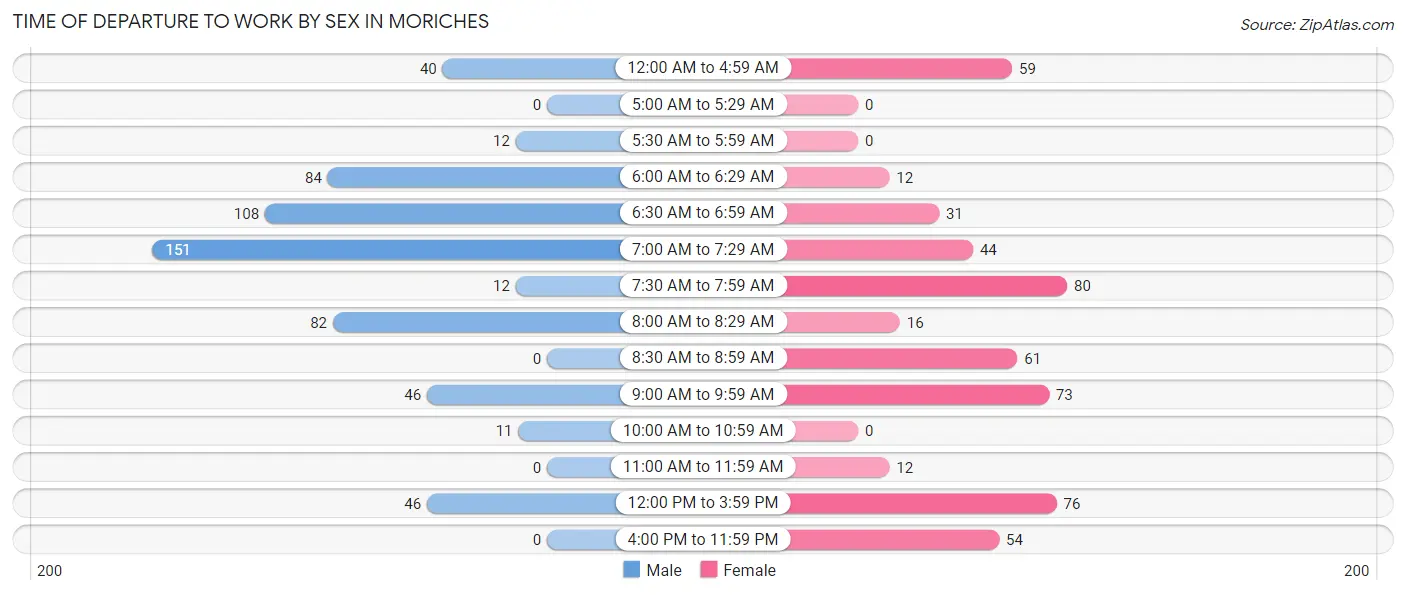
| Time of Departure | Male | Female |
| 12:00 AM to 4:59 AM | 40 (6.8%) | 59 (11.4%) |
| 5:00 AM to 5:29 AM | 0 (0.0%) | 0 (0.0%) |
| 5:30 AM to 5:59 AM | 12 (2.0%) | 0 (0.0%) |
| 6:00 AM to 6:29 AM | 84 (14.2%) | 12 (2.3%) |
| 6:30 AM to 6:59 AM | 108 (18.2%) | 31 (6.0%) |
| 7:00 AM to 7:29 AM | 151 (25.5%) | 44 (8.5%) |
| 7:30 AM to 7:59 AM | 12 (2.0%) | 80 (15.4%) |
| 8:00 AM to 8:29 AM | 82 (13.9%) | 16 (3.1%) |
| 8:30 AM to 8:59 AM | 0 (0.0%) | 61 (11.8%) |
| 9:00 AM to 9:59 AM | 46 (7.8%) | 73 (14.1%) |
| 10:00 AM to 10:59 AM | 11 (1.9%) | 0 (0.0%) |
| 11:00 AM to 11:59 AM | 0 (0.0%) | 12 (2.3%) |
| 12:00 PM to 3:59 PM | 46 (7.8%) | 76 (14.7%) |
| 4:00 PM to 11:59 PM | 0 (0.0%) | 54 (10.4%) |
| Total | 592 (100.0%) | 518 (100.0%) |
Housing Occupancy in Moriches
Occupancy by Ownership in Moriches
Of the total 1,269 dwellings in Moriches, owner-occupied units account for 627 (49.4%), while renter-occupied units make up 642 (50.6%).
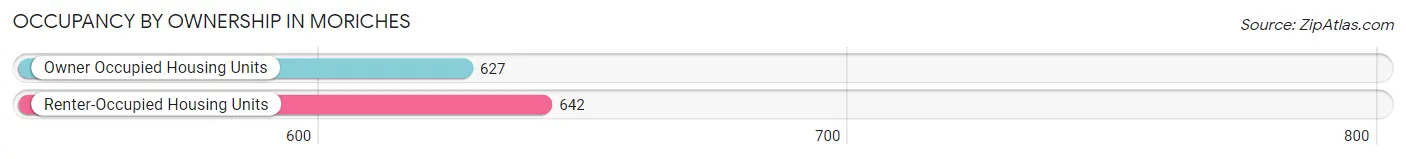
| Occupancy | # Housing Units | % Housing Units |
| Owner Occupied Housing Units | 627 | 49.4% |
| Renter-Occupied Housing Units | 642 | 50.6% |
| Total Occupied Housing Units | 1,269 | 100.0% |
Occupancy by Household Size in Moriches
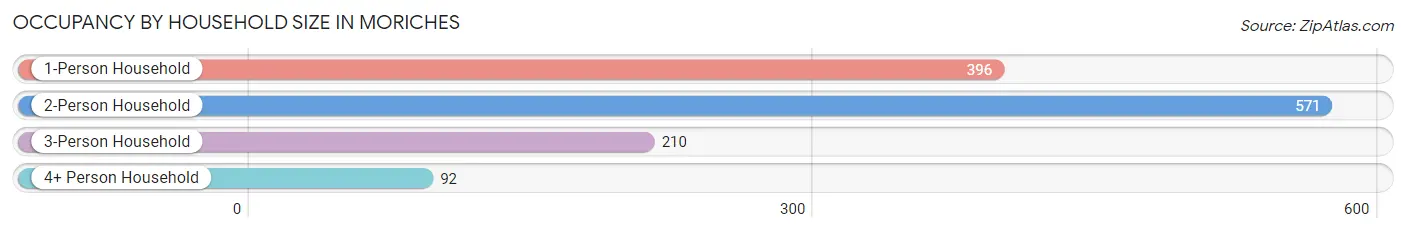
| Household Size | # Housing Units | % Housing Units |
| 1-Person Household | 396 | 31.2% |
| 2-Person Household | 571 | 45.0% |
| 3-Person Household | 210 | 16.6% |
| 4+ Person Household | 92 | 7.2% |
| Total Housing Units | 1,269 | 100.0% |
Occupancy by Ownership by Household Size in Moriches
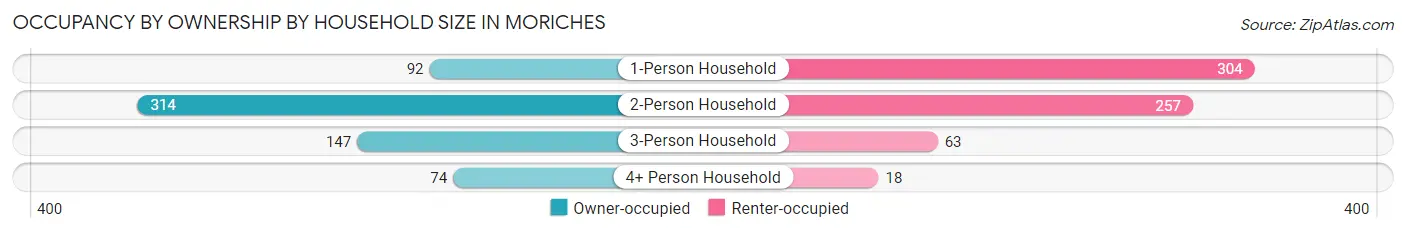
| Household Size | Owner-occupied | Renter-occupied |
| 1-Person Household | 92 (23.2%) | 304 (76.8%) |
| 2-Person Household | 314 (55.0%) | 257 (45.0%) |
| 3-Person Household | 147 (70.0%) | 63 (30.0%) |
| 4+ Person Household | 74 (80.4%) | 18 (19.6%) |
| Total Housing Units | 627 (49.4%) | 642 (50.6%) |
Occupancy by Educational Attainment in Moriches
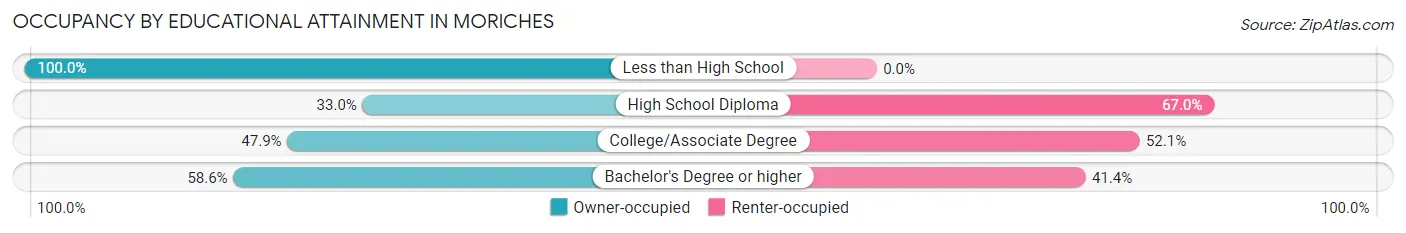
| Household Size | Owner-occupied | Renter-occupied |
| Less than High School | 37 (100.0%) | 0 (0.0%) |
| High School Diploma | 124 (33.0%) | 252 (67.0%) |
| College/Associate Degree | 159 (47.9%) | 173 (52.1%) |
| Bachelor's Degree or higher | 307 (58.6%) | 217 (41.4%) |
Occupancy by Age of Householder in Moriches
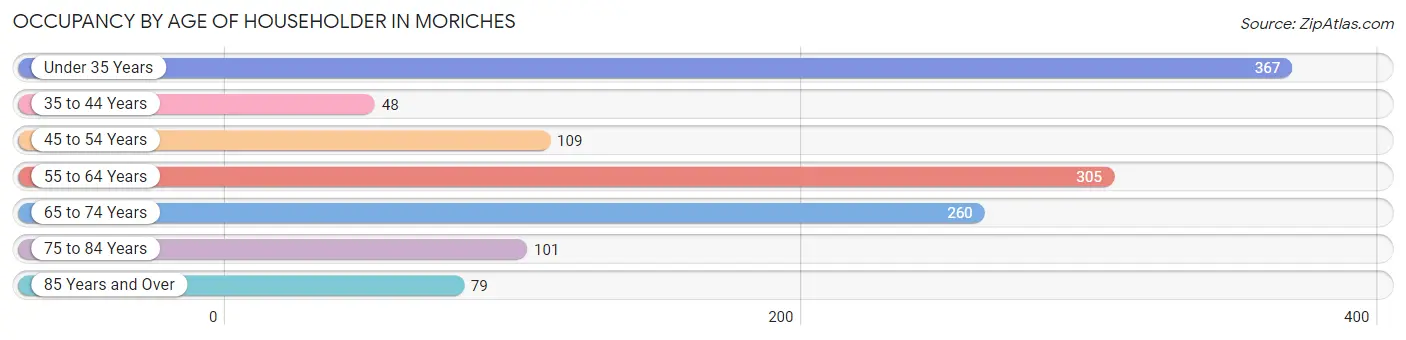
| Age Bracket | # Households | % Households |
| Under 35 Years | 367 | 28.9% |
| 35 to 44 Years | 48 | 3.8% |
| 45 to 54 Years | 109 | 8.6% |
| 55 to 64 Years | 305 | 24.0% |
| 65 to 74 Years | 260 | 20.5% |
| 75 to 84 Years | 101 | 8.0% |
| 85 Years and Over | 79 | 6.2% |
| Total | 1,269 | 100.0% |
Housing Finances in Moriches
Median Income by Occupancy in Moriches
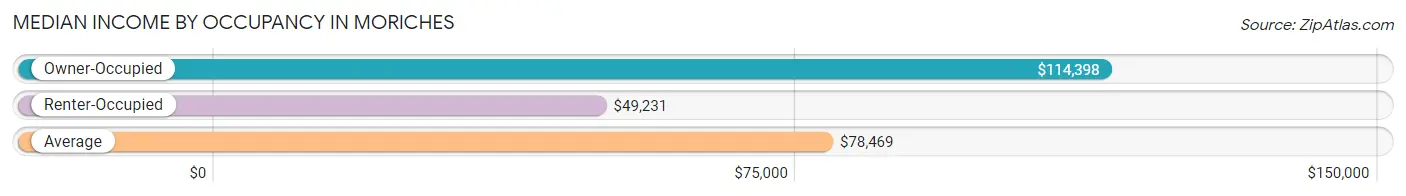
| Occupancy Type | # Households | Median Income |
| Owner-Occupied | 627 (49.4%) | $114,398 |
| Renter-Occupied | 642 (50.6%) | $49,231 |
| Average | 1,269 (100.0%) | $78,469 |
Occupancy by Householder Income Bracket in Moriches
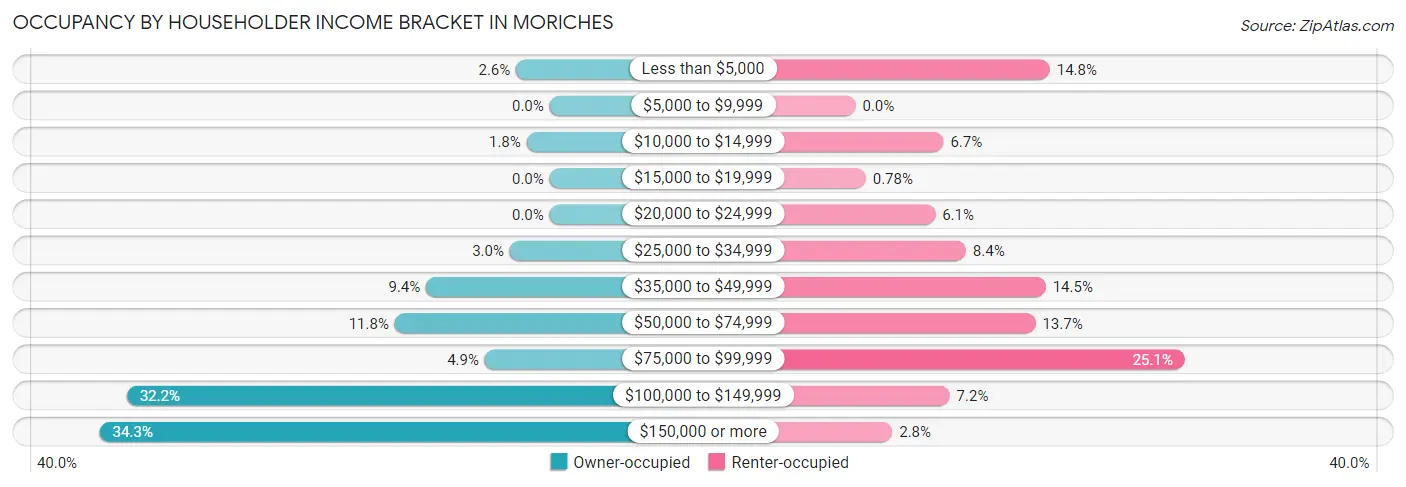
| Income Bracket | Owner-occupied | Renter-occupied |
| Less than $5,000 | 16 (2.5%) | 95 (14.8%) |
| $5,000 to $9,999 | 0 (0.0%) | 0 (0.0%) |
| $10,000 to $14,999 | 11 (1.8%) | 43 (6.7%) |
| $15,000 to $19,999 | 0 (0.0%) | 5 (0.8%) |
| $20,000 to $24,999 | 0 (0.0%) | 39 (6.1%) |
| $25,000 to $34,999 | 19 (3.0%) | 54 (8.4%) |
| $35,000 to $49,999 | 59 (9.4%) | 93 (14.5%) |
| $50,000 to $74,999 | 74 (11.8%) | 88 (13.7%) |
| $75,000 to $99,999 | 31 (4.9%) | 161 (25.1%) |
| $100,000 to $149,999 | 202 (32.2%) | 46 (7.2%) |
| $150,000 or more | 215 (34.3%) | 18 (2.8%) |
| Total | 627 (100.0%) | 642 (100.0%) |
Monthly Housing Cost Tiers in Moriches
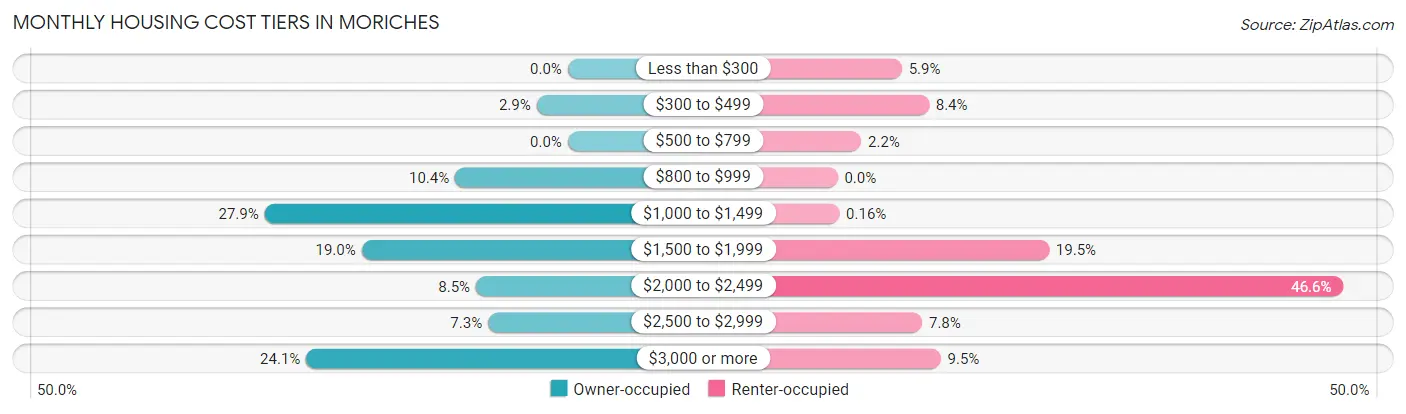
| Monthly Cost | Owner-occupied | Renter-occupied |
| Less than $300 | 0 (0.0%) | 38 (5.9%) |
| $300 to $499 | 18 (2.9%) | 54 (8.4%) |
| $500 to $799 | 0 (0.0%) | 14 (2.2%) |
| $800 to $999 | 65 (10.4%) | 0 (0.0%) |
| $1,000 to $1,499 | 175 (27.9%) | 1 (0.2%) |
| $1,500 to $1,999 | 119 (19.0%) | 125 (19.5%) |
| $2,000 to $2,499 | 53 (8.5%) | 299 (46.6%) |
| $2,500 to $2,999 | 46 (7.3%) | 50 (7.8%) |
| $3,000 or more | 151 (24.1%) | 61 (9.5%) |
| Total | 627 (100.0%) | 642 (100.0%) |
Physical Housing Characteristics in Moriches
Housing Structures in Moriches
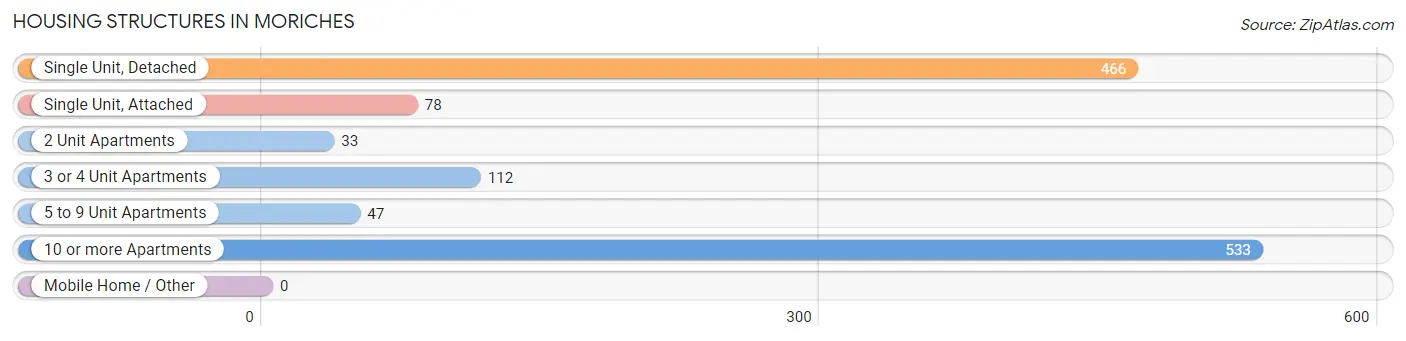
| Structure Type | # Housing Units | % Housing Units |
| Single Unit, Detached | 466 | 36.7% |
| Single Unit, Attached | 78 | 6.1% |
| 2 Unit Apartments | 33 | 2.6% |
| 3 or 4 Unit Apartments | 112 | 8.8% |
| 5 to 9 Unit Apartments | 47 | 3.7% |
| 10 or more Apartments | 533 | 42.0% |
| Mobile Home / Other | 0 | 0.0% |
| Total | 1,269 | 100.0% |
Housing Structures by Occupancy in Moriches
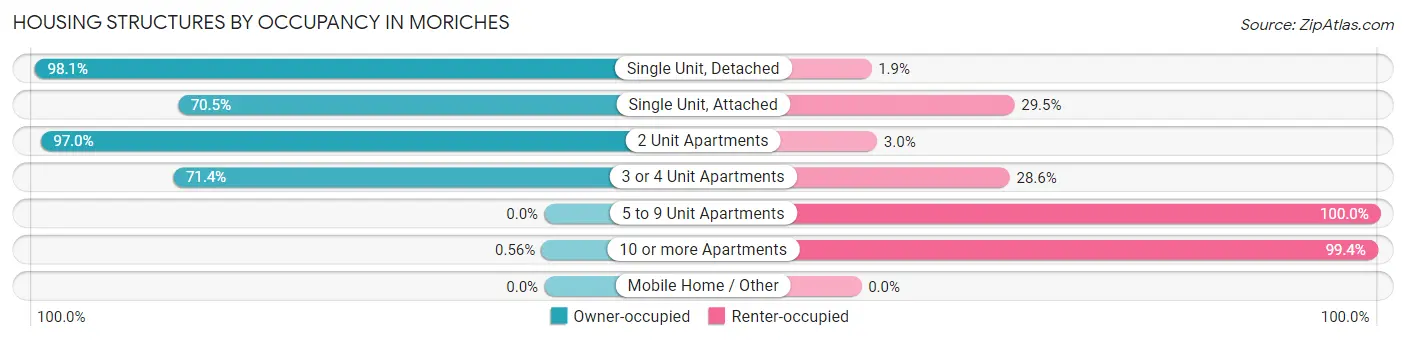
| Structure Type | Owner-occupied | Renter-occupied |
| Single Unit, Detached | 457 (98.1%) | 9 (1.9%) |
| Single Unit, Attached | 55 (70.5%) | 23 (29.5%) |
| 2 Unit Apartments | 32 (97.0%) | 1 (3.0%) |
| 3 or 4 Unit Apartments | 80 (71.4%) | 32 (28.6%) |
| 5 to 9 Unit Apartments | 0 (0.0%) | 47 (100.0%) |
| 10 or more Apartments | 3 (0.6%) | 530 (99.4%) |
| Mobile Home / Other | 0 (0.0%) | 0 (0.0%) |
| Total | 627 (49.4%) | 642 (50.6%) |
Housing Structures by Number of Rooms in Moriches
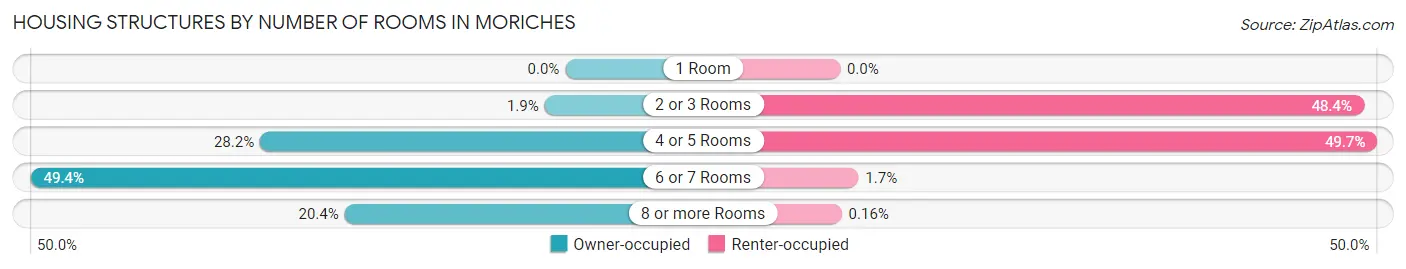
| Number of Rooms | Owner-occupied | Renter-occupied |
| 1 Room | 0 (0.0%) | 0 (0.0%) |
| 2 or 3 Rooms | 12 (1.9%) | 311 (48.4%) |
| 4 or 5 Rooms | 177 (28.2%) | 319 (49.7%) |
| 6 or 7 Rooms | 310 (49.4%) | 11 (1.7%) |
| 8 or more Rooms | 128 (20.4%) | 1 (0.2%) |
| Total | 627 (100.0%) | 642 (100.0%) |
Housing Structure by Heating Type in Moriches
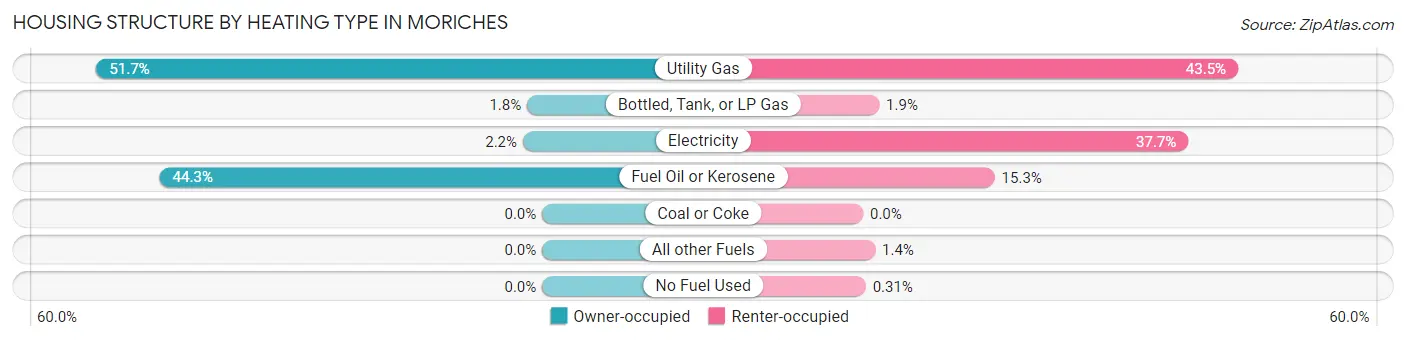
| Heating Type | Owner-occupied | Renter-occupied |
| Utility Gas | 324 (51.7%) | 279 (43.5%) |
| Bottled, Tank, or LP Gas | 11 (1.8%) | 12 (1.9%) |
| Electricity | 14 (2.2%) | 242 (37.7%) |
| Fuel Oil or Kerosene | 278 (44.3%) | 98 (15.3%) |
| Coal or Coke | 0 (0.0%) | 0 (0.0%) |
| All other Fuels | 0 (0.0%) | 9 (1.4%) |
| No Fuel Used | 0 (0.0%) | 2 (0.3%) |
| Total | 627 (100.0%) | 642 (100.0%) |
Household Vehicle Usage in Moriches
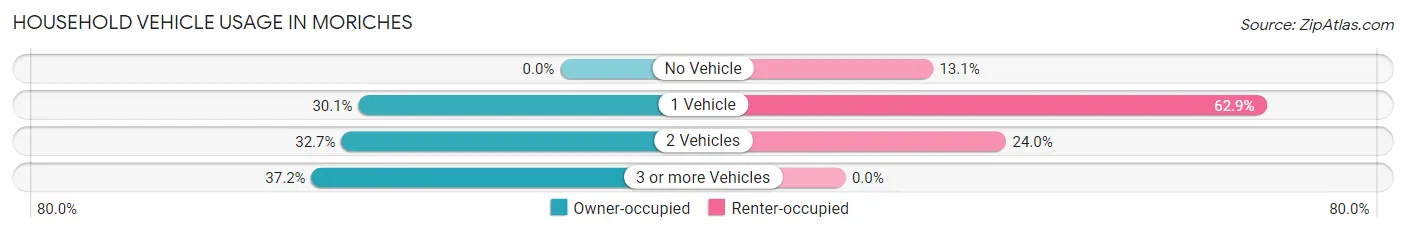
| Vehicles per Household | Owner-occupied | Renter-occupied |
| No Vehicle | 0 (0.0%) | 84 (13.1%) |
| 1 Vehicle | 189 (30.1%) | 404 (62.9%) |
| 2 Vehicles | 205 (32.7%) | 154 (24.0%) |
| 3 or more Vehicles | 233 (37.2%) | 0 (0.0%) |
| Total | 627 (100.0%) | 642 (100.0%) |
Real Estate & Mortgages in Moriches
Real Estate and Mortgage Overview in Moriches
| Characteristic | Without Mortgage | With Mortgage |
| Housing Units | 339 | 288 |
| Median Property Value | $411,000 | $443,100 |
| Median Household Income | $111,910 | $100 |
| Monthly Housing Costs | $1,414 | $151 |
| Real Estate Taxes | $7,201 | $0 |
Property Value by Mortgage Status in Moriches
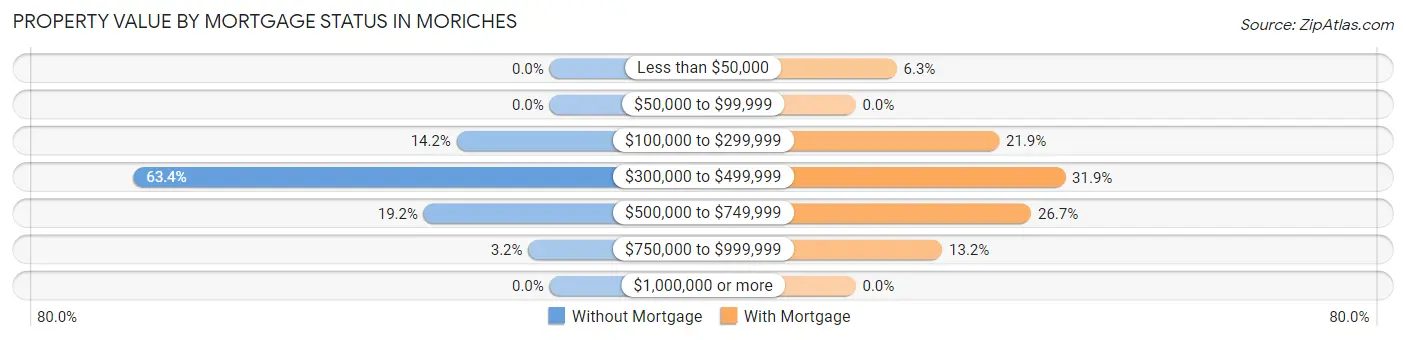
| Property Value | Without Mortgage | With Mortgage |
| Less than $50,000 | 0 (0.0%) | 18 (6.2%) |
| $50,000 to $99,999 | 0 (0.0%) | 0 (0.0%) |
| $100,000 to $299,999 | 48 (14.2%) | 63 (21.9%) |
| $300,000 to $499,999 | 215 (63.4%) | 92 (31.9%) |
| $500,000 to $749,999 | 65 (19.2%) | 77 (26.7%) |
| $750,000 to $999,999 | 11 (3.2%) | 38 (13.2%) |
| $1,000,000 or more | 0 (0.0%) | 0 (0.0%) |
| Total | 339 (100.0%) | 288 (100.0%) |
Household Income by Mortgage Status in Moriches
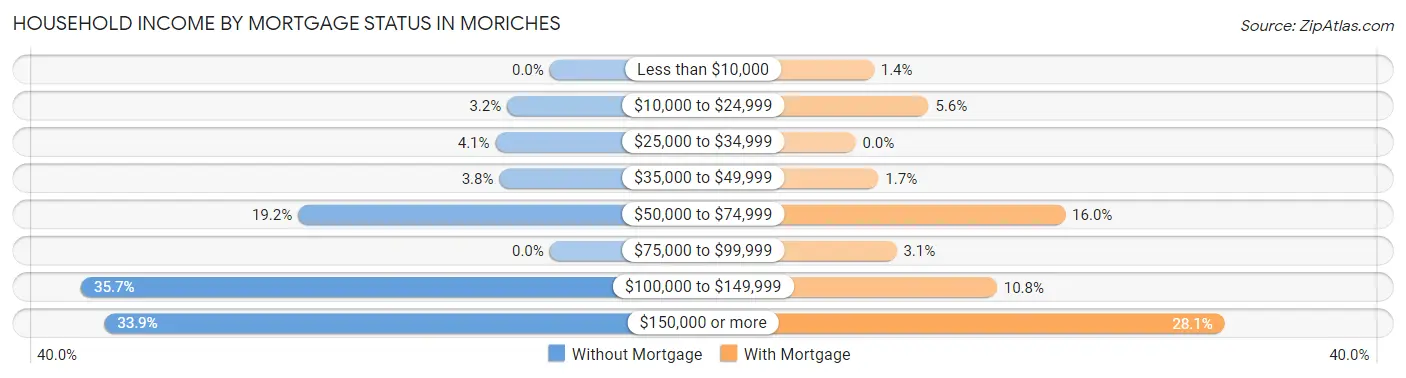
| Household Income | Without Mortgage | With Mortgage |
| Less than $10,000 | 0 (0.0%) | 4 (1.4%) |
| $10,000 to $24,999 | 11 (3.2%) | 16 (5.6%) |
| $25,000 to $34,999 | 14 (4.1%) | 0 (0.0%) |
| $35,000 to $49,999 | 13 (3.8%) | 5 (1.7%) |
| $50,000 to $74,999 | 65 (19.2%) | 46 (16.0%) |
| $75,000 to $99,999 | 0 (0.0%) | 9 (3.1%) |
| $100,000 to $149,999 | 121 (35.7%) | 31 (10.8%) |
| $150,000 or more | 115 (33.9%) | 81 (28.1%) |
| Total | 339 (100.0%) | 288 (100.0%) |
Property Value to Household Income Ratio in Moriches
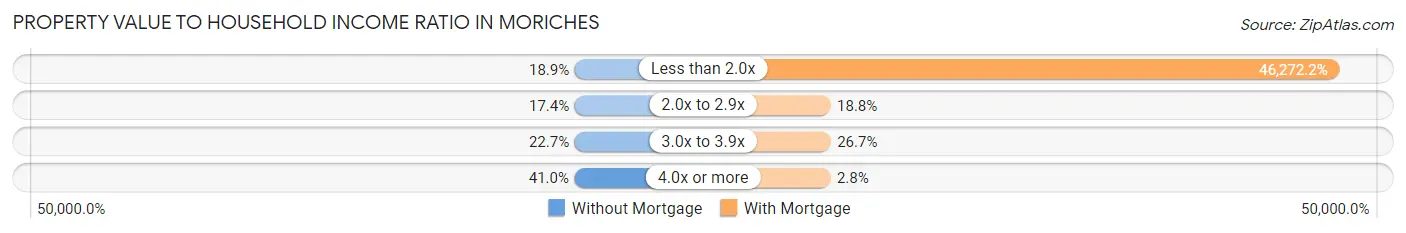
| Value-to-Income Ratio | Without Mortgage | With Mortgage |
| Less than 2.0x | 64 (18.9%) | 133,264 (46,272.2%) |
| 2.0x to 2.9x | 59 (17.4%) | 54 (18.8%) |
| 3.0x to 3.9x | 77 (22.7%) | 77 (26.7%) |
| 4.0x or more | 139 (41.0%) | 8 (2.8%) |
| Total | 339 (100.0%) | 288 (100.0%) |
Real Estate Taxes by Mortgage Status in Moriches
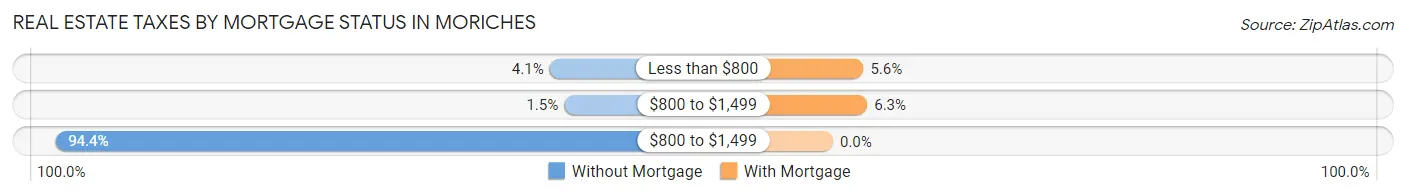
| Property Taxes | Without Mortgage | With Mortgage |
| Less than $800 | 14 (4.1%) | 16 (5.6%) |
| $800 to $1,499 | 5 (1.5%) | 18 (6.2%) |
| $800 to $1,499 | 320 (94.4%) | 0 (0.0%) |
| Total | 339 (100.0%) | 288 (100.0%) |
Health & Disability in Moriches
Health Insurance Coverage by Age in Moriches
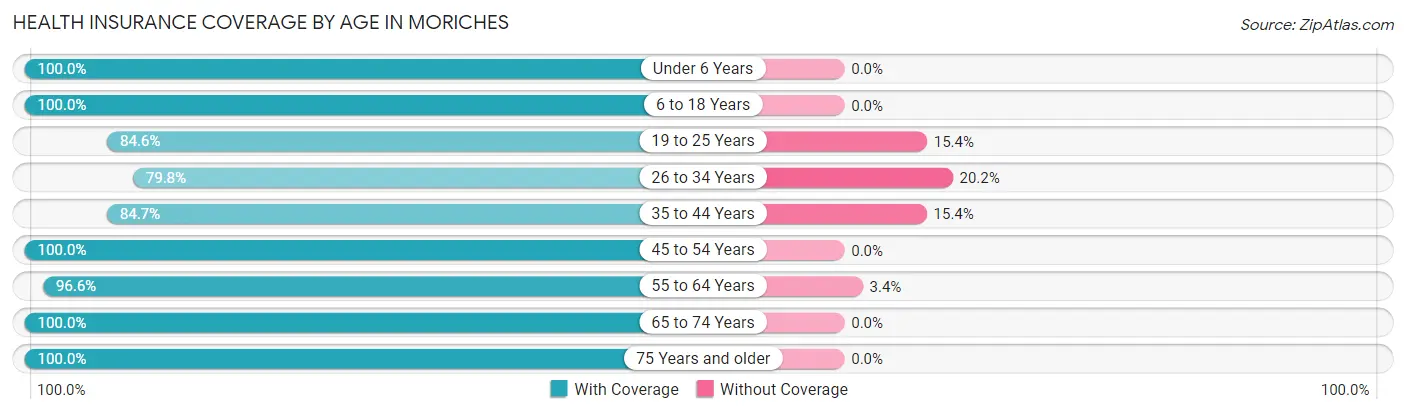
| Age Bracket | With Coverage | Without Coverage |
| Under 6 Years | 289 (100.0%) | 0 (0.0%) |
| 6 to 18 Years | 116 (100.0%) | 0 (0.0%) |
| 19 to 25 Years | 165 (84.6%) | 30 (15.4%) |
| 26 to 34 Years | 336 (79.8%) | 85 (20.2%) |
| 35 to 44 Years | 204 (84.7%) | 37 (15.3%) |
| 45 to 54 Years | 182 (100.0%) | 0 (0.0%) |
| 55 to 64 Years | 452 (96.6%) | 16 (3.4%) |
| 65 to 74 Years | 418 (100.0%) | 0 (0.0%) |
| 75 Years and older | 296 (100.0%) | 0 (0.0%) |
| Total | 2,458 (93.6%) | 168 (6.4%) |
Health Insurance Coverage by Citizenship Status in Moriches
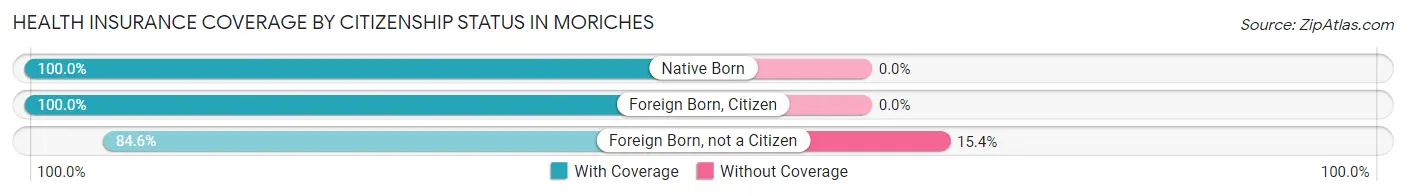
| Citizenship Status | With Coverage | Without Coverage |
| Native Born | 289 (100.0%) | 0 (0.0%) |
| Foreign Born, Citizen | 116 (100.0%) | 0 (0.0%) |
| Foreign Born, not a Citizen | 165 (84.6%) | 30 (15.4%) |
Health Insurance Coverage by Household Income in Moriches
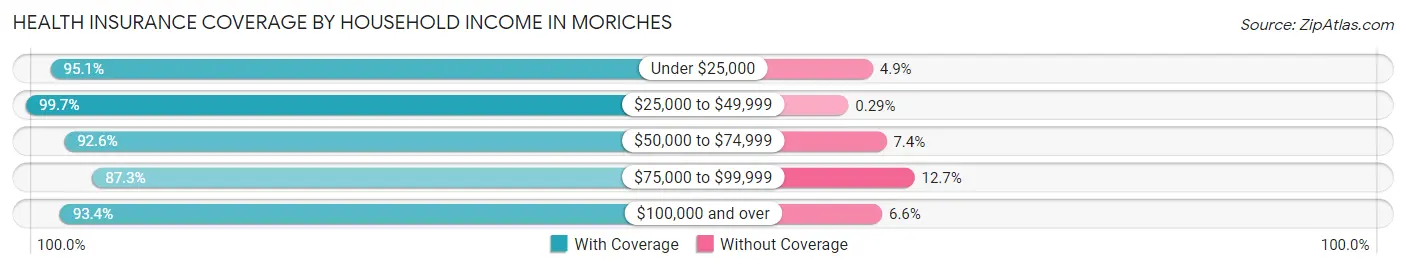
| Household Income | With Coverage | Without Coverage |
| Under $25,000 | 312 (95.1%) | 16 (4.9%) |
| $25,000 to $49,999 | 339 (99.7%) | 1 (0.3%) |
| $50,000 to $74,999 | 324 (92.6%) | 26 (7.4%) |
| $75,000 to $99,999 | 282 (87.3%) | 41 (12.7%) |
| $100,000 and over | 1,188 (93.4%) | 84 (6.6%) |
Public vs Private Health Insurance Coverage by Age in Moriches
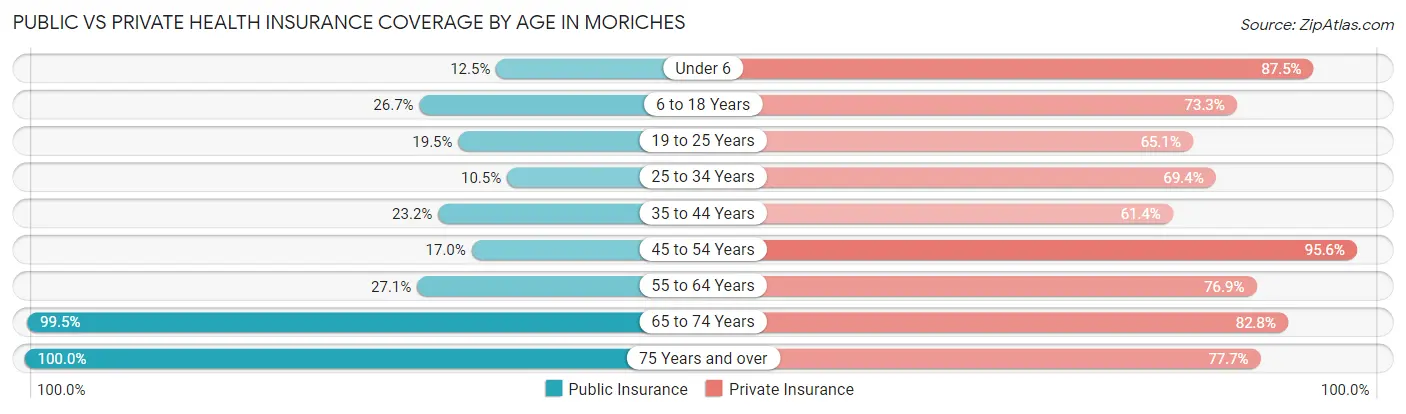
| Age Bracket | Public Insurance | Private Insurance |
| Under 6 | 36 (12.5%) | 253 (87.5%) |
| 6 to 18 Years | 31 (26.7%) | 85 (73.3%) |
| 19 to 25 Years | 38 (19.5%) | 127 (65.1%) |
| 25 to 34 Years | 44 (10.4%) | 292 (69.4%) |
| 35 to 44 Years | 56 (23.2%) | 148 (61.4%) |
| 45 to 54 Years | 31 (17.0%) | 174 (95.6%) |
| 55 to 64 Years | 127 (27.1%) | 360 (76.9%) |
| 65 to 74 Years | 416 (99.5%) | 346 (82.8%) |
| 75 Years and over | 296 (100.0%) | 230 (77.7%) |
| Total | 1,075 (40.9%) | 2,015 (76.7%) |
Disability Status by Sex by Age in Moriches
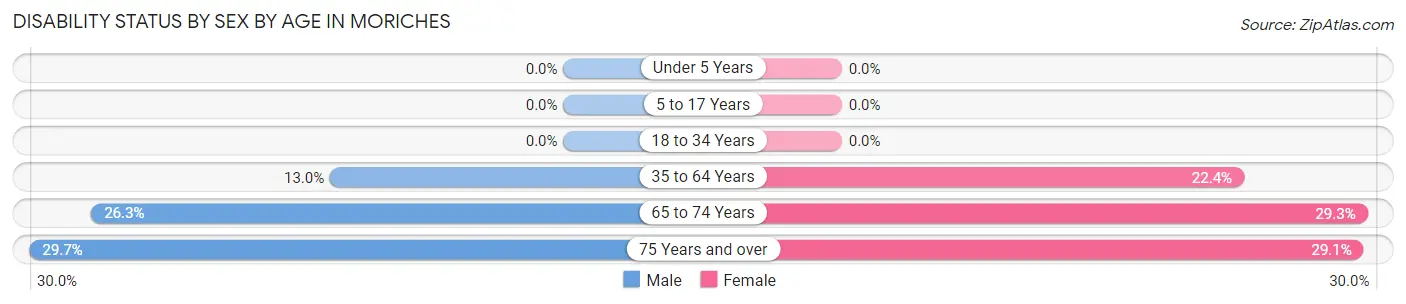
| Age Bracket | Male | Female |
| Under 5 Years | 0 (0.0%) | 0 (0.0%) |
| 5 to 17 Years | 0 (0.0%) | 0 (0.0%) |
| 18 to 34 Years | 0 (0.0%) | 0 (0.0%) |
| 35 to 64 Years | 56 (13.0%) | 103 (22.4%) |
| 65 to 74 Years | 56 (26.3%) | 60 (29.3%) |
| 75 Years and over | 44 (29.7%) | 43 (29.0%) |
Disability Class by Sex by Age in Moriches
Disability Class: Hearing Difficulty
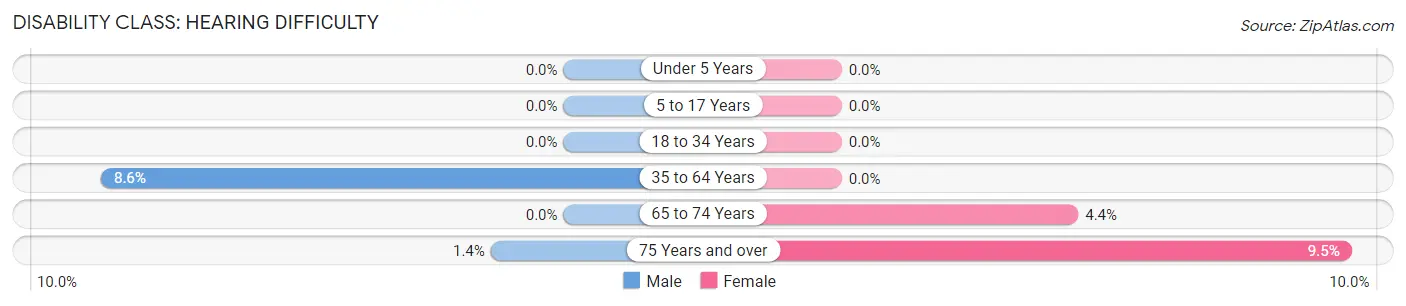
| Age Bracket | Male | Female |
| Under 5 Years | 0 (0.0%) | 0 (0.0%) |
| 5 to 17 Years | 0 (0.0%) | 0 (0.0%) |
| 18 to 34 Years | 0 (0.0%) | 0 (0.0%) |
| 35 to 64 Years | 37 (8.6%) | 0 (0.0%) |
| 65 to 74 Years | 0 (0.0%) | 9 (4.4%) |
| 75 Years and over | 2 (1.3%) | 14 (9.5%) |
Disability Class: Vision Difficulty
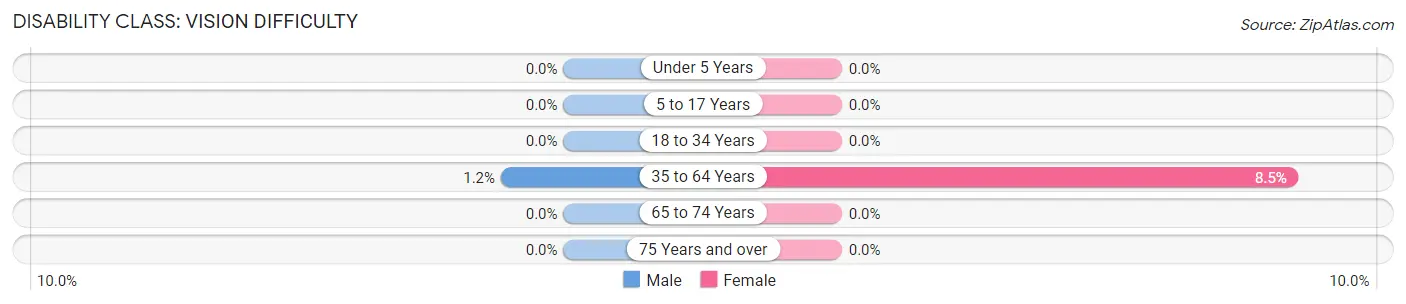
| Age Bracket | Male | Female |
| Under 5 Years | 0 (0.0%) | 0 (0.0%) |
| 5 to 17 Years | 0 (0.0%) | 0 (0.0%) |
| 18 to 34 Years | 0 (0.0%) | 0 (0.0%) |
| 35 to 64 Years | 5 (1.2%) | 39 (8.5%) |
| 65 to 74 Years | 0 (0.0%) | 0 (0.0%) |
| 75 Years and over | 0 (0.0%) | 0 (0.0%) |
Disability Class: Cognitive Difficulty
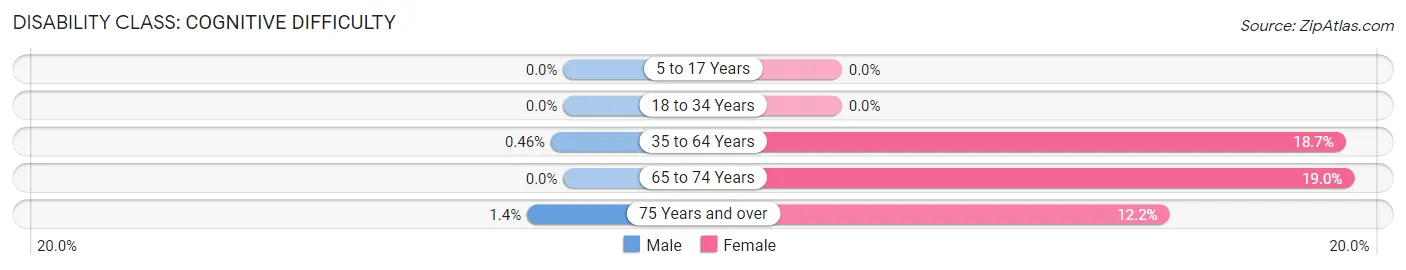
| Age Bracket | Male | Female |
| 5 to 17 Years | 0 (0.0%) | 0 (0.0%) |
| 18 to 34 Years | 0 (0.0%) | 0 (0.0%) |
| 35 to 64 Years | 2 (0.5%) | 86 (18.7%) |
| 65 to 74 Years | 0 (0.0%) | 39 (19.0%) |
| 75 Years and over | 2 (1.3%) | 18 (12.2%) |
Disability Class: Ambulatory Difficulty
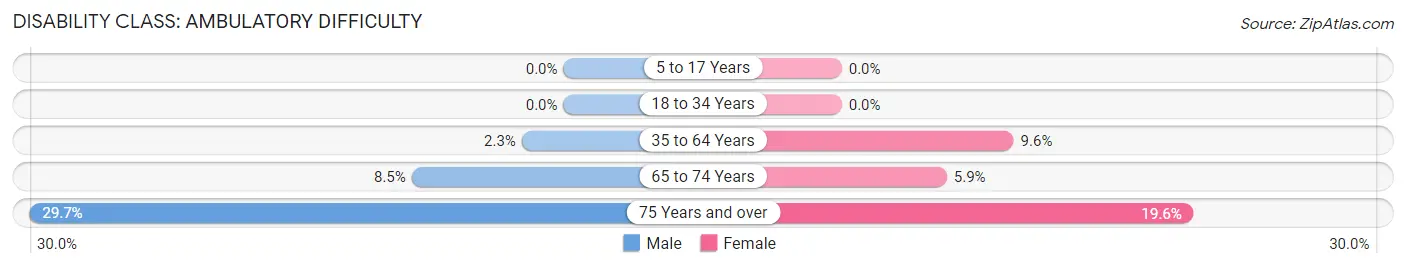
| Age Bracket | Male | Female |
| 5 to 17 Years | 0 (0.0%) | 0 (0.0%) |
| 18 to 34 Years | 0 (0.0%) | 0 (0.0%) |
| 35 to 64 Years | 10 (2.3%) | 44 (9.6%) |
| 65 to 74 Years | 18 (8.5%) | 12 (5.9%) |
| 75 Years and over | 44 (29.7%) | 29 (19.6%) |
Disability Class: Self-Care Difficulty
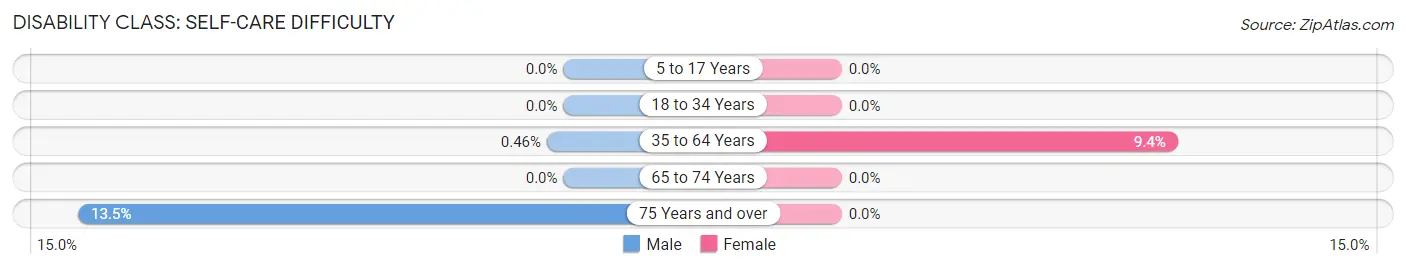
| Age Bracket | Male | Female |
| 5 to 17 Years | 0 (0.0%) | 0 (0.0%) |
| 18 to 34 Years | 0 (0.0%) | 0 (0.0%) |
| 35 to 64 Years | 2 (0.5%) | 43 (9.3%) |
| 65 to 74 Years | 0 (0.0%) | 0 (0.0%) |
| 75 Years and over | 20 (13.5%) | 0 (0.0%) |
Technology Access in Moriches
Computing Device Access in Moriches
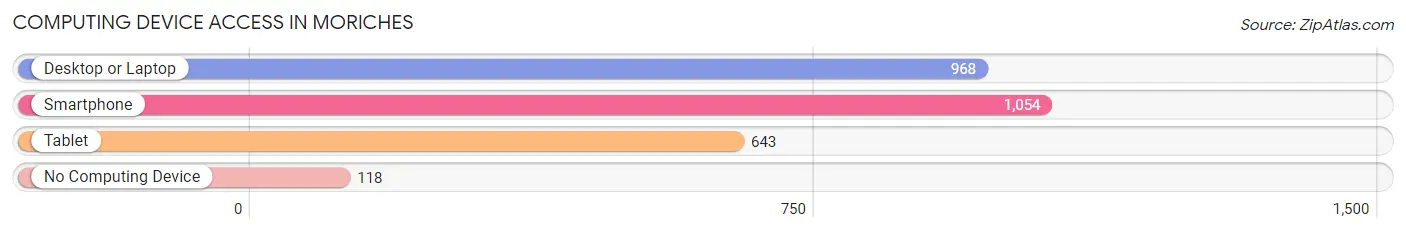
| Device Type | # Households | % Households |
| Desktop or Laptop | 968 | 76.3% |
| Smartphone | 1,054 | 83.1% |
| Tablet | 643 | 50.7% |
| No Computing Device | 118 | 9.3% |
| Total | 1,269 | 100.0% |
Internet Access in Moriches
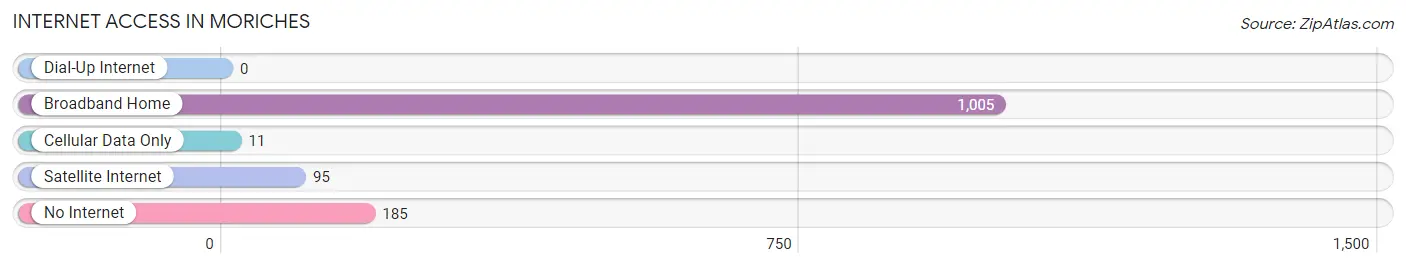
| Internet Type | # Households | % Households |
| Dial-Up Internet | 0 | 0.0% |
| Broadband Home | 1,005 | 79.2% |
| Cellular Data Only | 11 | 0.9% |
| Satellite Internet | 95 | 7.5% |
| No Internet | 185 | 14.6% |
| Total | 1,269 | 100.0% |
Moriches Summary
Moriches is a hamlet located in the Town of Brookhaven in Suffolk County, New York. It is situated on the South Shore of Long Island, approximately 70 miles east of New York City. The hamlet is bordered by East Moriches to the west, Center Moriches to the north, and Eastport to the east.
History
Moriches was originally inhabited by the Secatogue Indians, a sub-tribe of the Montaukett Indians. The name “Moriches” is derived from the Secatogue word “Meriches”, which means “place of rushes”. The area was first settled by Europeans in the late 1600s, and the hamlet was officially established in 1794.
In the 19th century, Moriches was a popular destination for wealthy New Yorkers looking to escape the hustle and bustle of the city. The hamlet was home to several large estates, including the William Floyd Estate, which is now a National Historic Landmark.
In the early 20th century, Moriches became a popular summer resort destination. The hamlet was home to several large hotels, including the Moriches Hotel, which was destroyed by a fire in the 1950s.
Geography
Moriches is located on the South Shore of Long Island, approximately 70 miles east of New York City. The hamlet is bordered by East Moriches to the west, Center Moriches to the north, and Eastport to the east.
The hamlet is situated on the Moriches Bay, which is part of the Great South Bay. The bay is a popular destination for fishing, boating, and other recreational activities.
The hamlet is home to several parks, including the Moriches Bay Park, which offers a variety of outdoor activities, including fishing, swimming, and picnicking.
Economy
Moriches is primarily a residential community, with a few small businesses located in the hamlet. The largest employer in the area is the Moriches Bay Yacht Club, which employs approximately 50 people.
The hamlet is also home to several small retail stores restaurants and other businesses
Demographics
As of the 2010 census, the population of Moriches was 5,717. The racial makeup of the hamlet was 87.3% White, 5.2% African American, 0.7% Native American, 1.2% Asian, and 4.6% from other races.
The median household income in Moriches was $76,945, and the median family income was $87,813. The per capita income was $32,945.
Conclusion
Moriches is a hamlet located in the Town of Brookhaven in Suffolk County, New York. It is situated on the South Shore of Long Island, approximately 70 miles east of New York City. The hamlet was originally inhabited by the Secatogue Indians, and was first settled by Europeans in the late 1600s. Moriches is primarily a residential community, with a few small businesses located in the hamlet. As of the 2010 census, the population of Moriches was 5,717. The median household income in Moriches was $76,945, and the median family income was $87,813. The hamlet is home to several parks, including the Moriches Bay Park, which offers a variety of outdoor activities.
Common Questions
What is the Total Population of Moriches?
Total Population of Moriches is 2,626.
What is the Total Male Population of Moriches?
Total Male Population of Moriches is 1,323.
What is the Total Female Population of Moriches?
Total Female Population of Moriches is 1,303.
What is the Ratio of Males per 100 Females in Moriches?
There are 101.53 Males per 100 Females in Moriches.
What is the Ratio of Females per 100 Males in Moriches?
There are 98.49 Females per 100 Males in Moriches.
What is the Median Population Age in Moriches?
Median Population Age in Moriches is 47.6 Years.
What is the Average Family Size in Moriches
Average Family Size in Moriches is 2.5 People.
What is the Average Household Size in Moriches
Average Household Size in Moriches is 2.1 People.
What is Per Capita Income in Moriches?
Per Capita income in Moriches is $41,845.
What is the Median Family Income in Moriches?
Median Family Income in Moriches is $110,139.
What is the Median Household income in Moriches?
Median Household Income in Moriches is $78,469.
What is Income or Wage Gap in Moriches?
Income or Wage Gap in Moriches is 4.3%.
Women in Moriches earn 95.7 cents for every dollar earned by a man.
What is Inequality or Gini Index in Moriches?
Inequality or Gini Index in Moriches is 0.40.
How Large is the Labor Force in Moriches?
There are 1,222 People in the Labor Forcein in Moriches.
What is the Percentage of People in the Labor Force in Moriches?
54.3% of People are in the Labor Force in Moriches.
What is the Unemployment Rate in Moriches?
Unemployment Rate in Moriches is 3.8%.