Ashland, NJ
Ashland Map
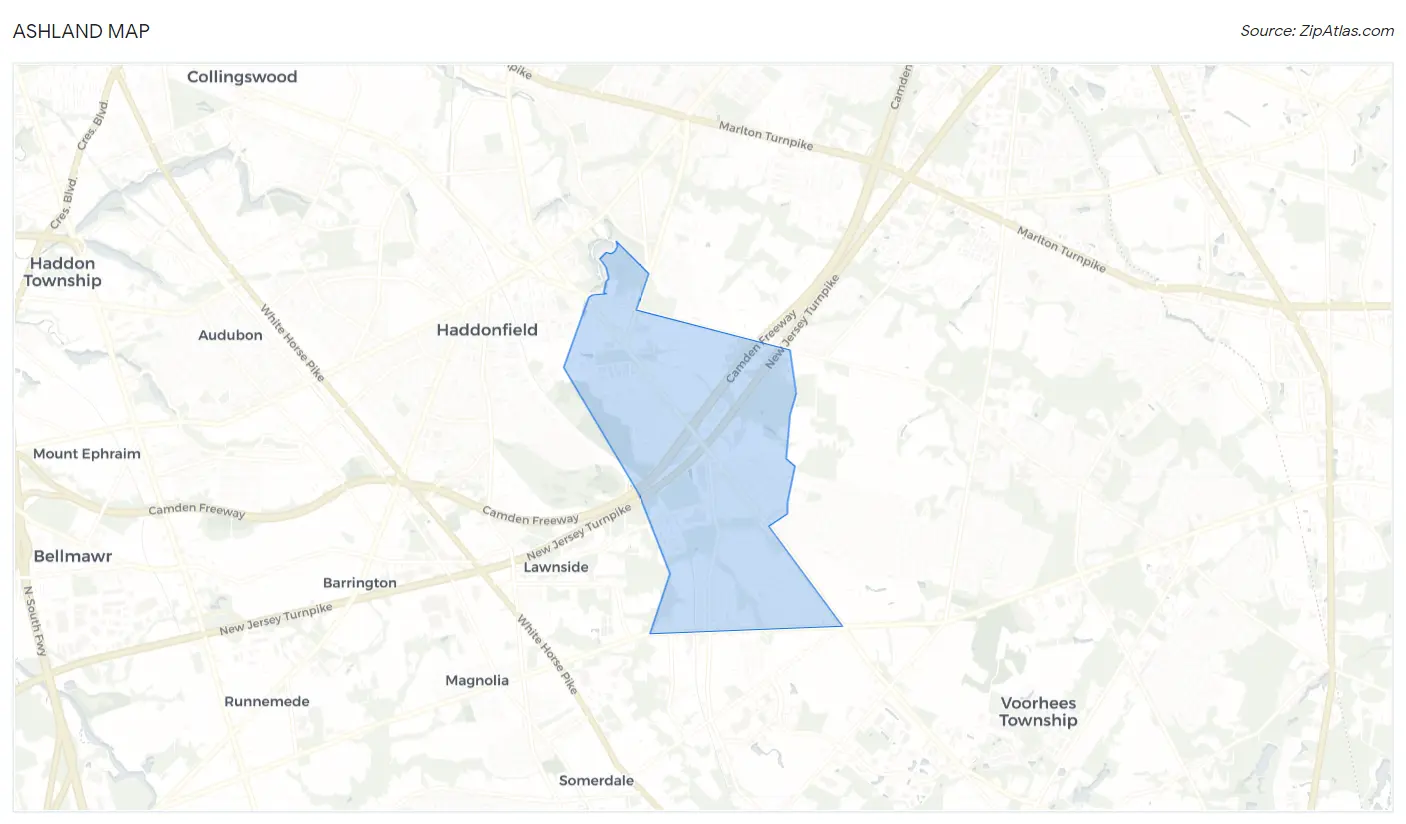
Ashland Overview
9,383
TOTAL POPULATION
4,165
MALE POPULATION
5,218
FEMALE POPULATION
79.82
MALES / 100 FEMALES
125.28
FEMALES / 100 MALES
50.2
MEDIAN AGE
3.0
AVG FAMILY SIZE
2.5
AVG HOUSEHOLD SIZE
$51,978
PER CAPITA INCOME
$117,204
AVG FAMILY INCOME
$112,690
AVG HOUSEHOLD INCOME
41.1%
WAGE / INCOME GAP [ % ]
58.9¢/ $1
WAGE / INCOME GAP [ $ ]
$11,618
FAMILY INCOME DEFICIT
0.40
INEQUALITY / GINI INDEX
5,188
LABOR FORCE [ PEOPLE ]
66.4%
PERCENT IN LABOR FORCE
4.9%
UNEMPLOYMENT RATE
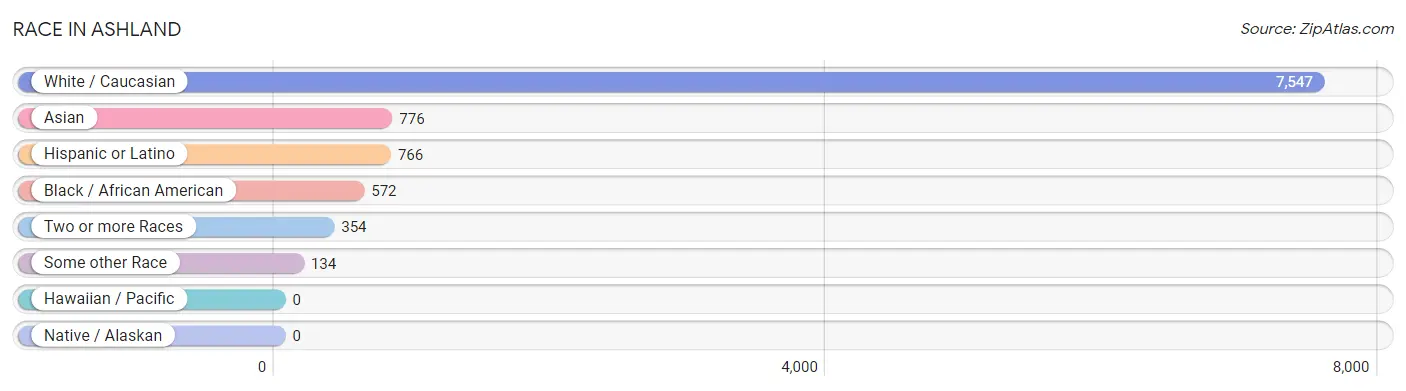
Race in Ashland
The most populous races in Ashland are White / Caucasian (7,547 | 80.4%), Asian (776 | 8.3%), and Hispanic or Latino (766 | 8.2%).
| Race | # Population | % Population |
| Asian | 776 | 8.3% |
| Black / African American | 572 | 6.1% |
| Hawaiian / Pacific | 0 | 0.0% |
| Hispanic or Latino | 766 | 8.2% |
| Native / Alaskan | 0 | 0.0% |
| White / Caucasian | 7,547 | 80.4% |
| Two or more Races | 354 | 3.8% |
| Some other Race | 134 | 1.4% |
| Total | 9,383 | 100.0% |
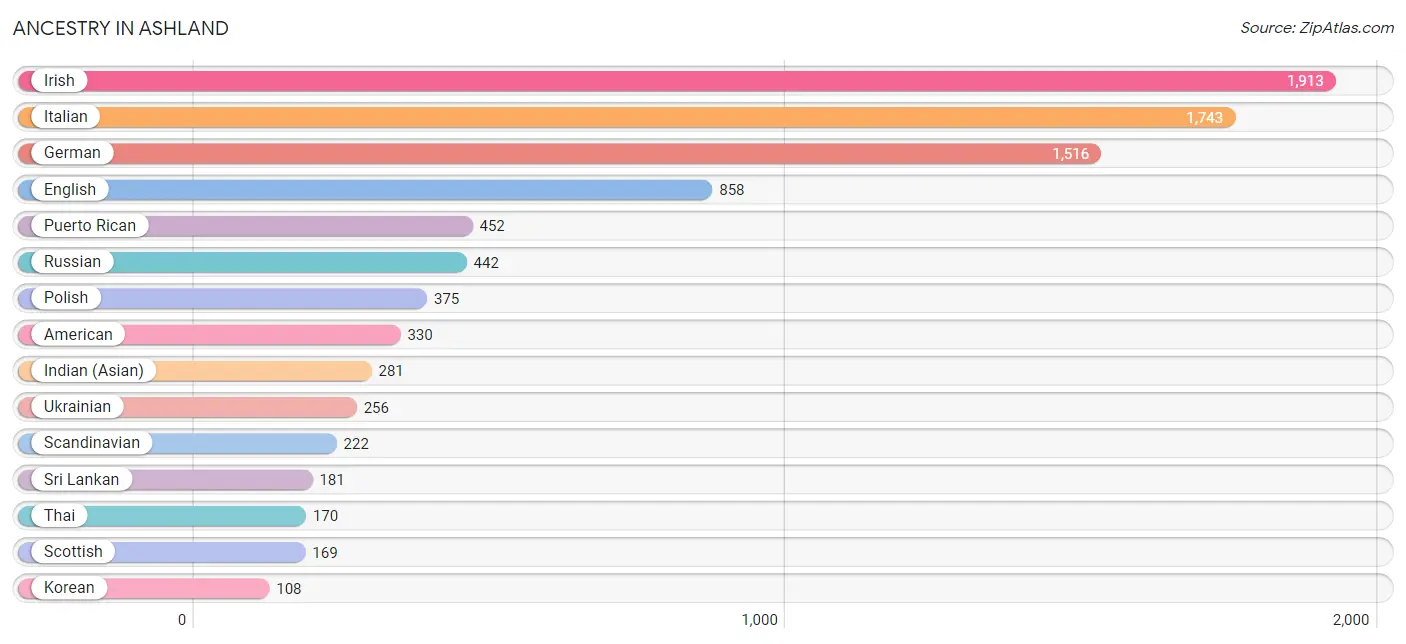
Ancestry in Ashland
The most populous ancestries reported in Ashland are Irish (1,913 | 20.4%), Italian (1,743 | 18.6%), German (1,516 | 16.2%), English (858 | 9.1%), and Puerto Rican (452 | 4.8%), together accounting for 69.1% of all Ashland residents.
| Ancestry | # Population | % Population |
| African | 32 | 0.3% |
| Albanian | 31 | 0.3% |
| American | 330 | 3.5% |
| Arab | 48 | 0.5% |
| Armenian | 11 | 0.1% |
| Austrian | 9 | 0.1% |
| Barbadian | 7 | 0.1% |
| Blackfeet | 24 | 0.3% |
| British | 61 | 0.6% |
| Burmese | 102 | 1.1% |
| Canadian | 11 | 0.1% |
| Central American | 66 | 0.7% |
| Colombian | 15 | 0.2% |
| Croatian | 33 | 0.4% |
| Cuban | 15 | 0.2% |
| Czech | 23 | 0.3% |
| Czechoslovakian | 40 | 0.4% |
| Danish | 29 | 0.3% |
| Dominican | 71 | 0.8% |
| Dutch | 48 | 0.5% |
| Eastern European | 72 | 0.8% |
| English | 858 | 9.1% |
| Estonian | 38 | 0.4% |
| European | 43 | 0.5% |
| French | 88 | 0.9% |
| German | 1,516 | 16.2% |
| Greek | 83 | 0.9% |
| Guatemalan | 46 | 0.5% |
| Haitian | 7 | 0.1% |
| Hungarian | 15 | 0.2% |
| Indian (Asian) | 281 | 3.0% |
| Irish | 1,913 | 20.4% |
| Israeli | 6 | 0.1% |
| Italian | 1,743 | 18.6% |
| Jamaican | 29 | 0.3% |
| Japanese | 38 | 0.4% |
| Korean | 108 | 1.1% |
| Laotian | 21 | 0.2% |
| Latvian | 33 | 0.4% |
| Liberian | 15 | 0.2% |
| Lithuanian | 103 | 1.1% |
| Mexican | 70 | 0.7% |
| Northern European | 21 | 0.2% |
| Norwegian | 44 | 0.5% |
| Polish | 375 | 4.0% |
| Portuguese | 7 | 0.1% |
| Puerto Rican | 452 | 4.8% |
| Romanian | 10 | 0.1% |
| Russian | 442 | 4.7% |
| Salvadoran | 20 | 0.2% |
| Scandinavian | 222 | 2.4% |
| Scotch-Irish | 39 | 0.4% |
| Scottish | 169 | 1.8% |
| Slovak | 8 | 0.1% |
| South American | 86 | 0.9% |
| Sri Lankan | 181 | 1.9% |
| Subsaharan African | 47 | 0.5% |
| Swedish | 31 | 0.3% |
| Thai | 170 | 1.8% |
| Turkish | 70 | 0.7% |
| Ukrainian | 256 | 2.7% |
| Venezuelan | 71 | 0.8% |
| Welsh | 85 | 0.9% | View All 63 Rows |
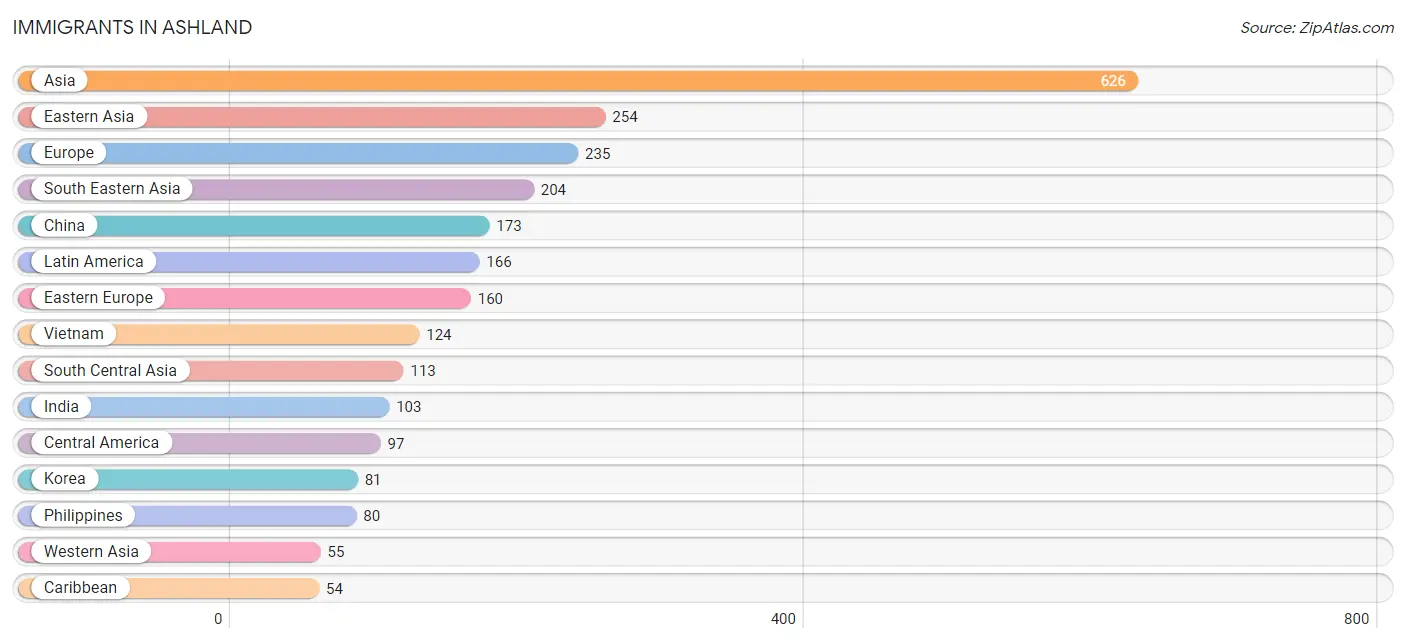
Immigrants in Ashland
The most numerous immigrant groups reported in Ashland came from Asia (626 | 6.7%), Eastern Asia (254 | 2.7%), Europe (235 | 2.5%), South Eastern Asia (204 | 2.2%), and China (173 | 1.8%), together accounting for 15.9% of all Ashland residents.
| Immigration Origin | # Population | % Population |
| Africa | 32 | 0.3% |
| Albania | 20 | 0.2% |
| Asia | 626 | 6.7% |
| Canada | 23 | 0.3% |
| Caribbean | 54 | 0.6% |
| Central America | 97 | 1.0% |
| China | 173 | 1.8% |
| Colombia | 7 | 0.1% |
| Czechoslovakia | 10 | 0.1% |
| Dominica | 6 | 0.1% |
| Dominican Republic | 39 | 0.4% |
| Eastern Africa | 4 | 0.0% |
| Eastern Asia | 254 | 2.7% |
| Eastern Europe | 160 | 1.7% |
| El Salvador | 3 | 0.0% |
| England | 8 | 0.1% |
| Europe | 235 | 2.5% |
| Germany | 13 | 0.1% |
| Greece | 24 | 0.3% |
| Guatemala | 54 | 0.6% |
| India | 103 | 1.1% |
| Israel | 20 | 0.2% |
| Italy | 16 | 0.2% |
| Jamaica | 9 | 0.1% |
| Korea | 81 | 0.9% |
| Latin America | 166 | 1.8% |
| Liberia | 15 | 0.2% |
| Lithuania | 25 | 0.3% |
| Mexico | 40 | 0.4% |
| Moldova | 16 | 0.2% |
| Northern Europe | 22 | 0.2% |
| Pakistan | 10 | 0.1% |
| Philippines | 80 | 0.9% |
| Poland | 13 | 0.1% |
| Russia | 8 | 0.1% |
| Serbia | 19 | 0.2% |
| South America | 15 | 0.2% |
| South Central Asia | 113 | 1.2% |
| South Eastern Asia | 204 | 2.2% |
| Southern Europe | 40 | 0.4% |
| Turkey | 35 | 0.4% |
| Ukraine | 49 | 0.5% |
| Venezuela | 8 | 0.1% |
| Vietnam | 124 | 1.3% |
| Western Africa | 15 | 0.2% |
| Western Asia | 55 | 0.6% |
| Western Europe | 13 | 0.1% | View All 47 Rows |
Sex and Age in Ashland
Sex and Age in Ashland
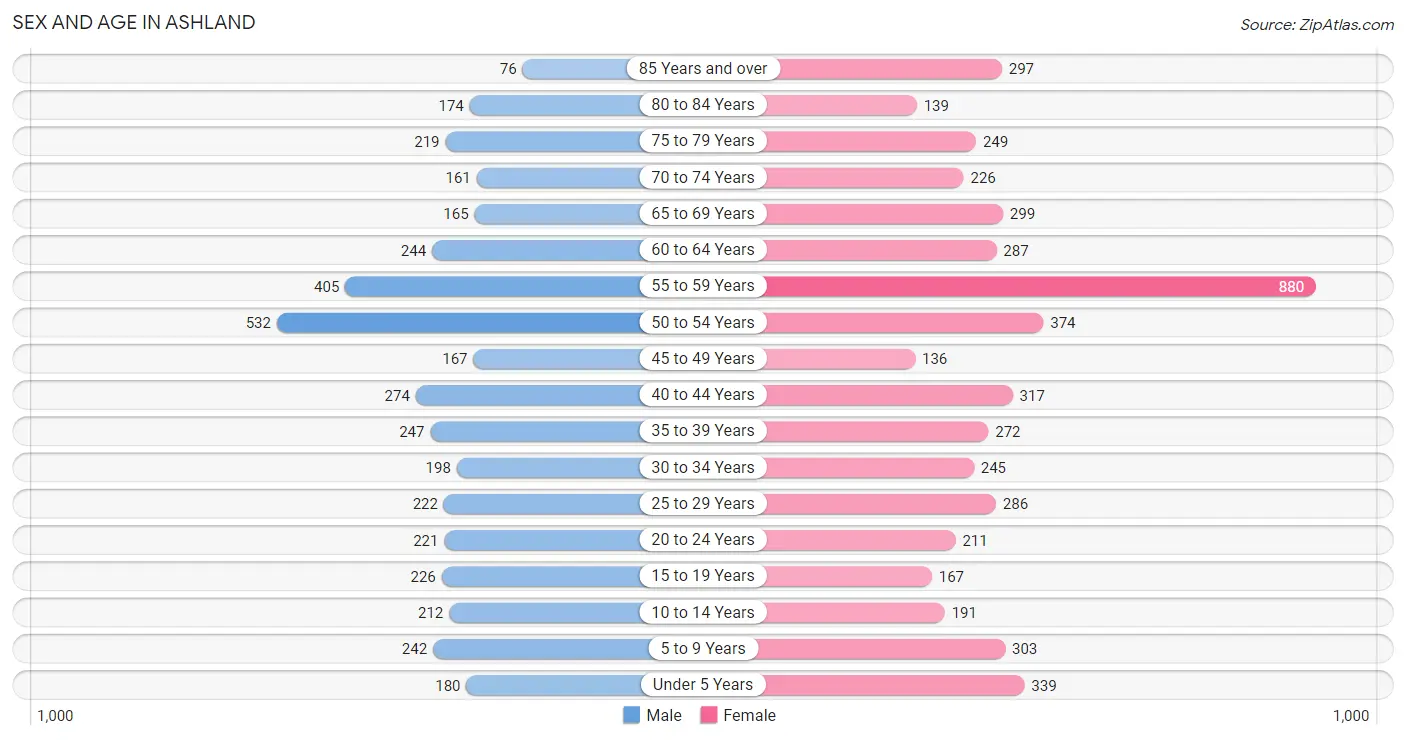
The most populous age groups in Ashland are 50 to 54 Years (532 | 12.8%) for men and 55 to 59 Years (880 | 16.9%) for women.
| Age Bracket | Male | Female |
| Under 5 Years | 180 (4.3%) | 339 (6.5%) |
| 5 to 9 Years | 242 (5.8%) | 303 (5.8%) |
| 10 to 14 Years | 212 (5.1%) | 191 (3.7%) |
| 15 to 19 Years | 226 (5.4%) | 167 (3.2%) |
| 20 to 24 Years | 221 (5.3%) | 211 (4.0%) |
| 25 to 29 Years | 222 (5.3%) | 286 (5.5%) |
| 30 to 34 Years | 198 (4.8%) | 245 (4.7%) |
| 35 to 39 Years | 247 (5.9%) | 272 (5.2%) |
| 40 to 44 Years | 274 (6.6%) | 317 (6.1%) |
| 45 to 49 Years | 167 (4.0%) | 136 (2.6%) |
| 50 to 54 Years | 532 (12.8%) | 374 (7.2%) |
| 55 to 59 Years | 405 (9.7%) | 880 (16.9%) |
| 60 to 64 Years | 244 (5.9%) | 287 (5.5%) |
| 65 to 69 Years | 165 (4.0%) | 299 (5.7%) |
| 70 to 74 Years | 161 (3.9%) | 226 (4.3%) |
| 75 to 79 Years | 219 (5.3%) | 249 (4.8%) |
| 80 to 84 Years | 174 (4.2%) | 139 (2.7%) |
| 85 Years and over | 76 (1.8%) | 297 (5.7%) |
| Total | 4,165 (100.0%) | 5,218 (100.0%) |
Families and Households in Ashland
Median Family Size in Ashland
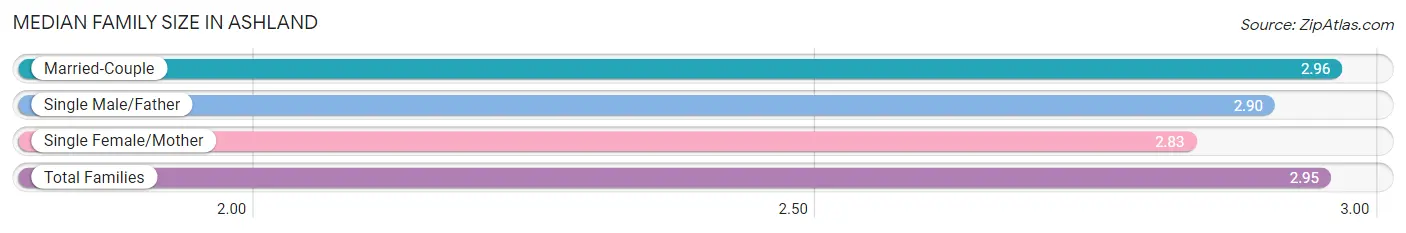
The median family size in Ashland is 2.95 persons per family, with married-couple families (2,395 | 86.6%) accounting for the largest median family size of 2.96 persons per family. On the other hand, single female/mother families (350 | 12.7%) represent the smallest median family size with 2.83 persons per family.
| Family Type | # Families | Family Size |
| Married-Couple | 2,395 (86.6%) | 2.96 |
| Single Male/Father | 21 (0.8%) | 2.90 |
| Single Female/Mother | 350 (12.7%) | 2.83 |
| Total Families | 2,766 (100.0%) | 2.95 |
Median Household Size in Ashland
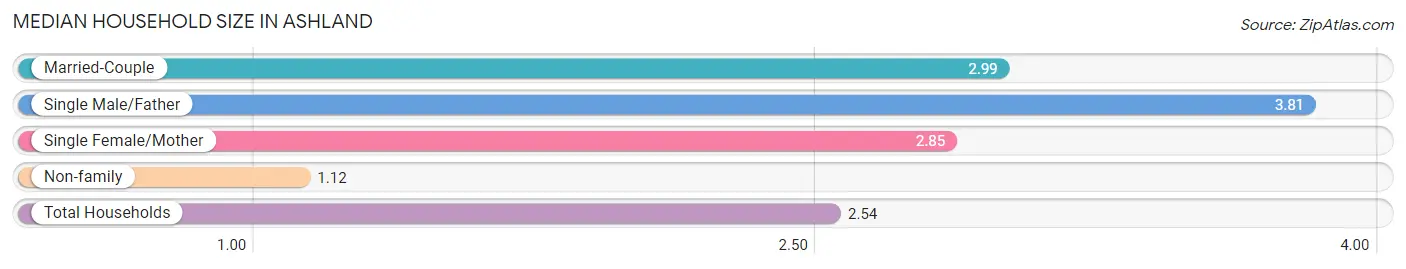
The median household size in Ashland is 2.54 persons per household, with single male/father households (21 | 0.6%) accounting for the largest median household size of 3.81 persons per household. non-family households (854 | 23.6%) represent the smallest median household size with 1.12 persons per household.
| Household Type | # Households | Household Size |
| Married-Couple | 2,395 (66.2%) | 2.99 |
| Single Male/Father | 21 (0.6%) | 3.81 |
| Single Female/Mother | 350 (9.7%) | 2.85 |
| Non-family | 854 (23.6%) | 1.12 |
| Total Households | 3,620 (100.0%) | 2.54 |
Household Size by Marriage Status in Ashland
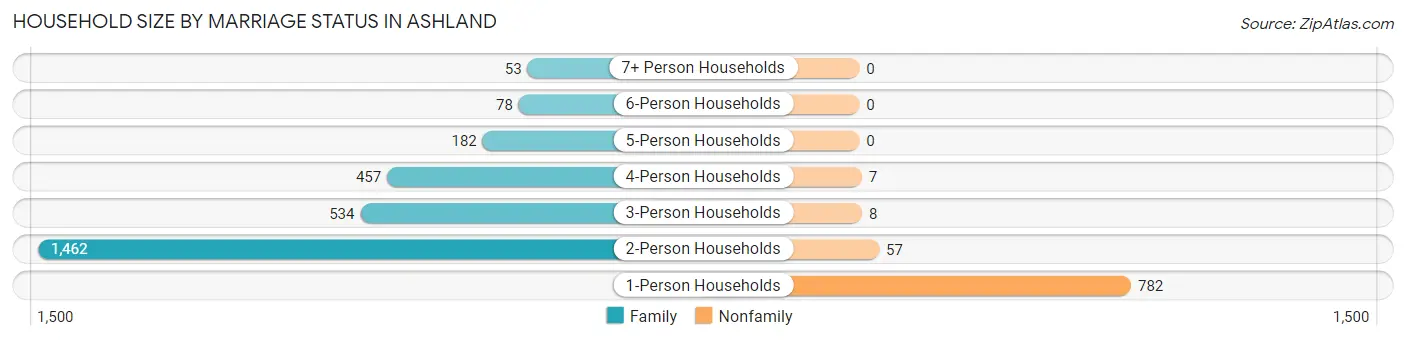
Out of a total of 3,620 households in Ashland, 2,766 (76.4%) are family households, while 854 (23.6%) are nonfamily households. The most numerous type of family households are 2-person households, comprising 1,462, and the most common type of nonfamily households are 1-person households, comprising 782.
| Household Size | Family Households | Nonfamily Households |
| 1-Person Households | - | 782 (21.6%) |
| 2-Person Households | 1,462 (40.4%) | 57 (1.6%) |
| 3-Person Households | 534 (14.7%) | 8 (0.2%) |
| 4-Person Households | 457 (12.6%) | 7 (0.2%) |
| 5-Person Households | 182 (5.0%) | 0 (0.0%) |
| 6-Person Households | 78 (2.1%) | 0 (0.0%) |
| 7+ Person Households | 53 (1.5%) | 0 (0.0%) |
| Total | 2,766 (76.4%) | 854 (23.6%) |
Female Fertility in Ashland
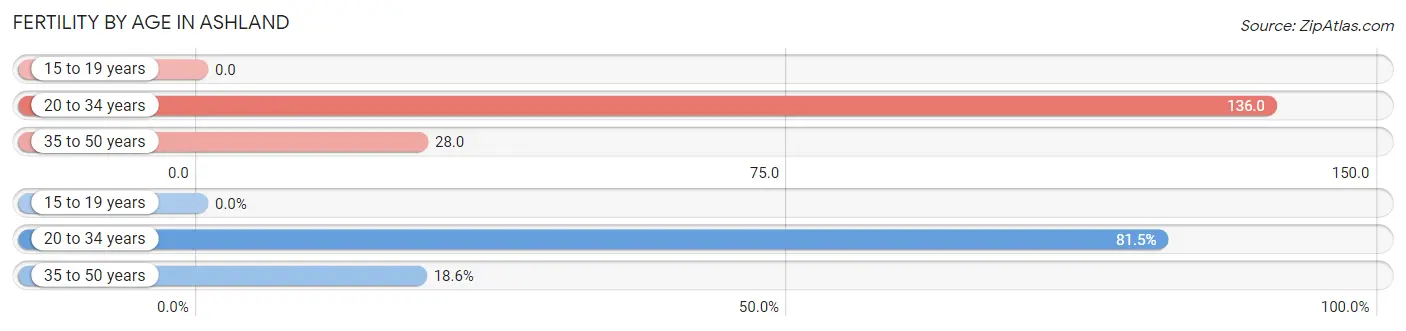
Fertility by Age in Ashland
Average fertility rate in Ashland is 71.0 births per 1,000 women. Women in the age bracket of 20 to 34 years have the highest fertility rate with 136.0 births per 1,000 women. Women in the age bracket of 20 to 34 years acount for 81.5% of all women with births.
| Age Bracket | Women with Births | Births / 1,000 Women |
| 15 to 19 years | 0 (0.0%) | 0.0 |
| 20 to 34 years | 101 (81.5%) | 136.0 |
| 35 to 50 years | 23 (18.5%) | 28.0 |
| Total | 124 (100.0%) | 71.0 |
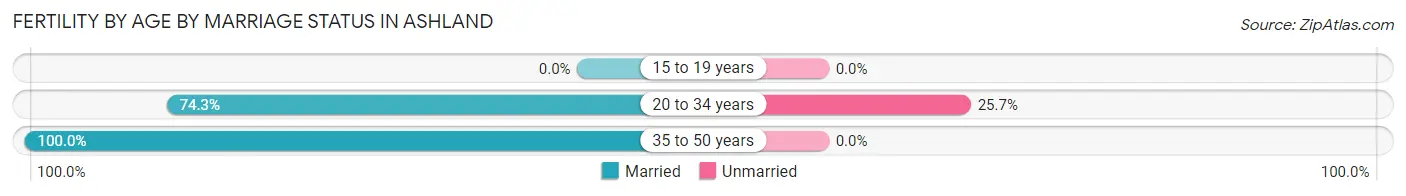
Fertility by Age by Marriage Status in Ashland
79.0% of women with births (124) in Ashland are married. The highest percentage of unmarried women with births falls into 20 to 34 years age bracket with 25.7% of them unmarried at the time of birth, while the lowest percentage of unmarried women with births belong to 35 to 50 years age bracket with 0.0% of them unmarried.
| Age Bracket | Married | Unmarried |
| 15 to 19 years | 0 (0.0%) | 0 (0.0%) |
| 20 to 34 years | 75 (74.3%) | 26 (25.7%) |
| 35 to 50 years | 23 (100.0%) | 0 (0.0%) |
| Total | 98 (79.0%) | 26 (21.0%) |
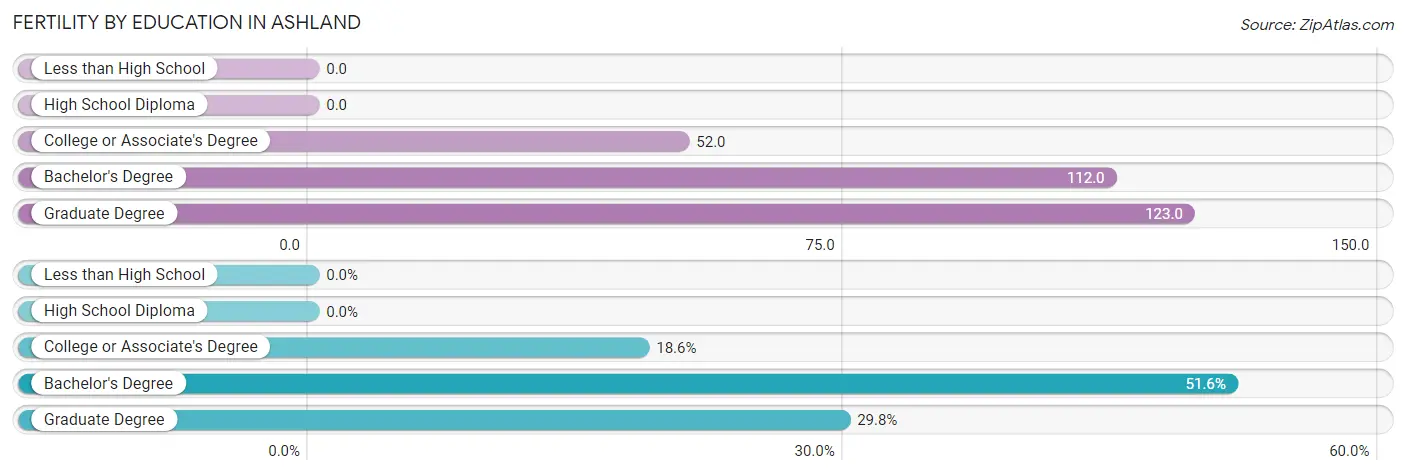
Fertility by Education in Ashland
| Educational Attainment | Women with Births | Births / 1,000 Women |
| Less than High School | 0 (0.0%) | 0.0 |
| High School Diploma | 0 (0.0%) | 0.0 |
| College or Associate's Degree | 23 (18.5%) | 52.0 |
| Bachelor's Degree | 64 (51.6%) | 112.0 |
| Graduate Degree | 37 (29.8%) | 123.0 |
| Total | 124 (100.0%) | 71.0 |
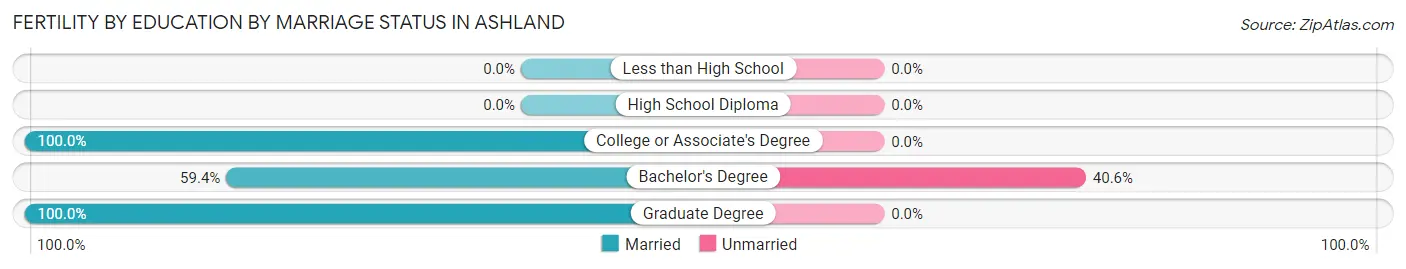
Fertility by Education by Marriage Status in Ashland
21.0% of women with births in Ashland are unmarried. Women with the educational attainment of college or associate's degree are most likely to be married with 100.0% of them married at childbirth, while women with the educational attainment of bachelor's degree are least likely to be married with 40.6% of them unmarried at childbirth.
| Educational Attainment | Married | Unmarried |
| Less than High School | 0 (0.0%) | 0 (0.0%) |
| High School Diploma | 0 (0.0%) | 0 (0.0%) |
| College or Associate's Degree | 23 (100.0%) | 0 (0.0%) |
| Bachelor's Degree | 38 (59.4%) | 26 (40.6%) |
| Graduate Degree | 37 (100.0%) | 0 (0.0%) |
| Total | 98 (79.0%) | 26 (21.0%) |
Income in Ashland
Income Overview in Ashland
Per Capita Income in Ashland is $51,978, while median incomes of families and households are $117,204 and $112,690 respectively.
| Characteristic | Number | Measure |
| Per Capita Income | 9,383 | $51,978 |
| Median Family Income | 2,766 | $117,204 |
| Mean Family Income | 2,766 | $150,092 |
| Median Household Income | 3,620 | $112,690 |
| Mean Household Income | 3,620 | $134,261 |
| Income Deficit | 2,766 | $11,618 |
| Wage / Income Gap (%) | 9,383 | 41.11% |
| Wage / Income Gap ($) | 9,383 | 58.89¢ per $1 |
| Gini / Inequality Index | 9,383 | 0.40 |
Earnings by Sex in Ashland
Average Earnings in Ashland are $57,595, $69,700 for men and $41,048 for women, a difference of 41.1%.
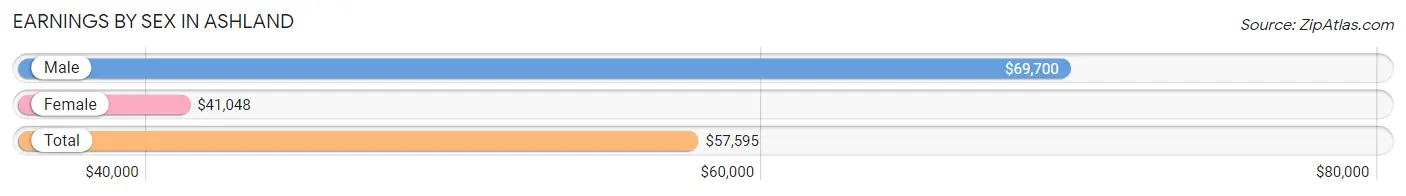
| Sex | Number | Average Earnings |
| Male | 2,474 (46.7%) | $69,700 |
| Female | 2,823 (53.3%) | $41,048 |
| Total | 5,297 (100.0%) | $57,595 |
Earnings by Sex by Income Bracket in Ashland
The most common earnings brackets in Ashland are $100,000+ for men (771 | 31.2%) and $100,000+ for women (619 | 21.9%).
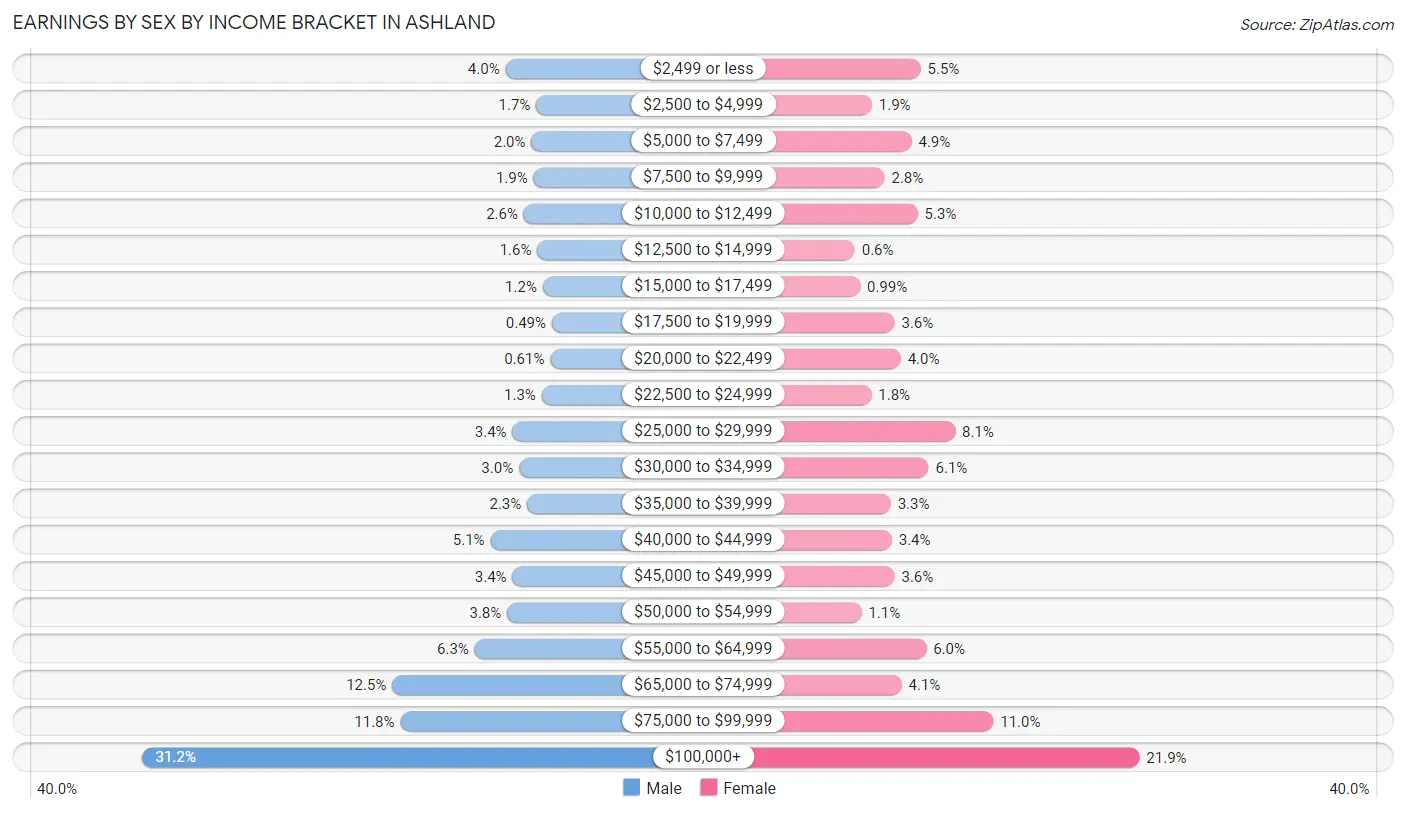
| Income | Male | Female |
| $2,499 or less | 98 (4.0%) | 156 (5.5%) |
| $2,500 to $4,999 | 41 (1.7%) | 53 (1.9%) |
| $5,000 to $7,499 | 50 (2.0%) | 137 (4.9%) |
| $7,500 to $9,999 | 46 (1.9%) | 80 (2.8%) |
| $10,000 to $12,499 | 64 (2.6%) | 150 (5.3%) |
| $12,500 to $14,999 | 39 (1.6%) | 17 (0.6%) |
| $15,000 to $17,499 | 29 (1.2%) | 28 (1.0%) |
| $17,500 to $19,999 | 12 (0.5%) | 101 (3.6%) |
| $20,000 to $22,499 | 15 (0.6%) | 114 (4.0%) |
| $22,500 to $24,999 | 31 (1.3%) | 52 (1.8%) |
| $25,000 to $29,999 | 85 (3.4%) | 229 (8.1%) |
| $30,000 to $34,999 | 73 (2.9%) | 173 (6.1%) |
| $35,000 to $39,999 | 58 (2.3%) | 93 (3.3%) |
| $40,000 to $44,999 | 126 (5.1%) | 95 (3.4%) |
| $45,000 to $49,999 | 85 (3.4%) | 101 (3.6%) |
| $50,000 to $54,999 | 95 (3.8%) | 31 (1.1%) |
| $55,000 to $64,999 | 155 (6.3%) | 168 (5.9%) |
| $65,000 to $74,999 | 308 (12.4%) | 116 (4.1%) |
| $75,000 to $99,999 | 293 (11.8%) | 310 (11.0%) |
| $100,000+ | 771 (31.2%) | 619 (21.9%) |
| Total | 2,474 (100.0%) | 2,823 (100.0%) |
Earnings by Sex by Educational Attainment in Ashland
Average earnings in Ashland are $74,660 for men and $47,404 for women, a difference of 36.5%. Men with an educational attainment of graduate degree enjoy the highest average annual earnings of $132,813, while those with less than high school education earn the least with $36,000. Women with an educational attainment of graduate degree earn the most with the average annual earnings of $91,667, while those with high school diploma education have the smallest earnings of $26,545.
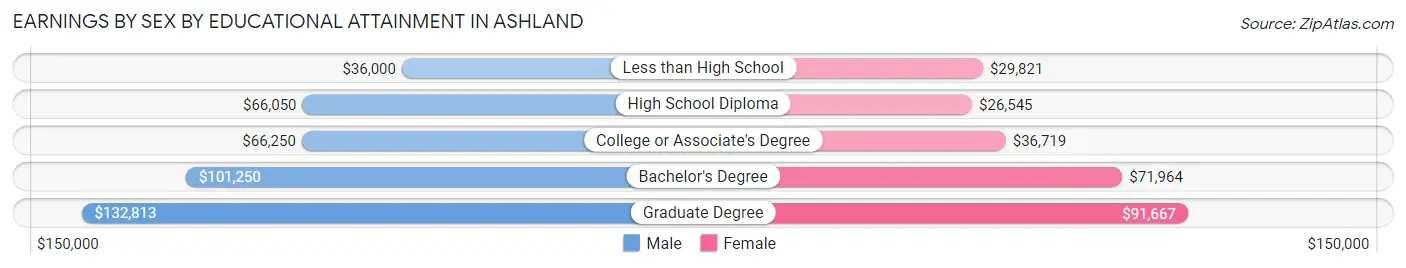
| Educational Attainment | Male Income | Female Income |
| Less than High School | $36,000 | $29,821 |
| High School Diploma | $66,050 | $26,545 |
| College or Associate's Degree | $66,250 | $36,719 |
| Bachelor's Degree | $101,250 | $71,964 |
| Graduate Degree | $132,813 | $91,667 |
| Total | $74,660 | $47,404 |
Family Income in Ashland
Family Income Brackets in Ashland
According to the Ashland family income data, there are 772 families falling into the $100,000 to $149,999 income range, which is the most common income bracket and makes up 27.9% of all families. Conversely, the $10,000 to $14,999 income bracket is the least frequent group with only 28 families (1.0%) belonging to this category.
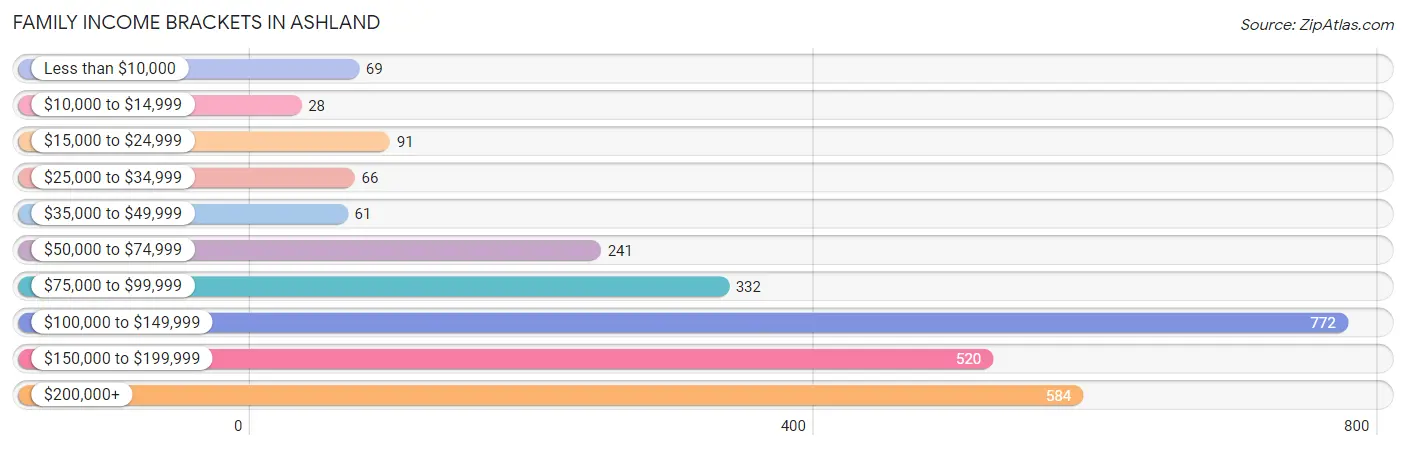
| Income Bracket | # Families | % Families |
| Less than $10,000 | 69 | 2.5% |
| $10,000 to $14,999 | 28 | 1.0% |
| $15,000 to $24,999 | 91 | 3.3% |
| $25,000 to $34,999 | 66 | 2.4% |
| $35,000 to $49,999 | 61 | 2.2% |
| $50,000 to $74,999 | 241 | 8.7% |
| $75,000 to $99,999 | 332 | 12.0% |
| $100,000 to $149,999 | 772 | 27.9% |
| $150,000 to $199,999 | 520 | 18.8% |
| $200,000+ | 584 | 21.1% |
Family Income by Famaliy Size in Ashland
7+ person families (53 | 1.9%) account for the highest median family income in Ashland with $244,740 per family, while 2-person families (1,481 | 53.5%) have the highest median income of $52,654 per family member.
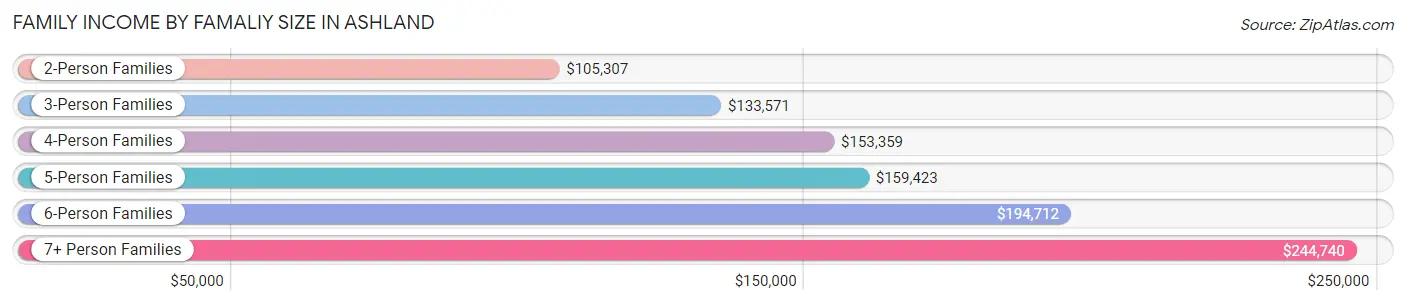
| Income Bracket | # Families | Median Income |
| 2-Person Families | 1,481 (53.5%) | $105,307 |
| 3-Person Families | 536 (19.4%) | $133,571 |
| 4-Person Families | 455 (16.5%) | $153,359 |
| 5-Person Families | 182 (6.6%) | $159,423 |
| 6-Person Families | 59 (2.1%) | $194,712 |
| 7+ Person Families | 53 (1.9%) | $244,740 |
| Total | 2,766 (100.0%) | $117,204 |
Family Income by Number of Earners in Ashland
The median family income in Ashland is $117,204, with families comprising 3+ earners (349) having the highest median family income of $207,434, while families with no earners (318) have the lowest median family income of $85,556, accounting for 12.6% and 11.5% of families, respectively.
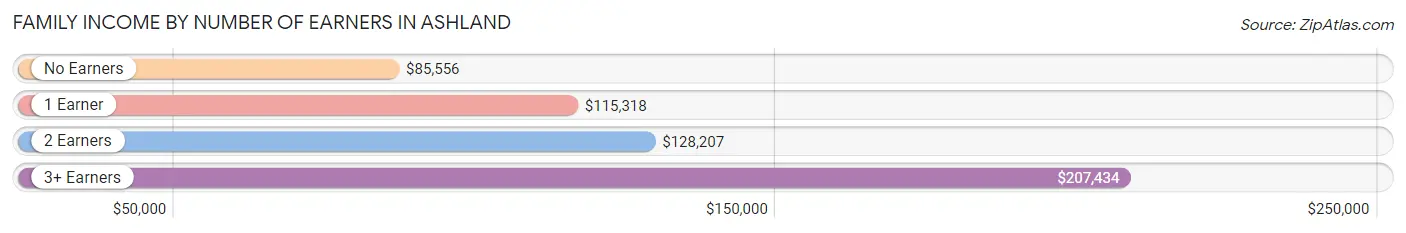
| Number of Earners | # Families | Median Income |
| No Earners | 318 (11.5%) | $85,556 |
| 1 Earner | 710 (25.7%) | $115,318 |
| 2 Earners | 1,389 (50.2%) | $128,207 |
| 3+ Earners | 349 (12.6%) | $207,434 |
| Total | 2,766 (100.0%) | $117,204 |
Household Income in Ashland
Household Income Brackets in Ashland
With 930 households falling in the category, the $100,000 to $149,999 income range is the most frequent in Ashland, accounting for 25.7% of all households. In contrast, only 40 households (1.1%) fall into the $10,000 to $14,999 income bracket, making it the least populous group.
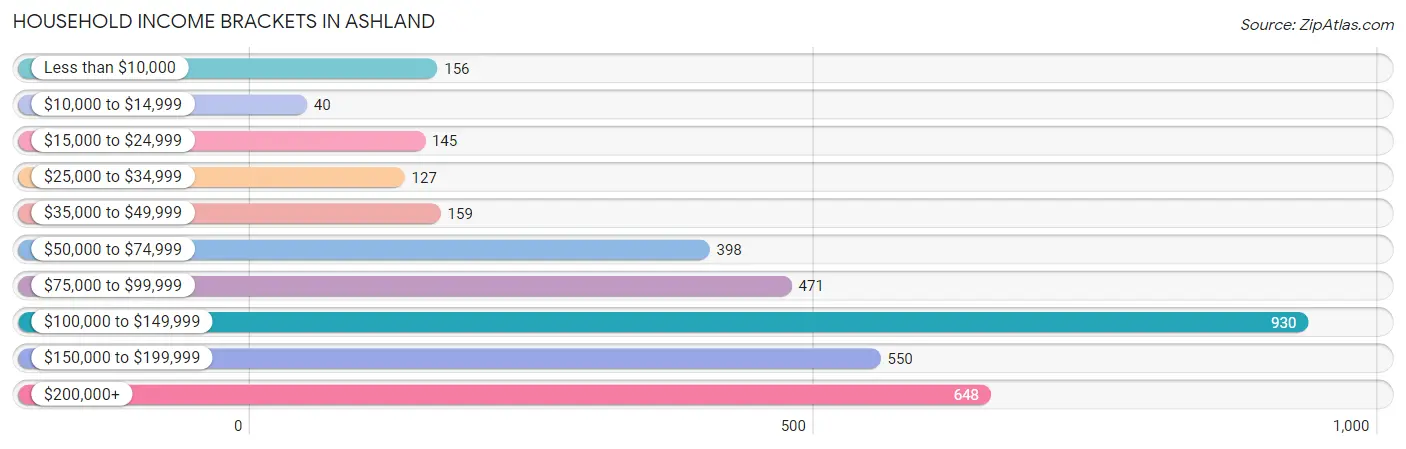
| Income Bracket | # Households | % Households |
| Less than $10,000 | 156 | 4.3% |
| $10,000 to $14,999 | 40 | 1.1% |
| $15,000 to $24,999 | 145 | 4.0% |
| $25,000 to $34,999 | 127 | 3.5% |
| $35,000 to $49,999 | 159 | 4.4% |
| $50,000 to $74,999 | 398 | 11.0% |
| $75,000 to $99,999 | 471 | 13.0% |
| $100,000 to $149,999 | 930 | 25.7% |
| $150,000 to $199,999 | 550 | 15.2% |
| $200,000+ | 648 | 17.9% |
Household Income by Householder Age in Ashland
The median household income in Ashland is $112,690, with the highest median household income of $151,184 found in the 25 to 44 years age bracket for the primary householder. A total of 888 households (24.5%) fall into this category.
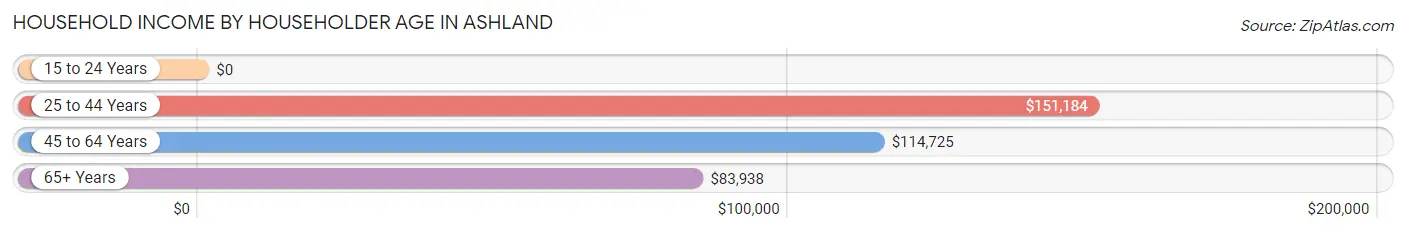
| Income Bracket | # Households | Median Income |
| 15 to 24 Years | 0 (0.0%) | $0 |
| 25 to 44 Years | 888 (24.5%) | $151,184 |
| 45 to 64 Years | 1,561 (43.1%) | $114,725 |
| 65+ Years | 1,171 (32.4%) | $83,938 |
| Total | 3,620 (100.0%) | $112,690 |
Poverty in Ashland
Income Below Poverty by Sex and Age in Ashland
With 7.7% poverty level for males and 11.4% for females among the residents of Ashland, 6 to 11 year old males and 16 and 17 year old females are the most vulnerable to poverty, with 145 males (43.9%) and 50 females (63.3%) in their respective age groups living below the poverty level.
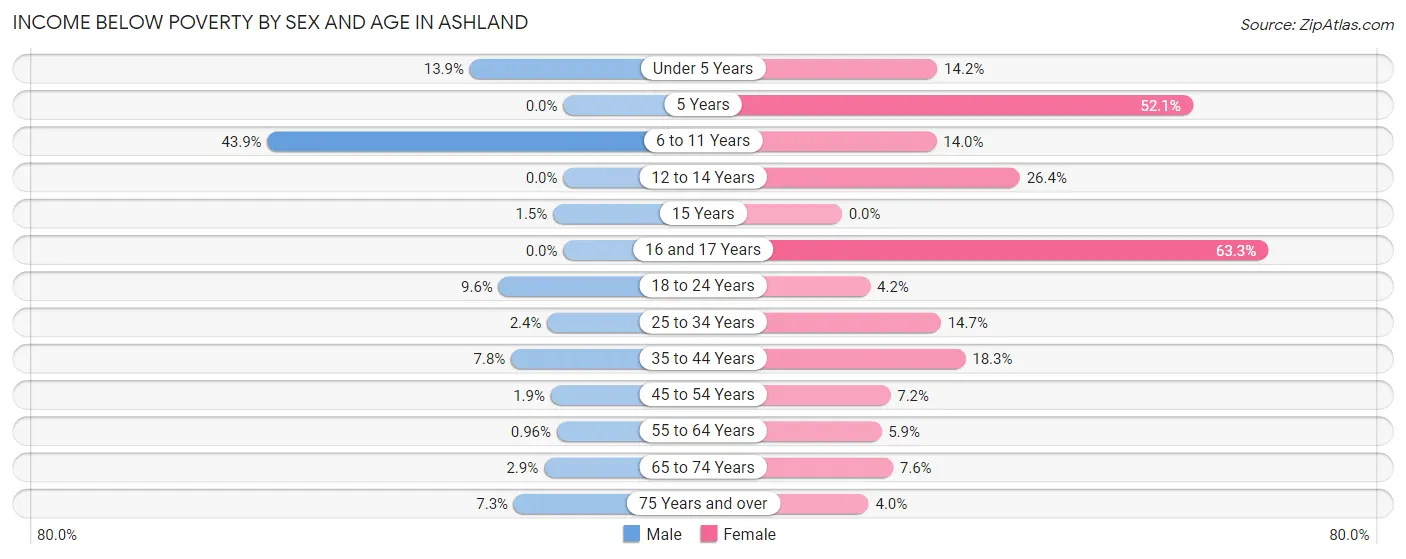
| Age Bracket | Male | Female |
| Under 5 Years | 25 (13.9%) | 48 (14.2%) |
| 5 Years | 0 (0.0%) | 50 (52.1%) |
| 6 to 11 Years | 145 (43.9%) | 41 (14.0%) |
| 12 to 14 Years | 0 (0.0%) | 28 (26.4%) |
| 15 Years | 1 (1.5%) | 0 (0.0%) |
| 16 and 17 Years | 0 (0.0%) | 50 (63.3%) |
| 18 to 24 Years | 31 (9.6%) | 11 (4.2%) |
| 25 to 34 Years | 10 (2.4%) | 78 (14.7%) |
| 35 to 44 Years | 40 (7.7%) | 108 (18.3%) |
| 45 to 54 Years | 13 (1.9%) | 36 (7.2%) |
| 55 to 64 Years | 6 (1.0%) | 68 (5.9%) |
| 65 to 74 Years | 8 (2.9%) | 37 (7.6%) |
| 75 Years and over | 34 (7.3%) | 25 (4.0%) |
| Total | 313 (7.7%) | 580 (11.4%) |
Income Above Poverty by Sex and Age in Ashland
According to the poverty statistics in Ashland, males aged 5 years and females aged 15 years are the age groups that are most secure financially, with 100.0% of males and 100.0% of females in these age groups living above the poverty line.
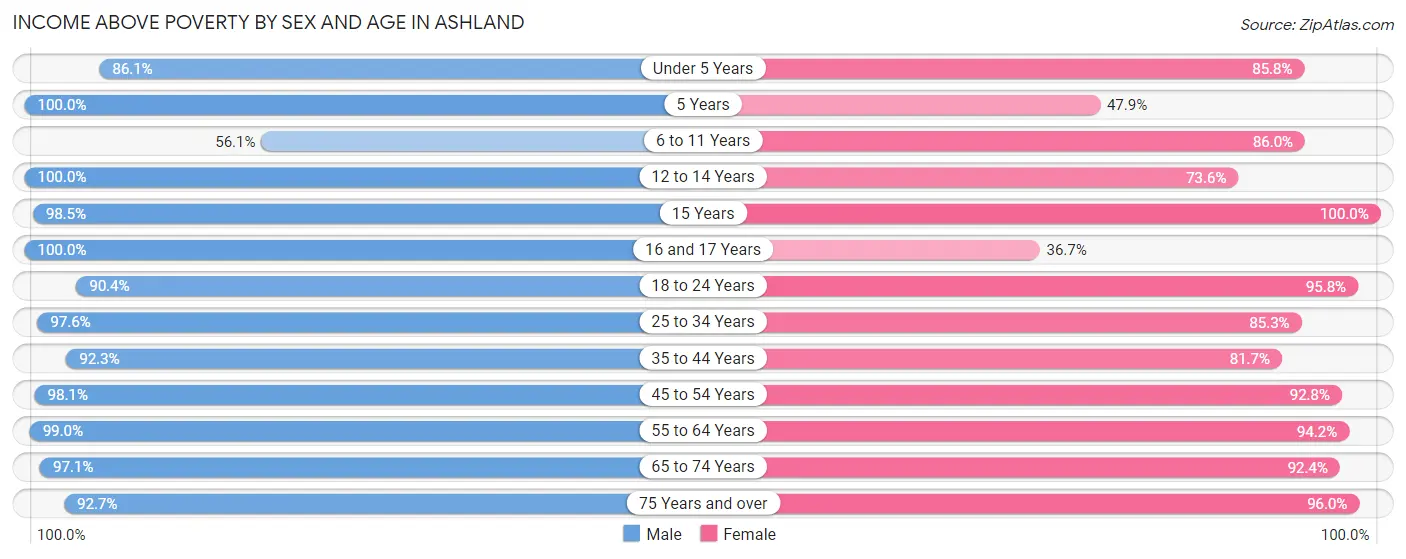
| Age Bracket | Male | Female |
| Under 5 Years | 155 (86.1%) | 291 (85.8%) |
| 5 Years | 24 (100.0%) | 46 (47.9%) |
| 6 to 11 Years | 185 (56.1%) | 251 (86.0%) |
| 12 to 14 Years | 100 (100.0%) | 78 (73.6%) |
| 15 Years | 65 (98.5%) | 37 (100.0%) |
| 16 and 17 Years | 58 (100.0%) | 29 (36.7%) |
| 18 to 24 Years | 292 (90.4%) | 251 (95.8%) |
| 25 to 34 Years | 410 (97.6%) | 453 (85.3%) |
| 35 to 44 Years | 476 (92.2%) | 481 (81.7%) |
| 45 to 54 Years | 686 (98.1%) | 464 (92.8%) |
| 55 to 64 Years | 617 (99.0%) | 1,095 (94.2%) |
| 65 to 74 Years | 271 (97.1%) | 451 (92.4%) |
| 75 Years and over | 429 (92.7%) | 604 (96.0%) |
| Total | 3,768 (92.3%) | 4,531 (88.6%) |
Income Below Poverty Among Married-Couple Families in Ashland
The poverty statistics for married-couple families in Ashland show that 2.4% or 58 of the total 2,395 families live below the poverty line. Families with 1 or 2 children have the highest poverty rate of 7.4%, comprising of 50 families. On the other hand, families with 3 or 4 children have the lowest poverty rate of 0.0%, which includes 0 families.
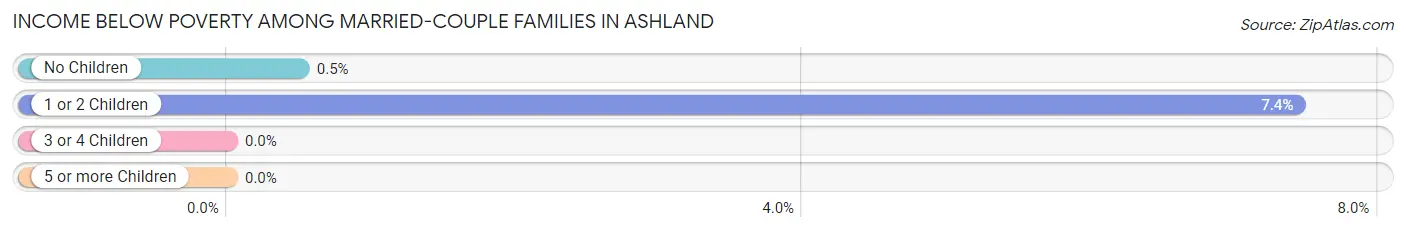
| Children | Above Poverty | Below Poverty |
| No Children | 1,597 (99.5%) | 8 (0.5%) |
| 1 or 2 Children | 623 (92.6%) | 50 (7.4%) |
| 3 or 4 Children | 117 (100.0%) | 0 (0.0%) |
| 5 or more Children | 0 (0.0%) | 0 (0.0%) |
| Total | 2,337 (97.6%) | 58 (2.4%) |
Income Below Poverty Among Single-Parent Households in Ashland
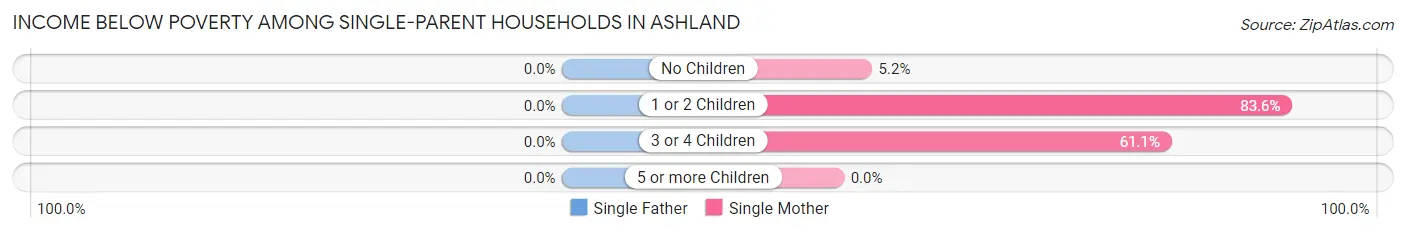
| Children | Single Father | Single Mother |
| No Children | 0 (0.0%) | 10 (5.2%) |
| 1 or 2 Children | 0 (0.0%) | 117 (83.6%) |
| 3 or 4 Children | 0 (0.0%) | 11 (61.1%) |
| 5 or more Children | 0 (0.0%) | 0 (0.0%) |
| Total | 0 (0.0%) | 138 (39.4%) |
Income Below Poverty Among Married-Couple vs Single-Parent Households in Ashland
The poverty data for Ashland shows that 58 of the married-couple family households (2.4%) and 138 of the single-parent households (37.2%) are living below the poverty level. Within the married-couple family households, those with 1 or 2 children have the highest poverty rate, with 50 households (7.4%) falling below the poverty line. Among the single-parent households, those with 1 or 2 children have the highest poverty rate, with 117 household (72.7%) living below poverty.
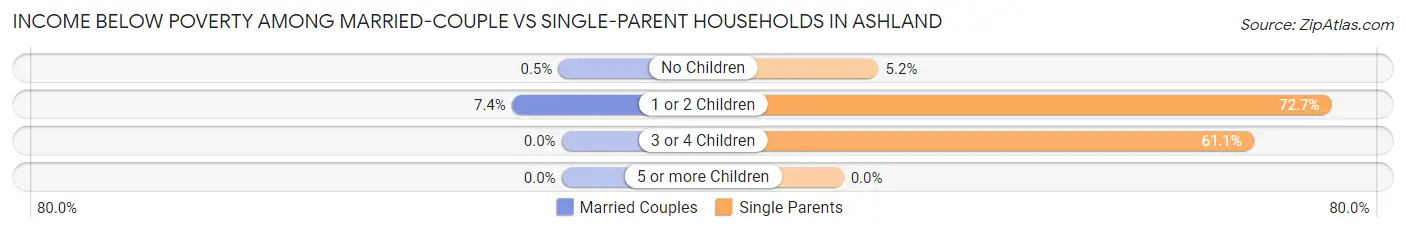
| Children | Married-Couple Families | Single-Parent Households |
| No Children | 8 (0.5%) | 10 (5.2%) |
| 1 or 2 Children | 50 (7.4%) | 117 (72.7%) |
| 3 or 4 Children | 0 (0.0%) | 11 (61.1%) |
| 5 or more Children | 0 (0.0%) | 0 (0.0%) |
| Total | 58 (2.4%) | 138 (37.2%) |
Employment Characteristics in Ashland
Employment by Class of Employer in Ashland
Among the 4,909 employed individuals in Ashland, private company employees (3,407 | 69.4%), not-for-profit organizations (468 | 9.5%), and local government employees (369 | 7.5%) make up the most common classes of employment.
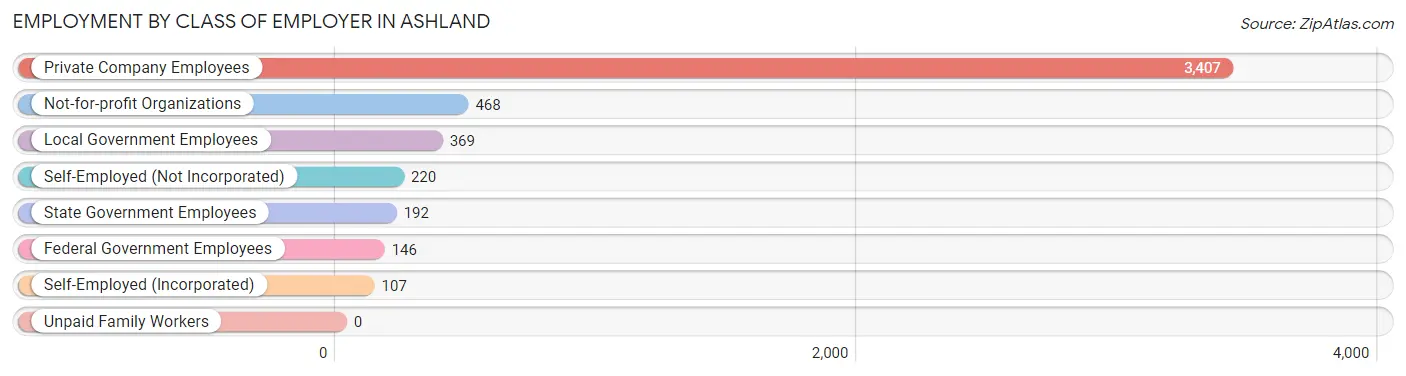
| Employer Class | # Employees | % Employees |
| Private Company Employees | 3,407 | 69.4% |
| Self-Employed (Incorporated) | 107 | 2.2% |
| Self-Employed (Not Incorporated) | 220 | 4.5% |
| Not-for-profit Organizations | 468 | 9.5% |
| Local Government Employees | 369 | 7.5% |
| State Government Employees | 192 | 3.9% |
| Federal Government Employees | 146 | 3.0% |
| Unpaid Family Workers | 0 | 0.0% |
| Total | 4,909 | 100.0% |
Employment Status by Age in Ashland
According to the labor force statistics for Ashland, out of the total population over 16 years of age (7,813), 66.4% or 5,188 individuals are in the labor force, with 4.9% or 254 of them unemployed. The age group with the highest labor force participation rate is 45 to 54 years, with 95.5% or 1,155 individuals in the labor force. Within the labor force, the 16 to 19 years age range has the highest percentage of unemployed individuals, with 36.2% or 47 of them being unemployed.
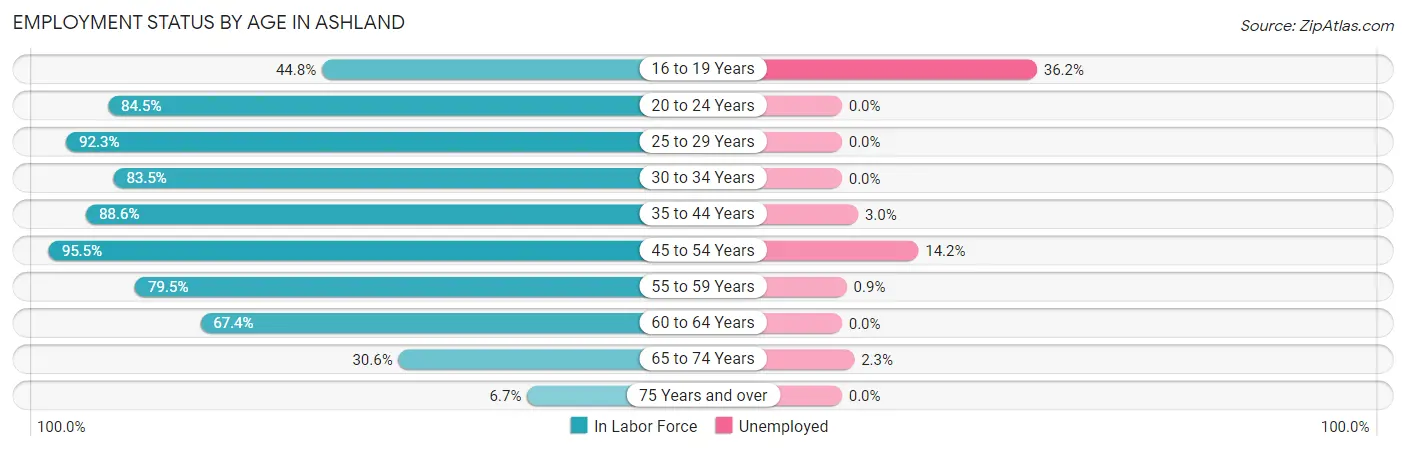
| Age Bracket | In Labor Force | Unemployed |
| 16 to 19 Years | 130 (44.8%) | 47 (36.2%) |
| 20 to 24 Years | 365 (84.5%) | 0 (0.0%) |
| 25 to 29 Years | 469 (92.3%) | 0 (0.0%) |
| 30 to 34 Years | 370 (83.5%) | 0 (0.0%) |
| 35 to 44 Years | 983 (88.6%) | 29 (3.0%) |
| 45 to 54 Years | 1,155 (95.5%) | 164 (14.2%) |
| 55 to 59 Years | 1,022 (79.5%) | 9 (0.9%) |
| 60 to 64 Years | 358 (67.4%) | 0 (0.0%) |
| 65 to 74 Years | 260 (30.6%) | 6 (2.3%) |
| 75 Years and over | 77 (6.7%) | 0 (0.0%) |
| Total | 5,188 (66.4%) | 254 (4.9%) |
Employment Status by Educational Attainment in Ashland
According to labor force statistics for Ashland, 85.7% of individuals (4,359) out of the total population between 25 and 64 years of age (5,086) are in the labor force, with 4.6% or 201 of them being unemployed. The group with the highest labor force participation rate are those with the educational attainment of high school diploma, with 91.7% or 1,036 individuals in the labor force. Within the labor force, individuals with less than high school education have the highest percentage of unemployment, with 21.6% or 11 of them being unemployed.
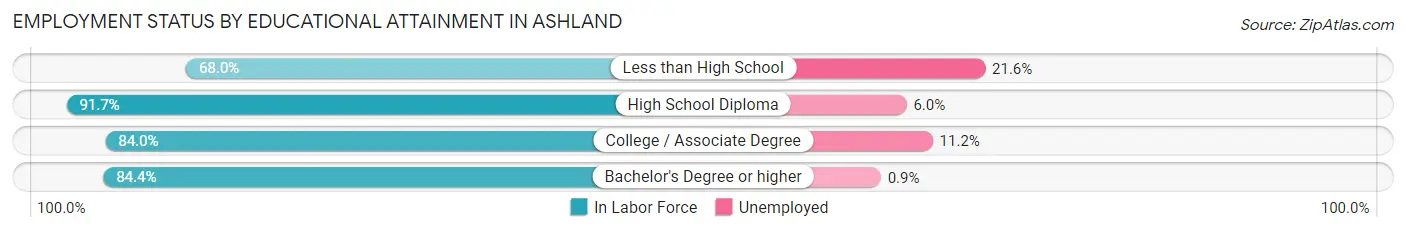
| Educational Attainment | In Labor Force | Unemployed |
| Less than High School | 51 (68.0%) | 16 (21.6%) |
| High School Diploma | 1,036 (91.7%) | 68 (6.0%) |
| College / Associate Degree | 946 (84.0%) | 126 (11.2%) |
| Bachelor's Degree or higher | 2,325 (84.4%) | 25 (0.9%) |
| Total | 4,359 (85.7%) | 234 (4.6%) |
Employment Occupations by Sex in Ashland
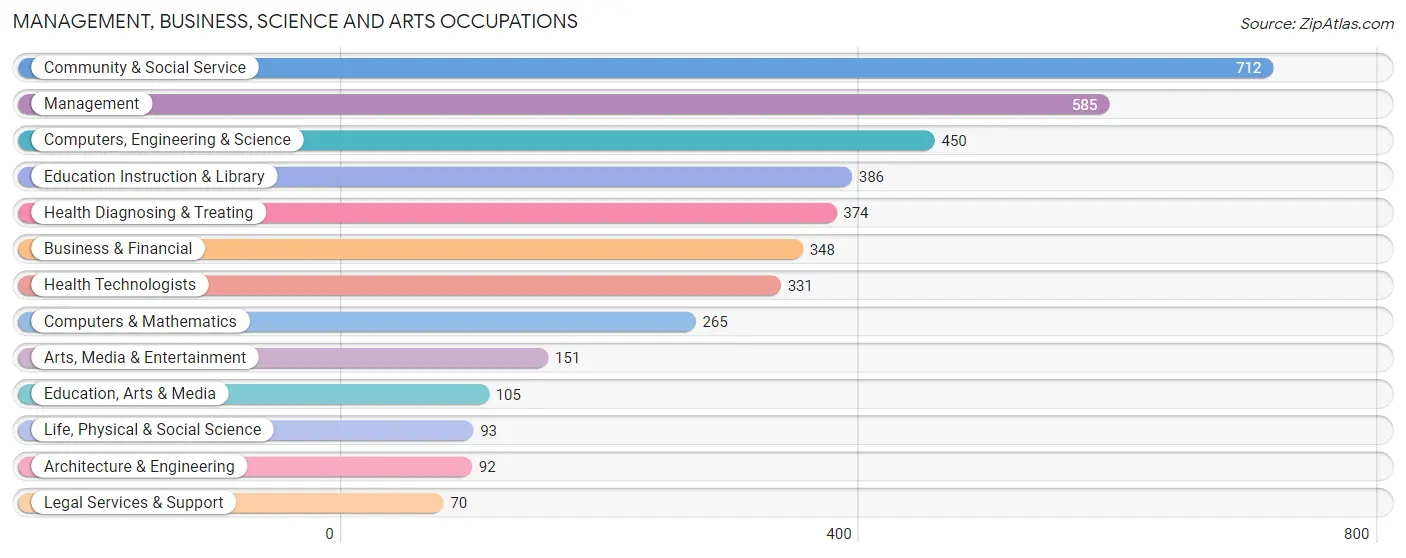
Management, Business, Science and Arts Occupations
The most common Management, Business, Science and Arts occupations in Ashland are Community & Social Service (712 | 14.5%), Management (585 | 11.9%), Computers, Engineering & Science (450 | 9.2%), Education Instruction & Library (386 | 7.9%), and Health Diagnosing & Treating (374 | 7.6%).
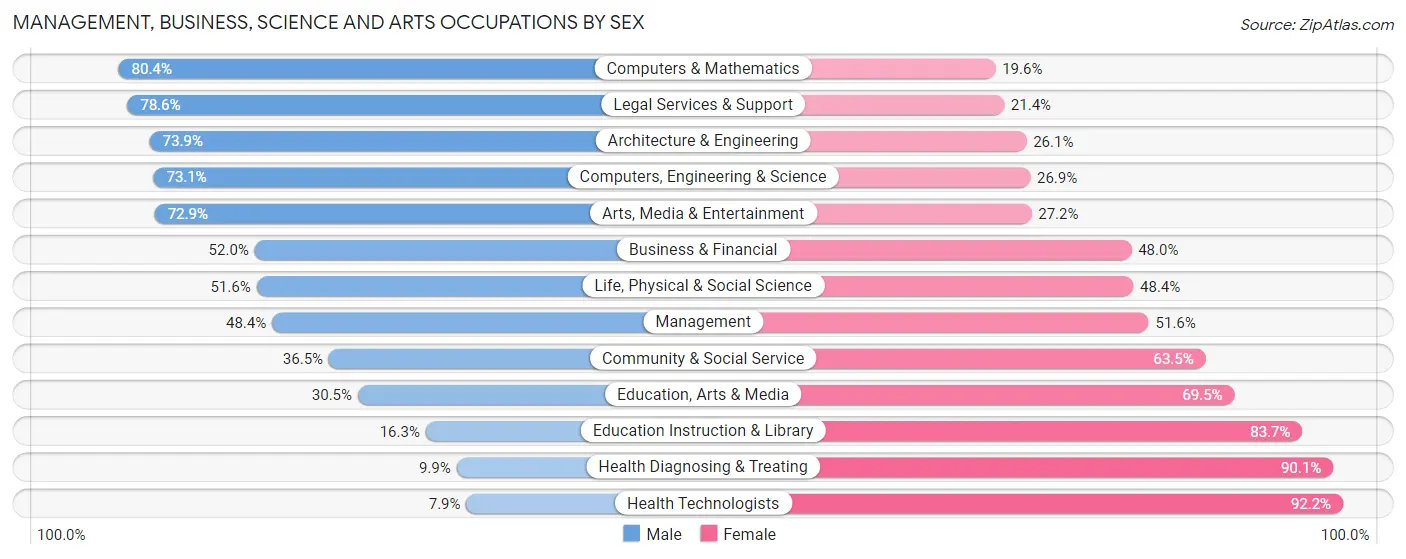
Management, Business, Science and Arts Occupations by Sex
Within the Management, Business, Science and Arts occupations in Ashland, the most male-oriented occupations are Computers & Mathematics (80.4%), Legal Services & Support (78.6%), and Architecture & Engineering (73.9%), while the most female-oriented occupations are Health Technologists (92.1%), Health Diagnosing & Treating (90.1%), and Education Instruction & Library (83.7%).
| Occupation | Male | Female |
| Management | 283 (48.4%) | 302 (51.6%) |
| Business & Financial | 181 (52.0%) | 167 (48.0%) |
| Computers, Engineering & Science | 329 (73.1%) | 121 (26.9%) |
| Computers & Mathematics | 213 (80.4%) | 52 (19.6%) |
| Architecture & Engineering | 68 (73.9%) | 24 (26.1%) |
| Life, Physical & Social Science | 48 (51.6%) | 45 (48.4%) |
| Community & Social Service | 260 (36.5%) | 452 (63.5%) |
| Education, Arts & Media | 32 (30.5%) | 73 (69.5%) |
| Legal Services & Support | 55 (78.6%) | 15 (21.4%) |
| Education Instruction & Library | 63 (16.3%) | 323 (83.7%) |
| Arts, Media & Entertainment | 110 (72.9%) | 41 (27.2%) |
| Health Diagnosing & Treating | 37 (9.9%) | 337 (90.1%) |
| Health Technologists | 26 (7.9%) | 305 (92.1%) |
| Total (Category) | 1,090 (44.2%) | 1,379 (55.8%) |
| Total (Overall) | 2,290 (46.7%) | 2,618 (53.3%) |
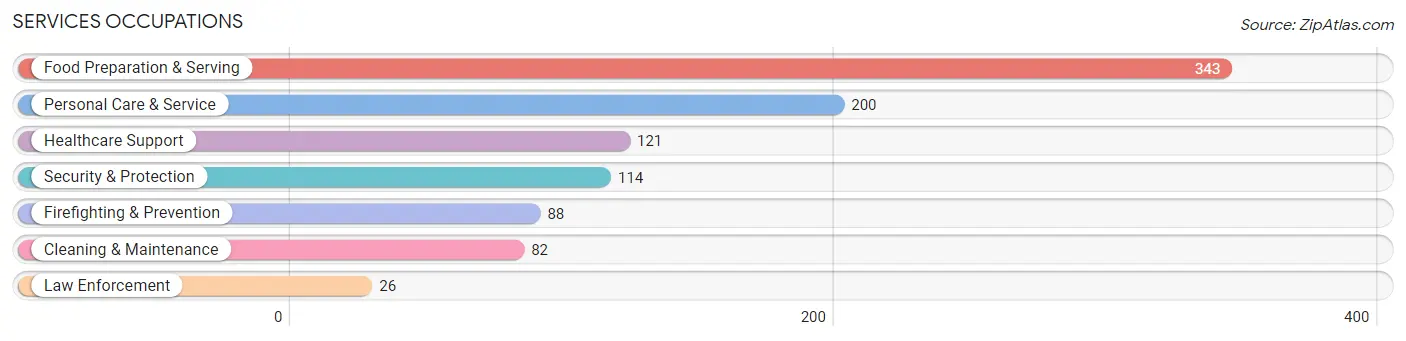
Services Occupations
The most common Services occupations in Ashland are Food Preparation & Serving (343 | 7.0%), Personal Care & Service (200 | 4.1%), Healthcare Support (121 | 2.5%), Security & Protection (114 | 2.3%), and Firefighting & Prevention (88 | 1.8%).
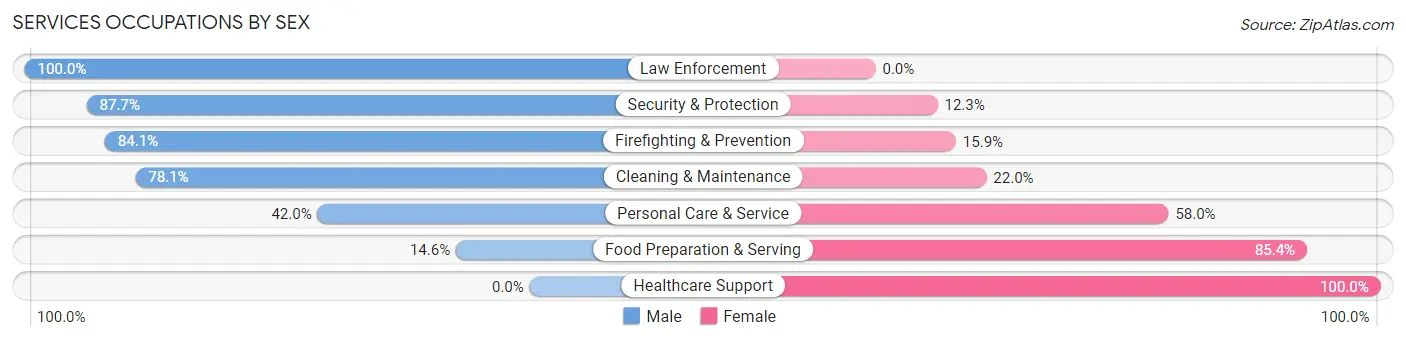
Services Occupations by Sex
Within the Services occupations in Ashland, the most male-oriented occupations are Law Enforcement (100.0%), Security & Protection (87.7%), and Firefighting & Prevention (84.1%), while the most female-oriented occupations are Healthcare Support (100.0%), Food Preparation & Serving (85.4%), and Personal Care & Service (58.0%).
| Occupation | Male | Female |
| Healthcare Support | 0 (0.0%) | 121 (100.0%) |
| Security & Protection | 100 (87.7%) | 14 (12.3%) |
| Firefighting & Prevention | 74 (84.1%) | 14 (15.9%) |
| Law Enforcement | 26 (100.0%) | 0 (0.0%) |
| Food Preparation & Serving | 50 (14.6%) | 293 (85.4%) |
| Cleaning & Maintenance | 64 (78.0%) | 18 (22.0%) |
| Personal Care & Service | 84 (42.0%) | 116 (58.0%) |
| Total (Category) | 298 (34.6%) | 562 (65.3%) |
| Total (Overall) | 2,290 (46.7%) | 2,618 (53.3%) |
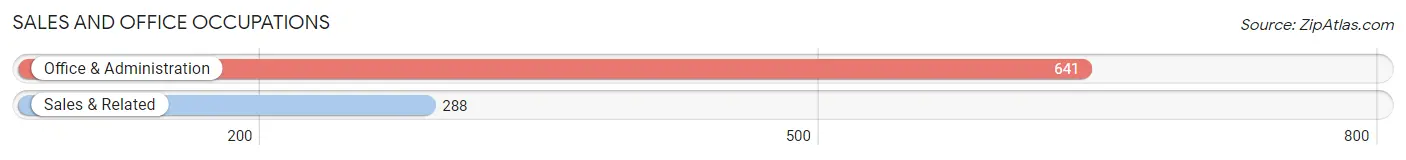
Sales and Office Occupations
The most common Sales and Office occupations in Ashland are Office & Administration (641 | 13.1%), and Sales & Related (288 | 5.9%).
Sales and Office Occupations by Sex
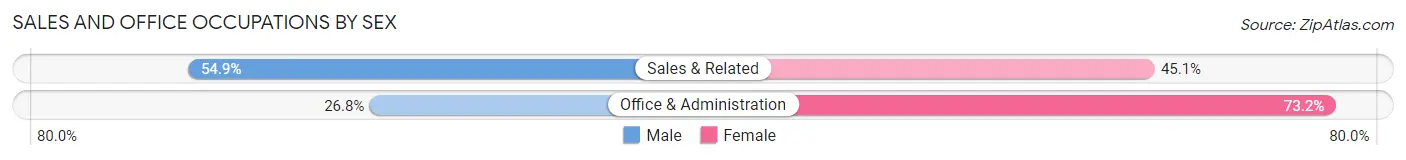
| Occupation | Male | Female |
| Sales & Related | 158 (54.9%) | 130 (45.1%) |
| Office & Administration | 172 (26.8%) | 469 (73.2%) |
| Total (Category) | 330 (35.5%) | 599 (64.5%) |
| Total (Overall) | 2,290 (46.7%) | 2,618 (53.3%) |
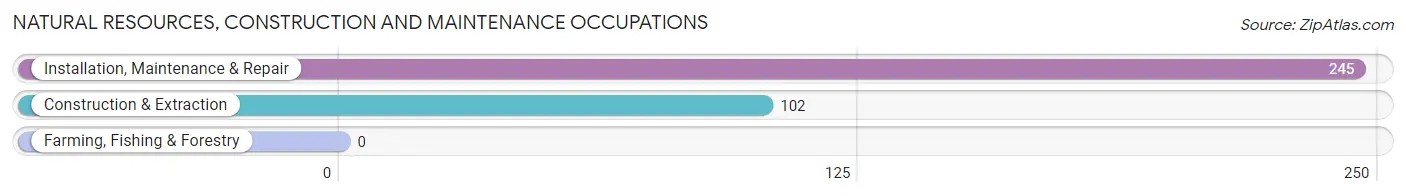
Natural Resources, Construction and Maintenance Occupations
The most common Natural Resources, Construction and Maintenance occupations in Ashland are Installation, Maintenance & Repair (245 | 5.0%), and Construction & Extraction (102 | 2.1%).
Natural Resources, Construction and Maintenance Occupations by Sex
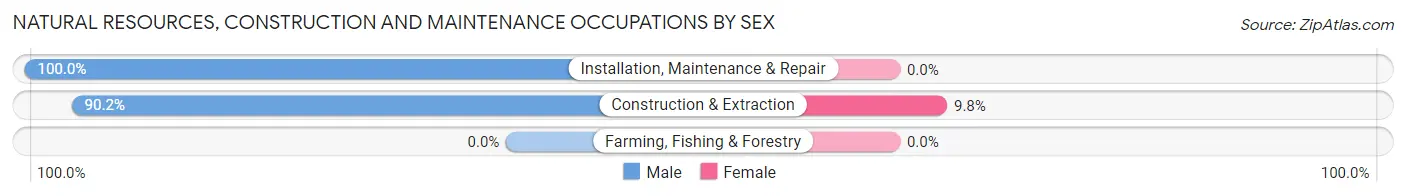
| Occupation | Male | Female |
| Farming, Fishing & Forestry | 0 (0.0%) | 0 (0.0%) |
| Construction & Extraction | 92 (90.2%) | 10 (9.8%) |
| Installation, Maintenance & Repair | 245 (100.0%) | 0 (0.0%) |
| Total (Category) | 337 (97.1%) | 10 (2.9%) |
| Total (Overall) | 2,290 (46.7%) | 2,618 (53.3%) |
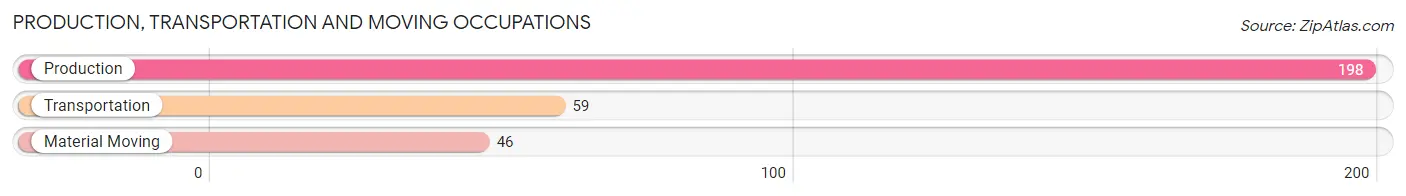
Production, Transportation and Moving Occupations
The most common Production, Transportation and Moving occupations in Ashland are Production (198 | 4.0%), Transportation (59 | 1.2%), and Material Moving (46 | 0.9%).
Production, Transportation and Moving Occupations by Sex
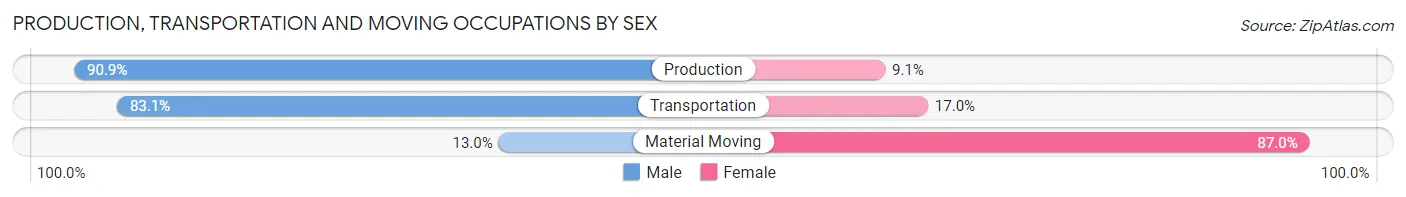
| Occupation | Male | Female |
| Production | 180 (90.9%) | 18 (9.1%) |
| Transportation | 49 (83.1%) | 10 (17.0%) |
| Material Moving | 6 (13.0%) | 40 (87.0%) |
| Total (Category) | 235 (77.6%) | 68 (22.4%) |
| Total (Overall) | 2,290 (46.7%) | 2,618 (53.3%) |
Employment Industries by Sex in Ashland
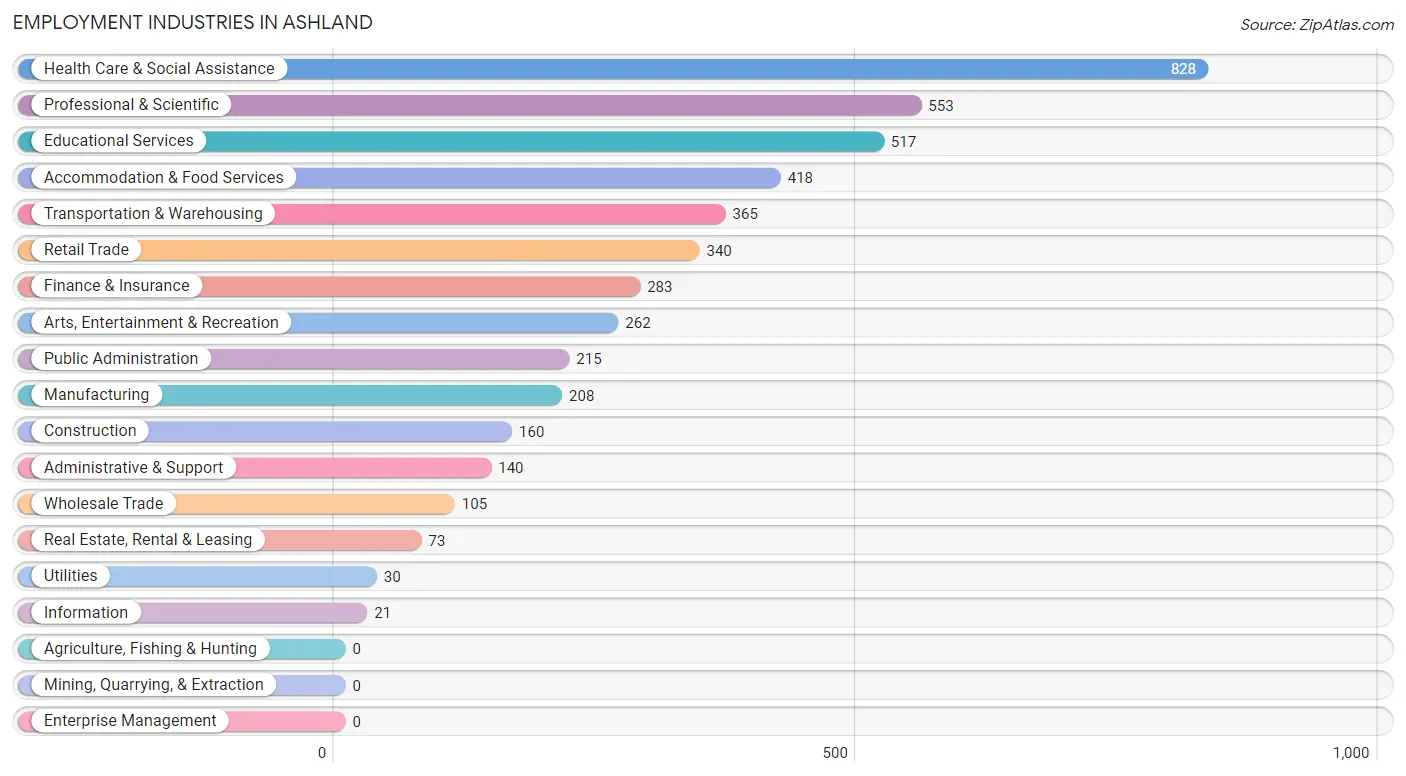
Employment Industries in Ashland
The major employment industries in Ashland include Health Care & Social Assistance (828 | 16.9%), Professional & Scientific (553 | 11.3%), Educational Services (517 | 10.5%), Accommodation & Food Services (418 | 8.5%), and Transportation & Warehousing (365 | 7.4%).
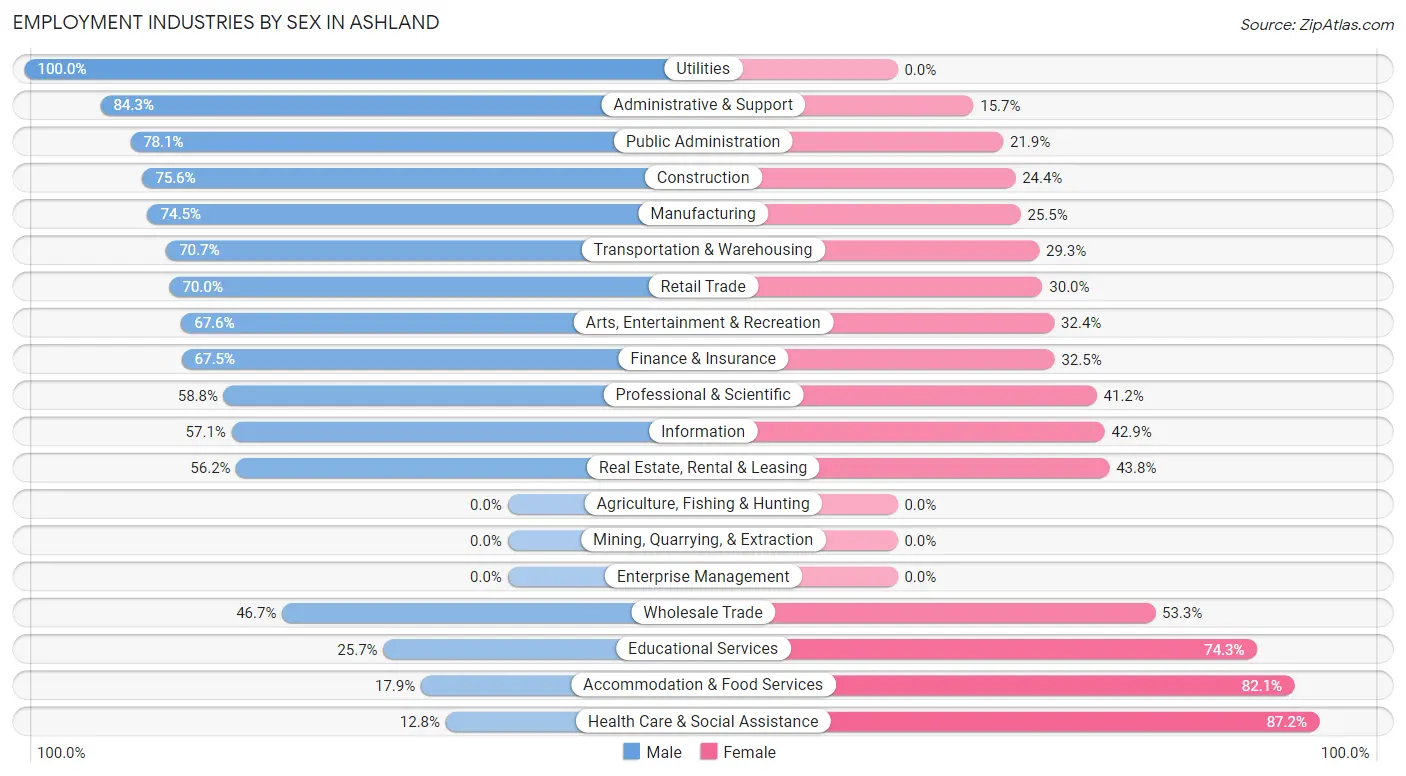
Employment Industries by Sex in Ashland
The Ashland industries that see more men than women are Utilities (100.0%), Administrative & Support (84.3%), and Public Administration (78.1%), whereas the industries that tend to have a higher number of women are Health Care & Social Assistance (87.2%), Accommodation & Food Services (82.1%), and Educational Services (74.3%).
| Industry | Male | Female |
| Agriculture, Fishing & Hunting | 0 (0.0%) | 0 (0.0%) |
| Mining, Quarrying, & Extraction | 0 (0.0%) | 0 (0.0%) |
| Construction | 121 (75.6%) | 39 (24.4%) |
| Manufacturing | 155 (74.5%) | 53 (25.5%) |
| Wholesale Trade | 49 (46.7%) | 56 (53.3%) |
| Retail Trade | 238 (70.0%) | 102 (30.0%) |
| Transportation & Warehousing | 258 (70.7%) | 107 (29.3%) |
| Utilities | 30 (100.0%) | 0 (0.0%) |
| Information | 12 (57.1%) | 9 (42.9%) |
| Finance & Insurance | 191 (67.5%) | 92 (32.5%) |
| Real Estate, Rental & Leasing | 41 (56.2%) | 32 (43.8%) |
| Professional & Scientific | 325 (58.8%) | 228 (41.2%) |
| Enterprise Management | 0 (0.0%) | 0 (0.0%) |
| Administrative & Support | 118 (84.3%) | 22 (15.7%) |
| Educational Services | 133 (25.7%) | 384 (74.3%) |
| Health Care & Social Assistance | 106 (12.8%) | 722 (87.2%) |
| Arts, Entertainment & Recreation | 177 (67.6%) | 85 (32.4%) |
| Accommodation & Food Services | 75 (17.9%) | 343 (82.1%) |
| Public Administration | 168 (78.1%) | 47 (21.9%) |
| Total | 2,290 (46.7%) | 2,618 (53.3%) |
Education in Ashland
School Enrollment in Ashland
The most common levels of schooling among the 1,923 students in Ashland are elementary school (492 | 25.6%), college / undergraduate (452 | 23.5%), and high school (321 | 16.7%).
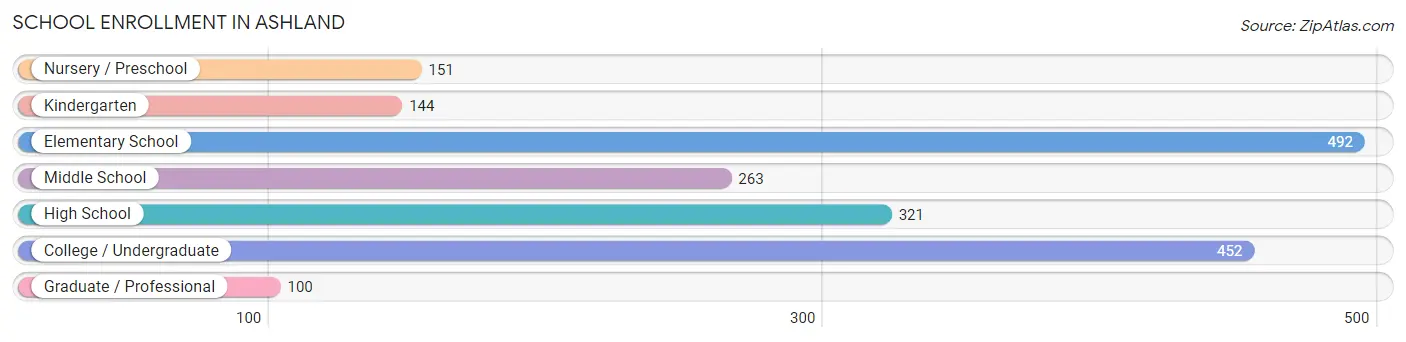
| School Level | # Students | % Students |
| Nursery / Preschool | 151 | 7.9% |
| Kindergarten | 144 | 7.5% |
| Elementary School | 492 | 25.6% |
| Middle School | 263 | 13.7% |
| High School | 321 | 16.7% |
| College / Undergraduate | 452 | 23.5% |
| Graduate / Professional | 100 | 5.2% |
| Total | 1,923 | 100.0% |
School Enrollment by Age by Funding Source in Ashland
Out of a total of 1,923 students who are enrolled in schools in Ashland, 285 (14.8%) attend a private institution, while the remaining 1,638 (85.2%) are enrolled in public schools. The age group of 3 to 4 year olds has the highest likelihood of being enrolled in private schools, with 104 (75.4% in the age bracket) enrolled. Conversely, the age group of 15 to 17 year olds has the lowest likelihood of being enrolled in a private school, with 240 (100.0% in the age bracket) attending a public institution.
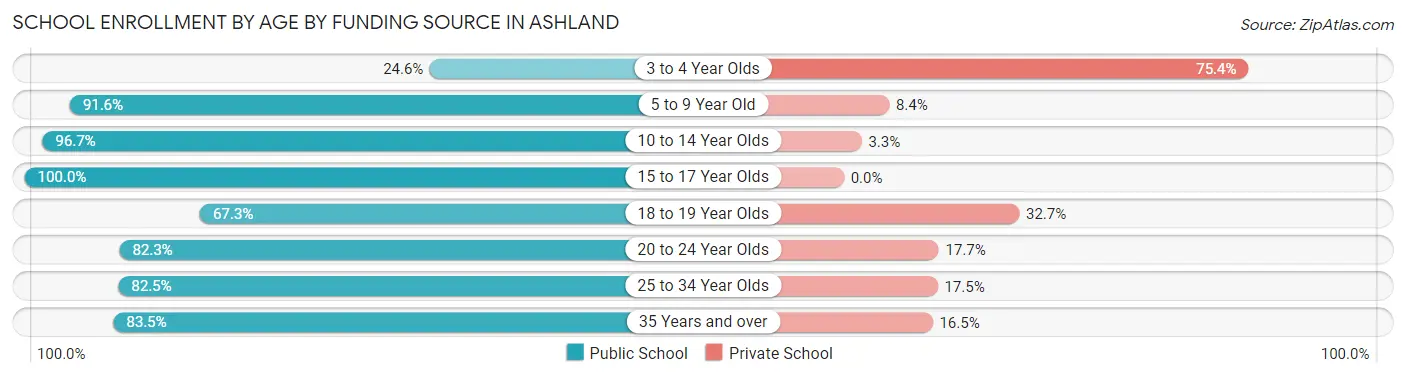
| Age Bracket | Public School | Private School |
| 3 to 4 Year Olds | 34 (24.6%) | 104 (75.4%) |
| 5 to 9 Year Old | 499 (91.6%) | 46 (8.4%) |
| 10 to 14 Year Olds | 378 (96.7%) | 13 (3.3%) |
| 15 to 17 Year Olds | 240 (100.0%) | 0 (0.0%) |
| 18 to 19 Year Olds | 68 (67.3%) | 33 (32.7%) |
| 20 to 24 Year Olds | 177 (82.3%) | 38 (17.7%) |
| 25 to 34 Year Olds | 137 (82.5%) | 29 (17.5%) |
| 35 Years and over | 106 (83.5%) | 21 (16.5%) |
| Total | 1,638 (85.2%) | 285 (14.8%) |
Educational Attainment by Field of Study in Ashland
Business (799 | 21.2%), education (506 | 13.4%), science & technology (437 | 11.6%), communications (269 | 7.1%), and liberal arts & history (261 | 6.9%) are the most common fields of study among 3,770 individuals in Ashland who have obtained a bachelor's degree or higher.
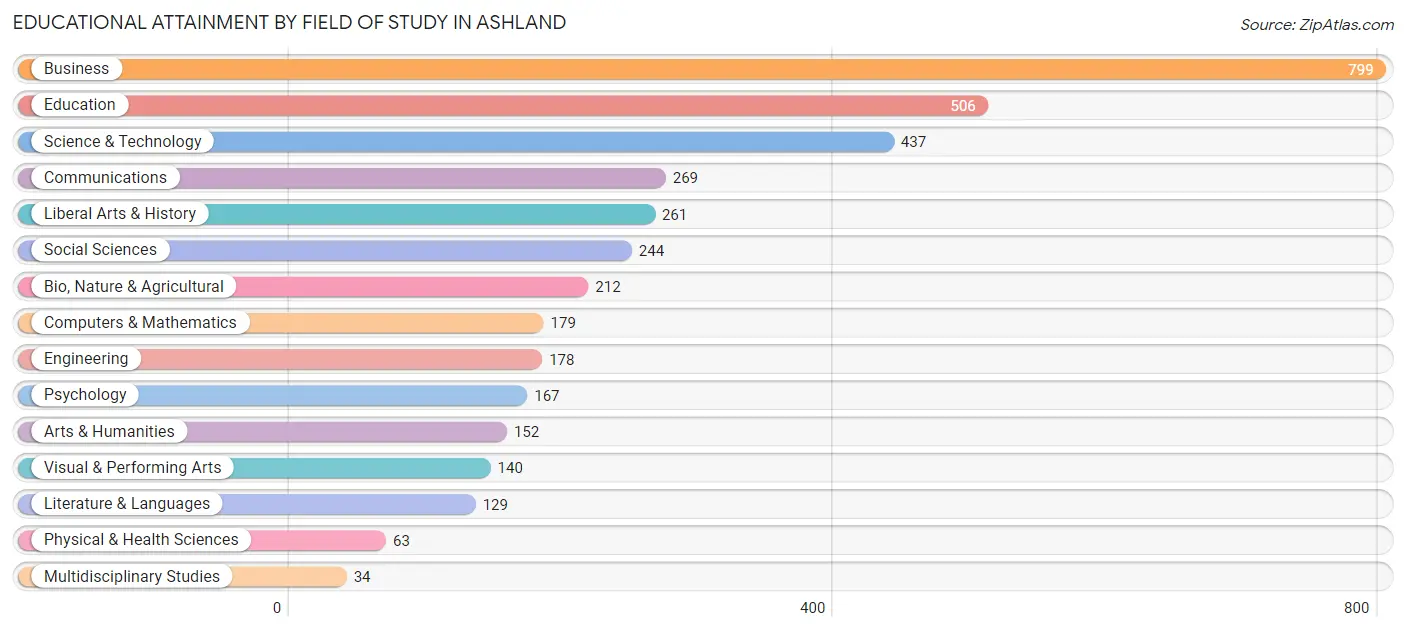
| Field of Study | # Graduates | % Graduates |
| Computers & Mathematics | 179 | 4.8% |
| Bio, Nature & Agricultural | 212 | 5.6% |
| Physical & Health Sciences | 63 | 1.7% |
| Psychology | 167 | 4.4% |
| Social Sciences | 244 | 6.5% |
| Engineering | 178 | 4.7% |
| Multidisciplinary Studies | 34 | 0.9% |
| Science & Technology | 437 | 11.6% |
| Business | 799 | 21.2% |
| Education | 506 | 13.4% |
| Literature & Languages | 129 | 3.4% |
| Liberal Arts & History | 261 | 6.9% |
| Visual & Performing Arts | 140 | 3.7% |
| Communications | 269 | 7.1% |
| Arts & Humanities | 152 | 4.0% |
| Total | 3,770 | 100.0% |
Transportation & Commute in Ashland
Vehicle Availability by Sex in Ashland
The most prevalent vehicle ownership categories in Ashland are males with 2 vehicles (1,135, accounting for 49.2%) and females with 2 vehicles (1,291, making up 43.6%).
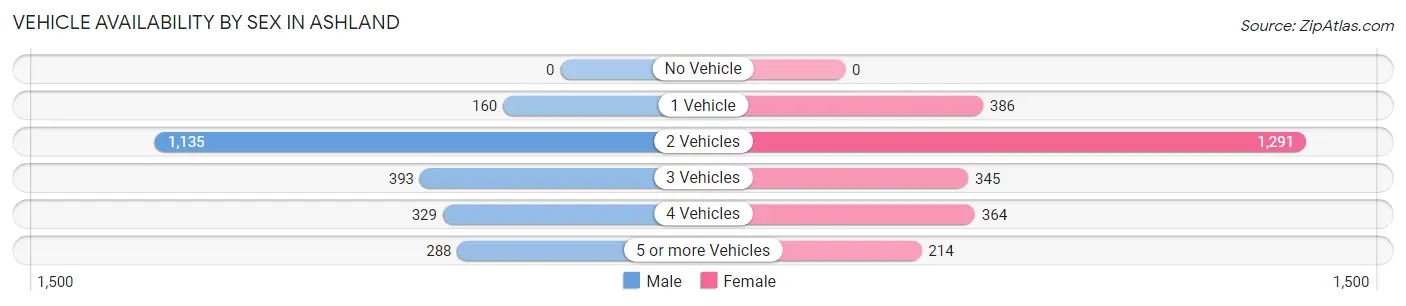
| Vehicles Available | Male | Female |
| No Vehicle | 0 (0.0%) | 0 (0.0%) |
| 1 Vehicle | 160 (6.9%) | 386 (14.8%) |
| 2 Vehicles | 1,135 (49.2%) | 1,291 (49.6%) |
| 3 Vehicles | 393 (17.1%) | 345 (13.3%) |
| 4 Vehicles | 329 (14.3%) | 364 (14.0%) |
| 5 or more Vehicles | 288 (12.5%) | 214 (8.2%) |
| Total | 2,305 (100.0%) | 2,600 (100.0%) |
Commute Time in Ashland
The most frequently occuring commute durations in Ashland are 20 to 24 minutes (969 commuters, 23.1%), 15 to 19 minutes (527 commuters, 12.6%), and 30 to 34 minutes (508 commuters, 12.1%).

| Commute Time | # Commuters | % Commuters |
| Less than 5 Minutes | 112 | 2.7% |
| 5 to 9 Minutes | 152 | 3.6% |
| 10 to 14 Minutes | 461 | 11.0% |
| 15 to 19 Minutes | 527 | 12.6% |
| 20 to 24 Minutes | 969 | 23.1% |
| 25 to 29 Minutes | 322 | 7.7% |
| 30 to 34 Minutes | 508 | 12.1% |
| 35 to 39 Minutes | 180 | 4.3% |
| 40 to 44 Minutes | 315 | 7.5% |
| 45 to 59 Minutes | 326 | 7.8% |
| 60 to 89 Minutes | 160 | 3.8% |
| 90 or more Minutes | 158 | 3.8% |
Commute Time by Sex in Ashland
The most common commute times in Ashland are 20 to 24 minutes (519 commuters, 26.0%) for males and 20 to 24 minutes (450 commuters, 20.5%) for females.
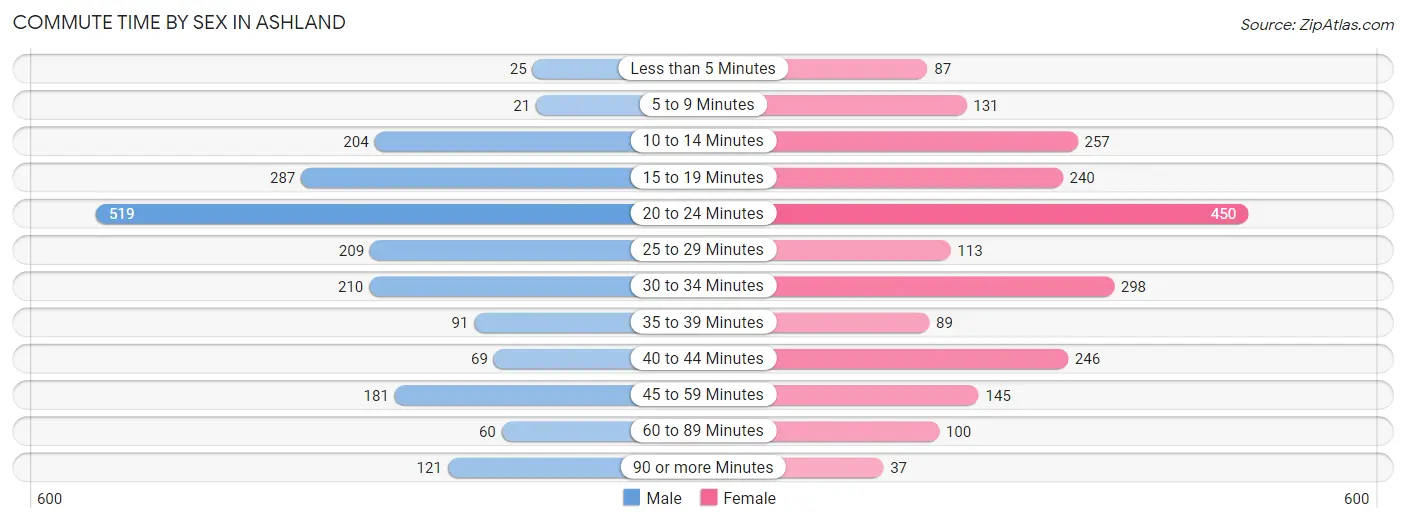
| Commute Time | Male | Female |
| Less than 5 Minutes | 25 (1.3%) | 87 (4.0%) |
| 5 to 9 Minutes | 21 (1.1%) | 131 (6.0%) |
| 10 to 14 Minutes | 204 (10.2%) | 257 (11.7%) |
| 15 to 19 Minutes | 287 (14.4%) | 240 (10.9%) |
| 20 to 24 Minutes | 519 (26.0%) | 450 (20.5%) |
| 25 to 29 Minutes | 209 (10.5%) | 113 (5.1%) |
| 30 to 34 Minutes | 210 (10.5%) | 298 (13.6%) |
| 35 to 39 Minutes | 91 (4.6%) | 89 (4.1%) |
| 40 to 44 Minutes | 69 (3.5%) | 246 (11.2%) |
| 45 to 59 Minutes | 181 (9.1%) | 145 (6.6%) |
| 60 to 89 Minutes | 60 (3.0%) | 100 (4.6%) |
| 90 or more Minutes | 121 (6.1%) | 37 (1.7%) |
Time of Departure to Work by Sex in Ashland
The most frequent times of departure to work in Ashland are 8:00 AM to 8:29 AM (357, 17.9%) for males and 7:30 AM to 7:59 AM (503, 22.9%) for females.
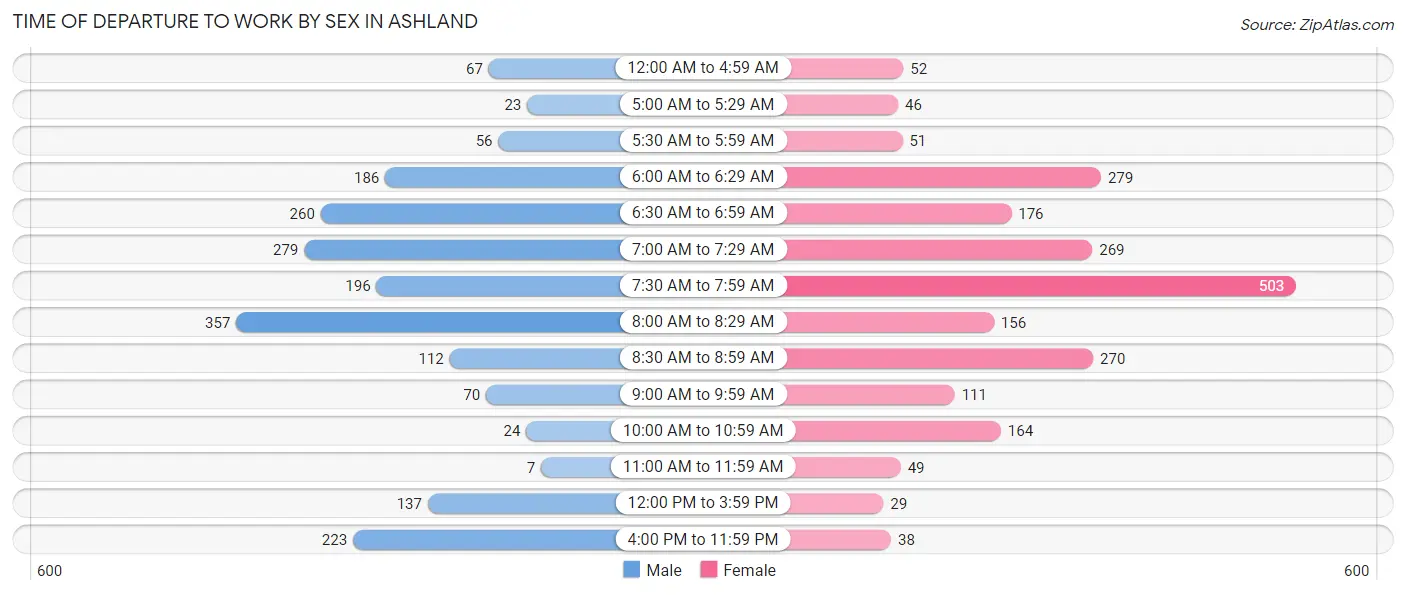
| Time of Departure | Male | Female |
| 12:00 AM to 4:59 AM | 67 (3.4%) | 52 (2.4%) |
| 5:00 AM to 5:29 AM | 23 (1.1%) | 46 (2.1%) |
| 5:30 AM to 5:59 AM | 56 (2.8%) | 51 (2.3%) |
| 6:00 AM to 6:29 AM | 186 (9.3%) | 279 (12.7%) |
| 6:30 AM to 6:59 AM | 260 (13.0%) | 176 (8.0%) |
| 7:00 AM to 7:29 AM | 279 (14.0%) | 269 (12.3%) |
| 7:30 AM to 7:59 AM | 196 (9.8%) | 503 (22.9%) |
| 8:00 AM to 8:29 AM | 357 (17.9%) | 156 (7.1%) |
| 8:30 AM to 8:59 AM | 112 (5.6%) | 270 (12.3%) |
| 9:00 AM to 9:59 AM | 70 (3.5%) | 111 (5.1%) |
| 10:00 AM to 10:59 AM | 24 (1.2%) | 164 (7.5%) |
| 11:00 AM to 11:59 AM | 7 (0.4%) | 49 (2.2%) |
| 12:00 PM to 3:59 PM | 137 (6.9%) | 29 (1.3%) |
| 4:00 PM to 11:59 PM | 223 (11.2%) | 38 (1.7%) |
| Total | 1,997 (100.0%) | 2,193 (100.0%) |
Housing Occupancy in Ashland
Occupancy by Ownership in Ashland
Of the total 3,620 dwellings in Ashland, owner-occupied units account for 3,280 (90.6%), while renter-occupied units make up 340 (9.4%).
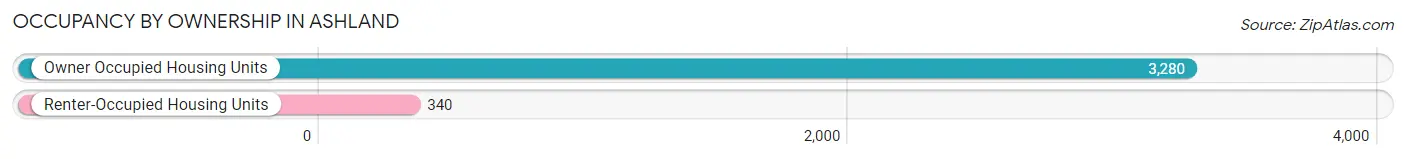
| Occupancy | # Housing Units | % Housing Units |
| Owner Occupied Housing Units | 3,280 | 90.6% |
| Renter-Occupied Housing Units | 340 | 9.4% |
| Total Occupied Housing Units | 3,620 | 100.0% |
Occupancy by Household Size in Ashland
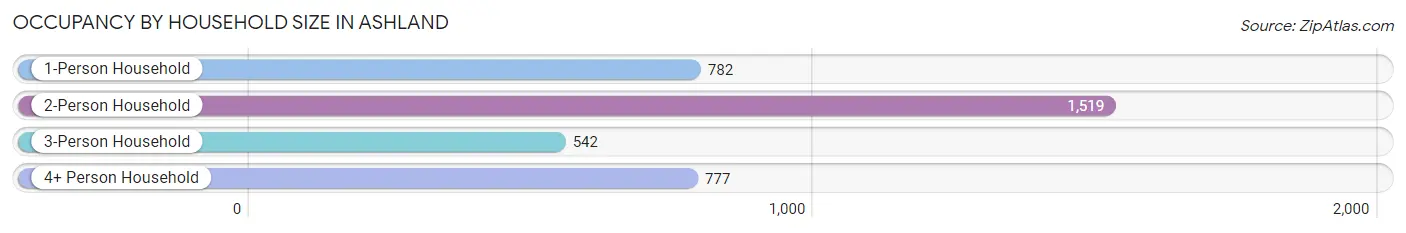
| Household Size | # Housing Units | % Housing Units |
| 1-Person Household | 782 | 21.6% |
| 2-Person Household | 1,519 | 42.0% |
| 3-Person Household | 542 | 15.0% |
| 4+ Person Household | 777 | 21.5% |
| Total Housing Units | 3,620 | 100.0% |
Occupancy by Ownership by Household Size in Ashland
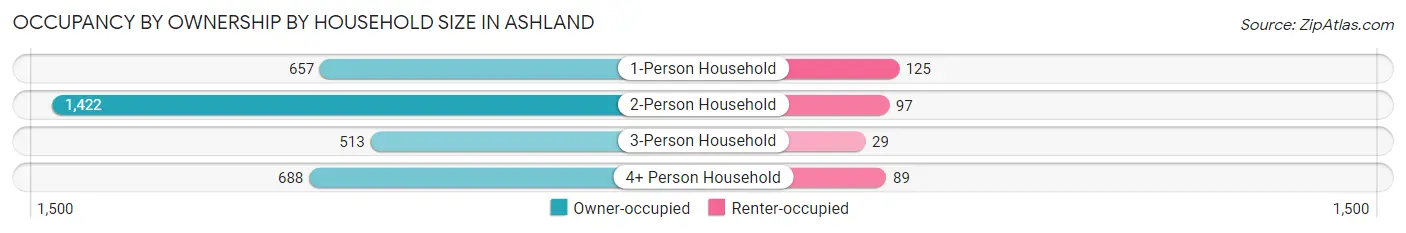
| Household Size | Owner-occupied | Renter-occupied |
| 1-Person Household | 657 (84.0%) | 125 (16.0%) |
| 2-Person Household | 1,422 (93.6%) | 97 (6.4%) |
| 3-Person Household | 513 (94.7%) | 29 (5.3%) |
| 4+ Person Household | 688 (88.5%) | 89 (11.5%) |
| Total Housing Units | 3,280 (90.6%) | 340 (9.4%) |
Occupancy by Educational Attainment in Ashland
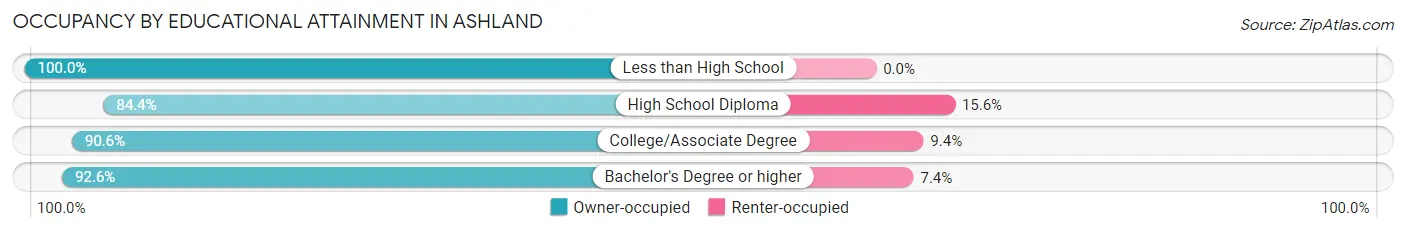
| Household Size | Owner-occupied | Renter-occupied |
| Less than High School | 22 (100.0%) | 0 (0.0%) |
| High School Diploma | 594 (84.4%) | 110 (15.6%) |
| College/Associate Degree | 726 (90.6%) | 75 (9.4%) |
| Bachelor's Degree or higher | 1,938 (92.6%) | 155 (7.4%) |
Occupancy by Age of Householder in Ashland
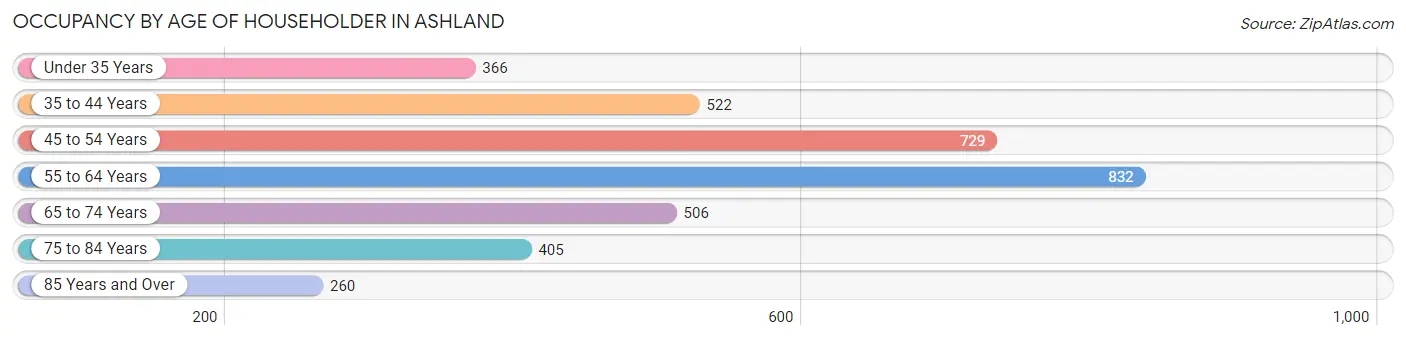
| Age Bracket | # Households | % Households |
| Under 35 Years | 366 | 10.1% |
| 35 to 44 Years | 522 | 14.4% |
| 45 to 54 Years | 729 | 20.1% |
| 55 to 64 Years | 832 | 23.0% |
| 65 to 74 Years | 506 | 14.0% |
| 75 to 84 Years | 405 | 11.2% |
| 85 Years and Over | 260 | 7.2% |
| Total | 3,620 | 100.0% |
Housing Finances in Ashland
Median Income by Occupancy in Ashland
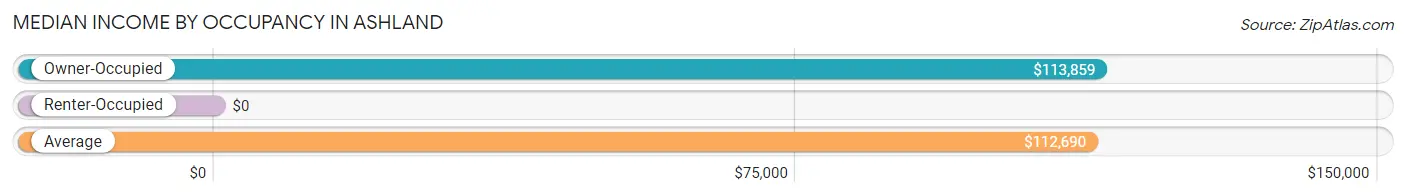
| Occupancy Type | # Households | Median Income |
| Owner-Occupied | 3,280 (90.6%) | $113,859 |
| Renter-Occupied | 340 (9.4%) | $0 |
| Average | 3,620 (100.0%) | $112,690 |
Occupancy by Householder Income Bracket in Ashland
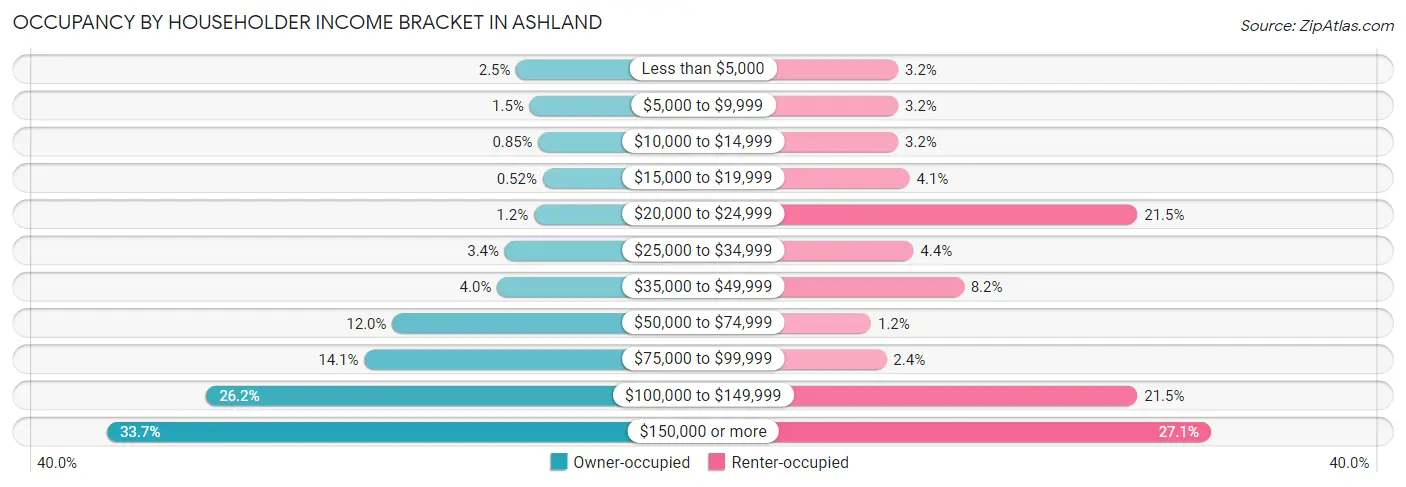
| Income Bracket | Owner-occupied | Renter-occupied |
| Less than $5,000 | 83 (2.5%) | 11 (3.2%) |
| $5,000 to $9,999 | 50 (1.5%) | 11 (3.2%) |
| $10,000 to $14,999 | 28 (0.9%) | 11 (3.2%) |
| $15,000 to $19,999 | 17 (0.5%) | 14 (4.1%) |
| $20,000 to $24,999 | 39 (1.2%) | 73 (21.5%) |
| $25,000 to $34,999 | 112 (3.4%) | 15 (4.4%) |
| $35,000 to $49,999 | 131 (4.0%) | 28 (8.2%) |
| $50,000 to $74,999 | 393 (12.0%) | 4 (1.2%) |
| $75,000 to $99,999 | 463 (14.1%) | 8 (2.4%) |
| $100,000 to $149,999 | 858 (26.2%) | 73 (21.5%) |
| $150,000 or more | 1,106 (33.7%) | 92 (27.1%) |
| Total | 3,280 (100.0%) | 340 (100.0%) |
Monthly Housing Cost Tiers in Ashland
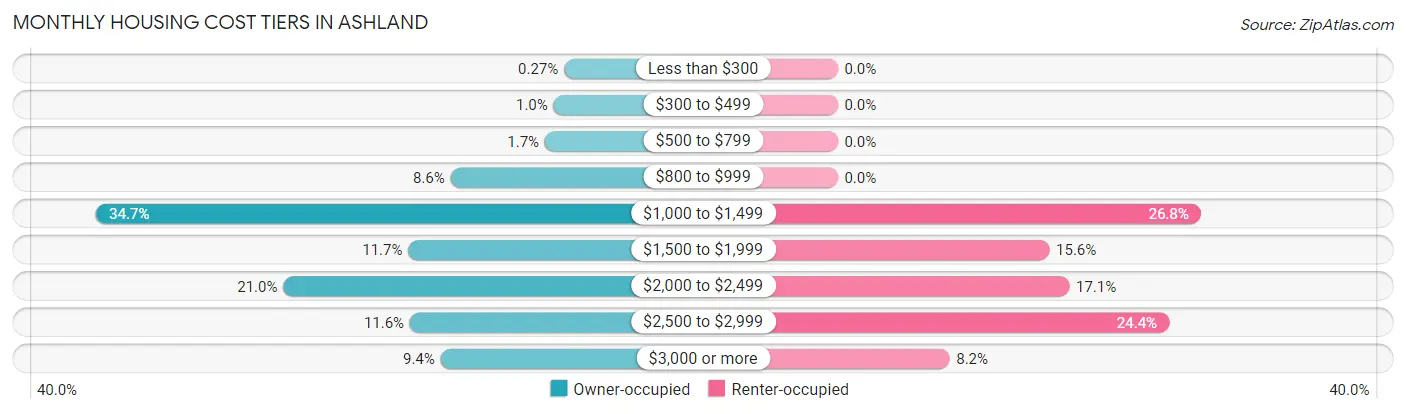
| Monthly Cost | Owner-occupied | Renter-occupied |
| Less than $300 | 9 (0.3%) | 0 (0.0%) |
| $300 to $499 | 34 (1.0%) | 0 (0.0%) |
| $500 to $799 | 55 (1.7%) | 0 (0.0%) |
| $800 to $999 | 283 (8.6%) | 0 (0.0%) |
| $1,000 to $1,499 | 1,139 (34.7%) | 91 (26.8%) |
| $1,500 to $1,999 | 385 (11.7%) | 53 (15.6%) |
| $2,000 to $2,499 | 687 (20.9%) | 58 (17.1%) |
| $2,500 to $2,999 | 381 (11.6%) | 83 (24.4%) |
| $3,000 or more | 307 (9.4%) | 28 (8.2%) |
| Total | 3,280 (100.0%) | 340 (100.0%) |
Physical Housing Characteristics in Ashland
Housing Structures in Ashland
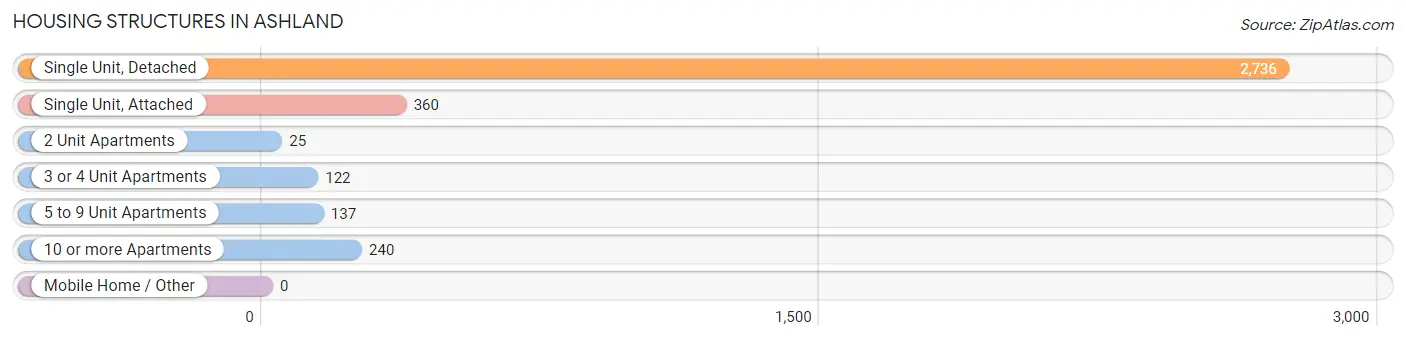
| Structure Type | # Housing Units | % Housing Units |
| Single Unit, Detached | 2,736 | 75.6% |
| Single Unit, Attached | 360 | 9.9% |
| 2 Unit Apartments | 25 | 0.7% |
| 3 or 4 Unit Apartments | 122 | 3.4% |
| 5 to 9 Unit Apartments | 137 | 3.8% |
| 10 or more Apartments | 240 | 6.6% |
| Mobile Home / Other | 0 | 0.0% |
| Total | 3,620 | 100.0% |
Housing Structures by Occupancy in Ashland
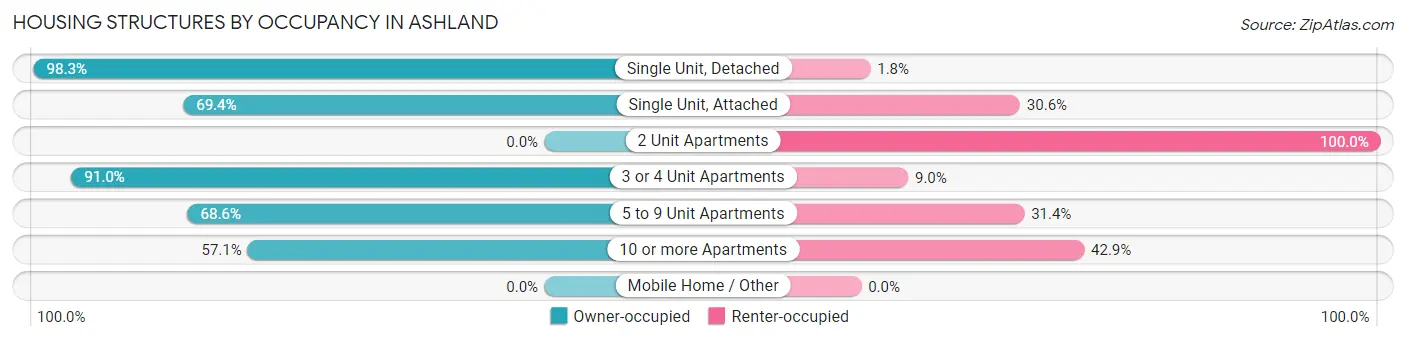
| Structure Type | Owner-occupied | Renter-occupied |
| Single Unit, Detached | 2,688 (98.3%) | 48 (1.8%) |
| Single Unit, Attached | 250 (69.4%) | 110 (30.6%) |
| 2 Unit Apartments | 0 (0.0%) | 25 (100.0%) |
| 3 or 4 Unit Apartments | 111 (91.0%) | 11 (9.0%) |
| 5 to 9 Unit Apartments | 94 (68.6%) | 43 (31.4%) |
| 10 or more Apartments | 137 (57.1%) | 103 (42.9%) |
| Mobile Home / Other | 0 (0.0%) | 0 (0.0%) |
| Total | 3,280 (90.6%) | 340 (9.4%) |
Housing Structures by Number of Rooms in Ashland
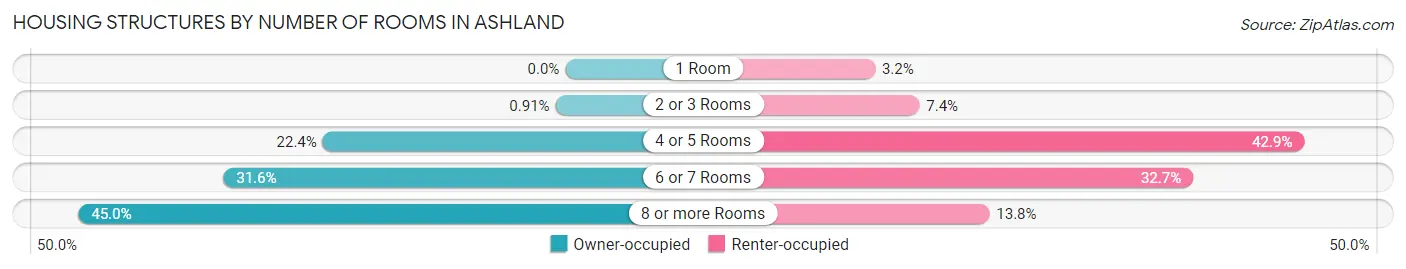
| Number of Rooms | Owner-occupied | Renter-occupied |
| 1 Room | 0 (0.0%) | 11 (3.2%) |
| 2 or 3 Rooms | 30 (0.9%) | 25 (7.3%) |
| 4 or 5 Rooms | 736 (22.4%) | 146 (42.9%) |
| 6 or 7 Rooms | 1,037 (31.6%) | 111 (32.7%) |
| 8 or more Rooms | 1,477 (45.0%) | 47 (13.8%) |
| Total | 3,280 (100.0%) | 340 (100.0%) |
Housing Structure by Heating Type in Ashland
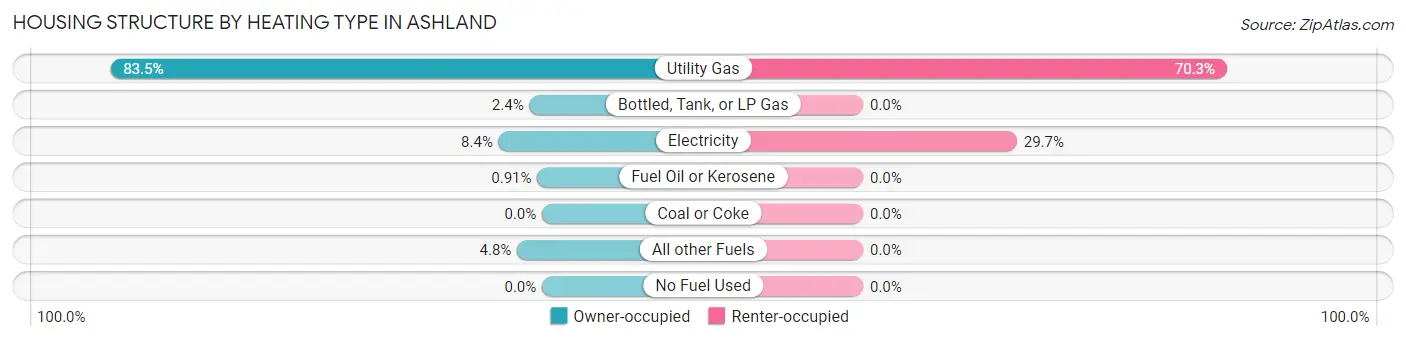
| Heating Type | Owner-occupied | Renter-occupied |
| Utility Gas | 2,737 (83.5%) | 239 (70.3%) |
| Bottled, Tank, or LP Gas | 80 (2.4%) | 0 (0.0%) |
| Electricity | 275 (8.4%) | 101 (29.7%) |
| Fuel Oil or Kerosene | 30 (0.9%) | 0 (0.0%) |
| Coal or Coke | 0 (0.0%) | 0 (0.0%) |
| All other Fuels | 158 (4.8%) | 0 (0.0%) |
| No Fuel Used | 0 (0.0%) | 0 (0.0%) |
| Total | 3,280 (100.0%) | 340 (100.0%) |
Household Vehicle Usage in Ashland
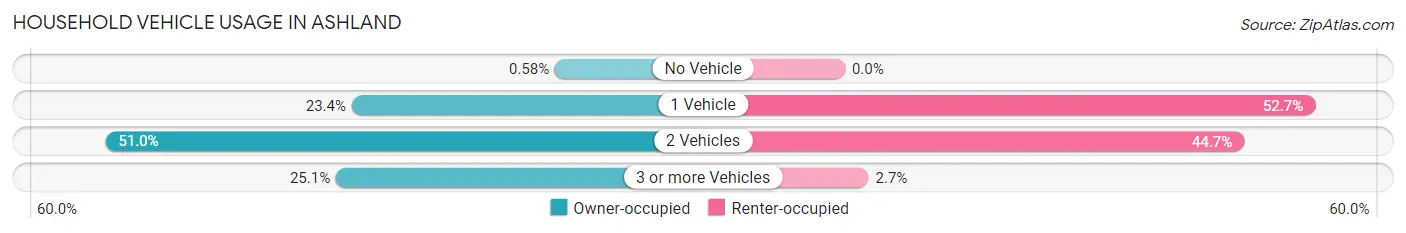
| Vehicles per Household | Owner-occupied | Renter-occupied |
| No Vehicle | 19 (0.6%) | 0 (0.0%) |
| 1 Vehicle | 766 (23.4%) | 179 (52.6%) |
| 2 Vehicles | 1,671 (50.9%) | 152 (44.7%) |
| 3 or more Vehicles | 824 (25.1%) | 9 (2.6%) |
| Total | 3,280 (100.0%) | 340 (100.0%) |
Real Estate & Mortgages in Ashland
Real Estate and Mortgage Overview in Ashland
| Characteristic | Without Mortgage | With Mortgage |
| Housing Units | 1,461 | 1,819 |
| Median Property Value | $277,500 | $284,300 |
| Median Household Income | $101,220 | $749 |
| Monthly Housing Costs | $1,184 | $283 |
| Real Estate Taxes | $8,045 | $0 |
Property Value by Mortgage Status in Ashland
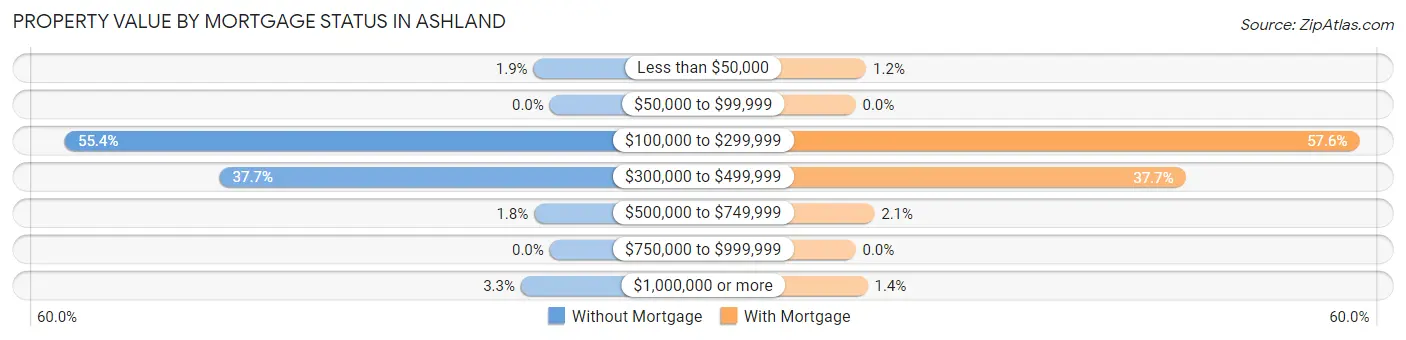
| Property Value | Without Mortgage | With Mortgage |
| Less than $50,000 | 27 (1.8%) | 22 (1.2%) |
| $50,000 to $99,999 | 0 (0.0%) | 0 (0.0%) |
| $100,000 to $299,999 | 809 (55.4%) | 1,047 (57.6%) |
| $300,000 to $499,999 | 551 (37.7%) | 686 (37.7%) |
| $500,000 to $749,999 | 26 (1.8%) | 39 (2.1%) |
| $750,000 to $999,999 | 0 (0.0%) | 0 (0.0%) |
| $1,000,000 or more | 48 (3.3%) | 25 (1.4%) |
| Total | 1,461 (100.0%) | 1,819 (100.0%) |
Household Income by Mortgage Status in Ashland
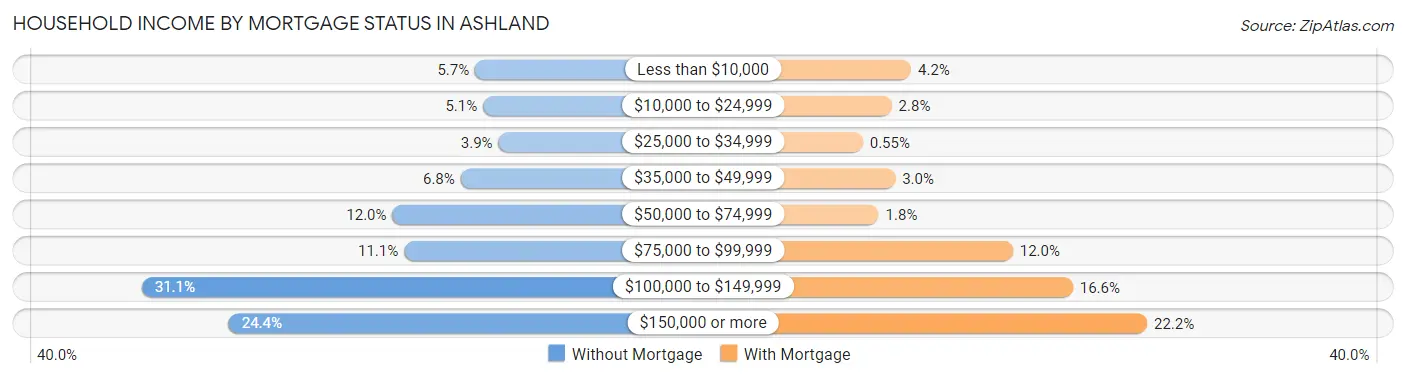
| Household Income | Without Mortgage | With Mortgage |
| Less than $10,000 | 83 (5.7%) | 77 (4.2%) |
| $10,000 to $24,999 | 74 (5.1%) | 50 (2.8%) |
| $25,000 to $34,999 | 57 (3.9%) | 10 (0.5%) |
| $35,000 to $49,999 | 99 (6.8%) | 55 (3.0%) |
| $50,000 to $74,999 | 175 (12.0%) | 32 (1.8%) |
| $75,000 to $99,999 | 162 (11.1%) | 218 (12.0%) |
| $100,000 to $149,999 | 454 (31.1%) | 301 (16.6%) |
| $150,000 or more | 357 (24.4%) | 404 (22.2%) |
| Total | 1,461 (100.0%) | 1,819 (100.0%) |
Property Value to Household Income Ratio in Ashland
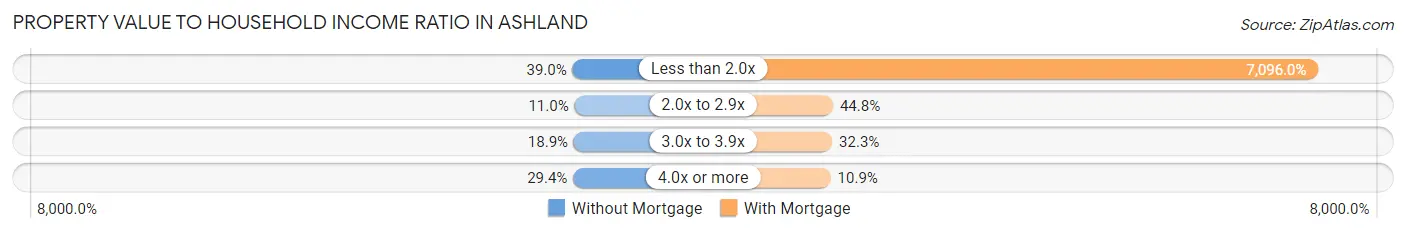
| Value-to-Income Ratio | Without Mortgage | With Mortgage |
| Less than 2.0x | 570 (39.0%) | 129,076 (7,096.0%) |
| 2.0x to 2.9x | 160 (11.0%) | 814 (44.8%) |
| 3.0x to 3.9x | 276 (18.9%) | 588 (32.3%) |
| 4.0x or more | 430 (29.4%) | 199 (10.9%) |
| Total | 1,461 (100.0%) | 1,819 (100.0%) |
Real Estate Taxes by Mortgage Status in Ashland
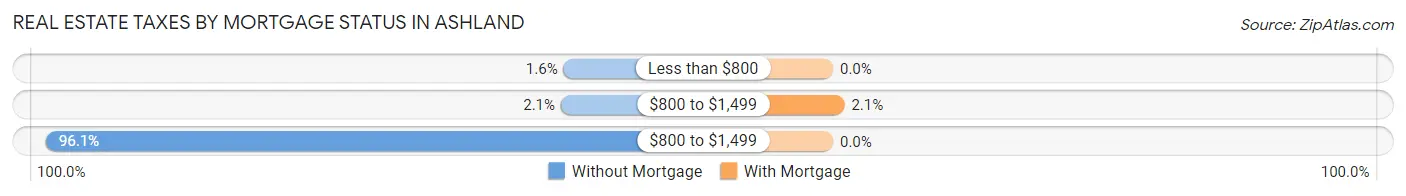
| Property Taxes | Without Mortgage | With Mortgage |
| Less than $800 | 23 (1.6%) | 0 (0.0%) |
| $800 to $1,499 | 30 (2.1%) | 38 (2.1%) |
| $800 to $1,499 | 1,404 (96.1%) | 0 (0.0%) |
| Total | 1,461 (100.0%) | 1,819 (100.0%) |
Health & Disability in Ashland
Health Insurance Coverage by Age in Ashland
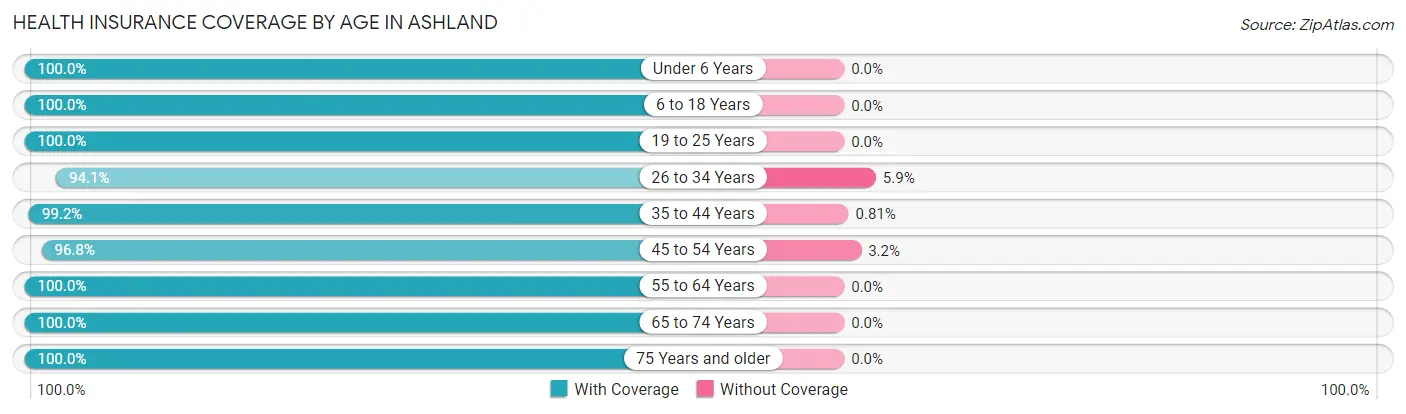
| Age Bracket | With Coverage | Without Coverage |
| Under 6 Years | 639 (100.0%) | 0 (0.0%) |
| 6 to 18 Years | 1,146 (100.0%) | 0 (0.0%) |
| 19 to 25 Years | 525 (100.0%) | 0 (0.0%) |
| 26 to 34 Years | 878 (94.1%) | 55 (5.9%) |
| 35 to 44 Years | 1,096 (99.2%) | 9 (0.8%) |
| 45 to 54 Years | 1,133 (96.8%) | 37 (3.2%) |
| 55 to 64 Years | 1,786 (100.0%) | 0 (0.0%) |
| 65 to 74 Years | 767 (100.0%) | 0 (0.0%) |
| 75 Years and older | 1,092 (100.0%) | 0 (0.0%) |
| Total | 9,062 (98.9%) | 101 (1.1%) |
Health Insurance Coverage by Citizenship Status in Ashland
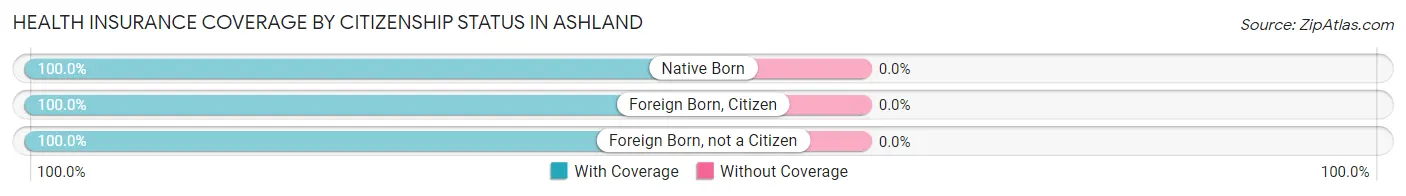
| Citizenship Status | With Coverage | Without Coverage |
| Native Born | 639 (100.0%) | 0 (0.0%) |
| Foreign Born, Citizen | 1,146 (100.0%) | 0 (0.0%) |
| Foreign Born, not a Citizen | 525 (100.0%) | 0 (0.0%) |
Health Insurance Coverage by Household Income in Ashland
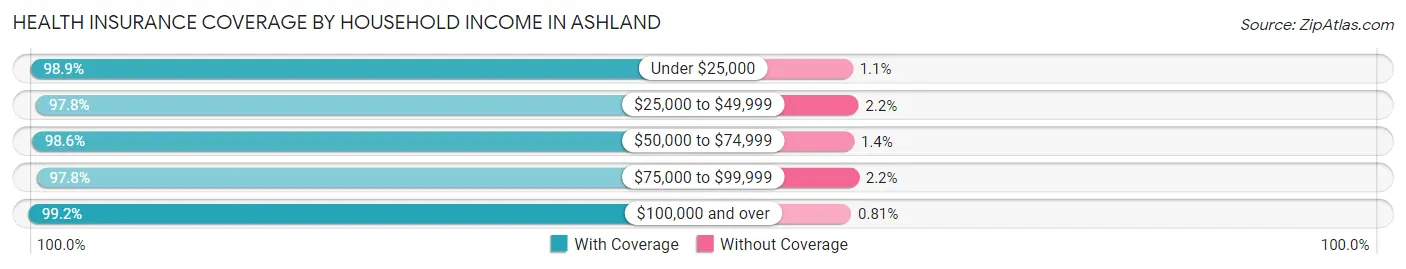
| Household Income | With Coverage | Without Coverage |
| Under $25,000 | 801 (98.9%) | 9 (1.1%) |
| $25,000 to $49,999 | 541 (97.8%) | 12 (2.2%) |
| $50,000 to $74,999 | 654 (98.6%) | 9 (1.4%) |
| $75,000 to $99,999 | 918 (97.8%) | 21 (2.2%) |
| $100,000 and over | 6,139 (99.2%) | 50 (0.8%) |
Public vs Private Health Insurance Coverage by Age in Ashland
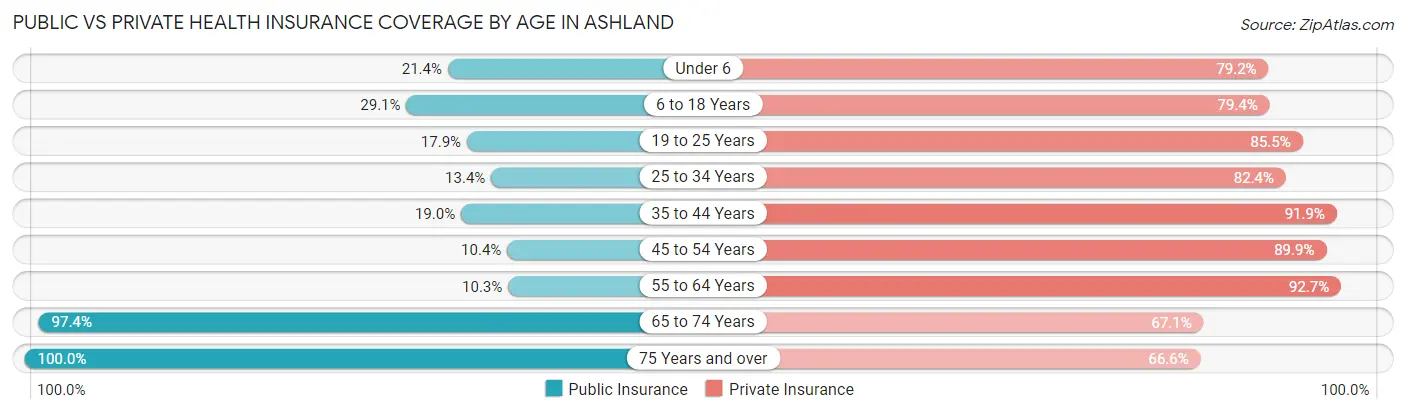
| Age Bracket | Public Insurance | Private Insurance |
| Under 6 | 137 (21.4%) | 506 (79.2%) |
| 6 to 18 Years | 334 (29.1%) | 910 (79.4%) |
| 19 to 25 Years | 94 (17.9%) | 449 (85.5%) |
| 25 to 34 Years | 125 (13.4%) | 769 (82.4%) |
| 35 to 44 Years | 210 (19.0%) | 1,015 (91.9%) |
| 45 to 54 Years | 122 (10.4%) | 1,052 (89.9%) |
| 55 to 64 Years | 183 (10.2%) | 1,655 (92.7%) |
| 65 to 74 Years | 747 (97.4%) | 515 (67.1%) |
| 75 Years and over | 1,092 (100.0%) | 727 (66.6%) |
| Total | 3,044 (33.2%) | 7,598 (82.9%) |
Disability Status by Sex by Age in Ashland
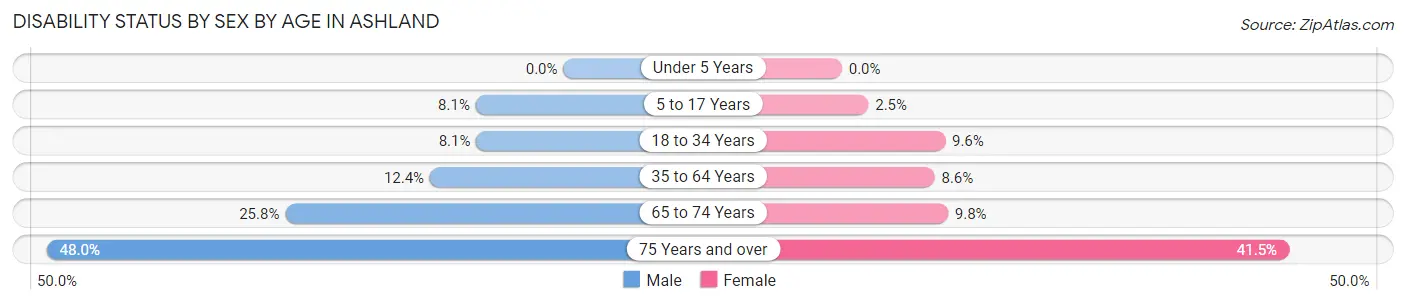
| Age Bracket | Male | Female |
| Under 5 Years | 0 (0.0%) | 0 (0.0%) |
| 5 to 17 Years | 47 (8.1%) | 15 (2.5%) |
| 18 to 34 Years | 60 (8.1%) | 76 (9.6%) |
| 35 to 64 Years | 224 (12.4%) | 194 (8.6%) |
| 65 to 74 Years | 72 (25.8%) | 48 (9.8%) |
| 75 Years and over | 222 (47.9%) | 261 (41.5%) |
Disability Class by Sex by Age in Ashland
Disability Class: Hearing Difficulty
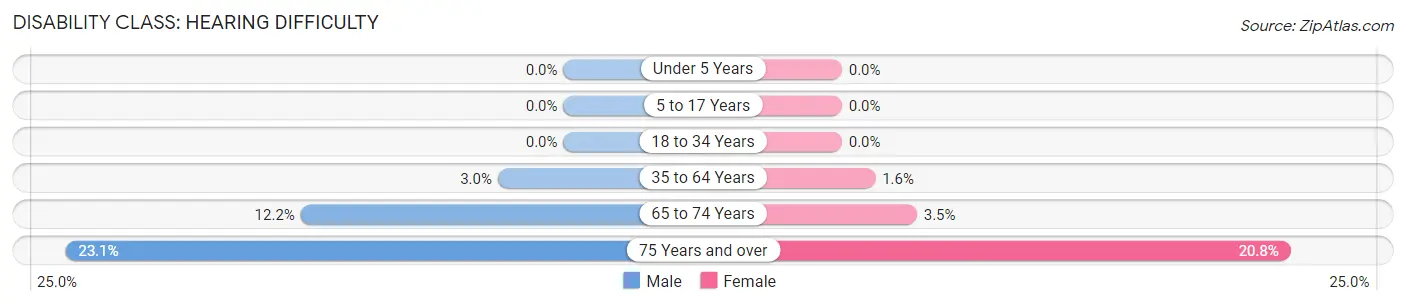
| Age Bracket | Male | Female |
| Under 5 Years | 0 (0.0%) | 0 (0.0%) |
| 5 to 17 Years | 0 (0.0%) | 0 (0.0%) |
| 18 to 34 Years | 0 (0.0%) | 0 (0.0%) |
| 35 to 64 Years | 55 (3.0%) | 35 (1.5%) |
| 65 to 74 Years | 34 (12.2%) | 17 (3.5%) |
| 75 Years and over | 107 (23.1%) | 131 (20.8%) |
Disability Class: Vision Difficulty
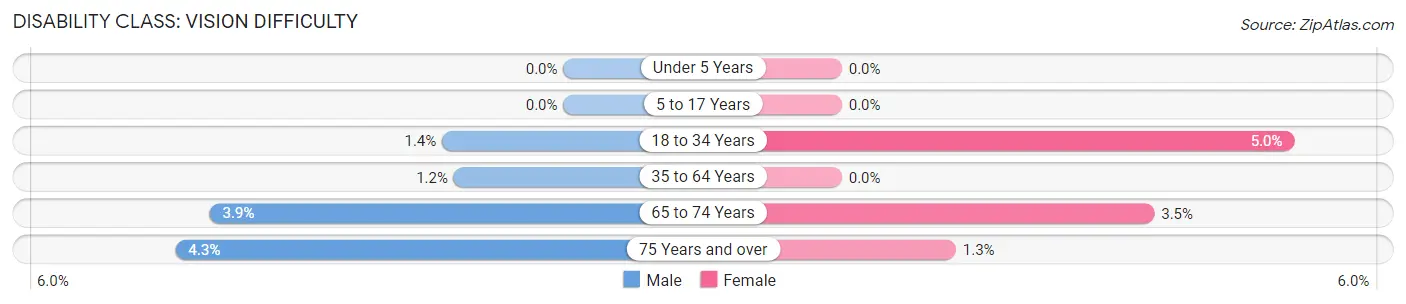
| Age Bracket | Male | Female |
| Under 5 Years | 0 (0.0%) | 0 (0.0%) |
| 5 to 17 Years | 0 (0.0%) | 0 (0.0%) |
| 18 to 34 Years | 10 (1.3%) | 40 (5.0%) |
| 35 to 64 Years | 22 (1.2%) | 0 (0.0%) |
| 65 to 74 Years | 11 (3.9%) | 17 (3.5%) |
| 75 Years and over | 20 (4.3%) | 8 (1.3%) |
Disability Class: Cognitive Difficulty
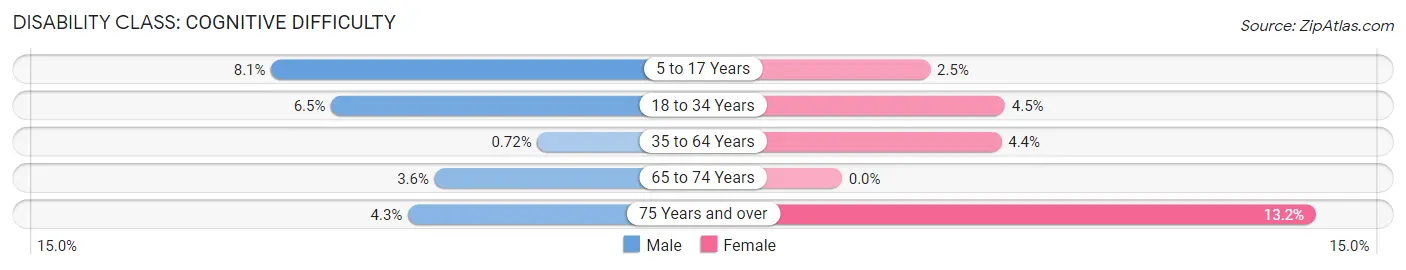
| Age Bracket | Male | Female |
| 5 to 17 Years | 47 (8.1%) | 15 (2.5%) |
| 18 to 34 Years | 48 (6.5%) | 36 (4.5%) |
| 35 to 64 Years | 13 (0.7%) | 100 (4.4%) |
| 65 to 74 Years | 10 (3.6%) | 0 (0.0%) |
| 75 Years and over | 20 (4.3%) | 83 (13.2%) |
Disability Class: Ambulatory Difficulty
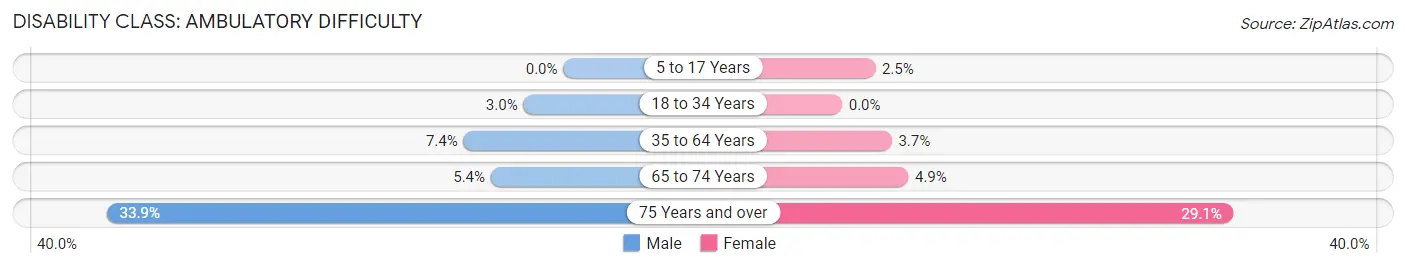
| Age Bracket | Male | Female |
| 5 to 17 Years | 0 (0.0%) | 15 (2.5%) |
| 18 to 34 Years | 22 (3.0%) | 0 (0.0%) |
| 35 to 64 Years | 134 (7.4%) | 83 (3.7%) |
| 65 to 74 Years | 15 (5.4%) | 24 (4.9%) |
| 75 Years and over | 157 (33.9%) | 183 (29.1%) |
Disability Class: Self-Care Difficulty
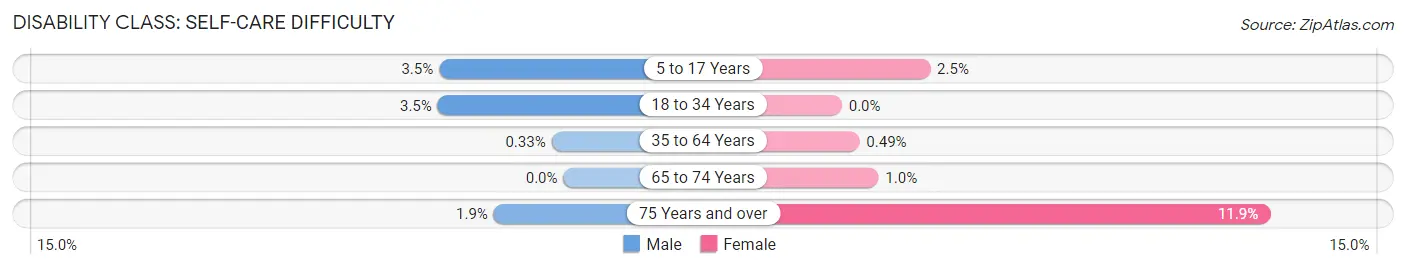
| Age Bracket | Male | Female |
| 5 to 17 Years | 20 (3.5%) | 15 (2.5%) |
| 18 to 34 Years | 26 (3.5%) | 0 (0.0%) |
| 35 to 64 Years | 6 (0.3%) | 11 (0.5%) |
| 65 to 74 Years | 0 (0.0%) | 5 (1.0%) |
| 75 Years and over | 9 (1.9%) | 75 (11.9%) |
Technology Access in Ashland
Computing Device Access in Ashland
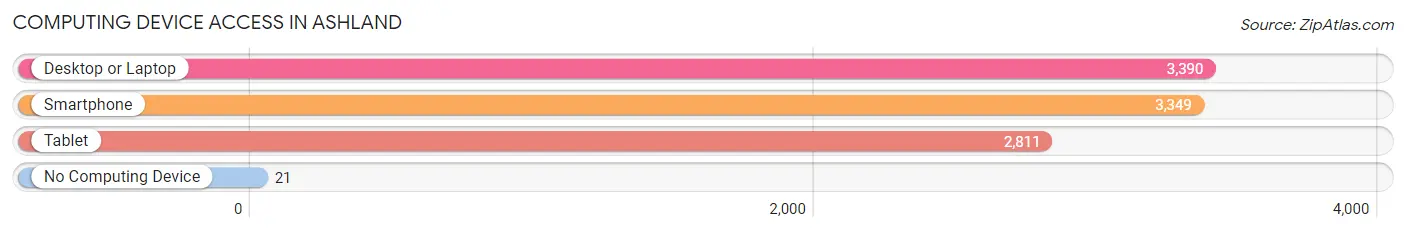
| Device Type | # Households | % Households |
| Desktop or Laptop | 3,390 | 93.6% |
| Smartphone | 3,349 | 92.5% |
| Tablet | 2,811 | 77.6% |
| No Computing Device | 21 | 0.6% |
| Total | 3,620 | 100.0% |
Internet Access in Ashland
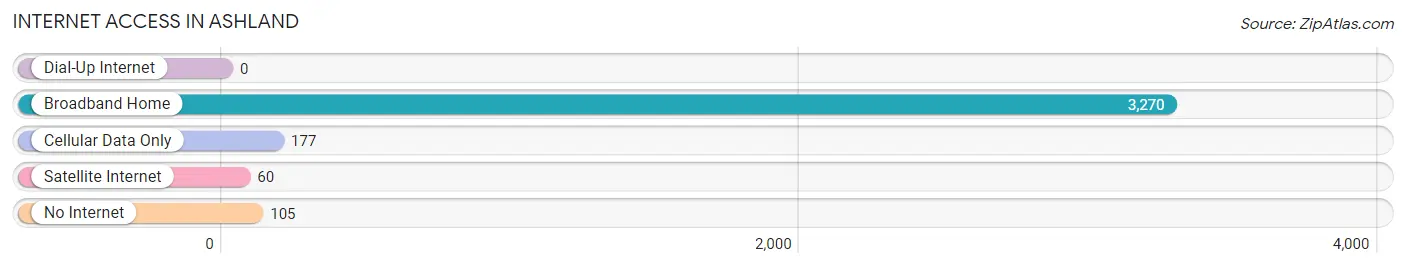
| Internet Type | # Households | % Households |
| Dial-Up Internet | 0 | 0.0% |
| Broadband Home | 3,270 | 90.3% |
| Cellular Data Only | 177 | 4.9% |
| Satellite Internet | 60 | 1.7% |
| No Internet | 105 | 2.9% |
| Total | 3,620 | 100.0% |
Ashland Summary
Ashland, NJ is a small borough located in Morris County, New Jersey. It is situated in the northern part of the state, about 25 miles west of New York City. The borough is bordered by the towns of Parsippany-Troy Hills, East Hanover, and Florham Park. As of the 2010 census, the population of Ashland was 2,543.
History
The area that is now Ashland was originally inhabited by the Lenni Lenape Native Americans. The first European settlers arrived in the area in the late 17th century. The area was part of Hanover Township until 1866, when it was incorporated as the Borough of Ashland. The name of the borough is derived from the Ashland Iron Works, which was established in the area in 1845.
Geography
Ashland is located at 40°49'25"N 74°27'45"W (40.823607, -74.462490). According to the United States Census Bureau, the borough has a total area of 0.9 square miles, all of which is land.
Economy
The economy of Ashland is largely based on small businesses and retail. The borough is home to several small businesses, including a hardware store, a bakery, a pharmacy, and a variety of restaurants. The borough also has a few larger employers, such as a medical center and a manufacturing plant.
Demographics
As of the 2010 census, there were 2,543 people, 990 households, and 690 families residing in the borough. The population density was 2,845.3 people per square mile. The racial makeup of the borough was 87.2% White, 5.2% African American, 0.2% Native American, 4.2% Asian, 0.1% Pacific Islander, 1.3% from other races, and 1.9% from two or more races. Hispanic or Latino of any race were 6.3% of the population.
The median age in the borough was 43.2 years. 22.2% of residents were under the age of 18; 6.2% were between the ages of 18 and 24; 24.3% were from 25 to 44; 32.2% were from 45 to 64; and 15.1% were 65 years of age or older. The gender makeup of the borough was 48.2% male and 51.8% female.
The median income for a household in the borough was $87,917, and the median income for a family was $103,917. The per capita income for the borough was $41,945. About 2.2% of families and 3.2% of the population were below the poverty line, including 3.7% of those under age 18 and 4.2% of those age 65 or over.
Common Questions
What is the Total Population of Ashland?
Total Population of Ashland is 9,383.
What is the Total Male Population of Ashland?
Total Male Population of Ashland is 4,165.
What is the Total Female Population of Ashland?
Total Female Population of Ashland is 5,218.
What is the Ratio of Males per 100 Females in Ashland?
There are 79.82 Males per 100 Females in Ashland.
What is the Ratio of Females per 100 Males in Ashland?
There are 125.28 Females per 100 Males in Ashland.
What is the Median Population Age in Ashland?
Median Population Age in Ashland is 50.2 Years.
What is the Average Family Size in Ashland
Average Family Size in Ashland is 3.0 People.
What is the Average Household Size in Ashland
Average Household Size in Ashland is 2.5 People.
What is Per Capita Income in Ashland?
Per Capita income in Ashland is $51,978.
What is the Median Family Income in Ashland?
Median Family Income in Ashland is $117,204.
What is the Median Household income in Ashland?
Median Household Income in Ashland is $112,690.
What is Income or Wage Gap in Ashland?
Income or Wage Gap in Ashland is 41.1%.
Women in Ashland earn 58.9 cents for every dollar earned by a man.
What is Family Income Deficit in Ashland?
Family Income Deficit in Ashland is $11,618.
Families that are below poverty line in Ashland earn $11,618 less on average than the poverty threshold level.
What is Inequality or Gini Index in Ashland?
Inequality or Gini Index in Ashland is 0.40.
How Large is the Labor Force in Ashland?
There are 5,188 People in the Labor Forcein in Ashland.
What is the Percentage of People in the Labor Force in Ashland?
66.4% of People are in the Labor Force in Ashland.
What is the Unemployment Rate in Ashland?
Unemployment Rate in Ashland is 4.9%.