Box Butte County, NE
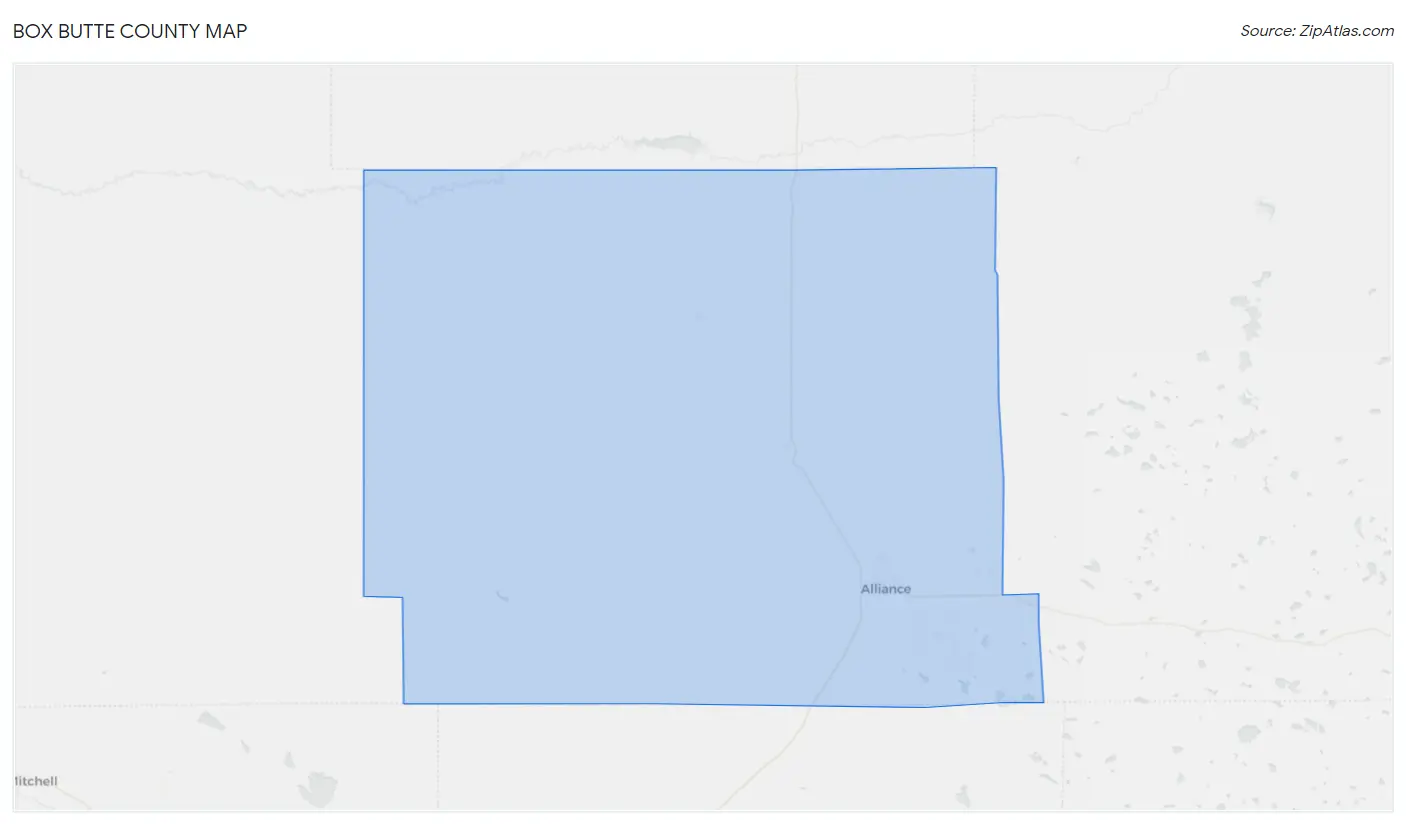
Box Butte County Map
Box Butte County Overview
10,778
TOTAL POPULATION
5,486
MALE POPULATION
5,292
FEMALE POPULATION
103.67
MALES / 100 FEMALES
96.46
FEMALES / 100 MALES
40.9
MEDIAN AGE
2.9
AVG FAMILY SIZE
2.3
AVG HOUSEHOLD SIZE
$32,141
PER CAPITA INCOME
$72,703
AVG FAMILY INCOME
$67,893
AVG HOUSEHOLD INCOME
38.0%
WAGE / INCOME GAP [ % ]
62.0¢/ $1
WAGE / INCOME GAP [ $ ]
0.38
INEQUALITY / GINI INDEX
5,461
LABOR FORCE [ PEOPLE ]
65.6%
PERCENT IN LABOR FORCE
4.0%
UNEMPLOYMENT RATE
Box Butte County Area Codes
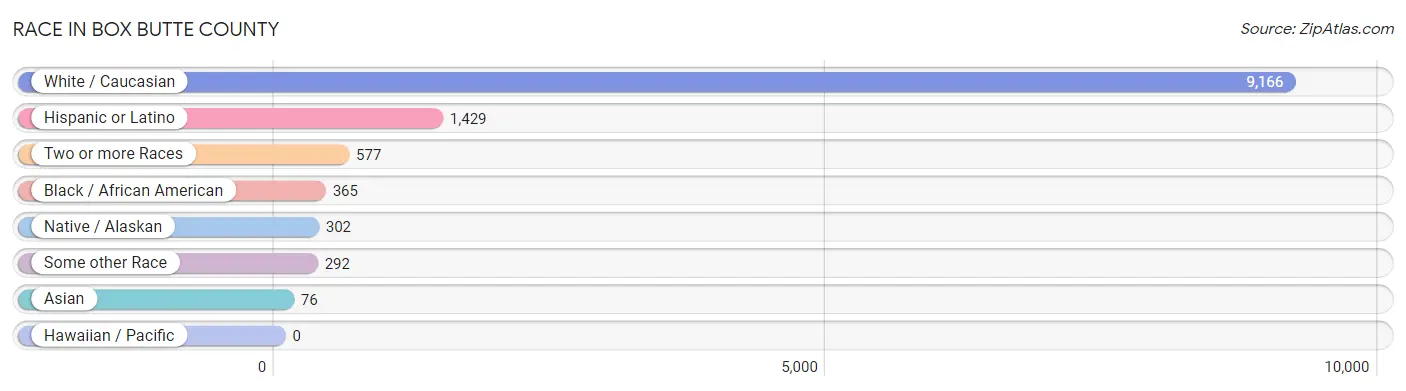
Race in Box Butte County
The most populous races in Box Butte County are White / Caucasian (9,166 | 85.0%), Hispanic or Latino (1,429 | 13.3%), and Two or more Races (577 | 5.3%).
| Race | # Population | % Population |
| Asian | 76 | 0.7% |
| Black / African American | 365 | 3.4% |
| Hawaiian / Pacific | 0 | 0.0% |
| Hispanic or Latino | 1,429 | 13.3% |
| Native / Alaskan | 302 | 2.8% |
| White / Caucasian | 9,166 | 85.0% |
| Two or more Races | 577 | 5.3% |
| Some other Race | 292 | 2.7% |
| Total | 10,778 | 100.0% |
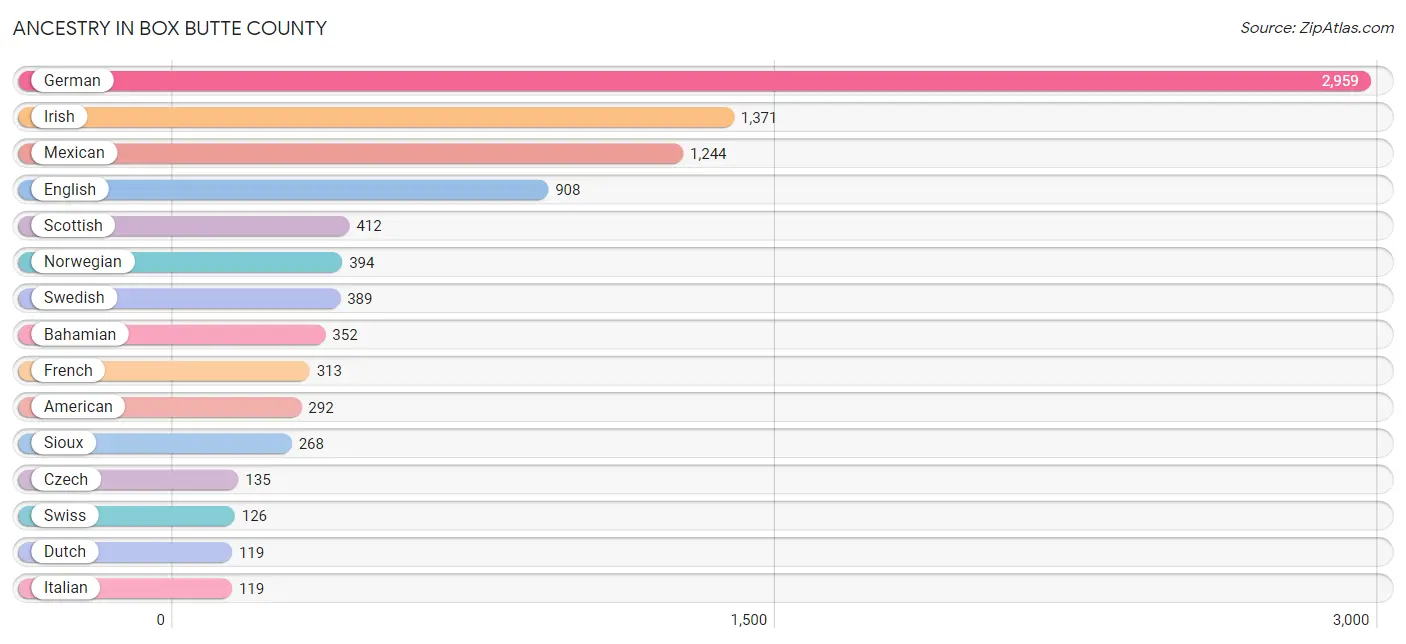
Ancestry in Box Butte County
The most populous ancestries reported in Box Butte County are German (2,959 | 27.5%), Irish (1,371 | 12.7%), Mexican (1,244 | 11.5%), English (908 | 8.4%), and Scottish (412 | 3.8%), together accounting for 64.0% of all Box Butte County residents.
| Ancestry | # Population | % Population |
| Alsatian | 10 | 0.1% |
| American | 292 | 2.7% |
| Austrian | 9 | 0.1% |
| Bahamian | 352 | 3.3% |
| Belgian | 2 | 0.0% |
| Bhutanese | 4 | 0.0% |
| British | 98 | 0.9% |
| Burmese | 13 | 0.1% |
| Central American | 2 | 0.0% |
| Cherokee | 7 | 0.1% |
| Colombian | 15 | 0.1% |
| Cuban | 26 | 0.2% |
| Czech | 135 | 1.3% |
| Czechoslovakian | 21 | 0.2% |
| Danish | 80 | 0.7% |
| Dutch | 119 | 1.1% |
| Eastern European | 20 | 0.2% |
| English | 908 | 8.4% |
| European | 118 | 1.1% |
| French | 313 | 2.9% |
| French Canadian | 15 | 0.1% |
| German | 2,959 | 27.5% |
| Greek | 64 | 0.6% |
| Irish | 1,371 | 12.7% |
| Italian | 119 | 1.1% |
| Korean | 58 | 0.5% |
| Mexican | 1,244 | 11.5% |
| Mexican American Indian | 53 | 0.5% |
| Native Hawaiian | 10 | 0.1% |
| Norwegian | 394 | 3.7% |
| Polish | 100 | 0.9% |
| Puerto Rican | 6 | 0.1% |
| Russian | 105 | 1.0% |
| Salvadoran | 2 | 0.0% |
| Scandinavian | 6 | 0.1% |
| Scotch-Irish | 56 | 0.5% |
| Scottish | 412 | 3.8% |
| Serbian | 3 | 0.0% |
| Sioux | 268 | 2.5% |
| South American | 15 | 0.1% |
| Swedish | 389 | 3.6% |
| Swiss | 126 | 1.2% |
| Thai | 14 | 0.1% | View All 43 Rows |
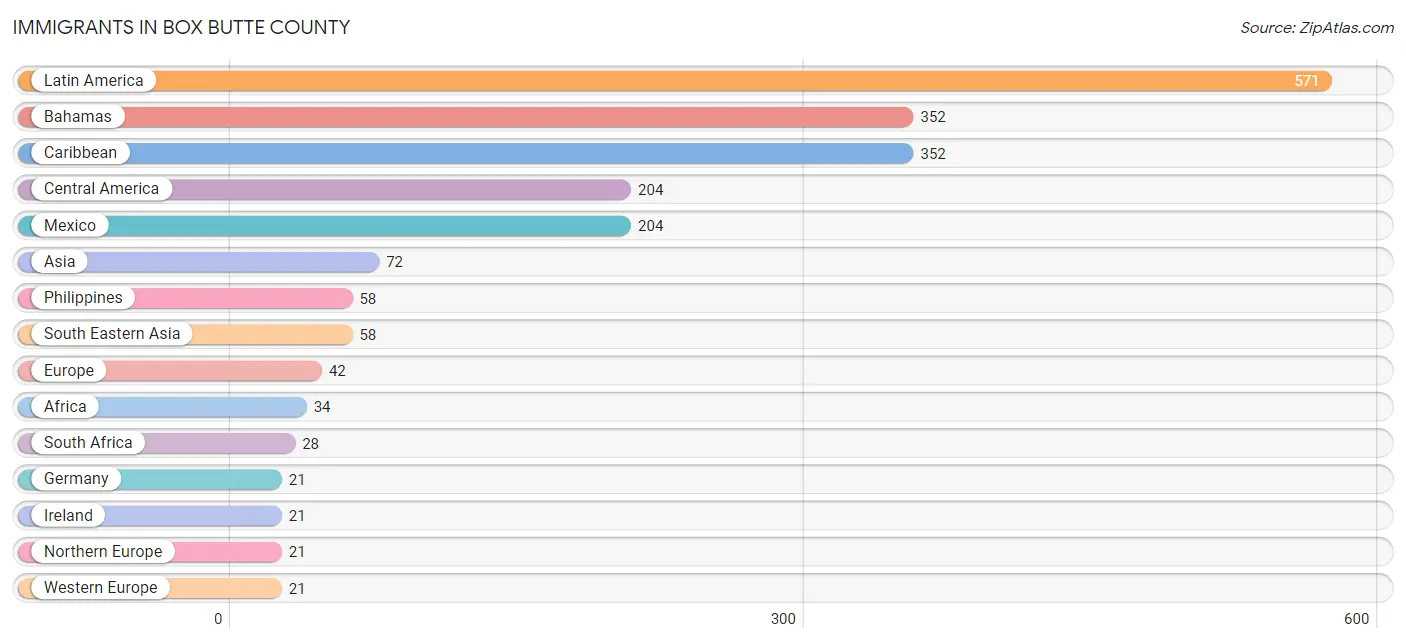
Immigrants in Box Butte County
The most numerous immigrant groups reported in Box Butte County came from Latin America (571 | 5.3%), Bahamas (352 | 3.3%), Caribbean (352 | 3.3%), Central America (204 | 1.9%), and Mexico (204 | 1.9%), together accounting for 15.6% of all Box Butte County residents.
| Immigration Origin | # Population | % Population |
| Africa | 34 | 0.3% |
| Asia | 72 | 0.7% |
| Bahamas | 352 | 3.3% |
| Canada | 14 | 0.1% |
| Caribbean | 352 | 3.3% |
| Central America | 204 | 1.9% |
| Colombia | 15 | 0.1% |
| Europe | 42 | 0.4% |
| Germany | 21 | 0.2% |
| India | 14 | 0.1% |
| Ireland | 21 | 0.2% |
| Latin America | 571 | 5.3% |
| Mexico | 204 | 1.9% |
| Northern Europe | 21 | 0.2% |
| Philippines | 58 | 0.5% |
| South Africa | 28 | 0.3% |
| South America | 15 | 0.1% |
| South Central Asia | 14 | 0.1% |
| South Eastern Asia | 58 | 0.5% |
| Western Europe | 21 | 0.2% | View All 20 Rows |
Sex and Age in Box Butte County
Sex and Age in Box Butte County
The most populous age groups in Box Butte County are 60 to 64 Years (590 | 10.7%) for men and 60 to 64 Years (529 | 10.0%) for women.
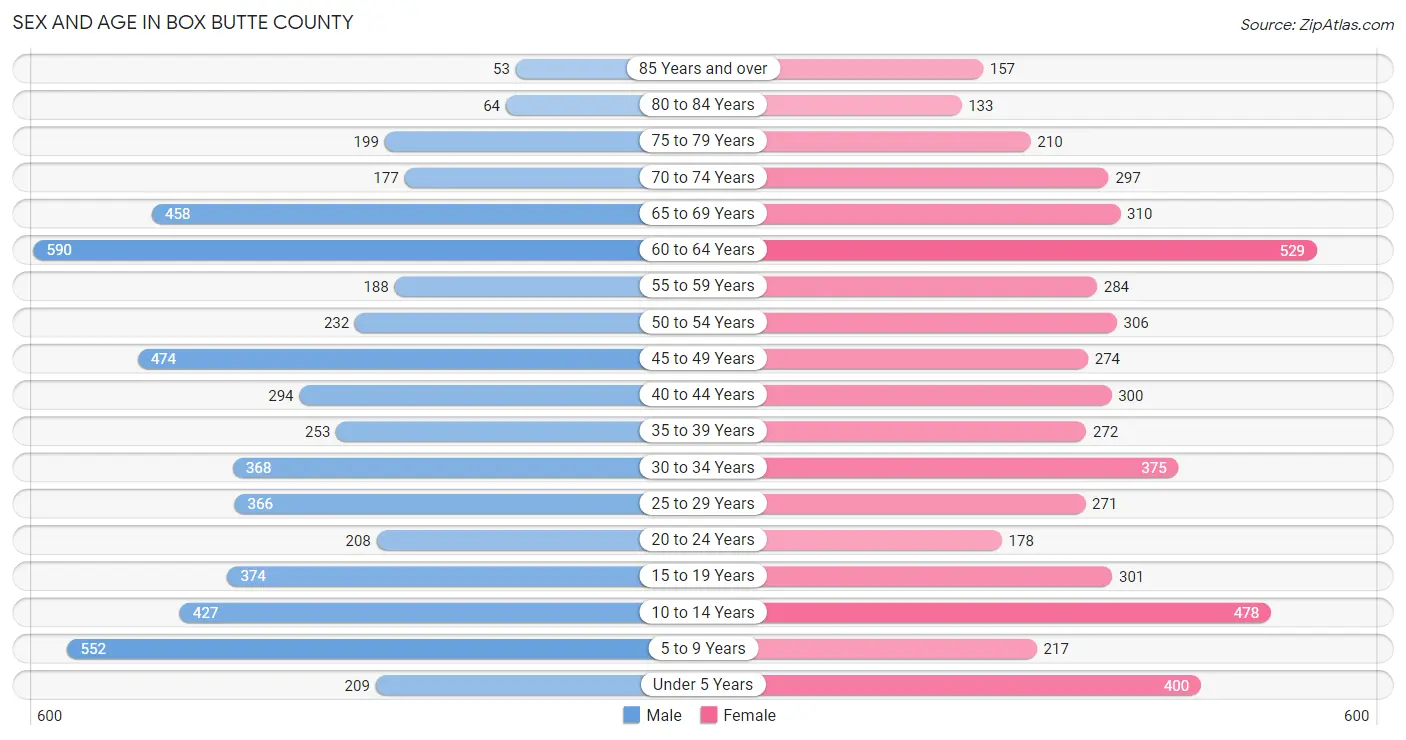
| Age Bracket | Male | Female |
| Under 5 Years | 209 (3.8%) | 400 (7.6%) |
| 5 to 9 Years | 552 (10.1%) | 217 (4.1%) |
| 10 to 14 Years | 427 (7.8%) | 478 (9.0%) |
| 15 to 19 Years | 374 (6.8%) | 301 (5.7%) |
| 20 to 24 Years | 208 (3.8%) | 178 (3.4%) |
| 25 to 29 Years | 366 (6.7%) | 271 (5.1%) |
| 30 to 34 Years | 368 (6.7%) | 375 (7.1%) |
| 35 to 39 Years | 253 (4.6%) | 272 (5.1%) |
| 40 to 44 Years | 294 (5.4%) | 300 (5.7%) |
| 45 to 49 Years | 474 (8.6%) | 274 (5.2%) |
| 50 to 54 Years | 232 (4.2%) | 306 (5.8%) |
| 55 to 59 Years | 188 (3.4%) | 284 (5.4%) |
| 60 to 64 Years | 590 (10.7%) | 529 (10.0%) |
| 65 to 69 Years | 458 (8.4%) | 310 (5.9%) |
| 70 to 74 Years | 177 (3.2%) | 297 (5.6%) |
| 75 to 79 Years | 199 (3.6%) | 210 (4.0%) |
| 80 to 84 Years | 64 (1.2%) | 133 (2.5%) |
| 85 Years and over | 53 (1.0%) | 157 (3.0%) |
| Total | 5,486 (100.0%) | 5,292 (100.0%) |
Families and Households in Box Butte County
Median Family Size in Box Butte County
The median family size in Box Butte County is 2.87 persons per family, with single female/mother families (459 | 15.8%) accounting for the largest median family size of 3.14 persons per family. On the other hand, married-couple families (2,200 | 75.7%) represent the smallest median family size with 2.79 persons per family.
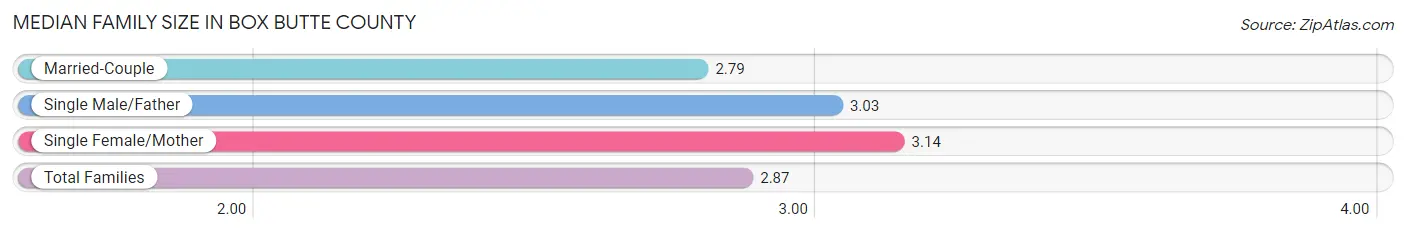
| Family Type | # Families | Family Size |
| Married-Couple | 2,200 (75.7%) | 2.79 |
| Single Male/Father | 247 (8.5%) | 3.03 |
| Single Female/Mother | 459 (15.8%) | 3.14 |
| Total Families | 2,906 (100.0%) | 2.87 |
Median Household Size in Box Butte County
The median household size in Box Butte County is 2.31 persons per household, with single male/father households (247 | 5.4%) accounting for the largest median household size of 4.21 persons per household. non-family households (1,667 | 36.4%) represent the smallest median household size with 1.09 persons per household.
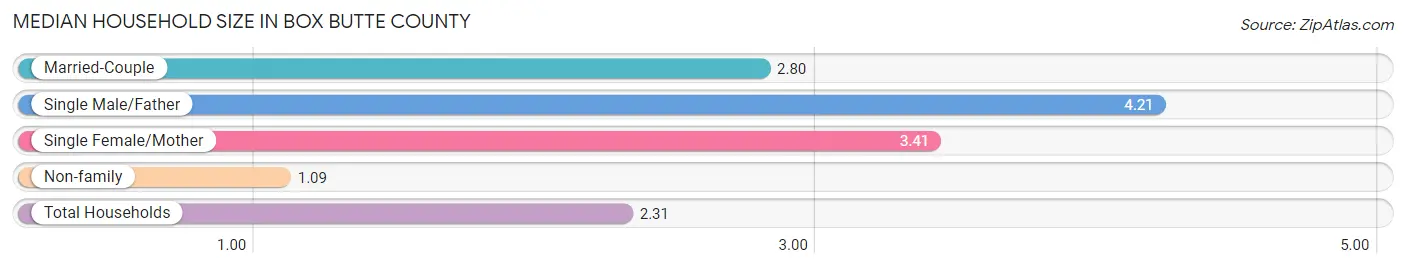
| Household Type | # Households | Household Size |
| Married-Couple | 2,200 (48.1%) | 2.80 |
| Single Male/Father | 247 (5.4%) | 4.21 |
| Single Female/Mother | 459 (10.0%) | 3.41 |
| Non-family | 1,667 (36.4%) | 1.09 |
| Total Households | 4,573 (100.0%) | 2.31 |
Household Size by Marriage Status in Box Butte County
Out of a total of 4,573 households in Box Butte County, 2,906 (63.5%) are family households, while 1,667 (36.4%) are nonfamily households. The most numerous type of family households are 2-person households, comprising 1,439, and the most common type of nonfamily households are 1-person households, comprising 1,521.
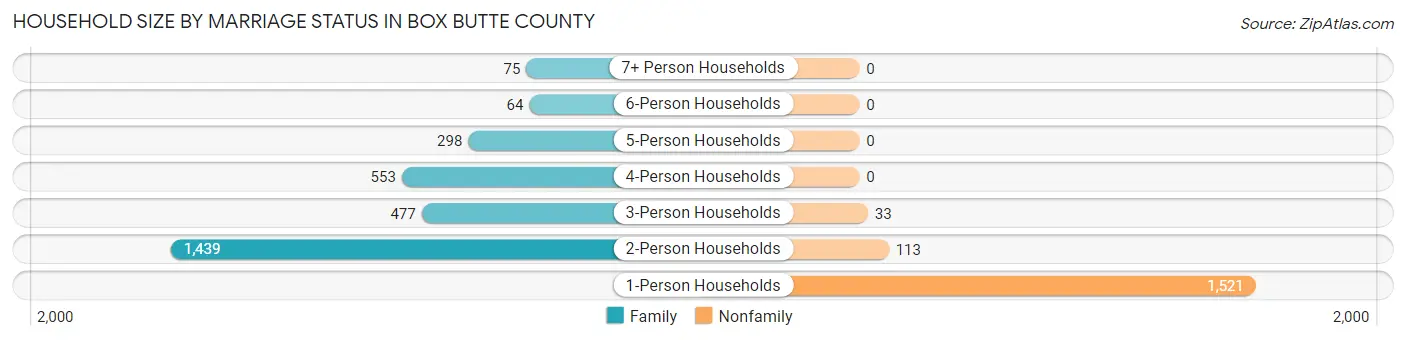
| Household Size | Family Households | Nonfamily Households |
| 1-Person Households | - | 1,521 (33.3%) |
| 2-Person Households | 1,439 (31.5%) | 113 (2.5%) |
| 3-Person Households | 477 (10.4%) | 33 (0.7%) |
| 4-Person Households | 553 (12.1%) | 0 (0.0%) |
| 5-Person Households | 298 (6.5%) | 0 (0.0%) |
| 6-Person Households | 64 (1.4%) | 0 (0.0%) |
| 7+ Person Households | 75 (1.6%) | 0 (0.0%) |
| Total | 2,906 (63.5%) | 1,667 (36.4%) |
Female Fertility in Box Butte County
Fertility by Age in Box Butte County
Average fertility rate in Box Butte County is 74.0 births per 1,000 women. Women in the age bracket of 20 to 34 years have the highest fertility rate with 118.0 births per 1,000 women. Women in the age bracket of 20 to 34 years acount for 66.4% of all women with births.
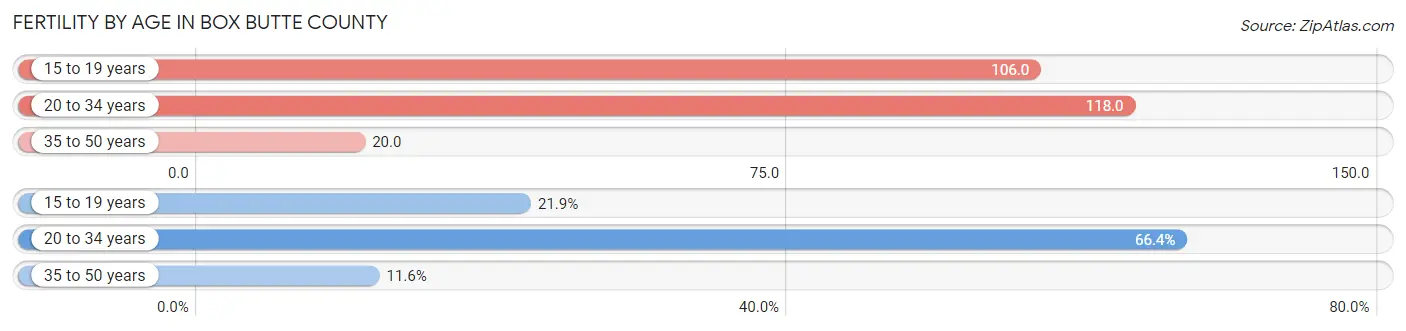
| Age Bracket | Women with Births | Births / 1,000 Women |
| 15 to 19 years | 32 (21.9%) | 106.0 |
| 20 to 34 years | 97 (66.4%) | 118.0 |
| 35 to 50 years | 17 (11.6%) | 20.0 |
| Total | 146 (100.0%) | 74.0 |
Fertility by Age by Marriage Status in Box Butte County
32.9% of women with births (146) in Box Butte County are married. The highest percentage of unmarried women with births falls into 15 to 19 years age bracket with 100.0% of them unmarried at the time of birth, while the lowest percentage of unmarried women with births belong to 35 to 50 years age bracket with 0.0% of them unmarried.
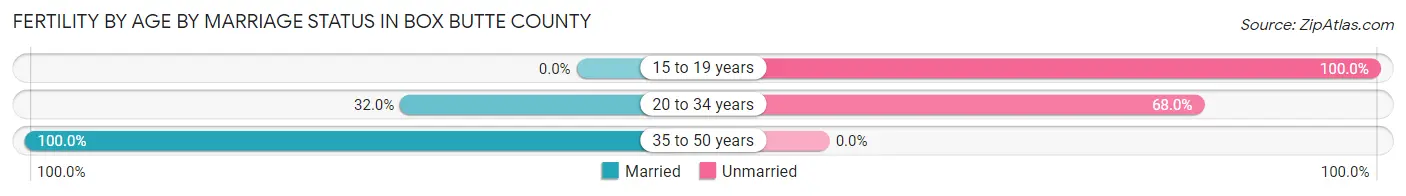
| Age Bracket | Married | Unmarried |
| 15 to 19 years | 0 (0.0%) | 32 (100.0%) |
| 20 to 34 years | 31 (32.0%) | 66 (68.0%) |
| 35 to 50 years | 17 (100.0%) | 0 (0.0%) |
| Total | 48 (32.9%) | 98 (67.1%) |
Fertility by Education in Box Butte County
Average fertility rate in Box Butte County is 74.0 births per 1,000 women. Women with the education attainment of college or associate's degree have the highest fertility rate of 111.0 births per 1,000 women, while women with the education attainment of high school diploma have the lowest fertility at 5.0 births per 1,000 women. Women with the education attainment of college or associate's degree represent 64.4% of all women with births.
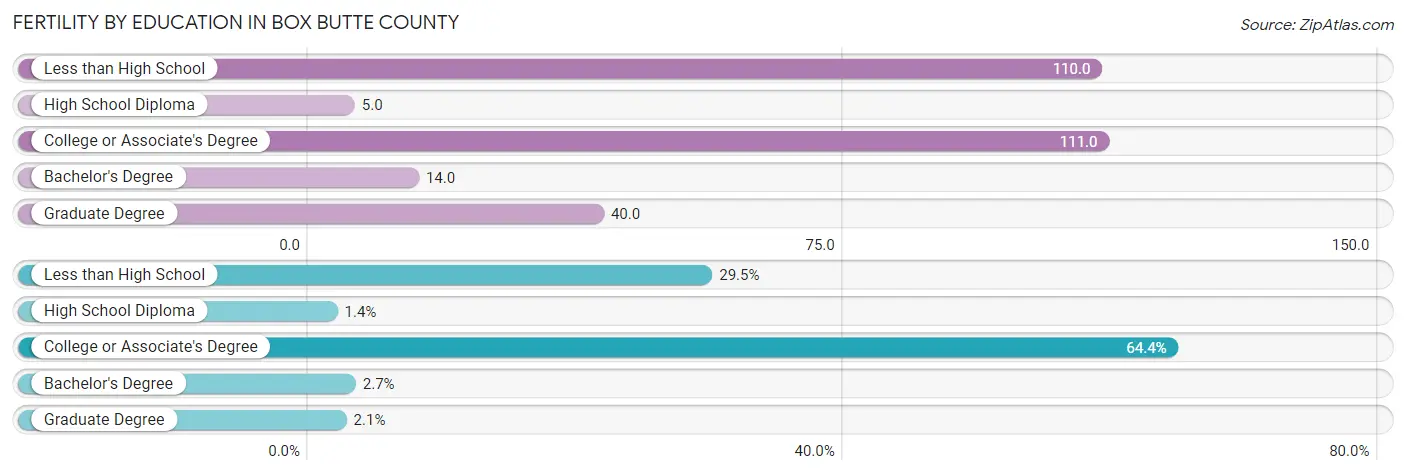
| Educational Attainment | Women with Births | Births / 1,000 Women |
| Less than High School | 43 (29.4%) | 110.0 |
| High School Diploma | 2 (1.4%) | 5.0 |
| College or Associate's Degree | 94 (64.4%) | 111.0 |
| Bachelor's Degree | 4 (2.7%) | 14.0 |
| Graduate Degree | 3 (2.1%) | 40.0 |
| Total | 146 (100.0%) | 74.0 |
Fertility by Education by Marriage Status in Box Butte County
67.1% of women with births in Box Butte County are unmarried. Women with the educational attainment of high school diploma are most likely to be married with 100.0% of them married at childbirth, while women with the educational attainment of less than high school are least likely to be married with 100.0% of them unmarried at childbirth.
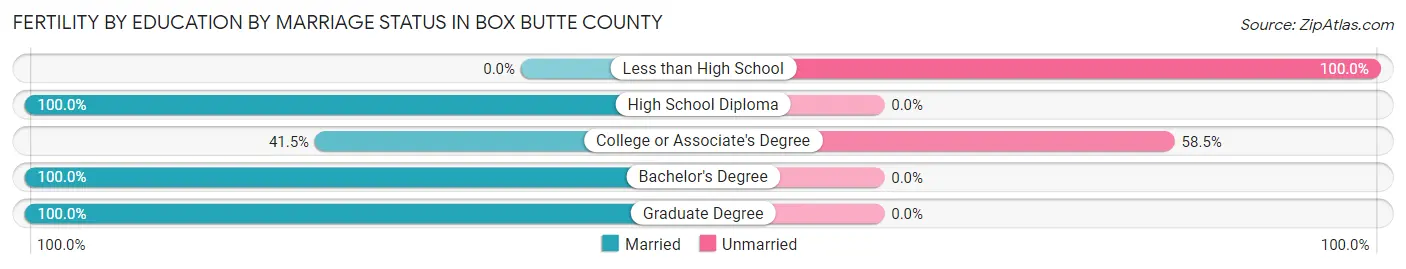
| Educational Attainment | Married | Unmarried |
| Less than High School | 0 (0.0%) | 43 (100.0%) |
| High School Diploma | 2 (100.0%) | 0 (0.0%) |
| College or Associate's Degree | 39 (41.5%) | 55 (58.5%) |
| Bachelor's Degree | 4 (100.0%) | 0 (0.0%) |
| Graduate Degree | 3 (100.0%) | 0 (0.0%) |
| Total | 48 (32.9%) | 98 (67.1%) |
Income in Box Butte County
Income Overview in Box Butte County
Per Capita Income in Box Butte County is $32,141, while median incomes of families and households are $72,703 and $67,893 respectively.
| Characteristic | Number | Measure |
| Per Capita Income | 10,778 | $32,141 |
| Median Family Income | 2,906 | $72,703 |
| Mean Family Income | 2,906 | $84,998 |
| Median Household Income | 4,573 | $67,893 |
| Mean Household Income | 4,573 | $73,321 |
| Income Deficit | 2,906 | $0 |
| Wage / Income Gap (%) | 10,778 | 38.03% |
| Wage / Income Gap ($) | 10,778 | 61.97¢ per $1 |
| Gini / Inequality Index | 10,778 | 0.38 |
Earnings by Sex in Box Butte County
Average Earnings in Box Butte County are $40,073, $52,861 for men and $32,760 for women, a difference of 38.0%.
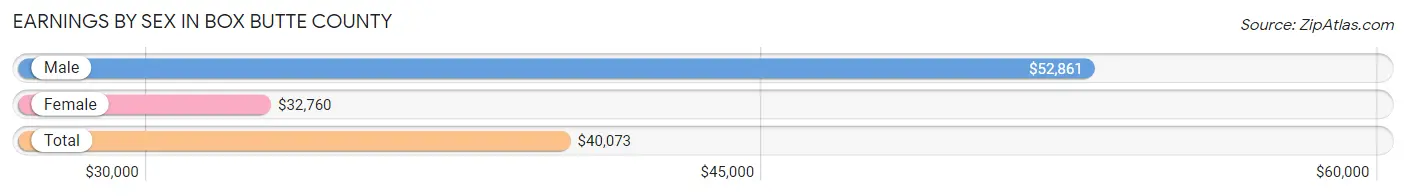
| Sex | Number | Average Earnings |
| Male | 2,928 (49.9%) | $52,861 |
| Female | 2,942 (50.1%) | $32,760 |
| Total | 5,870 (100.0%) | $40,073 |
Earnings by Sex by Income Bracket in Box Butte County
The most common earnings brackets in Box Butte County are $75,000 to $99,999 for men (580 | 19.8%) and $35,000 to $39,999 for women (343 | 11.7%).
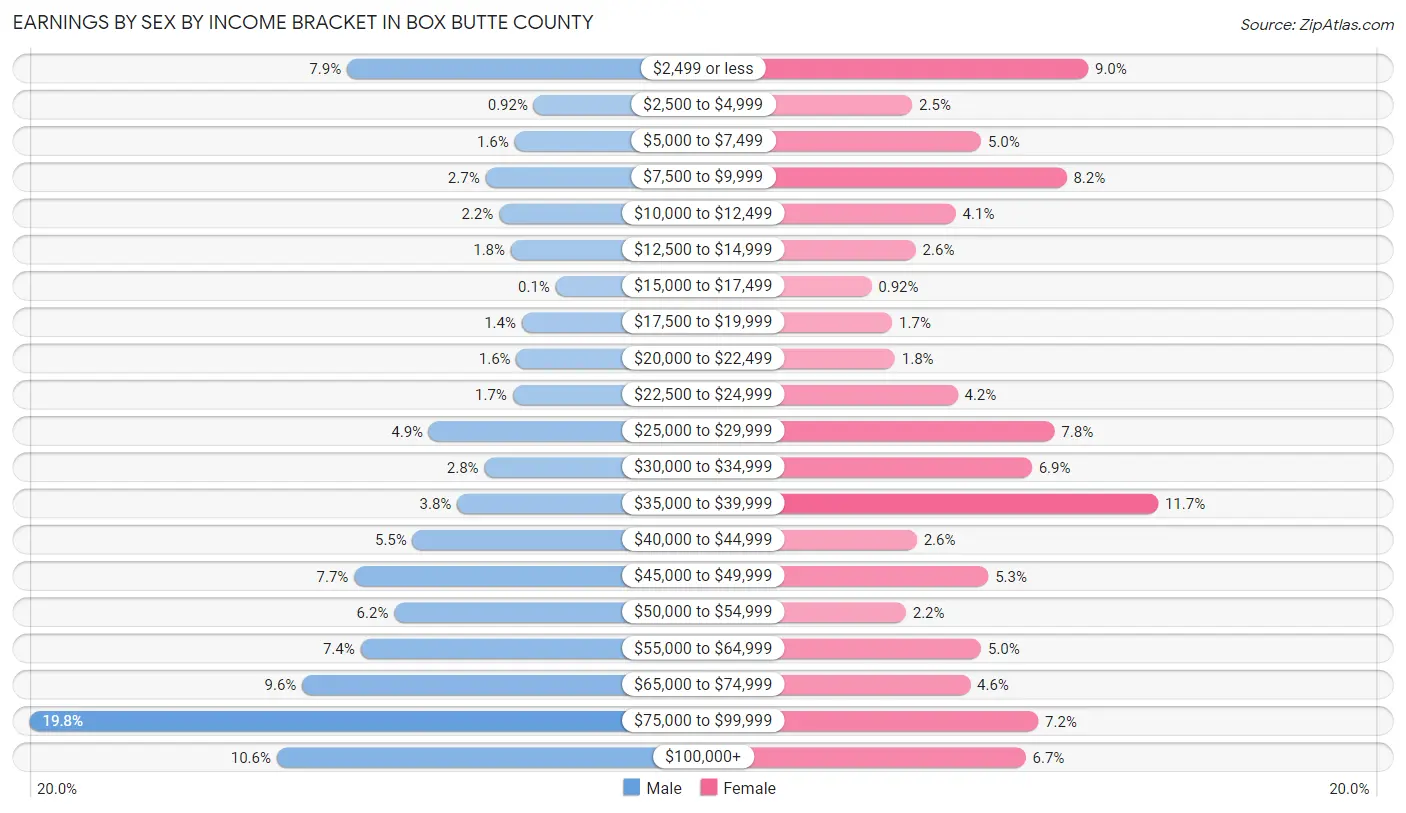
| Income | Male | Female |
| $2,499 or less | 232 (7.9%) | 266 (9.0%) |
| $2,500 to $4,999 | 27 (0.9%) | 72 (2.5%) |
| $5,000 to $7,499 | 48 (1.6%) | 148 (5.0%) |
| $7,500 to $9,999 | 80 (2.7%) | 242 (8.2%) |
| $10,000 to $12,499 | 65 (2.2%) | 120 (4.1%) |
| $12,500 to $14,999 | 52 (1.8%) | 76 (2.6%) |
| $15,000 to $17,499 | 3 (0.1%) | 27 (0.9%) |
| $17,500 to $19,999 | 40 (1.4%) | 50 (1.7%) |
| $20,000 to $22,499 | 46 (1.6%) | 53 (1.8%) |
| $22,500 to $24,999 | 50 (1.7%) | 122 (4.2%) |
| $25,000 to $29,999 | 142 (4.9%) | 229 (7.8%) |
| $30,000 to $34,999 | 81 (2.8%) | 204 (6.9%) |
| $35,000 to $39,999 | 111 (3.8%) | 343 (11.7%) |
| $40,000 to $44,999 | 160 (5.5%) | 77 (2.6%) |
| $45,000 to $49,999 | 224 (7.6%) | 156 (5.3%) |
| $50,000 to $54,999 | 180 (6.1%) | 65 (2.2%) |
| $55,000 to $64,999 | 217 (7.4%) | 148 (5.0%) |
| $65,000 to $74,999 | 281 (9.6%) | 136 (4.6%) |
| $75,000 to $99,999 | 580 (19.8%) | 211 (7.2%) |
| $100,000+ | 309 (10.5%) | 197 (6.7%) |
| Total | 2,928 (100.0%) | 2,942 (100.0%) |
Earnings by Sex by Educational Attainment in Box Butte County
Average earnings in Box Butte County are $57,676 for men and $36,747 for women, a difference of 36.3%. Men with an educational attainment of bachelor's degree enjoy the highest average annual earnings of $78,660, while those with less than high school education earn the least with $26,650. Women with an educational attainment of graduate degree earn the most with the average annual earnings of $61,354, while those with high school diploma education have the smallest earnings of $14,713.
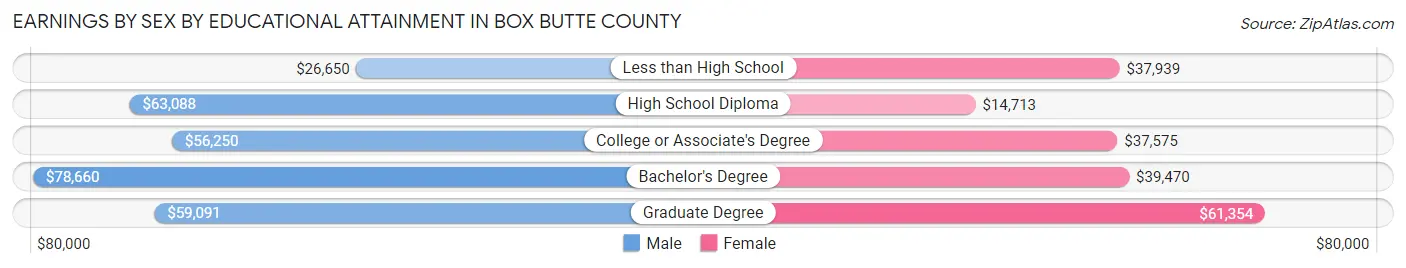
| Educational Attainment | Male Income | Female Income |
| Less than High School | $26,650 | $37,939 |
| High School Diploma | $63,088 | $14,713 |
| College or Associate's Degree | $56,250 | $37,575 |
| Bachelor's Degree | $78,660 | $39,470 |
| Graduate Degree | $59,091 | $61,354 |
| Total | $57,676 | $36,747 |
Family Income in Box Butte County
Family Income Brackets in Box Butte County
According to the Box Butte County family income data, there are 758 families falling into the $50,000 to $74,999 income range, which is the most common income bracket and makes up 26.1% of all families. Conversely, the $200,000+ income bracket is the least frequent group with only 46 families (1.6%) belonging to this category.
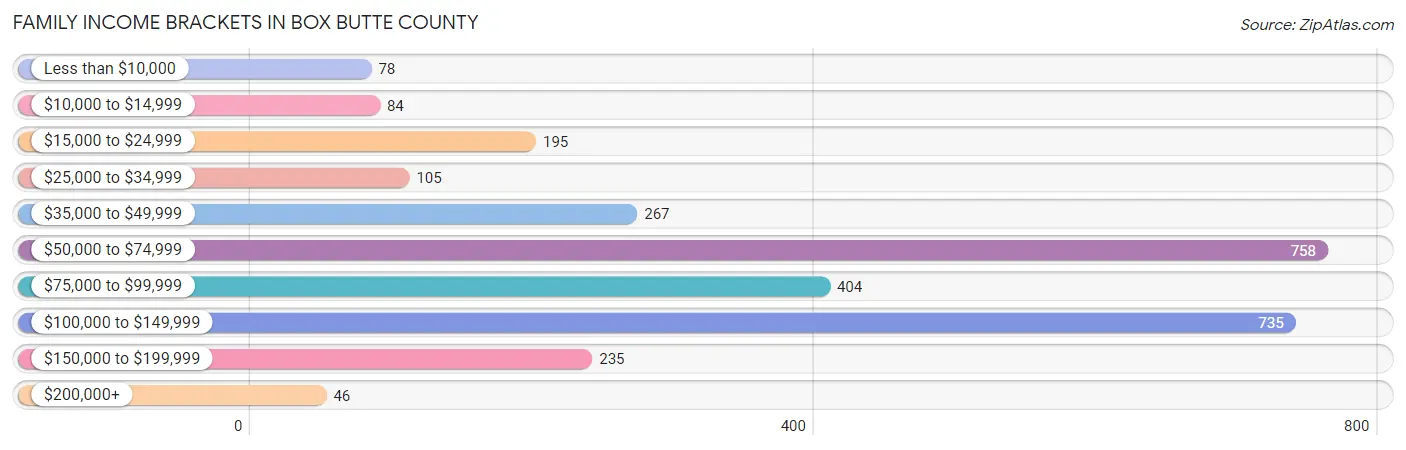
| Income Bracket | # Families | % Families |
| Less than $10,000 | 78 | 2.7% |
| $10,000 to $14,999 | 84 | 2.9% |
| $15,000 to $24,999 | 195 | 6.7% |
| $25,000 to $34,999 | 105 | 3.6% |
| $35,000 to $49,999 | 267 | 9.2% |
| $50,000 to $74,999 | 758 | 26.1% |
| $75,000 to $99,999 | 404 | 13.9% |
| $100,000 to $149,999 | 735 | 25.3% |
| $150,000 to $199,999 | 235 | 8.1% |
| $200,000+ | 46 | 1.6% |
Family Income by Famaliy Size in Box Butte County
7+ person families (68 | 2.3%) account for the highest median family income in Box Butte County with $147,500 per family, while 2-person families (1,578 | 54.3%) have the highest median income of $36,250 per family member.
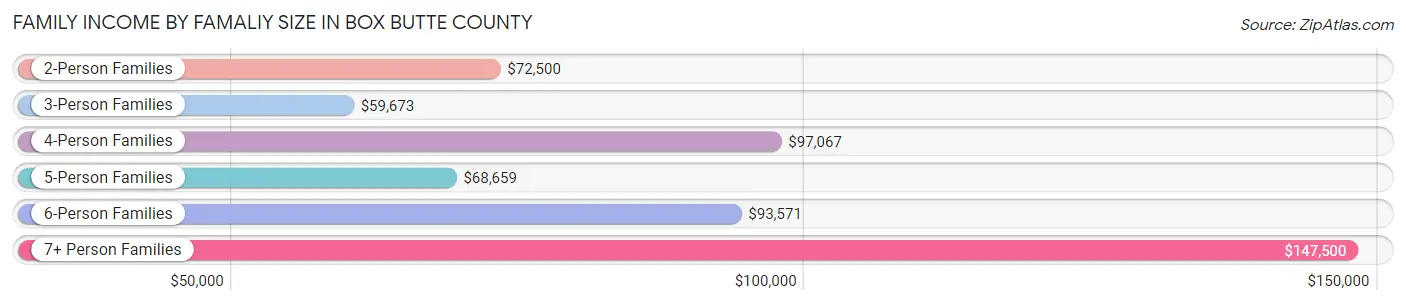
| Income Bracket | # Families | Median Income |
| 2-Person Families | 1,578 (54.3%) | $72,500 |
| 3-Person Families | 447 (15.4%) | $59,673 |
| 4-Person Families | 511 (17.6%) | $97,067 |
| 5-Person Families | 272 (9.4%) | $68,659 |
| 6-Person Families | 30 (1.0%) | $93,571 |
| 7+ Person Families | 68 (2.3%) | $147,500 |
| Total | 2,906 (100.0%) | $72,703 |
Family Income by Number of Earners in Box Butte County
The median family income in Box Butte County is $72,703, with families comprising 3+ earners (202) having the highest median family income of $116,250, while families with no earners (340) have the lowest median family income of $36,100, accounting for 7.0% and 11.7% of families, respectively.
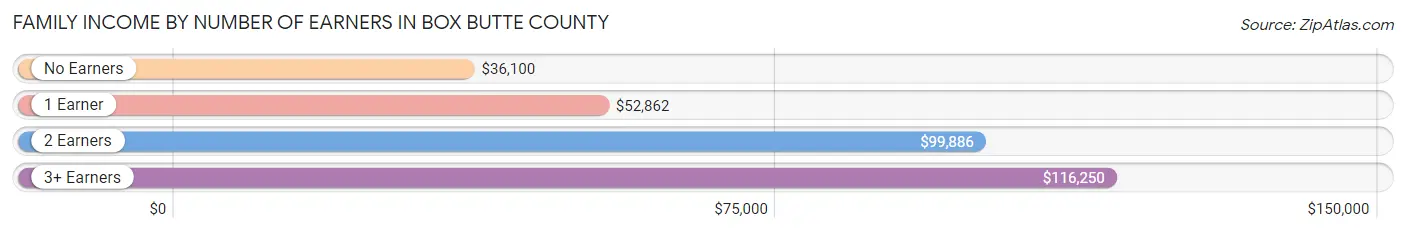
| Number of Earners | # Families | Median Income |
| No Earners | 340 (11.7%) | $36,100 |
| 1 Earner | 825 (28.4%) | $52,862 |
| 2 Earners | 1,539 (53.0%) | $99,886 |
| 3+ Earners | 202 (7.0%) | $116,250 |
| Total | 2,906 (100.0%) | $72,703 |
Household Income in Box Butte County
Household Income Brackets in Box Butte County
With 983 households falling in the category, the $50,000 to $74,999 income range is the most frequent in Box Butte County, accounting for 21.5% of all households. In contrast, only 55 households (1.2%) fall into the $200,000+ income bracket, making it the least populous group.
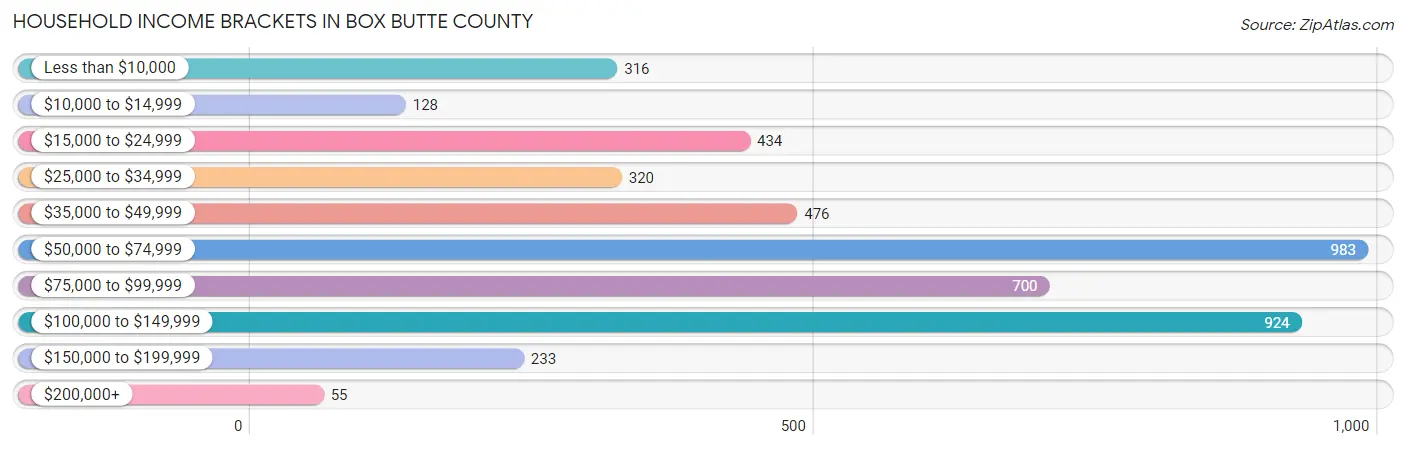
| Income Bracket | # Households | % Households |
| Less than $10,000 | 316 | 6.9% |
| $10,000 to $14,999 | 128 | 2.8% |
| $15,000 to $24,999 | 434 | 9.5% |
| $25,000 to $34,999 | 320 | 7.0% |
| $35,000 to $49,999 | 476 | 10.4% |
| $50,000 to $74,999 | 983 | 21.5% |
| $75,000 to $99,999 | 700 | 15.3% |
| $100,000 to $149,999 | 924 | 20.2% |
| $150,000 to $199,999 | 233 | 5.1% |
| $200,000+ | 55 | 1.2% |
Household Income by Householder Age in Box Butte County
The median household income in Box Butte County is $67,893, with the highest median household income of $78,026 found in the 25 to 44 years age bracket for the primary householder. A total of 1,342 households (29.3%) fall into this category. Meanwhile, the 65+ years age bracket for the primary householder has the lowest median household income of $37,806, with 1,359 households (29.7%) in this group.
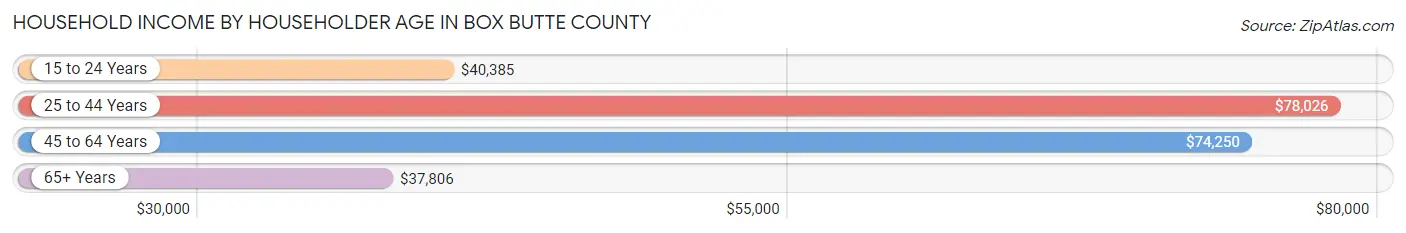
| Income Bracket | # Households | Median Income |
| 15 to 24 Years | 166 (3.6%) | $40,385 |
| 25 to 44 Years | 1,342 (29.3%) | $78,026 |
| 45 to 64 Years | 1,706 (37.3%) | $74,250 |
| 65+ Years | 1,359 (29.7%) | $37,806 |
| Total | 4,573 (100.0%) | $67,893 |
Poverty in Box Butte County
Income Below Poverty by Sex and Age in Box Butte County
With 7.5% poverty level for males and 16.7% for females among the residents of Box Butte County, 18 to 24 year old males and 18 to 24 year old females are the most vulnerable to poverty, with 113 males (38.2%) and 137 females (42.8%) in their respective age groups living below the poverty level.
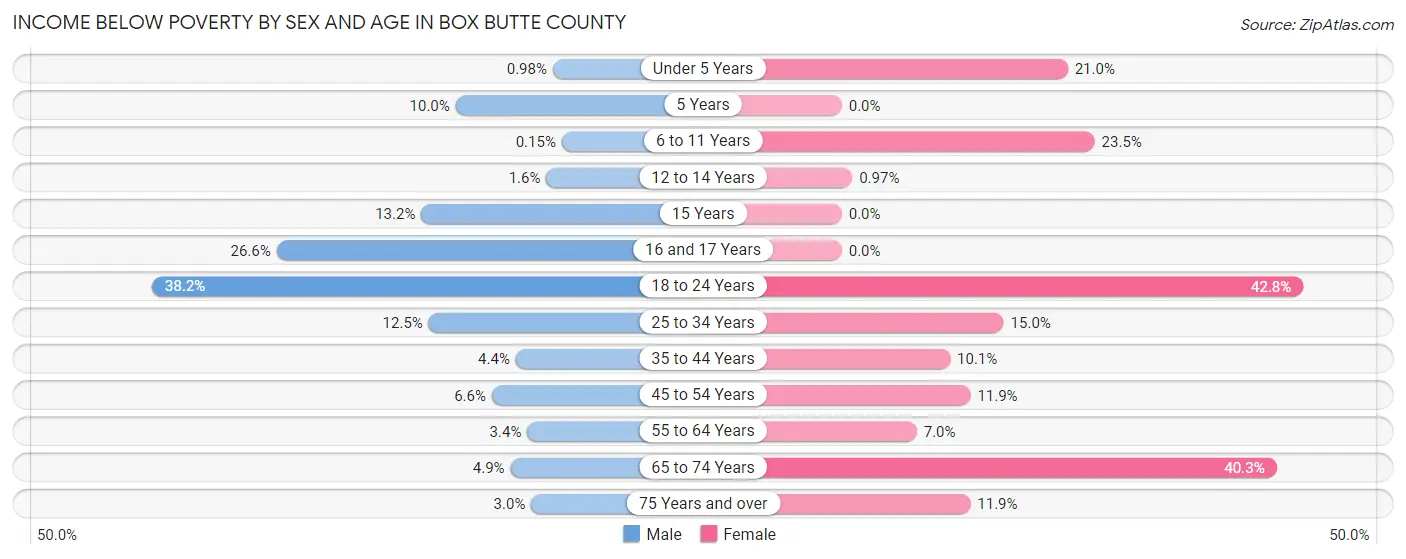
| Age Bracket | Male | Female |
| Under 5 Years | 2 (1.0%) | 82 (21.0%) |
| 5 Years | 4 (10.0%) | 0 (0.0%) |
| 6 to 11 Years | 1 (0.2%) | 73 (23.5%) |
| 12 to 14 Years | 4 (1.6%) | 3 (1.0%) |
| 15 Years | 19 (13.2%) | 0 (0.0%) |
| 16 and 17 Years | 37 (26.6%) | 0 (0.0%) |
| 18 to 24 Years | 113 (38.2%) | 137 (42.8%) |
| 25 to 34 Years | 90 (12.5%) | 97 (15.0%) |
| 35 to 44 Years | 24 (4.4%) | 57 (10.1%) |
| 45 to 54 Years | 45 (6.6%) | 69 (11.9%) |
| 55 to 64 Years | 26 (3.4%) | 56 (7.0%) |
| 65 to 74 Years | 31 (4.9%) | 240 (40.3%) |
| 75 Years and over | 9 (3.0%) | 52 (11.9%) |
| Total | 405 (7.5%) | 866 (16.7%) |
Income Above Poverty by Sex and Age in Box Butte County
According to the poverty statistics in Box Butte County, males aged 6 to 11 years and females aged 5 years are the age groups that are most secure financially, with 99.9% of males and 100.0% of females in these age groups living above the poverty line.
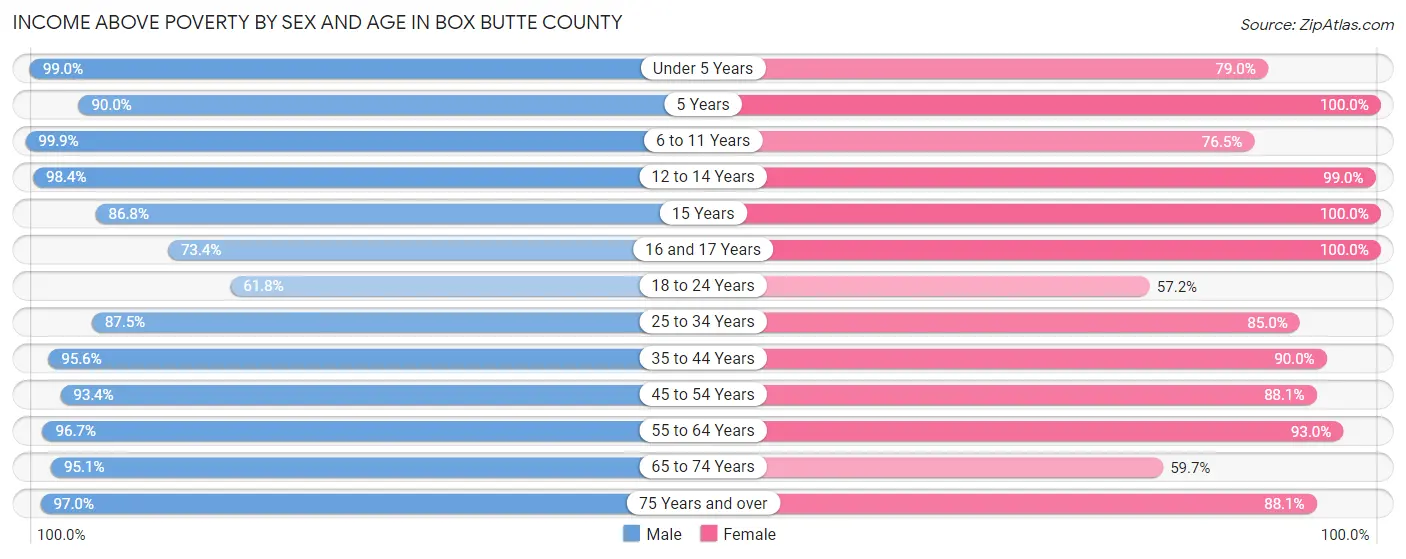
| Age Bracket | Male | Female |
| Under 5 Years | 202 (99.0%) | 309 (79.0%) |
| 5 Years | 36 (90.0%) | 74 (100.0%) |
| 6 to 11 Years | 671 (99.9%) | 238 (76.5%) |
| 12 to 14 Years | 249 (98.4%) | 307 (99.0%) |
| 15 Years | 125 (86.8%) | 27 (100.0%) |
| 16 and 17 Years | 102 (73.4%) | 131 (100.0%) |
| 18 to 24 Years | 183 (61.8%) | 183 (57.2%) |
| 25 to 34 Years | 630 (87.5%) | 549 (85.0%) |
| 35 to 44 Years | 519 (95.6%) | 510 (89.9%) |
| 45 to 54 Years | 633 (93.4%) | 509 (88.1%) |
| 55 to 64 Years | 749 (96.7%) | 749 (93.0%) |
| 65 to 74 Years | 600 (95.1%) | 355 (59.7%) |
| 75 Years and over | 293 (97.0%) | 384 (88.1%) |
| Total | 4,992 (92.5%) | 4,325 (83.3%) |
Income Below Poverty Among Married-Couple Families in Box Butte County
The poverty statistics for married-couple families in Box Butte County show that 4.8% or 106 of the total 2,200 families live below the poverty line. Families with no children have the highest poverty rate of 6.6%, comprising of 91 families. On the other hand, families with 5 or more children have the lowest poverty rate of 0.0%, which includes 0 families.
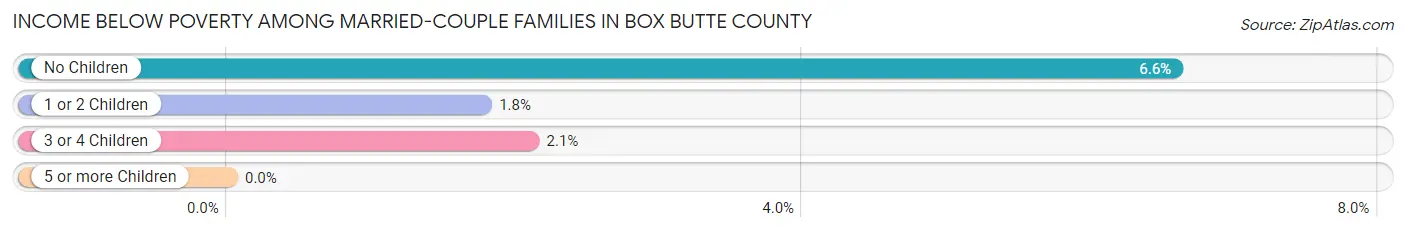
| Children | Above Poverty | Below Poverty |
| No Children | 1,293 (93.4%) | 91 (6.6%) |
| 1 or 2 Children | 554 (98.2%) | 10 (1.8%) |
| 3 or 4 Children | 233 (97.9%) | 5 (2.1%) |
| 5 or more Children | 14 (100.0%) | 0 (0.0%) |
| Total | 2,094 (95.2%) | 106 (4.8%) |
Income Below Poverty Among Single-Parent Households in Box Butte County
According to the poverty data in Box Butte County, 18.6% or 46 single-father households and 24.0% or 110 single-mother households are living below the poverty line. Among single-father households, those with no children have the highest poverty rate, with 11 households (31.4%) experiencing poverty. Likewise, among single-mother households, those with no children have the highest poverty rate, with 25 households (41.0%) falling below the poverty line.
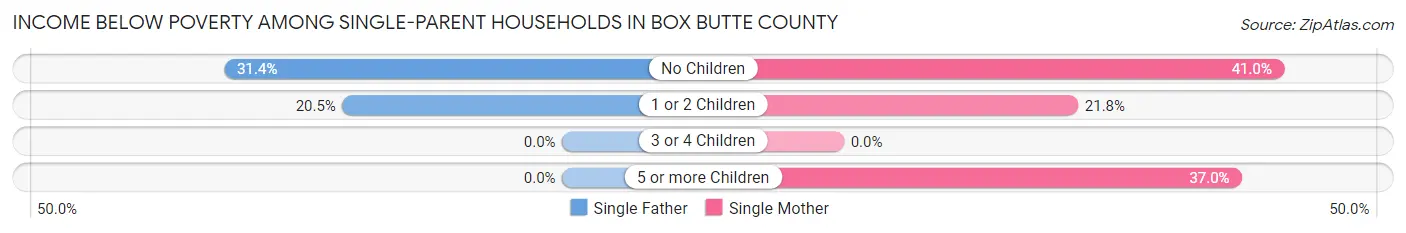
| Children | Single Father | Single Mother |
| No Children | 11 (31.4%) | 25 (41.0%) |
| 1 or 2 Children | 35 (20.5%) | 65 (21.8%) |
| 3 or 4 Children | 0 (0.0%) | 0 (0.0%) |
| 5 or more Children | 0 (0.0%) | 20 (37.0%) |
| Total | 46 (18.6%) | 110 (24.0%) |
Income Below Poverty Among Married-Couple vs Single-Parent Households in Box Butte County
The poverty data for Box Butte County shows that 106 of the married-couple family households (4.8%) and 156 of the single-parent households (22.1%) are living below the poverty level. Within the married-couple family households, those with no children have the highest poverty rate, with 91 households (6.6%) falling below the poverty line. Among the single-parent households, those with no children have the highest poverty rate, with 36 household (37.5%) living below poverty.
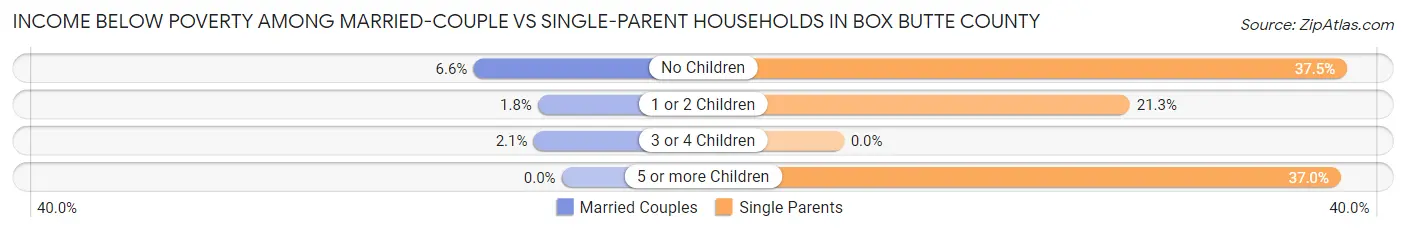
| Children | Married-Couple Families | Single-Parent Households |
| No Children | 91 (6.6%) | 36 (37.5%) |
| 1 or 2 Children | 10 (1.8%) | 100 (21.3%) |
| 3 or 4 Children | 5 (2.1%) | 0 (0.0%) |
| 5 or more Children | 0 (0.0%) | 20 (37.0%) |
| Total | 106 (4.8%) | 156 (22.1%) |
Employment Characteristics in Box Butte County
Employment by Class of Employer in Box Butte County
Among the 5,148 employed individuals in Box Butte County, private company employees (3,410 | 66.2%), local government employees (487 | 9.5%), and self-employed (not incorporated) (405 | 7.9%) make up the most common classes of employment.
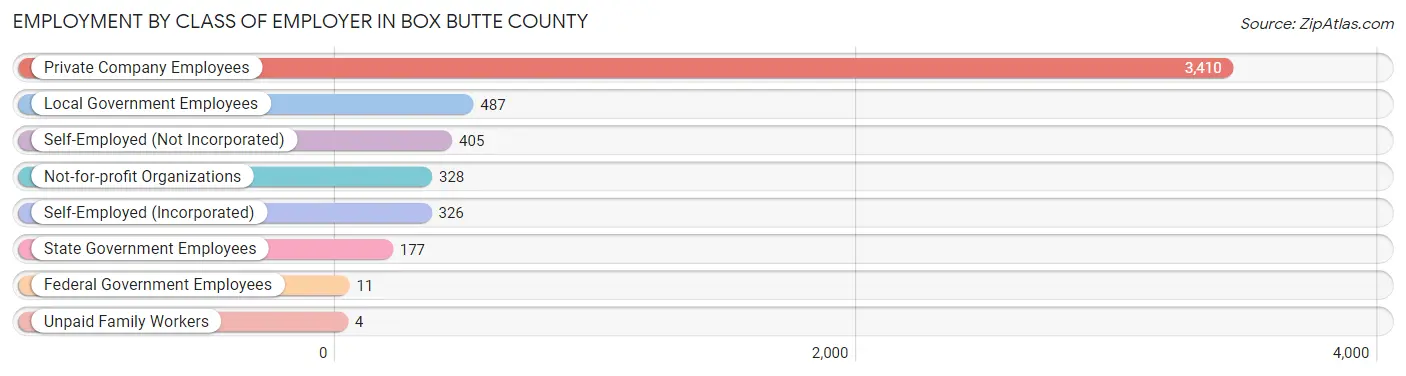
| Employer Class | # Employees | % Employees |
| Private Company Employees | 3,410 | 66.2% |
| Self-Employed (Incorporated) | 326 | 6.3% |
| Self-Employed (Not Incorporated) | 405 | 7.9% |
| Not-for-profit Organizations | 328 | 6.4% |
| Local Government Employees | 487 | 9.5% |
| State Government Employees | 177 | 3.4% |
| Federal Government Employees | 11 | 0.2% |
| Unpaid Family Workers | 4 | 0.1% |
| Total | 5,148 | 100.0% |
Employment Status by Age in Box Butte County
According to the labor force statistics for Box Butte County, out of the total population over 16 years of age (8,324), 65.6% or 5,461 individuals are in the labor force, with 4.0% or 218 of them unemployed. The age group with the highest labor force participation rate is 25 to 29 years, with 97.5% or 621 individuals in the labor force. Within the labor force, the 16 to 19 years age range has the highest percentage of unemployed individuals, with 22.1% or 59 of them being unemployed.
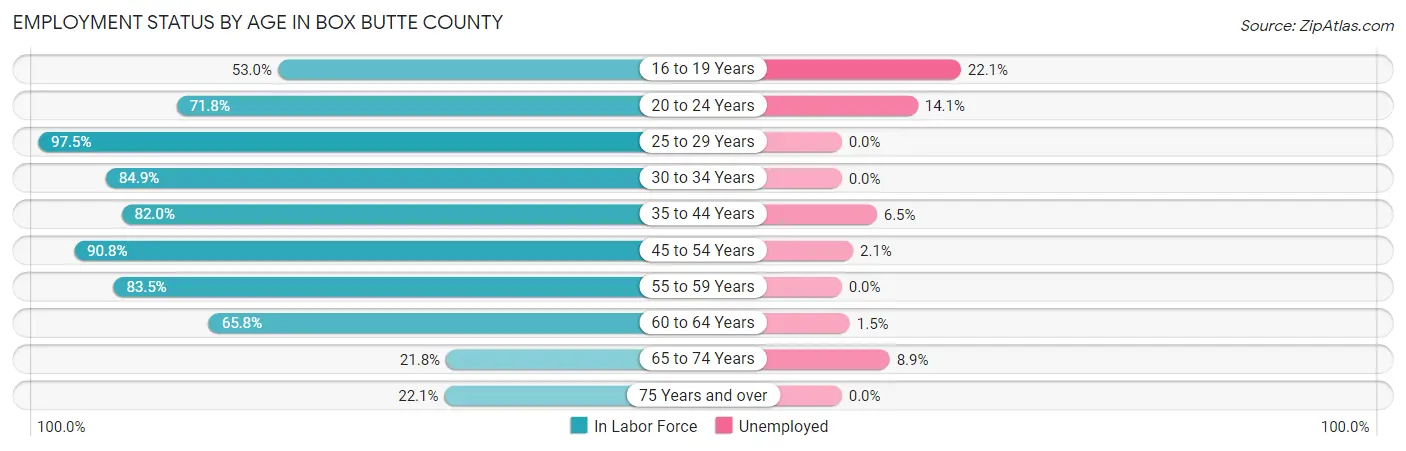
| Age Bracket | In Labor Force | Unemployed |
| 16 to 19 Years | 267 (53.0%) | 59 (22.1%) |
| 20 to 24 Years | 277 (71.8%) | 39 (14.1%) |
| 25 to 29 Years | 621 (97.5%) | 0 (0.0%) |
| 30 to 34 Years | 631 (84.9%) | 0 (0.0%) |
| 35 to 44 Years | 918 (82.0%) | 60 (6.5%) |
| 45 to 54 Years | 1,168 (90.8%) | 25 (2.1%) |
| 55 to 59 Years | 394 (83.5%) | 0 (0.0%) |
| 60 to 64 Years | 736 (65.8%) | 11 (1.5%) |
| 65 to 74 Years | 271 (21.8%) | 24 (8.9%) |
| 75 Years and over | 180 (22.1%) | 0 (0.0%) |
| Total | 5,461 (65.6%) | 218 (4.0%) |
Employment Status by Educational Attainment in Box Butte County
According to labor force statistics for Box Butte County, 83.1% of individuals (4,467) out of the total population between 25 and 64 years of age (5,376) are in the labor force, with 2.1% or 94 of them being unemployed. The group with the highest labor force participation rate are those with the educational attainment of bachelor's degree or higher, with 95.9% or 959 individuals in the labor force. Within the labor force, individuals with high school diploma education have the highest percentage of unemployment, with 6.7% or 72 of them being unemployed.
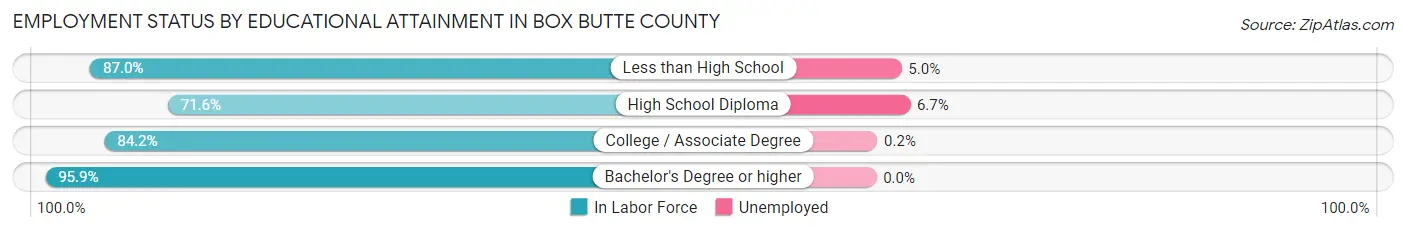
| Educational Attainment | In Labor Force | Unemployed |
| Less than High School | 400 (87.0%) | 23 (5.0%) |
| High School Diploma | 1,070 (71.6%) | 100 (6.7%) |
| College / Associate Degree | 2,039 (84.2%) | 5 (0.2%) |
| Bachelor's Degree or higher | 959 (95.9%) | 0 (0.0%) |
| Total | 4,467 (83.1%) | 113 (2.1%) |
Employment Occupations by Sex in Box Butte County
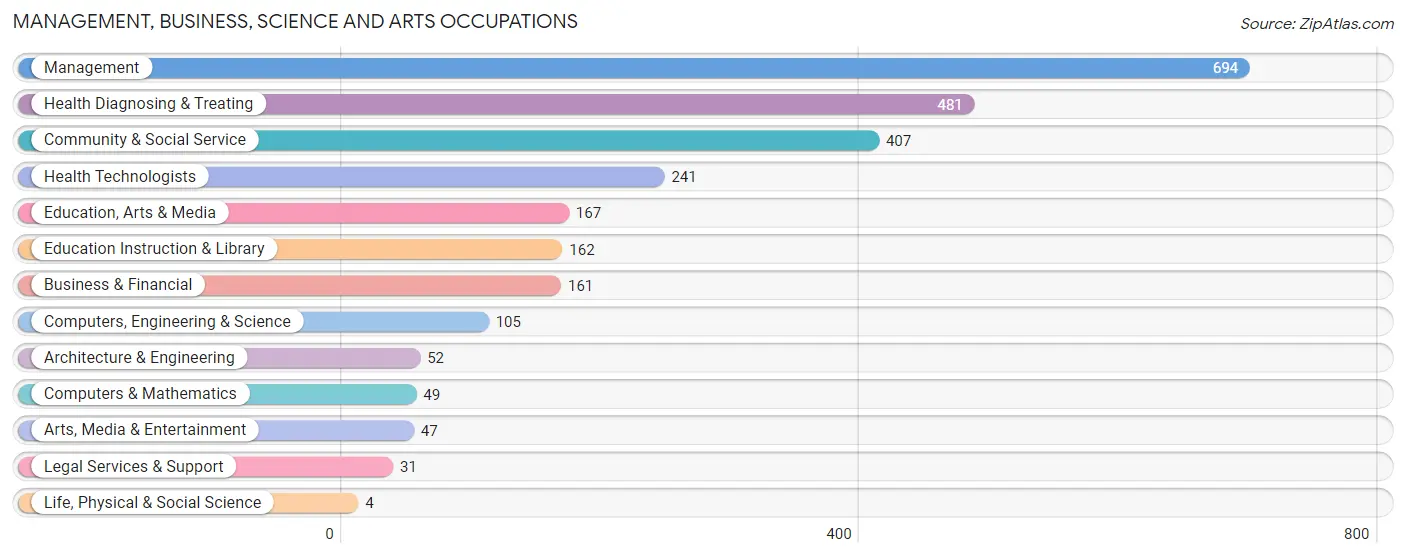
Management, Business, Science and Arts Occupations
The most common Management, Business, Science and Arts occupations in Box Butte County are Management (694 | 13.2%), Health Diagnosing & Treating (481 | 9.2%), Community & Social Service (407 | 7.8%), Health Technologists (241 | 4.6%), and Education, Arts & Media (167 | 3.2%).
Management, Business, Science and Arts Occupations by Sex
Within the Management, Business, Science and Arts occupations in Box Butte County, the most male-oriented occupations are Architecture & Engineering (100.0%), Life, Physical & Social Science (100.0%), and Arts, Media & Entertainment (87.2%), while the most female-oriented occupations are Health Diagnosing & Treating (99.0%), Health Technologists (97.9%), and Legal Services & Support (90.3%).
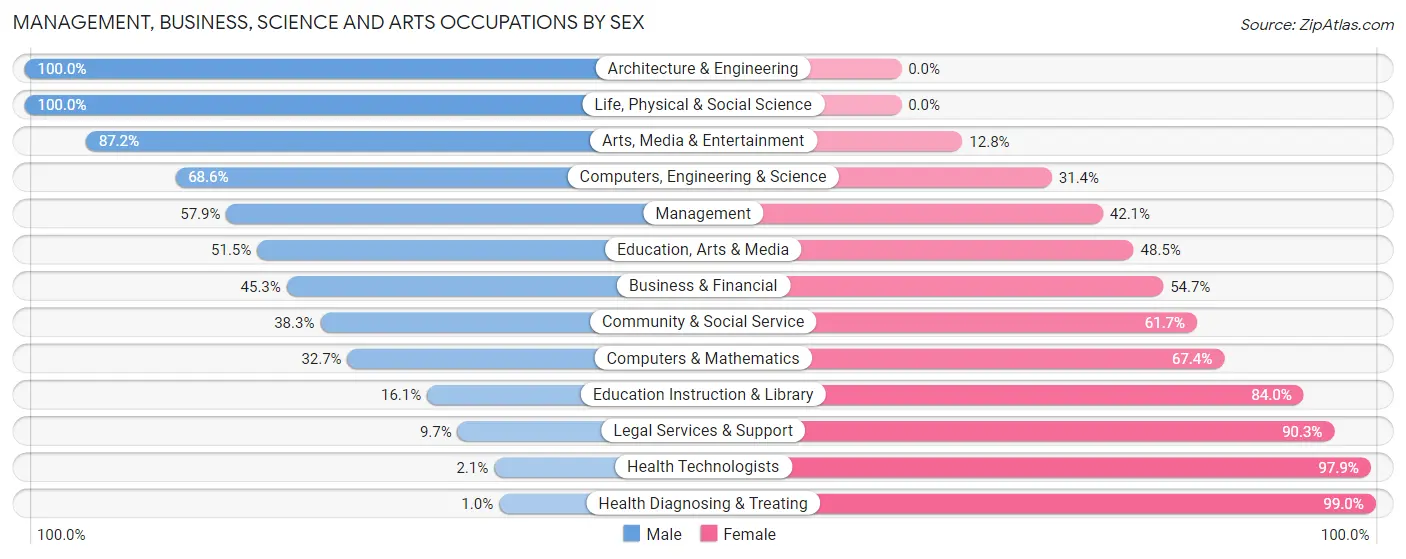
| Occupation | Male | Female |
| Management | 402 (57.9%) | 292 (42.1%) |
| Business & Financial | 73 (45.3%) | 88 (54.7%) |
| Computers, Engineering & Science | 72 (68.6%) | 33 (31.4%) |
| Computers & Mathematics | 16 (32.7%) | 33 (67.3%) |
| Architecture & Engineering | 52 (100.0%) | 0 (0.0%) |
| Life, Physical & Social Science | 4 (100.0%) | 0 (0.0%) |
| Community & Social Service | 156 (38.3%) | 251 (61.7%) |
| Education, Arts & Media | 86 (51.5%) | 81 (48.5%) |
| Legal Services & Support | 3 (9.7%) | 28 (90.3%) |
| Education Instruction & Library | 26 (16.1%) | 136 (84.0%) |
| Arts, Media & Entertainment | 41 (87.2%) | 6 (12.8%) |
| Health Diagnosing & Treating | 5 (1.0%) | 476 (99.0%) |
| Health Technologists | 5 (2.1%) | 236 (97.9%) |
| Total (Category) | 708 (38.3%) | 1,140 (61.7%) |
| Total (Overall) | 2,654 (50.6%) | 2,591 (49.4%) |
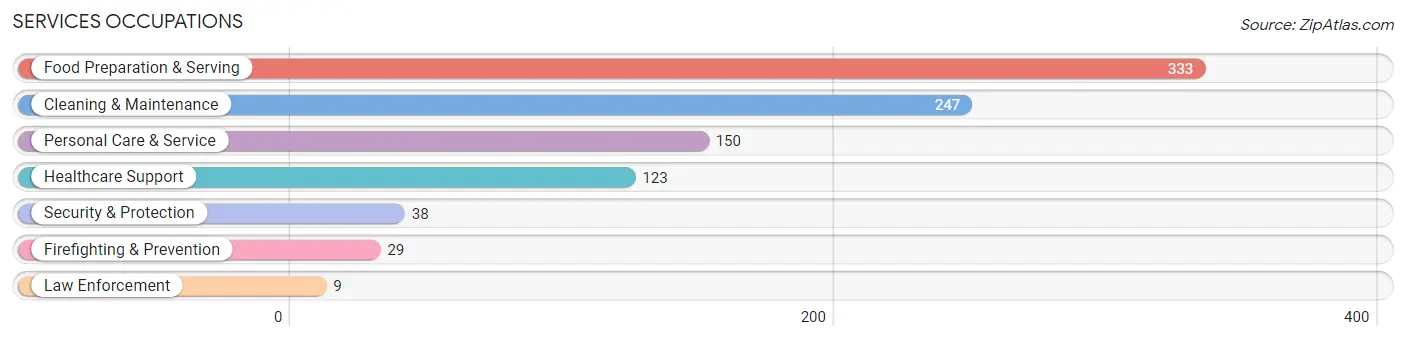
Services Occupations
The most common Services occupations in Box Butte County are Food Preparation & Serving (333 | 6.4%), Cleaning & Maintenance (247 | 4.7%), Personal Care & Service (150 | 2.9%), Healthcare Support (123 | 2.4%), and Security & Protection (38 | 0.7%).
Services Occupations by Sex
Within the Services occupations in Box Butte County, the most male-oriented occupations are Security & Protection (100.0%), Firefighting & Prevention (100.0%), and Law Enforcement (100.0%), while the most female-oriented occupations are Healthcare Support (100.0%), Personal Care & Service (100.0%), and Food Preparation & Serving (90.1%).
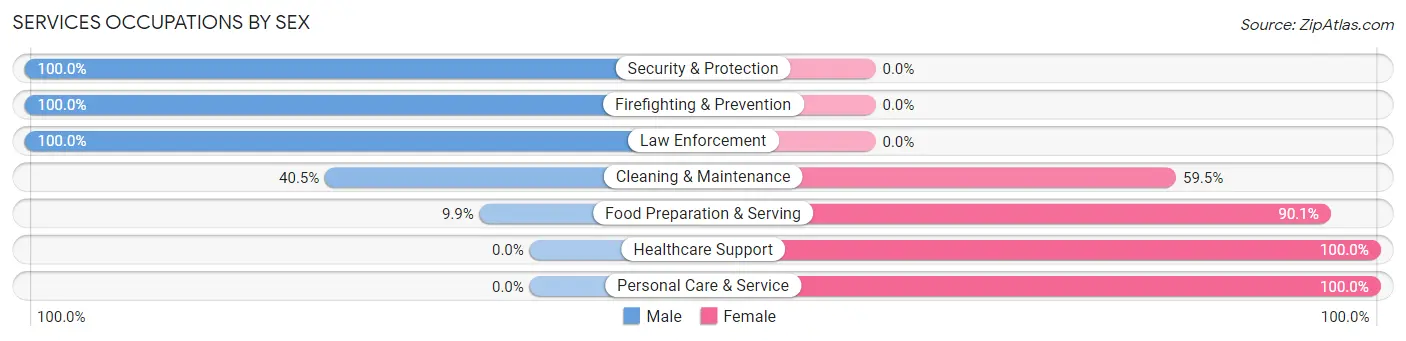
| Occupation | Male | Female |
| Healthcare Support | 0 (0.0%) | 123 (100.0%) |
| Security & Protection | 38 (100.0%) | 0 (0.0%) |
| Firefighting & Prevention | 29 (100.0%) | 0 (0.0%) |
| Law Enforcement | 9 (100.0%) | 0 (0.0%) |
| Food Preparation & Serving | 33 (9.9%) | 300 (90.1%) |
| Cleaning & Maintenance | 100 (40.5%) | 147 (59.5%) |
| Personal Care & Service | 0 (0.0%) | 150 (100.0%) |
| Total (Category) | 171 (19.2%) | 720 (80.8%) |
| Total (Overall) | 2,654 (50.6%) | 2,591 (49.4%) |
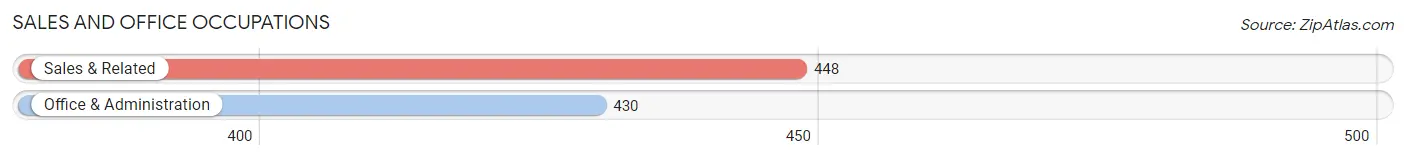
Sales and Office Occupations
The most common Sales and Office occupations in Box Butte County are Sales & Related (448 | 8.5%), and Office & Administration (430 | 8.2%).
Sales and Office Occupations by Sex
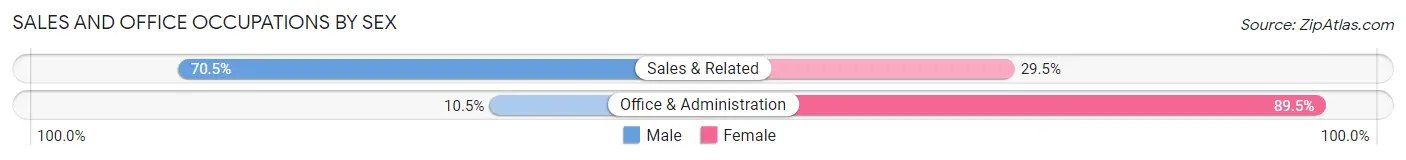
| Occupation | Male | Female |
| Sales & Related | 316 (70.5%) | 132 (29.5%) |
| Office & Administration | 45 (10.5%) | 385 (89.5%) |
| Total (Category) | 361 (41.1%) | 517 (58.9%) |
| Total (Overall) | 2,654 (50.6%) | 2,591 (49.4%) |
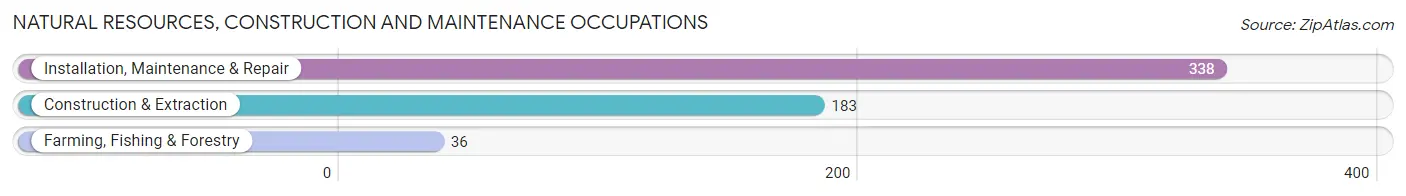
Natural Resources, Construction and Maintenance Occupations
The most common Natural Resources, Construction and Maintenance occupations in Box Butte County are Installation, Maintenance & Repair (338 | 6.4%), Construction & Extraction (183 | 3.5%), and Farming, Fishing & Forestry (36 | 0.7%).
Natural Resources, Construction and Maintenance Occupations by Sex
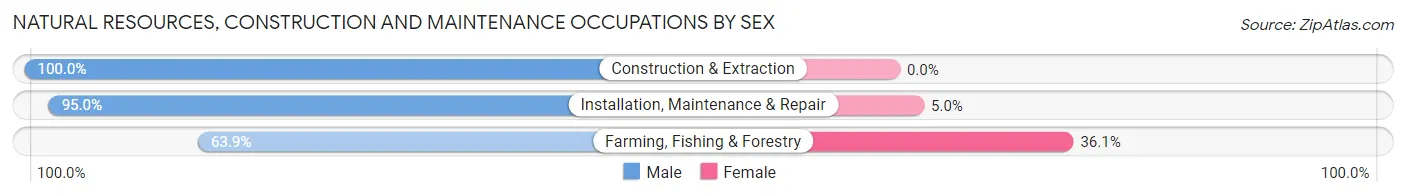
| Occupation | Male | Female |
| Farming, Fishing & Forestry | 23 (63.9%) | 13 (36.1%) |
| Construction & Extraction | 183 (100.0%) | 0 (0.0%) |
| Installation, Maintenance & Repair | 321 (95.0%) | 17 (5.0%) |
| Total (Category) | 527 (94.6%) | 30 (5.4%) |
| Total (Overall) | 2,654 (50.6%) | 2,591 (49.4%) |
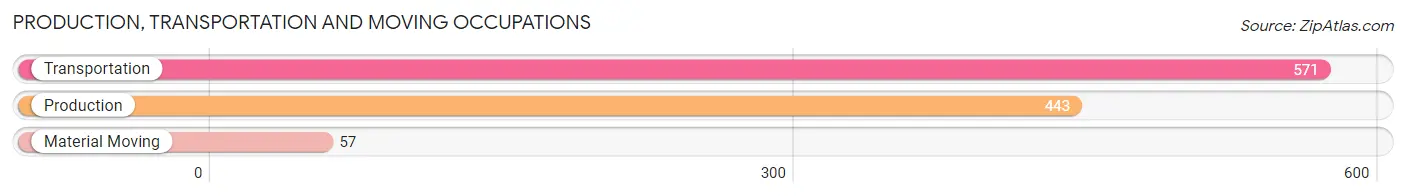
Production, Transportation and Moving Occupations
The most common Production, Transportation and Moving occupations in Box Butte County are Transportation (571 | 10.9%), Production (443 | 8.5%), and Material Moving (57 | 1.1%).
Production, Transportation and Moving Occupations by Sex
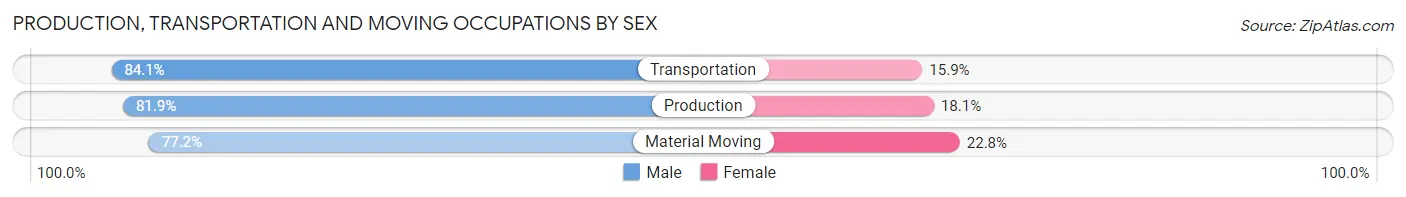
| Occupation | Male | Female |
| Production | 363 (81.9%) | 80 (18.1%) |
| Transportation | 480 (84.1%) | 91 (15.9%) |
| Material Moving | 44 (77.2%) | 13 (22.8%) |
| Total (Category) | 887 (82.8%) | 184 (17.2%) |
| Total (Overall) | 2,654 (50.6%) | 2,591 (49.4%) |
Employment Industries by Sex in Box Butte County
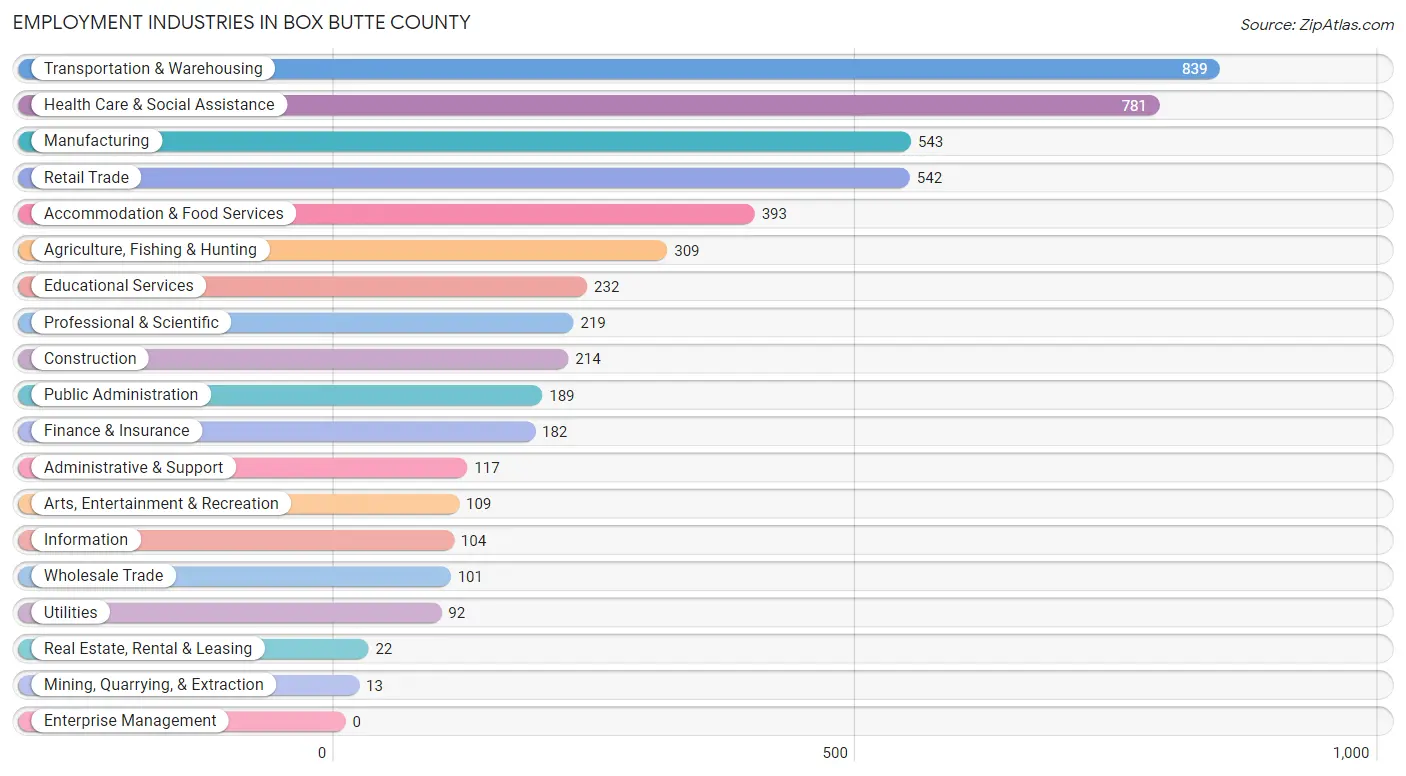
Employment Industries in Box Butte County
The major employment industries in Box Butte County include Transportation & Warehousing (839 | 16.0%), Health Care & Social Assistance (781 | 14.9%), Manufacturing (543 | 10.3%), Retail Trade (542 | 10.3%), and Accommodation & Food Services (393 | 7.5%).
Employment Industries by Sex in Box Butte County
The Box Butte County industries that see more men than women are Mining, Quarrying, & Extraction (100.0%), Wholesale Trade (91.1%), and Manufacturing (89.1%), whereas the industries that tend to have a higher number of women are Real Estate, Rental & Leasing (100.0%), Health Care & Social Assistance (97.8%), and Accommodation & Food Services (91.3%).
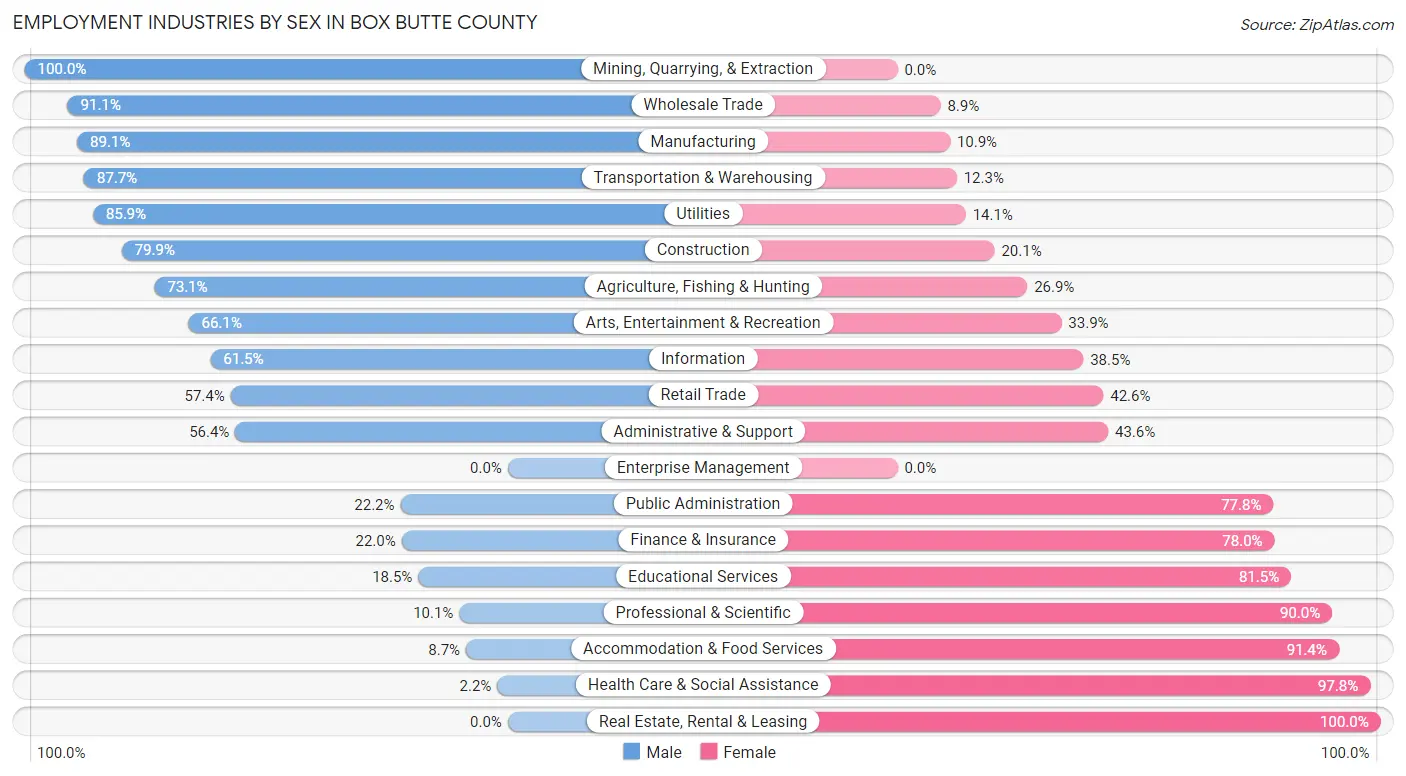
| Industry | Male | Female |
| Agriculture, Fishing & Hunting | 226 (73.1%) | 83 (26.9%) |
| Mining, Quarrying, & Extraction | 13 (100.0%) | 0 (0.0%) |
| Construction | 171 (79.9%) | 43 (20.1%) |
| Manufacturing | 484 (89.1%) | 59 (10.9%) |
| Wholesale Trade | 92 (91.1%) | 9 (8.9%) |
| Retail Trade | 311 (57.4%) | 231 (42.6%) |
| Transportation & Warehousing | 736 (87.7%) | 103 (12.3%) |
| Utilities | 79 (85.9%) | 13 (14.1%) |
| Information | 64 (61.5%) | 40 (38.5%) |
| Finance & Insurance | 40 (22.0%) | 142 (78.0%) |
| Real Estate, Rental & Leasing | 0 (0.0%) | 22 (100.0%) |
| Professional & Scientific | 22 (10.1%) | 197 (89.9%) |
| Enterprise Management | 0 (0.0%) | 0 (0.0%) |
| Administrative & Support | 66 (56.4%) | 51 (43.6%) |
| Educational Services | 43 (18.5%) | 189 (81.5%) |
| Health Care & Social Assistance | 17 (2.2%) | 764 (97.8%) |
| Arts, Entertainment & Recreation | 72 (66.1%) | 37 (33.9%) |
| Accommodation & Food Services | 34 (8.6%) | 359 (91.3%) |
| Public Administration | 42 (22.2%) | 147 (77.8%) |
| Total | 2,654 (50.6%) | 2,591 (49.4%) |
Education in Box Butte County
School Enrollment in Box Butte County
The most common levels of schooling among the 2,442 students in Box Butte County are middle school (801 | 32.8%), high school (665 | 27.2%), and elementary school (548 | 22.4%).
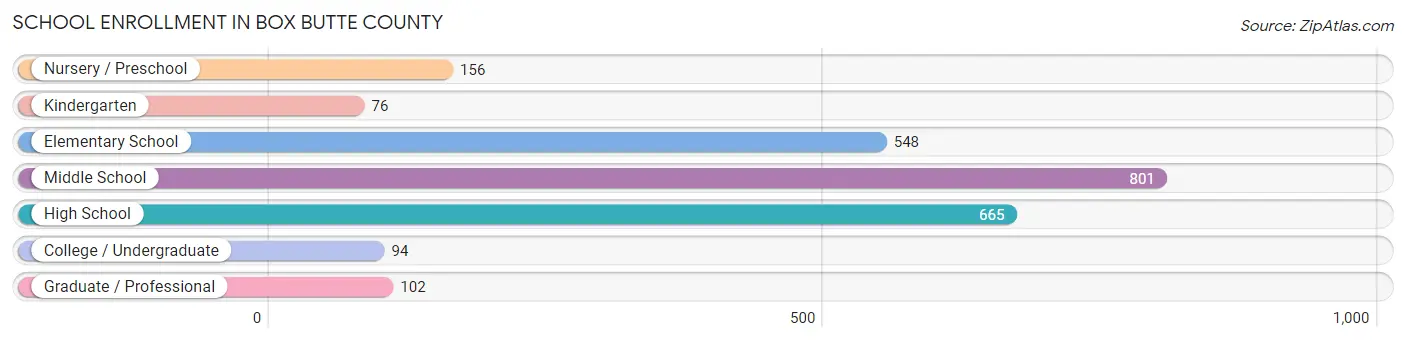
| School Level | # Students | % Students |
| Nursery / Preschool | 156 | 6.4% |
| Kindergarten | 76 | 3.1% |
| Elementary School | 548 | 22.4% |
| Middle School | 801 | 32.8% |
| High School | 665 | 27.2% |
| College / Undergraduate | 94 | 3.8% |
| Graduate / Professional | 102 | 4.2% |
| Total | 2,442 | 100.0% |
School Enrollment by Age by Funding Source in Box Butte County
Out of a total of 2,442 students who are enrolled in schools in Box Butte County, 332 (13.6%) attend a private institution, while the remaining 2,110 (86.4%) are enrolled in public schools. The age group of 35 years and over has the highest likelihood of being enrolled in private schools, with 30 (36.1% in the age bracket) enrolled. Conversely, the age group of 15 to 17 year olds has the lowest likelihood of being enrolled in a private school, with 440 (100.0% in the age bracket) attending a public institution.
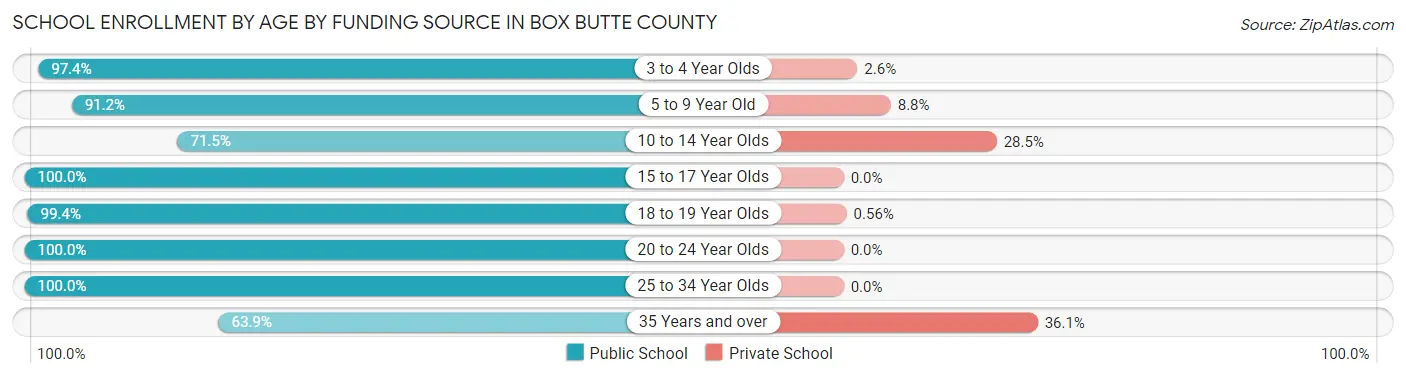
| Age Bracket | Public School | Private School |
| 3 to 4 Year Olds | 114 (97.4%) | 3 (2.6%) |
| 5 to 9 Year Old | 561 (91.2%) | 54 (8.8%) |
| 10 to 14 Year Olds | 612 (71.5%) | 244 (28.5%) |
| 15 to 17 Year Olds | 440 (100.0%) | 0 (0.0%) |
| 18 to 19 Year Olds | 177 (99.4%) | 1 (0.6%) |
| 20 to 24 Year Olds | 119 (100.0%) | 0 (0.0%) |
| 25 to 34 Year Olds | 34 (100.0%) | 0 (0.0%) |
| 35 Years and over | 53 (63.9%) | 30 (36.1%) |
| Total | 2,110 (86.4%) | 332 (13.6%) |
Educational Attainment by Field of Study in Box Butte County
Education (278 | 19.7%), science & technology (224 | 15.9%), business (224 | 15.9%), liberal arts & history (169 | 12.0%), and bio, nature & agricultural (122 | 8.6%) are the most common fields of study among 1,413 individuals in Box Butte County who have obtained a bachelor's degree or higher.
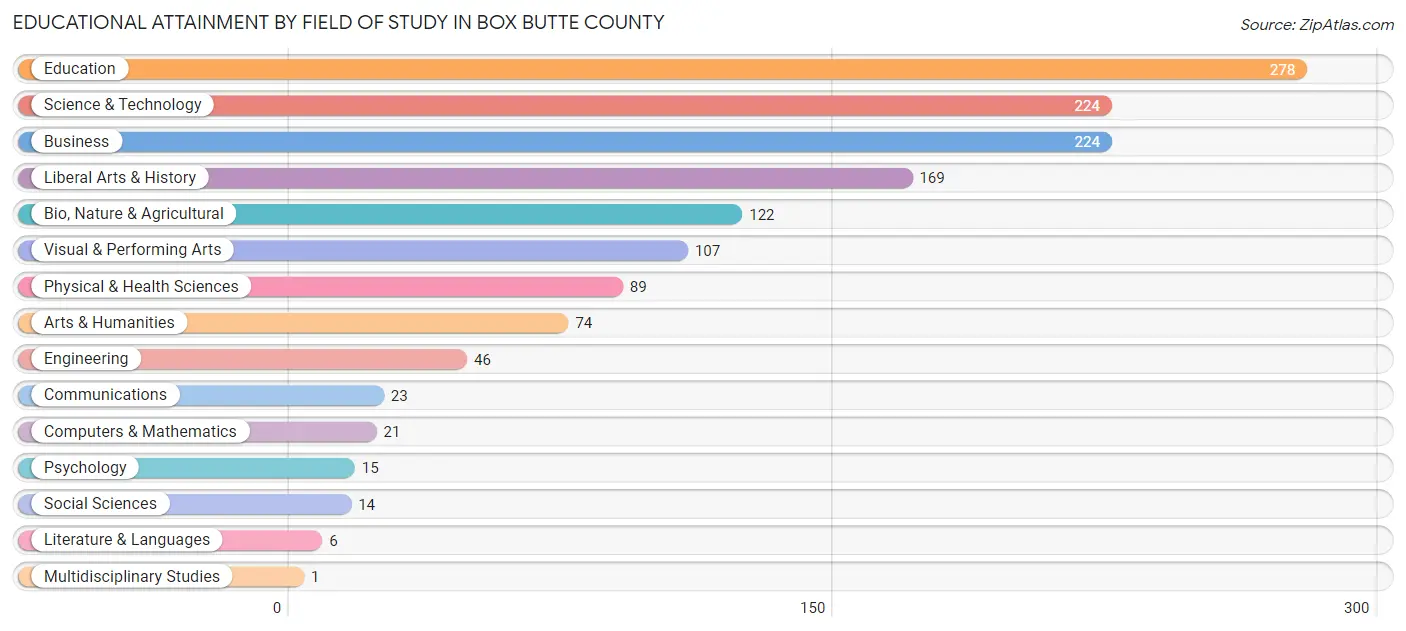
| Field of Study | # Graduates | % Graduates |
| Computers & Mathematics | 21 | 1.5% |
| Bio, Nature & Agricultural | 122 | 8.6% |
| Physical & Health Sciences | 89 | 6.3% |
| Psychology | 15 | 1.1% |
| Social Sciences | 14 | 1.0% |
| Engineering | 46 | 3.3% |
| Multidisciplinary Studies | 1 | 0.1% |
| Science & Technology | 224 | 15.9% |
| Business | 224 | 15.9% |
| Education | 278 | 19.7% |
| Literature & Languages | 6 | 0.4% |
| Liberal Arts & History | 169 | 12.0% |
| Visual & Performing Arts | 107 | 7.6% |
| Communications | 23 | 1.6% |
| Arts & Humanities | 74 | 5.2% |
| Total | 1,413 | 100.0% |
Transportation & Commute in Box Butte County
Vehicle Availability by Sex in Box Butte County
The most prevalent vehicle ownership categories in Box Butte County are males with 2 vehicles (989, accounting for 38.0%) and females with 2 vehicles (998, making up 38.9%).
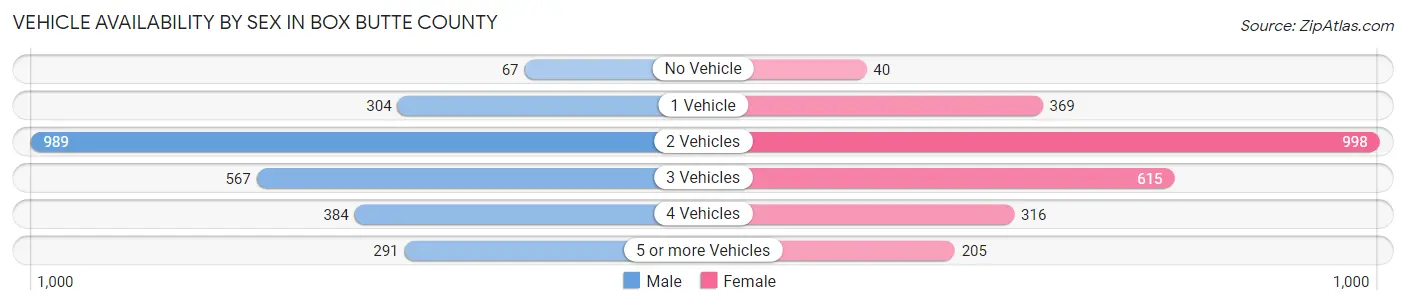
| Vehicles Available | Male | Female |
| No Vehicle | 67 (2.6%) | 40 (1.6%) |
| 1 Vehicle | 304 (11.7%) | 369 (14.5%) |
| 2 Vehicles | 989 (38.0%) | 998 (39.2%) |
| 3 Vehicles | 567 (21.8%) | 615 (24.2%) |
| 4 Vehicles | 384 (14.8%) | 316 (12.4%) |
| 5 or more Vehicles | 291 (11.2%) | 205 (8.1%) |
| Total | 2,602 (100.0%) | 2,543 (100.0%) |
Commute Time in Box Butte County
The most frequently occuring commute durations in Box Butte County are 5 to 9 minutes (2,185 commuters, 46.7%), less than 5 minutes (902 commuters, 19.3%), and 10 to 14 minutes (596 commuters, 12.8%).
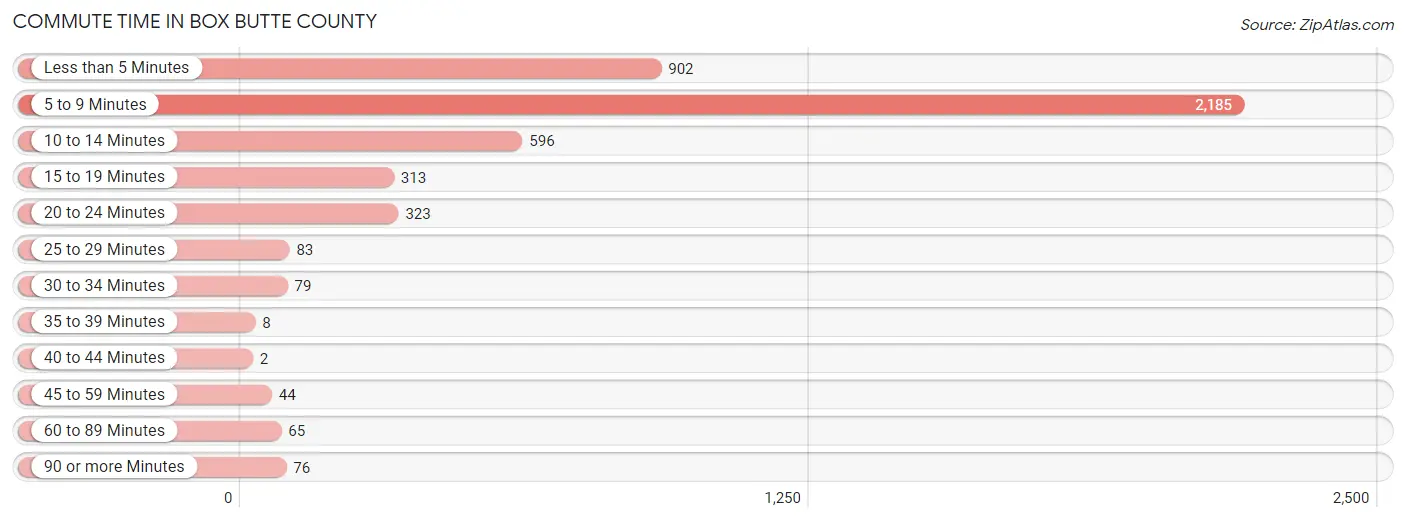
| Commute Time | # Commuters | % Commuters |
| Less than 5 Minutes | 902 | 19.3% |
| 5 to 9 Minutes | 2,185 | 46.7% |
| 10 to 14 Minutes | 596 | 12.8% |
| 15 to 19 Minutes | 313 | 6.7% |
| 20 to 24 Minutes | 323 | 6.9% |
| 25 to 29 Minutes | 83 | 1.8% |
| 30 to 34 Minutes | 79 | 1.7% |
| 35 to 39 Minutes | 8 | 0.2% |
| 40 to 44 Minutes | 2 | 0.0% |
| 45 to 59 Minutes | 44 | 0.9% |
| 60 to 89 Minutes | 65 | 1.4% |
| 90 or more Minutes | 76 | 1.6% |
Commute Time by Sex in Box Butte County
The most common commute times in Box Butte County are 5 to 9 minutes (1,094 commuters, 50.5%) for males and 5 to 9 minutes (1,091 commuters, 43.5%) for females.
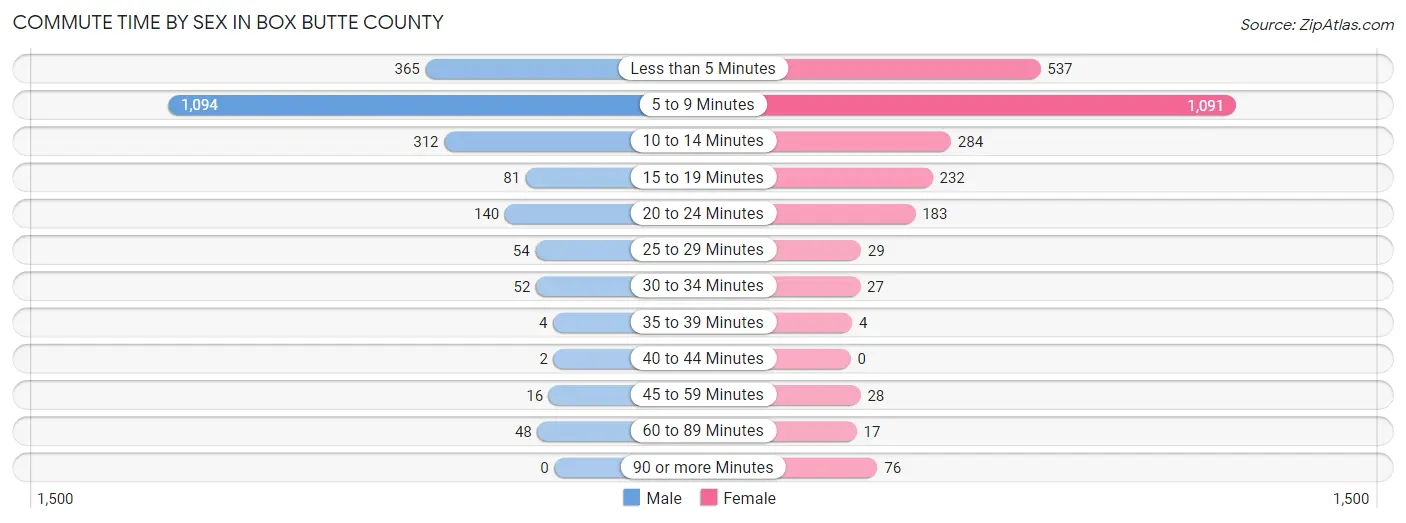
| Commute Time | Male | Female |
| Less than 5 Minutes | 365 (16.8%) | 537 (21.4%) |
| 5 to 9 Minutes | 1,094 (50.5%) | 1,091 (43.5%) |
| 10 to 14 Minutes | 312 (14.4%) | 284 (11.3%) |
| 15 to 19 Minutes | 81 (3.7%) | 232 (9.2%) |
| 20 to 24 Minutes | 140 (6.5%) | 183 (7.3%) |
| 25 to 29 Minutes | 54 (2.5%) | 29 (1.2%) |
| 30 to 34 Minutes | 52 (2.4%) | 27 (1.1%) |
| 35 to 39 Minutes | 4 (0.2%) | 4 (0.2%) |
| 40 to 44 Minutes | 2 (0.1%) | 0 (0.0%) |
| 45 to 59 Minutes | 16 (0.7%) | 28 (1.1%) |
| 60 to 89 Minutes | 48 (2.2%) | 17 (0.7%) |
| 90 or more Minutes | 0 (0.0%) | 76 (3.0%) |
Time of Departure to Work by Sex in Box Butte County
The most frequent times of departure to work in Box Butte County are 6:30 AM to 6:59 AM (369, 17.0%) for males and 7:30 AM to 7:59 AM (551, 22.0%) for females.
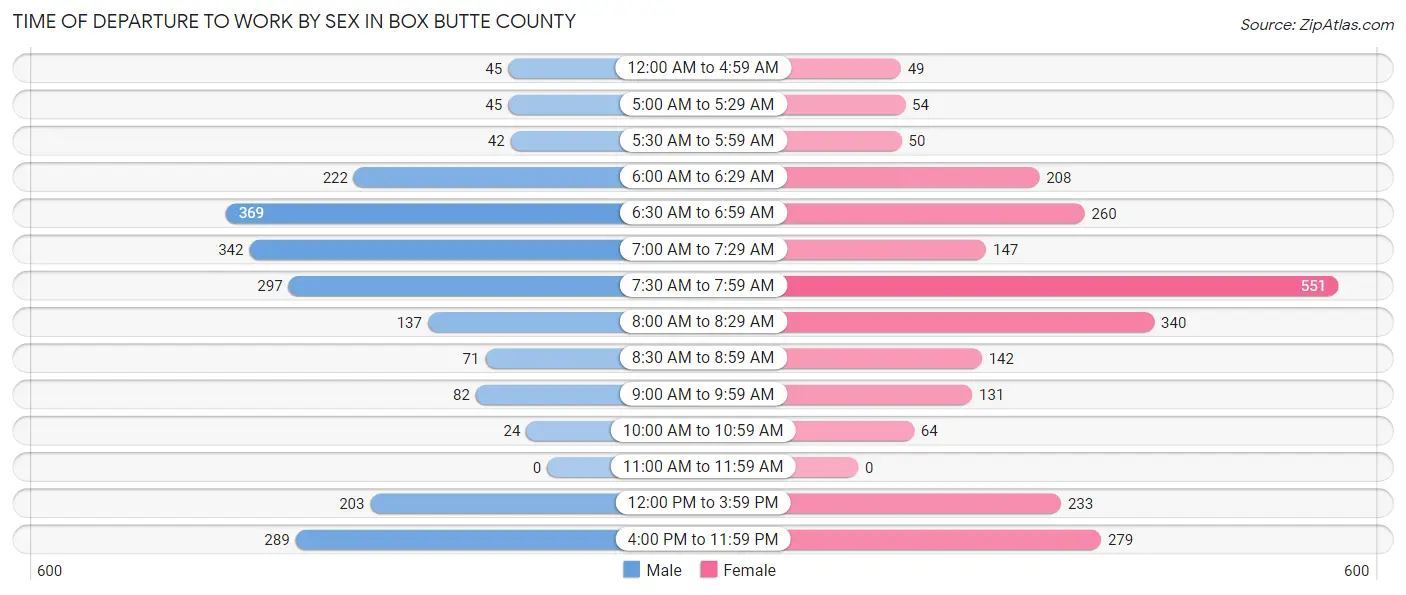
| Time of Departure | Male | Female |
| 12:00 AM to 4:59 AM | 45 (2.1%) | 49 (1.9%) |
| 5:00 AM to 5:29 AM | 45 (2.1%) | 54 (2.1%) |
| 5:30 AM to 5:59 AM | 42 (1.9%) | 50 (2.0%) |
| 6:00 AM to 6:29 AM | 222 (10.2%) | 208 (8.3%) |
| 6:30 AM to 6:59 AM | 369 (17.0%) | 260 (10.4%) |
| 7:00 AM to 7:29 AM | 342 (15.8%) | 147 (5.9%) |
| 7:30 AM to 7:59 AM | 297 (13.7%) | 551 (22.0%) |
| 8:00 AM to 8:29 AM | 137 (6.3%) | 340 (13.6%) |
| 8:30 AM to 8:59 AM | 71 (3.3%) | 142 (5.7%) |
| 9:00 AM to 9:59 AM | 82 (3.8%) | 131 (5.2%) |
| 10:00 AM to 10:59 AM | 24 (1.1%) | 64 (2.5%) |
| 11:00 AM to 11:59 AM | 0 (0.0%) | 0 (0.0%) |
| 12:00 PM to 3:59 PM | 203 (9.4%) | 233 (9.3%) |
| 4:00 PM to 11:59 PM | 289 (13.3%) | 279 (11.1%) |
| Total | 2,168 (100.0%) | 2,508 (100.0%) |
Housing Occupancy in Box Butte County
Occupancy by Ownership in Box Butte County
Of the total 4,573 dwellings in Box Butte County, owner-occupied units account for 3,340 (73.0%), while renter-occupied units make up 1,233 (27.0%).
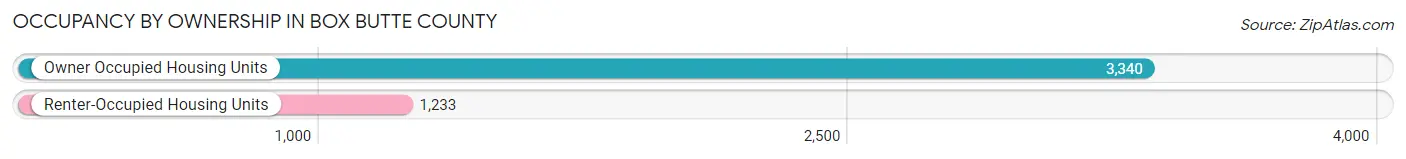
| Occupancy | # Housing Units | % Housing Units |
| Owner Occupied Housing Units | 3,340 | 73.0% |
| Renter-Occupied Housing Units | 1,233 | 27.0% |
| Total Occupied Housing Units | 4,573 | 100.0% |
Occupancy by Household Size in Box Butte County
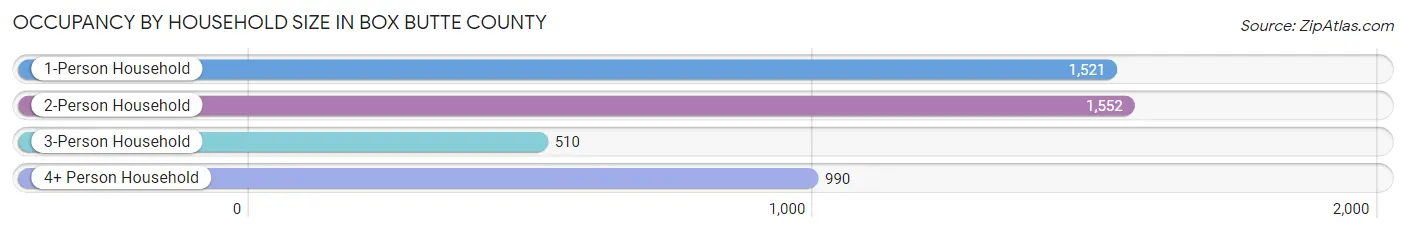
| Household Size | # Housing Units | % Housing Units |
| 1-Person Household | 1,521 | 33.3% |
| 2-Person Household | 1,552 | 33.9% |
| 3-Person Household | 510 | 11.2% |
| 4+ Person Household | 990 | 21.6% |
| Total Housing Units | 4,573 | 100.0% |
Occupancy by Ownership by Household Size in Box Butte County
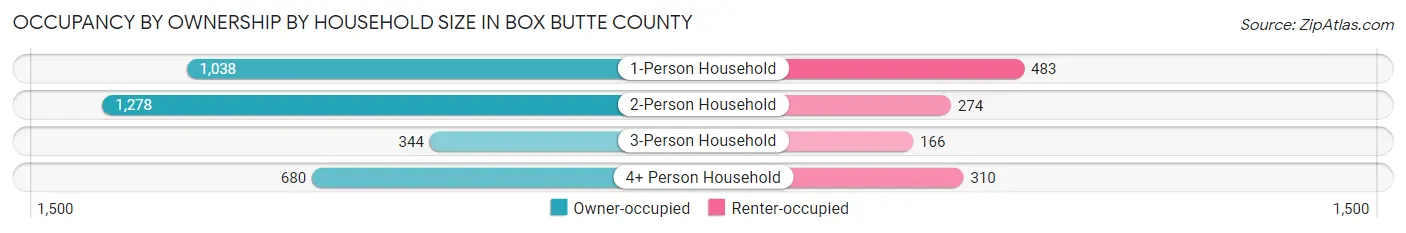
| Household Size | Owner-occupied | Renter-occupied |
| 1-Person Household | 1,038 (68.2%) | 483 (31.8%) |
| 2-Person Household | 1,278 (82.4%) | 274 (17.6%) |
| 3-Person Household | 344 (67.4%) | 166 (32.6%) |
| 4+ Person Household | 680 (68.7%) | 310 (31.3%) |
| Total Housing Units | 3,340 (73.0%) | 1,233 (27.0%) |
Occupancy by Educational Attainment in Box Butte County
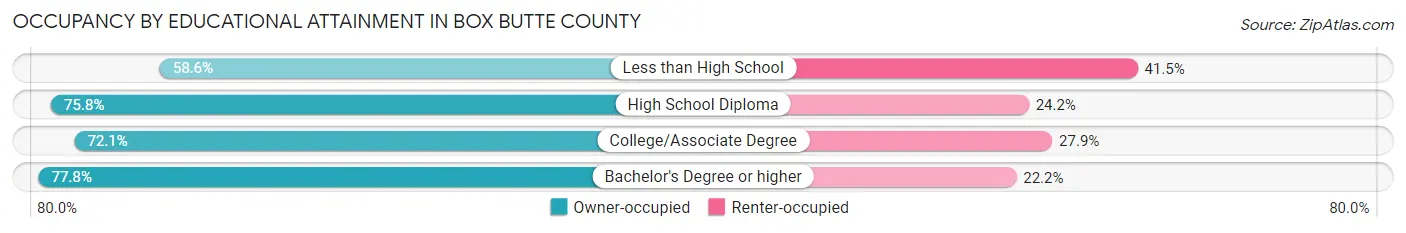
| Household Size | Owner-occupied | Renter-occupied |
| Less than High School | 202 (58.6%) | 143 (41.4%) |
| High School Diploma | 862 (75.8%) | 275 (24.2%) |
| College/Associate Degree | 1,625 (72.1%) | 629 (27.9%) |
| Bachelor's Degree or higher | 651 (77.8%) | 186 (22.2%) |
Occupancy by Age of Householder in Box Butte County
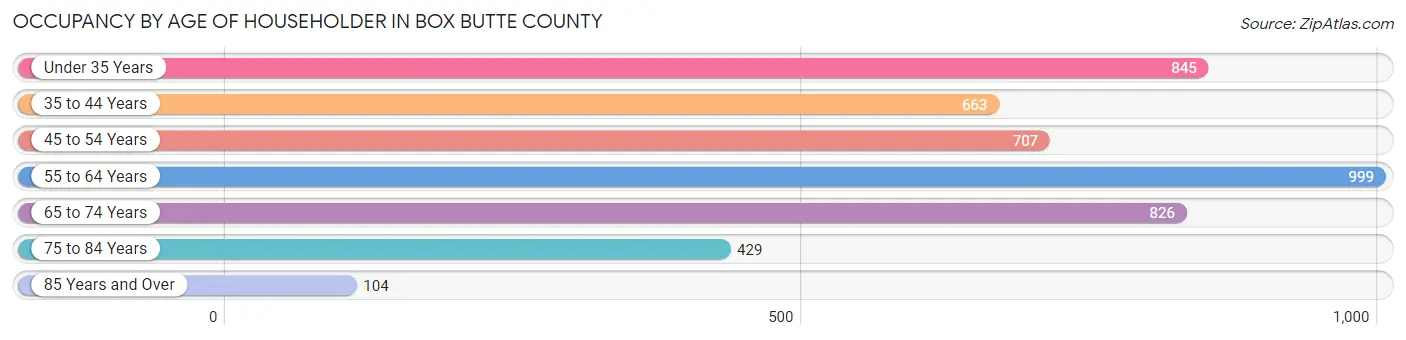
| Age Bracket | # Households | % Households |
| Under 35 Years | 845 | 18.5% |
| 35 to 44 Years | 663 | 14.5% |
| 45 to 54 Years | 707 | 15.5% |
| 55 to 64 Years | 999 | 21.8% |
| 65 to 74 Years | 826 | 18.1% |
| 75 to 84 Years | 429 | 9.4% |
| 85 Years and Over | 104 | 2.3% |
| Total | 4,573 | 100.0% |
Housing Finances in Box Butte County
Median Income by Occupancy in Box Butte County
| Occupancy Type | # Households | Median Income |
| Owner-Occupied | 3,340 (73.0%) | $74,250 |
| Renter-Occupied | 1,233 (27.0%) | $42,294 |
| Average | 4,573 (100.0%) | $67,893 |
Occupancy by Householder Income Bracket in Box Butte County
| Income Bracket | Owner-occupied | Renter-occupied |
| Less than $5,000 | 57 (1.7%) | 4 (0.3%) |
| $5,000 to $9,999 | 246 (7.4%) | 9 (0.7%) |
| $10,000 to $14,999 | 60 (1.8%) | 68 (5.5%) |
| $15,000 to $19,999 | 42 (1.3%) | 109 (8.8%) |
| $20,000 to $24,999 | 113 (3.4%) | 172 (14.0%) |
| $25,000 to $34,999 | 165 (4.9%) | 157 (12.7%) |
| $35,000 to $49,999 | 302 (9.0%) | 174 (14.1%) |
| $50,000 to $74,999 | 700 (21.0%) | 283 (23.0%) |
| $75,000 to $99,999 | 634 (19.0%) | 65 (5.3%) |
| $100,000 to $149,999 | 744 (22.3%) | 181 (14.7%) |
| $150,000 or more | 277 (8.3%) | 11 (0.9%) |
| Total | 3,340 (100.0%) | 1,233 (100.0%) |
Monthly Housing Cost Tiers in Box Butte County
| Monthly Cost | Owner-occupied | Renter-occupied |
| Less than $300 | 82 (2.5%) | 105 (8.5%) |
| $300 to $499 | 476 (14.2%) | 79 (6.4%) |
| $500 to $799 | 882 (26.4%) | 462 (37.5%) |
| $800 to $999 | 475 (14.2%) | 397 (32.2%) |
| $1,000 to $1,499 | 745 (22.3%) | 91 (7.4%) |
| $1,500 to $1,999 | 481 (14.4%) | 20 (1.6%) |
| $2,000 to $2,499 | 152 (4.5%) | 0 (0.0%) |
| $2,500 to $2,999 | 37 (1.1%) | 0 (0.0%) |
| $3,000 or more | 10 (0.3%) | 0 (0.0%) |
| Total | 3,340 (100.0%) | 1,233 (100.0%) |
Physical Housing Characteristics in Box Butte County
Housing Structures in Box Butte County
| Structure Type | # Housing Units | % Housing Units |
| Single Unit, Detached | 3,552 | 77.7% |
| Single Unit, Attached | 99 | 2.2% |
| 2 Unit Apartments | 202 | 4.4% |
| 3 or 4 Unit Apartments | 156 | 3.4% |
| 5 to 9 Unit Apartments | 94 | 2.1% |
| 10 or more Apartments | 260 | 5.7% |
| Mobile Home / Other | 210 | 4.6% |
| Total | 4,573 | 100.0% |
Housing Structures by Occupancy in Box Butte County
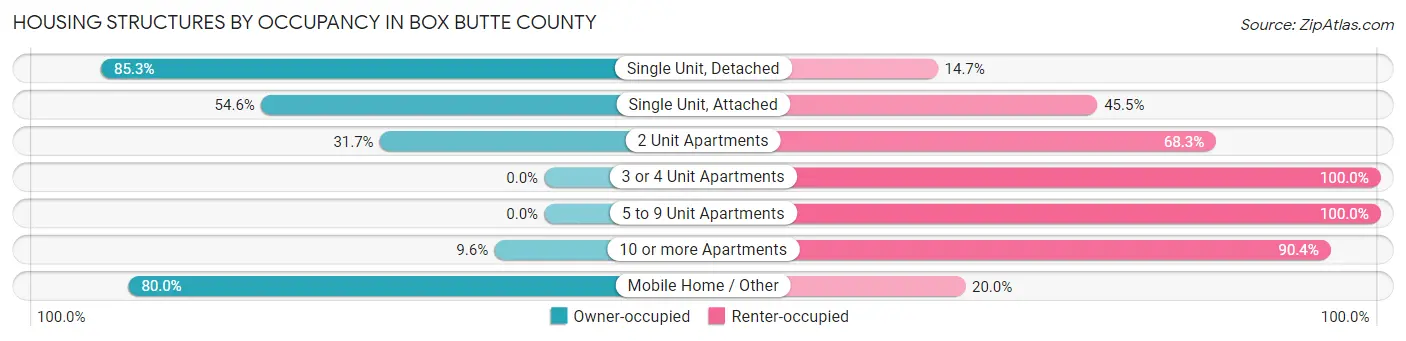
| Structure Type | Owner-occupied | Renter-occupied |
| Single Unit, Detached | 3,029 (85.3%) | 523 (14.7%) |
| Single Unit, Attached | 54 (54.5%) | 45 (45.5%) |
| 2 Unit Apartments | 64 (31.7%) | 138 (68.3%) |
| 3 or 4 Unit Apartments | 0 (0.0%) | 156 (100.0%) |
| 5 to 9 Unit Apartments | 0 (0.0%) | 94 (100.0%) |
| 10 or more Apartments | 25 (9.6%) | 235 (90.4%) |
| Mobile Home / Other | 168 (80.0%) | 42 (20.0%) |
| Total | 3,340 (73.0%) | 1,233 (27.0%) |
Housing Structures by Number of Rooms in Box Butte County
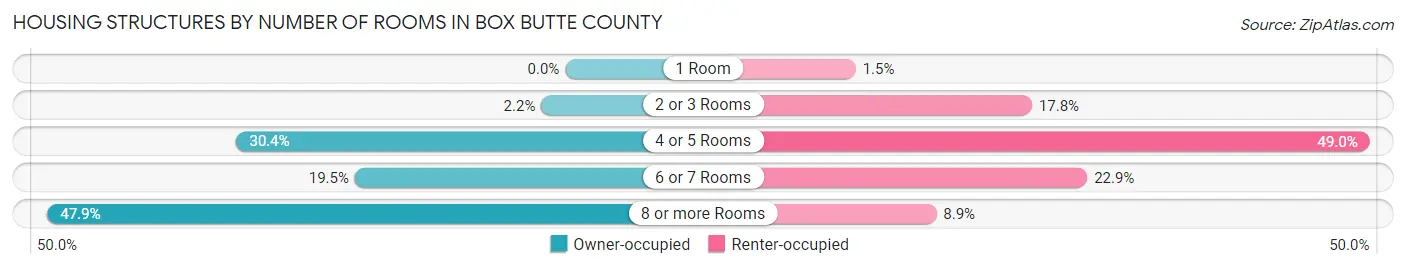
| Number of Rooms | Owner-occupied | Renter-occupied |
| 1 Room | 0 (0.0%) | 18 (1.5%) |
| 2 or 3 Rooms | 74 (2.2%) | 219 (17.8%) |
| 4 or 5 Rooms | 1,016 (30.4%) | 604 (49.0%) |
| 6 or 7 Rooms | 650 (19.5%) | 282 (22.9%) |
| 8 or more Rooms | 1,600 (47.9%) | 110 (8.9%) |
| Total | 3,340 (100.0%) | 1,233 (100.0%) |
Housing Structure by Heating Type in Box Butte County
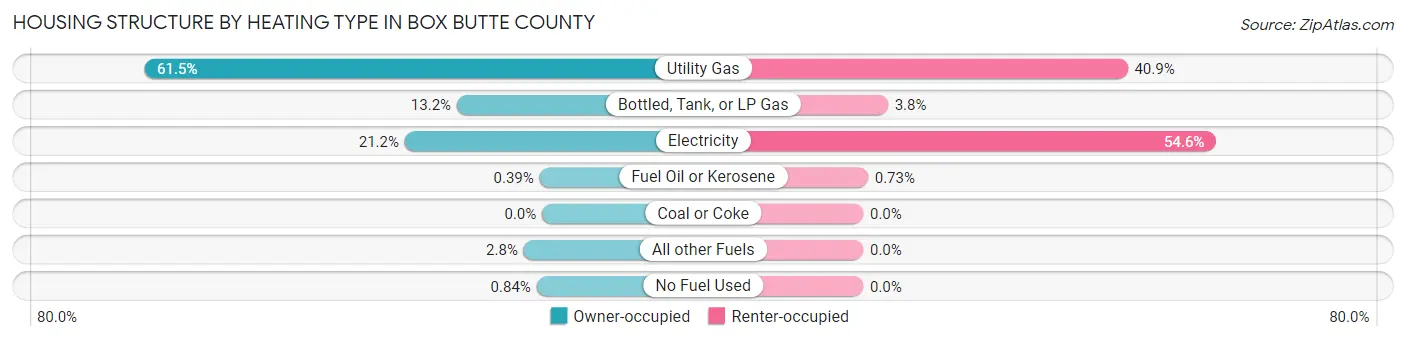
| Heating Type | Owner-occupied | Renter-occupied |
| Utility Gas | 2,055 (61.5%) | 504 (40.9%) |
| Bottled, Tank, or LP Gas | 440 (13.2%) | 47 (3.8%) |
| Electricity | 709 (21.2%) | 673 (54.6%) |
| Fuel Oil or Kerosene | 13 (0.4%) | 9 (0.7%) |
| Coal or Coke | 0 (0.0%) | 0 (0.0%) |
| All other Fuels | 95 (2.8%) | 0 (0.0%) |
| No Fuel Used | 28 (0.8%) | 0 (0.0%) |
| Total | 3,340 (100.0%) | 1,233 (100.0%) |
Household Vehicle Usage in Box Butte County
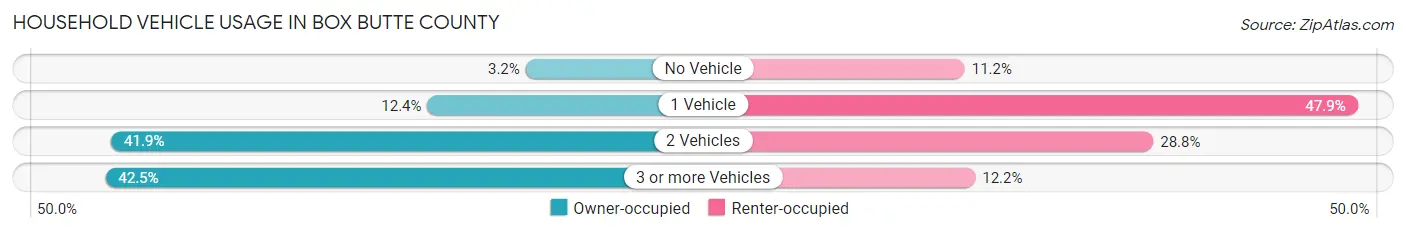
| Vehicles per Household | Owner-occupied | Renter-occupied |
| No Vehicle | 108 (3.2%) | 138 (11.2%) |
| 1 Vehicle | 414 (12.4%) | 590 (47.8%) |
| 2 Vehicles | 1,400 (41.9%) | 355 (28.8%) |
| 3 or more Vehicles | 1,418 (42.5%) | 150 (12.2%) |
| Total | 3,340 (100.0%) | 1,233 (100.0%) |
Real Estate & Mortgages in Box Butte County
Real Estate and Mortgage Overview in Box Butte County
| Characteristic | Without Mortgage | With Mortgage |
| Housing Units | 1,774 | 1,566 |
| Median Property Value | $150,200 | $171,700 |
| Median Household Income | $68,346 | $193 |
| Monthly Housing Costs | $642 | $10 |
| Real Estate Taxes | $2,370 | $93 |
Property Value by Mortgage Status in Box Butte County
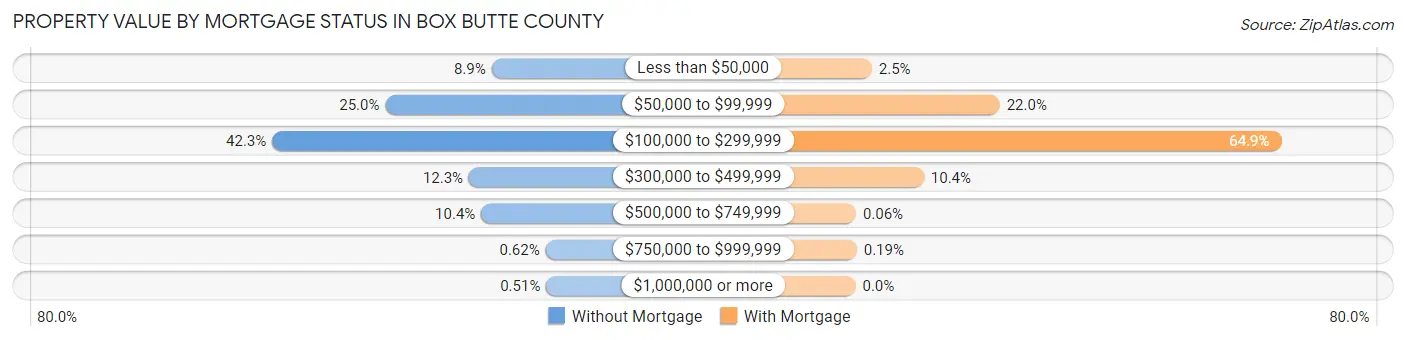
| Property Value | Without Mortgage | With Mortgage |
| Less than $50,000 | 157 (8.8%) | 39 (2.5%) |
| $50,000 to $99,999 | 444 (25.0%) | 344 (22.0%) |
| $100,000 to $299,999 | 750 (42.3%) | 1,016 (64.9%) |
| $300,000 to $499,999 | 218 (12.3%) | 163 (10.4%) |
| $500,000 to $749,999 | 185 (10.4%) | 1 (0.1%) |
| $750,000 to $999,999 | 11 (0.6%) | 3 (0.2%) |
| $1,000,000 or more | 9 (0.5%) | 0 (0.0%) |
| Total | 1,774 (100.0%) | 1,566 (100.0%) |
Household Income by Mortgage Status in Box Butte County
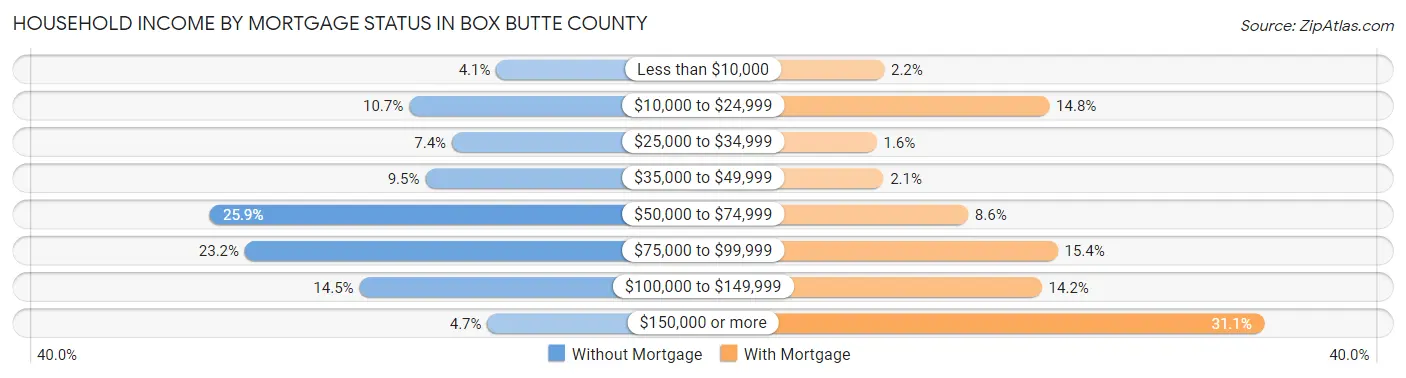
| Household Income | Without Mortgage | With Mortgage |
| Less than $10,000 | 72 (4.1%) | 34 (2.2%) |
| $10,000 to $24,999 | 190 (10.7%) | 231 (14.7%) |
| $25,000 to $34,999 | 132 (7.4%) | 25 (1.6%) |
| $35,000 to $49,999 | 168 (9.5%) | 33 (2.1%) |
| $50,000 to $74,999 | 459 (25.9%) | 134 (8.6%) |
| $75,000 to $99,999 | 412 (23.2%) | 241 (15.4%) |
| $100,000 to $149,999 | 257 (14.5%) | 222 (14.2%) |
| $150,000 or more | 84 (4.7%) | 487 (31.1%) |
| Total | 1,774 (100.0%) | 1,566 (100.0%) |
Property Value to Household Income Ratio in Box Butte County
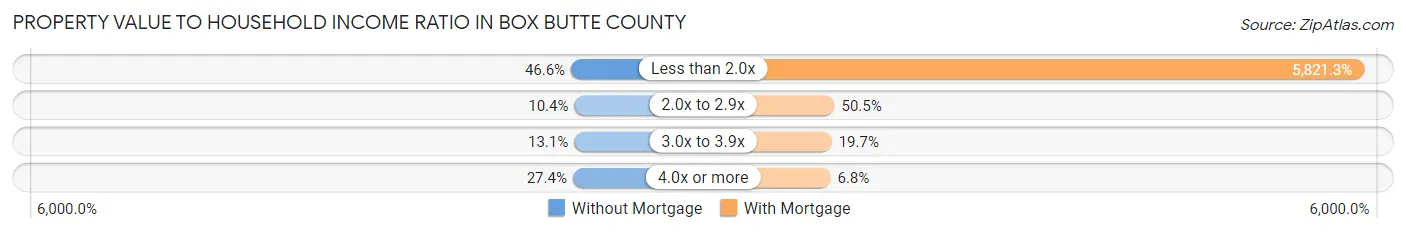
| Value-to-Income Ratio | Without Mortgage | With Mortgage |
| Less than 2.0x | 827 (46.6%) | 91,161 (5,821.3%) |
| 2.0x to 2.9x | 184 (10.4%) | 791 (50.5%) |
| 3.0x to 3.9x | 233 (13.1%) | 308 (19.7%) |
| 4.0x or more | 486 (27.4%) | 106 (6.8%) |
| Total | 1,774 (100.0%) | 1,566 (100.0%) |
Real Estate Taxes by Mortgage Status in Box Butte County
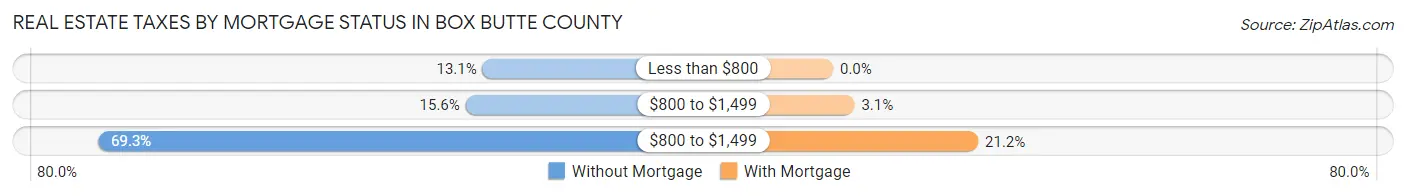
| Property Taxes | Without Mortgage | With Mortgage |
| Less than $800 | 232 (13.1%) | 0 (0.0%) |
| $800 to $1,499 | 276 (15.6%) | 49 (3.1%) |
| $800 to $1,499 | 1,229 (69.3%) | 332 (21.2%) |
| Total | 1,774 (100.0%) | 1,566 (100.0%) |
Health & Disability in Box Butte County
Health Insurance Coverage by Age in Box Butte County
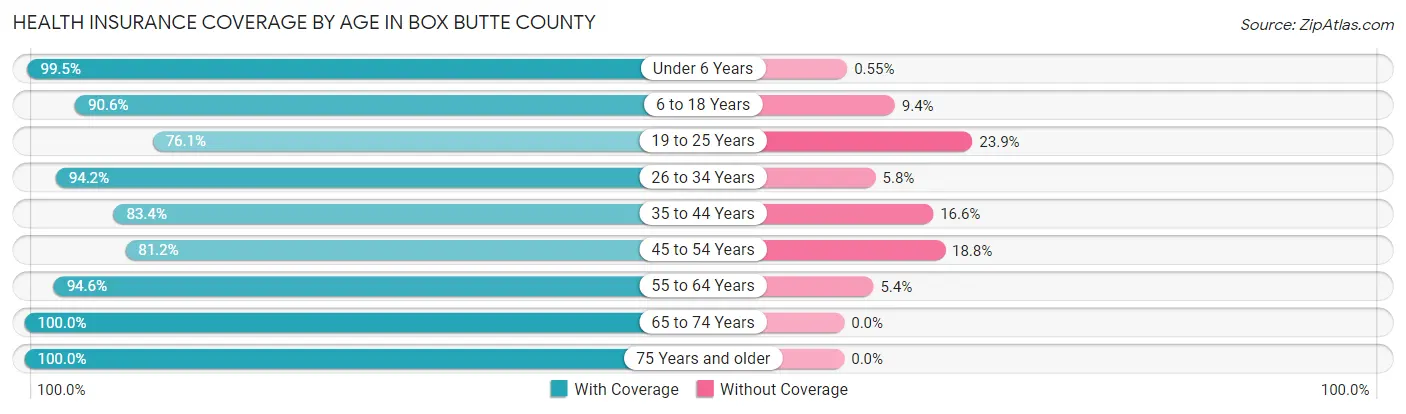
| Age Bracket | With Coverage | Without Coverage |
| Under 6 Years | 719 (99.5%) | 4 (0.5%) |
| 6 to 18 Years | 1,988 (90.6%) | 207 (9.4%) |
| 19 to 25 Years | 462 (76.1%) | 145 (23.9%) |
| 26 to 34 Years | 1,112 (94.2%) | 69 (5.8%) |
| 35 to 44 Years | 926 (83.4%) | 184 (16.6%) |
| 45 to 54 Years | 1,020 (81.2%) | 236 (18.8%) |
| 55 to 64 Years | 1,494 (94.6%) | 86 (5.4%) |
| 65 to 74 Years | 1,226 (100.0%) | 0 (0.0%) |
| 75 Years and older | 738 (100.0%) | 0 (0.0%) |
| Total | 9,685 (91.2%) | 931 (8.8%) |
Health Insurance Coverage by Citizenship Status in Box Butte County
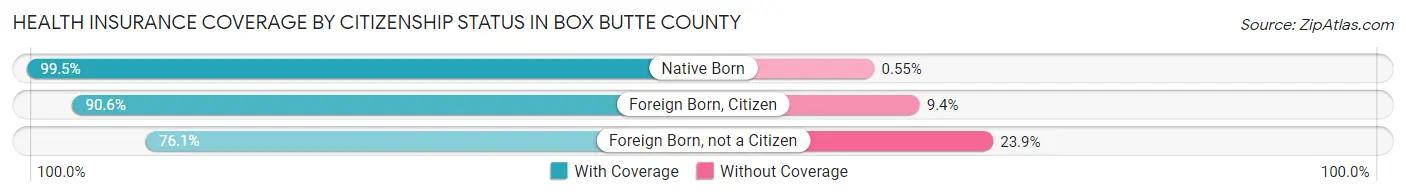
| Citizenship Status | With Coverage | Without Coverage |
| Native Born | 719 (99.5%) | 4 (0.5%) |
| Foreign Born, Citizen | 1,988 (90.6%) | 207 (9.4%) |
| Foreign Born, not a Citizen | 462 (76.1%) | 145 (23.9%) |
Health Insurance Coverage by Household Income in Box Butte County
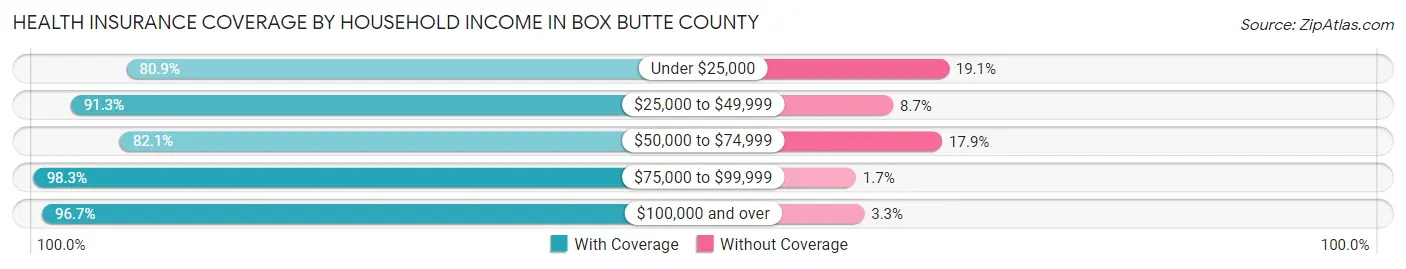
| Household Income | With Coverage | Without Coverage |
| Under $25,000 | 1,105 (80.9%) | 261 (19.1%) |
| $25,000 to $49,999 | 1,138 (91.3%) | 108 (8.7%) |
| $50,000 to $74,999 | 1,815 (82.1%) | 395 (17.9%) |
| $75,000 to $99,999 | 2,189 (98.3%) | 38 (1.7%) |
| $100,000 and over | 3,416 (96.7%) | 116 (3.3%) |
Public vs Private Health Insurance Coverage by Age in Box Butte County
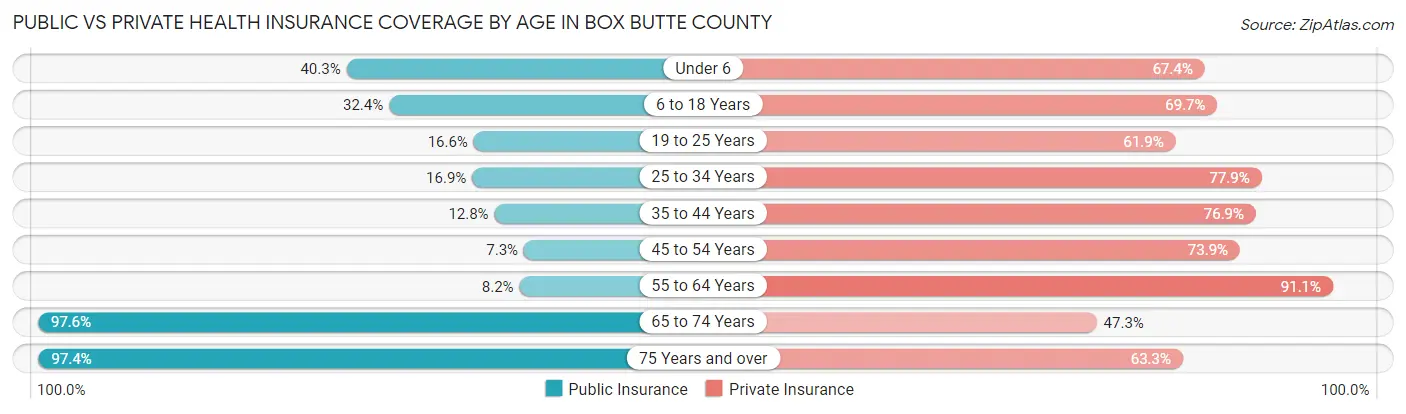
| Age Bracket | Public Insurance | Private Insurance |
| Under 6 | 291 (40.3%) | 487 (67.4%) |
| 6 to 18 Years | 710 (32.4%) | 1,530 (69.7%) |
| 19 to 25 Years | 101 (16.6%) | 376 (61.9%) |
| 25 to 34 Years | 200 (16.9%) | 920 (77.9%) |
| 35 to 44 Years | 142 (12.8%) | 853 (76.8%) |
| 45 to 54 Years | 92 (7.3%) | 928 (73.9%) |
| 55 to 64 Years | 129 (8.2%) | 1,440 (91.1%) |
| 65 to 74 Years | 1,196 (97.6%) | 580 (47.3%) |
| 75 Years and over | 719 (97.4%) | 467 (63.3%) |
| Total | 3,580 (33.7%) | 7,581 (71.4%) |
Disability Status by Sex by Age in Box Butte County
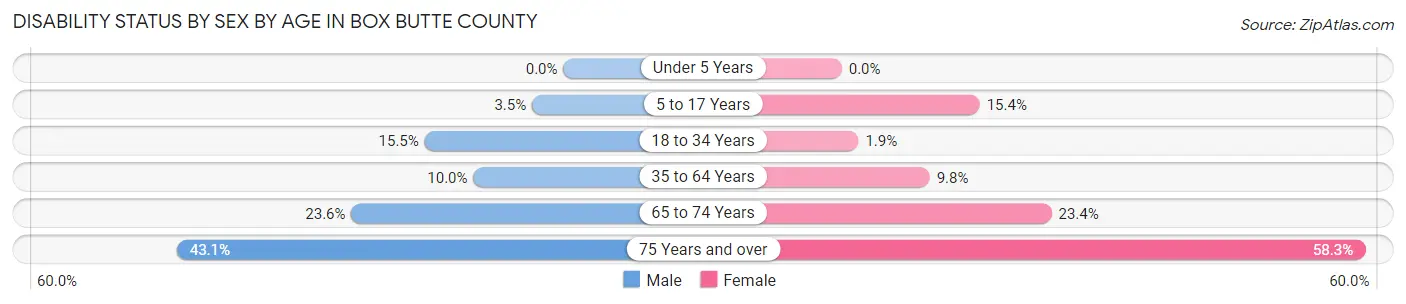
| Age Bracket | Male | Female |
| Under 5 Years | 0 (0.0%) | 0 (0.0%) |
| 5 to 17 Years | 44 (3.5%) | 131 (15.4%) |
| 18 to 34 Years | 157 (15.4%) | 18 (1.9%) |
| 35 to 64 Years | 200 (10.0%) | 191 (9.8%) |
| 65 to 74 Years | 149 (23.6%) | 139 (23.4%) |
| 75 Years and over | 130 (43.0%) | 254 (58.3%) |
Disability Class by Sex by Age in Box Butte County
Disability Class: Hearing Difficulty
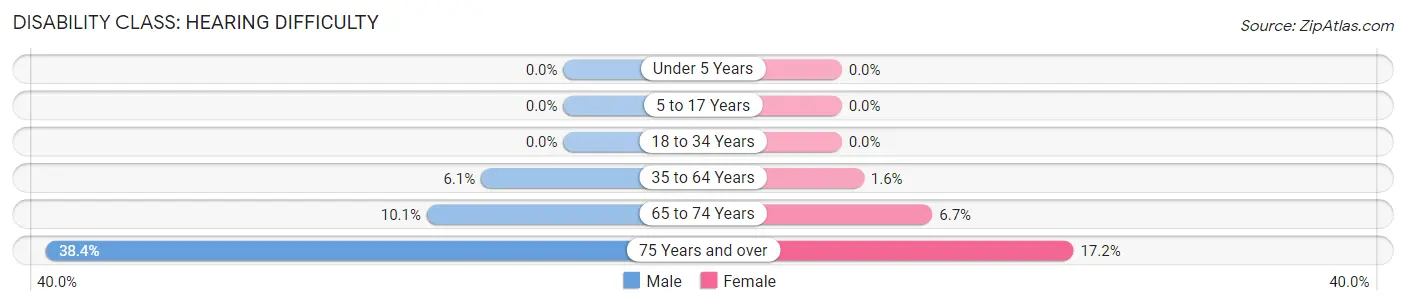
| Age Bracket | Male | Female |
| Under 5 Years | 0 (0.0%) | 0 (0.0%) |
| 5 to 17 Years | 0 (0.0%) | 0 (0.0%) |
| 18 to 34 Years | 0 (0.0%) | 0 (0.0%) |
| 35 to 64 Years | 122 (6.1%) | 32 (1.6%) |
| 65 to 74 Years | 64 (10.1%) | 40 (6.7%) |
| 75 Years and over | 116 (38.4%) | 75 (17.2%) |
Disability Class: Vision Difficulty
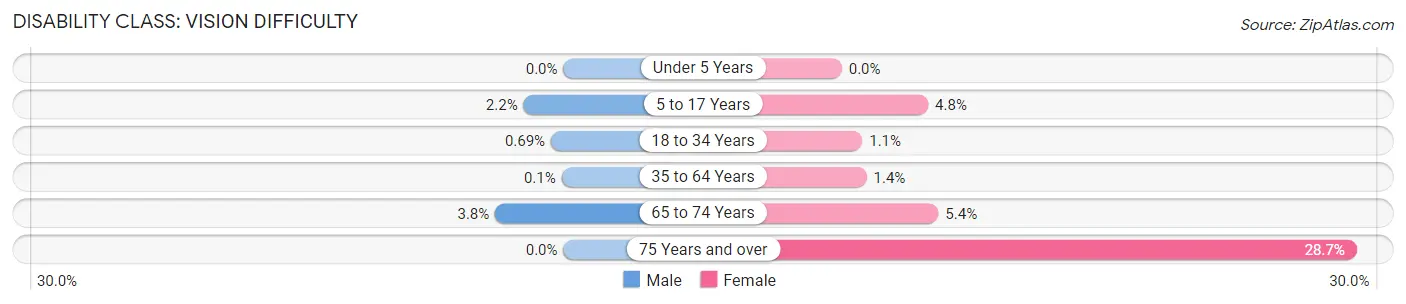
| Age Bracket | Male | Female |
| Under 5 Years | 0 (0.0%) | 0 (0.0%) |
| 5 to 17 Years | 28 (2.2%) | 41 (4.8%) |
| 18 to 34 Years | 7 (0.7%) | 11 (1.1%) |
| 35 to 64 Years | 2 (0.1%) | 27 (1.4%) |
| 65 to 74 Years | 24 (3.8%) | 32 (5.4%) |
| 75 Years and over | 0 (0.0%) | 125 (28.7%) |
Disability Class: Cognitive Difficulty
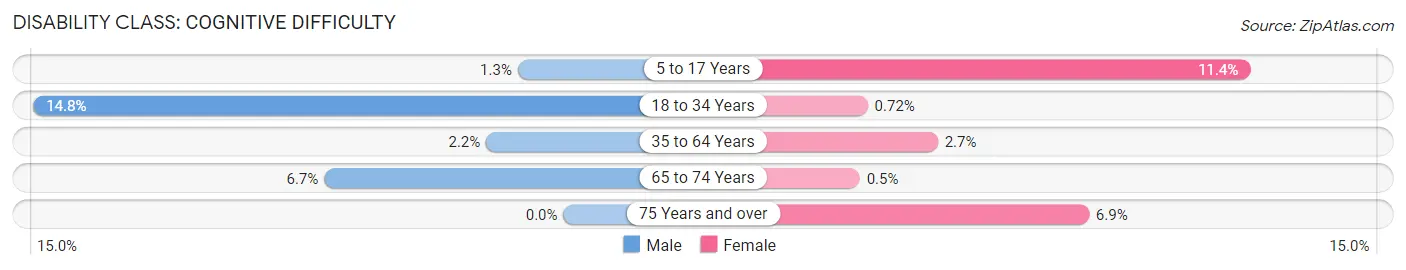
| Age Bracket | Male | Female |
| 5 to 17 Years | 16 (1.3%) | 97 (11.4%) |
| 18 to 34 Years | 150 (14.8%) | 7 (0.7%) |
| 35 to 64 Years | 43 (2.1%) | 52 (2.7%) |
| 65 to 74 Years | 42 (6.7%) | 3 (0.5%) |
| 75 Years and over | 0 (0.0%) | 30 (6.9%) |
Disability Class: Ambulatory Difficulty
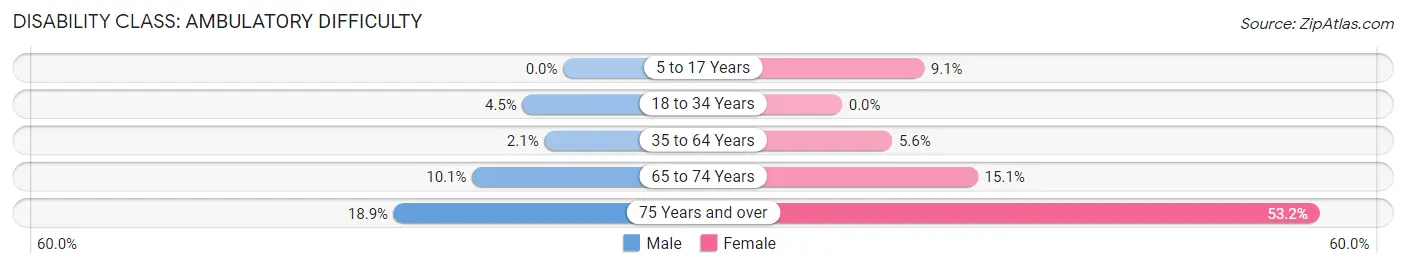
| Age Bracket | Male | Female |
| 5 to 17 Years | 0 (0.0%) | 78 (9.1%) |
| 18 to 34 Years | 46 (4.5%) | 0 (0.0%) |
| 35 to 64 Years | 42 (2.1%) | 109 (5.6%) |
| 65 to 74 Years | 64 (10.1%) | 90 (15.1%) |
| 75 Years and over | 57 (18.9%) | 232 (53.2%) |
Disability Class: Self-Care Difficulty
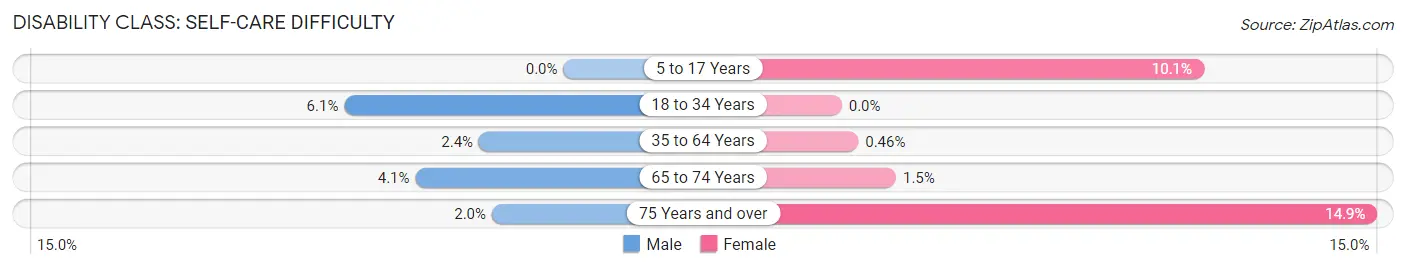
| Age Bracket | Male | Female |
| 5 to 17 Years | 0 (0.0%) | 86 (10.1%) |
| 18 to 34 Years | 62 (6.1%) | 0 (0.0%) |
| 35 to 64 Years | 47 (2.4%) | 9 (0.5%) |
| 65 to 74 Years | 26 (4.1%) | 9 (1.5%) |
| 75 Years and over | 6 (2.0%) | 65 (14.9%) |
Technology Access in Box Butte County
Computing Device Access in Box Butte County
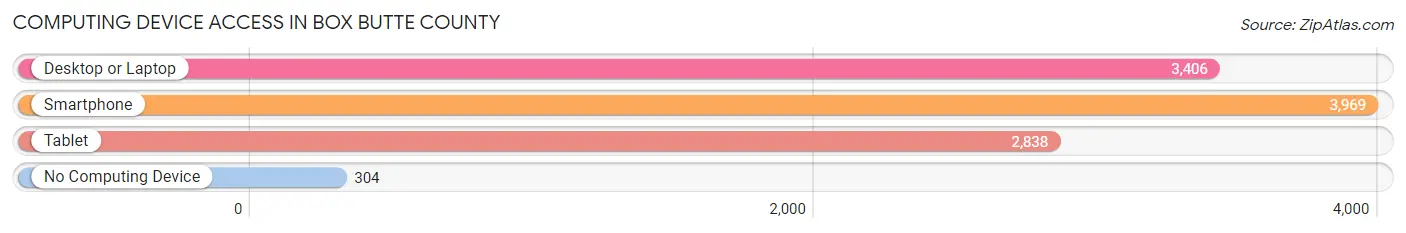
| Device Type | # Households | % Households |
| Desktop or Laptop | 3,406 | 74.5% |
| Smartphone | 3,969 | 86.8% |
| Tablet | 2,838 | 62.1% |
| No Computing Device | 304 | 6.7% |
| Total | 4,573 | 100.0% |
Internet Access in Box Butte County
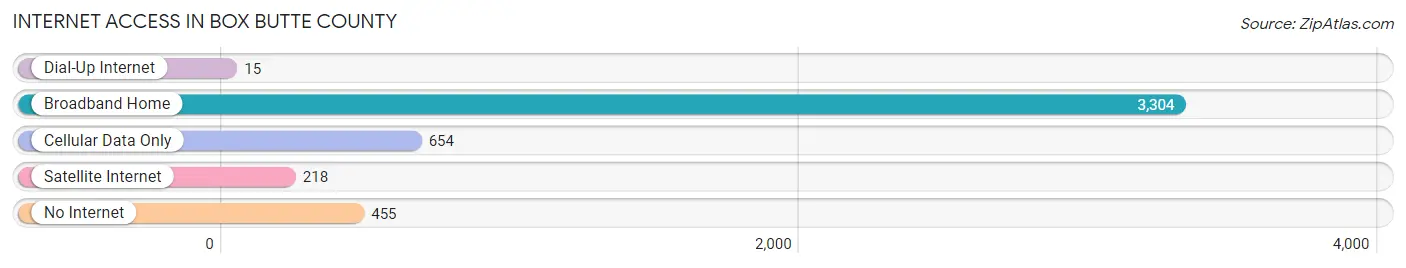
| Internet Type | # Households | % Households |
| Dial-Up Internet | 15 | 0.3% |
| Broadband Home | 3,304 | 72.3% |
| Cellular Data Only | 654 | 14.3% |
| Satellite Internet | 218 | 4.8% |
| No Internet | 455 | 10.0% |
| Total | 4,573 | 100.0% |
Box Butte County Summary
Butte County is located in the state of Nebraska, in the Midwestern United States. It is bordered by Sioux County to the north, Dawes County to the east, Sheridan County to the south, and Box Elder County, Wyoming to the west. The county seat is Alliance, and the largest city is Hemingford. The county was named after the Butte Mountains, which are located in the area.
Geography
Butte County covers an area of 1,845 square miles, making it the fourth-largest county in Nebraska. The county is located in the Sandhills region of the state, and is mostly flat with rolling hills. The terrain is mostly grassland, with some areas of sandhills and sagebrush. The county is drained by the North Platte River, which flows through the county from north to south.
The county has a semi-arid climate, with hot summers and cold winters. The average annual precipitation is around 17 inches, with most of it falling in the spring and summer months.
Demographics
As of the 2010 census, Butte County had a population of 9,845. The racial makeup of the county was 95.2% White, 0.3% African American, 0.7% Native American, 0.3% Asian, 0.1% Pacific Islander, 2.2% from other races, and 1.2% from two or more races. Hispanic or Latino of any race were 4.3% of the population.
The median income for a household in the county was $37,945, and the median income for a family was $45,938. The per capita income for the county was $18,945. About 11.2% of families and 14.2% of the population were below the poverty line, including 19.2% of those under age 18 and 8.2% of those age 65 or over.
Economy
The economy of Butte County is largely based on agriculture. The county is home to several large farms, which produce a variety of crops, including corn, wheat, soybeans, and alfalfa. Cattle ranching is also an important part of the local economy.
The county is also home to several small businesses, including restaurants, retail stores, and service providers. The county is served by two hospitals, and there are several schools in the area.
The county is served by two airports, Alliance Municipal Airport and Hemingford Municipal Airport. The county is also served by several highways, including Interstate 80, U.S. Route 20, and Nebraska Highway 2.
Conclusion
Butte County is a rural county located in the state of Nebraska. It is home to a population of just under 10,000 people, and is largely dependent on agriculture for its economy. The county is served by two airports, several highways, and several small businesses. The county is also home to several schools and hospitals.
Common Questions
What is the Total Population of Box Butte County?
Total Population of Box Butte County is 10,778.
What is the Total Male Population of Box Butte County?
Total Male Population of Box Butte County is 5,486.
What is the Total Female Population of Box Butte County?
Total Female Population of Box Butte County is 5,292.
What is the Ratio of Males per 100 Females in Box Butte County?
There are 103.67 Males per 100 Females in Box Butte County.
What is the Ratio of Females per 100 Males in Box Butte County?
There are 96.46 Females per 100 Males in Box Butte County.
What is the Median Population Age in Box Butte County?
Median Population Age in Box Butte County is 40.9 Years.
What is the Average Family Size in Box Butte County
Average Family Size in Box Butte County is 2.9 People.
What is the Average Household Size in Box Butte County
Average Household Size in Box Butte County is 2.3 People.
What is Per Capita Income in Box Butte County?
Per Capita income in Box Butte County is $32,141.
What is the Median Family Income in Box Butte County?
Median Family Income in Box Butte County is $72,703.
What is the Median Household income in Box Butte County?
Median Household Income in Box Butte County is $67,893.
What is Income or Wage Gap in Box Butte County?
Income or Wage Gap in Box Butte County is 38.0%.
Women in Box Butte County earn 62.0 cents for every dollar earned by a man.
What is Inequality or Gini Index in Box Butte County?
Inequality or Gini Index in Box Butte County is 0.38.
How Large is the Labor Force in Box Butte County?
There are 5,461 People in the Labor Forcein in Box Butte County.
What is the Percentage of People in the Labor Force in Box Butte County?
65.6% of People are in the Labor Force in Box Butte County.
What is the Unemployment Rate in Box Butte County?
Unemployment Rate in Box Butte County is 4.0%.