Washington, NC
Washington Map
Washington Overview
9,759
TOTAL POPULATION
4,561
MALE POPULATION
5,198
FEMALE POPULATION
87.75
MALES / 100 FEMALES
113.97
FEMALES / 100 MALES
46.2
MEDIAN AGE
2.9
AVG FAMILY SIZE
2.1
AVG HOUSEHOLD SIZE
$31,110
PER CAPITA INCOME
$62,813
AVG FAMILY INCOME
$42,821
AVG HOUSEHOLD INCOME
4.6%
WAGE / INCOME GAP [ % ]
95.4¢/ $1
WAGE / INCOME GAP [ $ ]
$11,479
FAMILY INCOME DEFICIT
0.54
INEQUALITY / GINI INDEX
4,042
LABOR FORCE [ PEOPLE ]
51.6%
PERCENT IN LABOR FORCE
5.6%
UNEMPLOYMENT RATE
Washington Zip Codes
Washington Area Codes
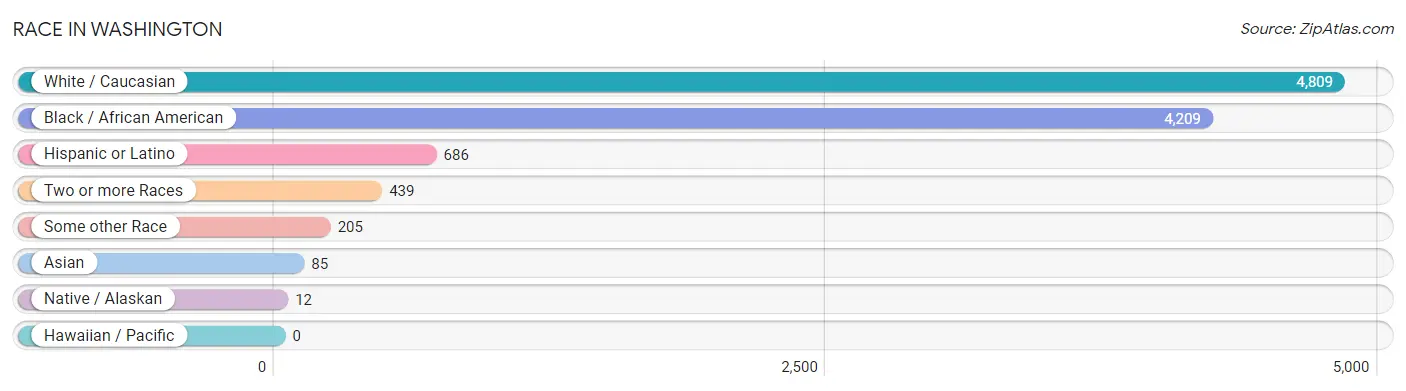
Race in Washington
The most populous races in Washington are White / Caucasian (4,809 | 49.3%), Black / African American (4,209 | 43.1%), and Hispanic or Latino (686 | 7.0%).
| Race | # Population | % Population |
| Asian | 85 | 0.9% |
| Black / African American | 4,209 | 43.1% |
| Hawaiian / Pacific | 0 | 0.0% |
| Hispanic or Latino | 686 | 7.0% |
| Native / Alaskan | 12 | 0.1% |
| White / Caucasian | 4,809 | 49.3% |
| Two or more Races | 439 | 4.5% |
| Some other Race | 205 | 2.1% |
| Total | 9,759 | 100.0% |
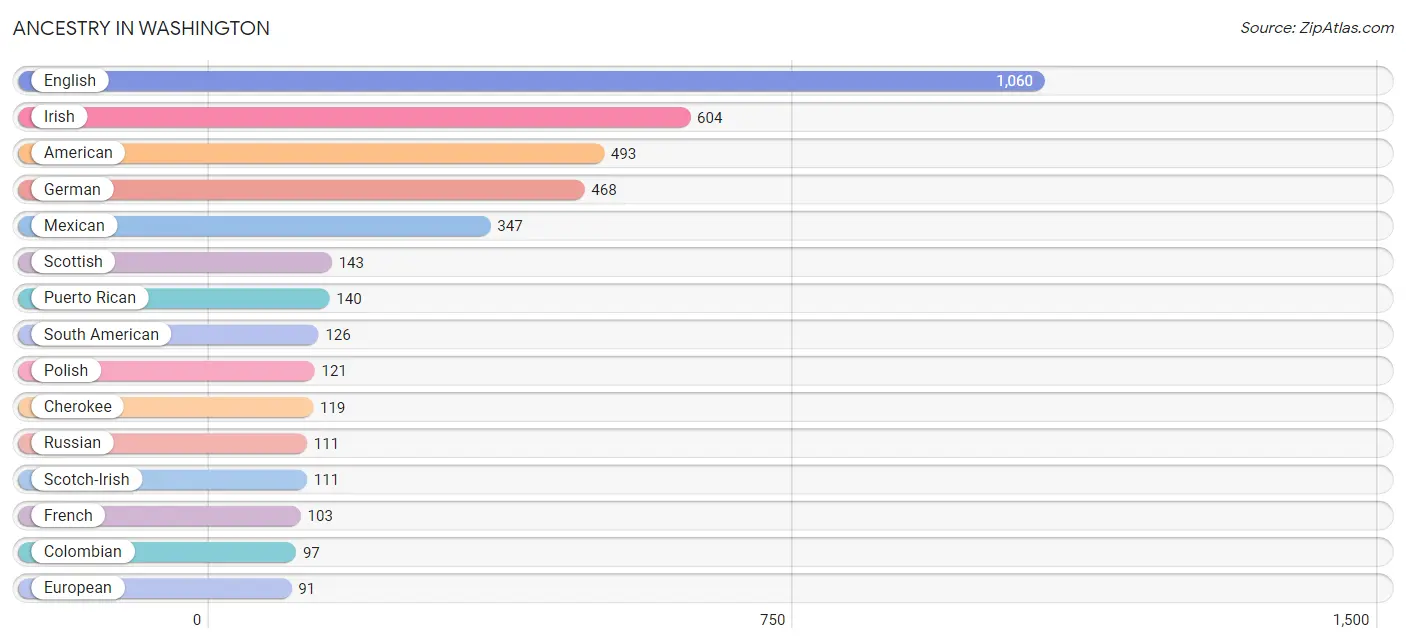
Ancestry in Washington
The most populous ancestries reported in Washington are English (1,060 | 10.9%), Irish (604 | 6.2%), American (493 | 5.1%), German (468 | 4.8%), and Mexican (347 | 3.6%), together accounting for 30.5% of all Washington residents.
| Ancestry | # Population | % Population |
| African | 46 | 0.5% |
| American | 493 | 5.1% |
| Austrian | 9 | 0.1% |
| British | 20 | 0.2% |
| British West Indian | 15 | 0.2% |
| Canadian | 14 | 0.1% |
| Central American | 24 | 0.3% |
| Cherokee | 119 | 1.2% |
| Colombian | 97 | 1.0% |
| Cuban | 15 | 0.2% |
| Dutch | 63 | 0.6% |
| English | 1,060 | 10.9% |
| European | 91 | 0.9% |
| French | 103 | 1.1% |
| German | 468 | 4.8% |
| Honduran | 24 | 0.3% |
| Hungarian | 9 | 0.1% |
| Irish | 604 | 6.2% |
| Italian | 30 | 0.3% |
| Jamaican | 34 | 0.4% |
| Lithuanian | 15 | 0.2% |
| Lumbee | 6 | 0.1% |
| Mexican | 347 | 3.6% |
| Peruvian | 29 | 0.3% |
| Polish | 121 | 1.2% |
| Portuguese | 20 | 0.2% |
| Puerto Rican | 140 | 1.4% |
| Russian | 111 | 1.1% |
| Scandinavian | 8 | 0.1% |
| Scotch-Irish | 111 | 1.1% |
| Scottish | 143 | 1.5% |
| South American | 126 | 1.3% |
| Sri Lankan | 85 | 0.9% |
| Subsaharan African | 46 | 0.5% |
| Swedish | 34 | 0.4% |
| Swiss | 9 | 0.1% |
| Thai | 23 | 0.2% |
| Welsh | 43 | 0.4% | View All 38 Rows |
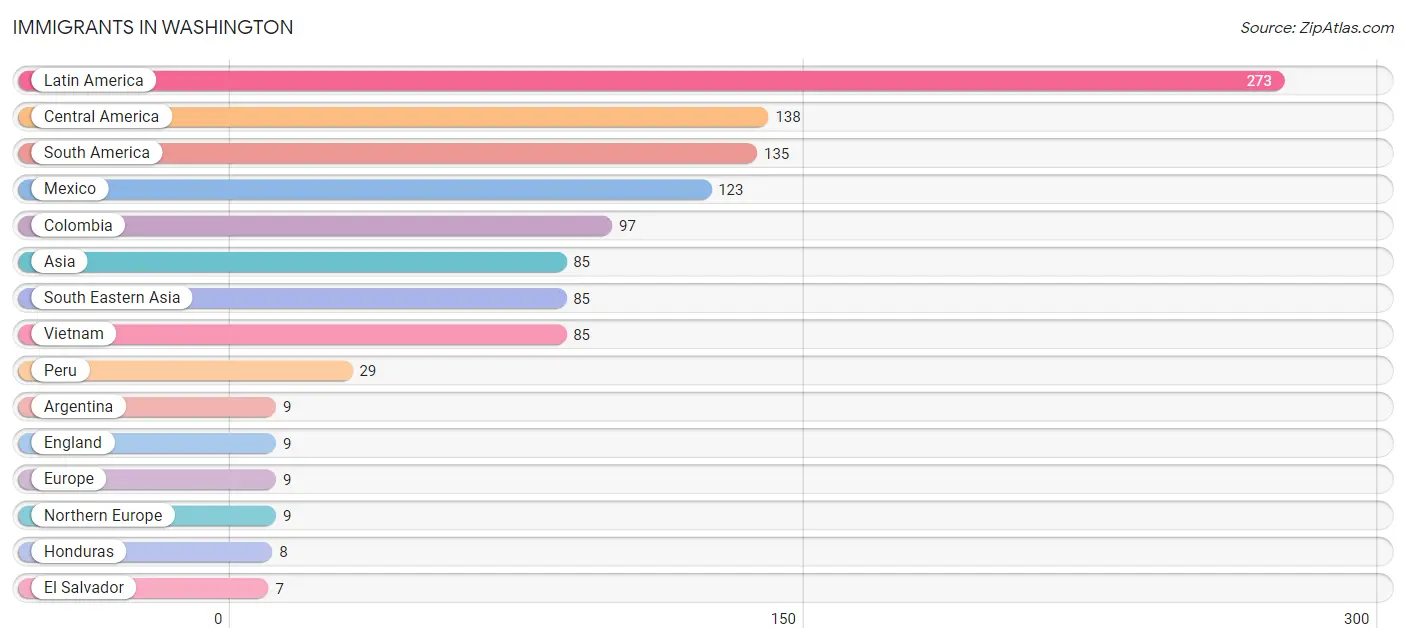
Immigrants in Washington
The most numerous immigrant groups reported in Washington came from Latin America (273 | 2.8%), Central America (138 | 1.4%), South America (135 | 1.4%), Mexico (123 | 1.3%), and Colombia (97 | 1.0%), together accounting for 7.8% of all Washington residents.
| Immigration Origin | # Population | % Population |
| Argentina | 9 | 0.1% |
| Asia | 85 | 0.9% |
| Central America | 138 | 1.4% |
| Colombia | 97 | 1.0% |
| El Salvador | 7 | 0.1% |
| England | 9 | 0.1% |
| Europe | 9 | 0.1% |
| Honduras | 8 | 0.1% |
| Latin America | 273 | 2.8% |
| Mexico | 123 | 1.3% |
| Northern Europe | 9 | 0.1% |
| Peru | 29 | 0.3% |
| South America | 135 | 1.4% |
| South Eastern Asia | 85 | 0.9% |
| Vietnam | 85 | 0.9% | View All 15 Rows |
Sex and Age in Washington
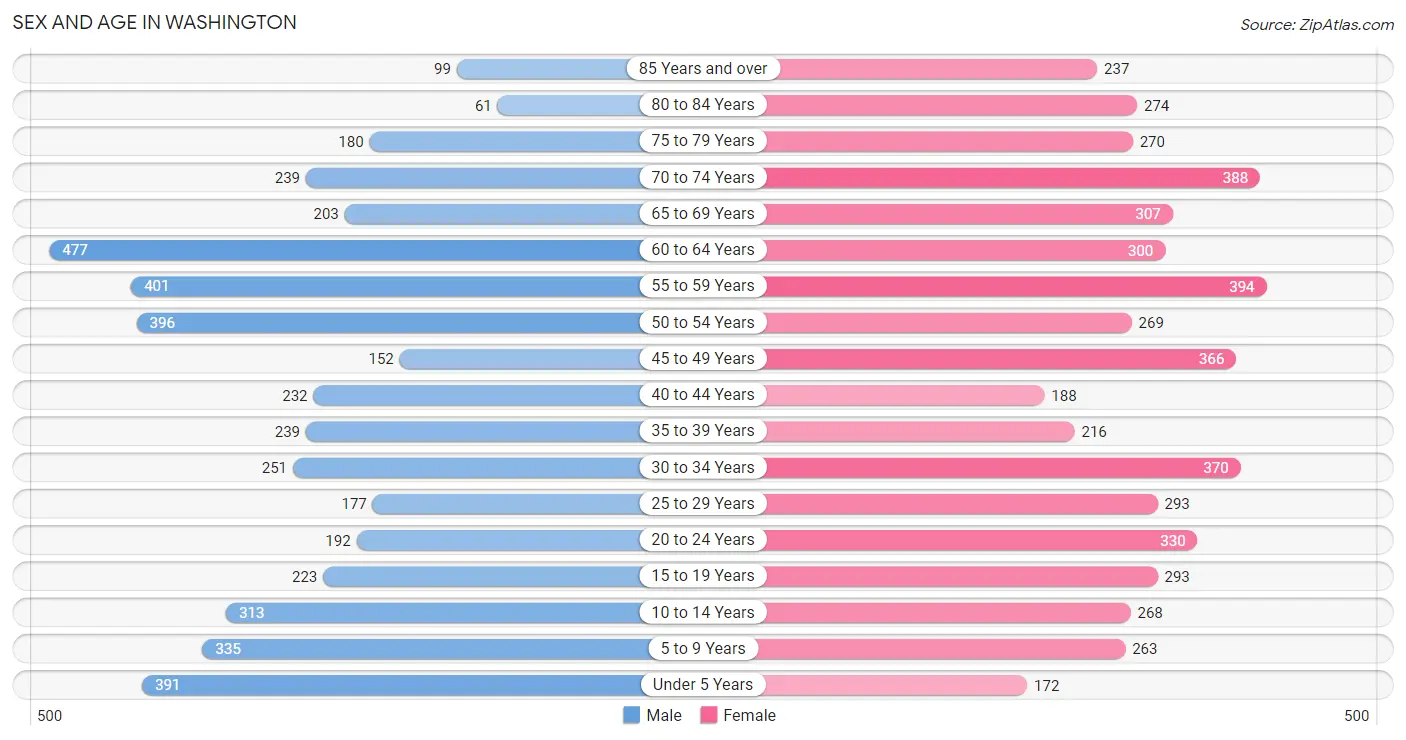
Sex and Age in Washington
The most populous age groups in Washington are 60 to 64 Years (477 | 10.5%) for men and 55 to 59 Years (394 | 7.6%) for women.
| Age Bracket | Male | Female |
| Under 5 Years | 391 (8.6%) | 172 (3.3%) |
| 5 to 9 Years | 335 (7.3%) | 263 (5.1%) |
| 10 to 14 Years | 313 (6.9%) | 268 (5.2%) |
| 15 to 19 Years | 223 (4.9%) | 293 (5.6%) |
| 20 to 24 Years | 192 (4.2%) | 330 (6.4%) |
| 25 to 29 Years | 177 (3.9%) | 293 (5.6%) |
| 30 to 34 Years | 251 (5.5%) | 370 (7.1%) |
| 35 to 39 Years | 239 (5.2%) | 216 (4.2%) |
| 40 to 44 Years | 232 (5.1%) | 188 (3.6%) |
| 45 to 49 Years | 152 (3.3%) | 366 (7.0%) |
| 50 to 54 Years | 396 (8.7%) | 269 (5.2%) |
| 55 to 59 Years | 401 (8.8%) | 394 (7.6%) |
| 60 to 64 Years | 477 (10.5%) | 300 (5.8%) |
| 65 to 69 Years | 203 (4.4%) | 307 (5.9%) |
| 70 to 74 Years | 239 (5.2%) | 388 (7.5%) |
| 75 to 79 Years | 180 (4.0%) | 270 (5.2%) |
| 80 to 84 Years | 61 (1.3%) | 274 (5.3%) |
| 85 Years and over | 99 (2.2%) | 237 (4.6%) |
| Total | 4,561 (100.0%) | 5,198 (100.0%) |
Families and Households in Washington
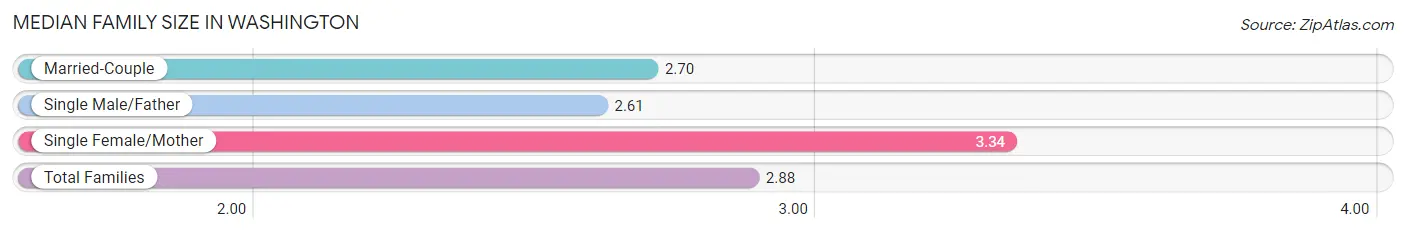
Median Family Size in Washington
The median family size in Washington is 2.88 persons per family, with single female/mother families (732 | 29.1%) accounting for the largest median family size of 3.34 persons per family. On the other hand, single male/father families (170 | 6.8%) represent the smallest median family size with 2.61 persons per family.
| Family Type | # Families | Family Size |
| Married-Couple | 1,609 (64.1%) | 2.70 |
| Single Male/Father | 170 (6.8%) | 2.61 |
| Single Female/Mother | 732 (29.1%) | 3.34 |
| Total Families | 2,511 (100.0%) | 2.88 |
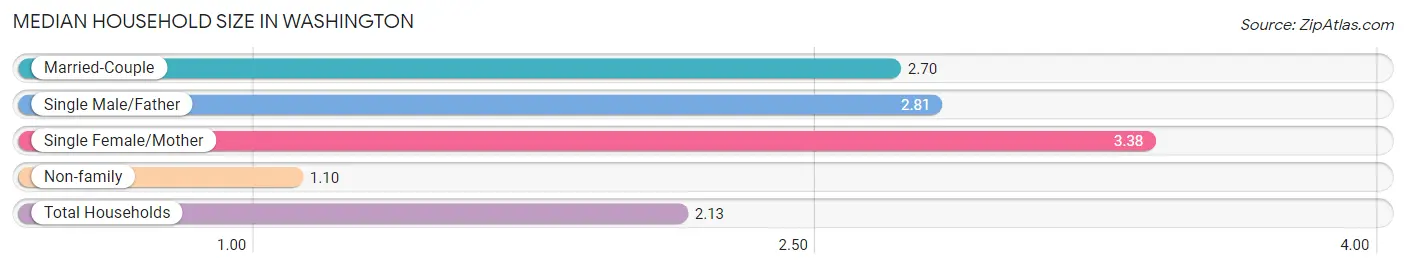
Median Household Size in Washington
The median household size in Washington is 2.13 persons per household, with single female/mother households (732 | 16.7%) accounting for the largest median household size of 3.38 persons per household. non-family households (1,861 | 42.6%) represent the smallest median household size with 1.10 persons per household.
| Household Type | # Households | Household Size |
| Married-Couple | 1,609 (36.8%) | 2.70 |
| Single Male/Father | 170 (3.9%) | 2.81 |
| Single Female/Mother | 732 (16.7%) | 3.38 |
| Non-family | 1,861 (42.6%) | 1.10 |
| Total Households | 4,372 (100.0%) | 2.13 |
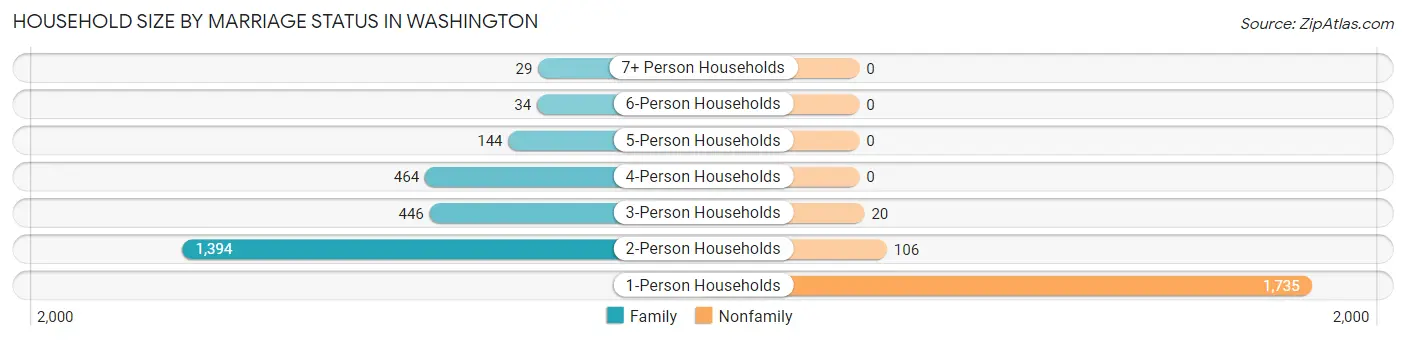
Household Size by Marriage Status in Washington
Out of a total of 4,372 households in Washington, 2,511 (57.4%) are family households, while 1,861 (42.6%) are nonfamily households. The most numerous type of family households are 2-person households, comprising 1,394, and the most common type of nonfamily households are 1-person households, comprising 1,735.
| Household Size | Family Households | Nonfamily Households |
| 1-Person Households | - | 1,735 (39.7%) |
| 2-Person Households | 1,394 (31.9%) | 106 (2.4%) |
| 3-Person Households | 446 (10.2%) | 20 (0.5%) |
| 4-Person Households | 464 (10.6%) | 0 (0.0%) |
| 5-Person Households | 144 (3.3%) | 0 (0.0%) |
| 6-Person Households | 34 (0.8%) | 0 (0.0%) |
| 7+ Person Households | 29 (0.7%) | 0 (0.0%) |
| Total | 2,511 (57.4%) | 1,861 (42.6%) |
Female Fertility in Washington
Fertility by Age in Washington
Average fertility rate in Washington is 52.0 births per 1,000 women. Women in the age bracket of 15 to 19 years have the highest fertility rate with 130.0 births per 1,000 women. Women in the age bracket of 20 to 34 years acount for 65.1% of all women with births.
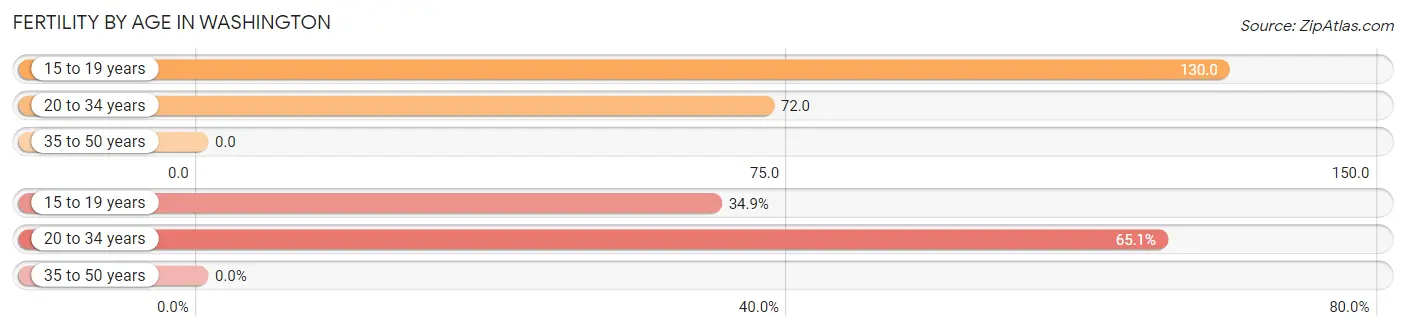
| Age Bracket | Women with Births | Births / 1,000 Women |
| 15 to 19 years | 38 (34.9%) | 130.0 |
| 20 to 34 years | 71 (65.1%) | 72.0 |
| 35 to 50 years | 0 (0.0%) | 0.0 |
| Total | 109 (100.0%) | 52.0 |
Fertility by Age by Marriage Status in Washington
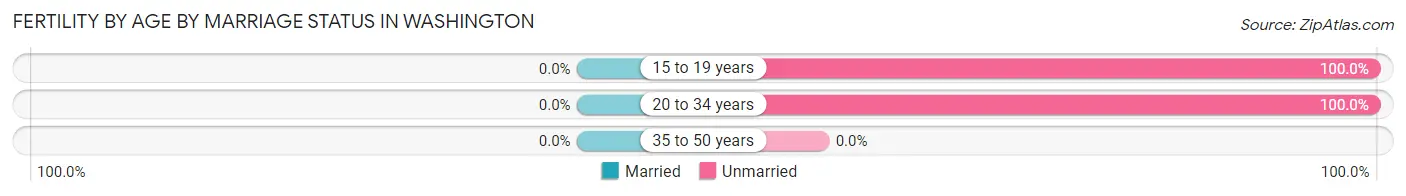
| Age Bracket | Married | Unmarried |
| 15 to 19 years | 0 (0.0%) | 38 (100.0%) |
| 20 to 34 years | 0 (0.0%) | 71 (100.0%) |
| 35 to 50 years | 0 (0.0%) | 0 (0.0%) |
| Total | 0 (0.0%) | 109 (100.0%) |
Fertility by Education in Washington
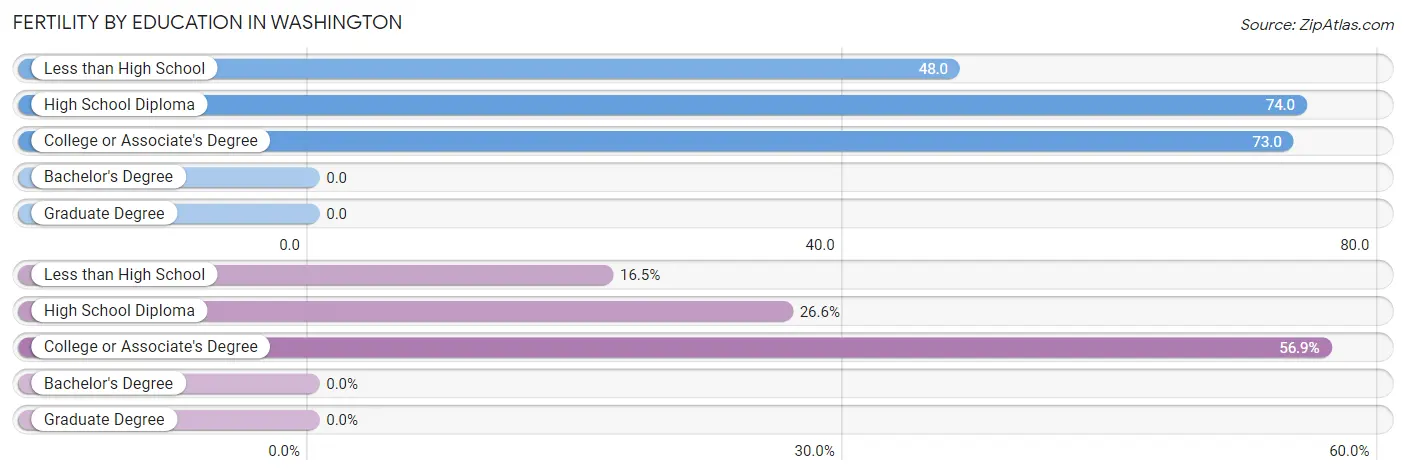
| Educational Attainment | Women with Births | Births / 1,000 Women |
| Less than High School | 18 (16.5%) | 48.0 |
| High School Diploma | 29 (26.6%) | 74.0 |
| College or Associate's Degree | 62 (56.9%) | 73.0 |
| Bachelor's Degree | 0 (0.0%) | 0.0 |
| Graduate Degree | 0 (0.0%) | 0.0 |
| Total | 109 (100.0%) | 52.0 |
Fertility by Education by Marriage Status in Washington
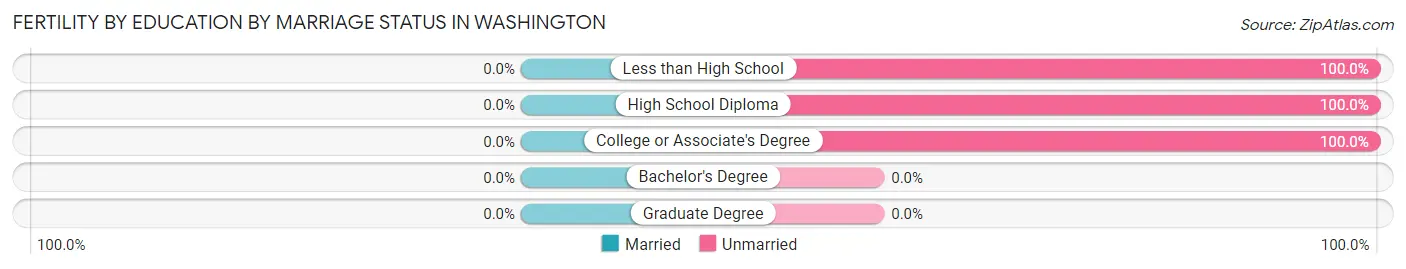
| Educational Attainment | Married | Unmarried |
| Less than High School | 0 (0.0%) | 18 (100.0%) |
| High School Diploma | 0 (0.0%) | 29 (100.0%) |
| College or Associate's Degree | 0 (0.0%) | 62 (100.0%) |
| Bachelor's Degree | 0 (0.0%) | 0 (0.0%) |
| Graduate Degree | 0 (0.0%) | 0 (0.0%) |
| Total | 0 (0.0%) | 109 (100.0%) |
Income in Washington
Income Overview in Washington
Per Capita Income in Washington is $31,110, while median incomes of families and households are $62,813 and $42,821 respectively.
| Characteristic | Number | Measure |
| Per Capita Income | 9,759 | $31,110 |
| Median Family Income | 2,511 | $62,813 |
| Mean Family Income | 2,511 | $93,685 |
| Median Household Income | 4,372 | $42,821 |
| Mean Household Income | 4,372 | $68,265 |
| Income Deficit | 2,511 | $11,479 |
| Wage / Income Gap (%) | 9,759 | 4.55% |
| Wage / Income Gap ($) | 9,759 | 95.45¢ per $1 |
| Gini / Inequality Index | 9,759 | 0.54 |
Earnings by Sex in Washington
Average Earnings in Washington are $33,264, $34,098 for men and $32,546 for women, a difference of 4.5%.
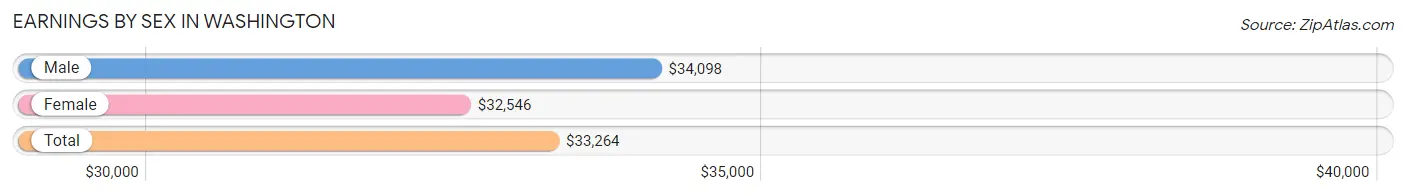
| Sex | Number | Average Earnings |
| Male | 2,087 (50.2%) | $34,098 |
| Female | 2,070 (49.8%) | $32,546 |
| Total | 4,157 (100.0%) | $33,264 |
Earnings by Sex by Income Bracket in Washington
The most common earnings brackets in Washington are $30,000 to $34,999 for men (292 | 14.0%) and $25,000 to $29,999 for women (336 | 16.2%).
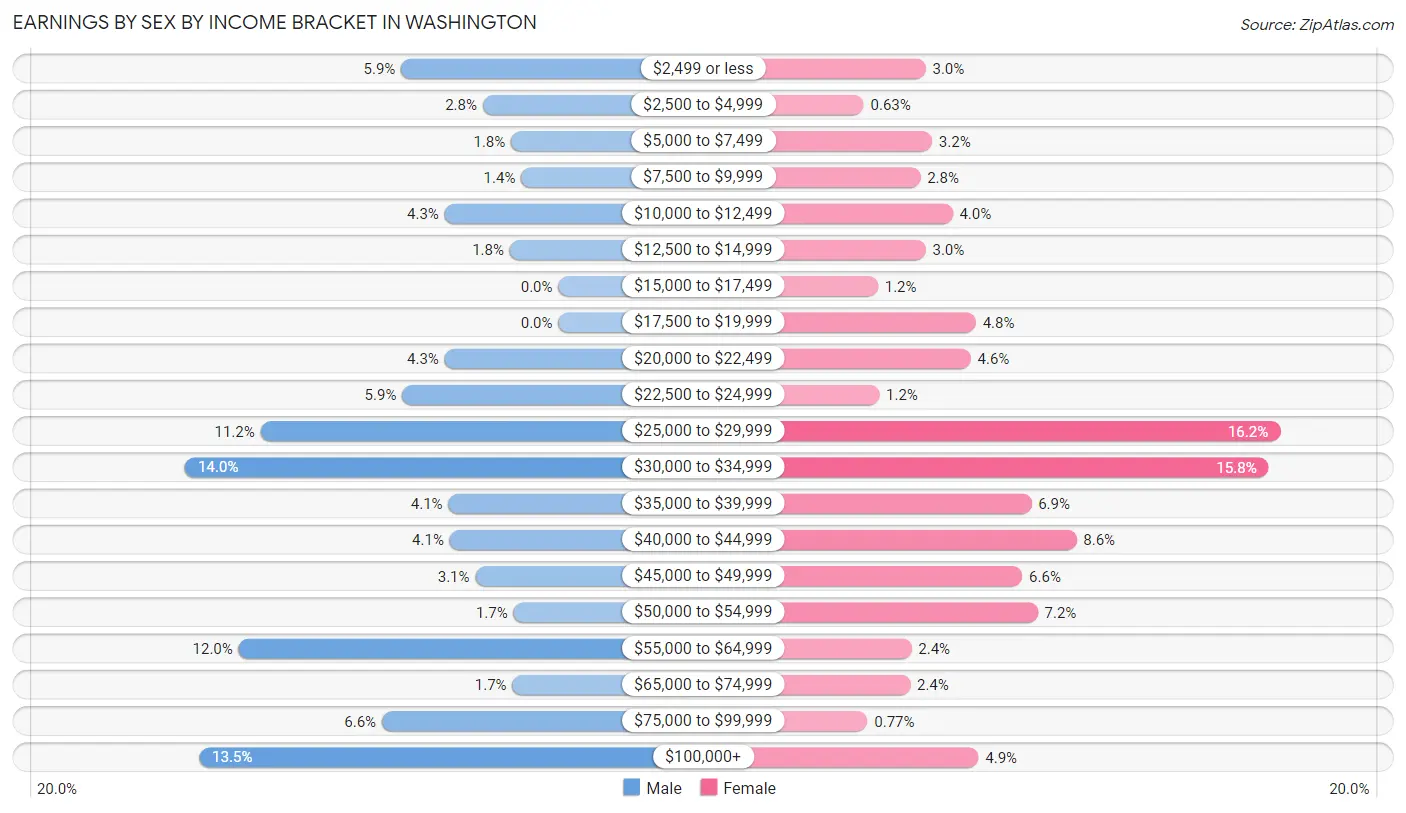
| Income | Male | Female |
| $2,499 or less | 123 (5.9%) | 61 (2.9%) |
| $2,500 to $4,999 | 59 (2.8%) | 13 (0.6%) |
| $5,000 to $7,499 | 37 (1.8%) | 66 (3.2%) |
| $7,500 to $9,999 | 29 (1.4%) | 57 (2.8%) |
| $10,000 to $12,499 | 89 (4.3%) | 82 (4.0%) |
| $12,500 to $14,999 | 38 (1.8%) | 61 (2.9%) |
| $15,000 to $17,499 | 0 (0.0%) | 24 (1.2%) |
| $17,500 to $19,999 | 0 (0.0%) | 100 (4.8%) |
| $20,000 to $22,499 | 89 (4.3%) | 96 (4.6%) |
| $22,500 to $24,999 | 122 (5.9%) | 25 (1.2%) |
| $25,000 to $29,999 | 233 (11.2%) | 336 (16.2%) |
| $30,000 to $34,999 | 292 (14.0%) | 327 (15.8%) |
| $35,000 to $39,999 | 86 (4.1%) | 143 (6.9%) |
| $40,000 to $44,999 | 85 (4.1%) | 178 (8.6%) |
| $45,000 to $49,999 | 65 (3.1%) | 136 (6.6%) |
| $50,000 to $54,999 | 35 (1.7%) | 148 (7.1%) |
| $55,000 to $64,999 | 250 (12.0%) | 50 (2.4%) |
| $65,000 to $74,999 | 36 (1.7%) | 49 (2.4%) |
| $75,000 to $99,999 | 138 (6.6%) | 16 (0.8%) |
| $100,000+ | 281 (13.5%) | 102 (4.9%) |
| Total | 2,087 (100.0%) | 2,070 (100.0%) |
Earnings by Sex by Educational Attainment in Washington
Average earnings in Washington are $36,424 for men and $33,218 for women, a difference of 8.8%. Men with an educational attainment of bachelor's degree enjoy the highest average annual earnings of $77,944, while those with less than high school education earn the least with $21,554. Women with an educational attainment of graduate degree earn the most with the average annual earnings of $49,293, while those with less than high school education have the smallest earnings of $18,150.
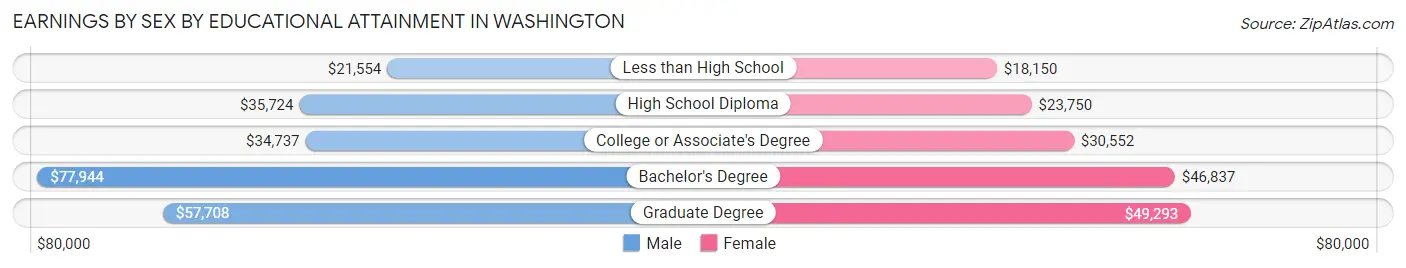
| Educational Attainment | Male Income | Female Income |
| Less than High School | $21,554 | $18,150 |
| High School Diploma | $35,724 | $23,750 |
| College or Associate's Degree | $34,737 | $30,552 |
| Bachelor's Degree | $77,944 | $46,837 |
| Graduate Degree | $57,708 | $49,293 |
| Total | $36,424 | $33,218 |
Family Income in Washington
Family Income Brackets in Washington
According to the Washington family income data, there are 650 families falling into the $50,000 to $74,999 income range, which is the most common income bracket and makes up 25.9% of all families. Conversely, the $15,000 to $24,999 income bracket is the least frequent group with only 123 families (4.9%) belonging to this category.
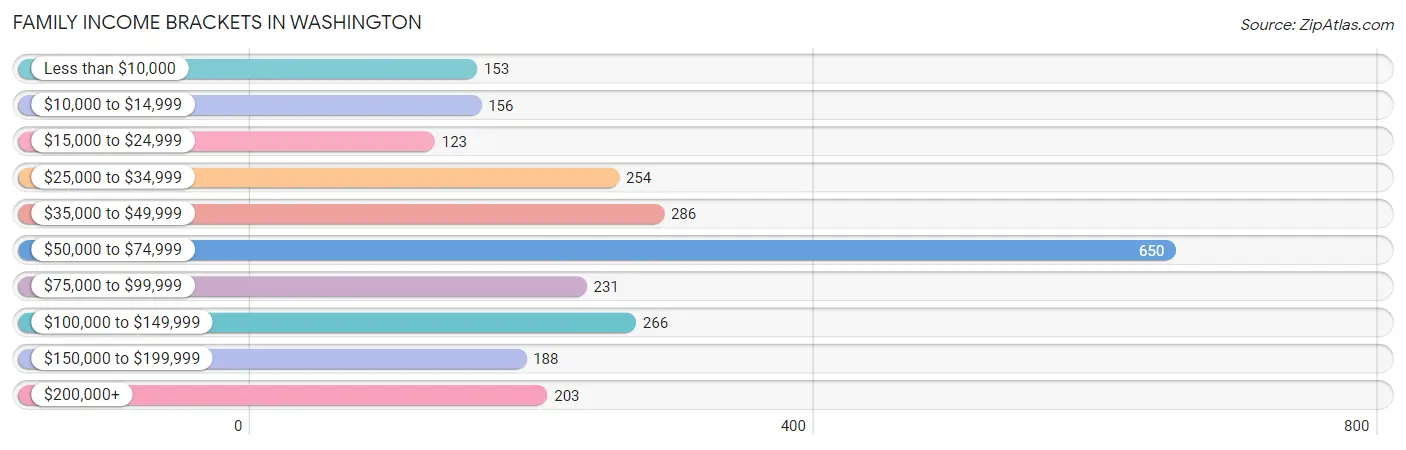
| Income Bracket | # Families | % Families |
| Less than $10,000 | 153 | 6.1% |
| $10,000 to $14,999 | 156 | 6.2% |
| $15,000 to $24,999 | 123 | 4.9% |
| $25,000 to $34,999 | 254 | 10.1% |
| $35,000 to $49,999 | 286 | 11.4% |
| $50,000 to $74,999 | 650 | 25.9% |
| $75,000 to $99,999 | 231 | 9.2% |
| $100,000 to $149,999 | 266 | 10.6% |
| $150,000 to $199,999 | 188 | 7.5% |
| $200,000+ | 203 | 8.1% |
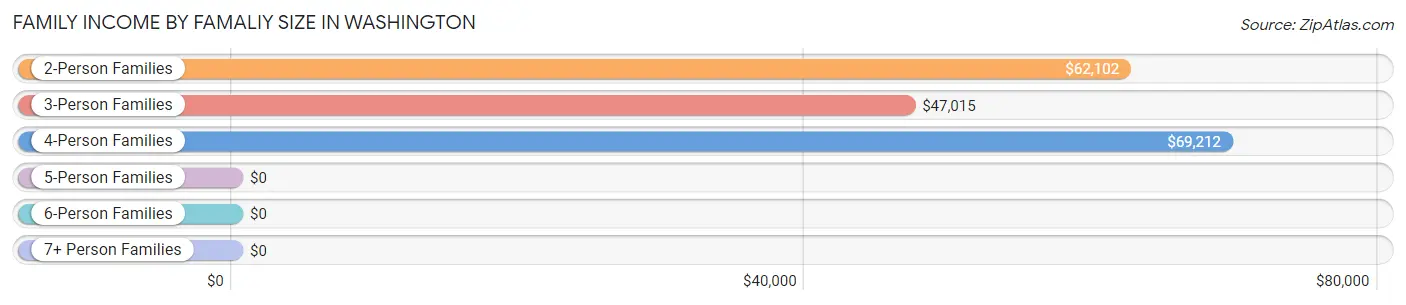
Family Income by Famaliy Size in Washington
4-person families (500 | 19.9%) account for the highest median family income in Washington with $69,212 per family, while 2-person families (1,427 | 56.8%) have the highest median income of $31,051 per family member.
| Income Bracket | # Families | Median Income |
| 2-Person Families | 1,427 (56.8%) | $62,102 |
| 3-Person Families | 417 (16.6%) | $47,015 |
| 4-Person Families | 500 (19.9%) | $69,212 |
| 5-Person Families | 108 (4.3%) | $0 |
| 6-Person Families | 30 (1.2%) | $0 |
| 7+ Person Families | 29 (1.1%) | $0 |
| Total | 2,511 (100.0%) | $62,813 |
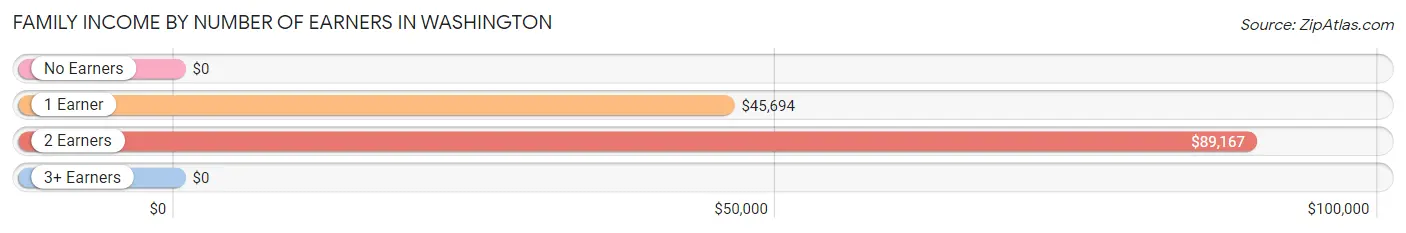
Family Income by Number of Earners in Washington
| Number of Earners | # Families | Median Income |
| No Earners | 462 (18.4%) | $0 |
| 1 Earner | 1,035 (41.2%) | $45,694 |
| 2 Earners | 940 (37.4%) | $89,167 |
| 3+ Earners | 74 (2.9%) | $0 |
| Total | 2,511 (100.0%) | $62,813 |
Household Income in Washington
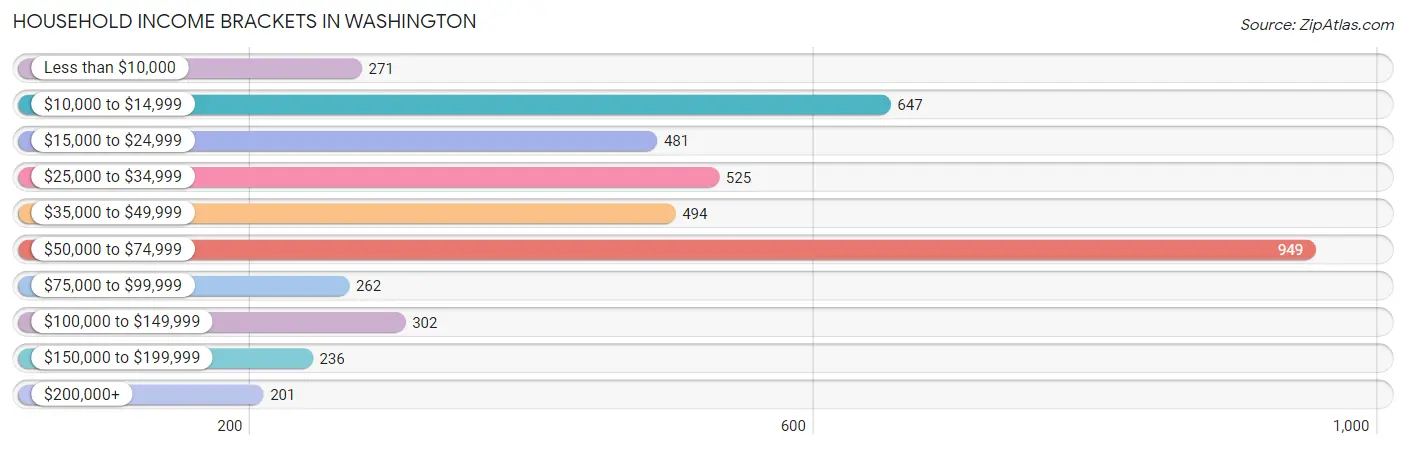
Household Income Brackets in Washington
With 949 households falling in the category, the $50,000 to $74,999 income range is the most frequent in Washington, accounting for 21.7% of all households. In contrast, only 201 households (4.6%) fall into the $200,000+ income bracket, making it the least populous group.
| Income Bracket | # Households | % Households |
| Less than $10,000 | 271 | 6.2% |
| $10,000 to $14,999 | 647 | 14.8% |
| $15,000 to $24,999 | 481 | 11.0% |
| $25,000 to $34,999 | 525 | 12.0% |
| $35,000 to $49,999 | 494 | 11.3% |
| $50,000 to $74,999 | 949 | 21.7% |
| $75,000 to $99,999 | 262 | 6.0% |
| $100,000 to $149,999 | 302 | 6.9% |
| $150,000 to $199,999 | 236 | 5.4% |
| $200,000+ | 201 | 4.6% |
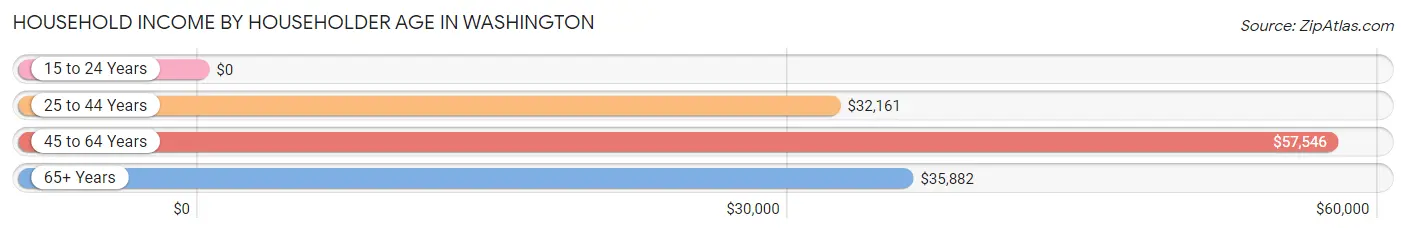
Household Income by Householder Age in Washington
The median household income in Washington is $42,821, with the highest median household income of $57,546 found in the 45 to 64 years age bracket for the primary householder. A total of 1,530 households (35.0%) fall into this category. Meanwhile, the 15 to 24 years age bracket for the primary householder has the lowest median household income of $0, with 194 households (4.4%) in this group.
| Income Bracket | # Households | Median Income |
| 15 to 24 Years | 194 (4.4%) | $0 |
| 25 to 44 Years | 1,166 (26.7%) | $32,161 |
| 45 to 64 Years | 1,530 (35.0%) | $57,546 |
| 65+ Years | 1,482 (33.9%) | $35,882 |
| Total | 4,372 (100.0%) | $42,821 |
Poverty in Washington
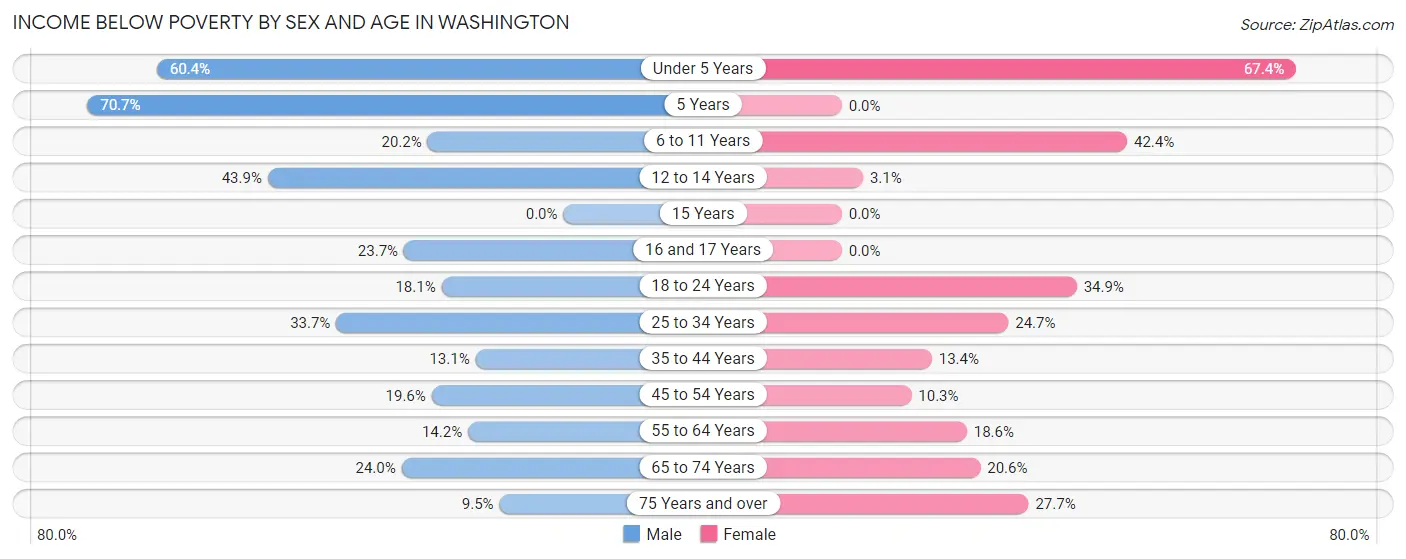
Income Below Poverty by Sex and Age in Washington
With 23.6% poverty level for males and 22.4% for females among the residents of Washington, 5 year old males and under 5 year old females are the most vulnerable to poverty, with 41 males (70.7%) and 116 females (67.4%) in their respective age groups living below the poverty level.
| Age Bracket | Male | Female |
| Under 5 Years | 236 (60.4%) | 116 (67.4%) |
| 5 Years | 41 (70.7%) | 0 (0.0%) |
| 6 to 11 Years | 93 (20.2%) | 122 (42.4%) |
| 12 to 14 Years | 54 (43.9%) | 7 (3.1%) |
| 15 Years | 0 (0.0%) | 0 (0.0%) |
| 16 and 17 Years | 18 (23.7%) | 0 (0.0%) |
| 18 to 24 Years | 42 (18.1%) | 150 (34.9%) |
| 25 to 34 Years | 142 (33.7%) | 163 (24.7%) |
| 35 to 44 Years | 59 (13.1%) | 54 (13.4%) |
| 45 to 54 Years | 106 (19.6%) | 65 (10.3%) |
| 55 to 64 Years | 116 (14.2%) | 126 (18.6%) |
| 65 to 74 Years | 98 (24.0%) | 133 (20.6%) |
| 75 Years and over | 28 (9.5%) | 191 (27.7%) |
| Total | 1,033 (23.6%) | 1,127 (22.4%) |
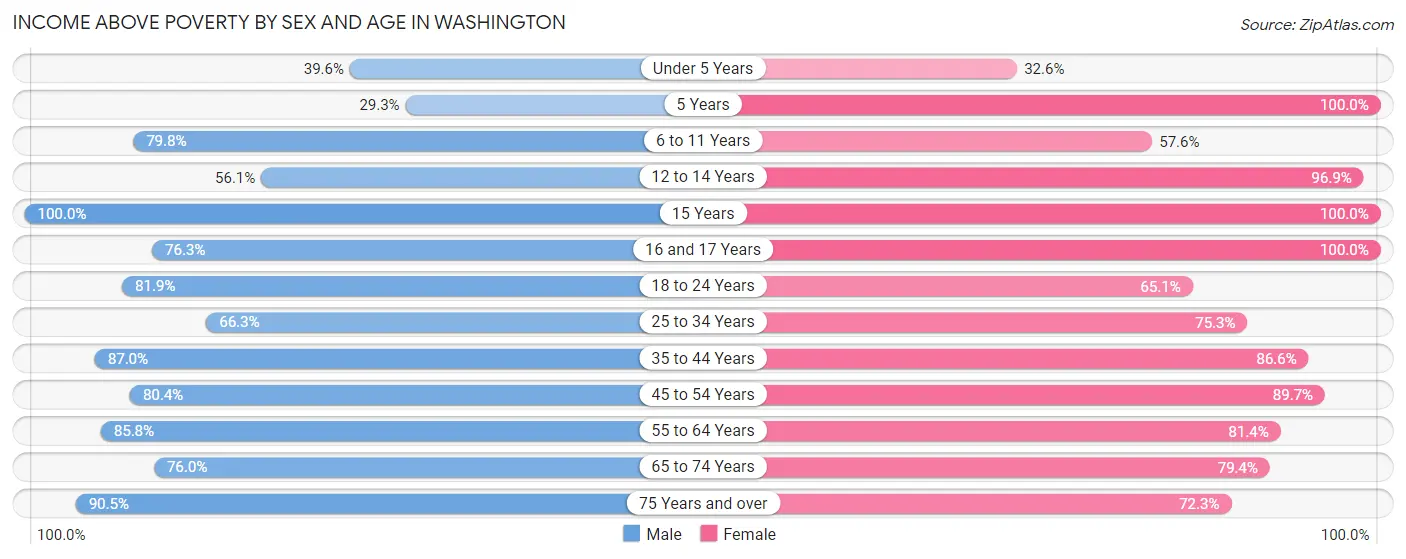
Income Above Poverty by Sex and Age in Washington
According to the poverty statistics in Washington, males aged 15 years and females aged 5 years are the age groups that are most secure financially, with 100.0% of males and 100.0% of females in these age groups living above the poverty line.
| Age Bracket | Male | Female |
| Under 5 Years | 155 (39.6%) | 56 (32.6%) |
| 5 Years | 17 (29.3%) | 18 (100.0%) |
| 6 to 11 Years | 368 (79.8%) | 166 (57.6%) |
| 12 to 14 Years | 69 (56.1%) | 216 (96.9%) |
| 15 Years | 89 (100.0%) | 93 (100.0%) |
| 16 and 17 Years | 58 (76.3%) | 91 (100.0%) |
| 18 to 24 Years | 190 (81.9%) | 280 (65.1%) |
| 25 to 34 Years | 279 (66.3%) | 496 (75.3%) |
| 35 to 44 Years | 393 (87.0%) | 350 (86.6%) |
| 45 to 54 Years | 436 (80.4%) | 564 (89.7%) |
| 55 to 64 Years | 703 (85.8%) | 553 (81.4%) |
| 65 to 74 Years | 310 (76.0%) | 514 (79.4%) |
| 75 Years and over | 267 (90.5%) | 498 (72.3%) |
| Total | 3,334 (76.3%) | 3,895 (77.6%) |
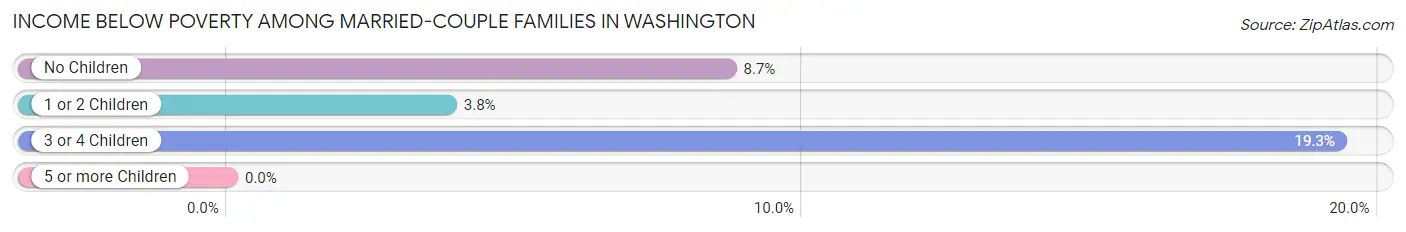
Income Below Poverty Among Married-Couple Families in Washington
The poverty statistics for married-couple families in Washington show that 7.7% or 124 of the total 1,609 families live below the poverty line. Families with 3 or 4 children have the highest poverty rate of 19.3%, comprising of 11 families. On the other hand, families with 1 or 2 children have the lowest poverty rate of 3.8%, which includes 17 families.
| Children | Above Poverty | Below Poverty |
| No Children | 1,010 (91.3%) | 96 (8.7%) |
| 1 or 2 Children | 429 (96.2%) | 17 (3.8%) |
| 3 or 4 Children | 46 (80.7%) | 11 (19.3%) |
| 5 or more Children | 0 (0.0%) | 0 (0.0%) |
| Total | 1,485 (92.3%) | 124 (7.7%) |
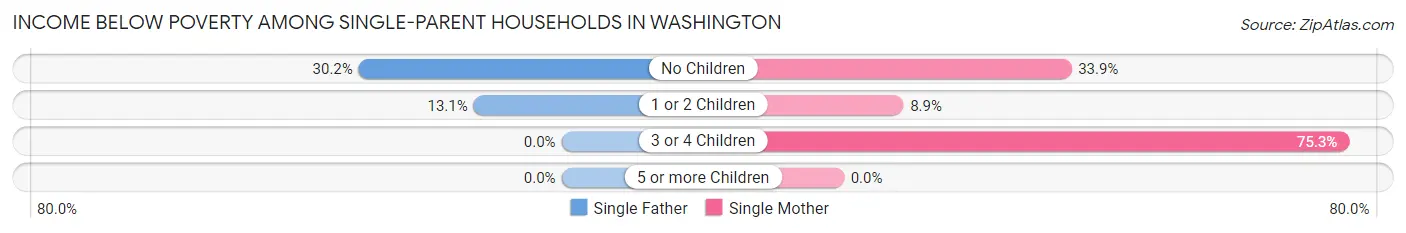
Income Below Poverty Among Single-Parent Households in Washington
According to the poverty data in Washington, 21.8% or 37 single-father households and 33.2% or 243 single-mother households are living below the poverty line. Among single-father households, those with no children have the highest poverty rate, with 26 households (30.2%) experiencing poverty. Likewise, among single-mother households, those with 3 or 4 children have the highest poverty rate, with 119 households (75.3%) falling below the poverty line.
| Children | Single Father | Single Mother |
| No Children | 26 (30.2%) | 99 (33.9%) |
| 1 or 2 Children | 11 (13.1%) | 25 (8.9%) |
| 3 or 4 Children | 0 (0.0%) | 119 (75.3%) |
| 5 or more Children | 0 (0.0%) | 0 (0.0%) |
| Total | 37 (21.8%) | 243 (33.2%) |
Income Below Poverty Among Married-Couple vs Single-Parent Households in Washington
The poverty data for Washington shows that 124 of the married-couple family households (7.7%) and 280 of the single-parent households (31.0%) are living below the poverty level. Within the married-couple family households, those with 3 or 4 children have the highest poverty rate, with 11 households (19.3%) falling below the poverty line. Among the single-parent households, those with 3 or 4 children have the highest poverty rate, with 119 household (75.3%) living below poverty.
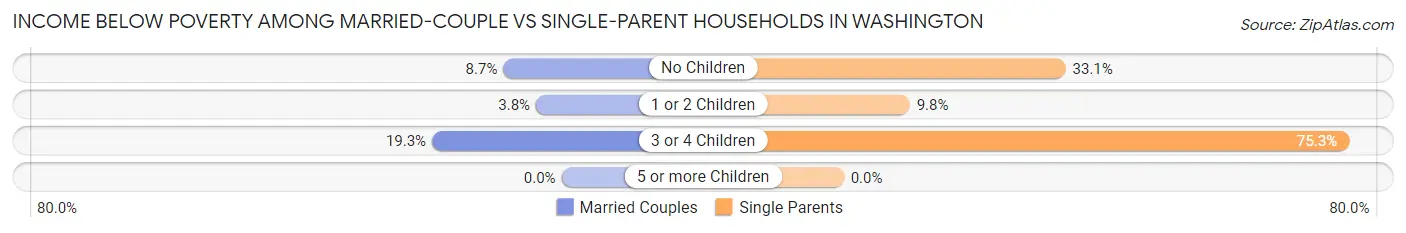
| Children | Married-Couple Families | Single-Parent Households |
| No Children | 96 (8.7%) | 125 (33.1%) |
| 1 or 2 Children | 17 (3.8%) | 36 (9.8%) |
| 3 or 4 Children | 11 (19.3%) | 119 (75.3%) |
| 5 or more Children | 0 (0.0%) | 0 (0.0%) |
| Total | 124 (7.7%) | 280 (31.0%) |
Employment Characteristics in Washington
Employment by Class of Employer in Washington
Among the 3,778 employed individuals in Washington, private company employees (2,385 | 63.1%), state government employees (420 | 11.1%), and local government employees (334 | 8.8%) make up the most common classes of employment.
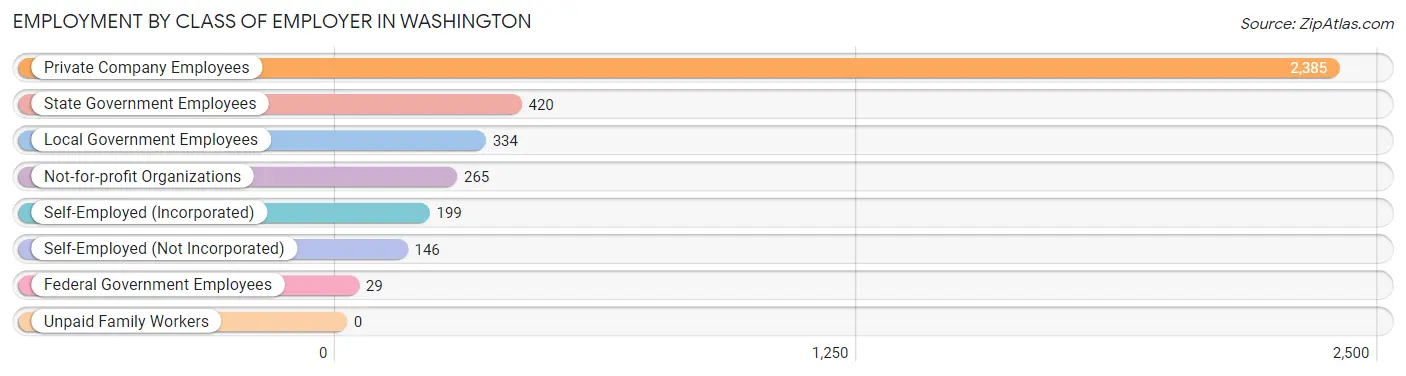
| Employer Class | # Employees | % Employees |
| Private Company Employees | 2,385 | 63.1% |
| Self-Employed (Incorporated) | 199 | 5.3% |
| Self-Employed (Not Incorporated) | 146 | 3.9% |
| Not-for-profit Organizations | 265 | 7.0% |
| Local Government Employees | 334 | 8.8% |
| State Government Employees | 420 | 11.1% |
| Federal Government Employees | 29 | 0.8% |
| Unpaid Family Workers | 0 | 0.0% |
| Total | 3,778 | 100.0% |
Employment Status by Age in Washington
According to the labor force statistics for Washington, out of the total population over 16 years of age (7,833), 51.6% or 4,042 individuals are in the labor force, with 5.6% or 226 of them unemployed. The age group with the highest labor force participation rate is 20 to 24 years, with 83.1% or 434 individuals in the labor force. Within the labor force, the 16 to 19 years age range has the highest percentage of unemployed individuals, with 46.4% or 32 of them being unemployed.
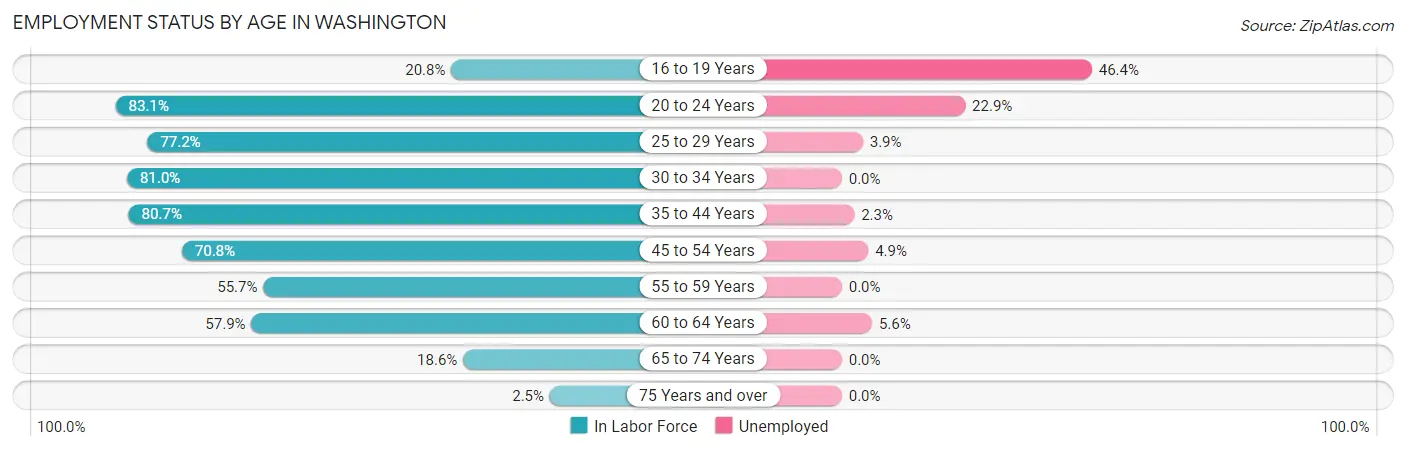
| Age Bracket | In Labor Force | Unemployed |
| 16 to 19 Years | 69 (20.8%) | 32 (46.4%) |
| 20 to 24 Years | 434 (83.1%) | 99 (22.9%) |
| 25 to 29 Years | 363 (77.2%) | 14 (3.9%) |
| 30 to 34 Years | 503 (81.0%) | 0 (0.0%) |
| 35 to 44 Years | 706 (80.7%) | 16 (2.3%) |
| 45 to 54 Years | 838 (70.8%) | 41 (4.9%) |
| 55 to 59 Years | 443 (55.7%) | 0 (0.0%) |
| 60 to 64 Years | 450 (57.9%) | 25 (5.6%) |
| 65 to 74 Years | 211 (18.6%) | 0 (0.0%) |
| 75 Years and over | 28 (2.5%) | 0 (0.0%) |
| Total | 4,042 (51.6%) | 226 (5.6%) |
Employment Status by Educational Attainment in Washington
According to labor force statistics for Washington, 69.9% of individuals (3,300) out of the total population between 25 and 64 years of age (4,721) are in the labor force, with 2.9% or 96 of them being unemployed. The group with the highest labor force participation rate are those with the educational attainment of bachelor's degree or higher, with 80.0% or 758 individuals in the labor force. Within the labor force, individuals with high school diploma education have the highest percentage of unemployment, with 10.8% or 80 of them being unemployed.
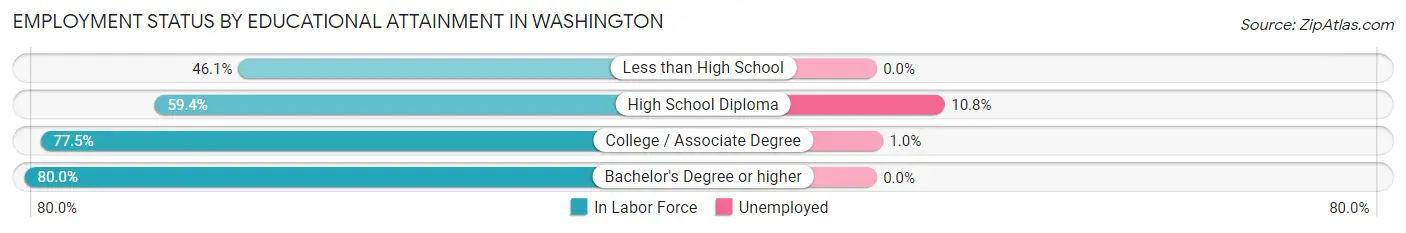
| Educational Attainment | In Labor Force | Unemployed |
| Less than High School | 229 (46.1%) | 0 (0.0%) |
| High School Diploma | 740 (59.4%) | 134 (10.8%) |
| College / Associate Degree | 1,575 (77.5%) | 20 (1.0%) |
| Bachelor's Degree or higher | 758 (80.0%) | 0 (0.0%) |
| Total | 3,300 (69.9%) | 137 (2.9%) |
Employment Occupations by Sex in Washington
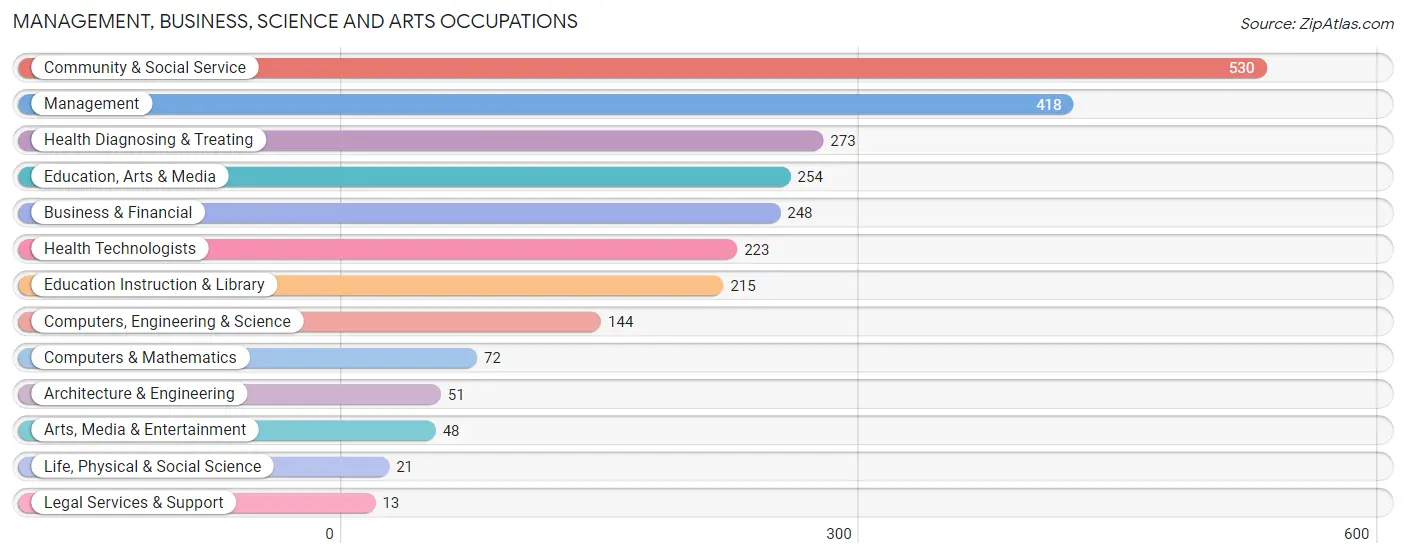
Management, Business, Science and Arts Occupations
The most common Management, Business, Science and Arts occupations in Washington are Community & Social Service (530 | 13.9%), Management (418 | 11.0%), Health Diagnosing & Treating (273 | 7.2%), Education, Arts & Media (254 | 6.7%), and Business & Financial (248 | 6.5%).
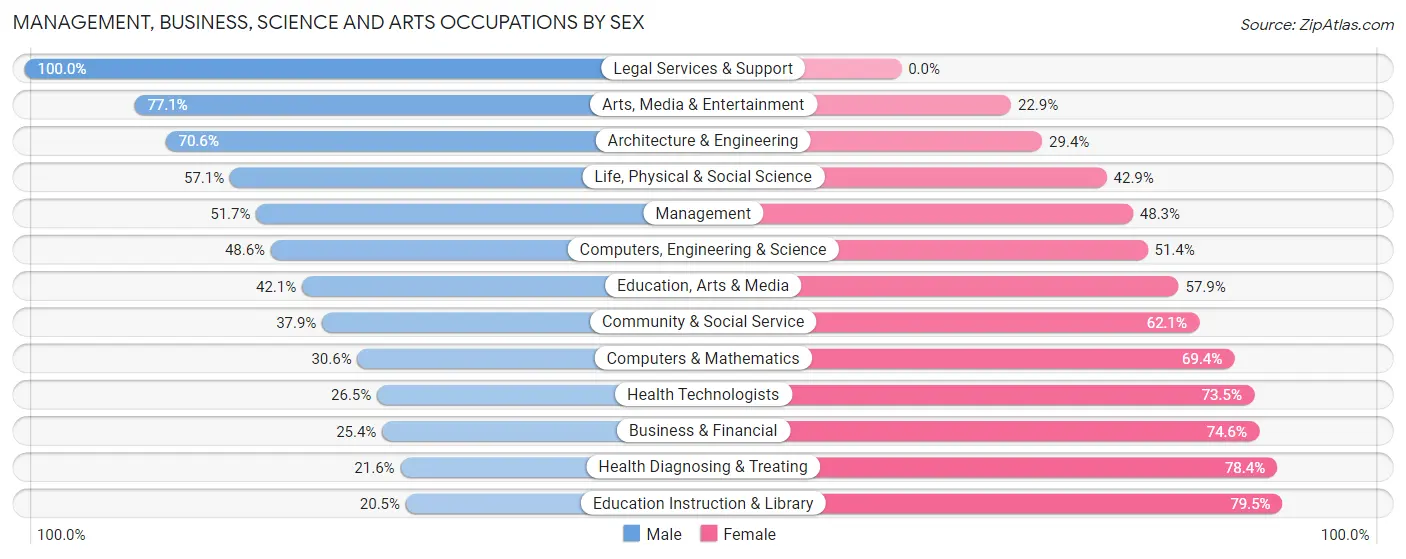
Management, Business, Science and Arts Occupations by Sex
Within the Management, Business, Science and Arts occupations in Washington, the most male-oriented occupations are Legal Services & Support (100.0%), Arts, Media & Entertainment (77.1%), and Architecture & Engineering (70.6%), while the most female-oriented occupations are Education Instruction & Library (79.5%), Health Diagnosing & Treating (78.4%), and Business & Financial (74.6%).
| Occupation | Male | Female |
| Management | 216 (51.7%) | 202 (48.3%) |
| Business & Financial | 63 (25.4%) | 185 (74.6%) |
| Computers, Engineering & Science | 70 (48.6%) | 74 (51.4%) |
| Computers & Mathematics | 22 (30.6%) | 50 (69.4%) |
| Architecture & Engineering | 36 (70.6%) | 15 (29.4%) |
| Life, Physical & Social Science | 12 (57.1%) | 9 (42.9%) |
| Community & Social Service | 201 (37.9%) | 329 (62.1%) |
| Education, Arts & Media | 107 (42.1%) | 147 (57.9%) |
| Legal Services & Support | 13 (100.0%) | 0 (0.0%) |
| Education Instruction & Library | 44 (20.5%) | 171 (79.5%) |
| Arts, Media & Entertainment | 37 (77.1%) | 11 (22.9%) |
| Health Diagnosing & Treating | 59 (21.6%) | 214 (78.4%) |
| Health Technologists | 59 (26.5%) | 164 (73.5%) |
| Total (Category) | 609 (37.8%) | 1,004 (62.2%) |
| Total (Overall) | 1,876 (49.3%) | 1,930 (50.7%) |
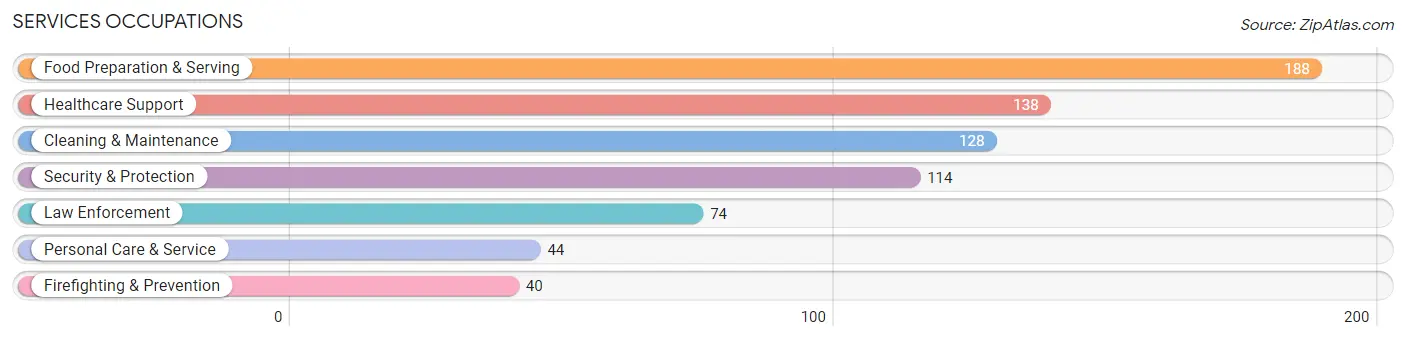
Services Occupations
The most common Services occupations in Washington are Food Preparation & Serving (188 | 4.9%), Healthcare Support (138 | 3.6%), Cleaning & Maintenance (128 | 3.4%), Security & Protection (114 | 3.0%), and Law Enforcement (74 | 1.9%).
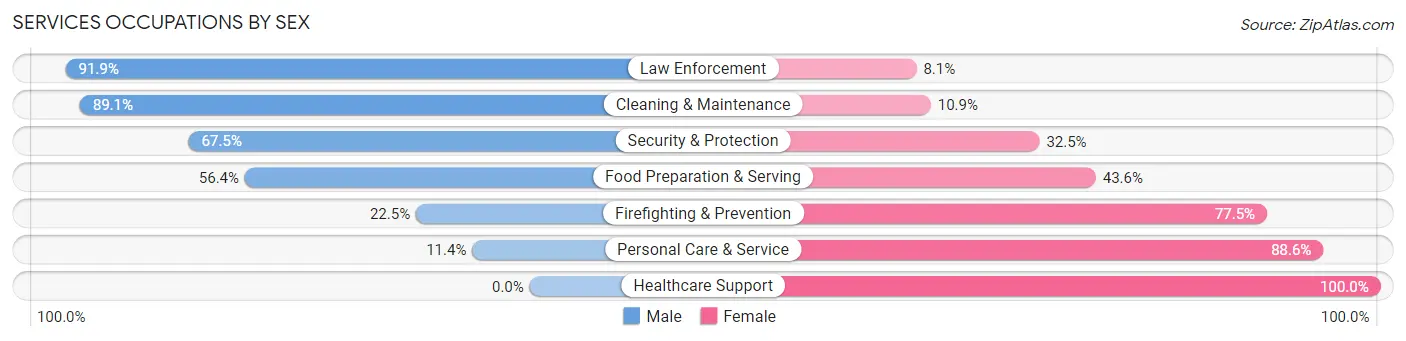
Services Occupations by Sex
Within the Services occupations in Washington, the most male-oriented occupations are Law Enforcement (91.9%), Cleaning & Maintenance (89.1%), and Security & Protection (67.5%), while the most female-oriented occupations are Healthcare Support (100.0%), Personal Care & Service (88.6%), and Firefighting & Prevention (77.5%).
| Occupation | Male | Female |
| Healthcare Support | 0 (0.0%) | 138 (100.0%) |
| Security & Protection | 77 (67.5%) | 37 (32.5%) |
| Firefighting & Prevention | 9 (22.5%) | 31 (77.5%) |
| Law Enforcement | 68 (91.9%) | 6 (8.1%) |
| Food Preparation & Serving | 106 (56.4%) | 82 (43.6%) |
| Cleaning & Maintenance | 114 (89.1%) | 14 (10.9%) |
| Personal Care & Service | 5 (11.4%) | 39 (88.6%) |
| Total (Category) | 302 (49.3%) | 310 (50.6%) |
| Total (Overall) | 1,876 (49.3%) | 1,930 (50.7%) |
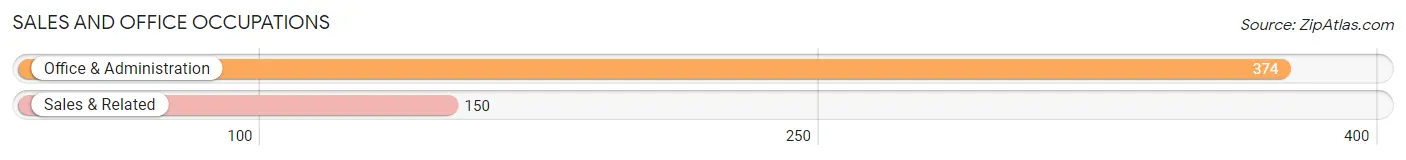
Sales and Office Occupations
The most common Sales and Office occupations in Washington are Office & Administration (374 | 9.8%), and Sales & Related (150 | 3.9%).
Sales and Office Occupations by Sex
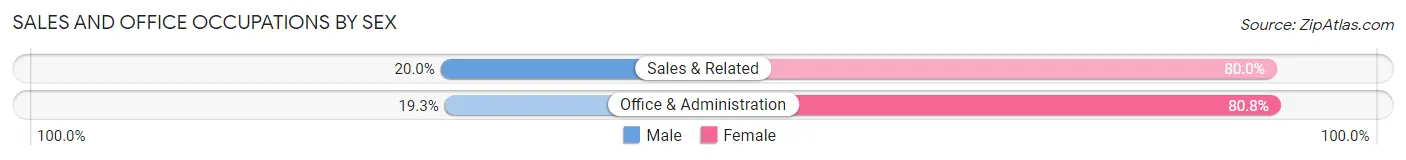
| Occupation | Male | Female |
| Sales & Related | 30 (20.0%) | 120 (80.0%) |
| Office & Administration | 72 (19.3%) | 302 (80.7%) |
| Total (Category) | 102 (19.5%) | 422 (80.5%) |
| Total (Overall) | 1,876 (49.3%) | 1,930 (50.7%) |
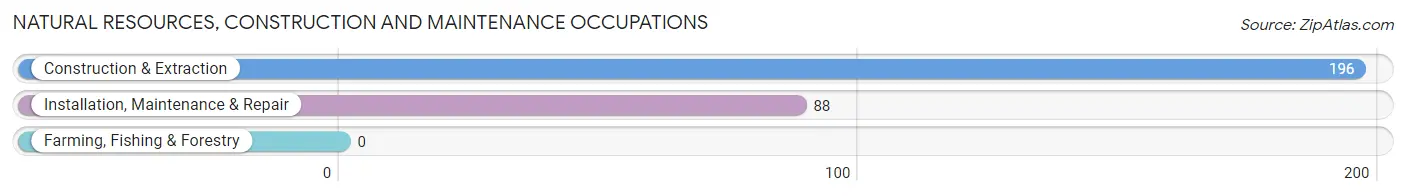
Natural Resources, Construction and Maintenance Occupations
The most common Natural Resources, Construction and Maintenance occupations in Washington are Construction & Extraction (196 | 5.1%), and Installation, Maintenance & Repair (88 | 2.3%).
Natural Resources, Construction and Maintenance Occupations by Sex
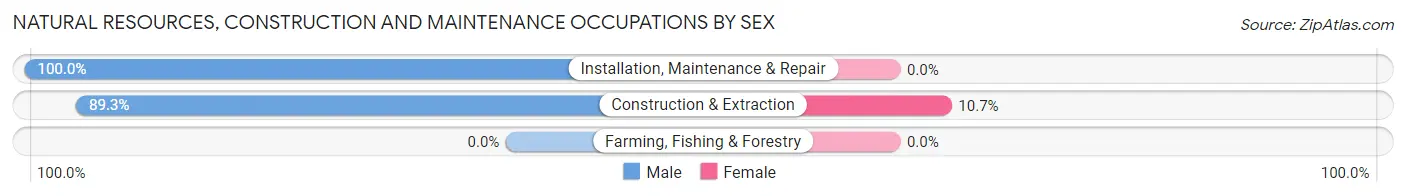
| Occupation | Male | Female |
| Farming, Fishing & Forestry | 0 (0.0%) | 0 (0.0%) |
| Construction & Extraction | 175 (89.3%) | 21 (10.7%) |
| Installation, Maintenance & Repair | 88 (100.0%) | 0 (0.0%) |
| Total (Category) | 263 (92.6%) | 21 (7.4%) |
| Total (Overall) | 1,876 (49.3%) | 1,930 (50.7%) |
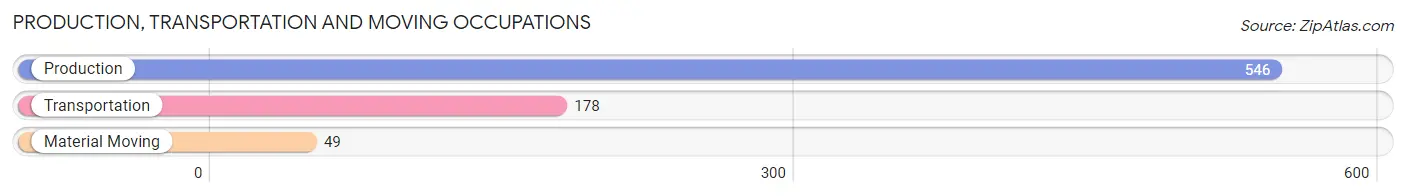
Production, Transportation and Moving Occupations
The most common Production, Transportation and Moving occupations in Washington are Production (546 | 14.3%), Transportation (178 | 4.7%), and Material Moving (49 | 1.3%).
Production, Transportation and Moving Occupations by Sex
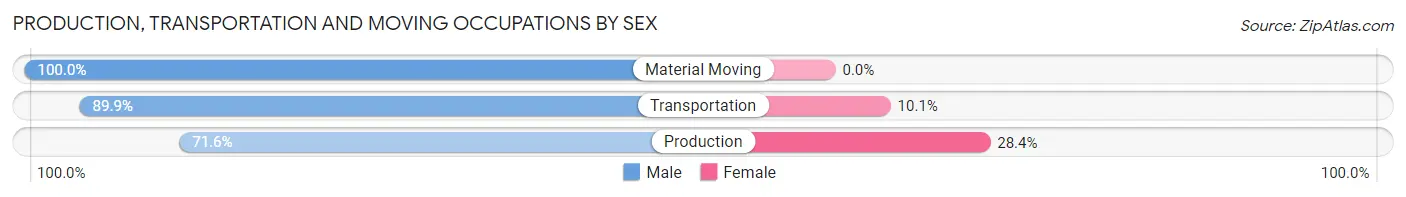
| Occupation | Male | Female |
| Production | 391 (71.6%) | 155 (28.4%) |
| Transportation | 160 (89.9%) | 18 (10.1%) |
| Material Moving | 49 (100.0%) | 0 (0.0%) |
| Total (Category) | 600 (77.6%) | 173 (22.4%) |
| Total (Overall) | 1,876 (49.3%) | 1,930 (50.7%) |
Employment Industries by Sex in Washington
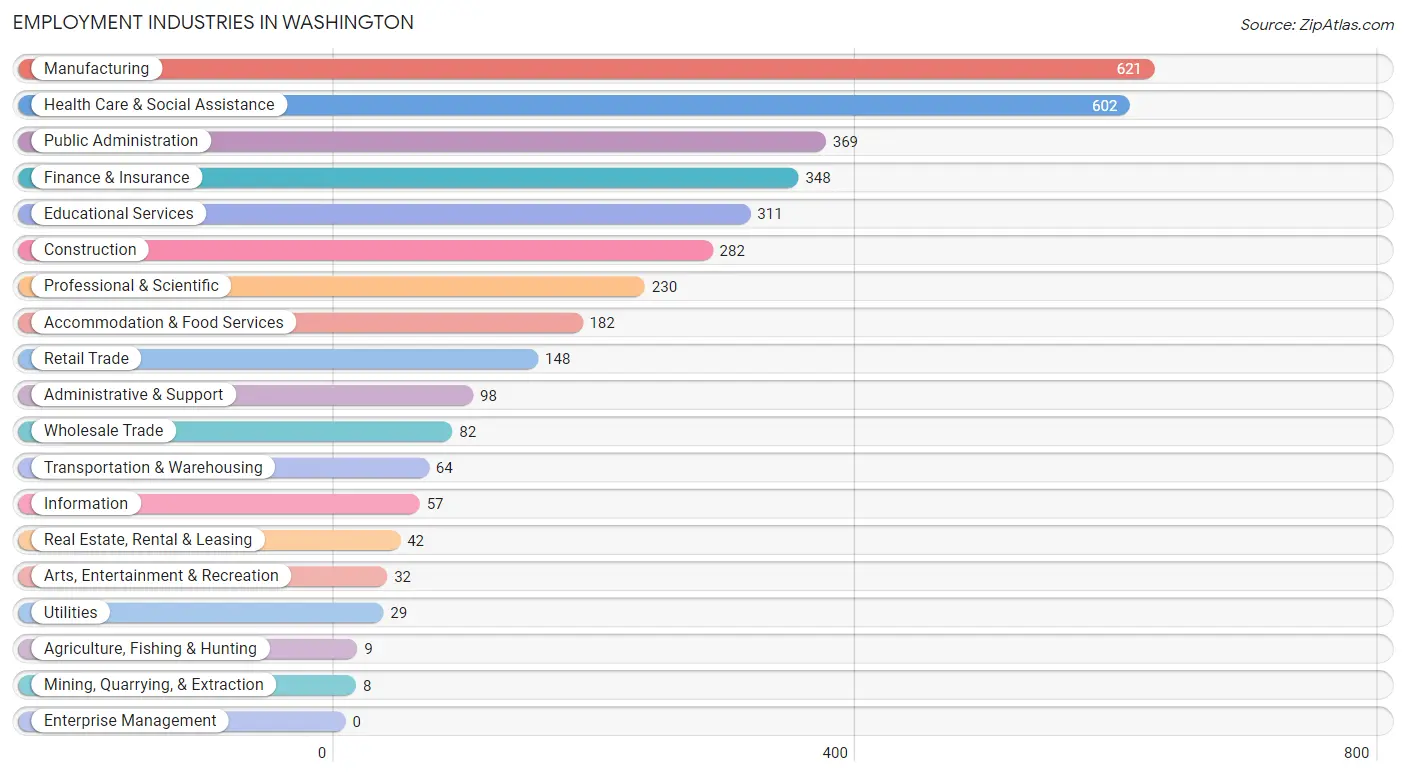
Employment Industries in Washington
The major employment industries in Washington include Manufacturing (621 | 16.3%), Health Care & Social Assistance (602 | 15.8%), Public Administration (369 | 9.7%), Finance & Insurance (348 | 9.1%), and Educational Services (311 | 8.2%).
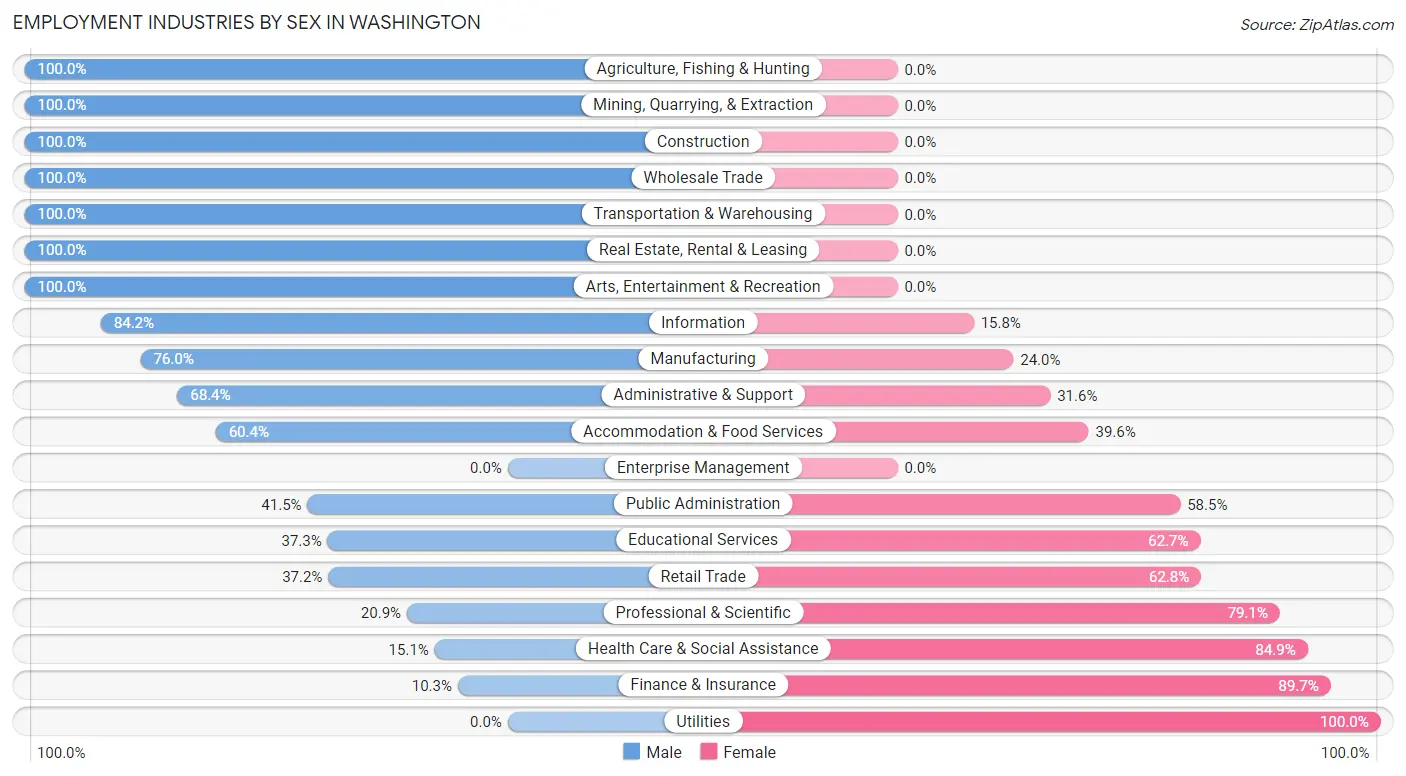
Employment Industries by Sex in Washington
The Washington industries that see more men than women are Agriculture, Fishing & Hunting (100.0%), Mining, Quarrying, & Extraction (100.0%), and Construction (100.0%), whereas the industries that tend to have a higher number of women are Utilities (100.0%), Finance & Insurance (89.7%), and Health Care & Social Assistance (84.9%).
| Industry | Male | Female |
| Agriculture, Fishing & Hunting | 9 (100.0%) | 0 (0.0%) |
| Mining, Quarrying, & Extraction | 8 (100.0%) | 0 (0.0%) |
| Construction | 282 (100.0%) | 0 (0.0%) |
| Manufacturing | 472 (76.0%) | 149 (24.0%) |
| Wholesale Trade | 82 (100.0%) | 0 (0.0%) |
| Retail Trade | 55 (37.2%) | 93 (62.8%) |
| Transportation & Warehousing | 64 (100.0%) | 0 (0.0%) |
| Utilities | 0 (0.0%) | 29 (100.0%) |
| Information | 48 (84.2%) | 9 (15.8%) |
| Finance & Insurance | 36 (10.3%) | 312 (89.7%) |
| Real Estate, Rental & Leasing | 42 (100.0%) | 0 (0.0%) |
| Professional & Scientific | 48 (20.9%) | 182 (79.1%) |
| Enterprise Management | 0 (0.0%) | 0 (0.0%) |
| Administrative & Support | 67 (68.4%) | 31 (31.6%) |
| Educational Services | 116 (37.3%) | 195 (62.7%) |
| Health Care & Social Assistance | 91 (15.1%) | 511 (84.9%) |
| Arts, Entertainment & Recreation | 32 (100.0%) | 0 (0.0%) |
| Accommodation & Food Services | 110 (60.4%) | 72 (39.6%) |
| Public Administration | 153 (41.5%) | 216 (58.5%) |
| Total | 1,876 (49.3%) | 1,930 (50.7%) |
Education in Washington
School Enrollment in Washington
The most common levels of schooling among the 1,922 students in Washington are elementary school (581 | 30.2%), high school (446 | 23.2%), and middle school (404 | 21.0%).
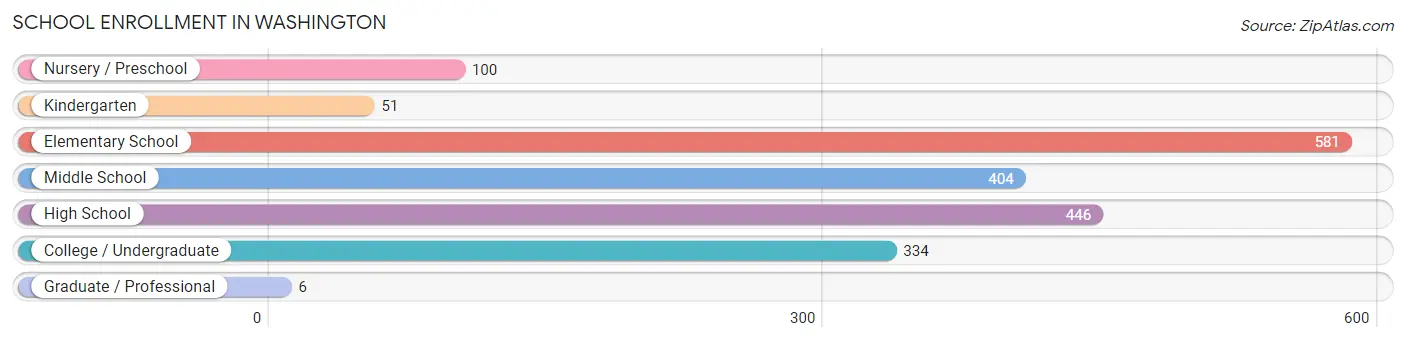
| School Level | # Students | % Students |
| Nursery / Preschool | 100 | 5.2% |
| Kindergarten | 51 | 2.6% |
| Elementary School | 581 | 30.2% |
| Middle School | 404 | 21.0% |
| High School | 446 | 23.2% |
| College / Undergraduate | 334 | 17.4% |
| Graduate / Professional | 6 | 0.3% |
| Total | 1,922 | 100.0% |
School Enrollment by Age by Funding Source in Washington
Out of a total of 1,922 students who are enrolled in schools in Washington, 135 (7.0%) attend a private institution, while the remaining 1,787 (93.0%) are enrolled in public schools. The age group of 35 years and over has the highest likelihood of being enrolled in private schools, with 32 (44.4% in the age bracket) enrolled. Conversely, the age group of 3 to 4 year olds has the lowest likelihood of being enrolled in a private school, with 82 (100.0% in the age bracket) attending a public institution.
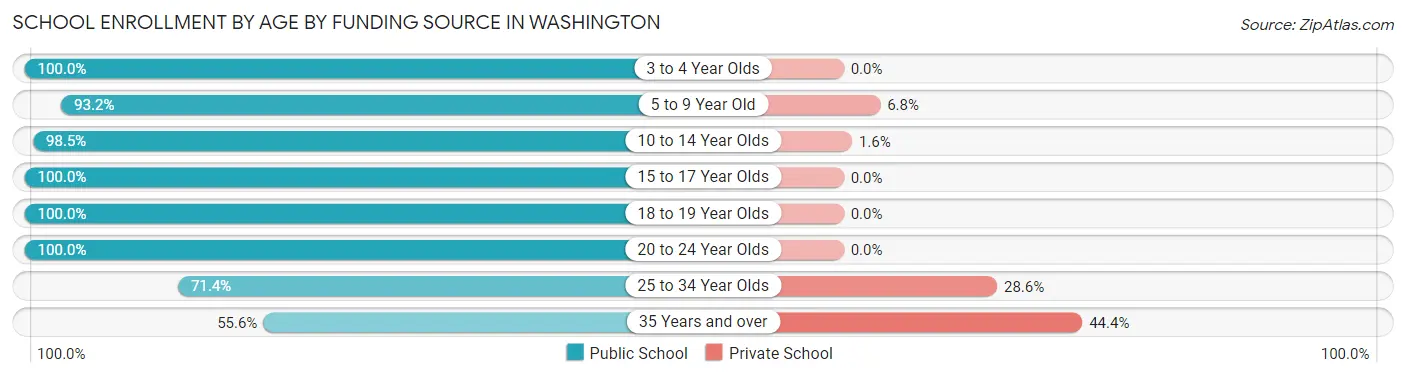
| Age Bracket | Public School | Private School |
| 3 to 4 Year Olds | 82 (100.0%) | 0 (0.0%) |
| 5 to 9 Year Old | 493 (93.2%) | 36 (6.8%) |
| 10 to 14 Year Olds | 572 (98.5%) | 9 (1.5%) |
| 15 to 17 Year Olds | 352 (100.0%) | 0 (0.0%) |
| 18 to 19 Year Olds | 74 (100.0%) | 0 (0.0%) |
| 20 to 24 Year Olds | 29 (100.0%) | 0 (0.0%) |
| 25 to 34 Year Olds | 145 (71.4%) | 58 (28.6%) |
| 35 Years and over | 40 (55.6%) | 32 (44.4%) |
| Total | 1,787 (93.0%) | 135 (7.0%) |
Educational Attainment by Field of Study in Washington
Education (357 | 22.7%), science & technology (230 | 14.6%), psychology (151 | 9.6%), liberal arts & history (134 | 8.5%), and arts & humanities (121 | 7.7%) are the most common fields of study among 1,574 individuals in Washington who have obtained a bachelor's degree or higher.
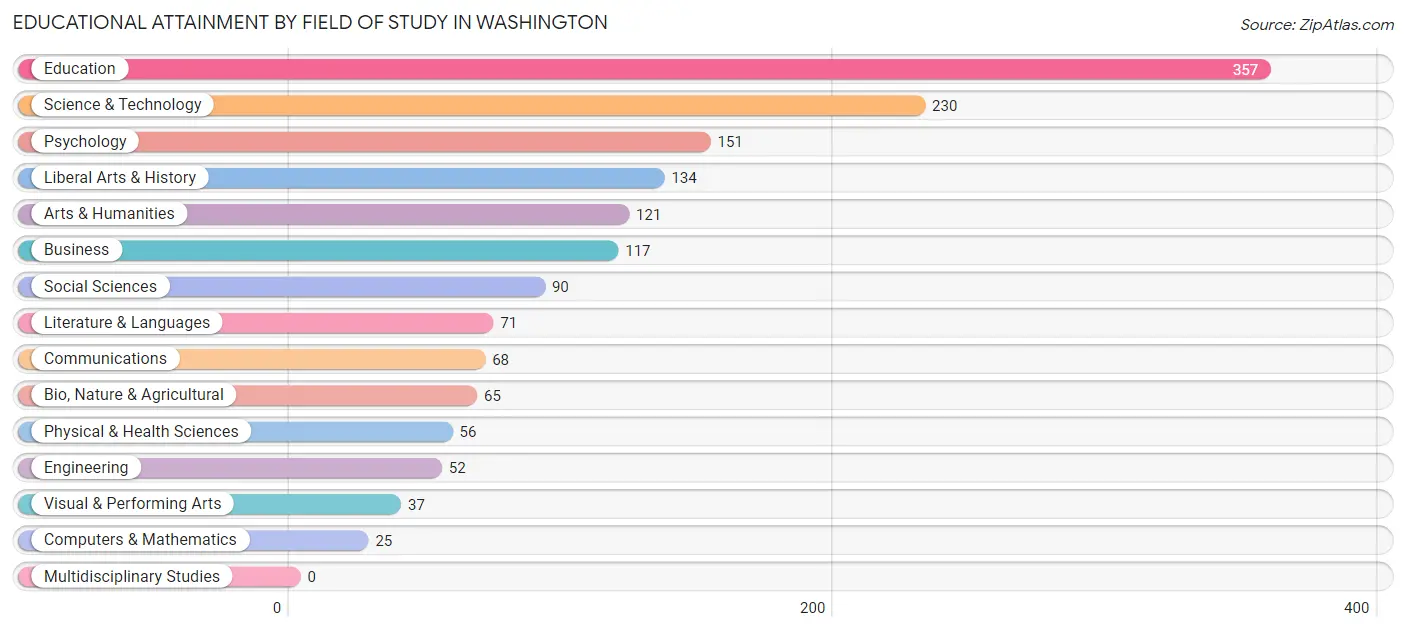
| Field of Study | # Graduates | % Graduates |
| Computers & Mathematics | 25 | 1.6% |
| Bio, Nature & Agricultural | 65 | 4.1% |
| Physical & Health Sciences | 56 | 3.6% |
| Psychology | 151 | 9.6% |
| Social Sciences | 90 | 5.7% |
| Engineering | 52 | 3.3% |
| Multidisciplinary Studies | 0 | 0.0% |
| Science & Technology | 230 | 14.6% |
| Business | 117 | 7.4% |
| Education | 357 | 22.7% |
| Literature & Languages | 71 | 4.5% |
| Liberal Arts & History | 134 | 8.5% |
| Visual & Performing Arts | 37 | 2.4% |
| Communications | 68 | 4.3% |
| Arts & Humanities | 121 | 7.7% |
| Total | 1,574 | 100.0% |
Transportation & Commute in Washington
Vehicle Availability by Sex in Washington
The most prevalent vehicle ownership categories in Washington are males with 2 vehicles (1,007, accounting for 55.6%) and females with 2 vehicles (913, making up 52.2%).
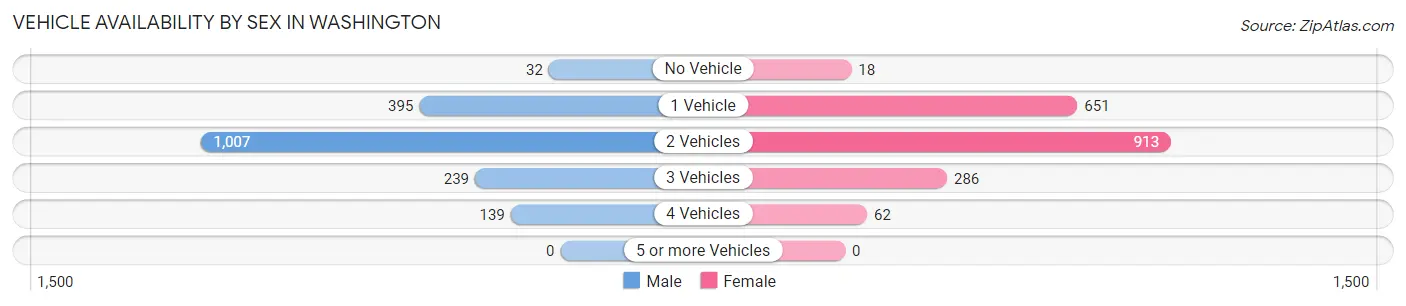
| Vehicles Available | Male | Female |
| No Vehicle | 32 (1.8%) | 18 (0.9%) |
| 1 Vehicle | 395 (21.8%) | 651 (33.7%) |
| 2 Vehicles | 1,007 (55.6%) | 913 (47.3%) |
| 3 Vehicles | 239 (13.2%) | 286 (14.8%) |
| 4 Vehicles | 139 (7.7%) | 62 (3.2%) |
| 5 or more Vehicles | 0 (0.0%) | 0 (0.0%) |
| Total | 1,812 (100.0%) | 1,930 (100.0%) |
Commute Time in Washington
The most frequently occuring commute durations in Washington are 5 to 9 minutes (999 commuters, 29.0%), 10 to 14 minutes (818 commuters, 23.7%), and 30 to 34 minutes (494 commuters, 14.3%).
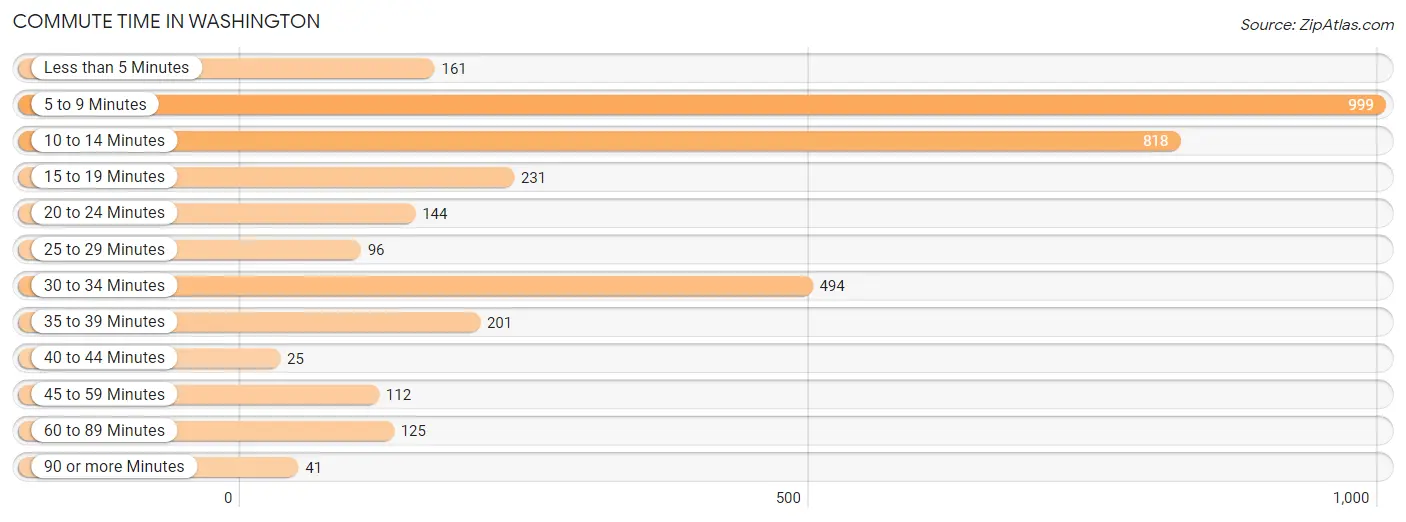
| Commute Time | # Commuters | % Commuters |
| Less than 5 Minutes | 161 | 4.7% |
| 5 to 9 Minutes | 999 | 29.0% |
| 10 to 14 Minutes | 818 | 23.7% |
| 15 to 19 Minutes | 231 | 6.7% |
| 20 to 24 Minutes | 144 | 4.2% |
| 25 to 29 Minutes | 96 | 2.8% |
| 30 to 34 Minutes | 494 | 14.3% |
| 35 to 39 Minutes | 201 | 5.8% |
| 40 to 44 Minutes | 25 | 0.7% |
| 45 to 59 Minutes | 112 | 3.3% |
| 60 to 89 Minutes | 125 | 3.6% |
| 90 or more Minutes | 41 | 1.2% |
Commute Time by Sex in Washington
The most common commute times in Washington are 5 to 9 minutes (477 commuters, 28.0%) for males and 5 to 9 minutes (522 commuters, 29.9%) for females.
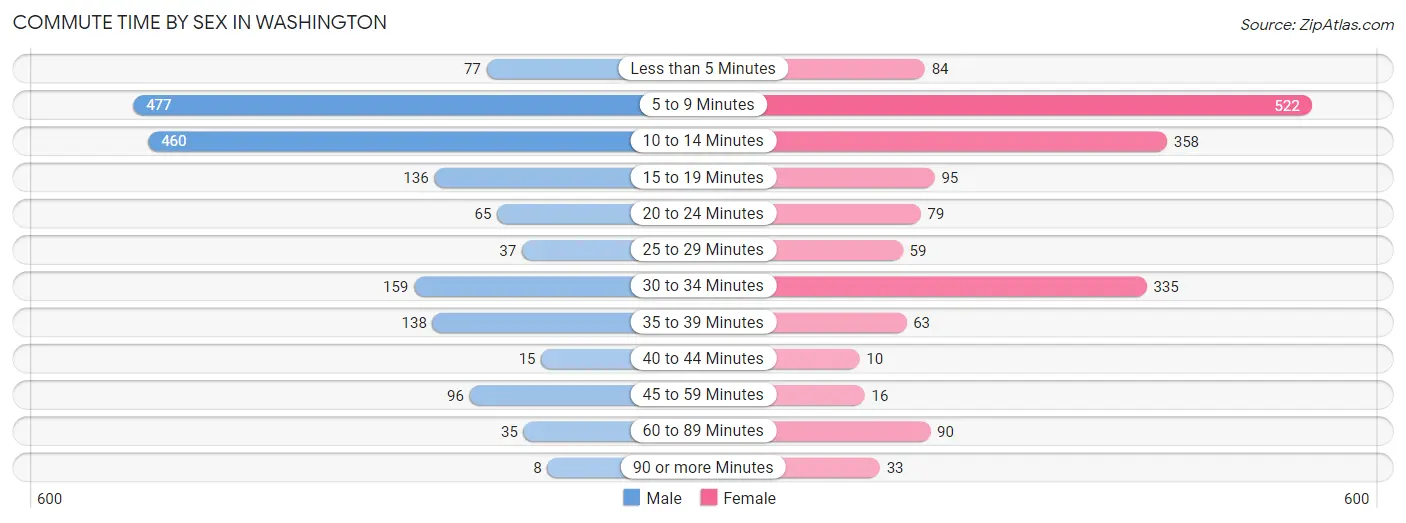
| Commute Time | Male | Female |
| Less than 5 Minutes | 77 (4.5%) | 84 (4.8%) |
| 5 to 9 Minutes | 477 (28.0%) | 522 (29.9%) |
| 10 to 14 Minutes | 460 (27.0%) | 358 (20.5%) |
| 15 to 19 Minutes | 136 (8.0%) | 95 (5.4%) |
| 20 to 24 Minutes | 65 (3.8%) | 79 (4.5%) |
| 25 to 29 Minutes | 37 (2.2%) | 59 (3.4%) |
| 30 to 34 Minutes | 159 (9.3%) | 335 (19.2%) |
| 35 to 39 Minutes | 138 (8.1%) | 63 (3.6%) |
| 40 to 44 Minutes | 15 (0.9%) | 10 (0.6%) |
| 45 to 59 Minutes | 96 (5.6%) | 16 (0.9%) |
| 60 to 89 Minutes | 35 (2.1%) | 90 (5.2%) |
| 90 or more Minutes | 8 (0.5%) | 33 (1.9%) |
Time of Departure to Work by Sex in Washington
The most frequent times of departure to work in Washington are 8:00 AM to 8:29 AM (369, 21.7%) for males and 8:00 AM to 8:29 AM (415, 23.8%) for females.
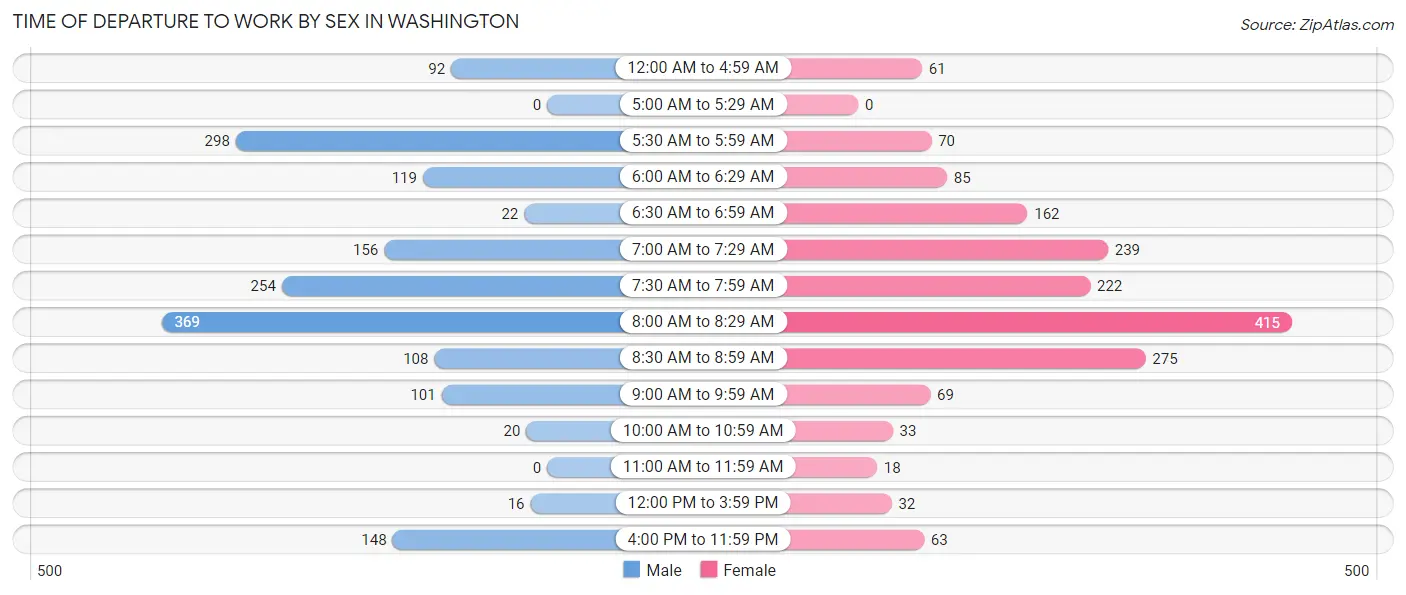
| Time of Departure | Male | Female |
| 12:00 AM to 4:59 AM | 92 (5.4%) | 61 (3.5%) |
| 5:00 AM to 5:29 AM | 0 (0.0%) | 0 (0.0%) |
| 5:30 AM to 5:59 AM | 298 (17.5%) | 70 (4.0%) |
| 6:00 AM to 6:29 AM | 119 (7.0%) | 85 (4.9%) |
| 6:30 AM to 6:59 AM | 22 (1.3%) | 162 (9.3%) |
| 7:00 AM to 7:29 AM | 156 (9.2%) | 239 (13.7%) |
| 7:30 AM to 7:59 AM | 254 (14.9%) | 222 (12.7%) |
| 8:00 AM to 8:29 AM | 369 (21.7%) | 415 (23.8%) |
| 8:30 AM to 8:59 AM | 108 (6.3%) | 275 (15.8%) |
| 9:00 AM to 9:59 AM | 101 (5.9%) | 69 (4.0%) |
| 10:00 AM to 10:59 AM | 20 (1.2%) | 33 (1.9%) |
| 11:00 AM to 11:59 AM | 0 (0.0%) | 18 (1.0%) |
| 12:00 PM to 3:59 PM | 16 (0.9%) | 32 (1.8%) |
| 4:00 PM to 11:59 PM | 148 (8.7%) | 63 (3.6%) |
| Total | 1,703 (100.0%) | 1,744 (100.0%) |
Housing Occupancy in Washington
Occupancy by Ownership in Washington
Of the total 4,372 dwellings in Washington, owner-occupied units account for 2,182 (49.9%), while renter-occupied units make up 2,190 (50.1%).
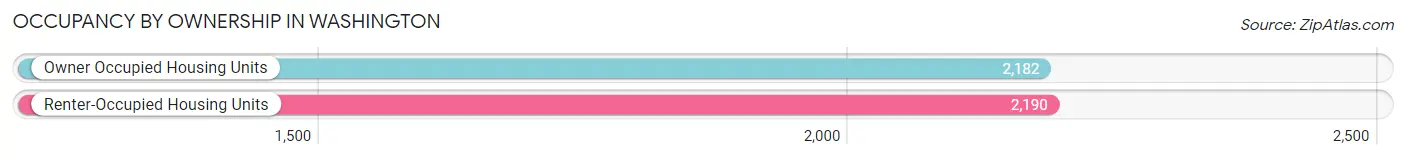
| Occupancy | # Housing Units | % Housing Units |
| Owner Occupied Housing Units | 2,182 | 49.9% |
| Renter-Occupied Housing Units | 2,190 | 50.1% |
| Total Occupied Housing Units | 4,372 | 100.0% |
Occupancy by Household Size in Washington
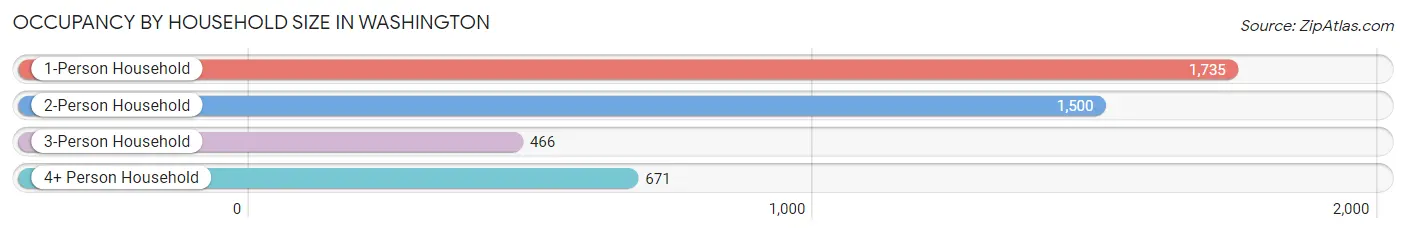
| Household Size | # Housing Units | % Housing Units |
| 1-Person Household | 1,735 | 39.7% |
| 2-Person Household | 1,500 | 34.3% |
| 3-Person Household | 466 | 10.7% |
| 4+ Person Household | 671 | 15.3% |
| Total Housing Units | 4,372 | 100.0% |
Occupancy by Ownership by Household Size in Washington
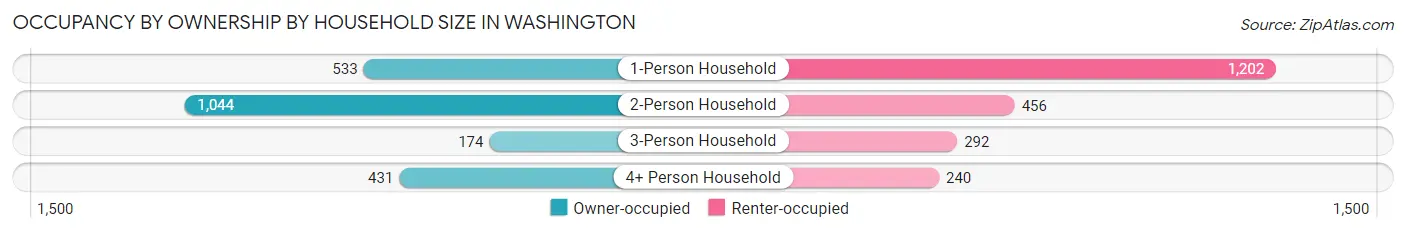
| Household Size | Owner-occupied | Renter-occupied |
| 1-Person Household | 533 (30.7%) | 1,202 (69.3%) |
| 2-Person Household | 1,044 (69.6%) | 456 (30.4%) |
| 3-Person Household | 174 (37.3%) | 292 (62.7%) |
| 4+ Person Household | 431 (64.2%) | 240 (35.8%) |
| Total Housing Units | 2,182 (49.9%) | 2,190 (50.1%) |
Occupancy by Educational Attainment in Washington
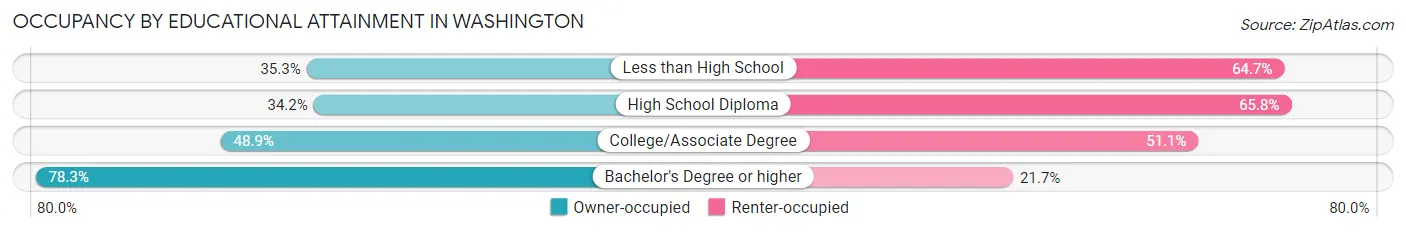
| Household Size | Owner-occupied | Renter-occupied |
| Less than High School | 168 (35.3%) | 308 (64.7%) |
| High School Diploma | 409 (34.2%) | 788 (65.8%) |
| College/Associate Degree | 845 (48.9%) | 883 (51.1%) |
| Bachelor's Degree or higher | 760 (78.3%) | 211 (21.7%) |
Occupancy by Age of Householder in Washington
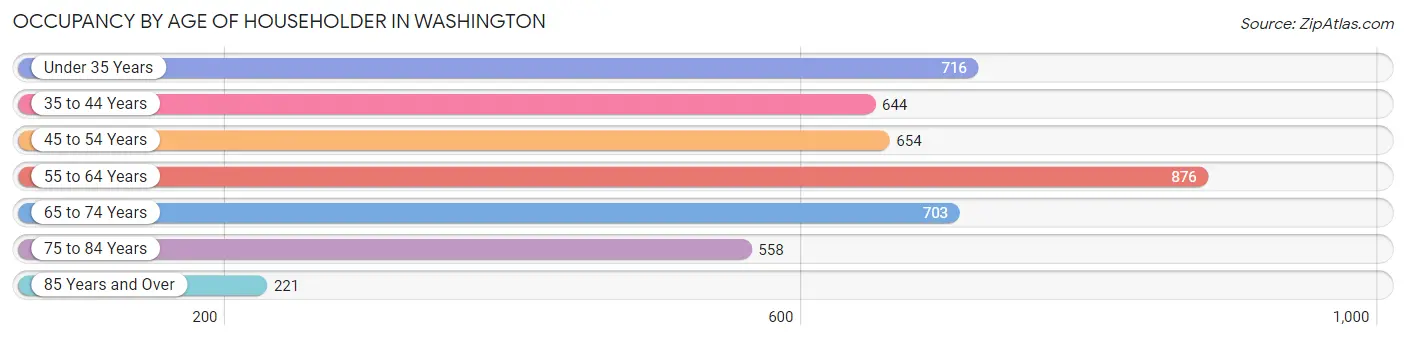
| Age Bracket | # Households | % Households |
| Under 35 Years | 716 | 16.4% |
| 35 to 44 Years | 644 | 14.7% |
| 45 to 54 Years | 654 | 15.0% |
| 55 to 64 Years | 876 | 20.0% |
| 65 to 74 Years | 703 | 16.1% |
| 75 to 84 Years | 558 | 12.8% |
| 85 Years and Over | 221 | 5.1% |
| Total | 4,372 | 100.0% |
Housing Finances in Washington
Median Income by Occupancy in Washington
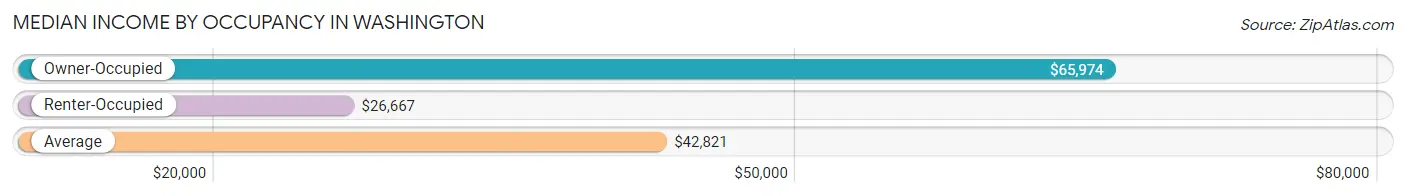
| Occupancy Type | # Households | Median Income |
| Owner-Occupied | 2,182 (49.9%) | $65,974 |
| Renter-Occupied | 2,190 (50.1%) | $26,667 |
| Average | 4,372 (100.0%) | $42,821 |
Occupancy by Householder Income Bracket in Washington
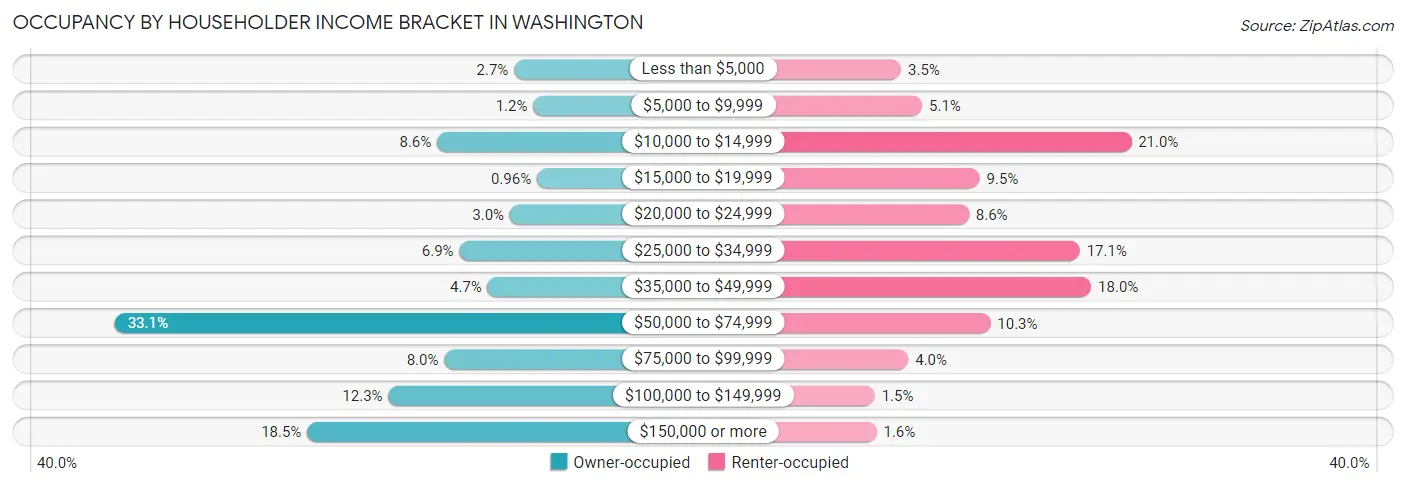
| Income Bracket | Owner-occupied | Renter-occupied |
| Less than $5,000 | 59 (2.7%) | 76 (3.5%) |
| $5,000 to $9,999 | 27 (1.2%) | 111 (5.1%) |
| $10,000 to $14,999 | 187 (8.6%) | 460 (21.0%) |
| $15,000 to $19,999 | 21 (1.0%) | 207 (9.5%) |
| $20,000 to $24,999 | 66 (3.0%) | 189 (8.6%) |
| $25,000 to $34,999 | 150 (6.9%) | 374 (17.1%) |
| $35,000 to $49,999 | 103 (4.7%) | 393 (17.9%) |
| $50,000 to $74,999 | 723 (33.1%) | 225 (10.3%) |
| $75,000 to $99,999 | 175 (8.0%) | 88 (4.0%) |
| $100,000 to $149,999 | 268 (12.3%) | 32 (1.5%) |
| $150,000 or more | 403 (18.5%) | 35 (1.6%) |
| Total | 2,182 (100.0%) | 2,190 (100.0%) |
Monthly Housing Cost Tiers in Washington
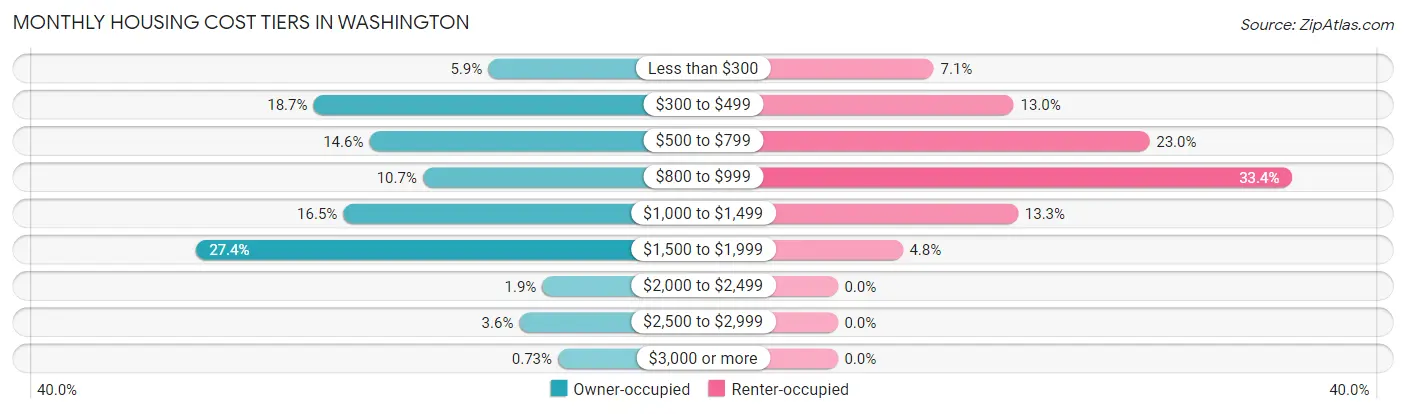
| Monthly Cost | Owner-occupied | Renter-occupied |
| Less than $300 | 128 (5.9%) | 155 (7.1%) |
| $300 to $499 | 409 (18.7%) | 284 (13.0%) |
| $500 to $799 | 319 (14.6%) | 503 (23.0%) |
| $800 to $999 | 233 (10.7%) | 732 (33.4%) |
| $1,000 to $1,499 | 361 (16.5%) | 291 (13.3%) |
| $1,500 to $1,999 | 597 (27.4%) | 105 (4.8%) |
| $2,000 to $2,499 | 41 (1.9%) | 0 (0.0%) |
| $2,500 to $2,999 | 78 (3.6%) | 0 (0.0%) |
| $3,000 or more | 16 (0.7%) | 0 (0.0%) |
| Total | 2,182 (100.0%) | 2,190 (100.0%) |
Physical Housing Characteristics in Washington
Housing Structures in Washington
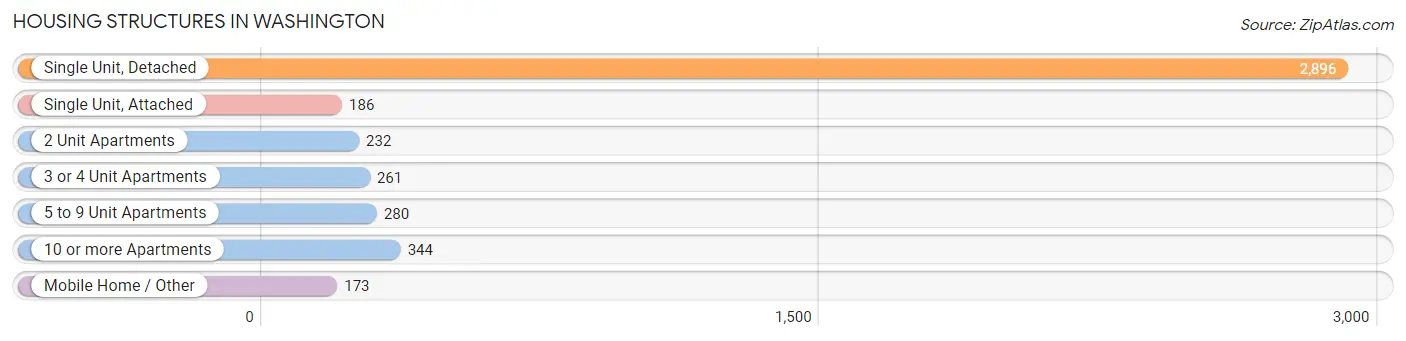
| Structure Type | # Housing Units | % Housing Units |
| Single Unit, Detached | 2,896 | 66.2% |
| Single Unit, Attached | 186 | 4.3% |
| 2 Unit Apartments | 232 | 5.3% |
| 3 or 4 Unit Apartments | 261 | 6.0% |
| 5 to 9 Unit Apartments | 280 | 6.4% |
| 10 or more Apartments | 344 | 7.9% |
| Mobile Home / Other | 173 | 4.0% |
| Total | 4,372 | 100.0% |
Housing Structures by Occupancy in Washington
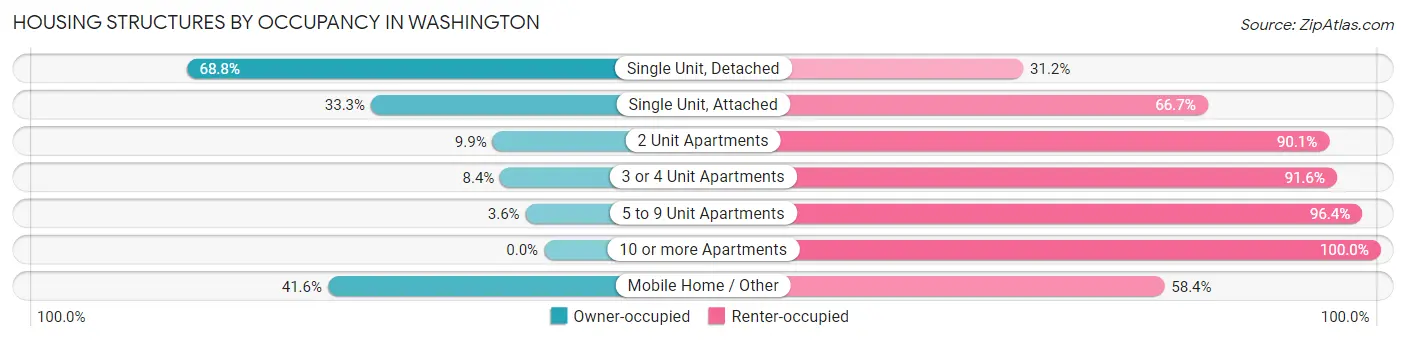
| Structure Type | Owner-occupied | Renter-occupied |
| Single Unit, Detached | 1,993 (68.8%) | 903 (31.2%) |
| Single Unit, Attached | 62 (33.3%) | 124 (66.7%) |
| 2 Unit Apartments | 23 (9.9%) | 209 (90.1%) |
| 3 or 4 Unit Apartments | 22 (8.4%) | 239 (91.6%) |
| 5 to 9 Unit Apartments | 10 (3.6%) | 270 (96.4%) |
| 10 or more Apartments | 0 (0.0%) | 344 (100.0%) |
| Mobile Home / Other | 72 (41.6%) | 101 (58.4%) |
| Total | 2,182 (49.9%) | 2,190 (50.1%) |
Housing Structures by Number of Rooms in Washington
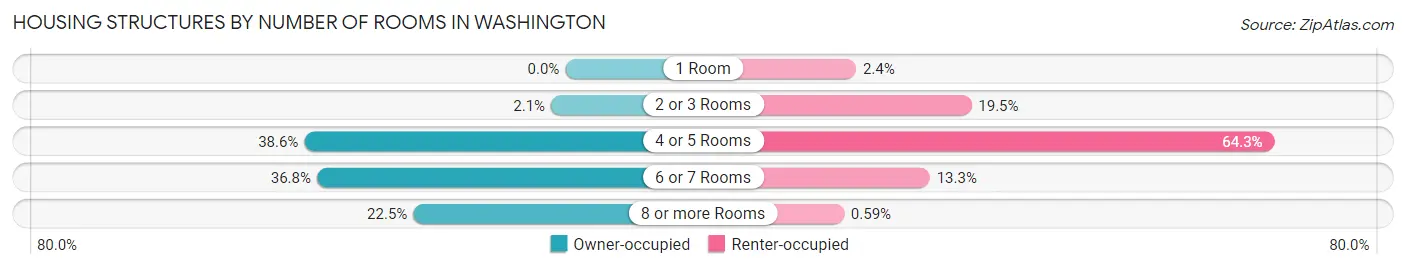
| Number of Rooms | Owner-occupied | Renter-occupied |
| 1 Room | 0 (0.0%) | 52 (2.4%) |
| 2 or 3 Rooms | 46 (2.1%) | 426 (19.5%) |
| 4 or 5 Rooms | 843 (38.6%) | 1,408 (64.3%) |
| 6 or 7 Rooms | 802 (36.8%) | 291 (13.3%) |
| 8 or more Rooms | 491 (22.5%) | 13 (0.6%) |
| Total | 2,182 (100.0%) | 2,190 (100.0%) |
Housing Structure by Heating Type in Washington
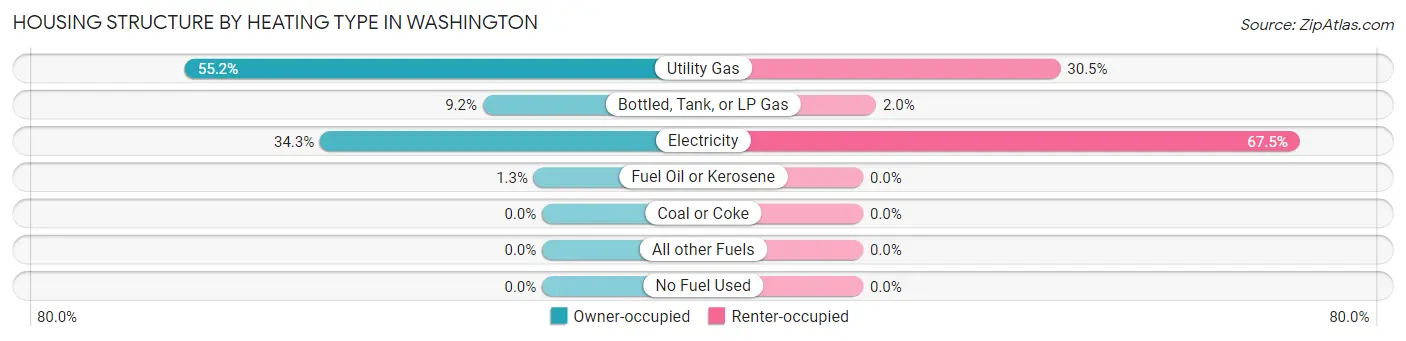
| Heating Type | Owner-occupied | Renter-occupied |
| Utility Gas | 1,205 (55.2%) | 668 (30.5%) |
| Bottled, Tank, or LP Gas | 200 (9.2%) | 44 (2.0%) |
| Electricity | 749 (34.3%) | 1,478 (67.5%) |
| Fuel Oil or Kerosene | 28 (1.3%) | 0 (0.0%) |
| Coal or Coke | 0 (0.0%) | 0 (0.0%) |
| All other Fuels | 0 (0.0%) | 0 (0.0%) |
| No Fuel Used | 0 (0.0%) | 0 (0.0%) |
| Total | 2,182 (100.0%) | 2,190 (100.0%) |
Household Vehicle Usage in Washington
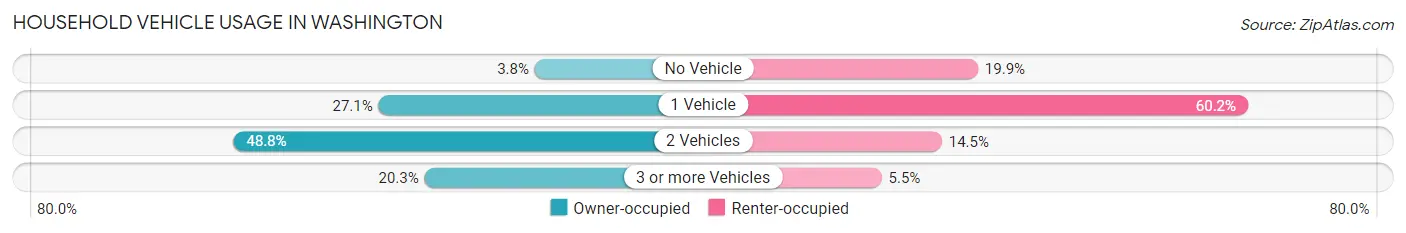
| Vehicles per Household | Owner-occupied | Renter-occupied |
| No Vehicle | 83 (3.8%) | 435 (19.9%) |
| 1 Vehicle | 592 (27.1%) | 1,318 (60.2%) |
| 2 Vehicles | 1,065 (48.8%) | 317 (14.5%) |
| 3 or more Vehicles | 442 (20.3%) | 120 (5.5%) |
| Total | 2,182 (100.0%) | 2,190 (100.0%) |
Real Estate & Mortgages in Washington
Real Estate and Mortgage Overview in Washington
| Characteristic | Without Mortgage | With Mortgage |
| Housing Units | 1,017 | 1,165 |
| Median Property Value | $116,900 | $208,900 |
| Median Household Income | $53,153 | $239 |
| Monthly Housing Costs | $482 | $16 |
| Real Estate Taxes | $1,253 | $18 |
Property Value by Mortgage Status in Washington
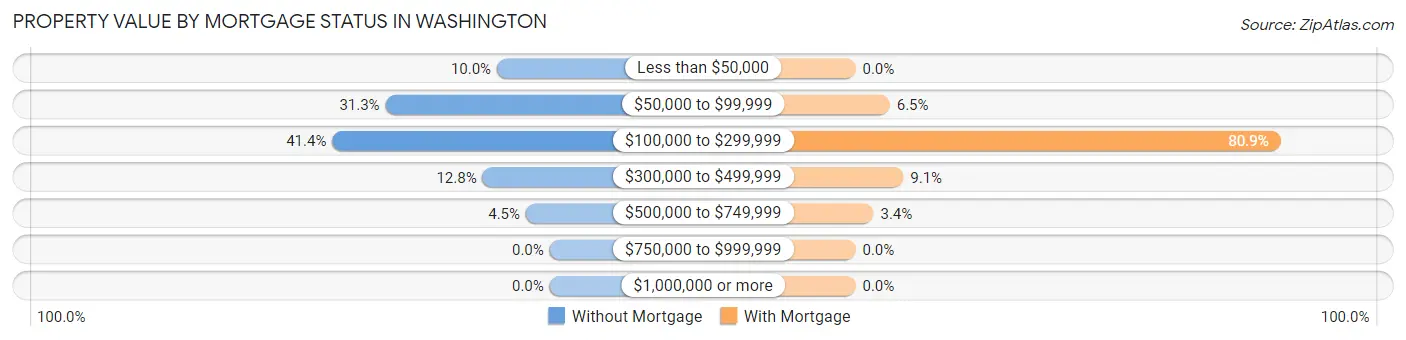
| Property Value | Without Mortgage | With Mortgage |
| Less than $50,000 | 102 (10.0%) | 0 (0.0%) |
| $50,000 to $99,999 | 318 (31.3%) | 76 (6.5%) |
| $100,000 to $299,999 | 421 (41.4%) | 943 (80.9%) |
| $300,000 to $499,999 | 130 (12.8%) | 106 (9.1%) |
| $500,000 to $749,999 | 46 (4.5%) | 40 (3.4%) |
| $750,000 to $999,999 | 0 (0.0%) | 0 (0.0%) |
| $1,000,000 or more | 0 (0.0%) | 0 (0.0%) |
| Total | 1,017 (100.0%) | 1,165 (100.0%) |
Household Income by Mortgage Status in Washington
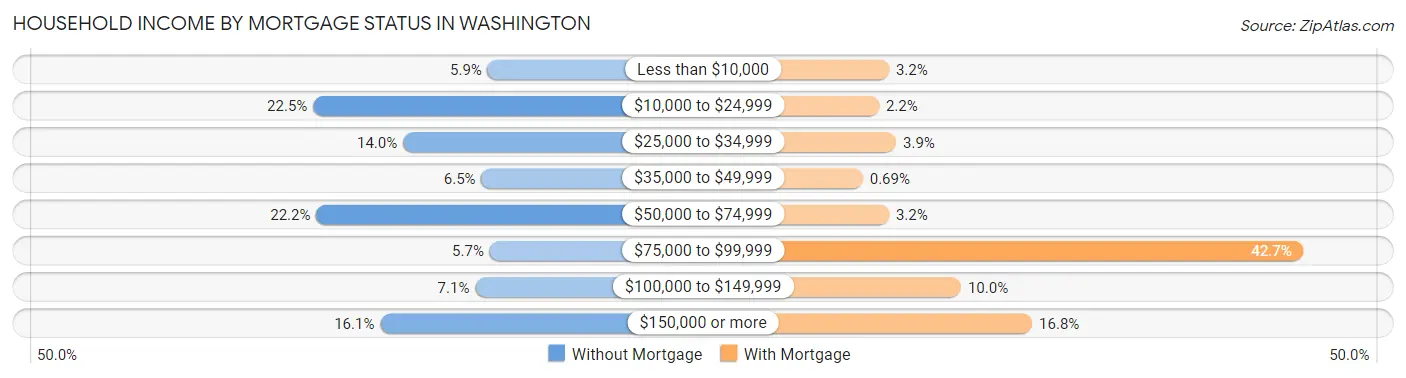
| Household Income | Without Mortgage | With Mortgage |
| Less than $10,000 | 60 (5.9%) | 37 (3.2%) |
| $10,000 to $24,999 | 229 (22.5%) | 26 (2.2%) |
| $25,000 to $34,999 | 142 (14.0%) | 45 (3.9%) |
| $35,000 to $49,999 | 66 (6.5%) | 8 (0.7%) |
| $50,000 to $74,999 | 226 (22.2%) | 37 (3.2%) |
| $75,000 to $99,999 | 58 (5.7%) | 497 (42.7%) |
| $100,000 to $149,999 | 72 (7.1%) | 117 (10.0%) |
| $150,000 or more | 164 (16.1%) | 196 (16.8%) |
| Total | 1,017 (100.0%) | 1,165 (100.0%) |
Property Value to Household Income Ratio in Washington
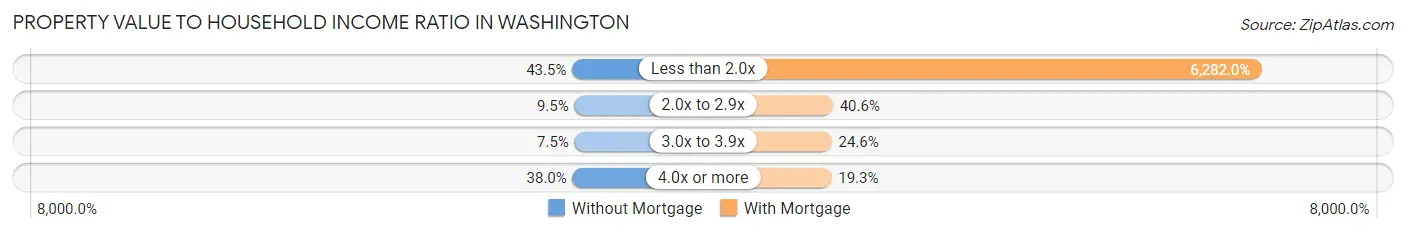
| Value-to-Income Ratio | Without Mortgage | With Mortgage |
| Less than 2.0x | 442 (43.5%) | 73,185 (6,282.0%) |
| 2.0x to 2.9x | 97 (9.5%) | 473 (40.6%) |
| 3.0x to 3.9x | 76 (7.5%) | 286 (24.5%) |
| 4.0x or more | 386 (38.0%) | 225 (19.3%) |
| Total | 1,017 (100.0%) | 1,165 (100.0%) |
Real Estate Taxes by Mortgage Status in Washington
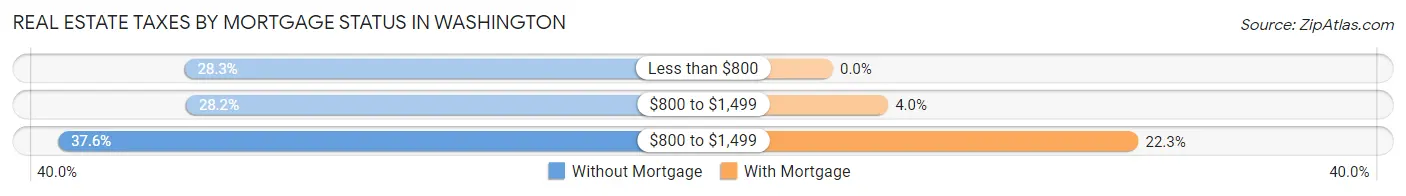
| Property Taxes | Without Mortgage | With Mortgage |
| Less than $800 | 288 (28.3%) | 0 (0.0%) |
| $800 to $1,499 | 287 (28.2%) | 47 (4.0%) |
| $800 to $1,499 | 382 (37.6%) | 260 (22.3%) |
| Total | 1,017 (100.0%) | 1,165 (100.0%) |
Health & Disability in Washington
Health Insurance Coverage by Age in Washington
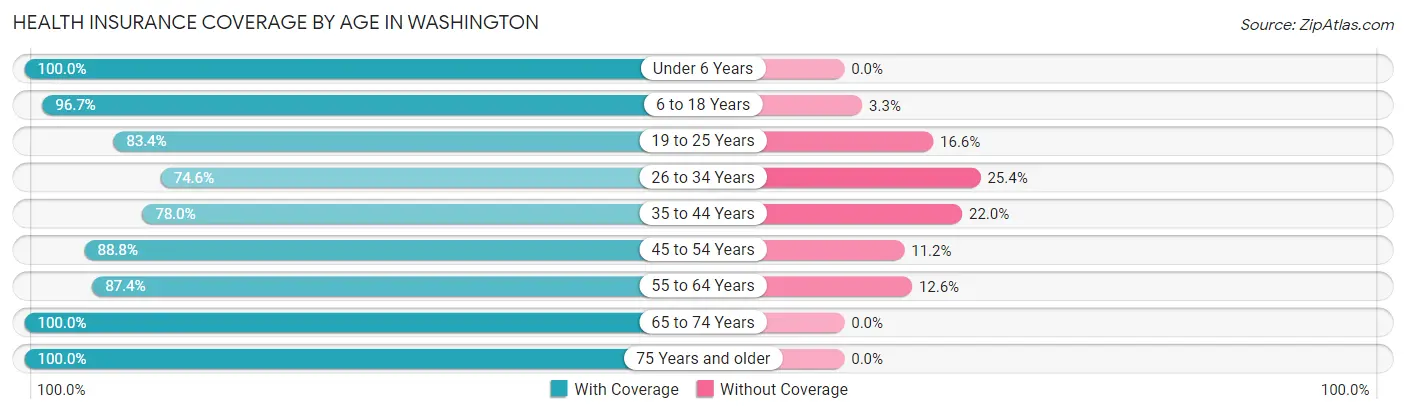
| Age Bracket | With Coverage | Without Coverage |
| Under 6 Years | 639 (100.0%) | 0 (0.0%) |
| 6 to 18 Years | 1,482 (96.7%) | 51 (3.3%) |
| 19 to 25 Years | 529 (83.4%) | 105 (16.6%) |
| 26 to 34 Years | 752 (74.6%) | 256 (25.4%) |
| 35 to 44 Years | 668 (78.0%) | 188 (22.0%) |
| 45 to 54 Years | 1,040 (88.8%) | 131 (11.2%) |
| 55 to 64 Years | 1,309 (87.4%) | 189 (12.6%) |
| 65 to 74 Years | 1,055 (100.0%) | 0 (0.0%) |
| 75 Years and older | 984 (100.0%) | 0 (0.0%) |
| Total | 8,458 (90.2%) | 920 (9.8%) |
Health Insurance Coverage by Citizenship Status in Washington
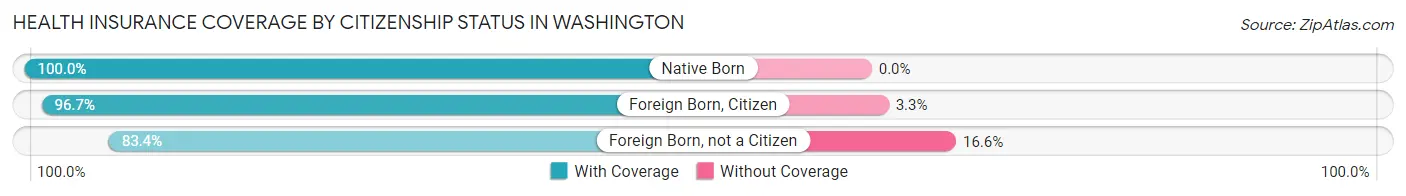
| Citizenship Status | With Coverage | Without Coverage |
| Native Born | 639 (100.0%) | 0 (0.0%) |
| Foreign Born, Citizen | 1,482 (96.7%) | 51 (3.3%) |
| Foreign Born, not a Citizen | 529 (83.4%) | 105 (16.6%) |
Health Insurance Coverage by Household Income in Washington
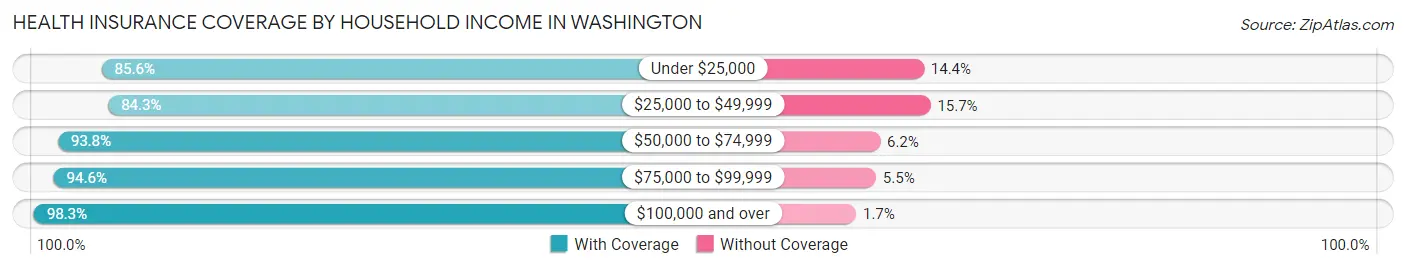
| Household Income | With Coverage | Without Coverage |
| Under $25,000 | 2,002 (85.6%) | 338 (14.4%) |
| $25,000 to $49,999 | 1,813 (84.3%) | 337 (15.7%) |
| $50,000 to $74,999 | 2,017 (93.8%) | 134 (6.2%) |
| $75,000 to $99,999 | 729 (94.6%) | 42 (5.4%) |
| $100,000 and over | 1,874 (98.3%) | 33 (1.7%) |
Public vs Private Health Insurance Coverage by Age in Washington
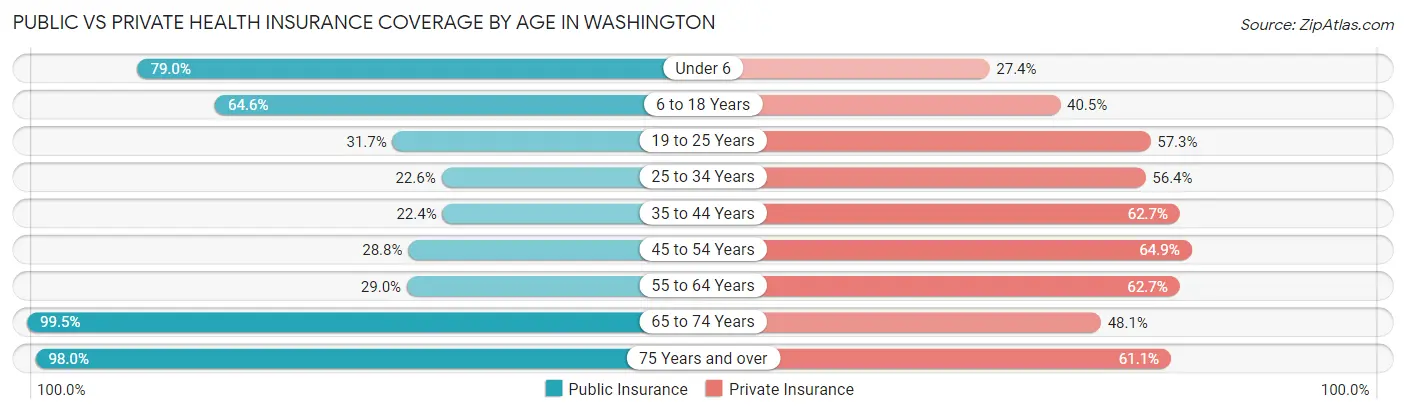
| Age Bracket | Public Insurance | Private Insurance |
| Under 6 | 505 (79.0%) | 175 (27.4%) |
| 6 to 18 Years | 991 (64.6%) | 621 (40.5%) |
| 19 to 25 Years | 201 (31.7%) | 363 (57.3%) |
| 25 to 34 Years | 228 (22.6%) | 568 (56.4%) |
| 35 to 44 Years | 192 (22.4%) | 537 (62.7%) |
| 45 to 54 Years | 337 (28.8%) | 760 (64.9%) |
| 55 to 64 Years | 435 (29.0%) | 939 (62.7%) |
| 65 to 74 Years | 1,050 (99.5%) | 507 (48.1%) |
| 75 Years and over | 964 (98.0%) | 601 (61.1%) |
| Total | 4,903 (52.3%) | 5,071 (54.1%) |
Disability Status by Sex by Age in Washington
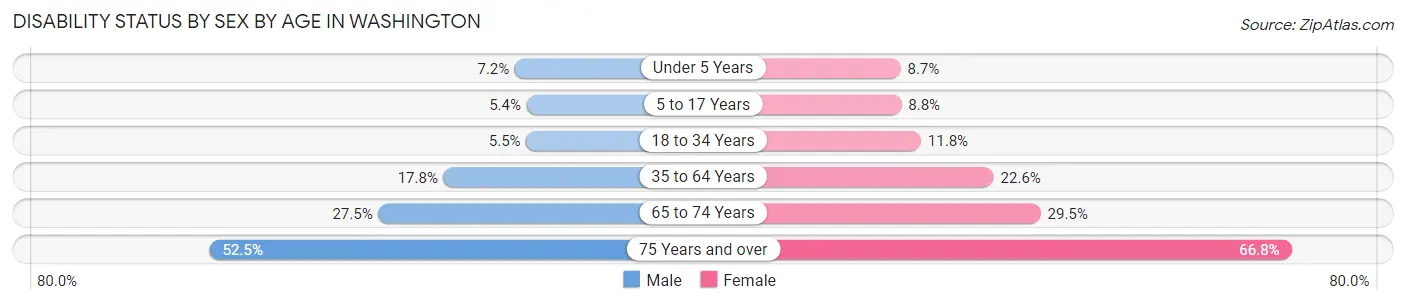
| Age Bracket | Male | Female |
| Under 5 Years | 28 (7.2%) | 15 (8.7%) |
| 5 to 17 Years | 44 (5.4%) | 63 (8.8%) |
| 18 to 34 Years | 35 (5.5%) | 128 (11.7%) |
| 35 to 64 Years | 322 (17.8%) | 386 (22.6%) |
| 65 to 74 Years | 112 (27.5%) | 191 (29.5%) |
| 75 Years and over | 155 (52.5%) | 460 (66.8%) |
Disability Class by Sex by Age in Washington
Disability Class: Hearing Difficulty
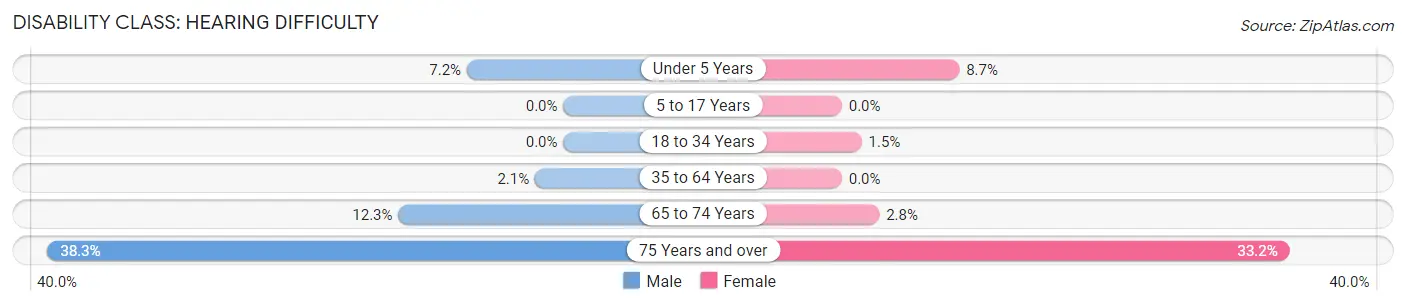
| Age Bracket | Male | Female |
| Under 5 Years | 28 (7.2%) | 15 (8.7%) |
| 5 to 17 Years | 0 (0.0%) | 0 (0.0%) |
| 18 to 34 Years | 0 (0.0%) | 16 (1.5%) |
| 35 to 64 Years | 38 (2.1%) | 0 (0.0%) |
| 65 to 74 Years | 50 (12.2%) | 18 (2.8%) |
| 75 Years and over | 113 (38.3%) | 229 (33.2%) |
Disability Class: Vision Difficulty
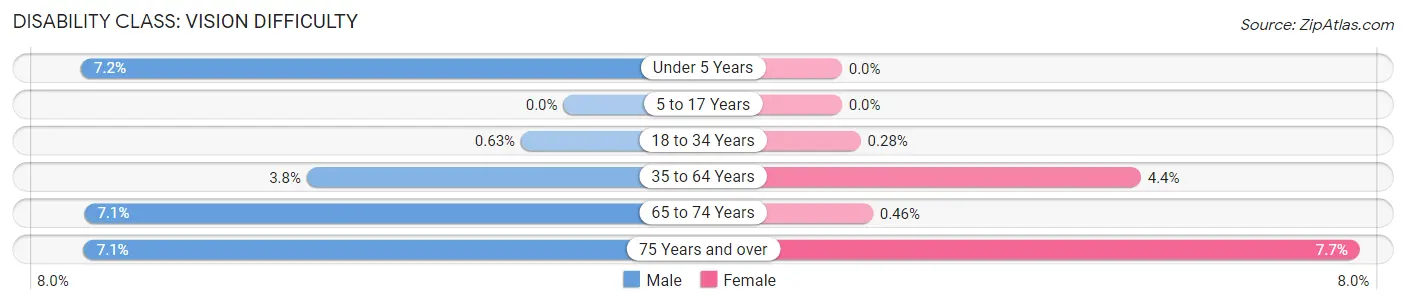
| Age Bracket | Male | Female |
| Under 5 Years | 28 (7.2%) | 0 (0.0%) |
| 5 to 17 Years | 0 (0.0%) | 0 (0.0%) |
| 18 to 34 Years | 4 (0.6%) | 3 (0.3%) |
| 35 to 64 Years | 69 (3.8%) | 76 (4.4%) |
| 65 to 74 Years | 29 (7.1%) | 3 (0.5%) |
| 75 Years and over | 21 (7.1%) | 53 (7.7%) |
Disability Class: Cognitive Difficulty
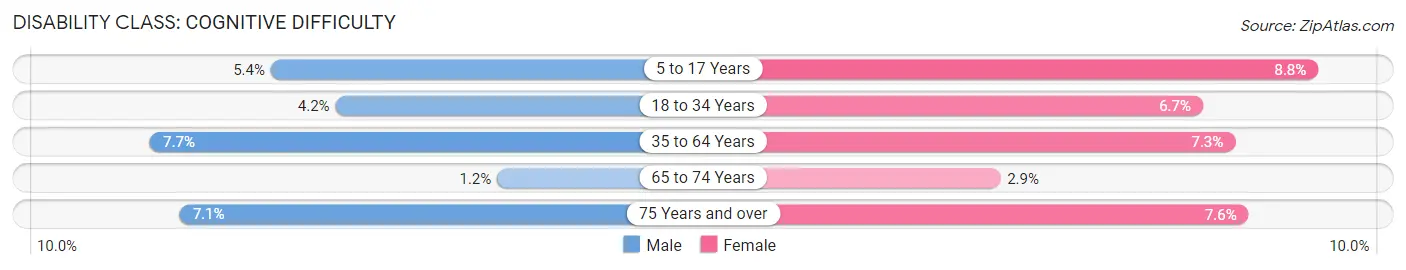
| Age Bracket | Male | Female |
| 5 to 17 Years | 44 (5.4%) | 63 (8.8%) |
| 18 to 34 Years | 27 (4.2%) | 73 (6.7%) |
| 35 to 64 Years | 139 (7.7%) | 125 (7.3%) |
| 65 to 74 Years | 5 (1.2%) | 19 (2.9%) |
| 75 Years and over | 21 (7.1%) | 52 (7.5%) |
Disability Class: Ambulatory Difficulty
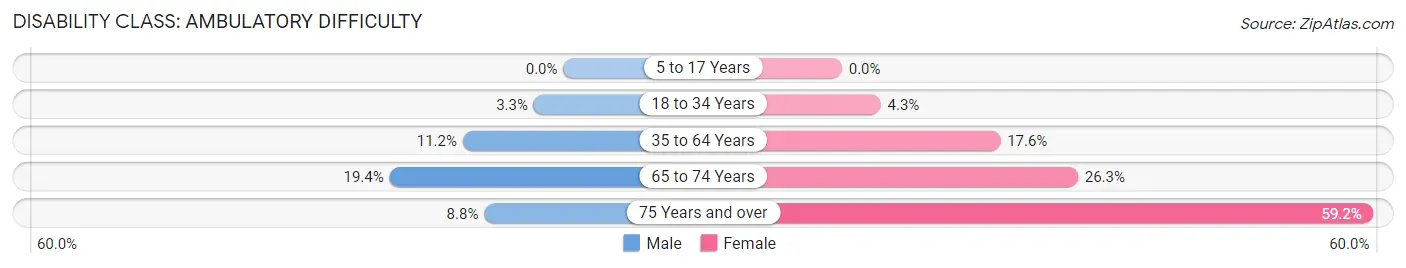
| Age Bracket | Male | Female |
| 5 to 17 Years | 0 (0.0%) | 0 (0.0%) |
| 18 to 34 Years | 21 (3.3%) | 47 (4.3%) |
| 35 to 64 Years | 203 (11.2%) | 302 (17.6%) |
| 65 to 74 Years | 79 (19.4%) | 170 (26.3%) |
| 75 Years and over | 26 (8.8%) | 408 (59.2%) |
Disability Class: Self-Care Difficulty
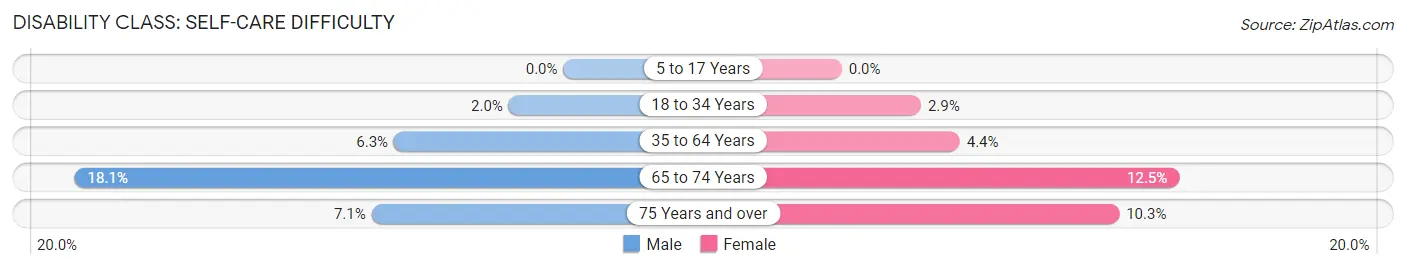
| Age Bracket | Male | Female |
| 5 to 17 Years | 0 (0.0%) | 0 (0.0%) |
| 18 to 34 Years | 13 (2.0%) | 32 (2.9%) |
| 35 to 64 Years | 114 (6.3%) | 75 (4.4%) |
| 65 to 74 Years | 74 (18.1%) | 81 (12.5%) |
| 75 Years and over | 21 (7.1%) | 71 (10.3%) |
Technology Access in Washington
Computing Device Access in Washington
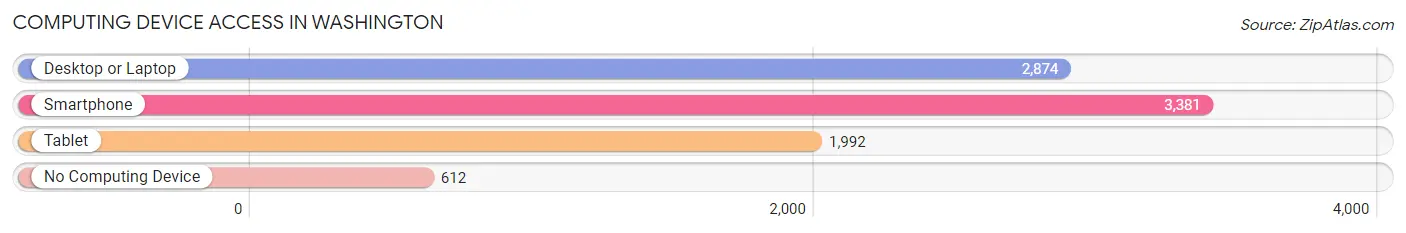
| Device Type | # Households | % Households |
| Desktop or Laptop | 2,874 | 65.7% |
| Smartphone | 3,381 | 77.3% |
| Tablet | 1,992 | 45.6% |
| No Computing Device | 612 | 14.0% |
| Total | 4,372 | 100.0% |
Internet Access in Washington
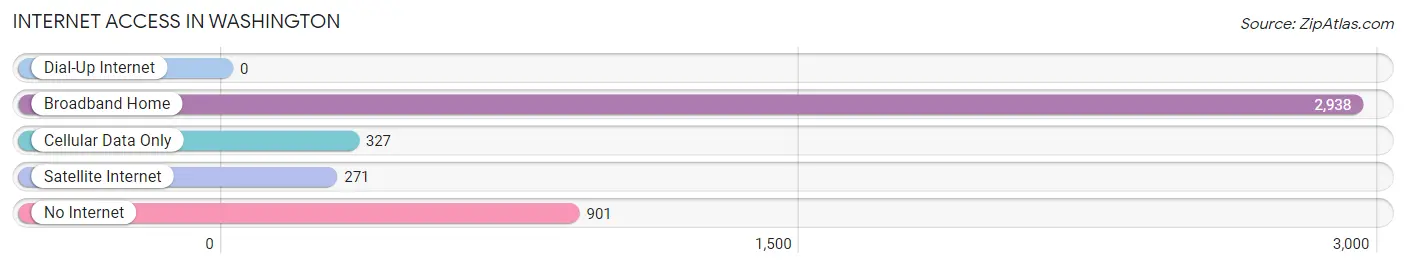
| Internet Type | # Households | % Households |
| Dial-Up Internet | 0 | 0.0% |
| Broadband Home | 2,938 | 67.2% |
| Cellular Data Only | 327 | 7.5% |
| Satellite Internet | 271 | 6.2% |
| No Internet | 901 | 20.6% |
| Total | 4,372 | 100.0% |
Washington Summary
Washington, North Carolina is a small city located in Beaufort County, North Carolina. It is situated on the Pamlico River, which is part of the Intracoastal Waterway. The city is the county seat of Beaufort County and is the largest city in the county. Washington is known for its historic downtown area, which is home to many shops, restaurants, and other attractions.
Geography
Washington is located in the Coastal Plain region of North Carolina, which is characterized by flat terrain and sandy soils. The city is situated on the Pamlico River, which is part of the Intracoastal Waterway. The city is located approximately 50 miles east of Greenville, North Carolina and approximately 70 miles south of Norfolk, Virginia.
The city has a total area of 8.3 square miles, of which 8.2 square miles is land and 0.1 square miles is water. The city is located at an elevation of 16 feet above sea level.
Economy
Washington’s economy is largely based on tourism and agriculture. The city is home to several tourist attractions, including the Washington Waterfront Park, the Washington Historic District, and the Washington County Museum. The city is also home to several agricultural businesses, including poultry farms, hog farms, and vegetable farms.
The city is also home to several manufacturing companies, including a paper mill, a furniture factory, and a boat manufacturing plant. The city is also home to several retail stores, including a Walmart Supercenter, a Lowe’s Home Improvement store, and several other stores.
Demographics
As of the 2010 census, the population of Washington was 9,744. The racial makeup of the city was 57.3% White, 37.2% African American, 0.4% Native American, 0.7% Asian, 0.1% Pacific Islander, and 4.3% from other races. The median household income in the city was $31,945, and the median family income was $41,945.
The city is home to several churches, including the First Baptist Church, the First Presbyterian Church, and the St. Peter’s Episcopal Church. The city is also home to several schools, including the Washington High School, the Washington Middle School, and the Washington Elementary School.
Conclusion
Washington, North Carolina is a small city located in Beaufort County, North Carolina. It is situated on the Pamlico River, which is part of the Intracoastal Waterway. The city is the county seat of Beaufort County and is the largest city in the county. Washington is known for its historic downtown area, which is home to many shops, restaurants, and other attractions. The city’s economy is largely based on tourism and agriculture, and it is home to several manufacturing companies, retail stores, and churches. As of the 2010 census, the population of Washington was 9,744. The racial makeup of the city was 57.3% White, 37.2% African American, 0.4% Native American, 0.7% Asian, 0.1% Pacific Islander, and 4.3% from other races. The median household income in the city was $31,945, and the median family income was $41,945.
Common Questions
What is the Total Population of Washington?
Total Population of Washington is 9,759.
What is the Total Male Population of Washington?
Total Male Population of Washington is 4,561.
What is the Total Female Population of Washington?
Total Female Population of Washington is 5,198.
What is the Ratio of Males per 100 Females in Washington?
There are 87.75 Males per 100 Females in Washington.
What is the Ratio of Females per 100 Males in Washington?
There are 113.97 Females per 100 Males in Washington.
What is the Median Population Age in Washington?
Median Population Age in Washington is 46.2 Years.
What is the Average Family Size in Washington
Average Family Size in Washington is 2.9 People.
What is the Average Household Size in Washington
Average Household Size in Washington is 2.1 People.
What is Per Capita Income in Washington?
Per Capita income in Washington is $31,110.
What is the Median Family Income in Washington?
Median Family Income in Washington is $62,813.
What is the Median Household income in Washington?
Median Household Income in Washington is $42,821.
What is Income or Wage Gap in Washington?
Income or Wage Gap in Washington is 4.6%.
Women in Washington earn 95.4 cents for every dollar earned by a man.
What is Family Income Deficit in Washington?
Family Income Deficit in Washington is $11,479.
Families that are below poverty line in Washington earn $11,479 less on average than the poverty threshold level.
What is Inequality or Gini Index in Washington?
Inequality or Gini Index in Washington is 0.54.
How Large is the Labor Force in Washington?
There are 4,042 People in the Labor Forcein in Washington.
What is the Percentage of People in the Labor Force in Washington?
51.6% of People are in the Labor Force in Washington.
What is the Unemployment Rate in Washington?
Unemployment Rate in Washington is 5.6%.