Ayden, NC
Ayden Map
Ayden Overview
5,002
TOTAL POPULATION
2,356
MALE POPULATION
2,646
FEMALE POPULATION
89.04
MALES / 100 FEMALES
112.31
FEMALES / 100 MALES
44.7
MEDIAN AGE
3.0
AVG FAMILY SIZE
2.2
AVG HOUSEHOLD SIZE
$25,067
PER CAPITA INCOME
$71,354
AVG FAMILY INCOME
$53,000
AVG HOUSEHOLD INCOME
11.8%
WAGE / INCOME GAP [ % ]
88.2¢/ $1
WAGE / INCOME GAP [ $ ]
0.43
INEQUALITY / GINI INDEX
1,970
LABOR FORCE [ PEOPLE ]
51.2%
PERCENT IN LABOR FORCE
1.8%
UNEMPLOYMENT RATE
Ayden Zip Codes
Ayden Area Codes
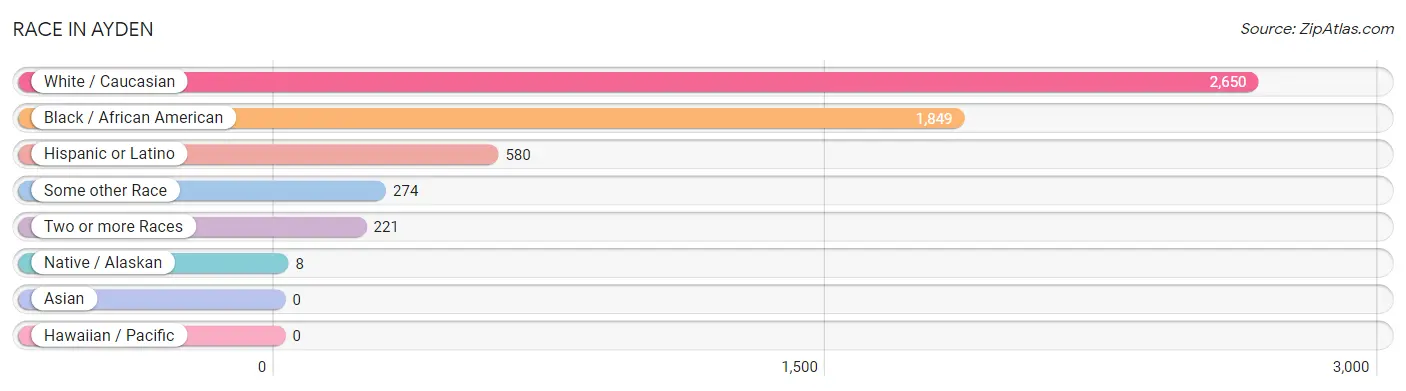
Race in Ayden
The most populous races in Ayden are White / Caucasian (2,650 | 53.0%), Black / African American (1,849 | 37.0%), and Hispanic or Latino (580 | 11.6%).
| Race | # Population | % Population |
| Asian | 0 | 0.0% |
| Black / African American | 1,849 | 37.0% |
| Hawaiian / Pacific | 0 | 0.0% |
| Hispanic or Latino | 580 | 11.6% |
| Native / Alaskan | 8 | 0.2% |
| White / Caucasian | 2,650 | 53.0% |
| Two or more Races | 221 | 4.4% |
| Some other Race | 274 | 5.5% |
| Total | 5,002 | 100.0% |
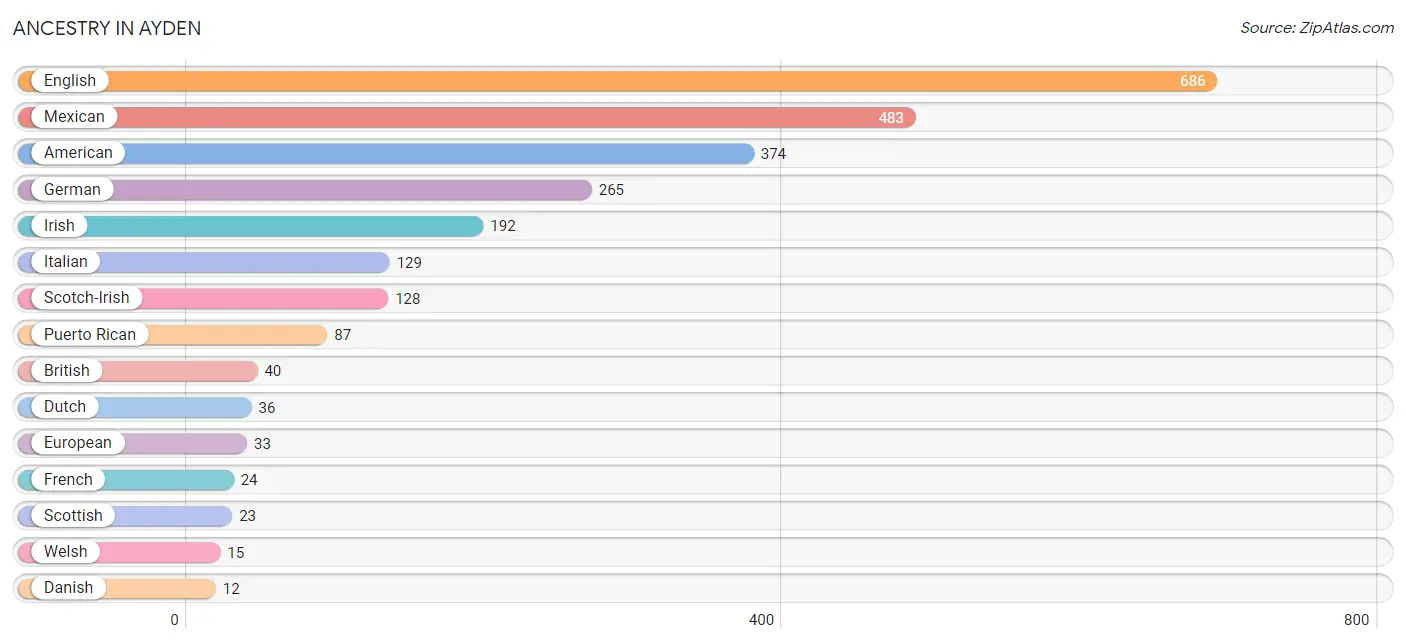
Ancestry in Ayden
The most populous ancestries reported in Ayden are English (686 | 13.7%), Mexican (483 | 9.7%), American (374 | 7.5%), German (265 | 5.3%), and Irish (192 | 3.8%), together accounting for 40.0% of all Ayden residents.
| Ancestry | # Population | % Population |
| American | 374 | 7.5% |
| Arab | 10 | 0.2% |
| British | 40 | 0.8% |
| Central American | 10 | 0.2% |
| Danish | 12 | 0.2% |
| Dutch | 36 | 0.7% |
| English | 686 | 13.7% |
| European | 33 | 0.7% |
| French | 24 | 0.5% |
| German | 265 | 5.3% |
| Honduran | 10 | 0.2% |
| Irish | 192 | 3.8% |
| Italian | 129 | 2.6% |
| Mexican | 483 | 9.7% |
| Mexican American Indian | 8 | 0.2% |
| Puerto Rican | 87 | 1.7% |
| Scandinavian | 6 | 0.1% |
| Scotch-Irish | 128 | 2.6% |
| Scottish | 23 | 0.5% |
| Welsh | 15 | 0.3% | View All 20 Rows |
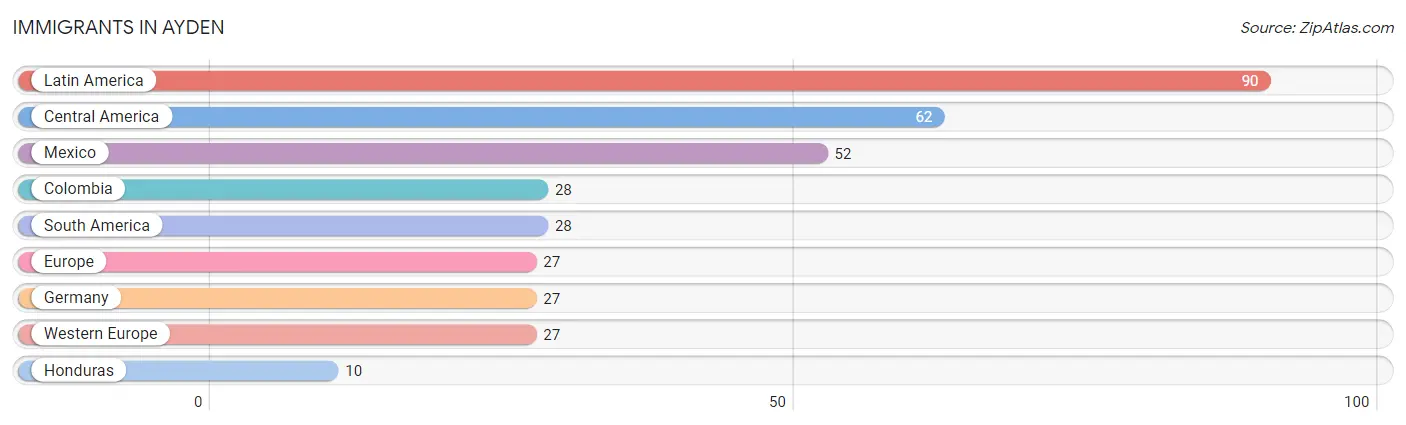
Immigrants in Ayden
The most numerous immigrant groups reported in Ayden came from Latin America (90 | 1.8%), Central America (62 | 1.2%), Mexico (52 | 1.0%), Colombia (28 | 0.6%), and South America (28 | 0.6%), together accounting for 5.2% of all Ayden residents.
| Immigration Origin | # Population | % Population |
| Central America | 62 | 1.2% |
| Colombia | 28 | 0.6% |
| Europe | 27 | 0.5% |
| Germany | 27 | 0.5% |
| Honduras | 10 | 0.2% |
| Latin America | 90 | 1.8% |
| Mexico | 52 | 1.0% |
| South America | 28 | 0.6% |
| Western Europe | 27 | 0.5% | View All 9 Rows |
Sex and Age in Ayden
Sex and Age in Ayden
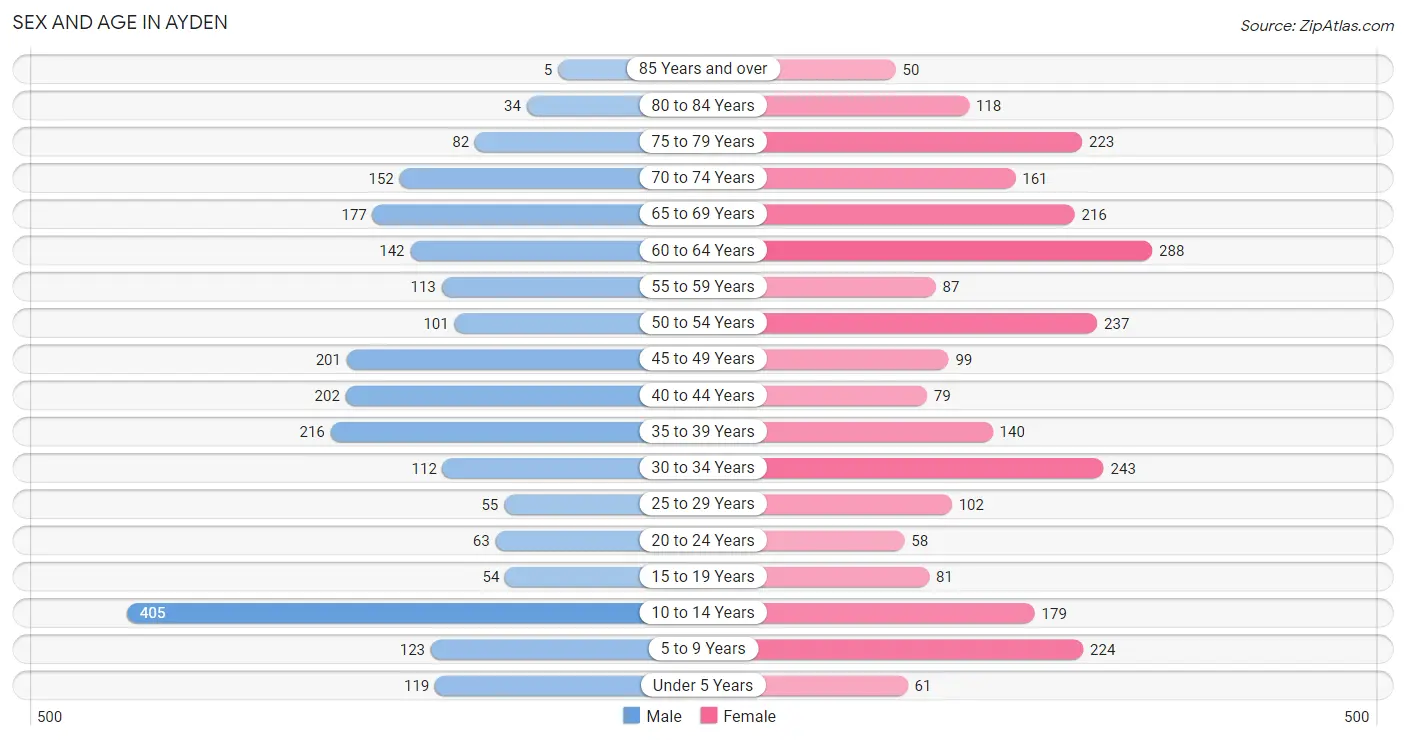
The most populous age groups in Ayden are 10 to 14 Years (405 | 17.2%) for men and 60 to 64 Years (288 | 10.9%) for women.
| Age Bracket | Male | Female |
| Under 5 Years | 119 (5.1%) | 61 (2.3%) |
| 5 to 9 Years | 123 (5.2%) | 224 (8.5%) |
| 10 to 14 Years | 405 (17.2%) | 179 (6.8%) |
| 15 to 19 Years | 54 (2.3%) | 81 (3.1%) |
| 20 to 24 Years | 63 (2.7%) | 58 (2.2%) |
| 25 to 29 Years | 55 (2.3%) | 102 (3.8%) |
| 30 to 34 Years | 112 (4.8%) | 243 (9.2%) |
| 35 to 39 Years | 216 (9.2%) | 140 (5.3%) |
| 40 to 44 Years | 202 (8.6%) | 79 (3.0%) |
| 45 to 49 Years | 201 (8.5%) | 99 (3.7%) |
| 50 to 54 Years | 101 (4.3%) | 237 (9.0%) |
| 55 to 59 Years | 113 (4.8%) | 87 (3.3%) |
| 60 to 64 Years | 142 (6.0%) | 288 (10.9%) |
| 65 to 69 Years | 177 (7.5%) | 216 (8.2%) |
| 70 to 74 Years | 152 (6.5%) | 161 (6.1%) |
| 75 to 79 Years | 82 (3.5%) | 223 (8.4%) |
| 80 to 84 Years | 34 (1.4%) | 118 (4.5%) |
| 85 Years and over | 5 (0.2%) | 50 (1.9%) |
| Total | 2,356 (100.0%) | 2,646 (100.0%) |
Families and Households in Ayden
Median Family Size in Ayden
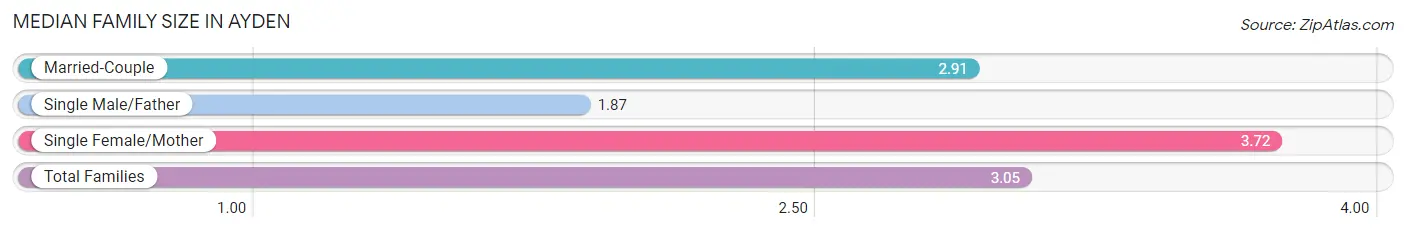
The median family size in Ayden is 3.05 persons per family, with single female/mother families (240 | 19.9%) accounting for the largest median family size of 3.72 persons per family. On the other hand, single male/father families (31 | 2.6%) represent the smallest median family size with 1.87 persons per family.
| Family Type | # Families | Family Size |
| Married-Couple | 935 (77.5%) | 2.91 |
| Single Male/Father | 31 (2.6%) | 1.87 |
| Single Female/Mother | 240 (19.9%) | 3.72 |
| Total Families | 1,206 (100.0%) | 3.05 |
Median Household Size in Ayden
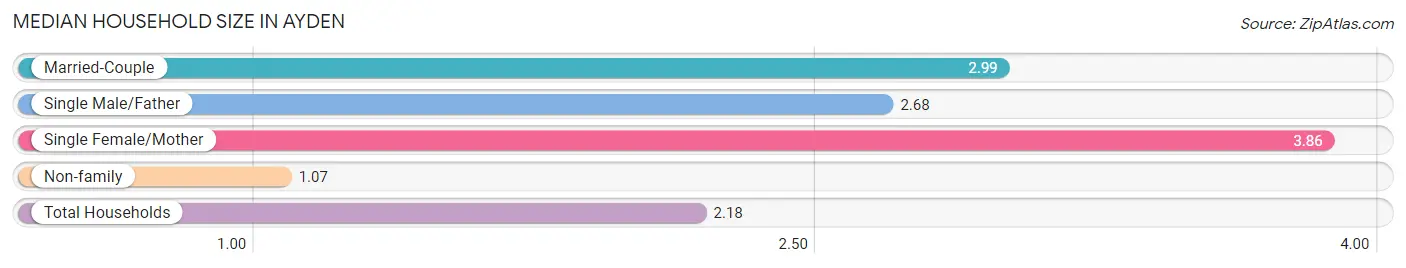
The median household size in Ayden is 2.18 persons per household, with single female/mother households (240 | 10.6%) accounting for the largest median household size of 3.86 persons per household. non-family households (1,060 | 46.8%) represent the smallest median household size with 1.07 persons per household.
| Household Type | # Households | Household Size |
| Married-Couple | 935 (41.3%) | 2.99 |
| Single Male/Father | 31 (1.4%) | 2.68 |
| Single Female/Mother | 240 (10.6%) | 3.86 |
| Non-family | 1,060 (46.8%) | 1.07 |
| Total Households | 2,266 (100.0%) | 2.18 |
Household Size by Marriage Status in Ayden
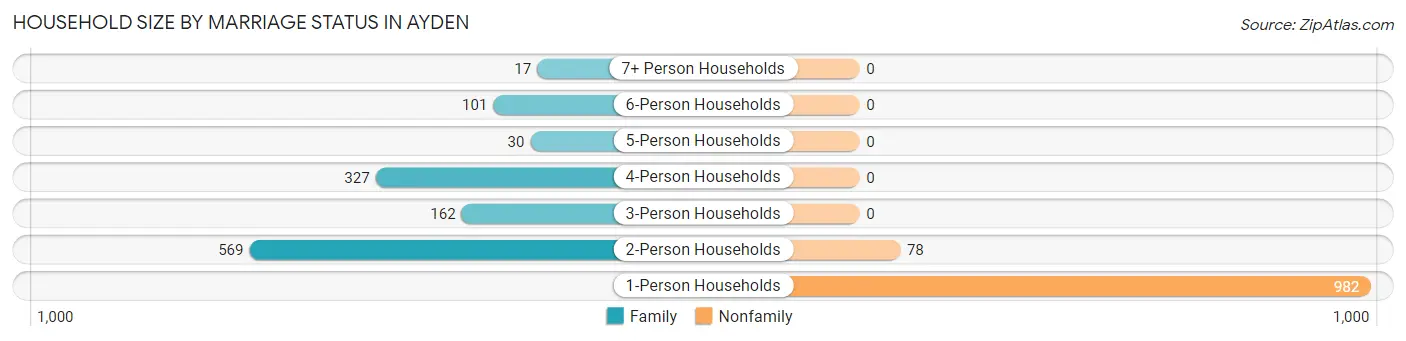
Out of a total of 2,266 households in Ayden, 1,206 (53.2%) are family households, while 1,060 (46.8%) are nonfamily households. The most numerous type of family households are 2-person households, comprising 569, and the most common type of nonfamily households are 1-person households, comprising 982.
| Household Size | Family Households | Nonfamily Households |
| 1-Person Households | - | 982 (43.3%) |
| 2-Person Households | 569 (25.1%) | 78 (3.4%) |
| 3-Person Households | 162 (7.1%) | 0 (0.0%) |
| 4-Person Households | 327 (14.4%) | 0 (0.0%) |
| 5-Person Households | 30 (1.3%) | 0 (0.0%) |
| 6-Person Households | 101 (4.5%) | 0 (0.0%) |
| 7+ Person Households | 17 (0.7%) | 0 (0.0%) |
| Total | 1,206 (53.2%) | 1,060 (46.8%) |
Female Fertility in Ayden
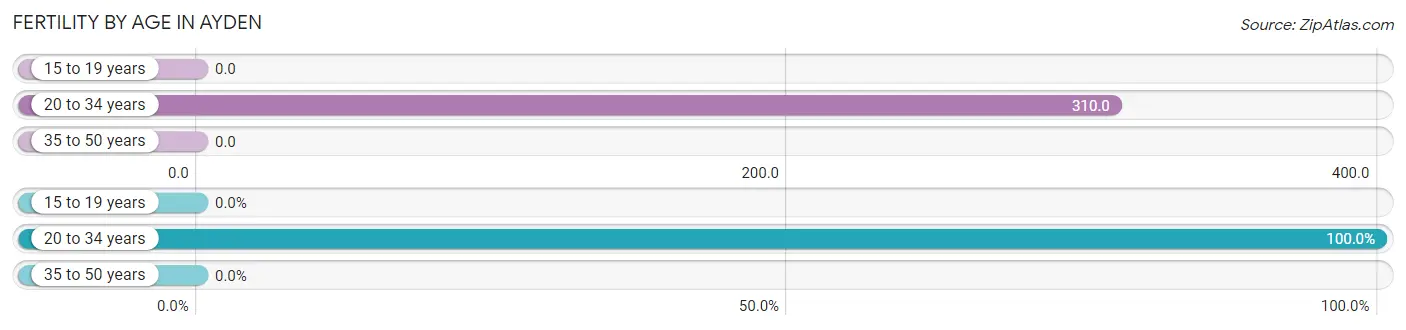
Fertility by Age in Ayden
Average fertility rate in Ayden is 152.0 births per 1,000 women. Women in the age bracket of 20 to 34 years have the highest fertility rate with 310.0 births per 1,000 women. Women in the age bracket of 20 to 34 years acount for 100.0% of all women with births.
| Age Bracket | Women with Births | Births / 1,000 Women |
| 15 to 19 years | 0 (0.0%) | 0.0 |
| 20 to 34 years | 125 (100.0%) | 310.0 |
| 35 to 50 years | 0 (0.0%) | 0.0 |
| Total | 125 (100.0%) | 152.0 |
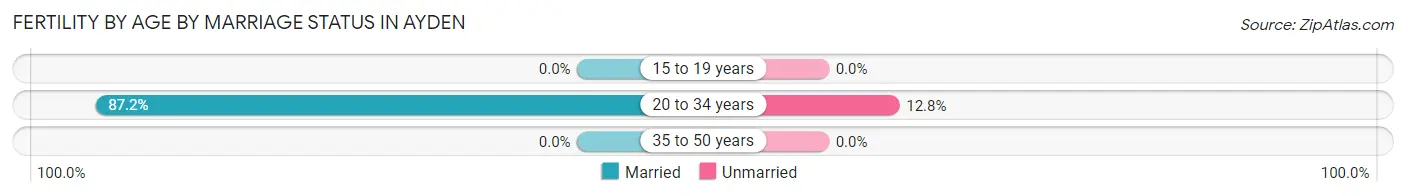
Fertility by Age by Marriage Status in Ayden
87.2% of women with births (125) in Ayden are married. The highest percentage of unmarried women with births falls into 20 to 34 years age bracket with 12.8% of them unmarried at the time of birth, while the lowest percentage of unmarried women with births belong to 20 to 34 years age bracket with 12.8% of them unmarried.
| Age Bracket | Married | Unmarried |
| 15 to 19 years | 0 (0.0%) | 0 (0.0%) |
| 20 to 34 years | 109 (87.2%) | 16 (12.8%) |
| 35 to 50 years | 0 (0.0%) | 0 (0.0%) |
| Total | 109 (87.2%) | 16 (12.8%) |
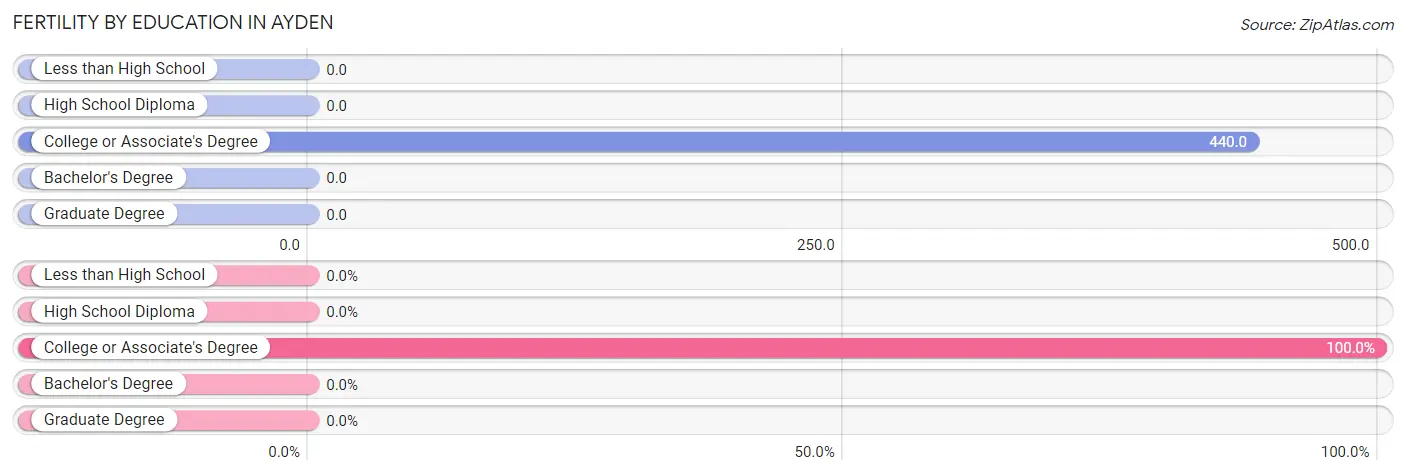
Fertility by Education in Ayden
| Educational Attainment | Women with Births | Births / 1,000 Women |
| Less than High School | 0 (0.0%) | 0.0 |
| High School Diploma | 0 (0.0%) | 0.0 |
| College or Associate's Degree | 125 (100.0%) | 440.0 |
| Bachelor's Degree | 0 (0.0%) | 0.0 |
| Graduate Degree | 0 (0.0%) | 0.0 |
| Total | 125 (100.0%) | 152.0 |
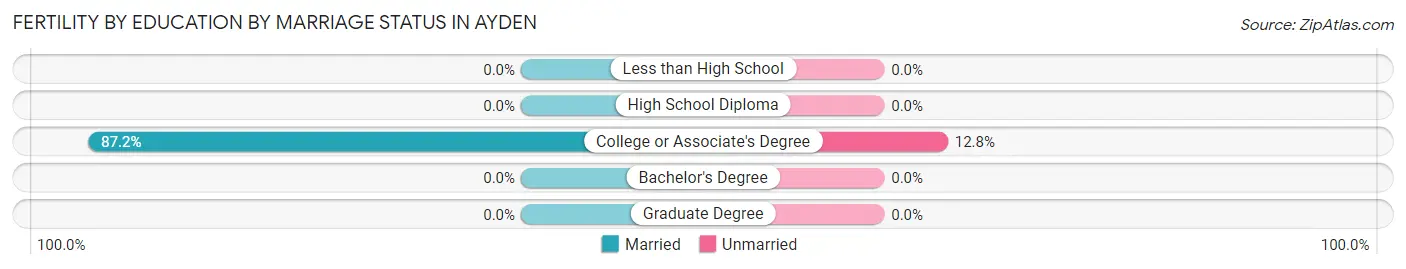
Fertility by Education by Marriage Status in Ayden
12.8% of women with births in Ayden are unmarried. Women with the educational attainment of college or associate's degree are most likely to be married with 87.2% of them married at childbirth, while women with the educational attainment of college or associate's degree are least likely to be married with 12.8% of them unmarried at childbirth.
| Educational Attainment | Married | Unmarried |
| Less than High School | 0 (0.0%) | 0 (0.0%) |
| High School Diploma | 0 (0.0%) | 0 (0.0%) |
| College or Associate's Degree | 109 (87.2%) | 16 (12.8%) |
| Bachelor's Degree | 0 (0.0%) | 0 (0.0%) |
| Graduate Degree | 0 (0.0%) | 0 (0.0%) |
| Total | 109 (87.2%) | 16 (12.8%) |
Income in Ayden
Income Overview in Ayden
Per Capita Income in Ayden is $25,067, while median incomes of families and households are $71,354 and $53,000 respectively.
| Characteristic | Number | Measure |
| Per Capita Income | 5,002 | $25,067 |
| Median Family Income | 1,206 | $71,354 |
| Mean Family Income | 1,206 | $70,148 |
| Median Household Income | 2,266 | $53,000 |
| Mean Household Income | 2,266 | $54,752 |
| Income Deficit | 1,206 | $0 |
| Wage / Income Gap (%) | 5,002 | 11.77% |
| Wage / Income Gap ($) | 5,002 | 88.23¢ per $1 |
| Gini / Inequality Index | 5,002 | 0.43 |
Earnings by Sex in Ayden
Average Earnings in Ayden are $38,015, $37,144 for men and $42,098 for women, a difference of 11.8%.
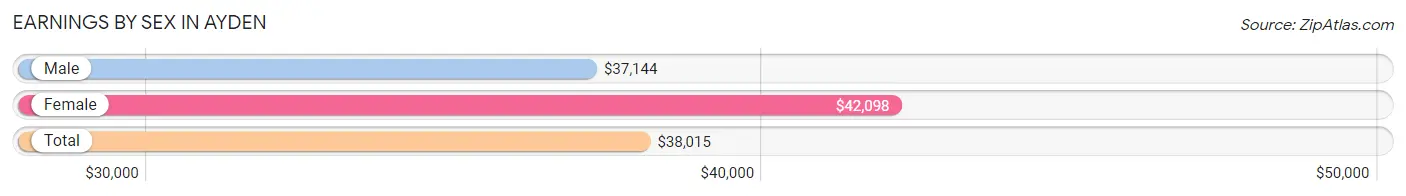
| Sex | Number | Average Earnings |
| Male | 1,041 (50.7%) | $37,144 |
| Female | 1,011 (49.3%) | $42,098 |
| Total | 2,052 (100.0%) | $38,015 |
Earnings by Sex by Income Bracket in Ayden
The most common earnings brackets in Ayden are $35,000 to $39,999 for men (270 | 25.9%) and $55,000 to $64,999 for women (234 | 23.2%).
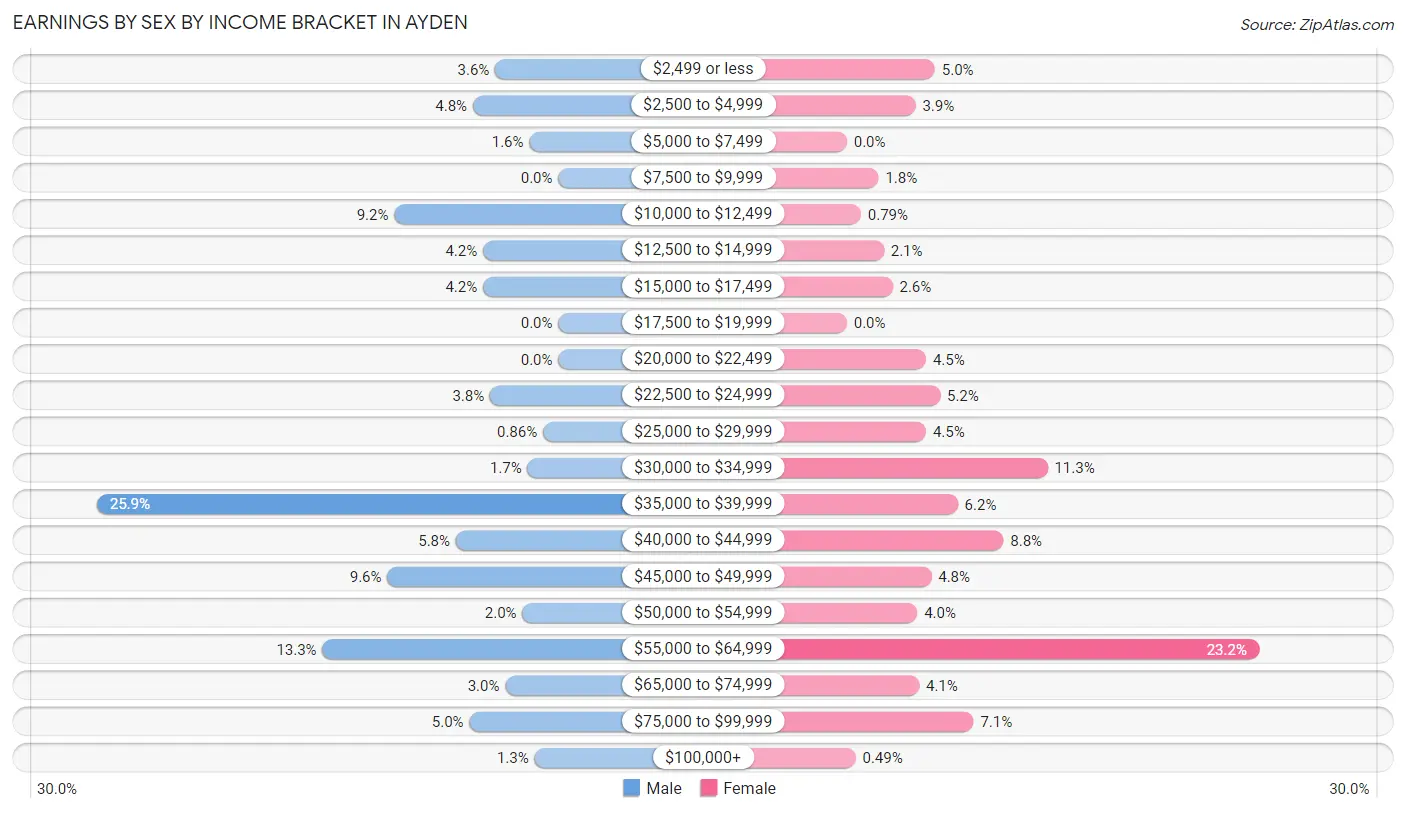
| Income | Male | Female |
| $2,499 or less | 37 (3.5%) | 50 (5.0%) |
| $2,500 to $4,999 | 50 (4.8%) | 39 (3.9%) |
| $5,000 to $7,499 | 17 (1.6%) | 0 (0.0%) |
| $7,500 to $9,999 | 0 (0.0%) | 18 (1.8%) |
| $10,000 to $12,499 | 96 (9.2%) | 8 (0.8%) |
| $12,500 to $14,999 | 44 (4.2%) | 21 (2.1%) |
| $15,000 to $17,499 | 44 (4.2%) | 26 (2.6%) |
| $17,500 to $19,999 | 0 (0.0%) | 0 (0.0%) |
| $20,000 to $22,499 | 0 (0.0%) | 45 (4.4%) |
| $22,500 to $24,999 | 40 (3.8%) | 53 (5.2%) |
| $25,000 to $29,999 | 9 (0.9%) | 45 (4.4%) |
| $30,000 to $34,999 | 18 (1.7%) | 114 (11.3%) |
| $35,000 to $39,999 | 270 (25.9%) | 63 (6.2%) |
| $40,000 to $44,999 | 60 (5.8%) | 89 (8.8%) |
| $45,000 to $49,999 | 100 (9.6%) | 48 (4.8%) |
| $50,000 to $54,999 | 21 (2.0%) | 40 (4.0%) |
| $55,000 to $64,999 | 138 (13.3%) | 234 (23.2%) |
| $65,000 to $74,999 | 31 (3.0%) | 41 (4.1%) |
| $75,000 to $99,999 | 52 (5.0%) | 72 (7.1%) |
| $100,000+ | 14 (1.3%) | 5 (0.5%) |
| Total | 1,041 (100.0%) | 1,011 (100.0%) |
Earnings by Sex by Educational Attainment in Ayden
Average earnings in Ayden are $38,019 for men and $43,566 for women, a difference of 12.7%. Men with an educational attainment of college or associate's degree enjoy the highest average annual earnings of $38,636, while those with high school diploma education earn the least with $37,652. Women with an educational attainment of graduate degree earn the most with the average annual earnings of $65,333, while those with high school diploma education have the smallest earnings of $28,711.
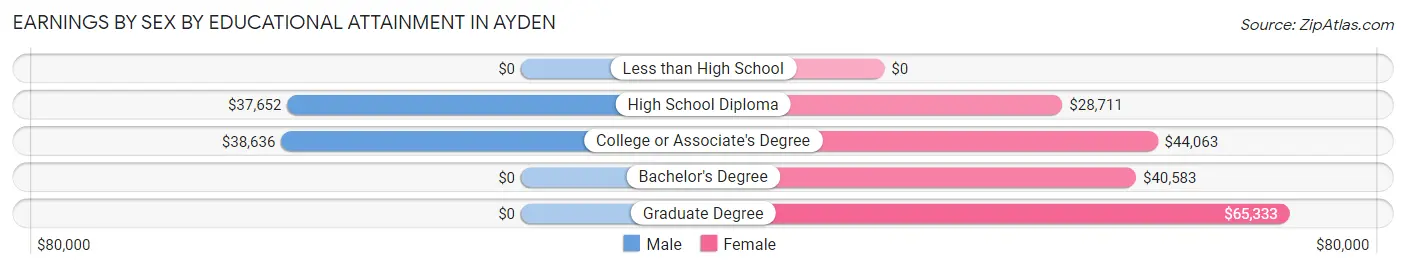
| Educational Attainment | Male Income | Female Income |
| Less than High School | - | - |
| High School Diploma | $37,652 | $28,711 |
| College or Associate's Degree | $38,636 | $44,063 |
| Bachelor's Degree | - | - |
| Graduate Degree | - | - |
| Total | $38,019 | $43,566 |
Family Income in Ayden
Family Income Brackets in Ayden
According to the Ayden family income data, there are 287 families falling into the $50,000 to $74,999 income range, which is the most common income bracket and makes up 23.8% of all families.
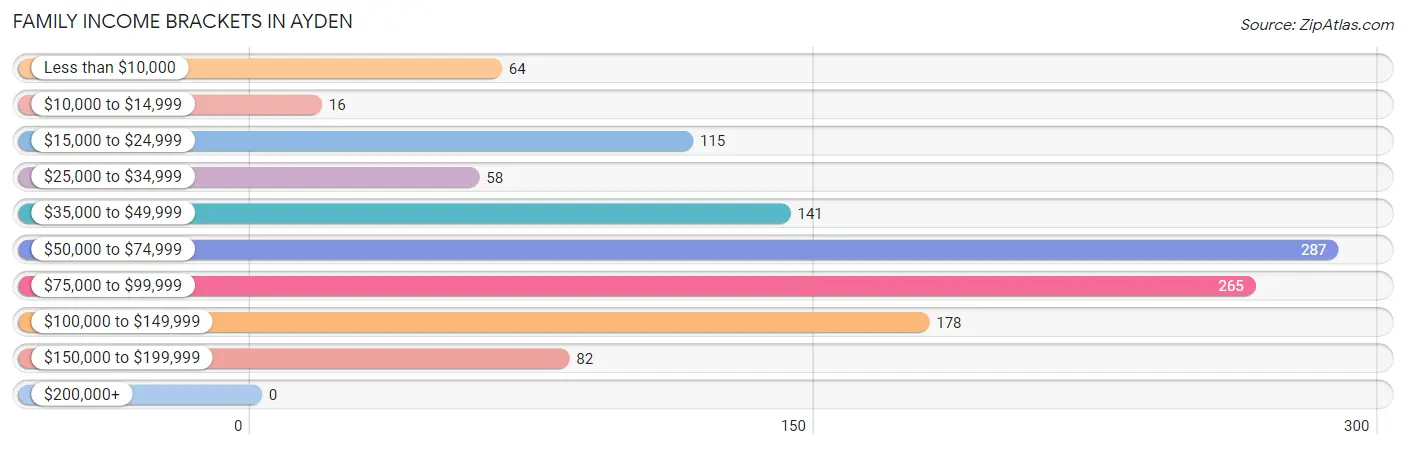
| Income Bracket | # Families | % Families |
| Less than $10,000 | 64 | 5.3% |
| $10,000 to $14,999 | 16 | 1.3% |
| $15,000 to $24,999 | 115 | 9.5% |
| $25,000 to $34,999 | 58 | 4.8% |
| $35,000 to $49,999 | 141 | 11.7% |
| $50,000 to $74,999 | 287 | 23.8% |
| $75,000 to $99,999 | 265 | 22.0% |
| $100,000 to $149,999 | 178 | 14.8% |
| $150,000 to $199,999 | 82 | 6.8% |
| $200,000+ | 0 | 0.0% |
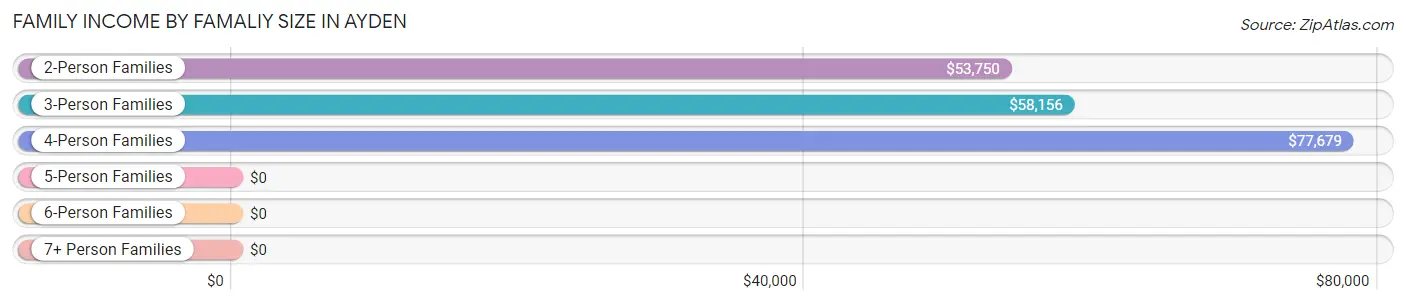
Family Income by Famaliy Size in Ayden
4-person families (358 | 29.7%) account for the highest median family income in Ayden with $77,679 per family, while 2-person families (593 | 49.2%) have the highest median income of $26,875 per family member.
| Income Bracket | # Families | Median Income |
| 2-Person Families | 593 (49.2%) | $53,750 |
| 3-Person Families | 173 (14.3%) | $58,156 |
| 4-Person Families | 358 (29.7%) | $77,679 |
| 5-Person Families | 30 (2.5%) | $0 |
| 6-Person Families | 35 (2.9%) | $0 |
| 7+ Person Families | 17 (1.4%) | $0 |
| Total | 1,206 (100.0%) | $71,354 |
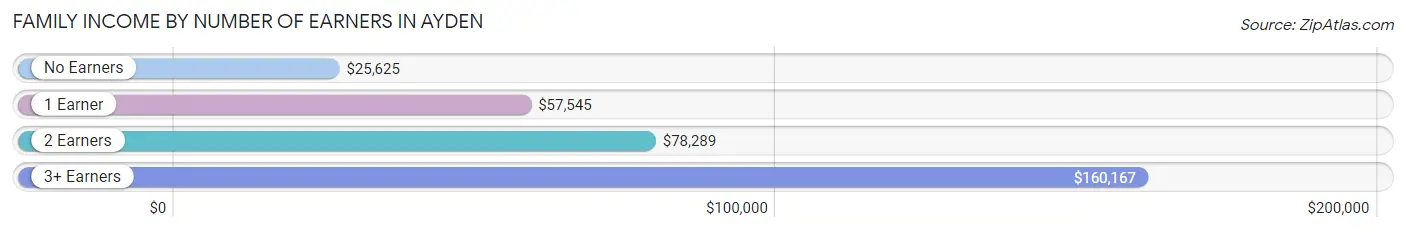
Family Income by Number of Earners in Ayden
The median family income in Ayden is $71,354, with families comprising 3+ earners (84) having the highest median family income of $160,167, while families with no earners (310) have the lowest median family income of $25,625, accounting for 7.0% and 25.7% of families, respectively.
| Number of Earners | # Families | Median Income |
| No Earners | 310 (25.7%) | $25,625 |
| 1 Earner | 320 (26.5%) | $57,545 |
| 2 Earners | 492 (40.8%) | $78,289 |
| 3+ Earners | 84 (7.0%) | $160,167 |
| Total | 1,206 (100.0%) | $71,354 |
Household Income in Ayden
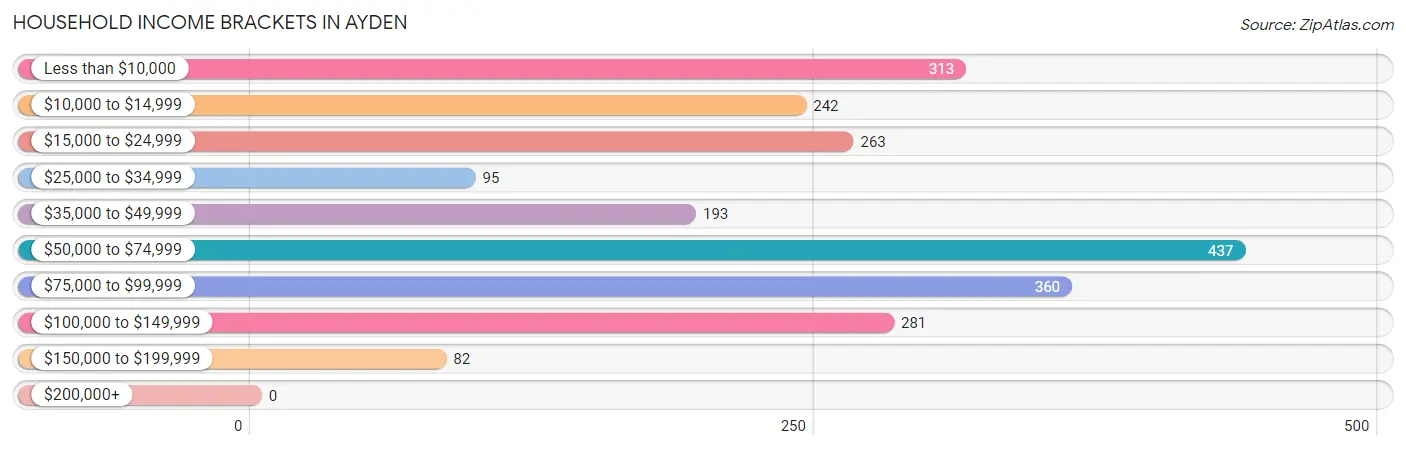
Household Income Brackets in Ayden
With 437 households falling in the category, the $50,000 to $74,999 income range is the most frequent in Ayden, accounting for 19.3% of all households.
| Income Bracket | # Households | % Households |
| Less than $10,000 | 313 | 13.8% |
| $10,000 to $14,999 | 242 | 10.7% |
| $15,000 to $24,999 | 263 | 11.6% |
| $25,000 to $34,999 | 95 | 4.2% |
| $35,000 to $49,999 | 193 | 8.5% |
| $50,000 to $74,999 | 437 | 19.3% |
| $75,000 to $99,999 | 360 | 15.9% |
| $100,000 to $149,999 | 281 | 12.4% |
| $150,000 to $199,999 | 82 | 3.6% |
| $200,000+ | 0 | 0.0% |
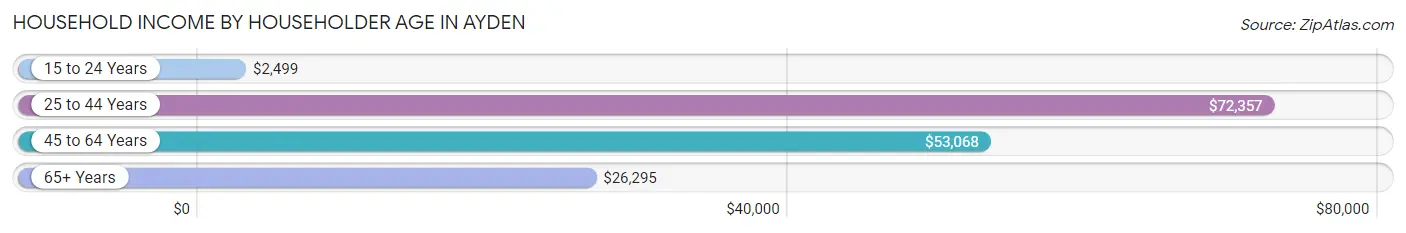
Household Income by Householder Age in Ayden
The median household income in Ayden is $53,000, with the highest median household income of $72,357 found in the 25 to 44 years age bracket for the primary householder. A total of 559 households (24.7%) fall into this category. Meanwhile, the 15 to 24 years age bracket for the primary householder has the lowest median household income of $2,499, with 55 households (2.4%) in this group.
| Income Bracket | # Households | Median Income |
| 15 to 24 Years | 55 (2.4%) | $2,499 |
| 25 to 44 Years | 559 (24.7%) | $72,357 |
| 45 to 64 Years | 825 (36.4%) | $53,068 |
| 65+ Years | 827 (36.5%) | $26,295 |
| Total | 2,266 (100.0%) | $53,000 |
Poverty in Ayden
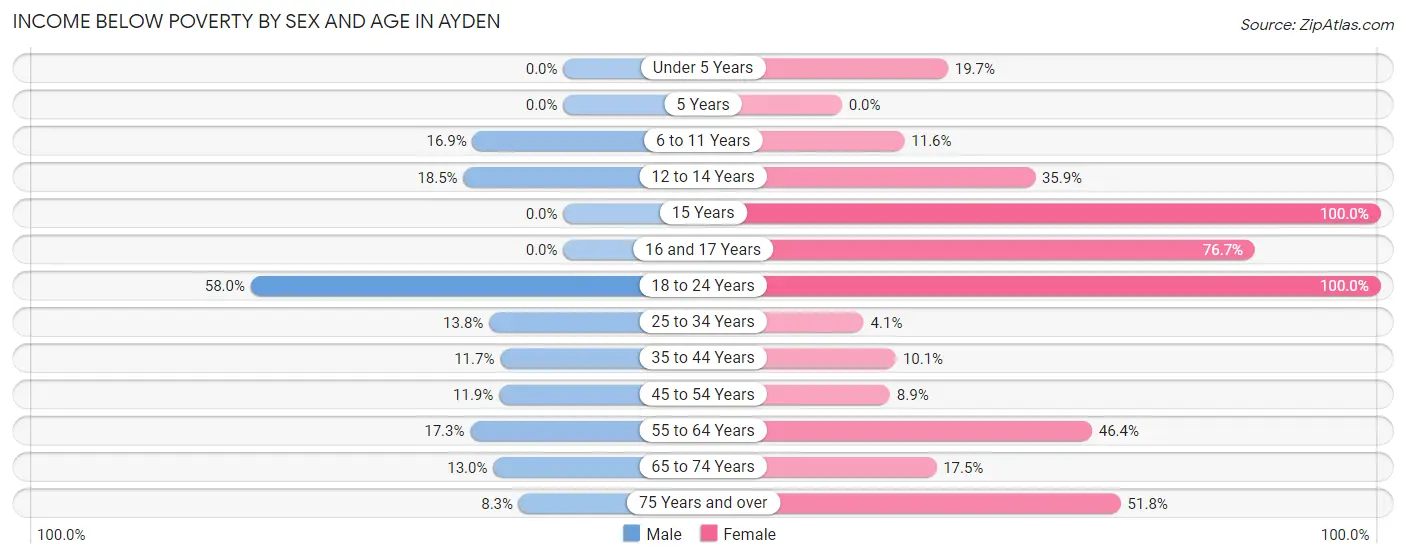
Income Below Poverty by Sex and Age in Ayden
With 15.0% poverty level for males and 26.2% for females among the residents of Ayden, 18 to 24 year old males and 15 year old females are the most vulnerable to poverty, with 47 males (58.0%) and 21 females (100.0%) in their respective age groups living below the poverty level.
| Age Bracket | Male | Female |
| Under 5 Years | 0 (0.0%) | 12 (19.7%) |
| 5 Years | 0 (0.0%) | 0 (0.0%) |
| 6 to 11 Years | 59 (16.9%) | 31 (11.6%) |
| 12 to 14 Years | 33 (18.5%) | 19 (35.8%) |
| 15 Years | 0 (0.0%) | 21 (100.0%) |
| 16 and 17 Years | 0 (0.0%) | 46 (76.7%) |
| 18 to 24 Years | 47 (58.0%) | 58 (100.0%) |
| 25 to 34 Years | 23 (13.8%) | 14 (4.1%) |
| 35 to 44 Years | 49 (11.7%) | 22 (10.1%) |
| 45 to 54 Years | 36 (11.9%) | 30 (8.9%) |
| 55 to 64 Years | 43 (17.3%) | 174 (46.4%) |
| 65 to 74 Years | 42 (13.0%) | 65 (17.5%) |
| 75 Years and over | 9 (8.3%) | 191 (51.8%) |
| Total | 341 (15.0%) | 683 (26.2%) |
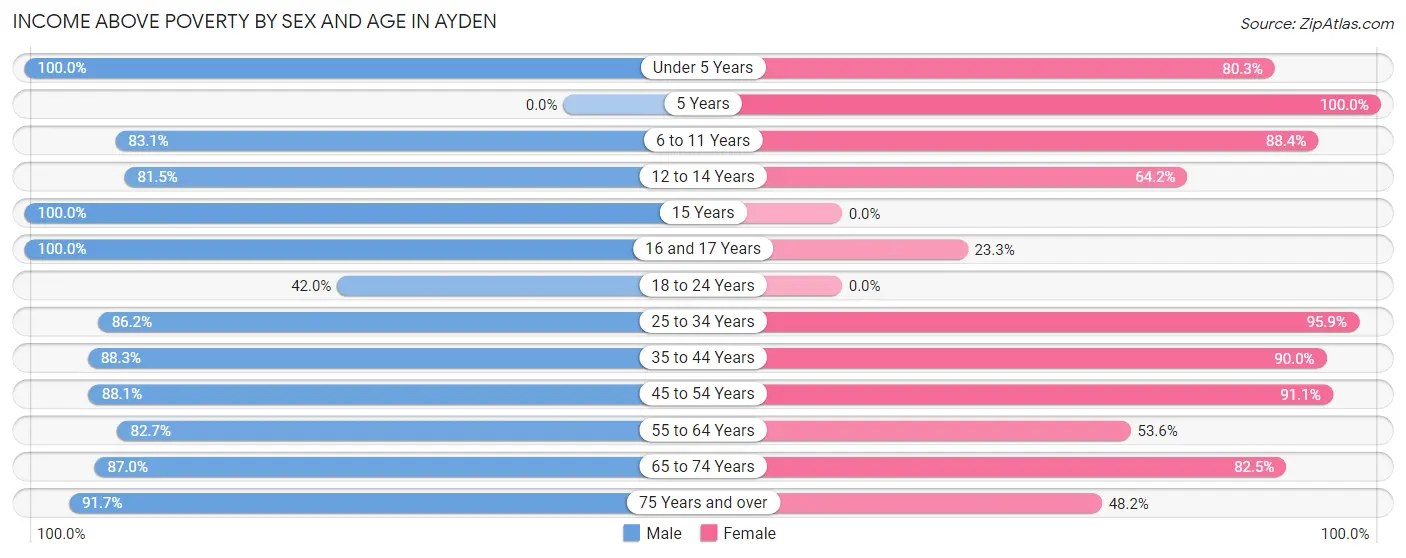
Income Above Poverty by Sex and Age in Ayden
According to the poverty statistics in Ayden, males aged under 5 years and females aged 5 years are the age groups that are most secure financially, with 100.0% of males and 100.0% of females in these age groups living above the poverty line.
| Age Bracket | Male | Female |
| Under 5 Years | 66 (100.0%) | 49 (80.3%) |
| 5 Years | 0 (0.0%) | 74 (100.0%) |
| 6 to 11 Years | 291 (83.1%) | 236 (88.4%) |
| 12 to 14 Years | 145 (81.5%) | 34 (64.1%) |
| 15 Years | 23 (100.0%) | 0 (0.0%) |
| 16 and 17 Years | 13 (100.0%) | 14 (23.3%) |
| 18 to 24 Years | 34 (42.0%) | 0 (0.0%) |
| 25 to 34 Years | 144 (86.2%) | 331 (95.9%) |
| 35 to 44 Years | 369 (88.3%) | 197 (89.9%) |
| 45 to 54 Years | 266 (88.1%) | 306 (91.1%) |
| 55 to 64 Years | 206 (82.7%) | 201 (53.6%) |
| 65 to 74 Years | 281 (87.0%) | 306 (82.5%) |
| 75 Years and over | 100 (91.7%) | 178 (48.2%) |
| Total | 1,938 (85.0%) | 1,926 (73.8%) |
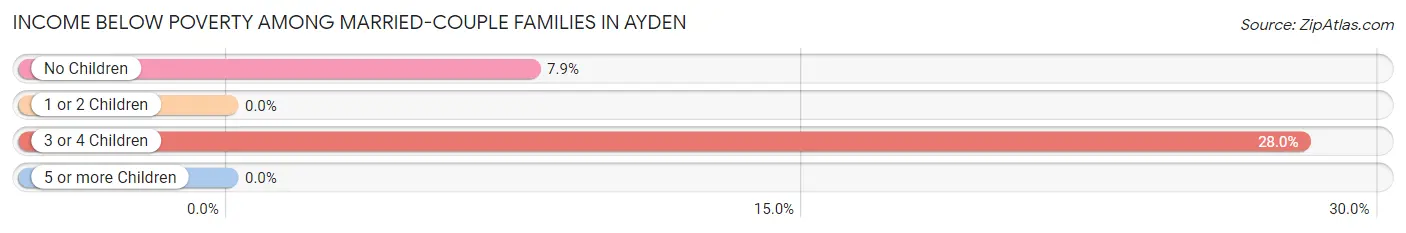
Income Below Poverty Among Married-Couple Families in Ayden
The poverty statistics for married-couple families in Ayden show that 6.2% or 58 of the total 935 families live below the poverty line. Families with 3 or 4 children have the highest poverty rate of 28.0%, comprising of 14 families. On the other hand, families with 1 or 2 children have the lowest poverty rate of 0.0%, which includes 0 families.
| Children | Above Poverty | Below Poverty |
| No Children | 514 (92.1%) | 44 (7.9%) |
| 1 or 2 Children | 327 (100.0%) | 0 (0.0%) |
| 3 or 4 Children | 36 (72.0%) | 14 (28.0%) |
| 5 or more Children | 0 (0.0%) | 0 (0.0%) |
| Total | 877 (93.8%) | 58 (6.2%) |
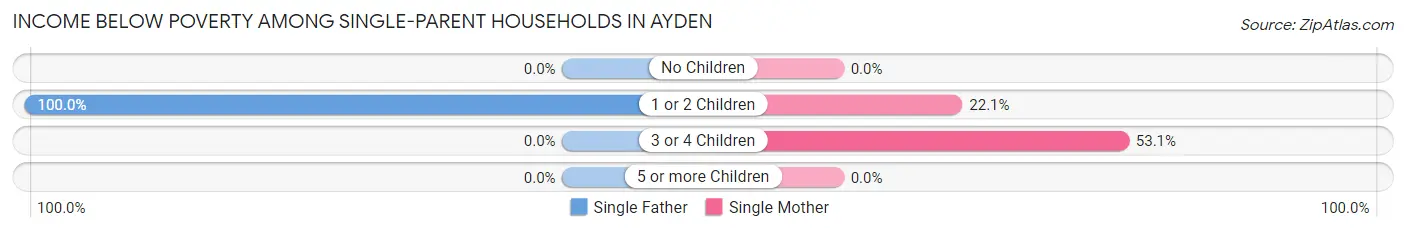
Income Below Poverty Among Single-Parent Households in Ayden
According to the poverty data in Ayden, 41.9% or 13 single-father households and 25.4% or 61 single-mother households are living below the poverty line. Among single-father households, those with 1 or 2 children have the highest poverty rate, with 13 households (100.0%) experiencing poverty. Likewise, among single-mother households, those with 3 or 4 children have the highest poverty rate, with 17 households (53.1%) falling below the poverty line.
| Children | Single Father | Single Mother |
| No Children | 0 (0.0%) | 0 (0.0%) |
| 1 or 2 Children | 13 (100.0%) | 44 (22.1%) |
| 3 or 4 Children | 0 (0.0%) | 17 (53.1%) |
| 5 or more Children | 0 (0.0%) | 0 (0.0%) |
| Total | 13 (41.9%) | 61 (25.4%) |
Income Below Poverty Among Married-Couple vs Single-Parent Households in Ayden
The poverty data for Ayden shows that 58 of the married-couple family households (6.2%) and 74 of the single-parent households (27.3%) are living below the poverty level. Within the married-couple family households, those with 3 or 4 children have the highest poverty rate, with 14 households (28.0%) falling below the poverty line. Among the single-parent households, those with 3 or 4 children have the highest poverty rate, with 17 household (53.1%) living below poverty.
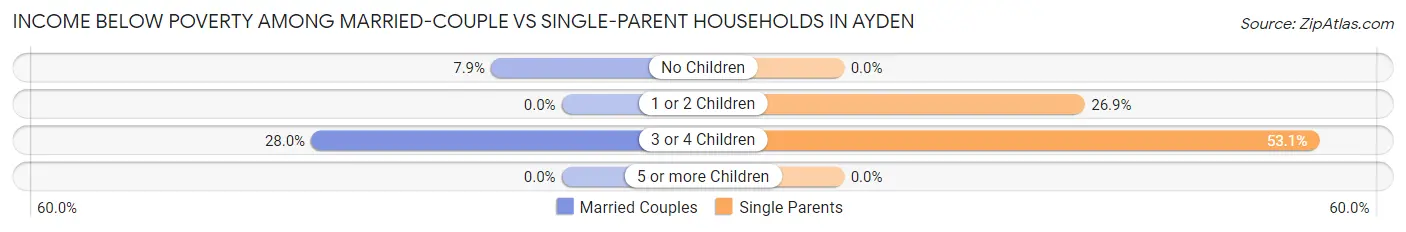
| Children | Married-Couple Families | Single-Parent Households |
| No Children | 44 (7.9%) | 0 (0.0%) |
| 1 or 2 Children | 0 (0.0%) | 57 (26.9%) |
| 3 or 4 Children | 14 (28.0%) | 17 (53.1%) |
| 5 or more Children | 0 (0.0%) | 0 (0.0%) |
| Total | 58 (6.2%) | 74 (27.3%) |
Employment Characteristics in Ayden
Employment by Class of Employer in Ayden
Among the 1,886 employed individuals in Ayden, private company employees (1,284 | 68.1%), local government employees (193 | 10.2%), and state government employees (163 | 8.6%) make up the most common classes of employment.
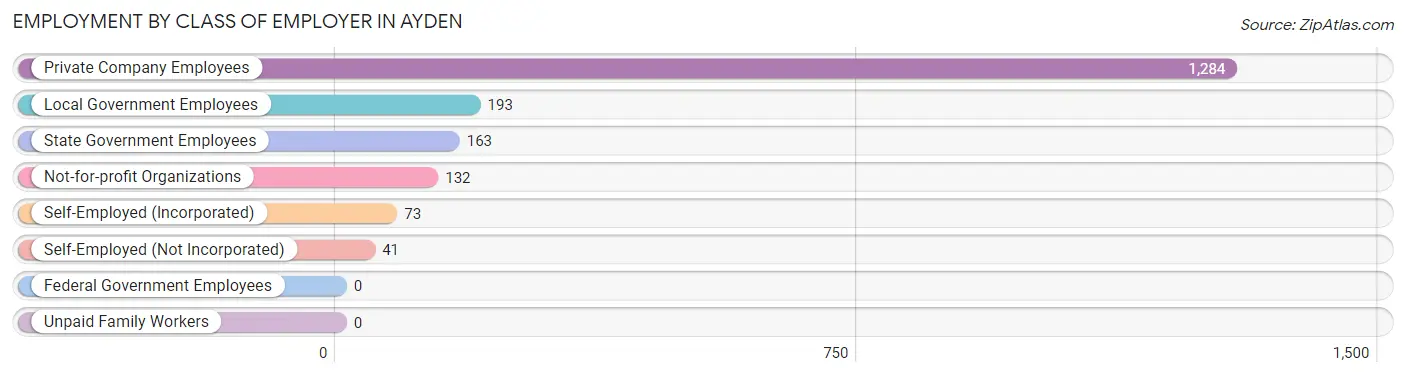
| Employer Class | # Employees | % Employees |
| Private Company Employees | 1,284 | 68.1% |
| Self-Employed (Incorporated) | 73 | 3.9% |
| Self-Employed (Not Incorporated) | 41 | 2.2% |
| Not-for-profit Organizations | 132 | 7.0% |
| Local Government Employees | 193 | 10.2% |
| State Government Employees | 163 | 8.6% |
| Federal Government Employees | 0 | 0.0% |
| Unpaid Family Workers | 0 | 0.0% |
| Total | 1,886 | 100.0% |
Employment Status by Age in Ayden
According to the labor force statistics for Ayden, out of the total population over 16 years of age (3,847), 51.2% or 1,970 individuals are in the labor force, with 1.8% or 35 of them unemployed. The age group with the highest labor force participation rate is 30 to 34 years, with 91.5% or 325 individuals in the labor force. Within the labor force, the 20 to 24 years age range has the highest percentage of unemployed individuals, with 39.7% or 23 of them being unemployed.
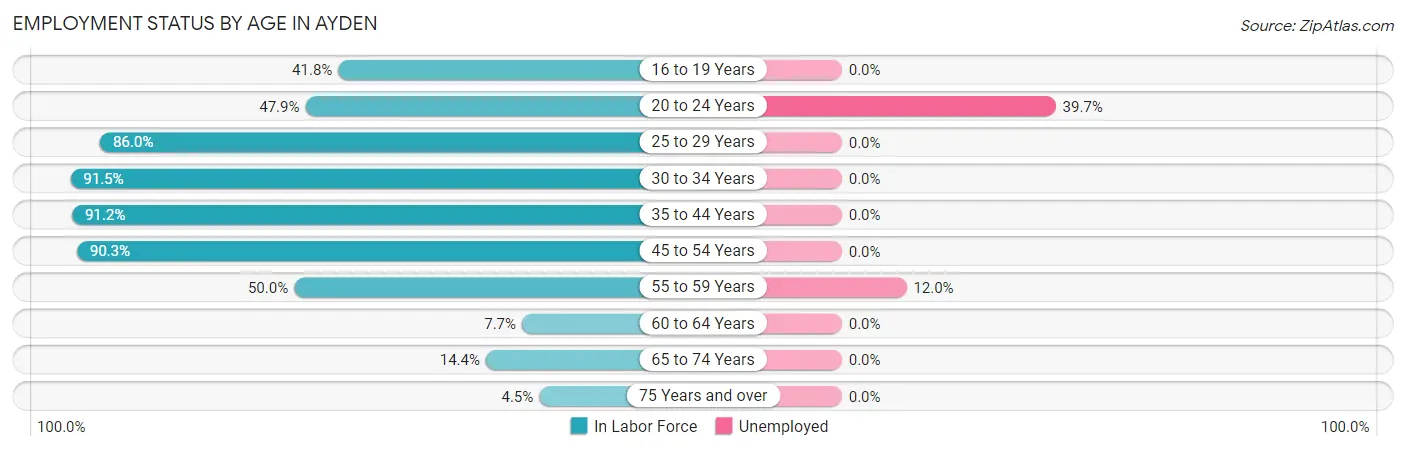
| Age Bracket | In Labor Force | Unemployed |
| 16 to 19 Years | 38 (41.8%) | 0 (0.0%) |
| 20 to 24 Years | 58 (47.9%) | 23 (39.7%) |
| 25 to 29 Years | 135 (86.0%) | 0 (0.0%) |
| 30 to 34 Years | 325 (91.5%) | 0 (0.0%) |
| 35 to 44 Years | 581 (91.2%) | 0 (0.0%) |
| 45 to 54 Years | 576 (90.3%) | 0 (0.0%) |
| 55 to 59 Years | 100 (50.0%) | 12 (12.0%) |
| 60 to 64 Years | 33 (7.7%) | 0 (0.0%) |
| 65 to 74 Years | 102 (14.4%) | 0 (0.0%) |
| 75 Years and over | 23 (4.5%) | 0 (0.0%) |
| Total | 1,970 (51.2%) | 35 (1.8%) |
Employment Status by Educational Attainment in Ayden
According to labor force statistics for Ayden, 72.4% of individuals (1,750) out of the total population between 25 and 64 years of age (2,417) are in the labor force, with 0.7% or 12 of them being unemployed. The group with the highest labor force participation rate are those with the educational attainment of bachelor's degree or higher, with 87.7% or 433 individuals in the labor force. Within the labor force, individuals with college / associate degree education have the highest percentage of unemployment, with 1.8% or 12 of them being unemployed.
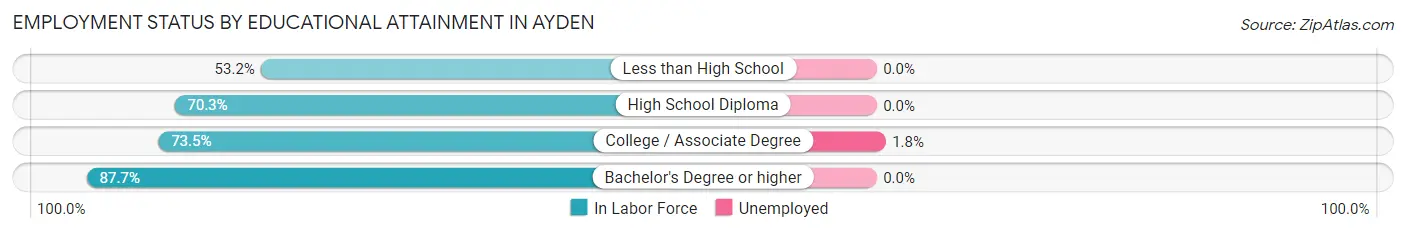
| Educational Attainment | In Labor Force | Unemployed |
| Less than High School | 197 (53.2%) | 0 (0.0%) |
| High School Diploma | 466 (70.3%) | 0 (0.0%) |
| College / Associate Degree | 654 (73.5%) | 16 (1.8%) |
| Bachelor's Degree or higher | 433 (87.7%) | 0 (0.0%) |
| Total | 1,750 (72.4%) | 17 (0.7%) |
Employment Occupations by Sex in Ayden
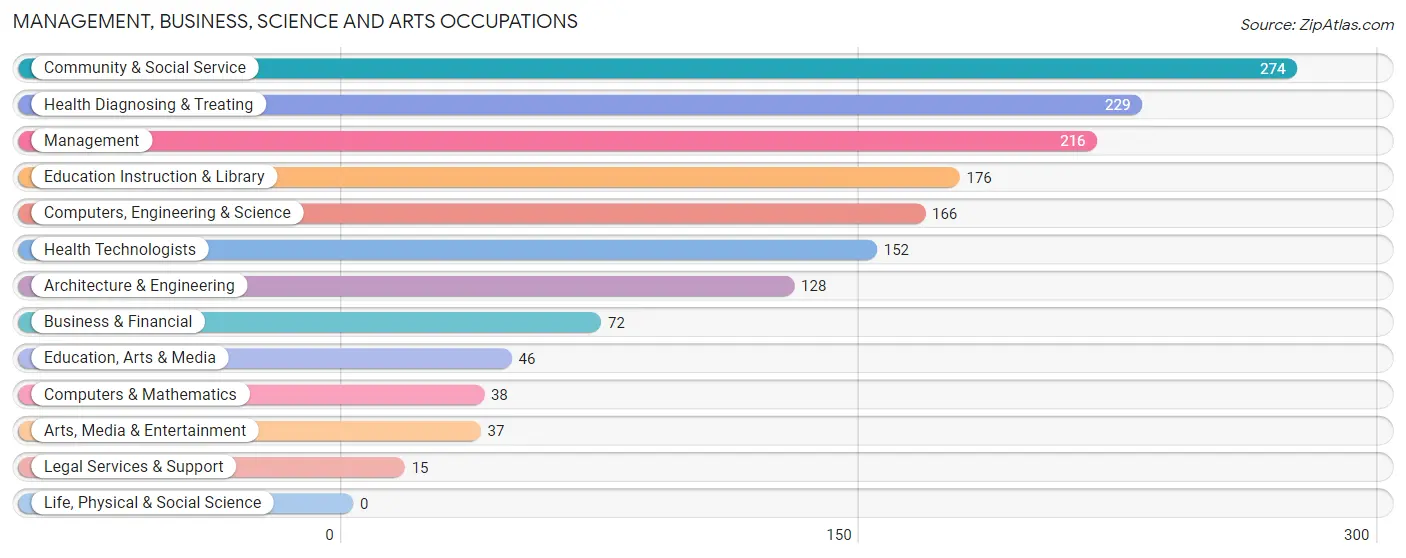
Management, Business, Science and Arts Occupations
The most common Management, Business, Science and Arts occupations in Ayden are Community & Social Service (274 | 14.1%), Health Diagnosing & Treating (229 | 11.8%), Management (216 | 11.2%), Education Instruction & Library (176 | 9.1%), and Computers, Engineering & Science (166 | 8.6%).
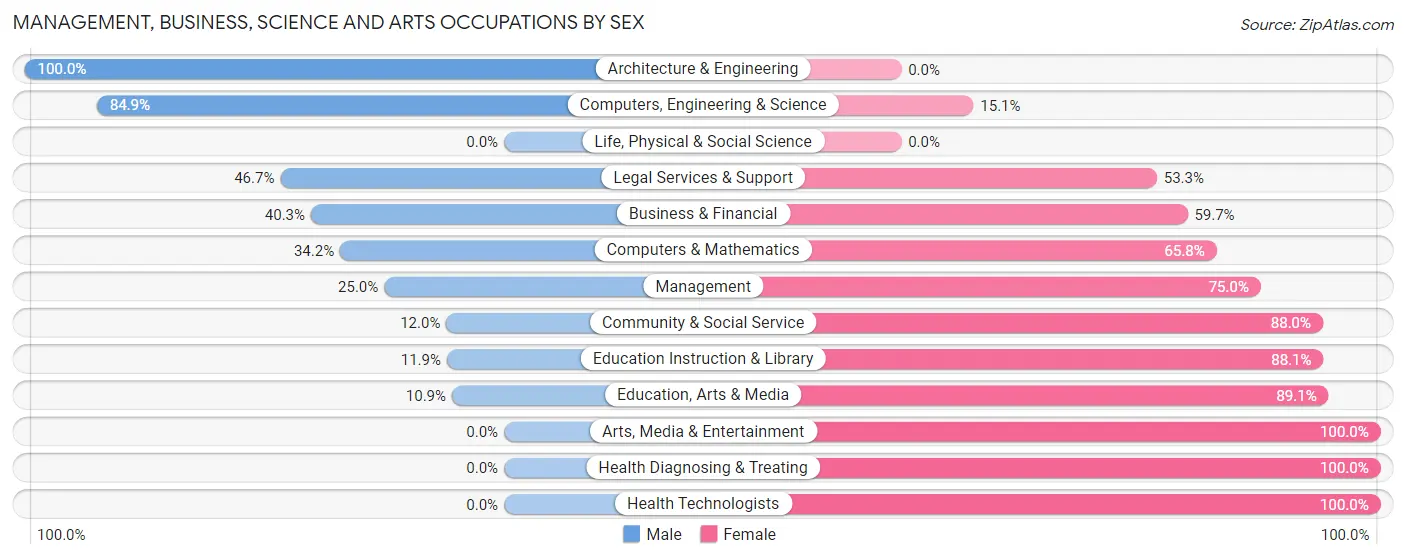
Management, Business, Science and Arts Occupations by Sex
Within the Management, Business, Science and Arts occupations in Ayden, the most male-oriented occupations are Architecture & Engineering (100.0%), Computers, Engineering & Science (84.9%), and Legal Services & Support (46.7%), while the most female-oriented occupations are Arts, Media & Entertainment (100.0%), Health Diagnosing & Treating (100.0%), and Health Technologists (100.0%).
| Occupation | Male | Female |
| Management | 54 (25.0%) | 162 (75.0%) |
| Business & Financial | 29 (40.3%) | 43 (59.7%) |
| Computers, Engineering & Science | 141 (84.9%) | 25 (15.1%) |
| Computers & Mathematics | 13 (34.2%) | 25 (65.8%) |
| Architecture & Engineering | 128 (100.0%) | 0 (0.0%) |
| Life, Physical & Social Science | 0 (0.0%) | 0 (0.0%) |
| Community & Social Service | 33 (12.0%) | 241 (88.0%) |
| Education, Arts & Media | 5 (10.9%) | 41 (89.1%) |
| Legal Services & Support | 7 (46.7%) | 8 (53.3%) |
| Education Instruction & Library | 21 (11.9%) | 155 (88.1%) |
| Arts, Media & Entertainment | 0 (0.0%) | 37 (100.0%) |
| Health Diagnosing & Treating | 0 (0.0%) | 229 (100.0%) |
| Health Technologists | 0 (0.0%) | 152 (100.0%) |
| Total (Category) | 257 (26.9%) | 700 (73.2%) |
| Total (Overall) | 989 (51.1%) | 947 (48.9%) |
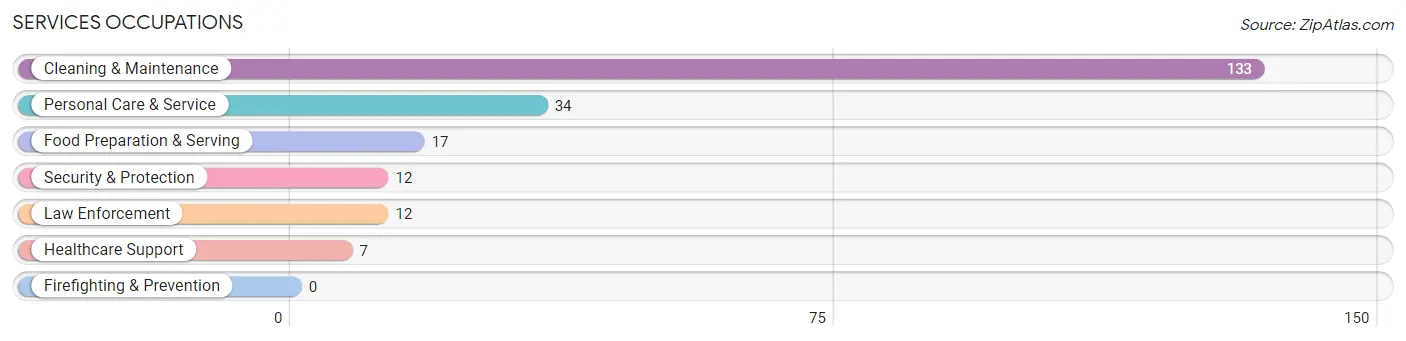
Services Occupations
The most common Services occupations in Ayden are Cleaning & Maintenance (133 | 6.9%), Personal Care & Service (34 | 1.8%), Food Preparation & Serving (17 | 0.9%), Security & Protection (12 | 0.6%), and Law Enforcement (12 | 0.6%).
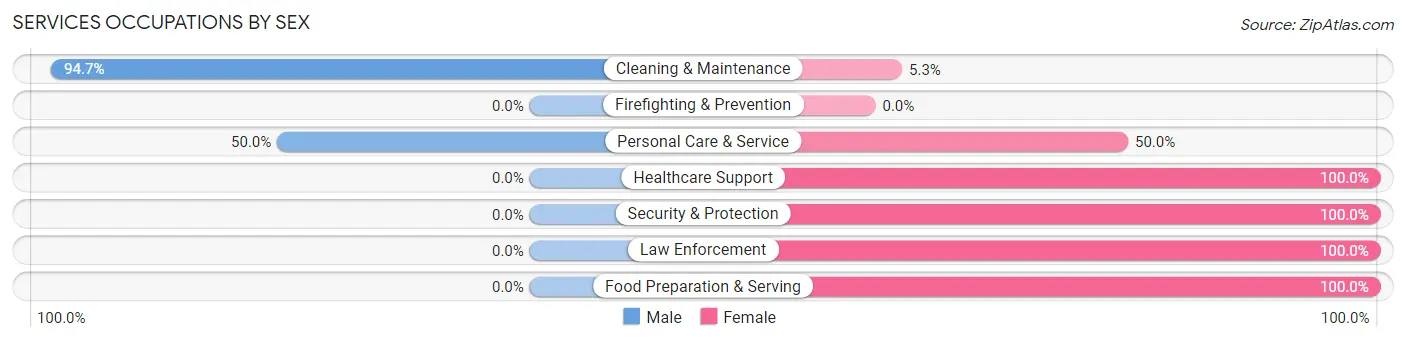
Services Occupations by Sex
Within the Services occupations in Ayden, the most male-oriented occupations are Cleaning & Maintenance (94.7%), and Personal Care & Service (50.0%), while the most female-oriented occupations are Healthcare Support (100.0%), Security & Protection (100.0%), and Law Enforcement (100.0%).
| Occupation | Male | Female |
| Healthcare Support | 0 (0.0%) | 7 (100.0%) |
| Security & Protection | 0 (0.0%) | 12 (100.0%) |
| Firefighting & Prevention | 0 (0.0%) | 0 (0.0%) |
| Law Enforcement | 0 (0.0%) | 12 (100.0%) |
| Food Preparation & Serving | 0 (0.0%) | 17 (100.0%) |
| Cleaning & Maintenance | 126 (94.7%) | 7 (5.3%) |
| Personal Care & Service | 17 (50.0%) | 17 (50.0%) |
| Total (Category) | 143 (70.4%) | 60 (29.6%) |
| Total (Overall) | 989 (51.1%) | 947 (48.9%) |
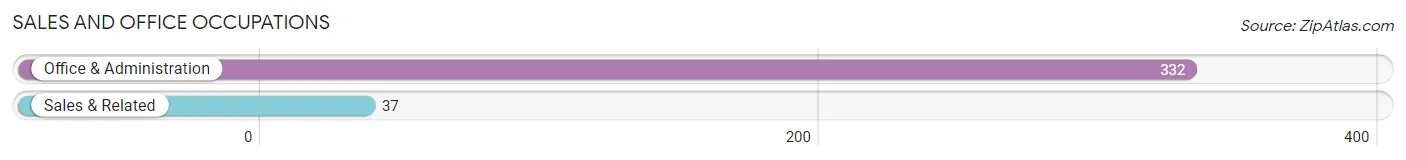
Sales and Office Occupations
The most common Sales and Office occupations in Ayden are Office & Administration (332 | 17.2%), and Sales & Related (37 | 1.9%).
Sales and Office Occupations by Sex
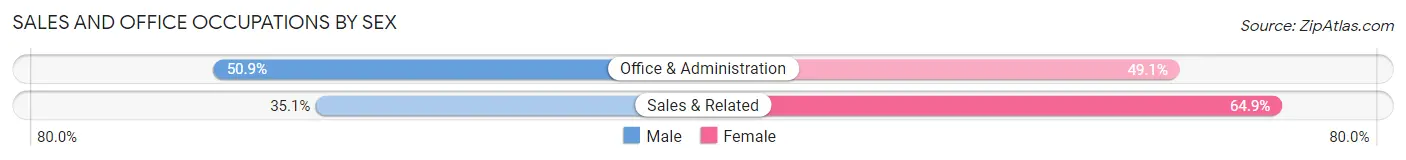
| Occupation | Male | Female |
| Sales & Related | 13 (35.1%) | 24 (64.9%) |
| Office & Administration | 169 (50.9%) | 163 (49.1%) |
| Total (Category) | 182 (49.3%) | 187 (50.7%) |
| Total (Overall) | 989 (51.1%) | 947 (48.9%) |
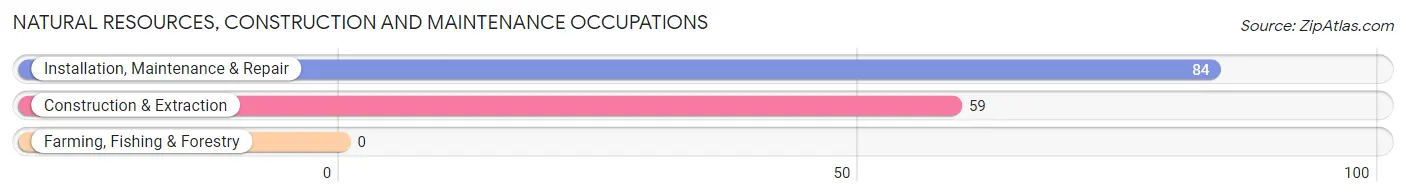
Natural Resources, Construction and Maintenance Occupations
The most common Natural Resources, Construction and Maintenance occupations in Ayden are Installation, Maintenance & Repair (84 | 4.3%), and Construction & Extraction (59 | 3.0%).
Natural Resources, Construction and Maintenance Occupations by Sex
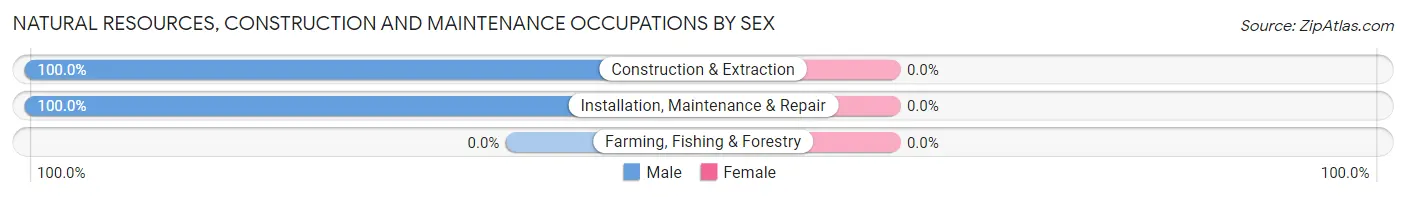
| Occupation | Male | Female |
| Farming, Fishing & Forestry | 0 (0.0%) | 0 (0.0%) |
| Construction & Extraction | 59 (100.0%) | 0 (0.0%) |
| Installation, Maintenance & Repair | 84 (100.0%) | 0 (0.0%) |
| Total (Category) | 143 (100.0%) | 0 (0.0%) |
| Total (Overall) | 989 (51.1%) | 947 (48.9%) |
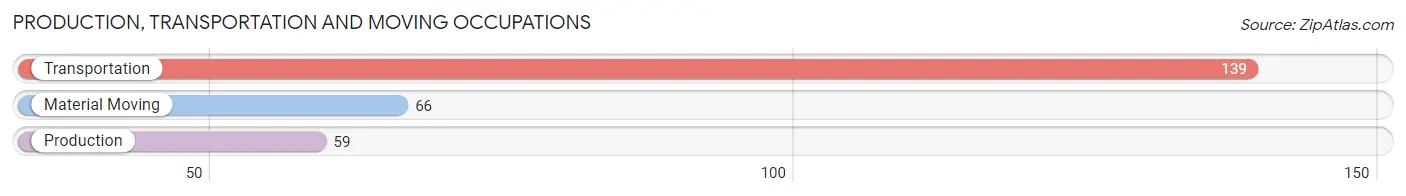
Production, Transportation and Moving Occupations
The most common Production, Transportation and Moving occupations in Ayden are Transportation (139 | 7.2%), Material Moving (66 | 3.4%), and Production (59 | 3.0%).
Production, Transportation and Moving Occupations by Sex
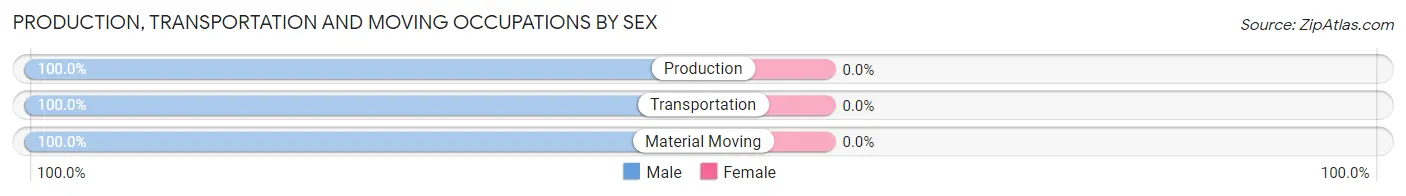
| Occupation | Male | Female |
| Production | 59 (100.0%) | 0 (0.0%) |
| Transportation | 139 (100.0%) | 0 (0.0%) |
| Material Moving | 66 (100.0%) | 0 (0.0%) |
| Total (Category) | 264 (100.0%) | 0 (0.0%) |
| Total (Overall) | 989 (51.1%) | 947 (48.9%) |
Employment Industries by Sex in Ayden
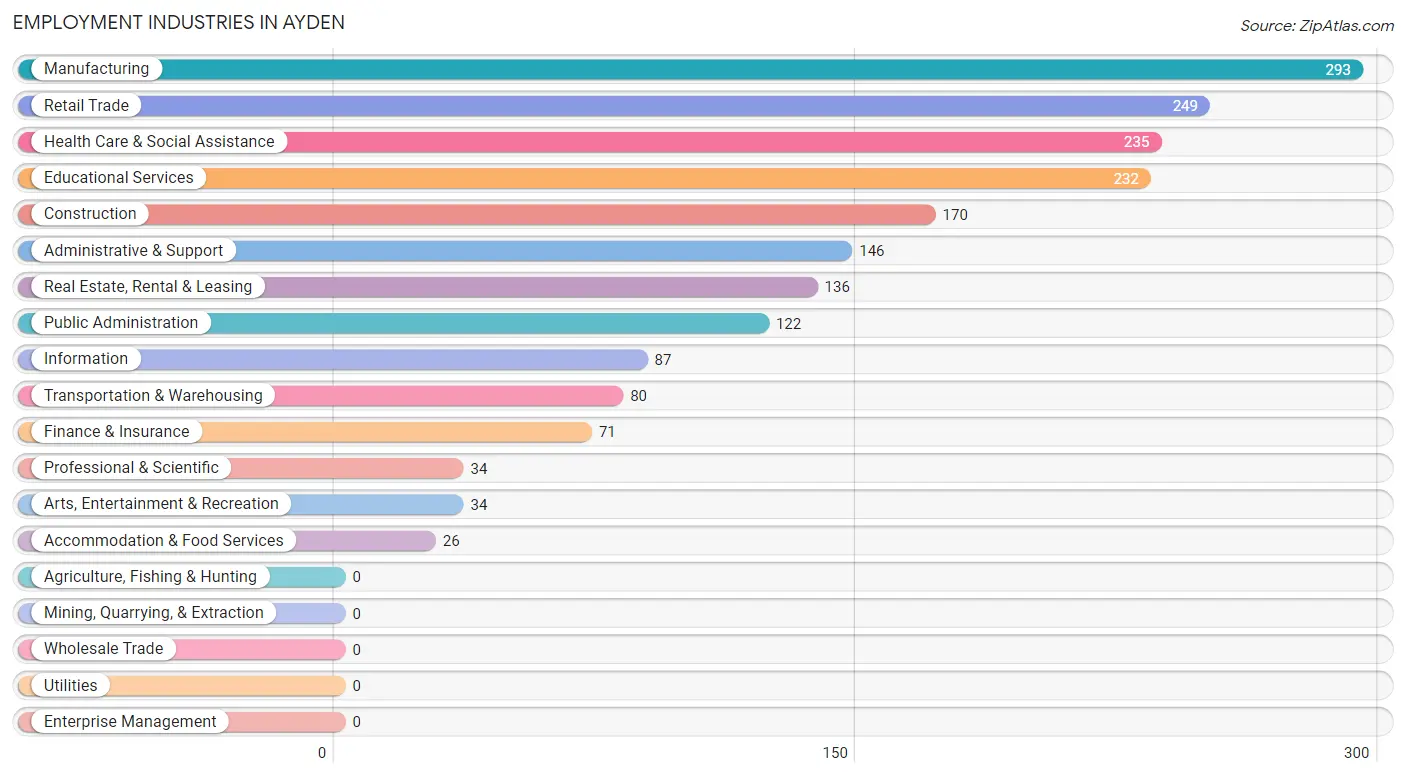
Employment Industries in Ayden
The major employment industries in Ayden include Manufacturing (293 | 15.1%), Retail Trade (249 | 12.9%), Health Care & Social Assistance (235 | 12.1%), Educational Services (232 | 12.0%), and Construction (170 | 8.8%).
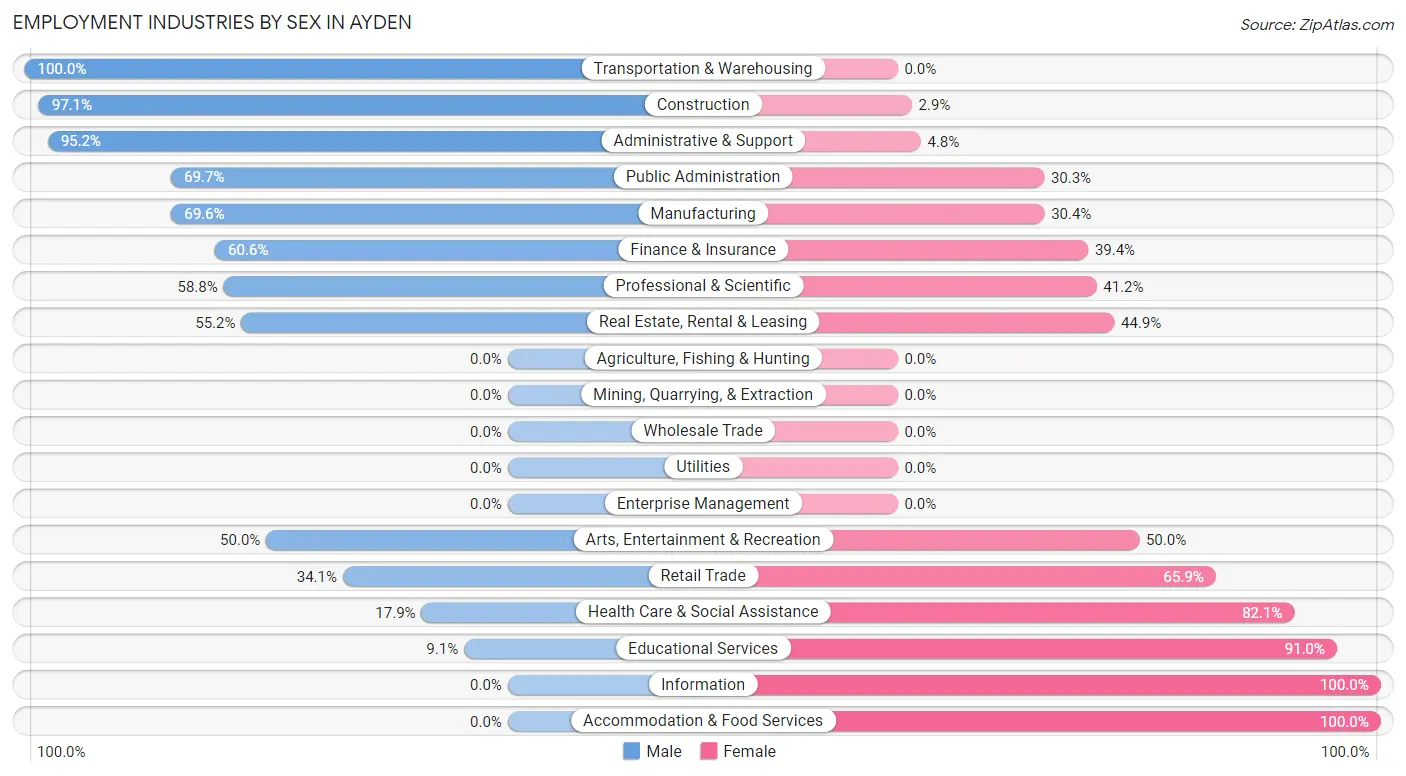
Employment Industries by Sex in Ayden
The Ayden industries that see more men than women are Transportation & Warehousing (100.0%), Construction (97.1%), and Administrative & Support (95.2%), whereas the industries that tend to have a higher number of women are Information (100.0%), Accommodation & Food Services (100.0%), and Educational Services (90.9%).
| Industry | Male | Female |
| Agriculture, Fishing & Hunting | 0 (0.0%) | 0 (0.0%) |
| Mining, Quarrying, & Extraction | 0 (0.0%) | 0 (0.0%) |
| Construction | 165 (97.1%) | 5 (2.9%) |
| Manufacturing | 204 (69.6%) | 89 (30.4%) |
| Wholesale Trade | 0 (0.0%) | 0 (0.0%) |
| Retail Trade | 85 (34.1%) | 164 (65.9%) |
| Transportation & Warehousing | 80 (100.0%) | 0 (0.0%) |
| Utilities | 0 (0.0%) | 0 (0.0%) |
| Information | 0 (0.0%) | 87 (100.0%) |
| Finance & Insurance | 43 (60.6%) | 28 (39.4%) |
| Real Estate, Rental & Leasing | 75 (55.1%) | 61 (44.9%) |
| Professional & Scientific | 20 (58.8%) | 14 (41.2%) |
| Enterprise Management | 0 (0.0%) | 0 (0.0%) |
| Administrative & Support | 139 (95.2%) | 7 (4.8%) |
| Educational Services | 21 (9.0%) | 211 (90.9%) |
| Health Care & Social Assistance | 42 (17.9%) | 193 (82.1%) |
| Arts, Entertainment & Recreation | 17 (50.0%) | 17 (50.0%) |
| Accommodation & Food Services | 0 (0.0%) | 26 (100.0%) |
| Public Administration | 85 (69.7%) | 37 (30.3%) |
| Total | 989 (51.1%) | 947 (48.9%) |
Education in Ayden
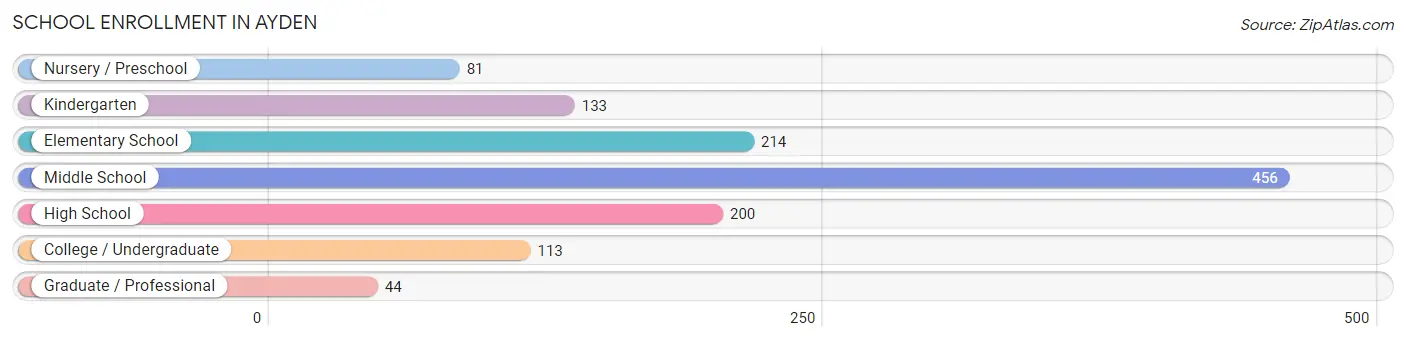
School Enrollment in Ayden
The most common levels of schooling among the 1,241 students in Ayden are middle school (456 | 36.7%), elementary school (214 | 17.2%), and high school (200 | 16.1%).
| School Level | # Students | % Students |
| Nursery / Preschool | 81 | 6.5% |
| Kindergarten | 133 | 10.7% |
| Elementary School | 214 | 17.2% |
| Middle School | 456 | 36.7% |
| High School | 200 | 16.1% |
| College / Undergraduate | 113 | 9.1% |
| Graduate / Professional | 44 | 3.5% |
| Total | 1,241 | 100.0% |
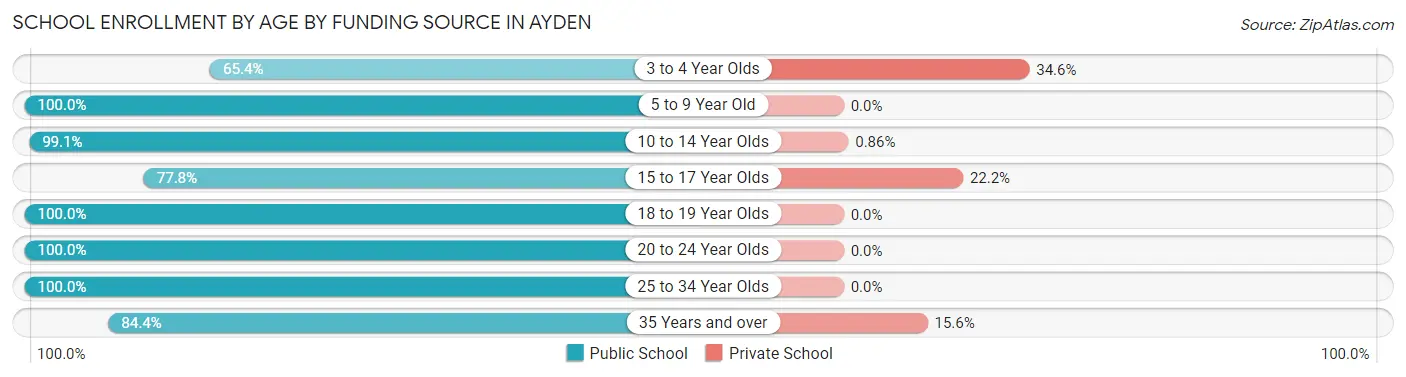
School Enrollment by Age by Funding Source in Ayden
Out of a total of 1,241 students who are enrolled in schools in Ayden, 69 (5.6%) attend a private institution, while the remaining 1,172 (94.4%) are enrolled in public schools. The age group of 3 to 4 year olds has the highest likelihood of being enrolled in private schools, with 28 (34.6% in the age bracket) enrolled. Conversely, the age group of 5 to 9 year old has the lowest likelihood of being enrolled in a private school, with 302 (100.0% in the age bracket) attending a public institution.
| Age Bracket | Public School | Private School |
| 3 to 4 Year Olds | 53 (65.4%) | 28 (34.6%) |
| 5 to 9 Year Old | 302 (100.0%) | 0 (0.0%) |
| 10 to 14 Year Olds | 579 (99.1%) | 5 (0.9%) |
| 15 to 17 Year Olds | 91 (77.8%) | 26 (22.2%) |
| 18 to 19 Year Olds | 18 (100.0%) | 0 (0.0%) |
| 20 to 24 Year Olds | 51 (100.0%) | 0 (0.0%) |
| 25 to 34 Year Olds | 24 (100.0%) | 0 (0.0%) |
| 35 Years and over | 54 (84.4%) | 10 (15.6%) |
| Total | 1,172 (94.4%) | 69 (5.6%) |
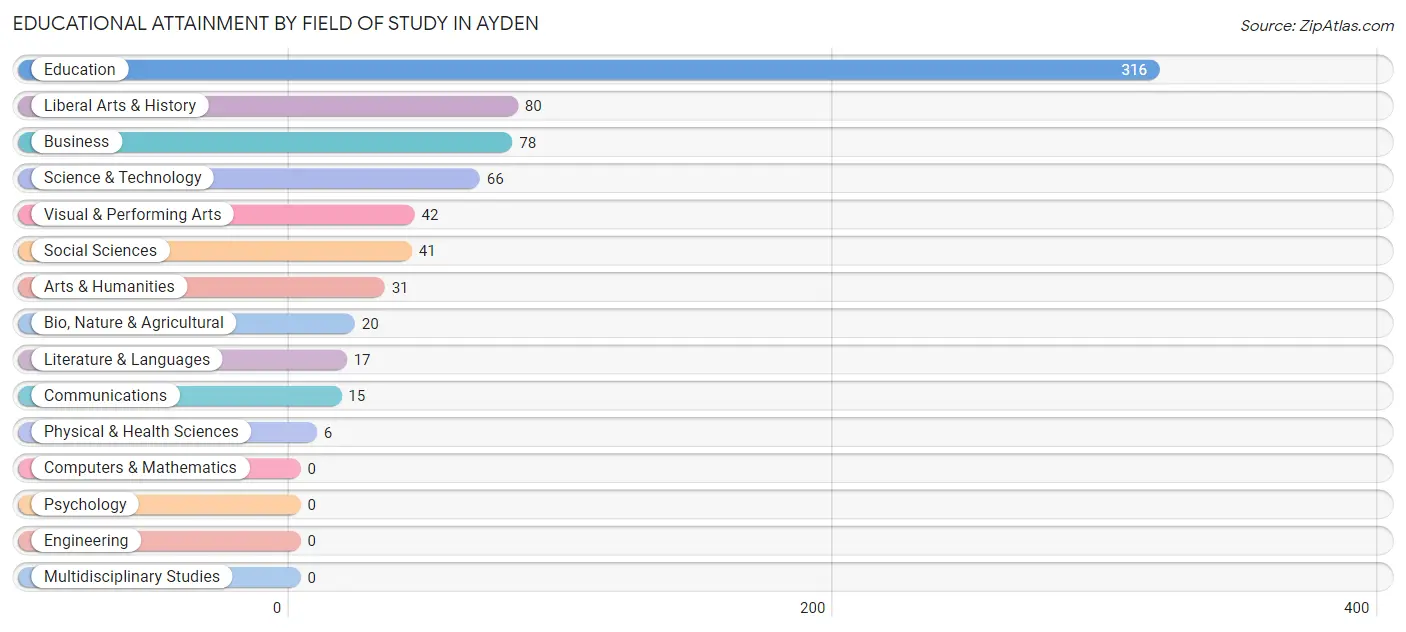
Educational Attainment by Field of Study in Ayden
Education (316 | 44.4%), liberal arts & history (80 | 11.2%), business (78 | 11.0%), science & technology (66 | 9.3%), and visual & performing arts (42 | 5.9%) are the most common fields of study among 712 individuals in Ayden who have obtained a bachelor's degree or higher.
| Field of Study | # Graduates | % Graduates |
| Computers & Mathematics | 0 | 0.0% |
| Bio, Nature & Agricultural | 20 | 2.8% |
| Physical & Health Sciences | 6 | 0.8% |
| Psychology | 0 | 0.0% |
| Social Sciences | 41 | 5.8% |
| Engineering | 0 | 0.0% |
| Multidisciplinary Studies | 0 | 0.0% |
| Science & Technology | 66 | 9.3% |
| Business | 78 | 11.0% |
| Education | 316 | 44.4% |
| Literature & Languages | 17 | 2.4% |
| Liberal Arts & History | 80 | 11.2% |
| Visual & Performing Arts | 42 | 5.9% |
| Communications | 15 | 2.1% |
| Arts & Humanities | 31 | 4.3% |
| Total | 712 | 100.0% |
Transportation & Commute in Ayden
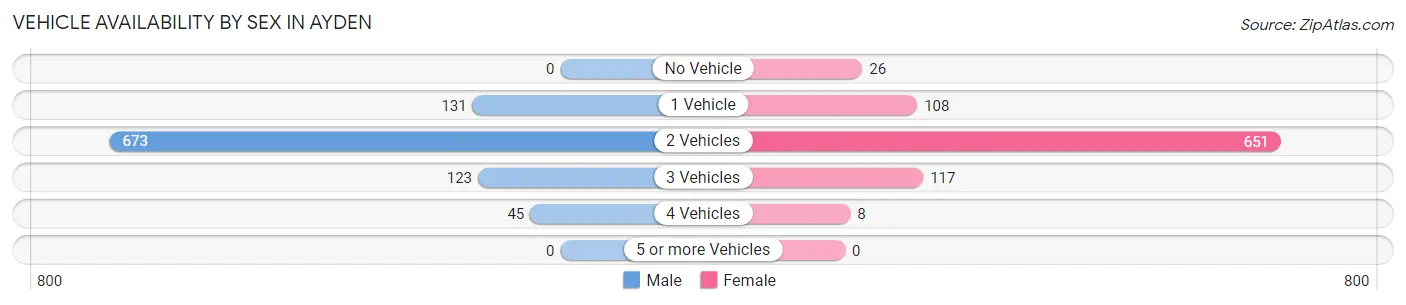
Vehicle Availability by Sex in Ayden
The most prevalent vehicle ownership categories in Ayden are males with 2 vehicles (673, accounting for 69.2%) and females with 2 vehicles (651, making up 74.0%).
| Vehicles Available | Male | Female |
| No Vehicle | 0 (0.0%) | 26 (2.9%) |
| 1 Vehicle | 131 (13.5%) | 108 (11.9%) |
| 2 Vehicles | 673 (69.2%) | 651 (71.5%) |
| 3 Vehicles | 123 (12.7%) | 117 (12.9%) |
| 4 Vehicles | 45 (4.6%) | 8 (0.9%) |
| 5 or more Vehicles | 0 (0.0%) | 0 (0.0%) |
| Total | 972 (100.0%) | 910 (100.0%) |
Commute Time in Ayden
The most frequently occuring commute durations in Ayden are 20 to 24 minutes (639 commuters, 34.9%), 15 to 19 minutes (317 commuters, 17.3%), and 5 to 9 minutes (274 commuters, 15.0%).
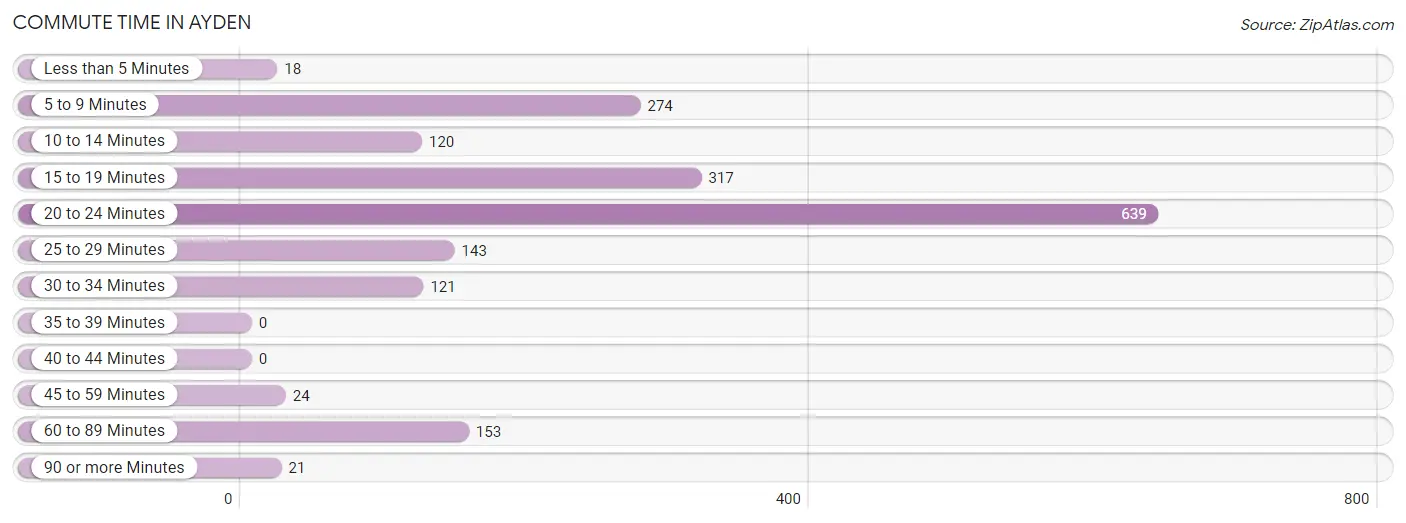
| Commute Time | # Commuters | % Commuters |
| Less than 5 Minutes | 18 | 1.0% |
| 5 to 9 Minutes | 274 | 15.0% |
| 10 to 14 Minutes | 120 | 6.6% |
| 15 to 19 Minutes | 317 | 17.3% |
| 20 to 24 Minutes | 639 | 34.9% |
| 25 to 29 Minutes | 143 | 7.8% |
| 30 to 34 Minutes | 121 | 6.6% |
| 35 to 39 Minutes | 0 | 0.0% |
| 40 to 44 Minutes | 0 | 0.0% |
| 45 to 59 Minutes | 24 | 1.3% |
| 60 to 89 Minutes | 153 | 8.4% |
| 90 or more Minutes | 21 | 1.1% |
Commute Time by Sex in Ayden
The most common commute times in Ayden are 20 to 24 minutes (373 commuters, 38.2%) for males and 15 to 19 minutes (272 commuters, 31.9%) for females.
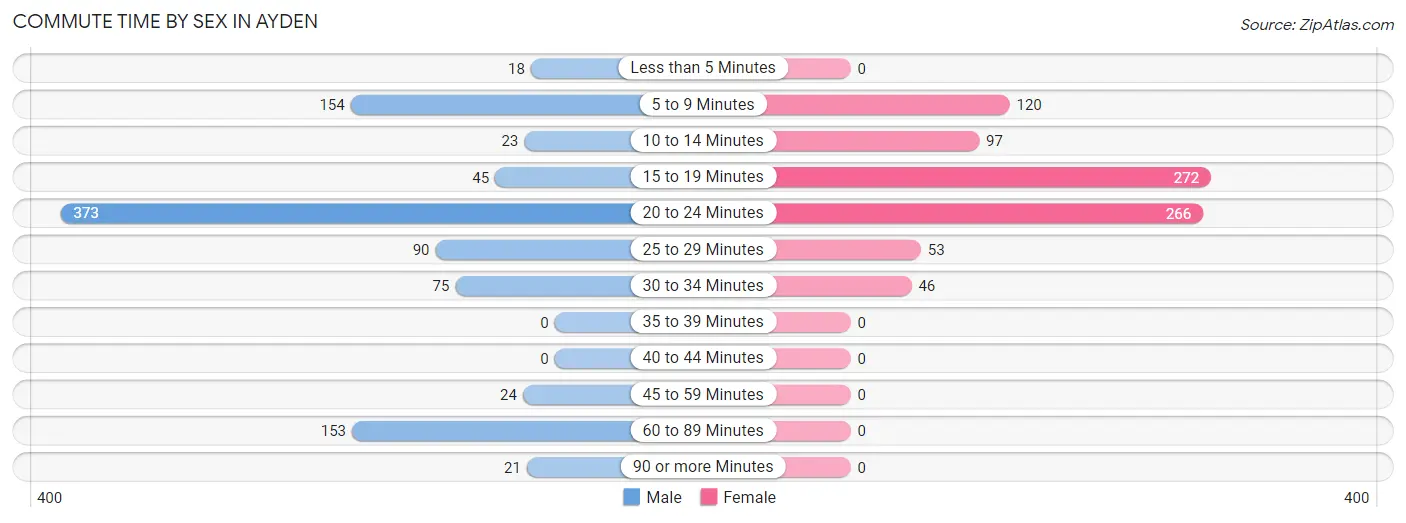
| Commute Time | Male | Female |
| Less than 5 Minutes | 18 (1.8%) | 0 (0.0%) |
| 5 to 9 Minutes | 154 (15.8%) | 120 (14.1%) |
| 10 to 14 Minutes | 23 (2.4%) | 97 (11.4%) |
| 15 to 19 Minutes | 45 (4.6%) | 272 (31.9%) |
| 20 to 24 Minutes | 373 (38.2%) | 266 (31.1%) |
| 25 to 29 Minutes | 90 (9.2%) | 53 (6.2%) |
| 30 to 34 Minutes | 75 (7.7%) | 46 (5.4%) |
| 35 to 39 Minutes | 0 (0.0%) | 0 (0.0%) |
| 40 to 44 Minutes | 0 (0.0%) | 0 (0.0%) |
| 45 to 59 Minutes | 24 (2.5%) | 0 (0.0%) |
| 60 to 89 Minutes | 153 (15.7%) | 0 (0.0%) |
| 90 or more Minutes | 21 (2.1%) | 0 (0.0%) |
Time of Departure to Work by Sex in Ayden
The most frequent times of departure to work in Ayden are 6:30 AM to 6:59 AM (342, 35.0%) for males and 7:00 AM to 7:29 AM (281, 32.9%) for females.
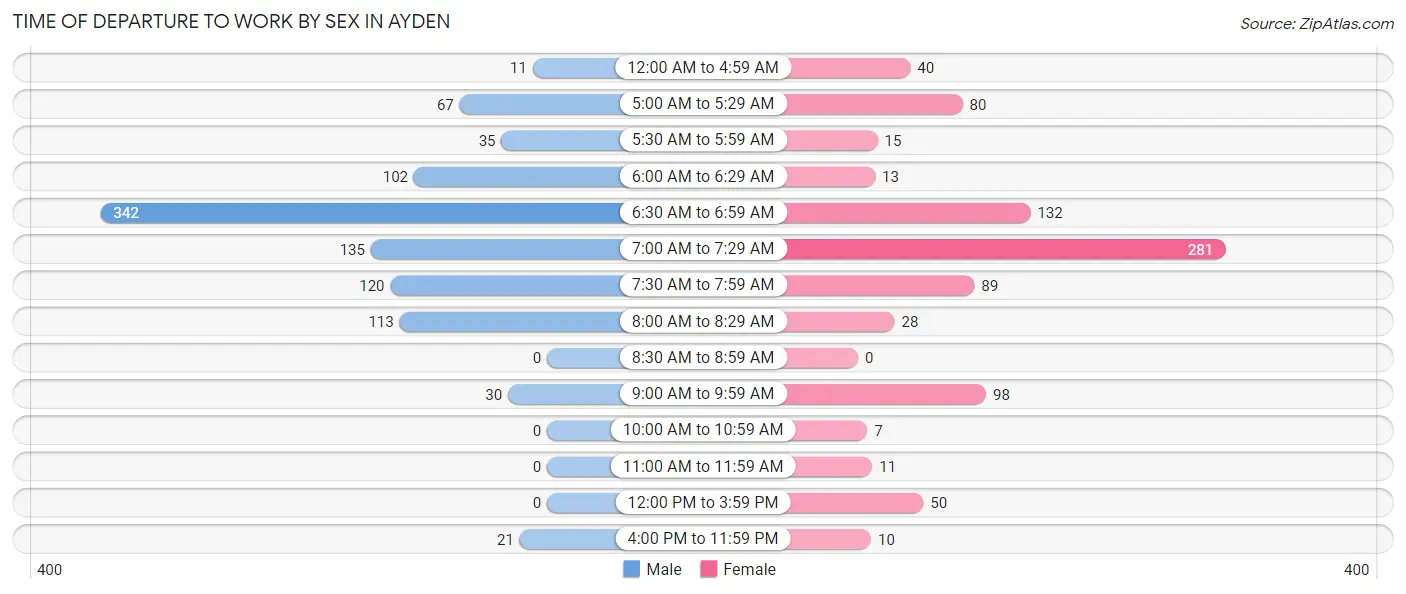
| Time of Departure | Male | Female |
| 12:00 AM to 4:59 AM | 11 (1.1%) | 40 (4.7%) |
| 5:00 AM to 5:29 AM | 67 (6.9%) | 80 (9.4%) |
| 5:30 AM to 5:59 AM | 35 (3.6%) | 15 (1.8%) |
| 6:00 AM to 6:29 AM | 102 (10.4%) | 13 (1.5%) |
| 6:30 AM to 6:59 AM | 342 (35.0%) | 132 (15.5%) |
| 7:00 AM to 7:29 AM | 135 (13.8%) | 281 (32.9%) |
| 7:30 AM to 7:59 AM | 120 (12.3%) | 89 (10.4%) |
| 8:00 AM to 8:29 AM | 113 (11.6%) | 28 (3.3%) |
| 8:30 AM to 8:59 AM | 0 (0.0%) | 0 (0.0%) |
| 9:00 AM to 9:59 AM | 30 (3.1%) | 98 (11.5%) |
| 10:00 AM to 10:59 AM | 0 (0.0%) | 7 (0.8%) |
| 11:00 AM to 11:59 AM | 0 (0.0%) | 11 (1.3%) |
| 12:00 PM to 3:59 PM | 0 (0.0%) | 50 (5.9%) |
| 4:00 PM to 11:59 PM | 21 (2.1%) | 10 (1.2%) |
| Total | 976 (100.0%) | 854 (100.0%) |
Housing Occupancy in Ayden
Occupancy by Ownership in Ayden
Of the total 2,266 dwellings in Ayden, owner-occupied units account for 1,315 (58.0%), while renter-occupied units make up 951 (42.0%).
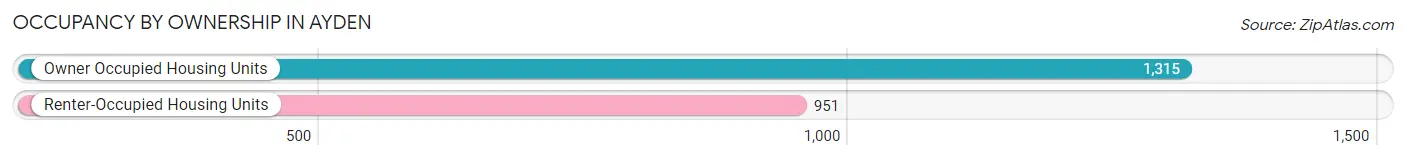
| Occupancy | # Housing Units | % Housing Units |
| Owner Occupied Housing Units | 1,315 | 58.0% |
| Renter-Occupied Housing Units | 951 | 42.0% |
| Total Occupied Housing Units | 2,266 | 100.0% |
Occupancy by Household Size in Ayden
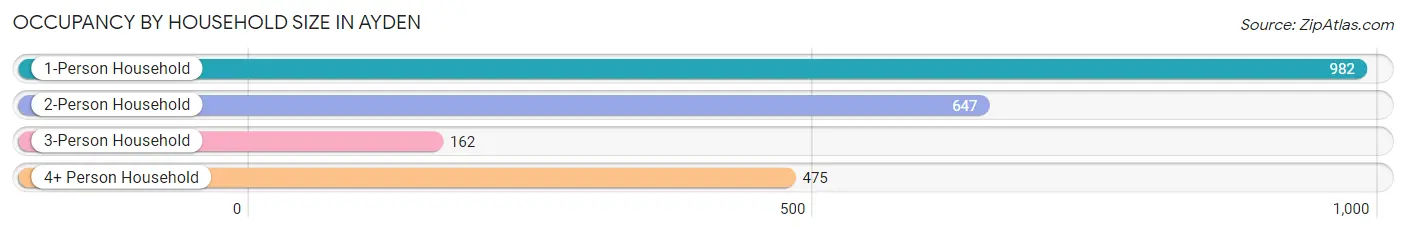
| Household Size | # Housing Units | % Housing Units |
| 1-Person Household | 982 | 43.3% |
| 2-Person Household | 647 | 28.5% |
| 3-Person Household | 162 | 7.1% |
| 4+ Person Household | 475 | 21.0% |
| Total Housing Units | 2,266 | 100.0% |
Occupancy by Ownership by Household Size in Ayden
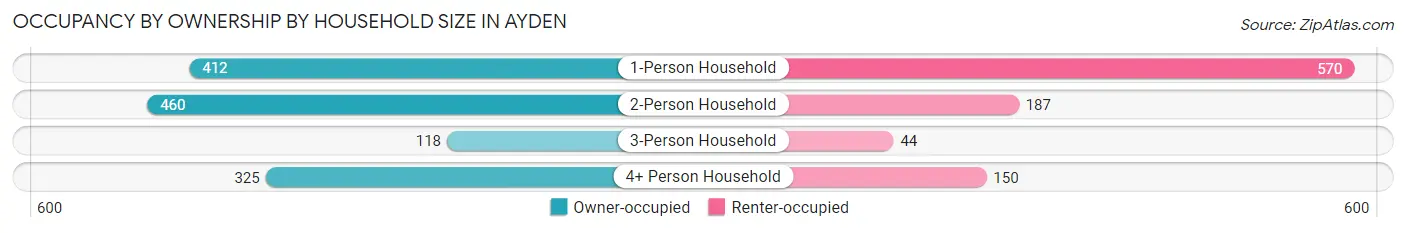
| Household Size | Owner-occupied | Renter-occupied |
| 1-Person Household | 412 (42.0%) | 570 (58.0%) |
| 2-Person Household | 460 (71.1%) | 187 (28.9%) |
| 3-Person Household | 118 (72.8%) | 44 (27.2%) |
| 4+ Person Household | 325 (68.4%) | 150 (31.6%) |
| Total Housing Units | 1,315 (58.0%) | 951 (42.0%) |
Occupancy by Educational Attainment in Ayden
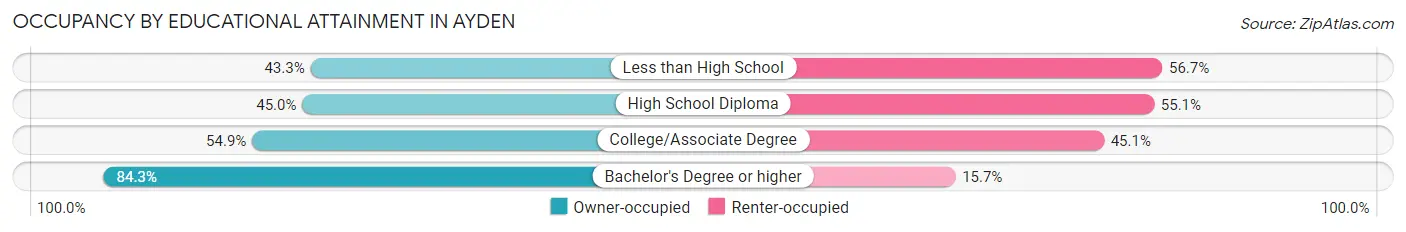
| Household Size | Owner-occupied | Renter-occupied |
| Less than High School | 133 (43.3%) | 174 (56.7%) |
| High School Diploma | 316 (45.0%) | 387 (55.0%) |
| College/Associate Degree | 360 (54.9%) | 296 (45.1%) |
| Bachelor's Degree or higher | 506 (84.3%) | 94 (15.7%) |
Occupancy by Age of Householder in Ayden
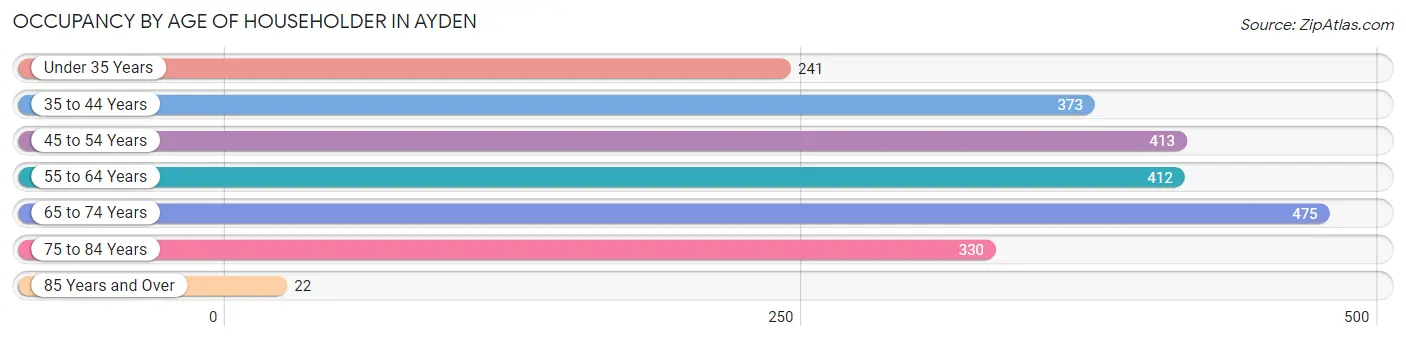
| Age Bracket | # Households | % Households |
| Under 35 Years | 241 | 10.6% |
| 35 to 44 Years | 373 | 16.5% |
| 45 to 54 Years | 413 | 18.2% |
| 55 to 64 Years | 412 | 18.2% |
| 65 to 74 Years | 475 | 21.0% |
| 75 to 84 Years | 330 | 14.6% |
| 85 Years and Over | 22 | 1.0% |
| Total | 2,266 | 100.0% |
Housing Finances in Ayden
Median Income by Occupancy in Ayden
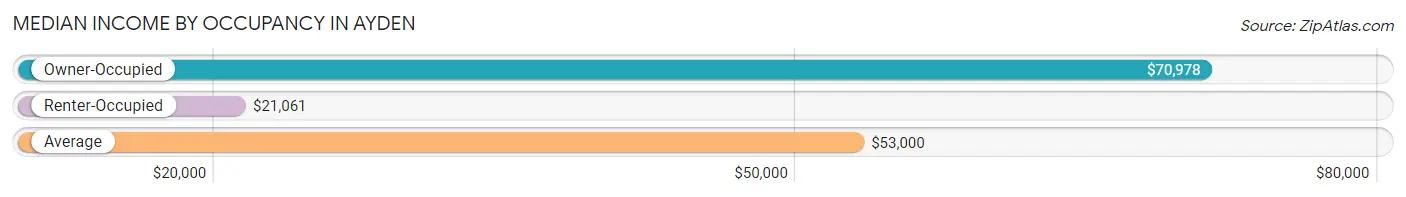
| Occupancy Type | # Households | Median Income |
| Owner-Occupied | 1,315 (58.0%) | $70,978 |
| Renter-Occupied | 951 (42.0%) | $21,061 |
| Average | 2,266 (100.0%) | $53,000 |
Occupancy by Householder Income Bracket in Ayden
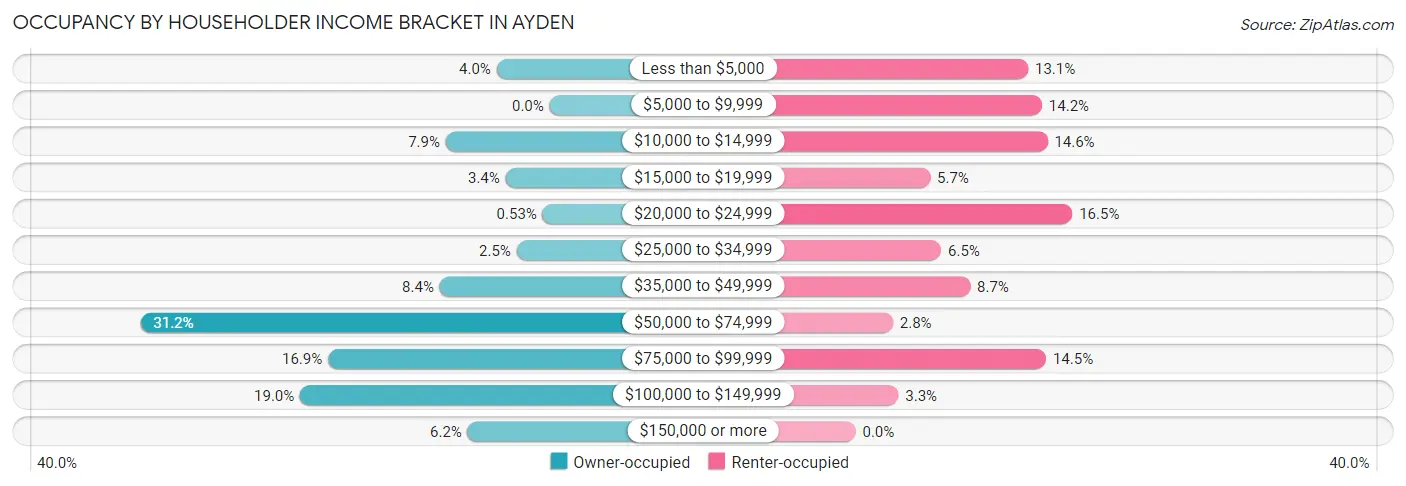
| Income Bracket | Owner-occupied | Renter-occupied |
| Less than $5,000 | 53 (4.0%) | 125 (13.1%) |
| $5,000 to $9,999 | 0 (0.0%) | 135 (14.2%) |
| $10,000 to $14,999 | 104 (7.9%) | 139 (14.6%) |
| $15,000 to $19,999 | 44 (3.4%) | 54 (5.7%) |
| $20,000 to $24,999 | 7 (0.5%) | 157 (16.5%) |
| $25,000 to $34,999 | 33 (2.5%) | 62 (6.5%) |
| $35,000 to $49,999 | 110 (8.4%) | 83 (8.7%) |
| $50,000 to $74,999 | 410 (31.2%) | 27 (2.8%) |
| $75,000 to $99,999 | 222 (16.9%) | 138 (14.5%) |
| $100,000 to $149,999 | 250 (19.0%) | 31 (3.3%) |
| $150,000 or more | 82 (6.2%) | 0 (0.0%) |
| Total | 1,315 (100.0%) | 951 (100.0%) |
Monthly Housing Cost Tiers in Ayden
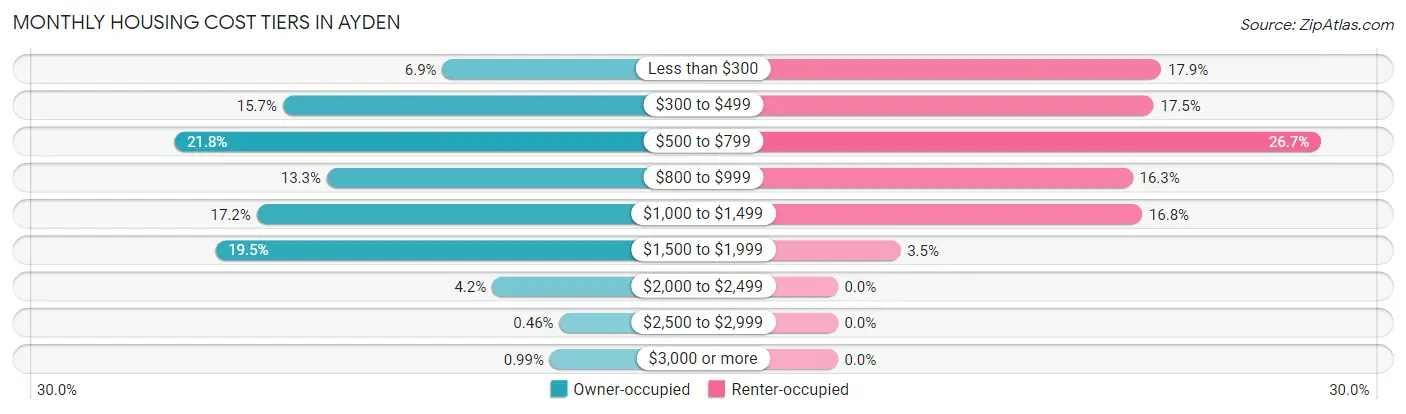
| Monthly Cost | Owner-occupied | Renter-occupied |
| Less than $300 | 91 (6.9%) | 170 (17.9%) |
| $300 to $499 | 207 (15.7%) | 166 (17.5%) |
| $500 to $799 | 286 (21.7%) | 254 (26.7%) |
| $800 to $999 | 175 (13.3%) | 155 (16.3%) |
| $1,000 to $1,499 | 226 (17.2%) | 160 (16.8%) |
| $1,500 to $1,999 | 256 (19.5%) | 33 (3.5%) |
| $2,000 to $2,499 | 55 (4.2%) | 0 (0.0%) |
| $2,500 to $2,999 | 6 (0.5%) | 0 (0.0%) |
| $3,000 or more | 13 (1.0%) | 0 (0.0%) |
| Total | 1,315 (100.0%) | 951 (100.0%) |
Physical Housing Characteristics in Ayden
Housing Structures in Ayden
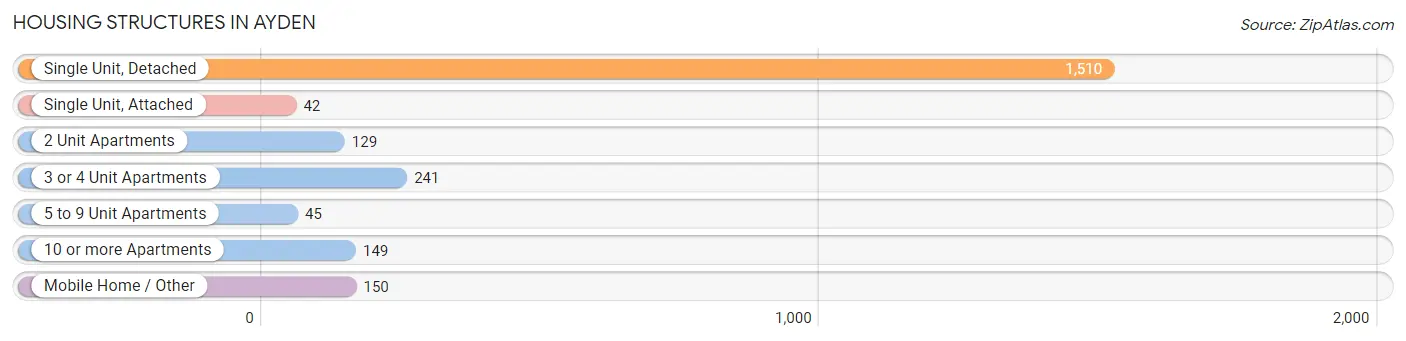
| Structure Type | # Housing Units | % Housing Units |
| Single Unit, Detached | 1,510 | 66.6% |
| Single Unit, Attached | 42 | 1.8% |
| 2 Unit Apartments | 129 | 5.7% |
| 3 or 4 Unit Apartments | 241 | 10.6% |
| 5 to 9 Unit Apartments | 45 | 2.0% |
| 10 or more Apartments | 149 | 6.6% |
| Mobile Home / Other | 150 | 6.6% |
| Total | 2,266 | 100.0% |
Housing Structures by Occupancy in Ayden
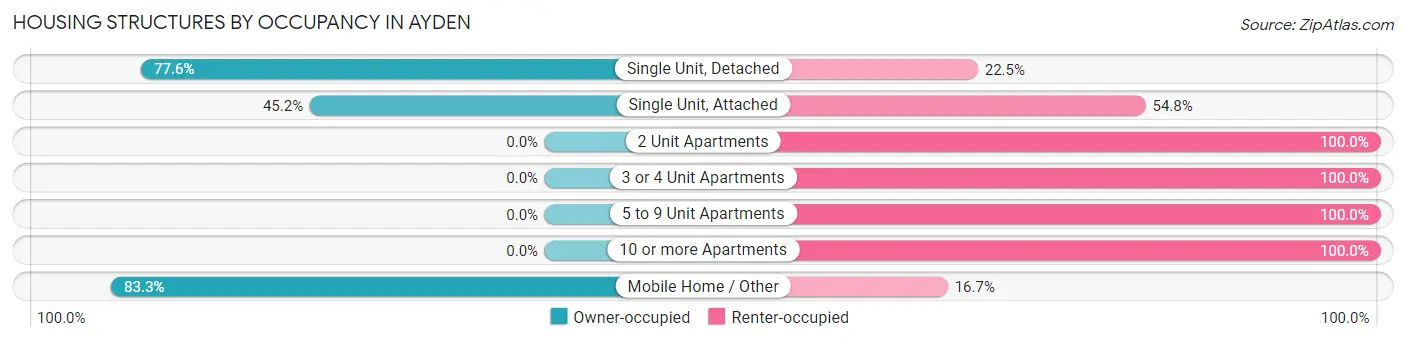
| Structure Type | Owner-occupied | Renter-occupied |
| Single Unit, Detached | 1,171 (77.5%) | 339 (22.5%) |
| Single Unit, Attached | 19 (45.2%) | 23 (54.8%) |
| 2 Unit Apartments | 0 (0.0%) | 129 (100.0%) |
| 3 or 4 Unit Apartments | 0 (0.0%) | 241 (100.0%) |
| 5 to 9 Unit Apartments | 0 (0.0%) | 45 (100.0%) |
| 10 or more Apartments | 0 (0.0%) | 149 (100.0%) |
| Mobile Home / Other | 125 (83.3%) | 25 (16.7%) |
| Total | 1,315 (58.0%) | 951 (42.0%) |
Housing Structures by Number of Rooms in Ayden
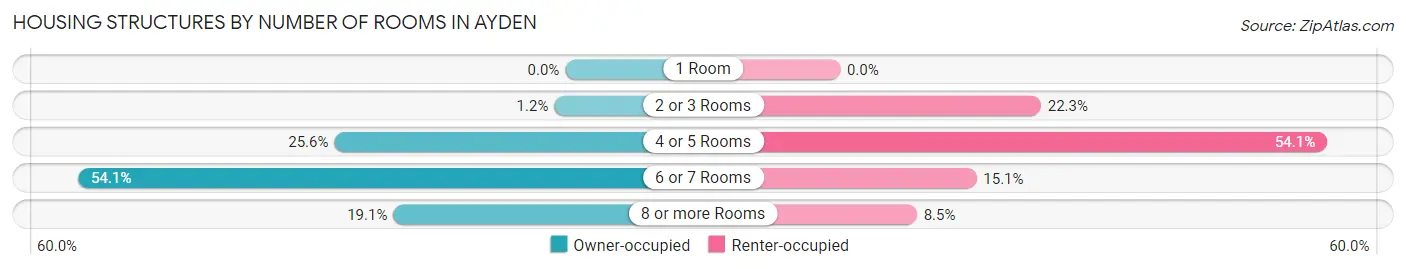
| Number of Rooms | Owner-occupied | Renter-occupied |
| 1 Room | 0 (0.0%) | 0 (0.0%) |
| 2 or 3 Rooms | 16 (1.2%) | 212 (22.3%) |
| 4 or 5 Rooms | 337 (25.6%) | 514 (54.0%) |
| 6 or 7 Rooms | 711 (54.1%) | 144 (15.1%) |
| 8 or more Rooms | 251 (19.1%) | 81 (8.5%) |
| Total | 1,315 (100.0%) | 951 (100.0%) |
Housing Structure by Heating Type in Ayden
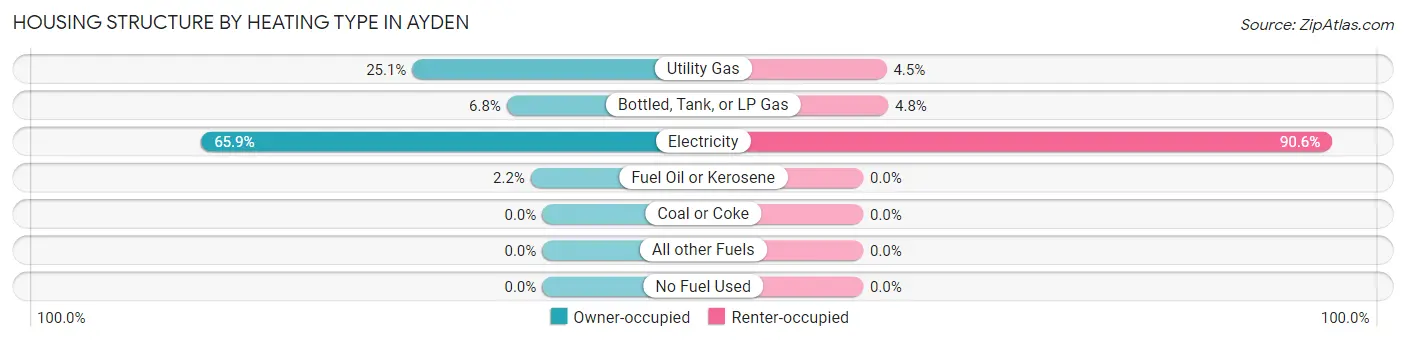
| Heating Type | Owner-occupied | Renter-occupied |
| Utility Gas | 330 (25.1%) | 43 (4.5%) |
| Bottled, Tank, or LP Gas | 90 (6.8%) | 46 (4.8%) |
| Electricity | 866 (65.9%) | 862 (90.6%) |
| Fuel Oil or Kerosene | 29 (2.2%) | 0 (0.0%) |
| Coal or Coke | 0 (0.0%) | 0 (0.0%) |
| All other Fuels | 0 (0.0%) | 0 (0.0%) |
| No Fuel Used | 0 (0.0%) | 0 (0.0%) |
| Total | 1,315 (100.0%) | 951 (100.0%) |
Household Vehicle Usage in Ayden
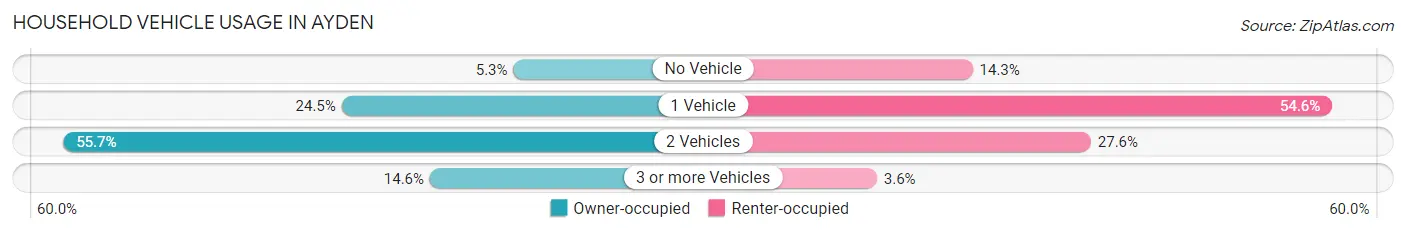
| Vehicles per Household | Owner-occupied | Renter-occupied |
| No Vehicle | 69 (5.2%) | 136 (14.3%) |
| 1 Vehicle | 322 (24.5%) | 519 (54.6%) |
| 2 Vehicles | 732 (55.7%) | 262 (27.6%) |
| 3 or more Vehicles | 192 (14.6%) | 34 (3.6%) |
| Total | 1,315 (100.0%) | 951 (100.0%) |
Real Estate & Mortgages in Ayden
Real Estate and Mortgage Overview in Ayden
| Characteristic | Without Mortgage | With Mortgage |
| Housing Units | 567 | 748 |
| Median Property Value | $137,400 | $169,700 |
| Median Household Income | $59,094 | $69 |
| Monthly Housing Costs | $493 | $13 |
| Real Estate Taxes | $971 | $0 |
Property Value by Mortgage Status in Ayden
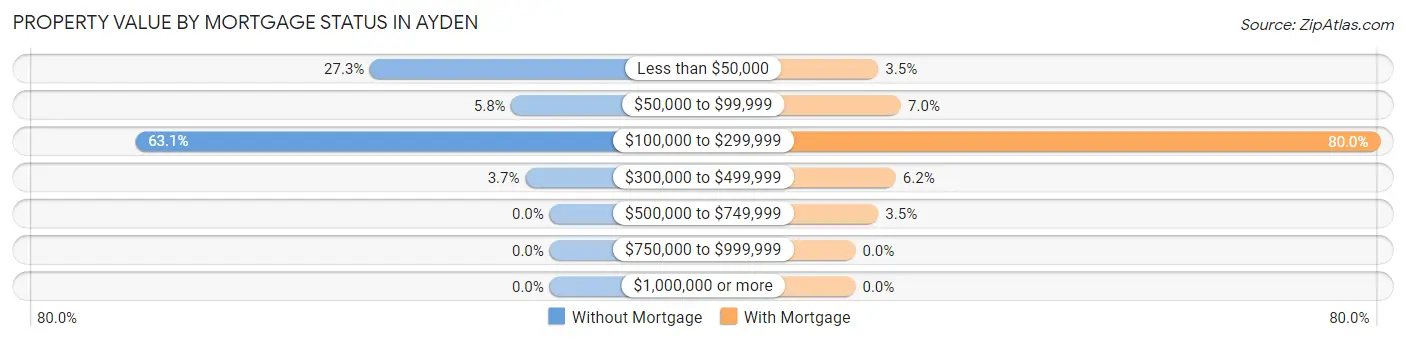
| Property Value | Without Mortgage | With Mortgage |
| Less than $50,000 | 155 (27.3%) | 26 (3.5%) |
| $50,000 to $99,999 | 33 (5.8%) | 52 (7.0%) |
| $100,000 to $299,999 | 358 (63.1%) | 598 (79.9%) |
| $300,000 to $499,999 | 21 (3.7%) | 46 (6.1%) |
| $500,000 to $749,999 | 0 (0.0%) | 26 (3.5%) |
| $750,000 to $999,999 | 0 (0.0%) | 0 (0.0%) |
| $1,000,000 or more | 0 (0.0%) | 0 (0.0%) |
| Total | 567 (100.0%) | 748 (100.0%) |
Household Income by Mortgage Status in Ayden
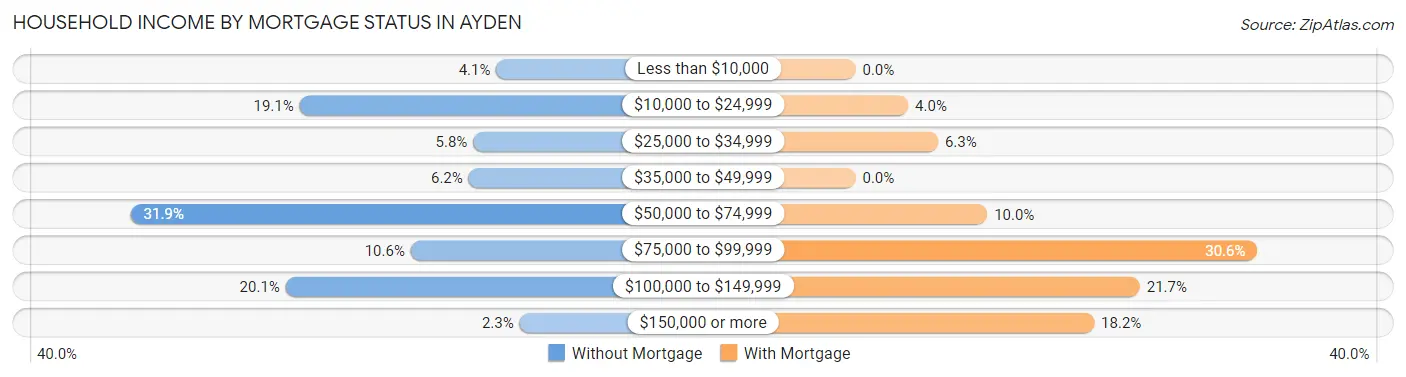
| Household Income | Without Mortgage | With Mortgage |
| Less than $10,000 | 23 (4.1%) | 0 (0.0%) |
| $10,000 to $24,999 | 108 (19.1%) | 30 (4.0%) |
| $25,000 to $34,999 | 33 (5.8%) | 47 (6.3%) |
| $35,000 to $49,999 | 35 (6.2%) | 0 (0.0%) |
| $50,000 to $74,999 | 181 (31.9%) | 75 (10.0%) |
| $75,000 to $99,999 | 60 (10.6%) | 229 (30.6%) |
| $100,000 to $149,999 | 114 (20.1%) | 162 (21.7%) |
| $150,000 or more | 13 (2.3%) | 136 (18.2%) |
| Total | 567 (100.0%) | 748 (100.0%) |
Property Value to Household Income Ratio in Ayden
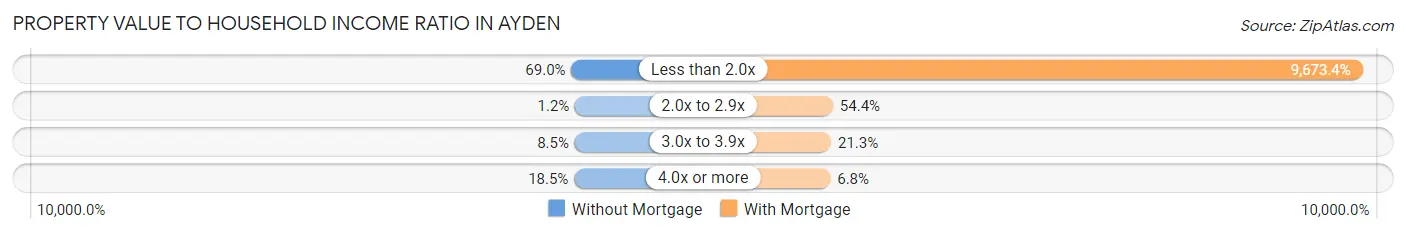
| Value-to-Income Ratio | Without Mortgage | With Mortgage |
| Less than 2.0x | 391 (69.0%) | 72,357 (9,673.4%) |
| 2.0x to 2.9x | 7 (1.2%) | 407 (54.4%) |
| 3.0x to 3.9x | 48 (8.5%) | 159 (21.3%) |
| 4.0x or more | 105 (18.5%) | 51 (6.8%) |
| Total | 567 (100.0%) | 748 (100.0%) |
Real Estate Taxes by Mortgage Status in Ayden
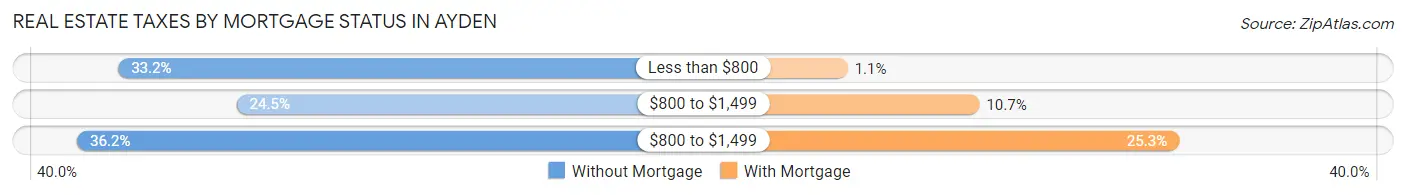
| Property Taxes | Without Mortgage | With Mortgage |
| Less than $800 | 188 (33.2%) | 8 (1.1%) |
| $800 to $1,499 | 139 (24.5%) | 80 (10.7%) |
| $800 to $1,499 | 205 (36.2%) | 189 (25.3%) |
| Total | 567 (100.0%) | 748 (100.0%) |
Health & Disability in Ayden
Health Insurance Coverage by Age in Ayden
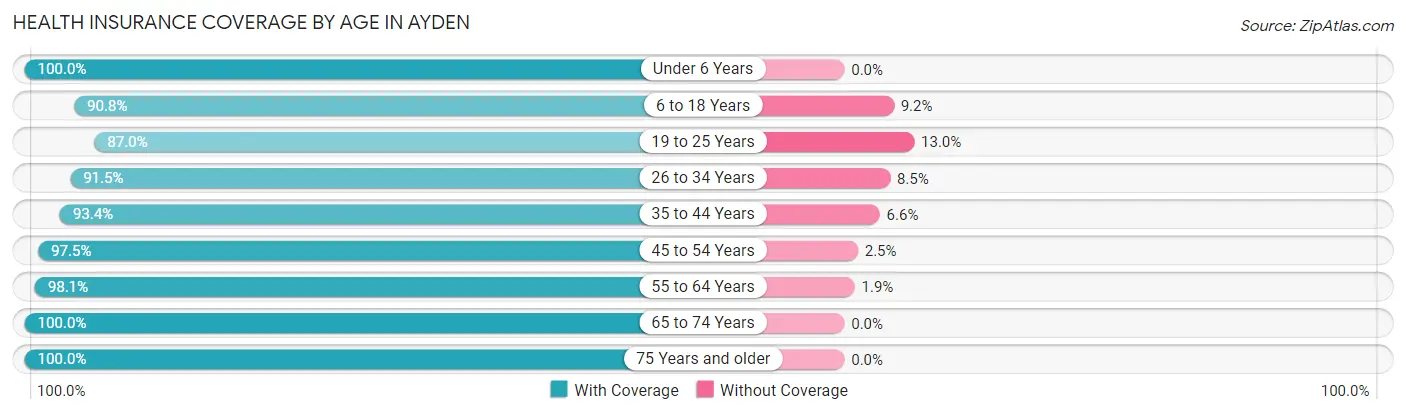
| Age Bracket | With Coverage | Without Coverage |
| Under 6 Years | 263 (100.0%) | 0 (0.0%) |
| 6 to 18 Years | 876 (90.8%) | 89 (9.2%) |
| 19 to 25 Years | 147 (87.0%) | 22 (13.0%) |
| 26 to 34 Years | 441 (91.5%) | 41 (8.5%) |
| 35 to 44 Years | 595 (93.4%) | 42 (6.6%) |
| 45 to 54 Years | 622 (97.5%) | 16 (2.5%) |
| 55 to 64 Years | 612 (98.1%) | 12 (1.9%) |
| 65 to 74 Years | 694 (100.0%) | 0 (0.0%) |
| 75 Years and older | 478 (100.0%) | 0 (0.0%) |
| Total | 4,728 (95.5%) | 222 (4.5%) |
Health Insurance Coverage by Citizenship Status in Ayden
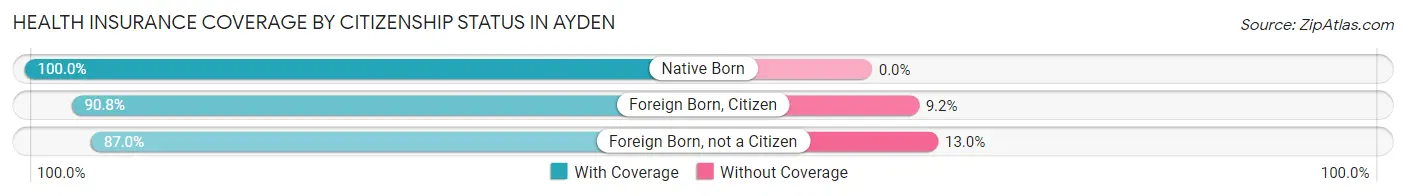
| Citizenship Status | With Coverage | Without Coverage |
| Native Born | 263 (100.0%) | 0 (0.0%) |
| Foreign Born, Citizen | 876 (90.8%) | 89 (9.2%) |
| Foreign Born, not a Citizen | 147 (87.0%) | 22 (13.0%) |
Health Insurance Coverage by Household Income in Ayden
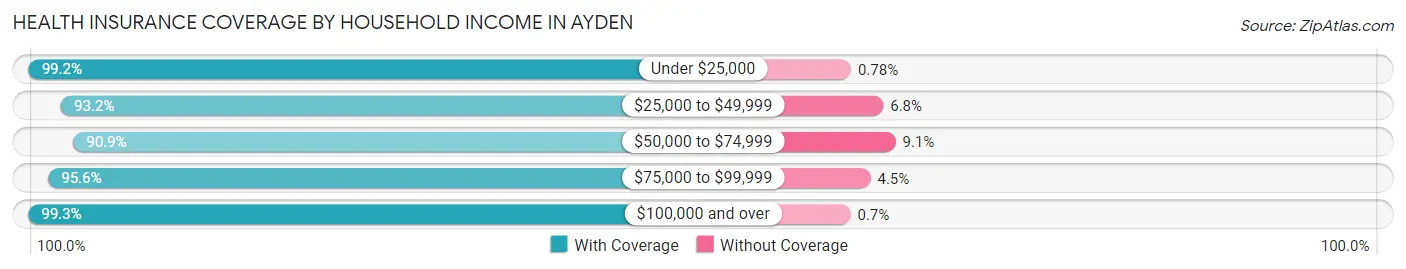
| Household Income | With Coverage | Without Coverage |
| Under $25,000 | 1,020 (99.2%) | 8 (0.8%) |
| $25,000 to $49,999 | 654 (93.2%) | 48 (6.8%) |
| $50,000 to $74,999 | 1,153 (90.9%) | 116 (9.1%) |
| $75,000 to $99,999 | 902 (95.6%) | 42 (4.4%) |
| $100,000 and over | 989 (99.3%) | 7 (0.7%) |
Public vs Private Health Insurance Coverage by Age in Ayden
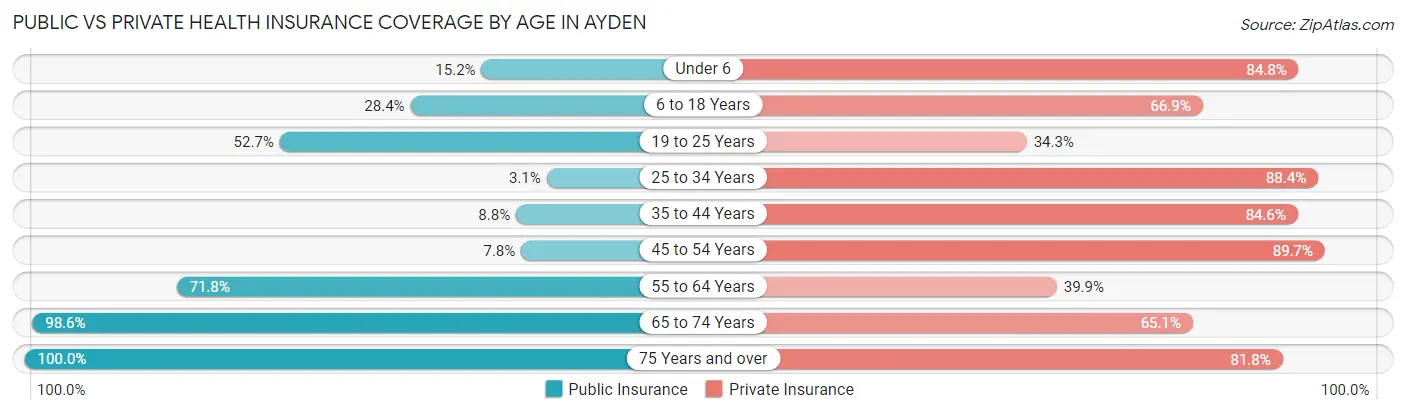
| Age Bracket | Public Insurance | Private Insurance |
| Under 6 | 40 (15.2%) | 223 (84.8%) |
| 6 to 18 Years | 274 (28.4%) | 646 (66.9%) |
| 19 to 25 Years | 89 (52.7%) | 58 (34.3%) |
| 25 to 34 Years | 15 (3.1%) | 426 (88.4%) |
| 35 to 44 Years | 56 (8.8%) | 539 (84.6%) |
| 45 to 54 Years | 50 (7.8%) | 572 (89.7%) |
| 55 to 64 Years | 448 (71.8%) | 249 (39.9%) |
| 65 to 74 Years | 684 (98.6%) | 452 (65.1%) |
| 75 Years and over | 478 (100.0%) | 391 (81.8%) |
| Total | 2,134 (43.1%) | 3,556 (71.8%) |
Disability Status by Sex by Age in Ayden
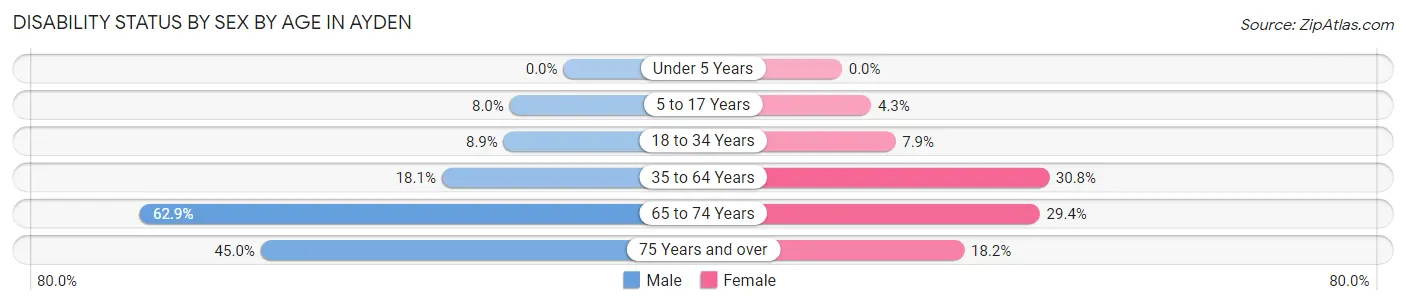
| Age Bracket | Male | Female |
| Under 5 Years | 0 (0.0%) | 0 (0.0%) |
| 5 to 17 Years | 45 (8.0%) | 21 (4.3%) |
| 18 to 34 Years | 22 (8.9%) | 32 (7.9%) |
| 35 to 64 Years | 175 (18.1%) | 286 (30.7%) |
| 65 to 74 Years | 203 (62.8%) | 109 (29.4%) |
| 75 Years and over | 49 (45.0%) | 67 (18.2%) |
Disability Class by Sex by Age in Ayden
Disability Class: Hearing Difficulty
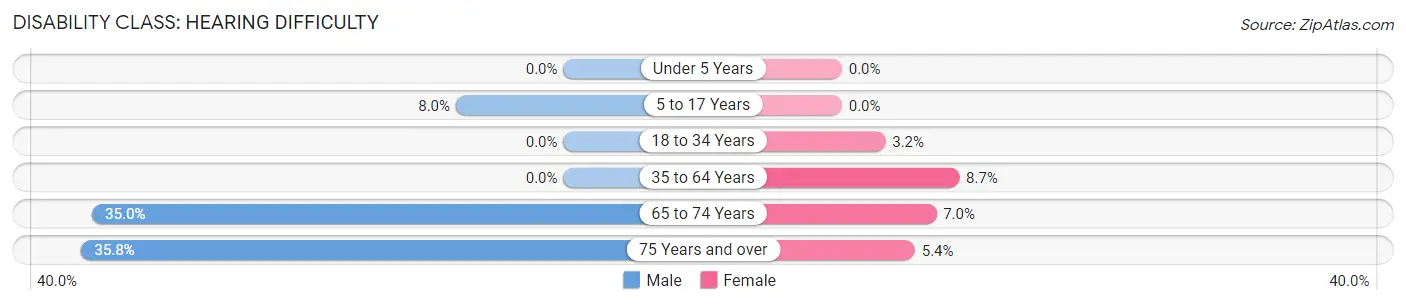
| Age Bracket | Male | Female |
| Under 5 Years | 0 (0.0%) | 0 (0.0%) |
| 5 to 17 Years | 45 (8.0%) | 0 (0.0%) |
| 18 to 34 Years | 0 (0.0%) | 13 (3.2%) |
| 35 to 64 Years | 0 (0.0%) | 81 (8.7%) |
| 65 to 74 Years | 113 (35.0%) | 26 (7.0%) |
| 75 Years and over | 39 (35.8%) | 20 (5.4%) |
Disability Class: Vision Difficulty
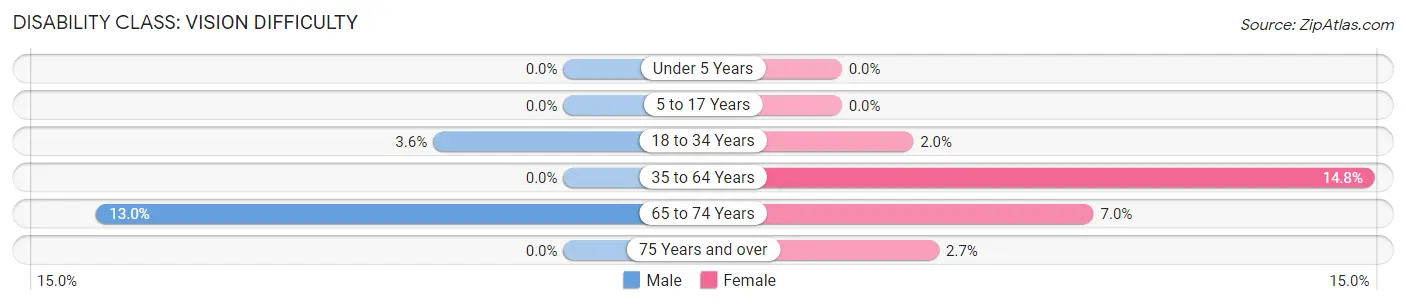
| Age Bracket | Male | Female |
| Under 5 Years | 0 (0.0%) | 0 (0.0%) |
| 5 to 17 Years | 0 (0.0%) | 0 (0.0%) |
| 18 to 34 Years | 9 (3.6%) | 8 (2.0%) |
| 35 to 64 Years | 0 (0.0%) | 138 (14.8%) |
| 65 to 74 Years | 42 (13.0%) | 26 (7.0%) |
| 75 Years and over | 0 (0.0%) | 10 (2.7%) |
Disability Class: Cognitive Difficulty
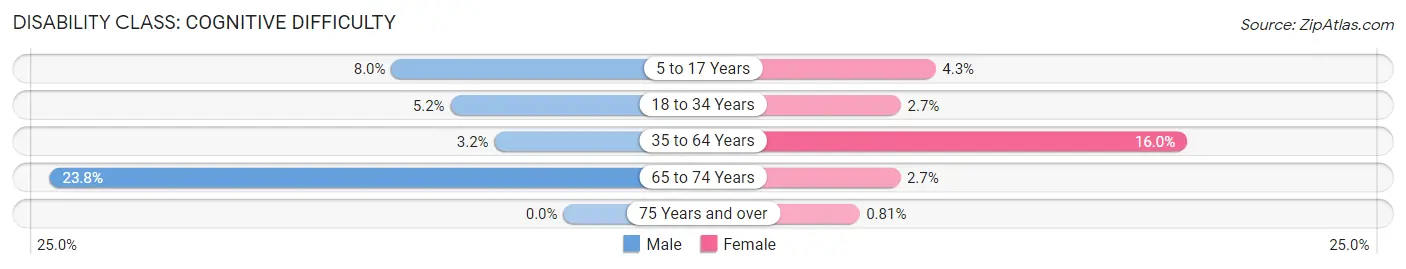
| Age Bracket | Male | Female |
| 5 to 17 Years | 45 (8.0%) | 21 (4.3%) |
| 18 to 34 Years | 13 (5.2%) | 11 (2.7%) |
| 35 to 64 Years | 31 (3.2%) | 149 (16.0%) |
| 65 to 74 Years | 77 (23.8%) | 10 (2.7%) |
| 75 Years and over | 0 (0.0%) | 3 (0.8%) |
Disability Class: Ambulatory Difficulty
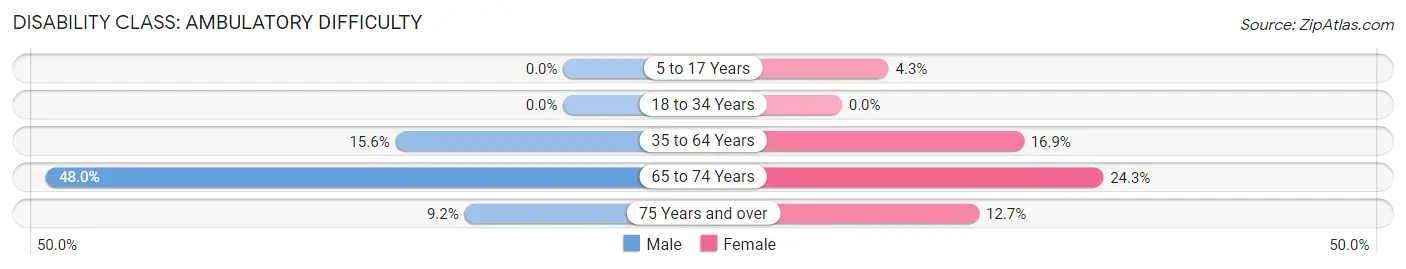
| Age Bracket | Male | Female |
| 5 to 17 Years | 0 (0.0%) | 21 (4.3%) |
| 18 to 34 Years | 0 (0.0%) | 0 (0.0%) |
| 35 to 64 Years | 151 (15.6%) | 157 (16.9%) |
| 65 to 74 Years | 155 (48.0%) | 90 (24.3%) |
| 75 Years and over | 10 (9.2%) | 47 (12.7%) |
Disability Class: Self-Care Difficulty
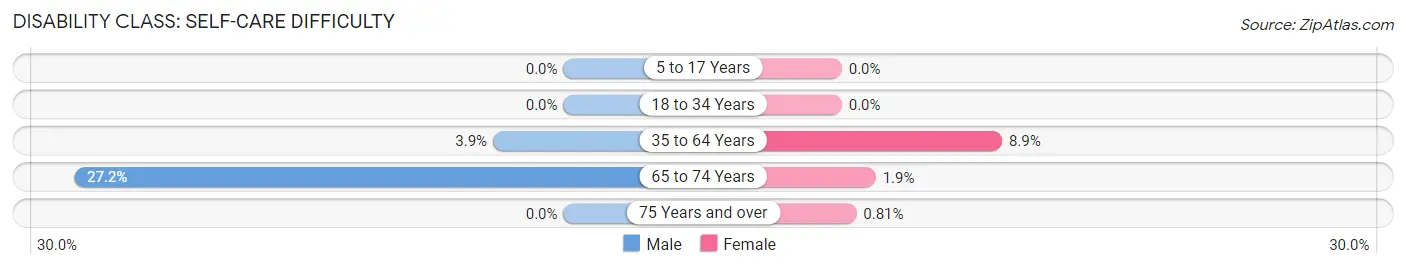
| Age Bracket | Male | Female |
| 5 to 17 Years | 0 (0.0%) | 0 (0.0%) |
| 18 to 34 Years | 0 (0.0%) | 0 (0.0%) |
| 35 to 64 Years | 38 (3.9%) | 83 (8.9%) |
| 65 to 74 Years | 88 (27.2%) | 7 (1.9%) |
| 75 Years and over | 0 (0.0%) | 3 (0.8%) |
Technology Access in Ayden
Computing Device Access in Ayden
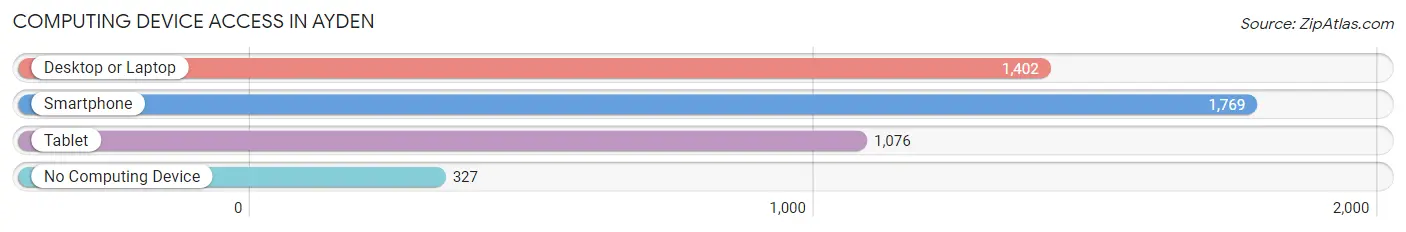
| Device Type | # Households | % Households |
| Desktop or Laptop | 1,402 | 61.9% |
| Smartphone | 1,769 | 78.1% |
| Tablet | 1,076 | 47.5% |
| No Computing Device | 327 | 14.4% |
| Total | 2,266 | 100.0% |
Internet Access in Ayden
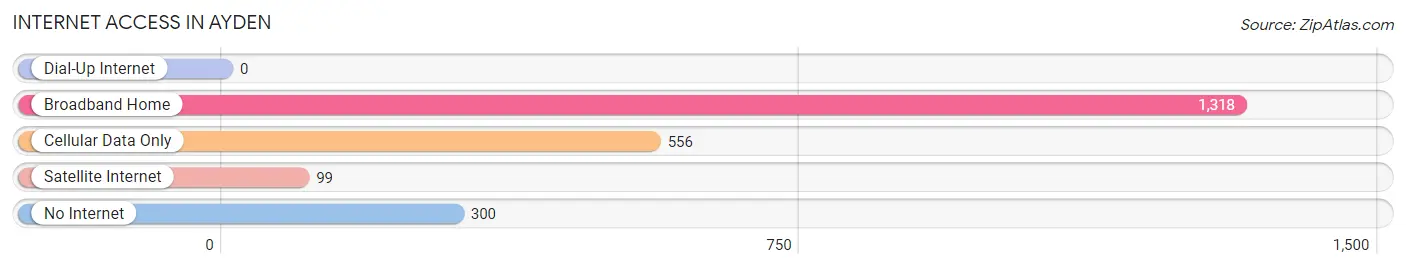
| Internet Type | # Households | % Households |
| Dial-Up Internet | 0 | 0.0% |
| Broadband Home | 1,318 | 58.2% |
| Cellular Data Only | 556 | 24.5% |
| Satellite Internet | 99 | 4.4% |
| No Internet | 300 | 13.2% |
| Total | 2,266 | 100.0% |
Ayden Summary
Ayden is a small town located in Pitt County, North Carolina. It is situated in the Coastal Plain region of the state, approximately 20 miles east of Greenville. The town was founded in 1891 and has a population of approximately 4,500 people.
Geography
Ayden is located in the Coastal Plain region of North Carolina, approximately 20 miles east of Greenville. The town is situated on the banks of the Tar River, which flows through the town and provides a source of recreation for the locals. The town is surrounded by farmland and is located near the Croatan National Forest. The town is also located near the Neuse River, which provides a source of water for the town.
The town has a humid subtropical climate, with hot, humid summers and mild winters. The average annual temperature is around 70 degrees Fahrenheit, with an average high of around 90 degrees in the summer and an average low of around 50 degrees in the winter. The town receives an average of around 50 inches of precipitation per year, with most of it falling in the summer months.
Economy
Ayden’s economy is largely based on agriculture and manufacturing. The town is home to several large farms, which produce a variety of crops, including corn, soybeans, cotton, and tobacco. The town is also home to several manufacturing companies, which produce a variety of products, including furniture, textiles, and electronics.
The town is also home to several small businesses, including restaurants, retail stores, and service providers. The town is also home to several educational institutions, including Ayden-Grifton High School, Ayden Elementary School, and Pitt Community College.
Demographics
As of the 2010 census, Ayden had a population of 4,541 people. The racial makeup of the town was 79.3% White, 16.2% African American, 0.3% Native American, 0.7% Asian, 0.1% Pacific Islander, and 3.4% from other races. The median household income was $30,945, and the median family income was $37,917.
The town is home to a variety of religious denominations, including Baptist, Methodist, Presbyterian, and Catholic. The town is also home to a variety of cultural events, including the Ayden Bluegrass Festival, the Ayden Watermelon Festival, and the Ayden Christmas Parade.
Conclusion
Ayden is a small town located in Pitt County, North Carolina. It is situated in the Coastal Plain region of the state, approximately 20 miles east of Greenville. The town was founded in 1891 and has a population of approximately 4,500 people. The town’s economy is largely based on agriculture and manufacturing, and the town is home to several small businesses, educational institutions, and cultural events. The town has a diverse population, with a variety of racial and religious backgrounds.
Common Questions
What is the Total Population of Ayden?
Total Population of Ayden is 5,002.
What is the Total Male Population of Ayden?
Total Male Population of Ayden is 2,356.
What is the Total Female Population of Ayden?
Total Female Population of Ayden is 2,646.
What is the Ratio of Males per 100 Females in Ayden?
There are 89.04 Males per 100 Females in Ayden.
What is the Ratio of Females per 100 Males in Ayden?
There are 112.31 Females per 100 Males in Ayden.
What is the Median Population Age in Ayden?
Median Population Age in Ayden is 44.7 Years.
What is the Average Family Size in Ayden
Average Family Size in Ayden is 3.0 People.
What is the Average Household Size in Ayden
Average Household Size in Ayden is 2.2 People.
What is Per Capita Income in Ayden?
Per Capita income in Ayden is $25,067.
What is the Median Family Income in Ayden?
Median Family Income in Ayden is $71,354.
What is the Median Household income in Ayden?
Median Household Income in Ayden is $53,000.
What is Income or Wage Gap in Ayden?
Income or Wage Gap in Ayden is 11.8%.
Women in Ayden earn 88.2 cents for every dollar earned by a man.
What is Inequality or Gini Index in Ayden?
Inequality or Gini Index in Ayden is 0.43.
How Large is the Labor Force in Ayden?
There are 1,970 People in the Labor Forcein in Ayden.
What is the Percentage of People in the Labor Force in Ayden?
51.2% of People are in the Labor Force in Ayden.
What is the Unemployment Rate in Ayden?
Unemployment Rate in Ayden is 1.8%.