West Glendive, MT
West Glendive Map
West Glendive Overview
1,912
TOTAL POPULATION
962
MALE POPULATION
950
FEMALE POPULATION
101.26
MALES / 100 FEMALES
98.75
FEMALES / 100 MALES
35.5
MEDIAN AGE
2.8
AVG FAMILY SIZE
2.3
AVG HOUSEHOLD SIZE
$36,567
PER CAPITA INCOME
$79,293
AVG FAMILY INCOME
$66,725
AVG HOUSEHOLD INCOME
29.0%
WAGE / INCOME GAP [ % ]
71.0¢/ $1
WAGE / INCOME GAP [ $ ]
$11,261
FAMILY INCOME DEFICIT
0.33
INEQUALITY / GINI INDEX
1,107
LABOR FORCE [ PEOPLE ]
71.3%
PERCENT IN LABOR FORCE
2.4%
UNEMPLOYMENT RATE
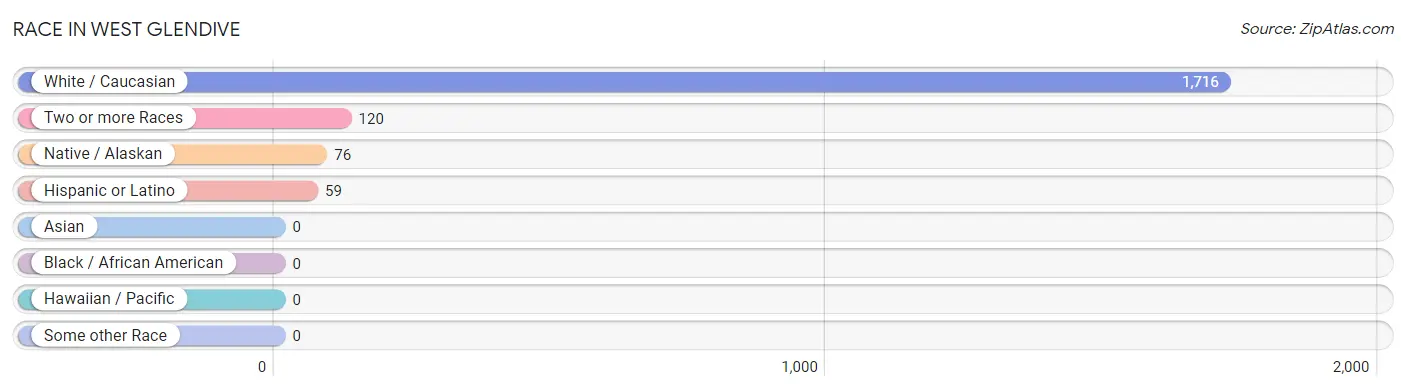
Race in West Glendive
The most populous races in West Glendive are White / Caucasian (1,716 | 89.7%), Two or more Races (120 | 6.3%), and Native / Alaskan (76 | 4.0%).
| Race | # Population | % Population |
| Asian | 0 | 0.0% |
| Black / African American | 0 | 0.0% |
| Hawaiian / Pacific | 0 | 0.0% |
| Hispanic or Latino | 59 | 3.1% |
| Native / Alaskan | 76 | 4.0% |
| White / Caucasian | 1,716 | 89.7% |
| Two or more Races | 120 | 6.3% |
| Some other Race | 0 | 0.0% |
| Total | 1,912 | 100.0% |
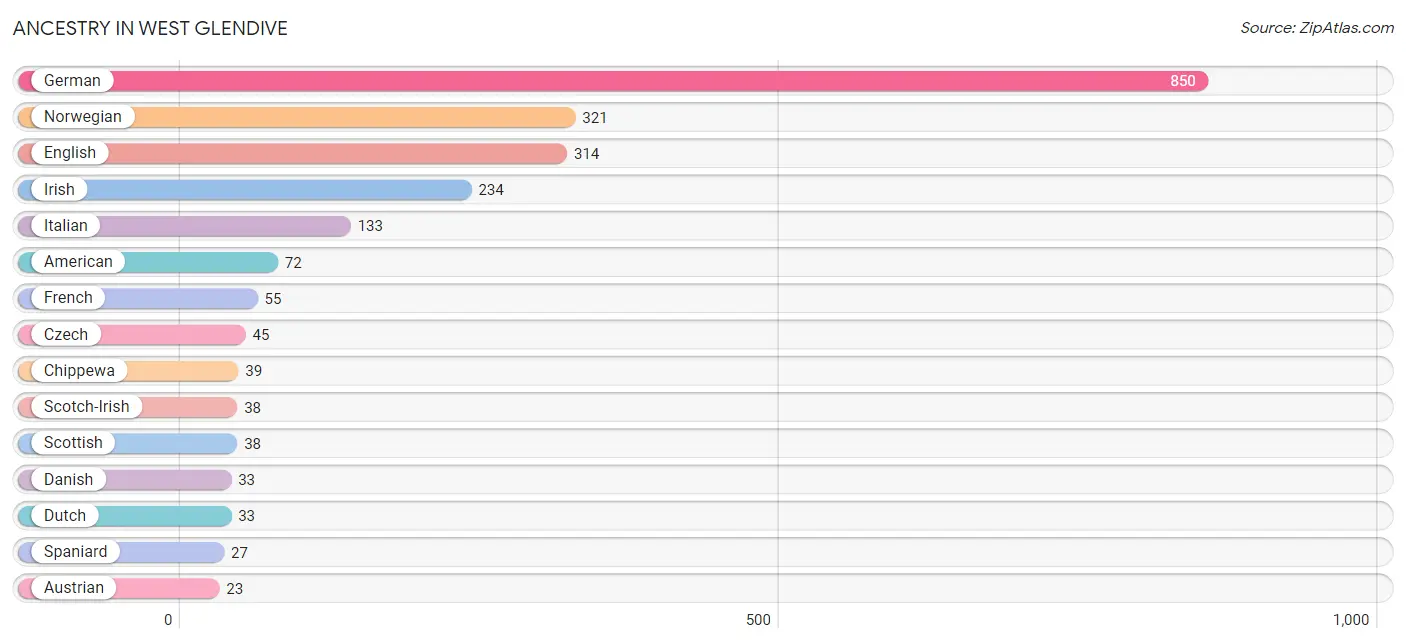
Ancestry in West Glendive
The most populous ancestries reported in West Glendive are German (850 | 44.5%), Norwegian (321 | 16.8%), English (314 | 16.4%), Irish (234 | 12.2%), and Italian (133 | 7.0%), together accounting for 96.9% of all West Glendive residents.
| Ancestry | # Population | % Population |
| American | 72 | 3.8% |
| Austrian | 23 | 1.2% |
| Bhutanese | 19 | 1.0% |
| British | 14 | 0.7% |
| Canadian | 15 | 0.8% |
| Chippewa | 39 | 2.0% |
| Czech | 45 | 2.4% |
| Danish | 33 | 1.7% |
| Dutch | 33 | 1.7% |
| English | 314 | 16.4% |
| French | 55 | 2.9% |
| German | 850 | 44.5% |
| Hungarian | 13 | 0.7% |
| Irish | 234 | 12.2% |
| Italian | 133 | 7.0% |
| Korean | 14 | 0.7% |
| Norwegian | 321 | 16.8% |
| Polish | 11 | 0.6% |
| Russian | 8 | 0.4% |
| Scandinavian | 10 | 0.5% |
| Scotch-Irish | 38 | 2.0% |
| Scottish | 38 | 2.0% |
| Spaniard | 27 | 1.4% |
| Swedish | 9 | 0.5% |
| Ukrainian | 13 | 0.7% |
| Welsh | 8 | 0.4% | View All 26 Rows |
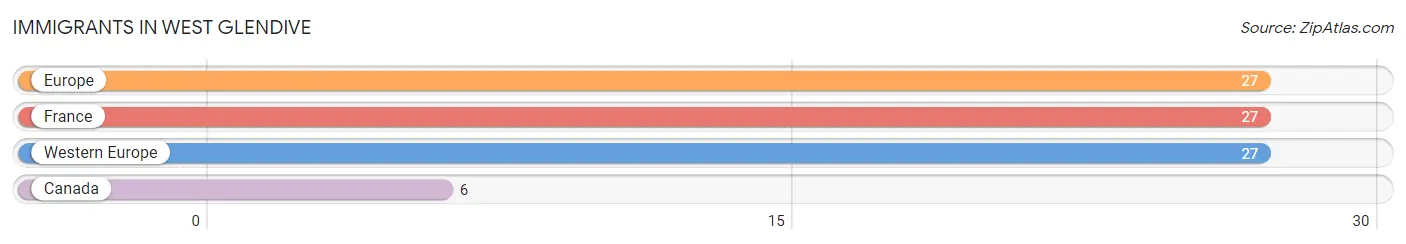
Immigrants in West Glendive
The most numerous immigrant groups reported in West Glendive came from Europe (27 | 1.4%), France (27 | 1.4%), Western Europe (27 | 1.4%), and Canada (6 | 0.3%), together accounting for 4.5% of all West Glendive residents.
| Immigration Origin | # Population | % Population |
| Canada | 6 | 0.3% |
| Europe | 27 | 1.4% |
| France | 27 | 1.4% |
| Western Europe | 27 | 1.4% | View All 4 Rows |
Sex and Age in West Glendive
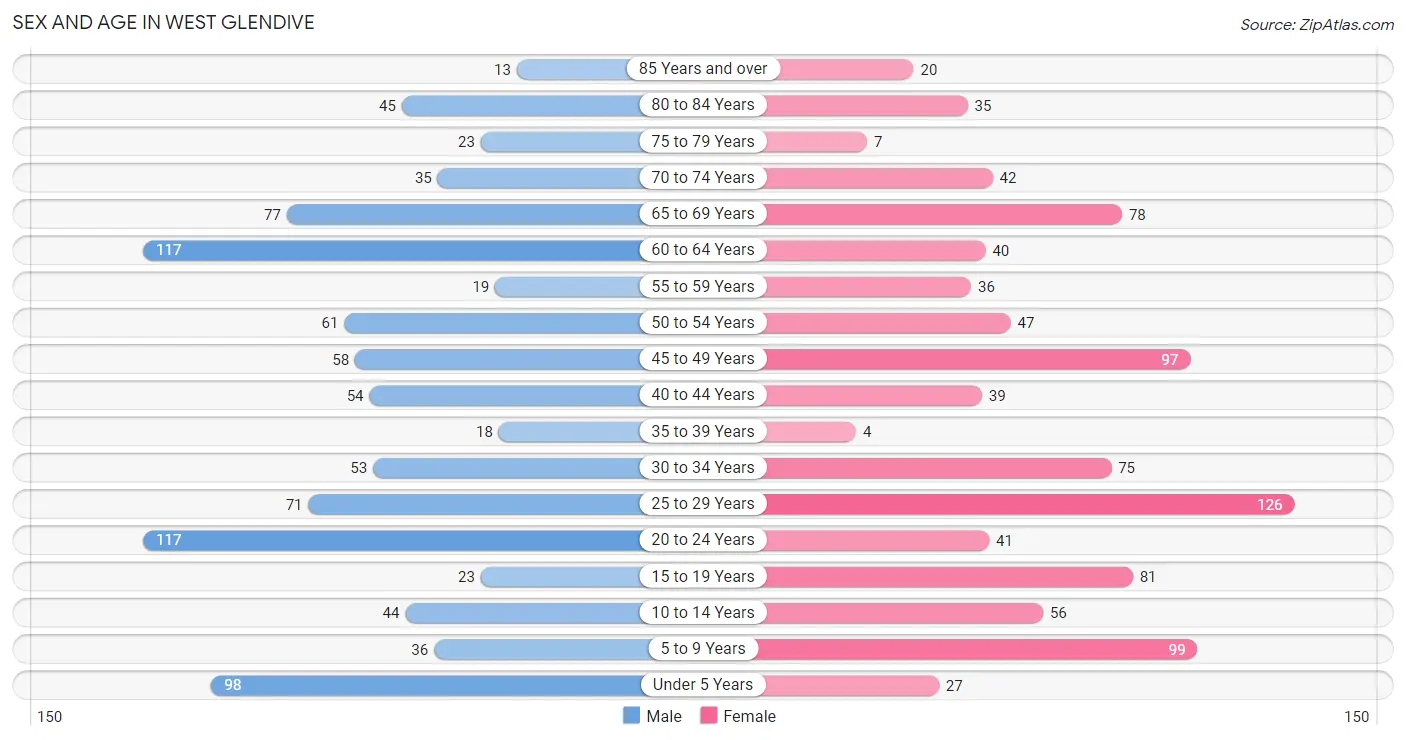
Sex and Age in West Glendive
The most populous age groups in West Glendive are 20 to 24 Years (117 | 12.2%) for men and 25 to 29 Years (126 | 13.3%) for women.
| Age Bracket | Male | Female |
| Under 5 Years | 98 (10.2%) | 27 (2.8%) |
| 5 to 9 Years | 36 (3.7%) | 99 (10.4%) |
| 10 to 14 Years | 44 (4.6%) | 56 (5.9%) |
| 15 to 19 Years | 23 (2.4%) | 81 (8.5%) |
| 20 to 24 Years | 117 (12.2%) | 41 (4.3%) |
| 25 to 29 Years | 71 (7.4%) | 126 (13.3%) |
| 30 to 34 Years | 53 (5.5%) | 75 (7.9%) |
| 35 to 39 Years | 18 (1.9%) | 4 (0.4%) |
| 40 to 44 Years | 54 (5.6%) | 39 (4.1%) |
| 45 to 49 Years | 58 (6.0%) | 97 (10.2%) |
| 50 to 54 Years | 61 (6.3%) | 47 (5.0%) |
| 55 to 59 Years | 19 (2.0%) | 36 (3.8%) |
| 60 to 64 Years | 117 (12.2%) | 40 (4.2%) |
| 65 to 69 Years | 77 (8.0%) | 78 (8.2%) |
| 70 to 74 Years | 35 (3.6%) | 42 (4.4%) |
| 75 to 79 Years | 23 (2.4%) | 7 (0.7%) |
| 80 to 84 Years | 45 (4.7%) | 35 (3.7%) |
| 85 Years and over | 13 (1.3%) | 20 (2.1%) |
| Total | 962 (100.0%) | 950 (100.0%) |
Families and Households in West Glendive
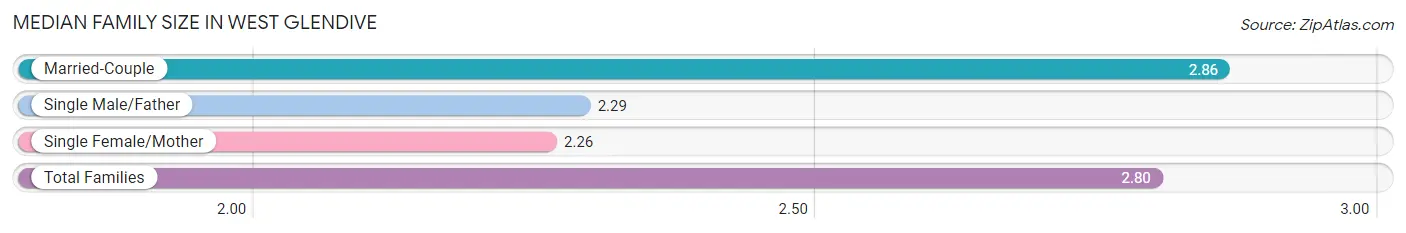
Median Family Size in West Glendive
The median family size in West Glendive is 2.80 persons per family, with married-couple families (521 | 90.9%) accounting for the largest median family size of 2.86 persons per family. On the other hand, single female/mother families (38 | 6.6%) represent the smallest median family size with 2.26 persons per family.
| Family Type | # Families | Family Size |
| Married-Couple | 521 (90.9%) | 2.86 |
| Single Male/Father | 14 (2.4%) | 2.29 |
| Single Female/Mother | 38 (6.6%) | 2.26 |
| Total Families | 573 (100.0%) | 2.80 |
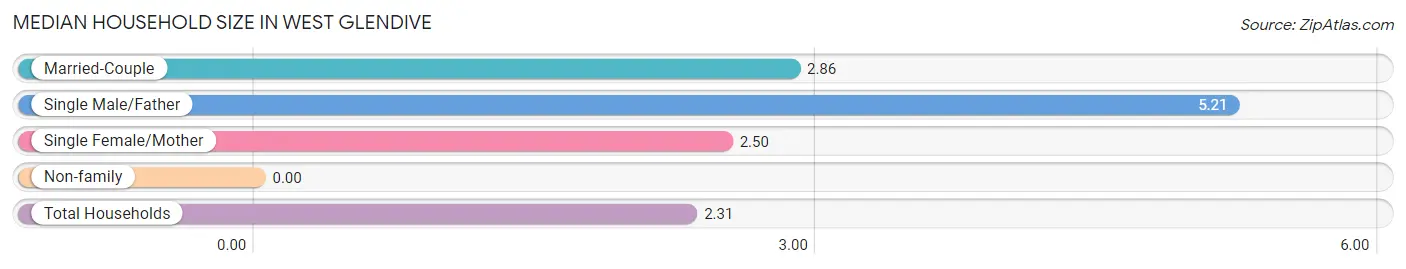
Median Household Size in West Glendive
| Household Type | # Households | Household Size |
| Married-Couple | 521 (62.9%) | 2.86 |
| Single Male/Father | 14 (1.7%) | 5.21 |
| Single Female/Mother | 38 (4.6%) | 2.50 |
| Non-family | 255 (30.8%) | - |
| Total Households | 828 (100.0%) | 2.31 |
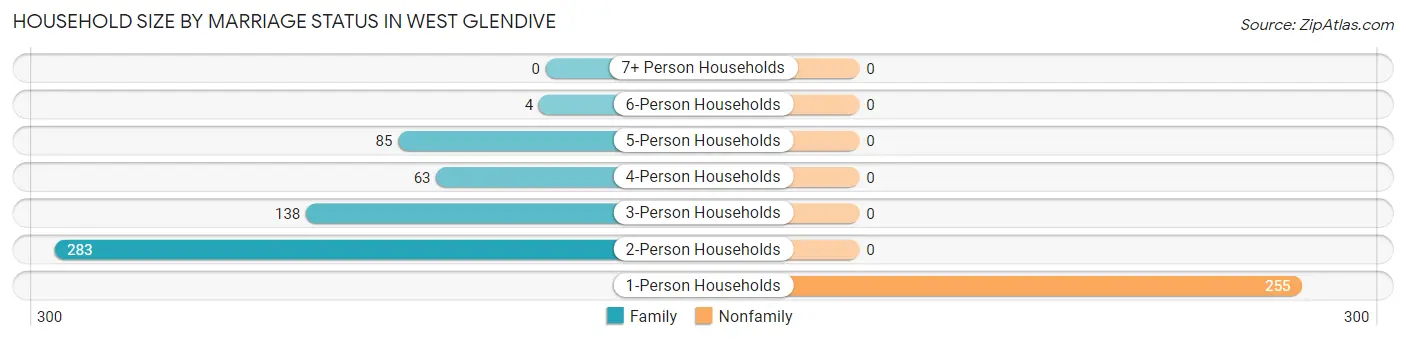
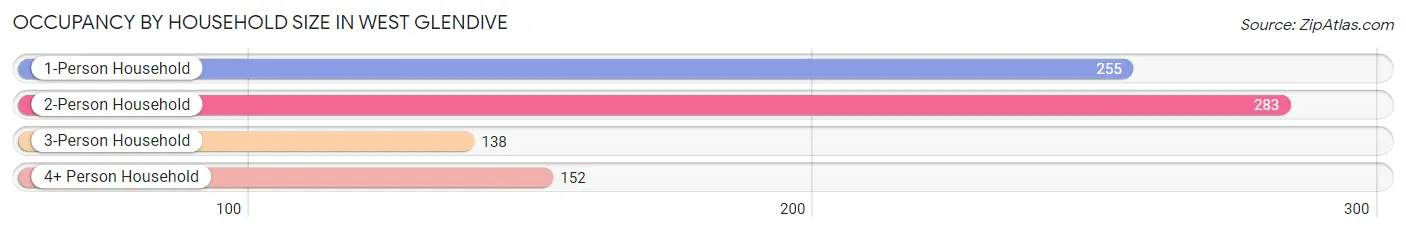
Household Size by Marriage Status in West Glendive
Out of a total of 828 households in West Glendive, 573 (69.2%) are family households, while 255 (30.8%) are nonfamily households. The most numerous type of family households are 2-person households, comprising 283, and the most common type of nonfamily households are 1-person households, comprising 255.
| Household Size | Family Households | Nonfamily Households |
| 1-Person Households | - | 255 (30.8%) |
| 2-Person Households | 283 (34.2%) | 0 (0.0%) |
| 3-Person Households | 138 (16.7%) | 0 (0.0%) |
| 4-Person Households | 63 (7.6%) | 0 (0.0%) |
| 5-Person Households | 85 (10.3%) | 0 (0.0%) |
| 6-Person Households | 4 (0.5%) | 0 (0.0%) |
| 7+ Person Households | 0 (0.0%) | 0 (0.0%) |
| Total | 573 (69.2%) | 255 (30.8%) |
Female Fertility in West Glendive
Fertility by Age in West Glendive
Average fertility rate in West Glendive is 80.0 births per 1,000 women. Women in the age bracket of 15 to 19 years have the highest fertility rate with 210.0 births per 1,000 women. Women in the age bracket of 20 to 34 years acount for 54.0% of all women with births.
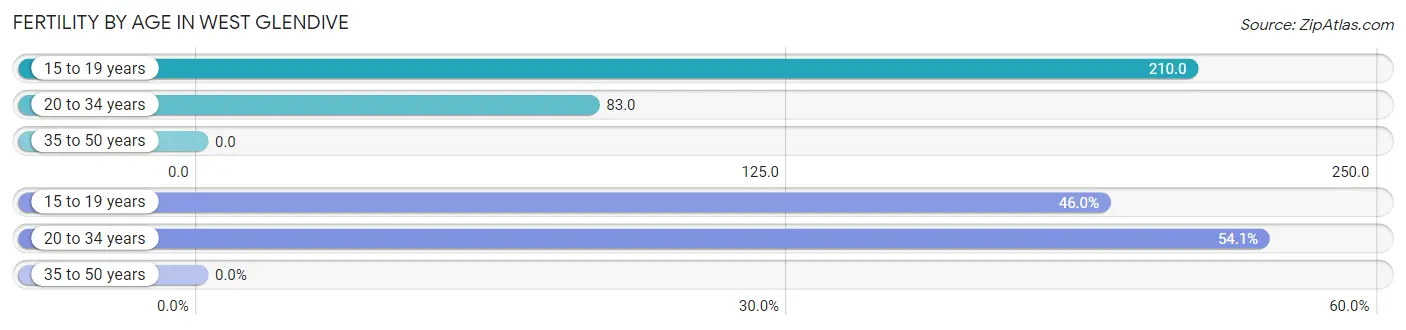
| Age Bracket | Women with Births | Births / 1,000 Women |
| 15 to 19 years | 17 (46.0%) | 210.0 |
| 20 to 34 years | 20 (54.0%) | 83.0 |
| 35 to 50 years | 0 (0.0%) | 0.0 |
| Total | 37 (100.0%) | 80.0 |
Fertility by Age by Marriage Status in West Glendive
83.8% of women with births (37) in West Glendive are married. The highest percentage of unmarried women with births falls into 20 to 34 years age bracket with 30.0% of them unmarried at the time of birth, while the lowest percentage of unmarried women with births belong to 15 to 19 years age bracket with 0.0% of them unmarried.
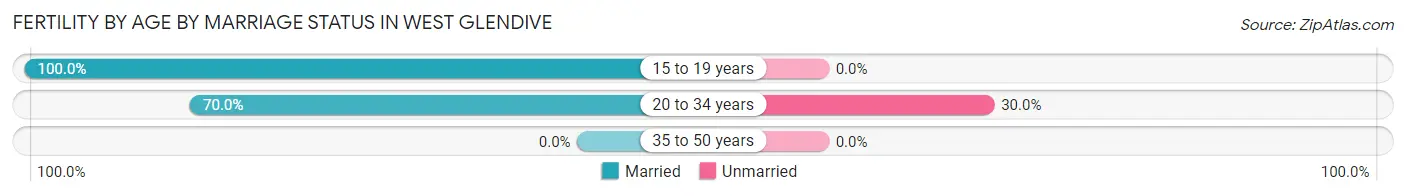
| Age Bracket | Married | Unmarried |
| 15 to 19 years | 17 (100.0%) | 0 (0.0%) |
| 20 to 34 years | 14 (70.0%) | 6 (30.0%) |
| 35 to 50 years | 0 (0.0%) | 0 (0.0%) |
| Total | 31 (83.8%) | 6 (16.2%) |
Fertility by Education in West Glendive
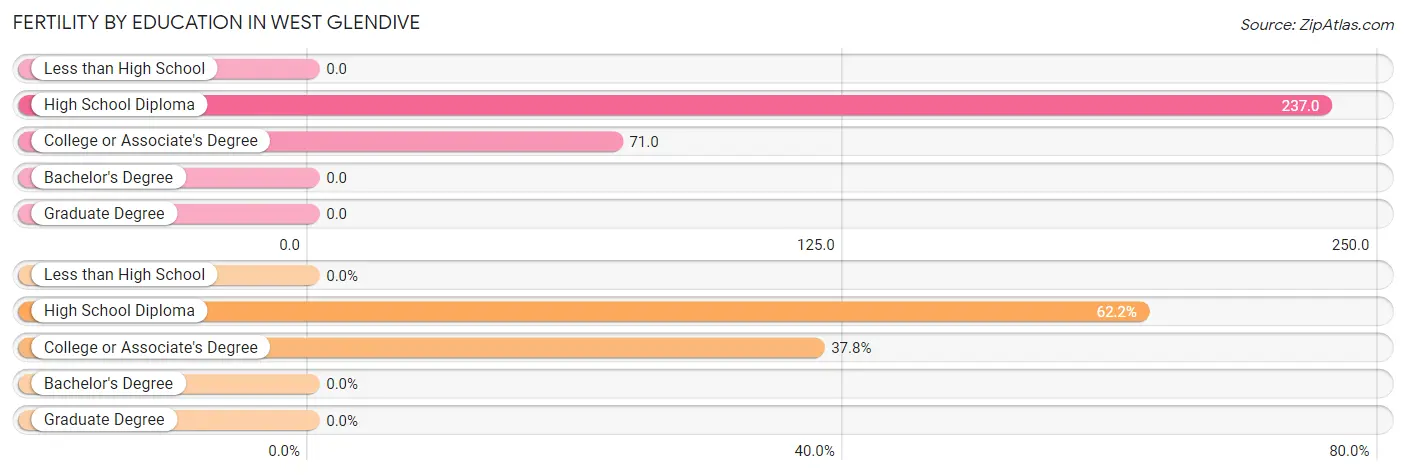
| Educational Attainment | Women with Births | Births / 1,000 Women |
| Less than High School | 0 (0.0%) | 0.0 |
| High School Diploma | 23 (62.2%) | 237.0 |
| College or Associate's Degree | 14 (37.8%) | 71.0 |
| Bachelor's Degree | 0 (0.0%) | 0.0 |
| Graduate Degree | 0 (0.0%) | 0.0 |
| Total | 37 (100.0%) | 80.0 |
Fertility by Education by Marriage Status in West Glendive
16.2% of women with births in West Glendive are unmarried. Women with the educational attainment of college or associate's degree are most likely to be married with 100.0% of them married at childbirth, while women with the educational attainment of high school diploma are least likely to be married with 26.1% of them unmarried at childbirth.
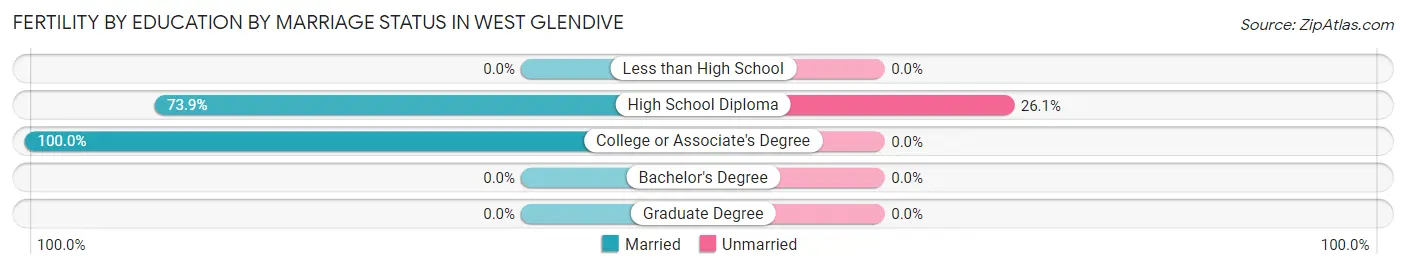
| Educational Attainment | Married | Unmarried |
| Less than High School | 0 (0.0%) | 0 (0.0%) |
| High School Diploma | 17 (73.9%) | 6 (26.1%) |
| College or Associate's Degree | 14 (100.0%) | 0 (0.0%) |
| Bachelor's Degree | 0 (0.0%) | 0 (0.0%) |
| Graduate Degree | 0 (0.0%) | 0 (0.0%) |
| Total | 31 (83.8%) | 6 (16.2%) |
Income in West Glendive
Income Overview in West Glendive
Per Capita Income in West Glendive is $36,567, while median incomes of families and households are $79,293 and $66,725 respectively.
| Characteristic | Number | Measure |
| Per Capita Income | 1,912 | $36,567 |
| Median Family Income | 573 | $79,293 |
| Mean Family Income | 573 | $91,557 |
| Median Household Income | 828 | $66,725 |
| Mean Household Income | 828 | $80,801 |
| Income Deficit | 573 | $11,261 |
| Wage / Income Gap (%) | 1,912 | 28.99% |
| Wage / Income Gap ($) | 1,912 | 71.01¢ per $1 |
| Gini / Inequality Index | 1,912 | 0.33 |
Earnings by Sex in West Glendive
Average Earnings in West Glendive are $39,688, $52,928 for men and $37,582 for women, a difference of 29.0%.
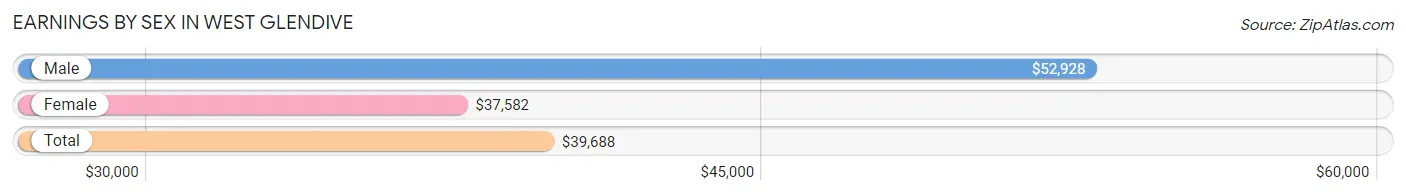
| Sex | Number | Average Earnings |
| Male | 655 (57.5%) | $52,928 |
| Female | 484 (42.5%) | $37,582 |
| Total | 1,139 (100.0%) | $39,688 |
Earnings by Sex by Income Bracket in West Glendive
The most common earnings brackets in West Glendive are $100,000+ for men (123 | 18.8%) and $35,000 to $39,999 for women (92 | 19.0%).
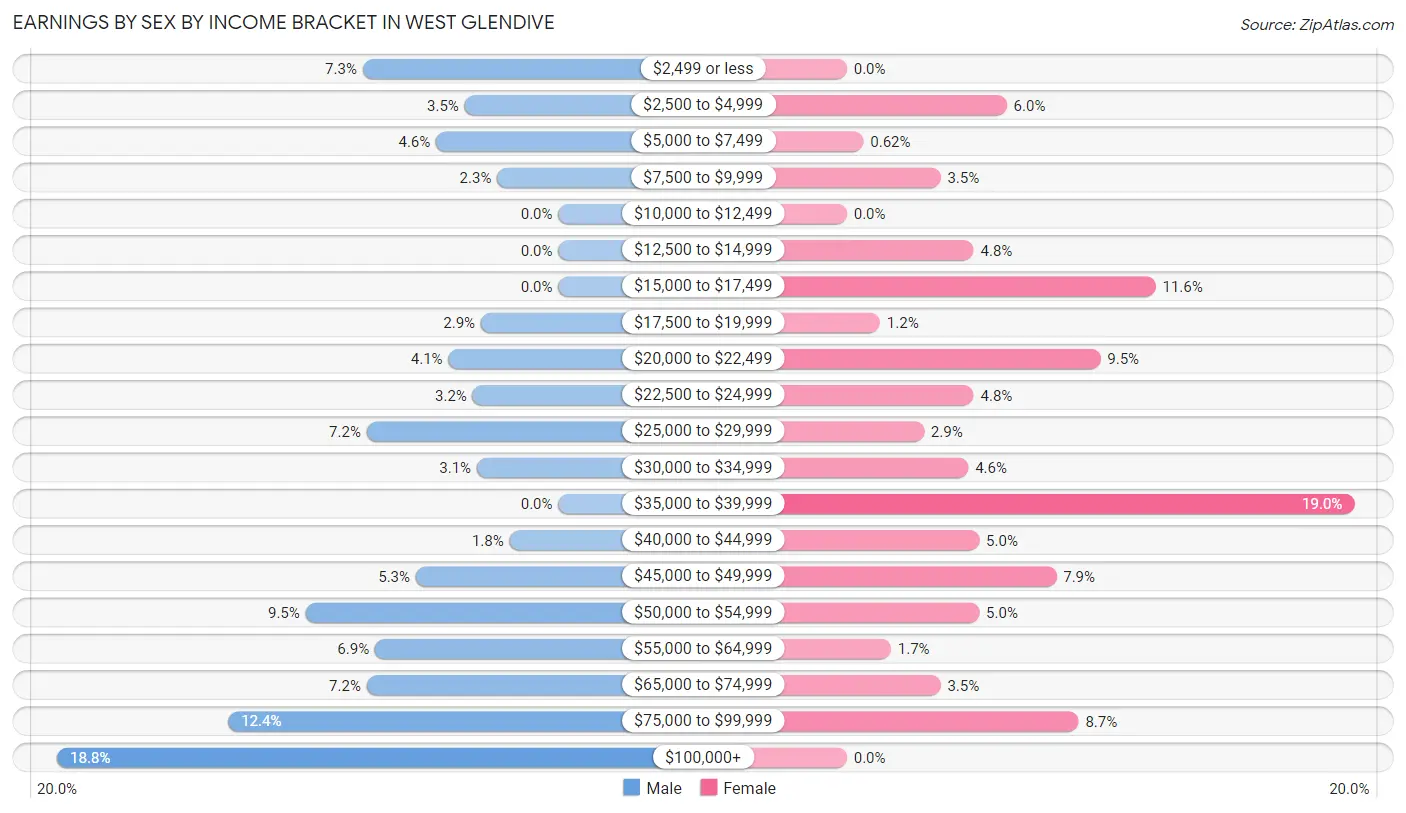
| Income | Male | Female |
| $2,499 or less | 48 (7.3%) | 0 (0.0%) |
| $2,500 to $4,999 | 23 (3.5%) | 29 (6.0%) |
| $5,000 to $7,499 | 30 (4.6%) | 3 (0.6%) |
| $7,500 to $9,999 | 15 (2.3%) | 17 (3.5%) |
| $10,000 to $12,499 | 0 (0.0%) | 0 (0.0%) |
| $12,500 to $14,999 | 0 (0.0%) | 23 (4.8%) |
| $15,000 to $17,499 | 0 (0.0%) | 56 (11.6%) |
| $17,500 to $19,999 | 19 (2.9%) | 6 (1.2%) |
| $20,000 to $22,499 | 27 (4.1%) | 46 (9.5%) |
| $22,500 to $24,999 | 21 (3.2%) | 23 (4.8%) |
| $25,000 to $29,999 | 47 (7.2%) | 14 (2.9%) |
| $30,000 to $34,999 | 20 (3.0%) | 22 (4.5%) |
| $35,000 to $39,999 | 0 (0.0%) | 92 (19.0%) |
| $40,000 to $44,999 | 12 (1.8%) | 24 (5.0%) |
| $45,000 to $49,999 | 35 (5.3%) | 38 (7.9%) |
| $50,000 to $54,999 | 62 (9.5%) | 24 (5.0%) |
| $55,000 to $64,999 | 45 (6.9%) | 8 (1.7%) |
| $65,000 to $74,999 | 47 (7.2%) | 17 (3.5%) |
| $75,000 to $99,999 | 81 (12.4%) | 42 (8.7%) |
| $100,000+ | 123 (18.8%) | 0 (0.0%) |
| Total | 655 (100.0%) | 484 (100.0%) |
Earnings by Sex by Educational Attainment in West Glendive
Average earnings in West Glendive are $63,839 for men and $38,370 for women, a difference of 39.9%. Men with an educational attainment of bachelor's degree enjoy the highest average annual earnings of $118,281, while those with high school diploma education earn the least with $41,250. Women with an educational attainment of graduate degree earn the most with the average annual earnings of $49,507, while those with high school diploma education have the smallest earnings of $30,682.
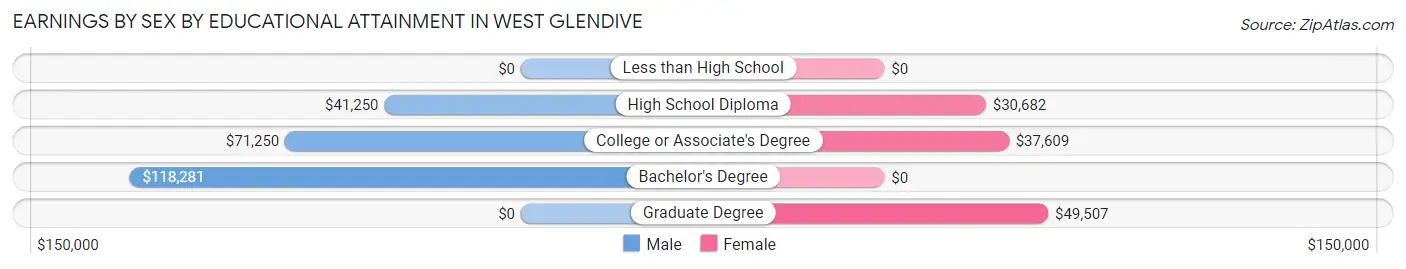
| Educational Attainment | Male Income | Female Income |
| Less than High School | - | - |
| High School Diploma | $41,250 | $30,682 |
| College or Associate's Degree | $71,250 | $37,609 |
| Bachelor's Degree | $118,281 | $0 |
| Graduate Degree | - | - |
| Total | $63,839 | $38,370 |
Family Income in West Glendive
Family Income Brackets in West Glendive
According to the West Glendive family income data, there are 153 families falling into the $50,000 to $74,999 income range, which is the most common income bracket and makes up 26.7% of all families.
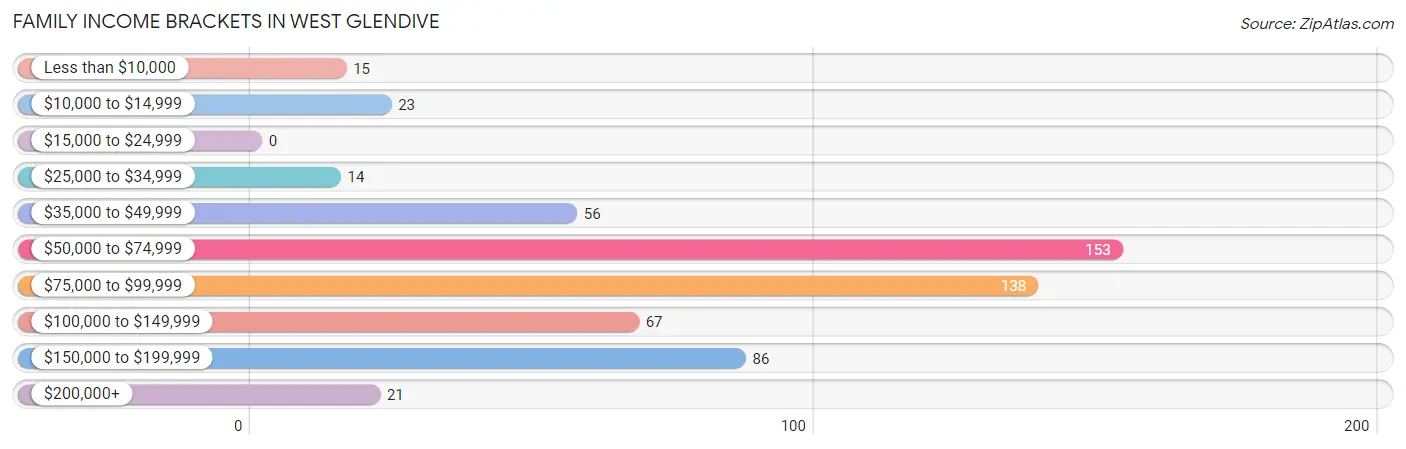
| Income Bracket | # Families | % Families |
| Less than $10,000 | 15 | 2.6% |
| $10,000 to $14,999 | 23 | 4.0% |
| $15,000 to $24,999 | 0 | 0.0% |
| $25,000 to $34,999 | 14 | 2.4% |
| $35,000 to $49,999 | 56 | 9.8% |
| $50,000 to $74,999 | 153 | 26.7% |
| $75,000 to $99,999 | 138 | 24.1% |
| $100,000 to $149,999 | 67 | 11.7% |
| $150,000 to $199,999 | 86 | 15.0% |
| $200,000+ | 21 | 3.7% |
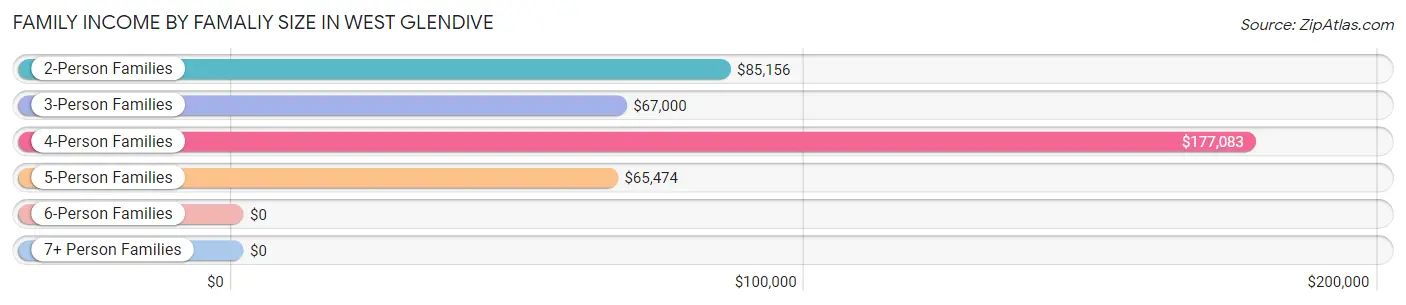
Family Income by Famaliy Size in West Glendive
4-person families (69 | 12.0%) account for the highest median family income in West Glendive with $177,083 per family, while 4-person families (69 | 12.0%) have the highest median income of $44,271 per family member.
| Income Bracket | # Families | Median Income |
| 2-Person Families | 297 (51.8%) | $85,156 |
| 3-Person Families | 124 (21.6%) | $67,000 |
| 4-Person Families | 69 (12.0%) | $177,083 |
| 5-Person Families | 79 (13.8%) | $65,474 |
| 6-Person Families | 4 (0.7%) | $0 |
| 7+ Person Families | 0 (0.0%) | $0 |
| Total | 573 (100.0%) | $79,293 |
Family Income by Number of Earners in West Glendive
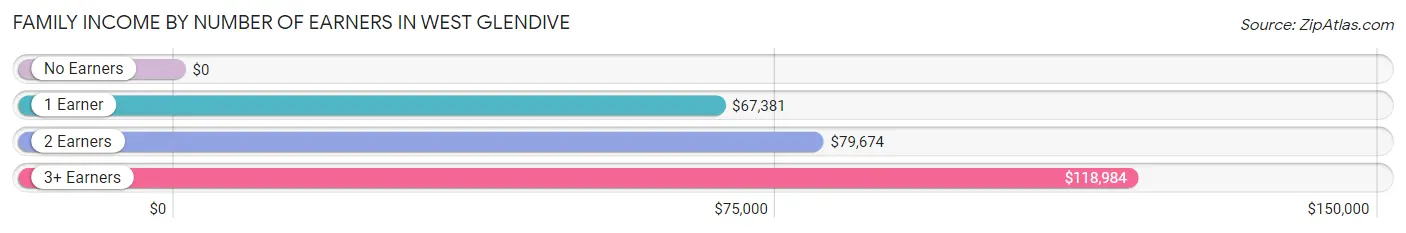
| Number of Earners | # Families | Median Income |
| No Earners | 44 (7.7%) | $0 |
| 1 Earner | 150 (26.2%) | $67,381 |
| 2 Earners | 336 (58.6%) | $79,674 |
| 3+ Earners | 43 (7.5%) | $118,984 |
| Total | 573 (100.0%) | $79,293 |
Household Income in West Glendive
Household Income Brackets in West Glendive
With 242 households falling in the category, the $50,000 to $74,999 income range is the most frequent in West Glendive, accounting for 29.2% of all households. In contrast, only 3 households (0.4%) fall into the $25,000 to $34,999 income bracket, making it the least populous group.
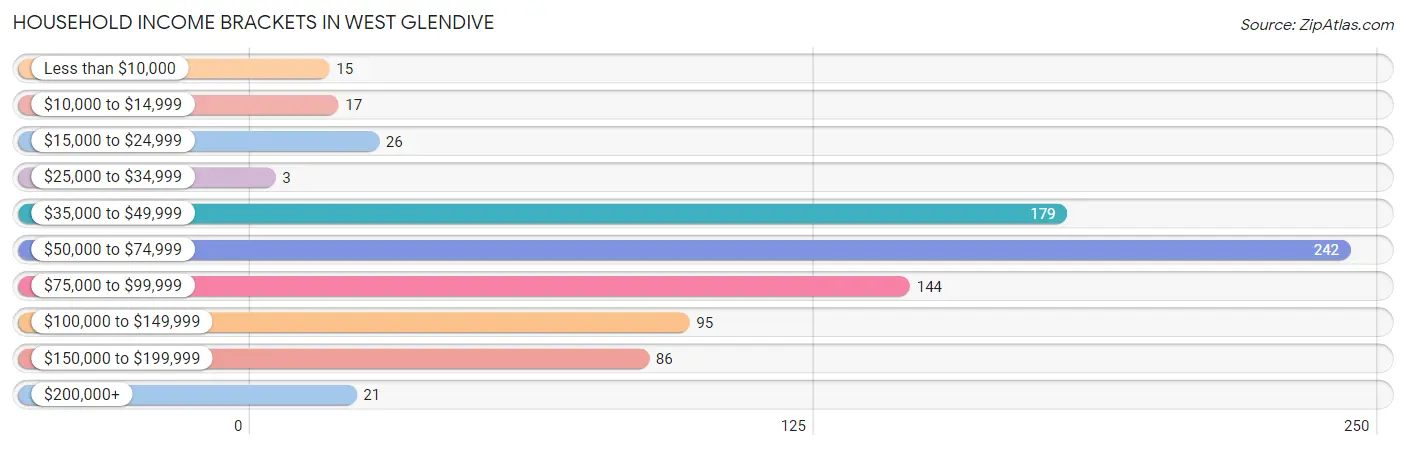
| Income Bracket | # Households | % Households |
| Less than $10,000 | 15 | 1.8% |
| $10,000 to $14,999 | 17 | 2.1% |
| $15,000 to $24,999 | 26 | 3.1% |
| $25,000 to $34,999 | 3 | 0.4% |
| $35,000 to $49,999 | 179 | 21.6% |
| $50,000 to $74,999 | 242 | 29.2% |
| $75,000 to $99,999 | 144 | 17.4% |
| $100,000 to $149,999 | 95 | 11.5% |
| $150,000 to $199,999 | 86 | 10.4% |
| $200,000+ | 21 | 2.5% |
Household Income by Householder Age in West Glendive
The median household income in West Glendive is $66,725, with the highest median household income of $77,989 found in the 25 to 44 years age bracket for the primary householder. A total of 287 households (34.7%) fall into this category. Meanwhile, the 65+ years age bracket for the primary householder has the lowest median household income of $44,917, with 226 households (27.3%) in this group.
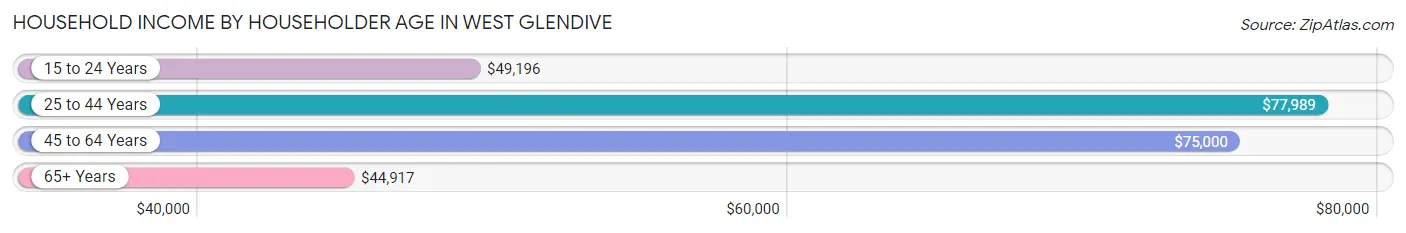
| Income Bracket | # Households | Median Income |
| 15 to 24 Years | 33 (4.0%) | $49,196 |
| 25 to 44 Years | 287 (34.7%) | $77,989 |
| 45 to 64 Years | 282 (34.1%) | $75,000 |
| 65+ Years | 226 (27.3%) | $44,917 |
| Total | 828 (100.0%) | $66,725 |
Poverty in West Glendive
Income Below Poverty by Sex and Age in West Glendive
With 4.6% poverty level for males and 5.4% for females among the residents of West Glendive, 5 year old males and 6 to 11 year old females are the most vulnerable to poverty, with 11 males (100.0%) and 13 females (13.7%) in their respective age groups living below the poverty level.
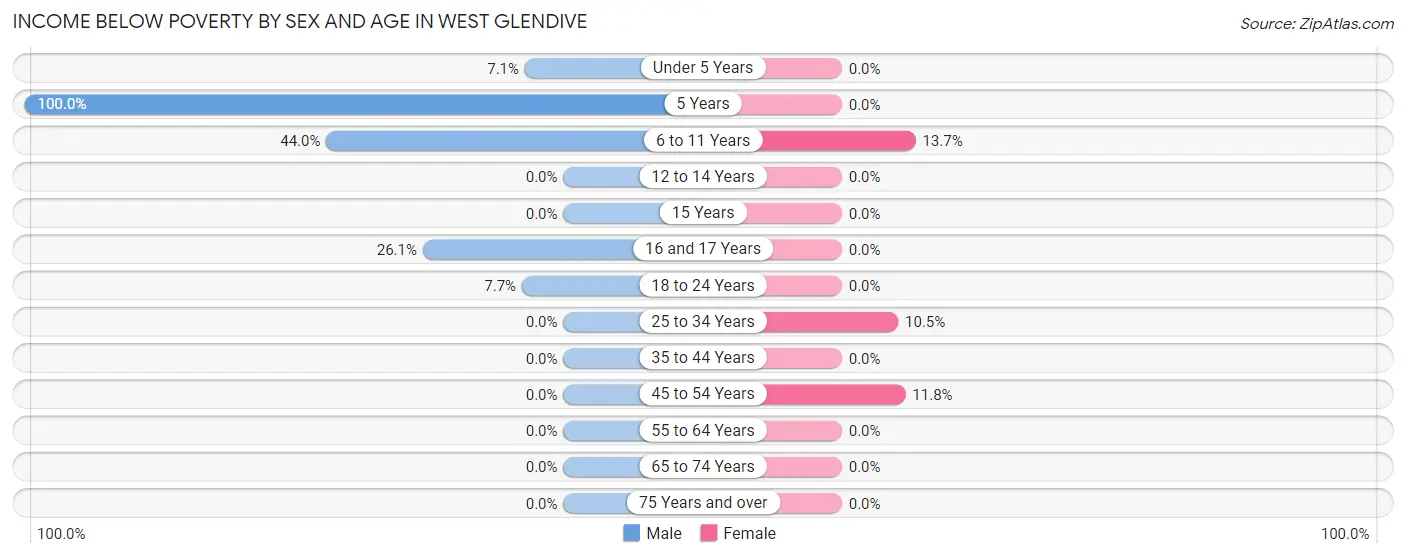
| Age Bracket | Male | Female |
| Under 5 Years | 7 (7.1%) | 0 (0.0%) |
| 5 Years | 11 (100.0%) | 0 (0.0%) |
| 6 to 11 Years | 11 (44.0%) | 13 (13.7%) |
| 12 to 14 Years | 0 (0.0%) | 0 (0.0%) |
| 15 Years | 0 (0.0%) | 0 (0.0%) |
| 16 and 17 Years | 6 (26.1%) | 0 (0.0%) |
| 18 to 24 Years | 9 (7.7%) | 0 (0.0%) |
| 25 to 34 Years | 0 (0.0%) | 21 (10.4%) |
| 35 to 44 Years | 0 (0.0%) | 0 (0.0%) |
| 45 to 54 Years | 0 (0.0%) | 17 (11.8%) |
| 55 to 64 Years | 0 (0.0%) | 0 (0.0%) |
| 65 to 74 Years | 0 (0.0%) | 0 (0.0%) |
| 75 Years and over | 0 (0.0%) | 0 (0.0%) |
| Total | 44 (4.6%) | 51 (5.4%) |
Income Above Poverty by Sex and Age in West Glendive
According to the poverty statistics in West Glendive, males aged 12 to 14 years and females aged under 5 years are the age groups that are most secure financially, with 100.0% of males and 100.0% of females in these age groups living above the poverty line.
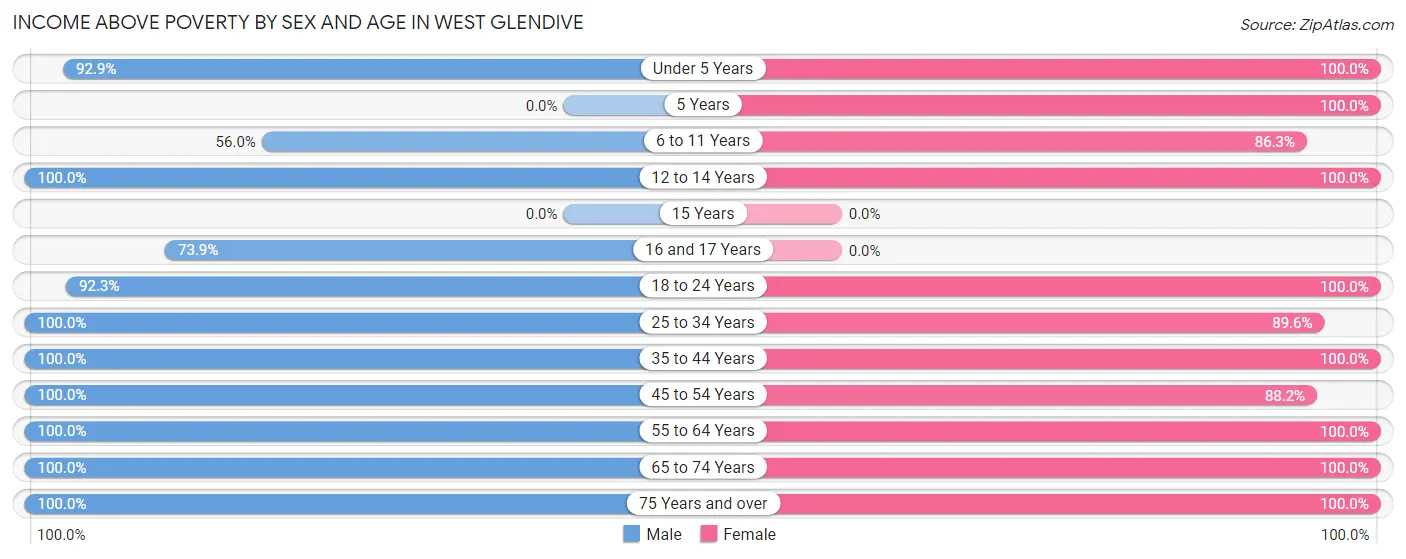
| Age Bracket | Male | Female |
| Under 5 Years | 91 (92.9%) | 27 (100.0%) |
| 5 Years | 0 (0.0%) | 24 (100.0%) |
| 6 to 11 Years | 14 (56.0%) | 82 (86.3%) |
| 12 to 14 Years | 44 (100.0%) | 36 (100.0%) |
| 15 Years | 0 (0.0%) | 0 (0.0%) |
| 16 and 17 Years | 17 (73.9%) | 0 (0.0%) |
| 18 to 24 Years | 108 (92.3%) | 122 (100.0%) |
| 25 to 34 Years | 124 (100.0%) | 180 (89.5%) |
| 35 to 44 Years | 72 (100.0%) | 43 (100.0%) |
| 45 to 54 Years | 119 (100.0%) | 127 (88.2%) |
| 55 to 64 Years | 136 (100.0%) | 76 (100.0%) |
| 65 to 74 Years | 112 (100.0%) | 120 (100.0%) |
| 75 Years and over | 81 (100.0%) | 62 (100.0%) |
| Total | 918 (95.4%) | 899 (94.6%) |
Income Below Poverty Among Married-Couple Families in West Glendive
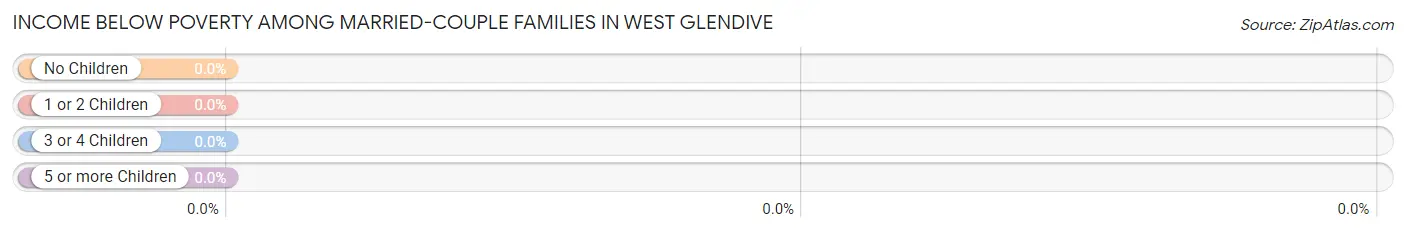
| Children | Above Poverty | Below Poverty |
| No Children | 276 (100.0%) | 0 (0.0%) |
| 1 or 2 Children | 182 (100.0%) | 0 (0.0%) |
| 3 or 4 Children | 63 (100.0%) | 0 (0.0%) |
| 5 or more Children | 0 (0.0%) | 0 (0.0%) |
| Total | 521 (100.0%) | 0 (0.0%) |
Income Below Poverty Among Single-Parent Households in West Glendive
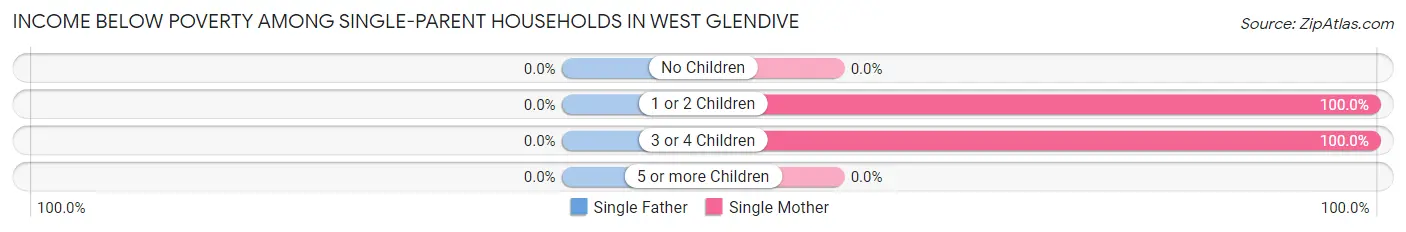
| Children | Single Father | Single Mother |
| No Children | 0 (0.0%) | 0 (0.0%) |
| 1 or 2 Children | 0 (0.0%) | 32 (100.0%) |
| 3 or 4 Children | 0 (0.0%) | 6 (100.0%) |
| 5 or more Children | 0 (0.0%) | 0 (0.0%) |
| Total | 0 (0.0%) | 38 (100.0%) |
Income Below Poverty Among Married-Couple vs Single-Parent Households in West Glendive
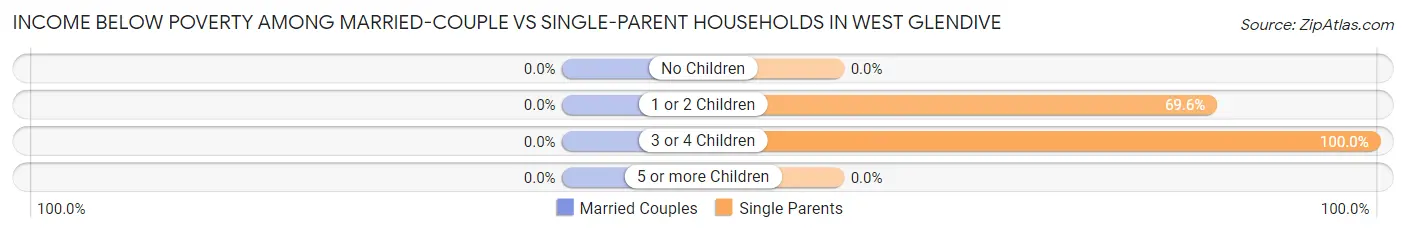
| Children | Married-Couple Families | Single-Parent Households |
| No Children | 0 (0.0%) | 0 (0.0%) |
| 1 or 2 Children | 0 (0.0%) | 32 (69.6%) |
| 3 or 4 Children | 0 (0.0%) | 6 (100.0%) |
| 5 or more Children | 0 (0.0%) | 0 (0.0%) |
| Total | 0 (0.0%) | 38 (73.1%) |
Employment Characteristics in West Glendive
Employment by Class of Employer in West Glendive
Among the 1,052 employed individuals in West Glendive, private company employees (569 | 54.1%), local government employees (137 | 13.0%), and not-for-profit organizations (114 | 10.8%) make up the most common classes of employment.
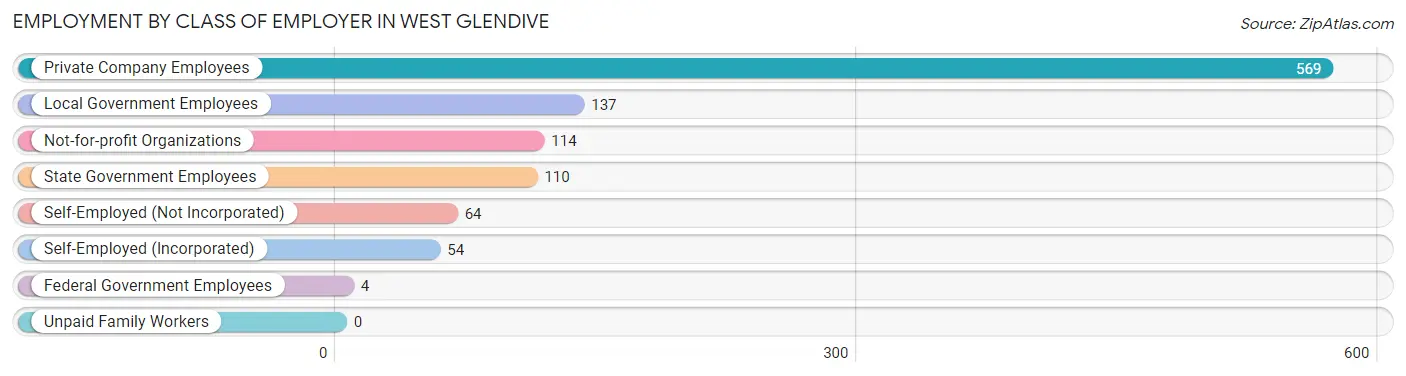
| Employer Class | # Employees | % Employees |
| Private Company Employees | 569 | 54.1% |
| Self-Employed (Incorporated) | 54 | 5.1% |
| Self-Employed (Not Incorporated) | 64 | 6.1% |
| Not-for-profit Organizations | 114 | 10.8% |
| Local Government Employees | 137 | 13.0% |
| State Government Employees | 110 | 10.5% |
| Federal Government Employees | 4 | 0.4% |
| Unpaid Family Workers | 0 | 0.0% |
| Total | 1,052 | 100.0% |
Employment Status by Age in West Glendive
According to the labor force statistics for West Glendive, out of the total population over 16 years of age (1,552), 71.3% or 1,107 individuals are in the labor force, with 2.4% or 27 of them unemployed. The age group with the highest labor force participation rate is 20 to 24 years, with 100.0% or 158 individuals in the labor force. Within the labor force, the 16 to 19 years age range has the highest percentage of unemployed individuals, with 26.1% or 6 of them being unemployed.
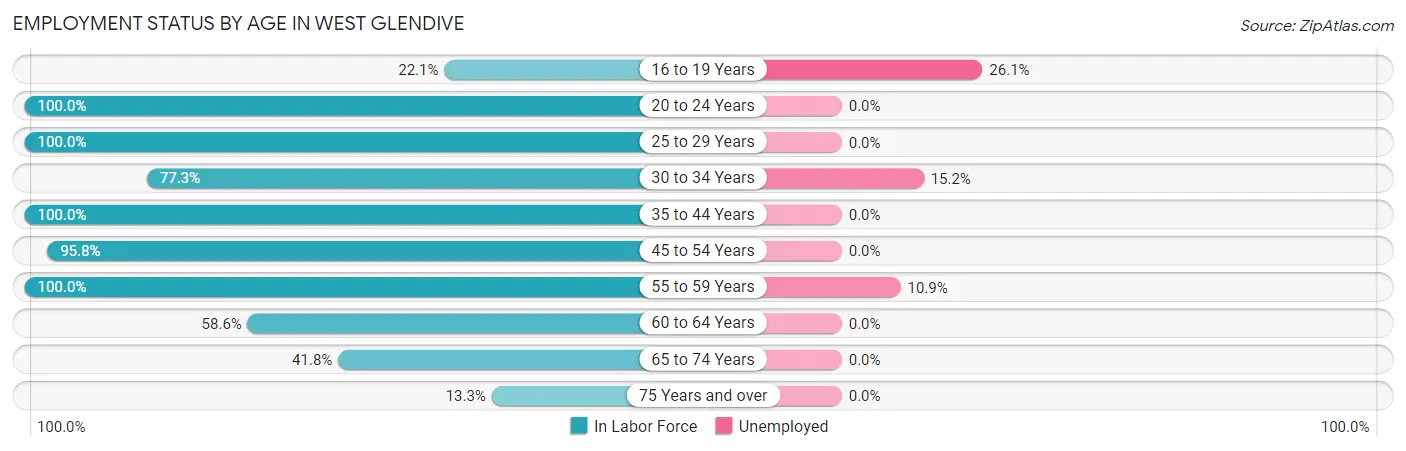
| Age Bracket | In Labor Force | Unemployed |
| 16 to 19 Years | 23 (22.1%) | 6 (26.1%) |
| 20 to 24 Years | 158 (100.0%) | 0 (0.0%) |
| 25 to 29 Years | 197 (100.0%) | 0 (0.0%) |
| 30 to 34 Years | 99 (77.3%) | 15 (15.2%) |
| 35 to 44 Years | 115 (100.0%) | 0 (0.0%) |
| 45 to 54 Years | 252 (95.8%) | 0 (0.0%) |
| 55 to 59 Years | 55 (100.0%) | 6 (10.9%) |
| 60 to 64 Years | 92 (58.6%) | 0 (0.0%) |
| 65 to 74 Years | 97 (41.8%) | 0 (0.0%) |
| 75 Years and over | 19 (13.3%) | 0 (0.0%) |
| Total | 1,107 (71.3%) | 27 (2.4%) |
Employment Status by Educational Attainment in West Glendive
According to labor force statistics for West Glendive, 88.5% of individuals (810) out of the total population between 25 and 64 years of age (915) are in the labor force, with 2.6% or 21 of them being unemployed. The group with the highest labor force participation rate are those with the educational attainment of college / associate degree, with 96.0% or 455 individuals in the labor force. Within the labor force, individuals with high school diploma education have the highest percentage of unemployment, with 8.0% or 15 of them being unemployed.
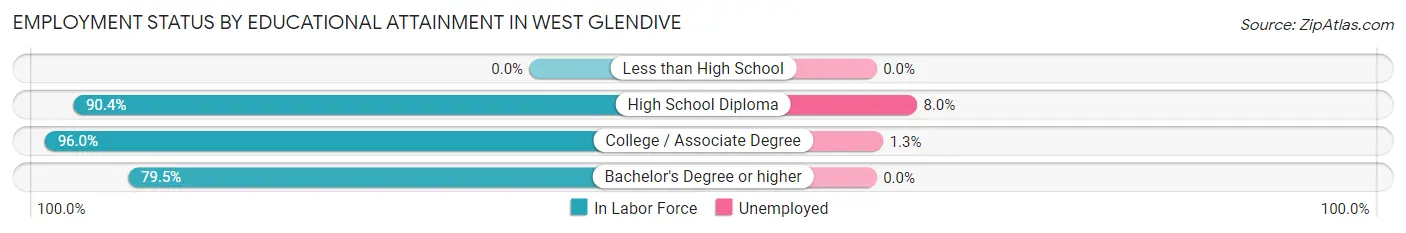
| Educational Attainment | In Labor Force | Unemployed |
| Less than High School | 0 (0.0%) | 0 (0.0%) |
| High School Diploma | 188 (90.4%) | 17 (8.0%) |
| College / Associate Degree | 455 (96.0%) | 6 (1.3%) |
| Bachelor's Degree or higher | 167 (79.5%) | 0 (0.0%) |
| Total | 810 (88.5%) | 24 (2.6%) |
Employment Occupations by Sex in West Glendive
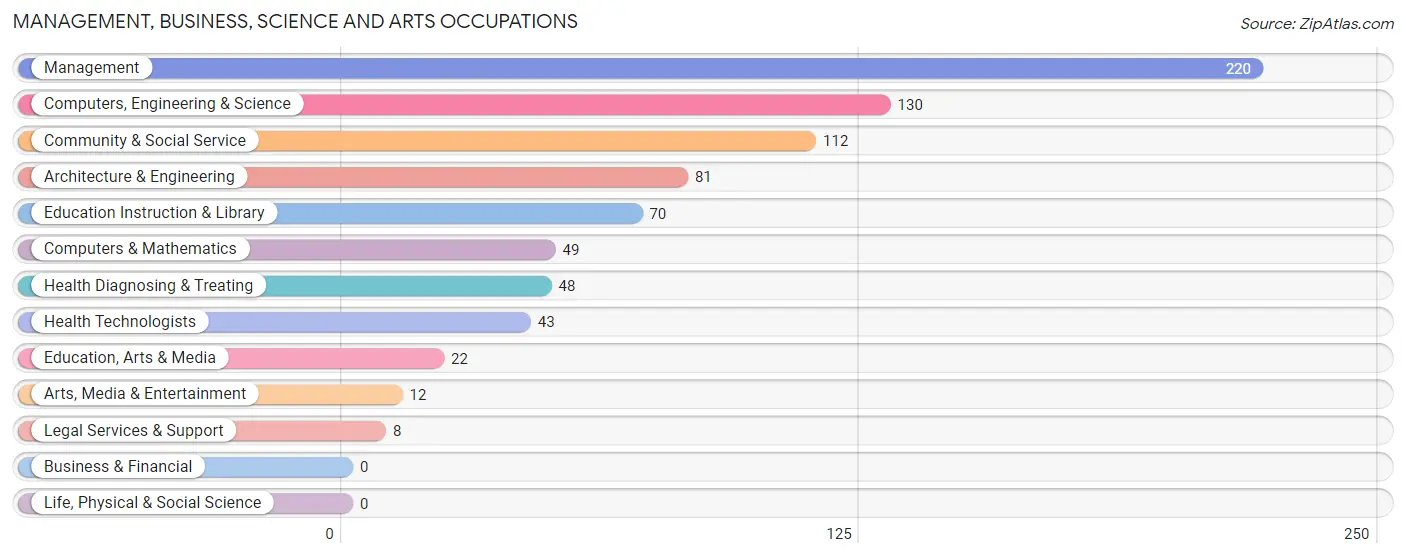
Management, Business, Science and Arts Occupations
The most common Management, Business, Science and Arts occupations in West Glendive are Management (220 | 20.4%), Computers, Engineering & Science (130 | 12.0%), Community & Social Service (112 | 10.4%), Architecture & Engineering (81 | 7.5%), and Education Instruction & Library (70 | 6.5%).
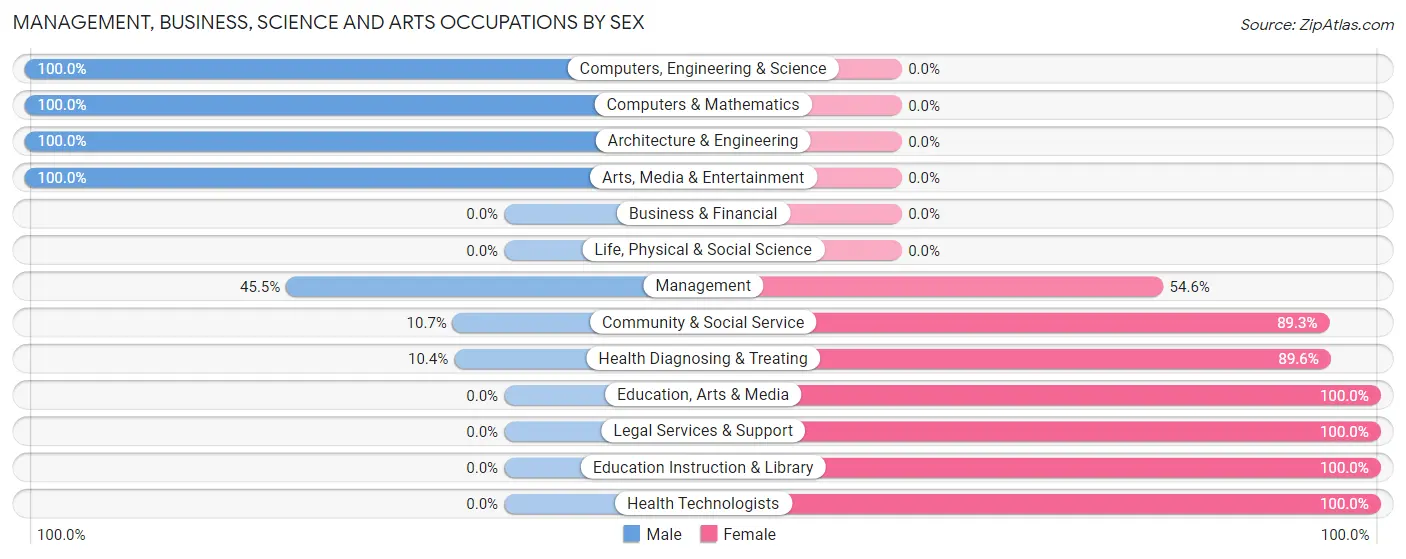
Management, Business, Science and Arts Occupations by Sex
Within the Management, Business, Science and Arts occupations in West Glendive, the most male-oriented occupations are Computers, Engineering & Science (100.0%), Computers & Mathematics (100.0%), and Architecture & Engineering (100.0%), while the most female-oriented occupations are Education, Arts & Media (100.0%), Legal Services & Support (100.0%), and Education Instruction & Library (100.0%).
| Occupation | Male | Female |
| Management | 100 (45.5%) | 120 (54.5%) |
| Business & Financial | 0 (0.0%) | 0 (0.0%) |
| Computers, Engineering & Science | 130 (100.0%) | 0 (0.0%) |
| Computers & Mathematics | 49 (100.0%) | 0 (0.0%) |
| Architecture & Engineering | 81 (100.0%) | 0 (0.0%) |
| Life, Physical & Social Science | 0 (0.0%) | 0 (0.0%) |
| Community & Social Service | 12 (10.7%) | 100 (89.3%) |
| Education, Arts & Media | 0 (0.0%) | 22 (100.0%) |
| Legal Services & Support | 0 (0.0%) | 8 (100.0%) |
| Education Instruction & Library | 0 (0.0%) | 70 (100.0%) |
| Arts, Media & Entertainment | 12 (100.0%) | 0 (0.0%) |
| Health Diagnosing & Treating | 5 (10.4%) | 43 (89.6%) |
| Health Technologists | 0 (0.0%) | 43 (100.0%) |
| Total (Category) | 247 (48.4%) | 263 (51.6%) |
| Total (Overall) | 596 (55.2%) | 484 (44.8%) |
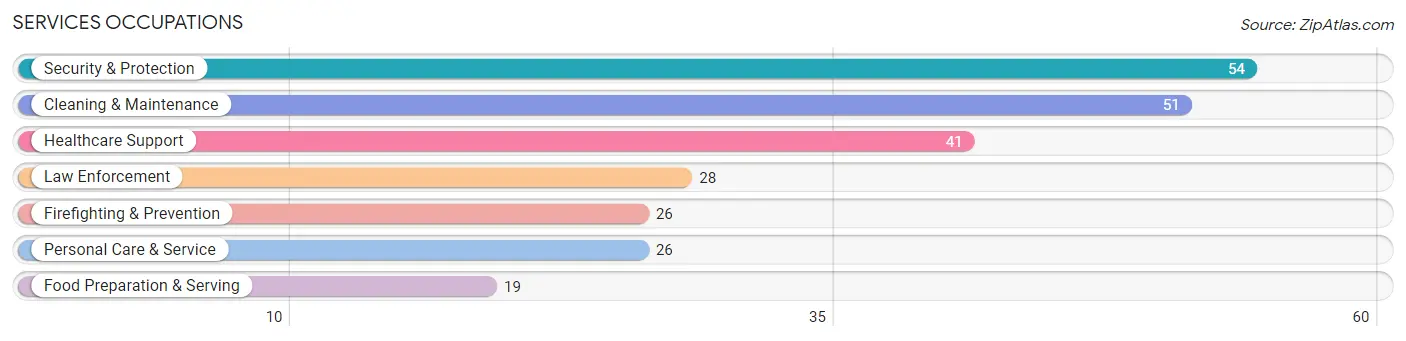
Services Occupations
The most common Services occupations in West Glendive are Security & Protection (54 | 5.0%), Cleaning & Maintenance (51 | 4.7%), Healthcare Support (41 | 3.8%), Law Enforcement (28 | 2.6%), and Firefighting & Prevention (26 | 2.4%).
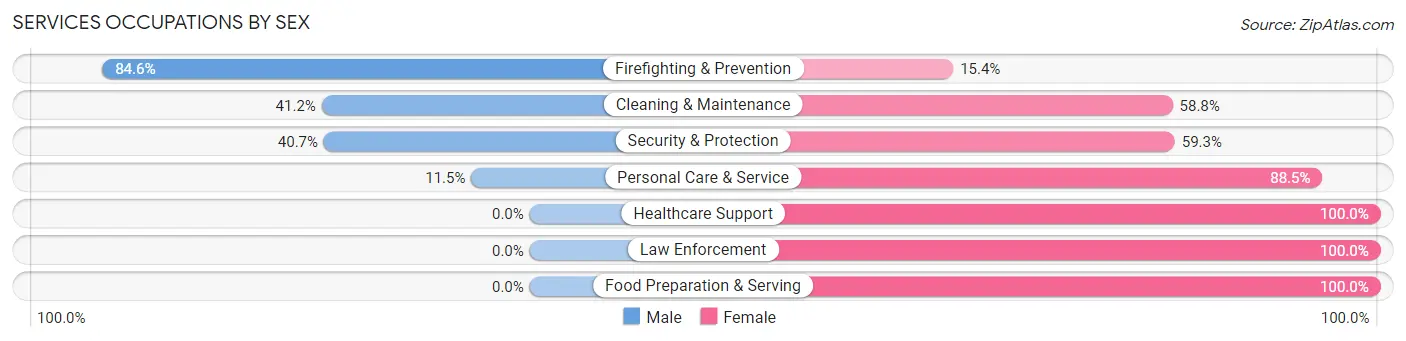
Services Occupations by Sex
Within the Services occupations in West Glendive, the most male-oriented occupations are Firefighting & Prevention (84.6%), Cleaning & Maintenance (41.2%), and Security & Protection (40.7%), while the most female-oriented occupations are Healthcare Support (100.0%), Law Enforcement (100.0%), and Food Preparation & Serving (100.0%).
| Occupation | Male | Female |
| Healthcare Support | 0 (0.0%) | 41 (100.0%) |
| Security & Protection | 22 (40.7%) | 32 (59.3%) |
| Firefighting & Prevention | 22 (84.6%) | 4 (15.4%) |
| Law Enforcement | 0 (0.0%) | 28 (100.0%) |
| Food Preparation & Serving | 0 (0.0%) | 19 (100.0%) |
| Cleaning & Maintenance | 21 (41.2%) | 30 (58.8%) |
| Personal Care & Service | 3 (11.5%) | 23 (88.5%) |
| Total (Category) | 46 (24.1%) | 145 (75.9%) |
| Total (Overall) | 596 (55.2%) | 484 (44.8%) |
Sales and Office Occupations
The most common Sales and Office occupations in West Glendive are Sales & Related (87 | 8.1%), and Office & Administration (72 | 6.7%).
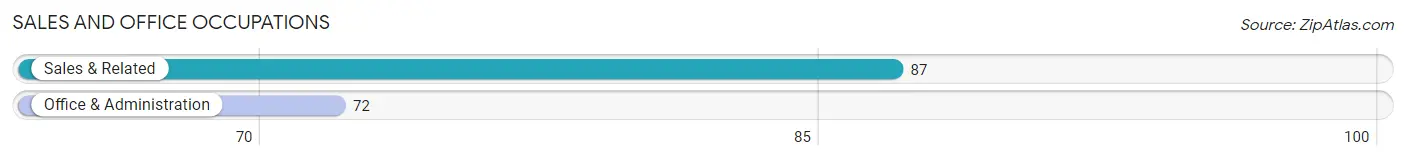
Sales and Office Occupations by Sex
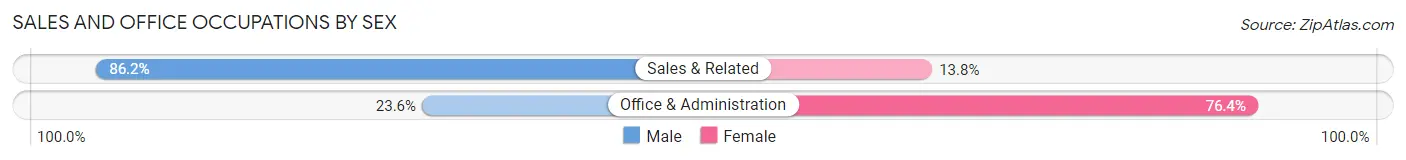
| Occupation | Male | Female |
| Sales & Related | 75 (86.2%) | 12 (13.8%) |
| Office & Administration | 17 (23.6%) | 55 (76.4%) |
| Total (Category) | 92 (57.9%) | 67 (42.1%) |
| Total (Overall) | 596 (55.2%) | 484 (44.8%) |
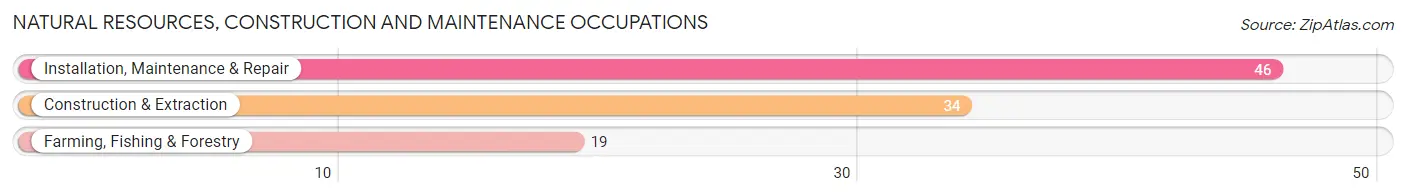
Natural Resources, Construction and Maintenance Occupations
The most common Natural Resources, Construction and Maintenance occupations in West Glendive are Installation, Maintenance & Repair (46 | 4.3%), Construction & Extraction (34 | 3.2%), and Farming, Fishing & Forestry (19 | 1.8%).
Natural Resources, Construction and Maintenance Occupations by Sex
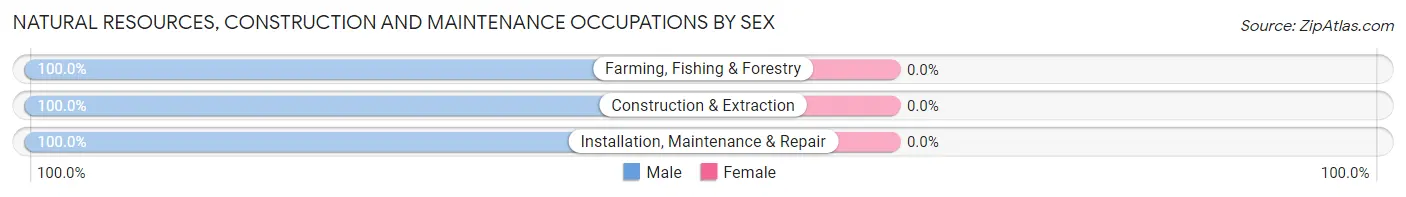
| Occupation | Male | Female |
| Farming, Fishing & Forestry | 19 (100.0%) | 0 (0.0%) |
| Construction & Extraction | 34 (100.0%) | 0 (0.0%) |
| Installation, Maintenance & Repair | 46 (100.0%) | 0 (0.0%) |
| Total (Category) | 99 (100.0%) | 0 (0.0%) |
| Total (Overall) | 596 (55.2%) | 484 (44.8%) |
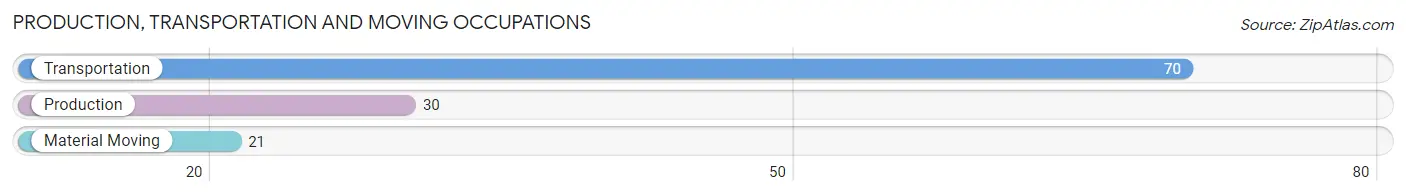
Production, Transportation and Moving Occupations
The most common Production, Transportation and Moving occupations in West Glendive are Transportation (70 | 6.5%), Production (30 | 2.8%), and Material Moving (21 | 1.9%).
Production, Transportation and Moving Occupations by Sex
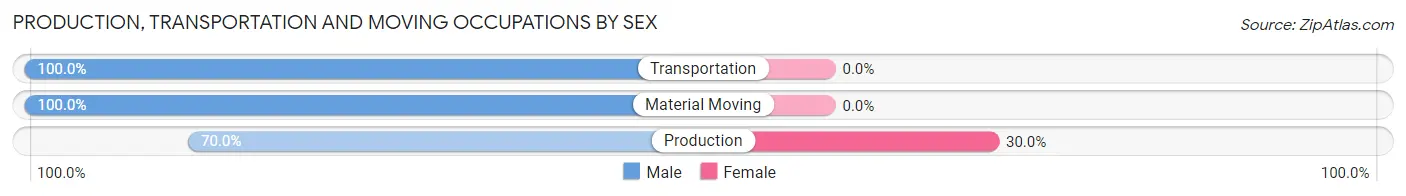
| Occupation | Male | Female |
| Production | 21 (70.0%) | 9 (30.0%) |
| Transportation | 70 (100.0%) | 0 (0.0%) |
| Material Moving | 21 (100.0%) | 0 (0.0%) |
| Total (Category) | 112 (92.6%) | 9 (7.4%) |
| Total (Overall) | 596 (55.2%) | 484 (44.8%) |
Employment Industries by Sex in West Glendive
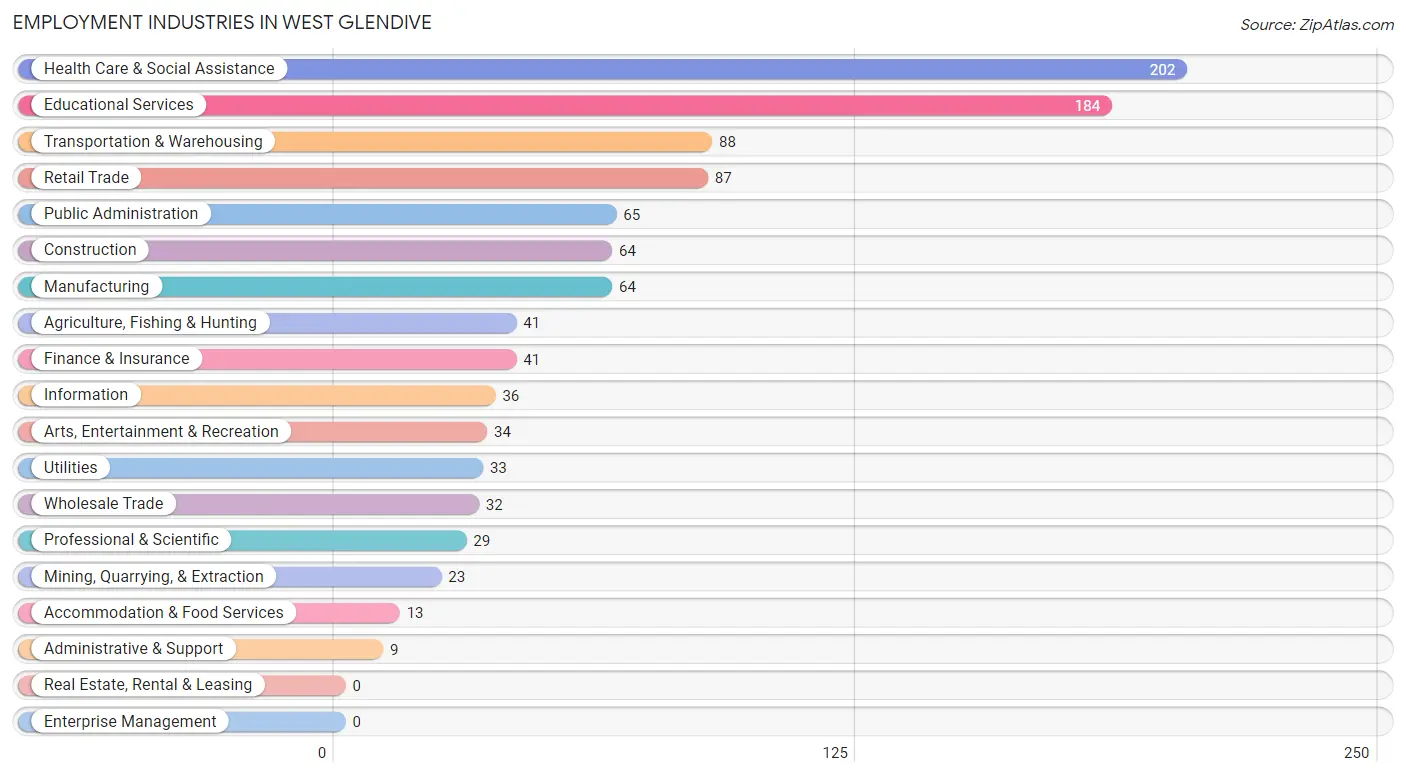
Employment Industries in West Glendive
The major employment industries in West Glendive include Health Care & Social Assistance (202 | 18.7%), Educational Services (184 | 17.0%), Transportation & Warehousing (88 | 8.2%), Retail Trade (87 | 8.1%), and Public Administration (65 | 6.0%).
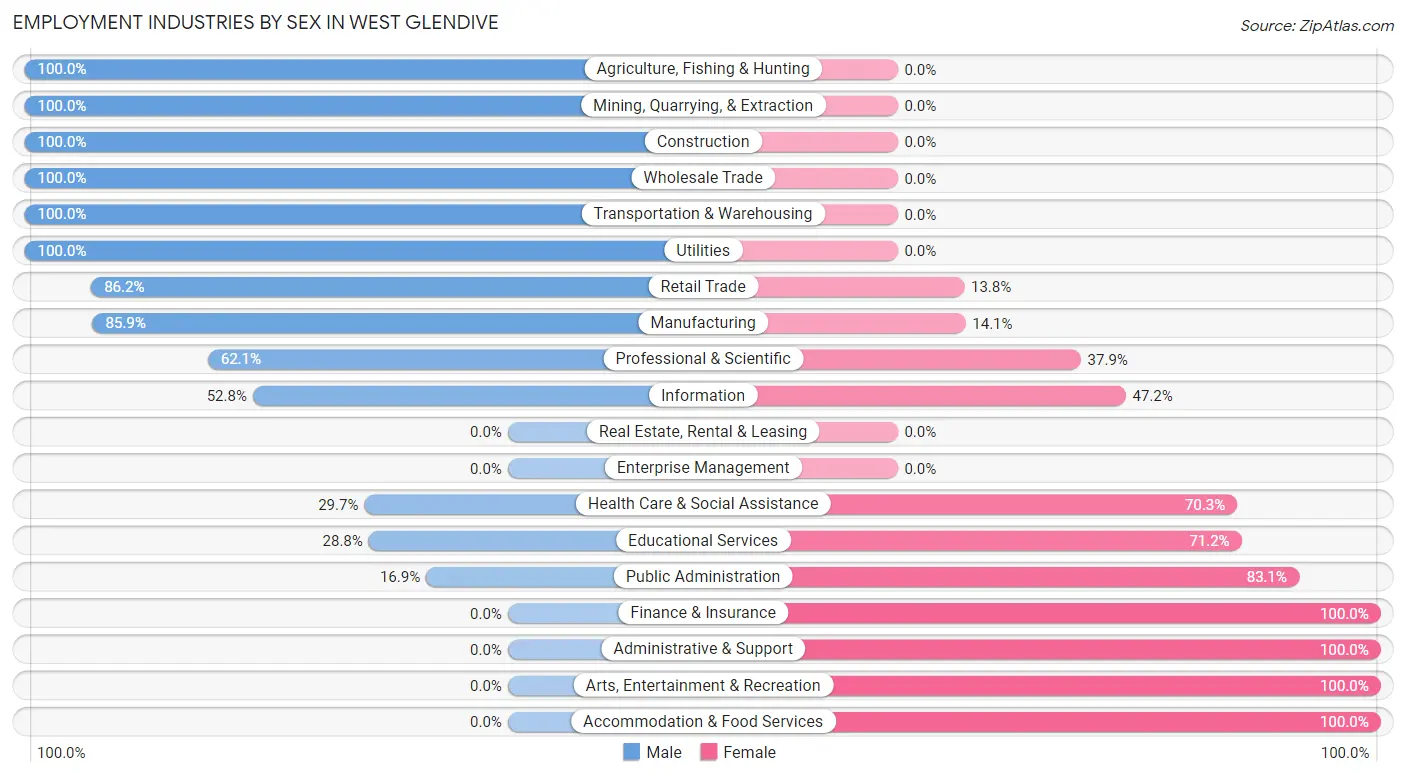
Employment Industries by Sex in West Glendive
The West Glendive industries that see more men than women are Agriculture, Fishing & Hunting (100.0%), Mining, Quarrying, & Extraction (100.0%), and Construction (100.0%), whereas the industries that tend to have a higher number of women are Finance & Insurance (100.0%), Administrative & Support (100.0%), and Arts, Entertainment & Recreation (100.0%).
| Industry | Male | Female |
| Agriculture, Fishing & Hunting | 41 (100.0%) | 0 (0.0%) |
| Mining, Quarrying, & Extraction | 23 (100.0%) | 0 (0.0%) |
| Construction | 64 (100.0%) | 0 (0.0%) |
| Manufacturing | 55 (85.9%) | 9 (14.1%) |
| Wholesale Trade | 32 (100.0%) | 0 (0.0%) |
| Retail Trade | 75 (86.2%) | 12 (13.8%) |
| Transportation & Warehousing | 88 (100.0%) | 0 (0.0%) |
| Utilities | 33 (100.0%) | 0 (0.0%) |
| Information | 19 (52.8%) | 17 (47.2%) |
| Finance & Insurance | 0 (0.0%) | 41 (100.0%) |
| Real Estate, Rental & Leasing | 0 (0.0%) | 0 (0.0%) |
| Professional & Scientific | 18 (62.1%) | 11 (37.9%) |
| Enterprise Management | 0 (0.0%) | 0 (0.0%) |
| Administrative & Support | 0 (0.0%) | 9 (100.0%) |
| Educational Services | 53 (28.8%) | 131 (71.2%) |
| Health Care & Social Assistance | 60 (29.7%) | 142 (70.3%) |
| Arts, Entertainment & Recreation | 0 (0.0%) | 34 (100.0%) |
| Accommodation & Food Services | 0 (0.0%) | 13 (100.0%) |
| Public Administration | 11 (16.9%) | 54 (83.1%) |
| Total | 596 (55.2%) | 484 (44.8%) |
Education in West Glendive
School Enrollment in West Glendive
The most common levels of schooling among the 361 students in West Glendive are middle school (100 | 27.7%), high school (81 | 22.4%), and kindergarten (48 | 13.3%).
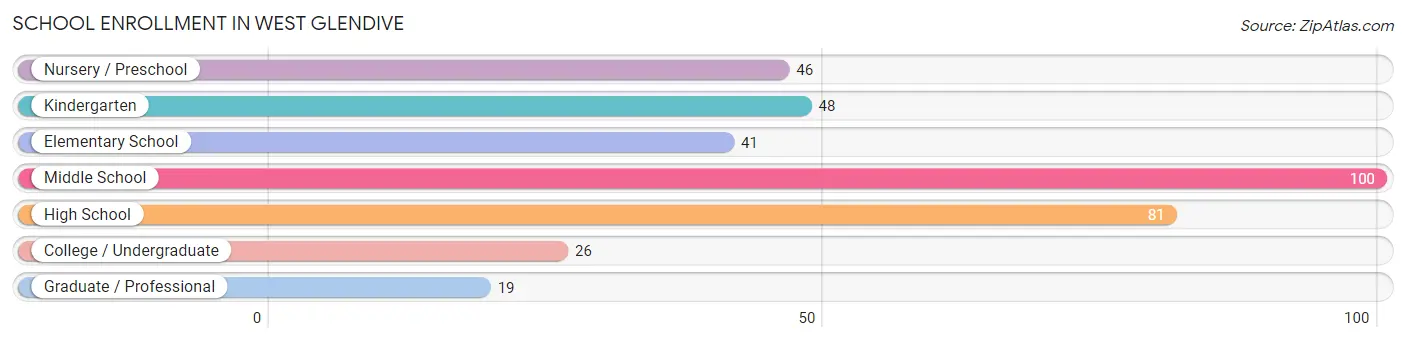
| School Level | # Students | % Students |
| Nursery / Preschool | 46 | 12.7% |
| Kindergarten | 48 | 13.3% |
| Elementary School | 41 | 11.4% |
| Middle School | 100 | 27.7% |
| High School | 81 | 22.4% |
| College / Undergraduate | 26 | 7.2% |
| Graduate / Professional | 19 | 5.3% |
| Total | 361 | 100.0% |
School Enrollment by Age by Funding Source in West Glendive
Out of a total of 361 students who are enrolled in schools in West Glendive, 37 (10.2%) attend a private institution, while the remaining 324 (89.8%) are enrolled in public schools. The age group of 3 to 4 year olds has the highest likelihood of being enrolled in private schools, with 13 (59.1% in the age bracket) enrolled. Conversely, the age group of 10 to 14 year olds has the lowest likelihood of being enrolled in a private school, with 100 (100.0% in the age bracket) attending a public institution.
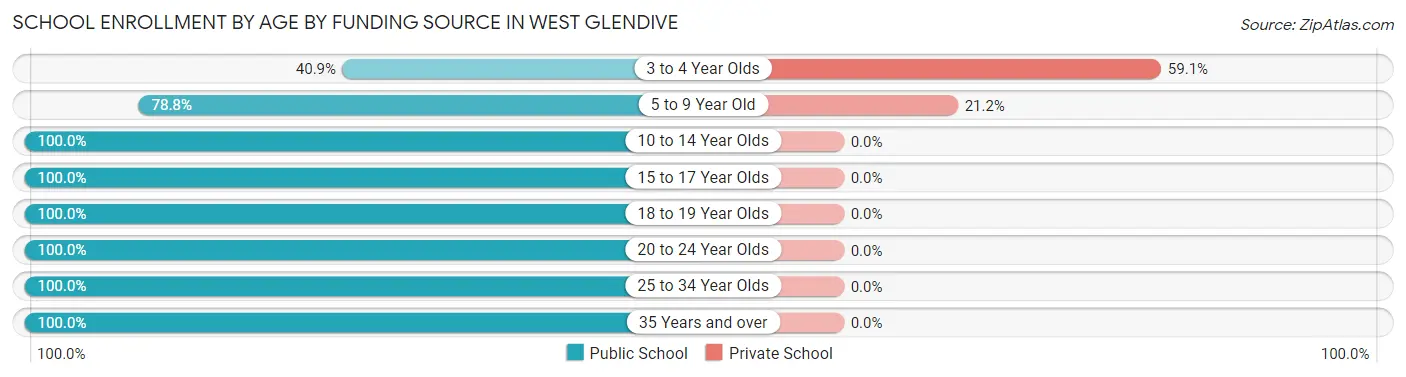
| Age Bracket | Public School | Private School |
| 3 to 4 Year Olds | 9 (40.9%) | 13 (59.1%) |
| 5 to 9 Year Old | 89 (78.8%) | 24 (21.2%) |
| 10 to 14 Year Olds | 100 (100.0%) | 0 (0.0%) |
| 15 to 17 Year Olds | 17 (100.0%) | 0 (0.0%) |
| 18 to 19 Year Olds | 64 (100.0%) | 0 (0.0%) |
| 20 to 24 Year Olds | 21 (100.0%) | 0 (0.0%) |
| 25 to 34 Year Olds | 16 (100.0%) | 0 (0.0%) |
| 35 Years and over | 8 (100.0%) | 0 (0.0%) |
| Total | 324 (89.8%) | 37 (10.2%) |
Educational Attainment by Field of Study in West Glendive
Education (126 | 44.7%), business (49 | 17.4%), engineering (27 | 9.6%), bio, nature & agricultural (25 | 8.9%), and science & technology (21 | 7.4%) are the most common fields of study among 282 individuals in West Glendive who have obtained a bachelor's degree or higher.
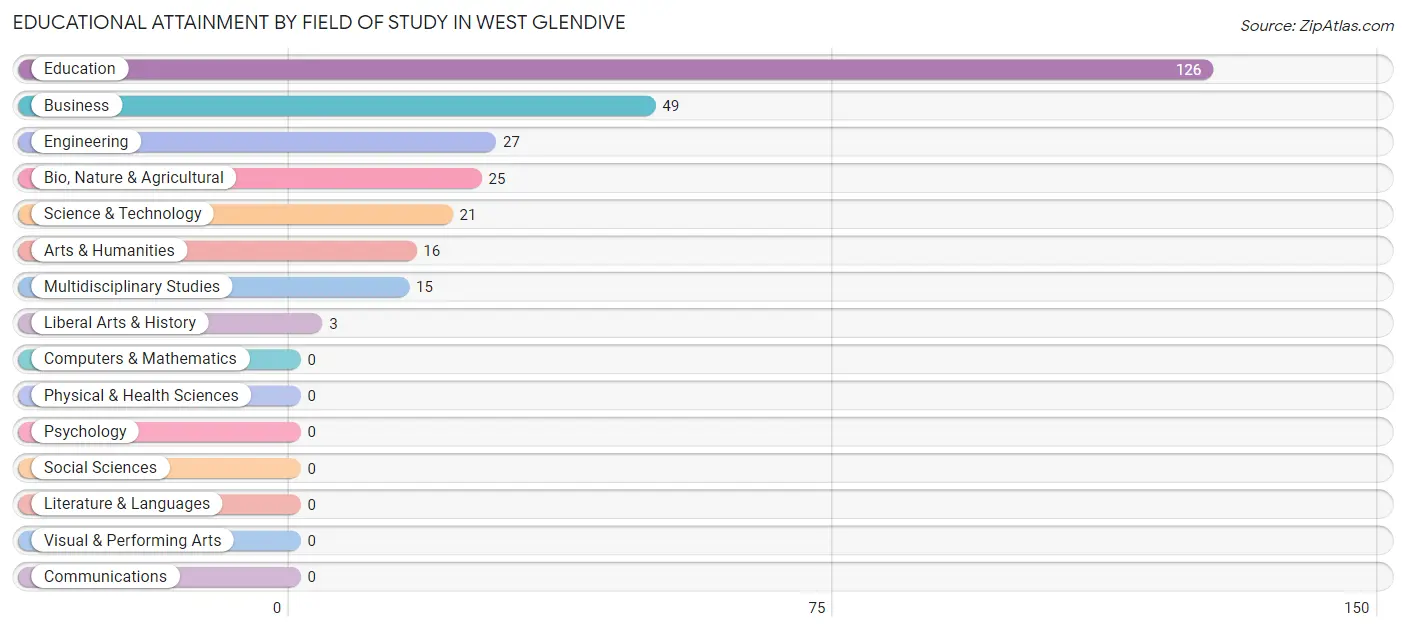
| Field of Study | # Graduates | % Graduates |
| Computers & Mathematics | 0 | 0.0% |
| Bio, Nature & Agricultural | 25 | 8.9% |
| Physical & Health Sciences | 0 | 0.0% |
| Psychology | 0 | 0.0% |
| Social Sciences | 0 | 0.0% |
| Engineering | 27 | 9.6% |
| Multidisciplinary Studies | 15 | 5.3% |
| Science & Technology | 21 | 7.4% |
| Business | 49 | 17.4% |
| Education | 126 | 44.7% |
| Literature & Languages | 0 | 0.0% |
| Liberal Arts & History | 3 | 1.1% |
| Visual & Performing Arts | 0 | 0.0% |
| Communications | 0 | 0.0% |
| Arts & Humanities | 16 | 5.7% |
| Total | 282 | 100.0% |
Transportation & Commute in West Glendive
Vehicle Availability by Sex in West Glendive
The most prevalent vehicle ownership categories in West Glendive are males with 2 vehicles (180, accounting for 30.2%) and females with 2 vehicles (210, making up 39.5%).
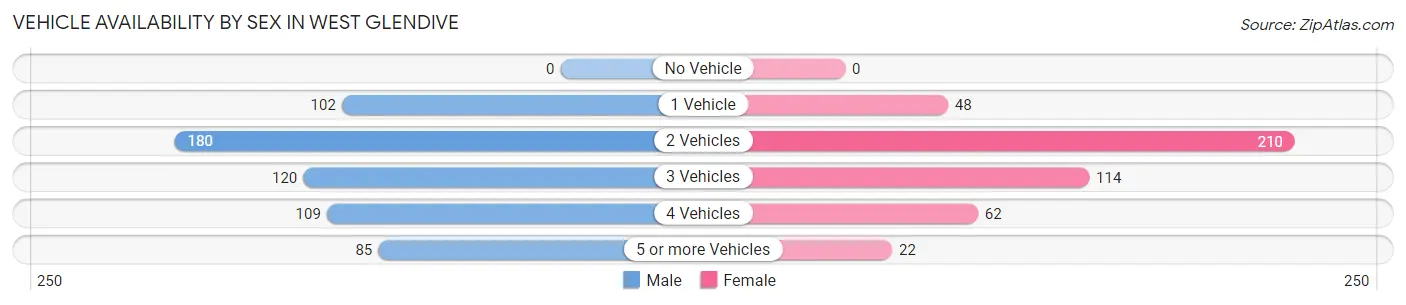
| Vehicles Available | Male | Female |
| No Vehicle | 0 (0.0%) | 0 (0.0%) |
| 1 Vehicle | 102 (17.1%) | 48 (10.5%) |
| 2 Vehicles | 180 (30.2%) | 210 (46.1%) |
| 3 Vehicles | 120 (20.1%) | 114 (25.0%) |
| 4 Vehicles | 109 (18.3%) | 62 (13.6%) |
| 5 or more Vehicles | 85 (14.3%) | 22 (4.8%) |
| Total | 596 (100.0%) | 456 (100.0%) |
Commute Time in West Glendive
The most frequently occuring commute durations in West Glendive are 5 to 9 minutes (510 commuters, 52.6%), 10 to 14 minutes (329 commuters, 34.0%), and 15 to 19 minutes (49 commuters, 5.1%).
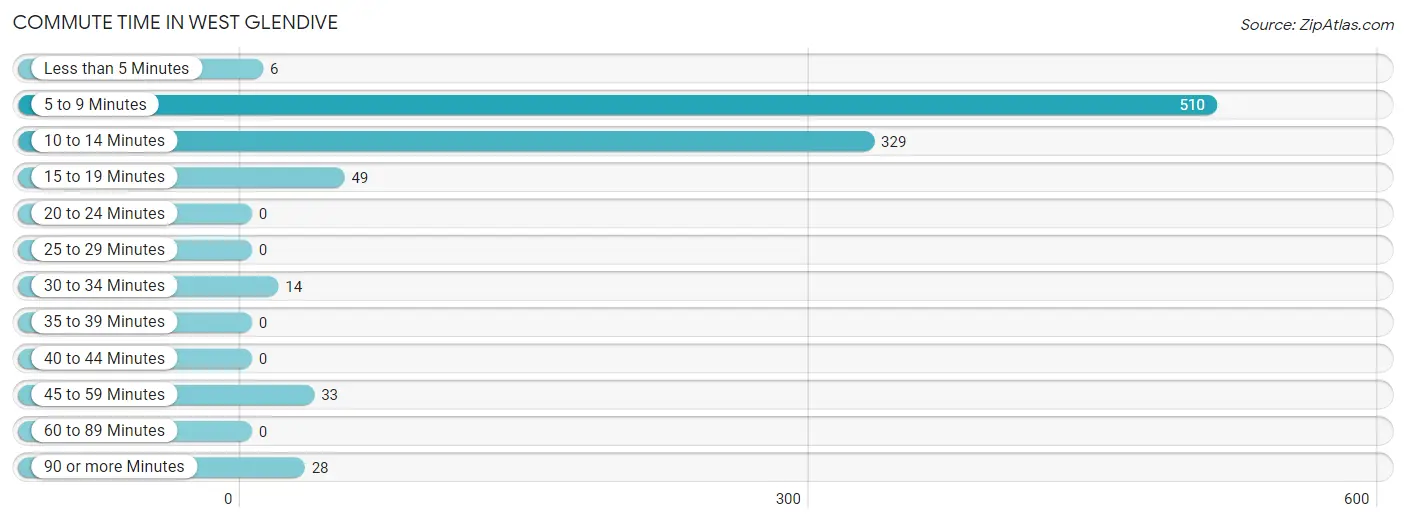
| Commute Time | # Commuters | % Commuters |
| Less than 5 Minutes | 6 | 0.6% |
| 5 to 9 Minutes | 510 | 52.6% |
| 10 to 14 Minutes | 329 | 34.0% |
| 15 to 19 Minutes | 49 | 5.1% |
| 20 to 24 Minutes | 0 | 0.0% |
| 25 to 29 Minutes | 0 | 0.0% |
| 30 to 34 Minutes | 14 | 1.4% |
| 35 to 39 Minutes | 0 | 0.0% |
| 40 to 44 Minutes | 0 | 0.0% |
| 45 to 59 Minutes | 33 | 3.4% |
| 60 to 89 Minutes | 0 | 0.0% |
| 90 or more Minutes | 28 | 2.9% |
Commute Time by Sex in West Glendive
The most common commute times in West Glendive are 5 to 9 minutes (249 commuters, 43.9%) for males and 5 to 9 minutes (261 commuters, 64.9%) for females.
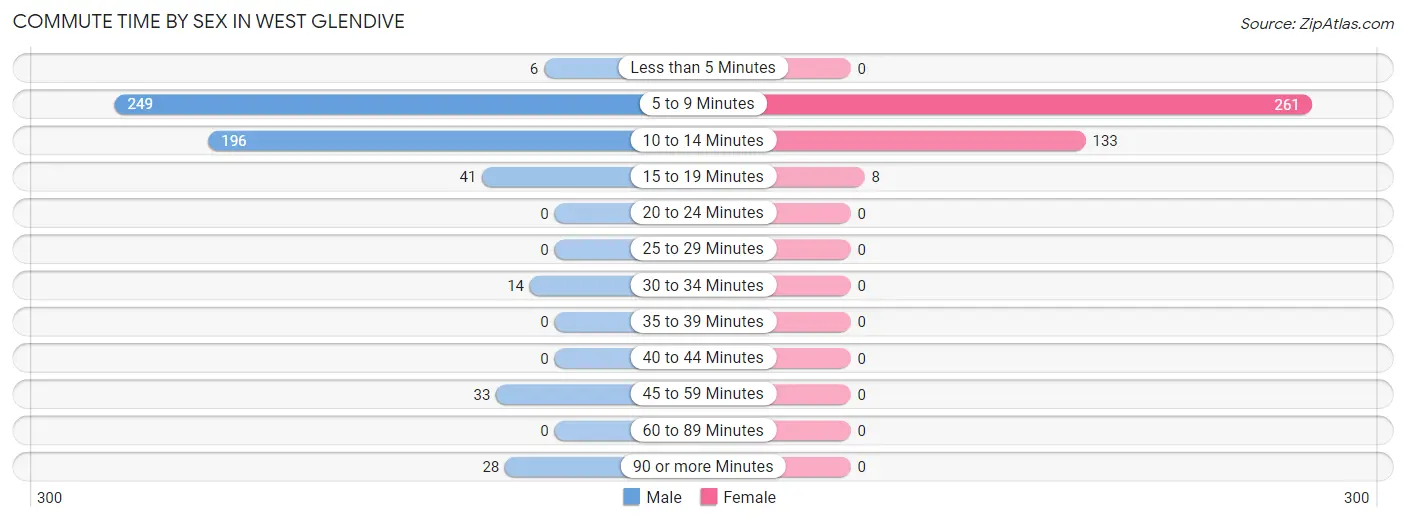
| Commute Time | Male | Female |
| Less than 5 Minutes | 6 (1.1%) | 0 (0.0%) |
| 5 to 9 Minutes | 249 (43.9%) | 261 (64.9%) |
| 10 to 14 Minutes | 196 (34.6%) | 133 (33.1%) |
| 15 to 19 Minutes | 41 (7.2%) | 8 (2.0%) |
| 20 to 24 Minutes | 0 (0.0%) | 0 (0.0%) |
| 25 to 29 Minutes | 0 (0.0%) | 0 (0.0%) |
| 30 to 34 Minutes | 14 (2.5%) | 0 (0.0%) |
| 35 to 39 Minutes | 0 (0.0%) | 0 (0.0%) |
| 40 to 44 Minutes | 0 (0.0%) | 0 (0.0%) |
| 45 to 59 Minutes | 33 (5.8%) | 0 (0.0%) |
| 60 to 89 Minutes | 0 (0.0%) | 0 (0.0%) |
| 90 or more Minutes | 28 (4.9%) | 0 (0.0%) |
Time of Departure to Work by Sex in West Glendive
The most frequent times of departure to work in West Glendive are 6:30 AM to 6:59 AM (132, 23.3%) for males and 7:30 AM to 7:59 AM (171, 42.5%) for females.
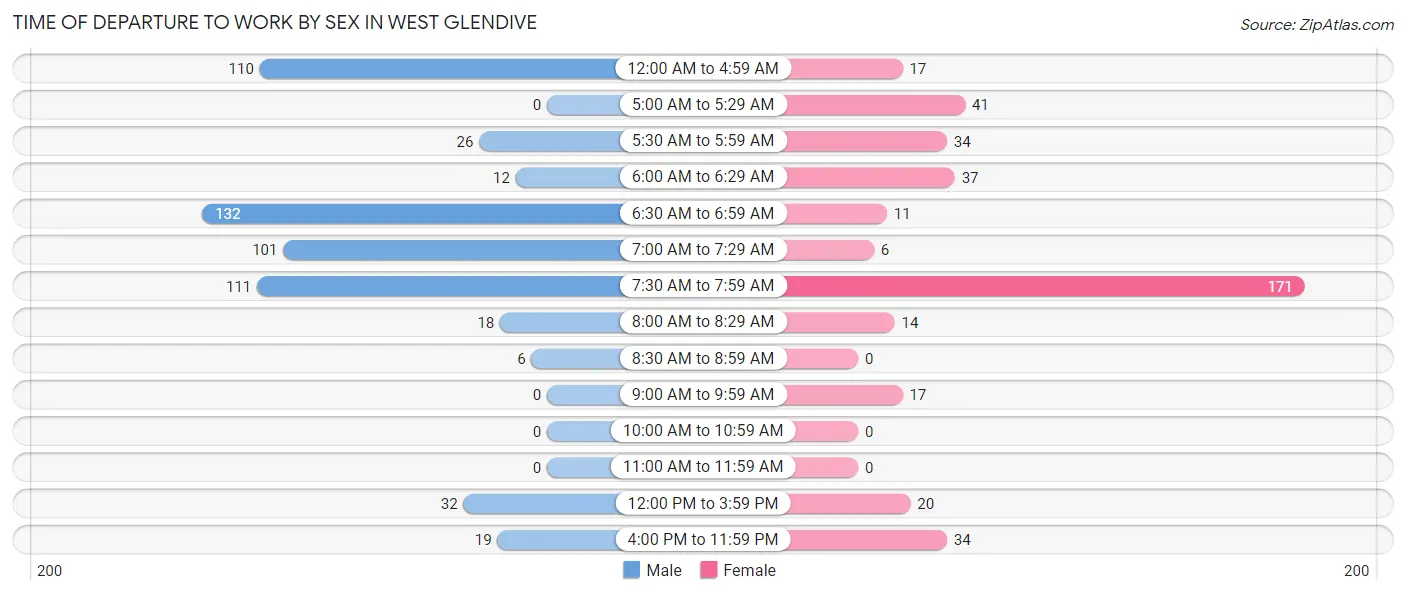
| Time of Departure | Male | Female |
| 12:00 AM to 4:59 AM | 110 (19.4%) | 17 (4.2%) |
| 5:00 AM to 5:29 AM | 0 (0.0%) | 41 (10.2%) |
| 5:30 AM to 5:59 AM | 26 (4.6%) | 34 (8.5%) |
| 6:00 AM to 6:29 AM | 12 (2.1%) | 37 (9.2%) |
| 6:30 AM to 6:59 AM | 132 (23.3%) | 11 (2.7%) |
| 7:00 AM to 7:29 AM | 101 (17.8%) | 6 (1.5%) |
| 7:30 AM to 7:59 AM | 111 (19.6%) | 171 (42.5%) |
| 8:00 AM to 8:29 AM | 18 (3.2%) | 14 (3.5%) |
| 8:30 AM to 8:59 AM | 6 (1.1%) | 0 (0.0%) |
| 9:00 AM to 9:59 AM | 0 (0.0%) | 17 (4.2%) |
| 10:00 AM to 10:59 AM | 0 (0.0%) | 0 (0.0%) |
| 11:00 AM to 11:59 AM | 0 (0.0%) | 0 (0.0%) |
| 12:00 PM to 3:59 PM | 32 (5.6%) | 20 (5.0%) |
| 4:00 PM to 11:59 PM | 19 (3.4%) | 34 (8.5%) |
| Total | 567 (100.0%) | 402 (100.0%) |
Housing Occupancy in West Glendive
Occupancy by Ownership in West Glendive
Of the total 828 dwellings in West Glendive, owner-occupied units account for 615 (74.3%), while renter-occupied units make up 213 (25.7%).
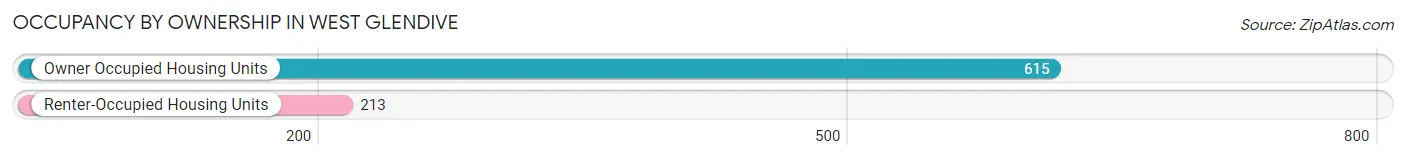
| Occupancy | # Housing Units | % Housing Units |
| Owner Occupied Housing Units | 615 | 74.3% |
| Renter-Occupied Housing Units | 213 | 25.7% |
| Total Occupied Housing Units | 828 | 100.0% |
Occupancy by Household Size in West Glendive
| Household Size | # Housing Units | % Housing Units |
| 1-Person Household | 255 | 30.8% |
| 2-Person Household | 283 | 34.2% |
| 3-Person Household | 138 | 16.7% |
| 4+ Person Household | 152 | 18.4% |
| Total Housing Units | 828 | 100.0% |
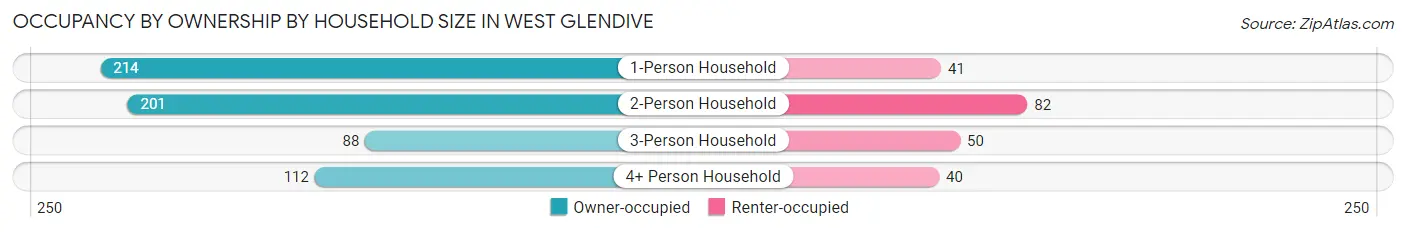
Occupancy by Ownership by Household Size in West Glendive
| Household Size | Owner-occupied | Renter-occupied |
| 1-Person Household | 214 (83.9%) | 41 (16.1%) |
| 2-Person Household | 201 (71.0%) | 82 (29.0%) |
| 3-Person Household | 88 (63.8%) | 50 (36.2%) |
| 4+ Person Household | 112 (73.7%) | 40 (26.3%) |
| Total Housing Units | 615 (74.3%) | 213 (25.7%) |
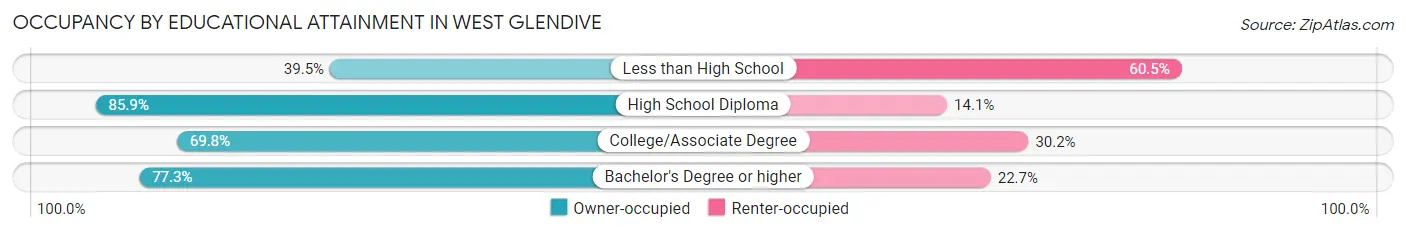
Occupancy by Educational Attainment in West Glendive
| Household Size | Owner-occupied | Renter-occupied |
| Less than High School | 15 (39.5%) | 23 (60.5%) |
| High School Diploma | 171 (85.9%) | 28 (14.1%) |
| College/Associate Degree | 259 (69.8%) | 112 (30.2%) |
| Bachelor's Degree or higher | 170 (77.3%) | 50 (22.7%) |
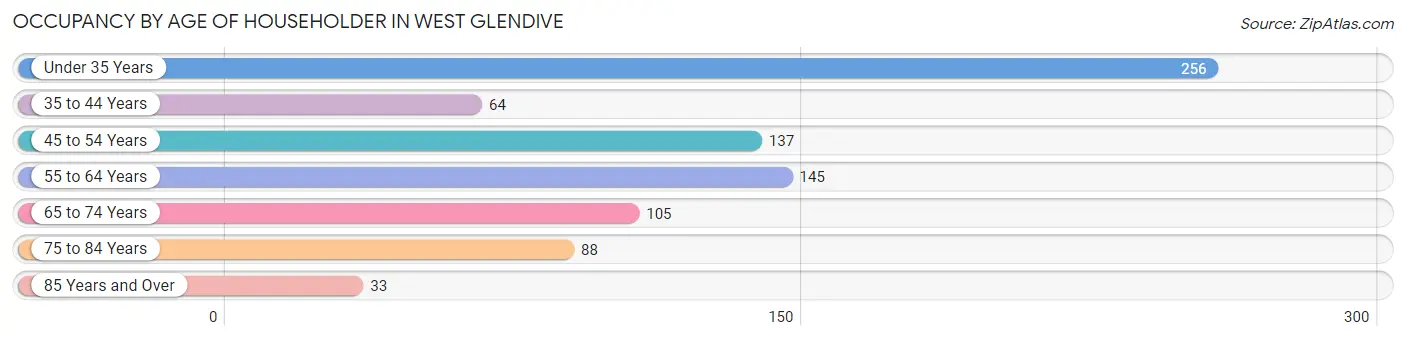
Occupancy by Age of Householder in West Glendive
| Age Bracket | # Households | % Households |
| Under 35 Years | 256 | 30.9% |
| 35 to 44 Years | 64 | 7.7% |
| 45 to 54 Years | 137 | 16.6% |
| 55 to 64 Years | 145 | 17.5% |
| 65 to 74 Years | 105 | 12.7% |
| 75 to 84 Years | 88 | 10.6% |
| 85 Years and Over | 33 | 4.0% |
| Total | 828 | 100.0% |
Housing Finances in West Glendive
Median Income by Occupancy in West Glendive
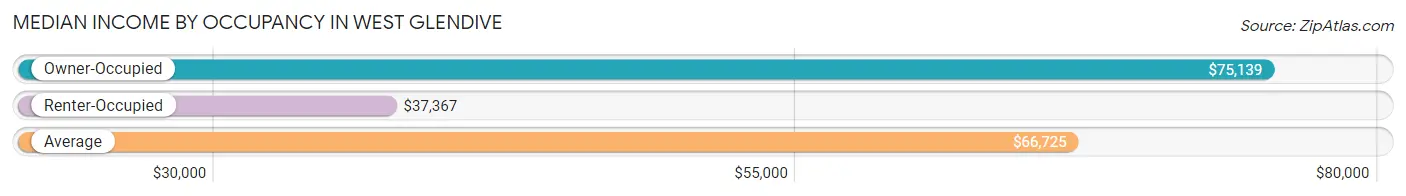
| Occupancy Type | # Households | Median Income |
| Owner-Occupied | 615 (74.3%) | $75,139 |
| Renter-Occupied | 213 (25.7%) | $37,367 |
| Average | 828 (100.0%) | $66,725 |
Occupancy by Householder Income Bracket in West Glendive
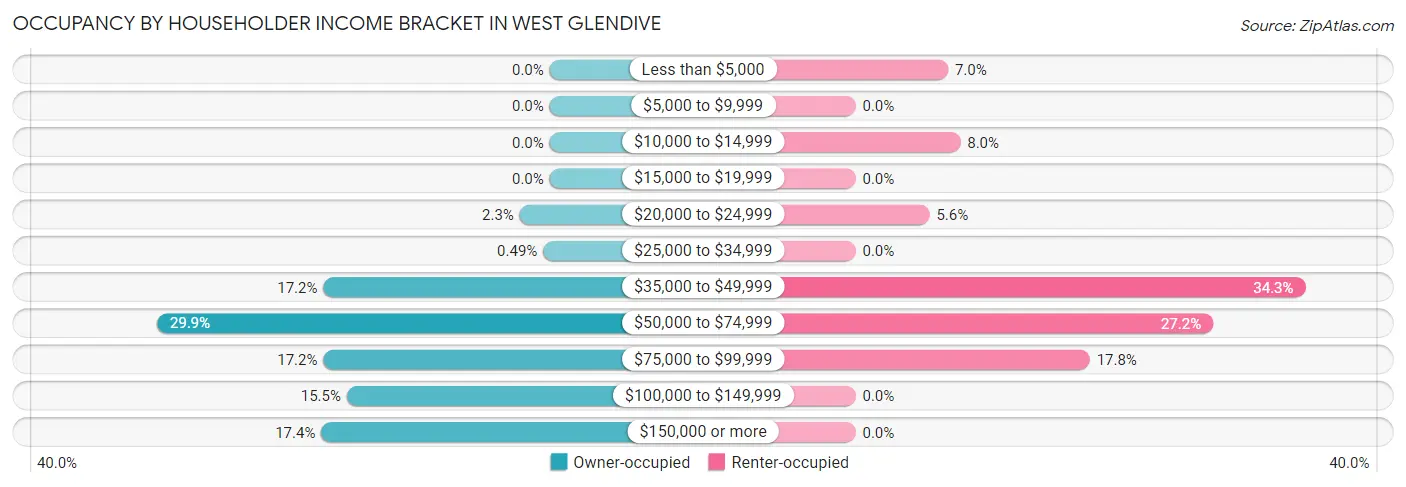
| Income Bracket | Owner-occupied | Renter-occupied |
| Less than $5,000 | 0 (0.0%) | 15 (7.0%) |
| $5,000 to $9,999 | 0 (0.0%) | 0 (0.0%) |
| $10,000 to $14,999 | 0 (0.0%) | 17 (8.0%) |
| $15,000 to $19,999 | 0 (0.0%) | 0 (0.0%) |
| $20,000 to $24,999 | 14 (2.3%) | 12 (5.6%) |
| $25,000 to $34,999 | 3 (0.5%) | 0 (0.0%) |
| $35,000 to $49,999 | 106 (17.2%) | 73 (34.3%) |
| $50,000 to $74,999 | 184 (29.9%) | 58 (27.2%) |
| $75,000 to $99,999 | 106 (17.2%) | 38 (17.8%) |
| $100,000 to $149,999 | 95 (15.4%) | 0 (0.0%) |
| $150,000 or more | 107 (17.4%) | 0 (0.0%) |
| Total | 615 (100.0%) | 213 (100.0%) |
Monthly Housing Cost Tiers in West Glendive
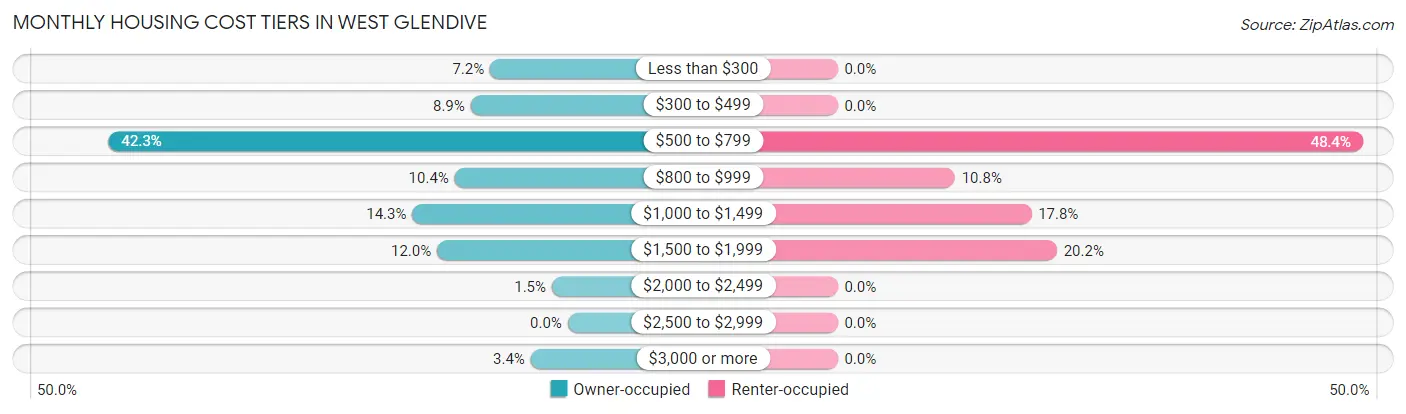
| Monthly Cost | Owner-occupied | Renter-occupied |
| Less than $300 | 44 (7.1%) | 0 (0.0%) |
| $300 to $499 | 55 (8.9%) | 0 (0.0%) |
| $500 to $799 | 260 (42.3%) | 103 (48.4%) |
| $800 to $999 | 64 (10.4%) | 23 (10.8%) |
| $1,000 to $1,499 | 88 (14.3%) | 38 (17.8%) |
| $1,500 to $1,999 | 74 (12.0%) | 43 (20.2%) |
| $2,000 to $2,499 | 9 (1.5%) | 0 (0.0%) |
| $2,500 to $2,999 | 0 (0.0%) | 0 (0.0%) |
| $3,000 or more | 21 (3.4%) | 0 (0.0%) |
| Total | 615 (100.0%) | 213 (100.0%) |
Physical Housing Characteristics in West Glendive
Housing Structures in West Glendive
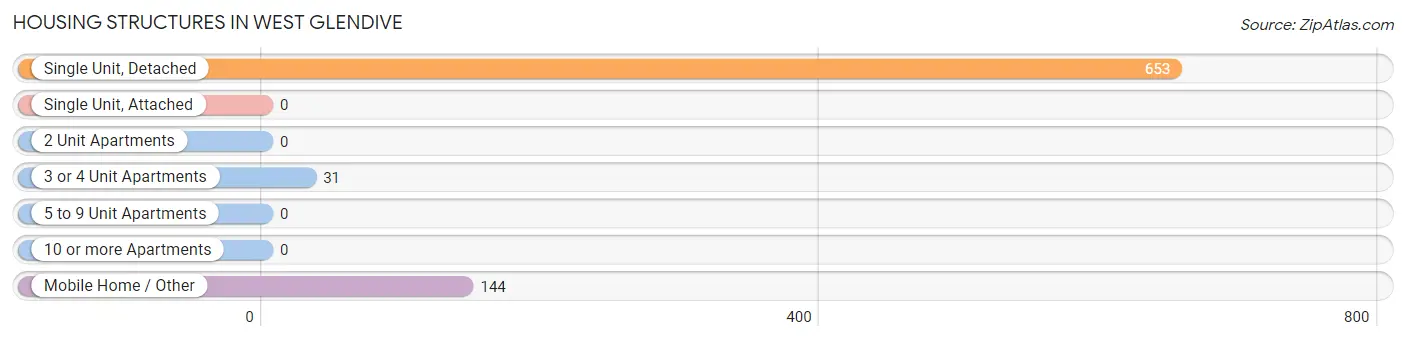
| Structure Type | # Housing Units | % Housing Units |
| Single Unit, Detached | 653 | 78.9% |
| Single Unit, Attached | 0 | 0.0% |
| 2 Unit Apartments | 0 | 0.0% |
| 3 or 4 Unit Apartments | 31 | 3.7% |
| 5 to 9 Unit Apartments | 0 | 0.0% |
| 10 or more Apartments | 0 | 0.0% |
| Mobile Home / Other | 144 | 17.4% |
| Total | 828 | 100.0% |
Housing Structures by Occupancy in West Glendive
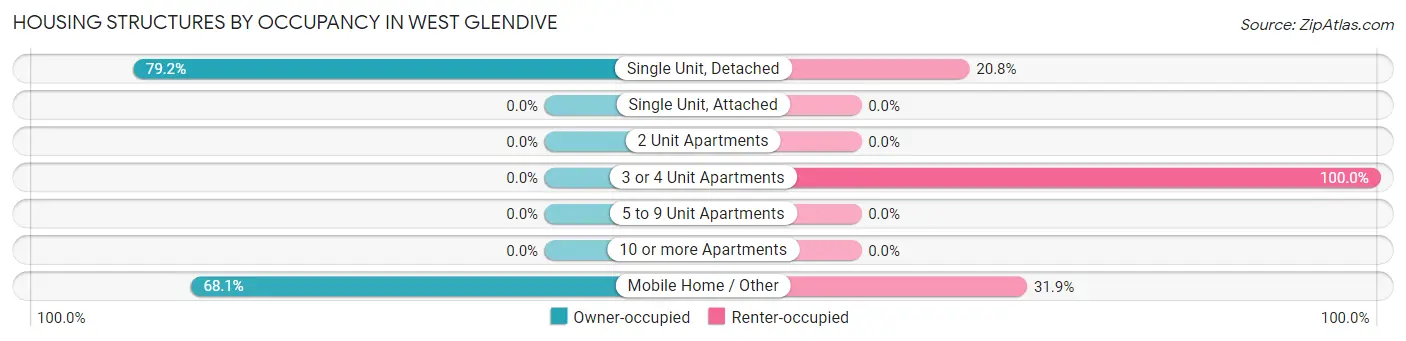
| Structure Type | Owner-occupied | Renter-occupied |
| Single Unit, Detached | 517 (79.2%) | 136 (20.8%) |
| Single Unit, Attached | 0 (0.0%) | 0 (0.0%) |
| 2 Unit Apartments | 0 (0.0%) | 0 (0.0%) |
| 3 or 4 Unit Apartments | 0 (0.0%) | 31 (100.0%) |
| 5 to 9 Unit Apartments | 0 (0.0%) | 0 (0.0%) |
| 10 or more Apartments | 0 (0.0%) | 0 (0.0%) |
| Mobile Home / Other | 98 (68.1%) | 46 (31.9%) |
| Total | 615 (74.3%) | 213 (25.7%) |
Housing Structures by Number of Rooms in West Glendive
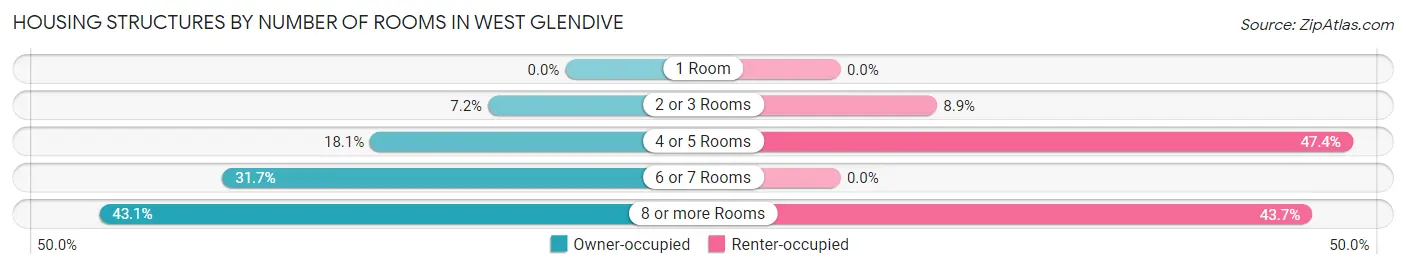
| Number of Rooms | Owner-occupied | Renter-occupied |
| 1 Room | 0 (0.0%) | 0 (0.0%) |
| 2 or 3 Rooms | 44 (7.1%) | 19 (8.9%) |
| 4 or 5 Rooms | 111 (18.0%) | 101 (47.4%) |
| 6 or 7 Rooms | 195 (31.7%) | 0 (0.0%) |
| 8 or more Rooms | 265 (43.1%) | 93 (43.7%) |
| Total | 615 (100.0%) | 213 (100.0%) |
Housing Structure by Heating Type in West Glendive
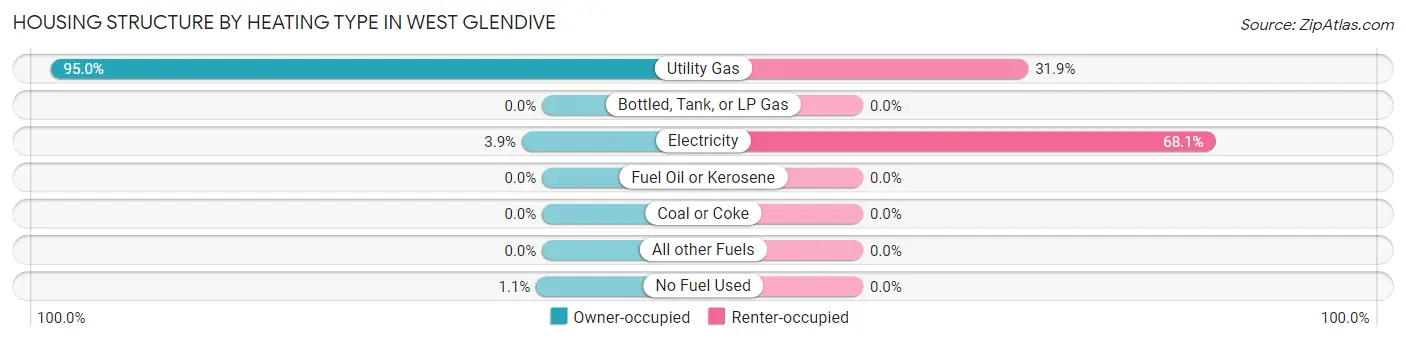
| Heating Type | Owner-occupied | Renter-occupied |
| Utility Gas | 584 (95.0%) | 68 (31.9%) |
| Bottled, Tank, or LP Gas | 0 (0.0%) | 0 (0.0%) |
| Electricity | 24 (3.9%) | 145 (68.1%) |
| Fuel Oil or Kerosene | 0 (0.0%) | 0 (0.0%) |
| Coal or Coke | 0 (0.0%) | 0 (0.0%) |
| All other Fuels | 0 (0.0%) | 0 (0.0%) |
| No Fuel Used | 7 (1.1%) | 0 (0.0%) |
| Total | 615 (100.0%) | 213 (100.0%) |
Household Vehicle Usage in West Glendive
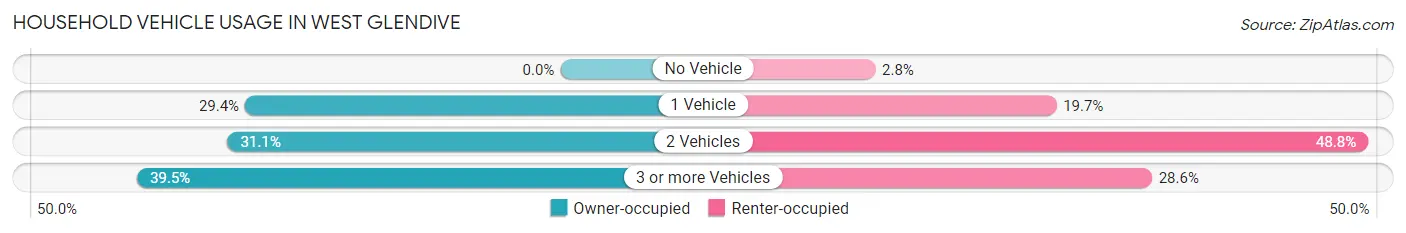
| Vehicles per Household | Owner-occupied | Renter-occupied |
| No Vehicle | 0 (0.0%) | 6 (2.8%) |
| 1 Vehicle | 181 (29.4%) | 42 (19.7%) |
| 2 Vehicles | 191 (31.1%) | 104 (48.8%) |
| 3 or more Vehicles | 243 (39.5%) | 61 (28.6%) |
| Total | 615 (100.0%) | 213 (100.0%) |
Real Estate & Mortgages in West Glendive
Real Estate and Mortgage Overview in West Glendive
| Characteristic | Without Mortgage | With Mortgage |
| Housing Units | 361 | 254 |
| Median Property Value | $230,800 | $188,600 |
| Median Household Income | $65,231 | $32 |
| Monthly Housing Costs | $593 | $21 |
| Real Estate Taxes | $2,592 | $25 |
Property Value by Mortgage Status in West Glendive
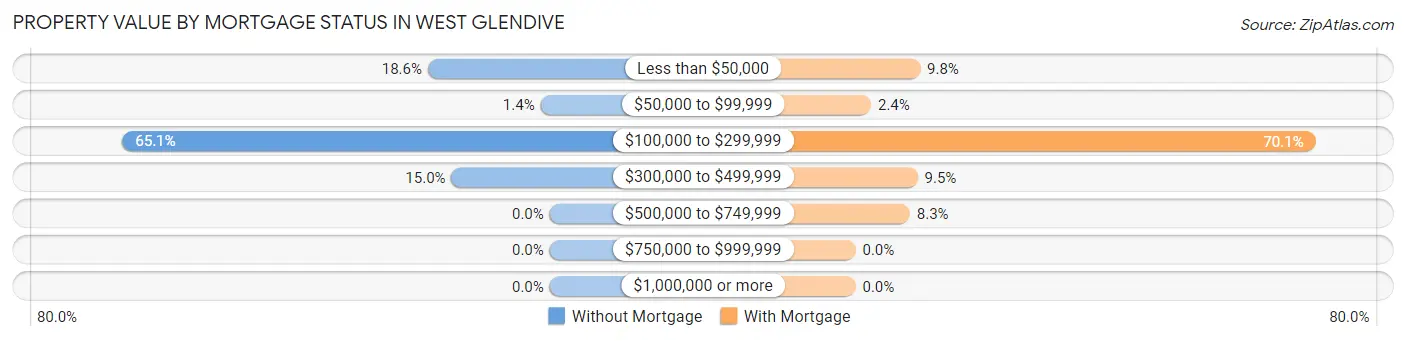
| Property Value | Without Mortgage | With Mortgage |
| Less than $50,000 | 67 (18.6%) | 25 (9.8%) |
| $50,000 to $99,999 | 5 (1.4%) | 6 (2.4%) |
| $100,000 to $299,999 | 235 (65.1%) | 178 (70.1%) |
| $300,000 to $499,999 | 54 (15.0%) | 24 (9.5%) |
| $500,000 to $749,999 | 0 (0.0%) | 21 (8.3%) |
| $750,000 to $999,999 | 0 (0.0%) | 0 (0.0%) |
| $1,000,000 or more | 0 (0.0%) | 0 (0.0%) |
| Total | 361 (100.0%) | 254 (100.0%) |
Household Income by Mortgage Status in West Glendive
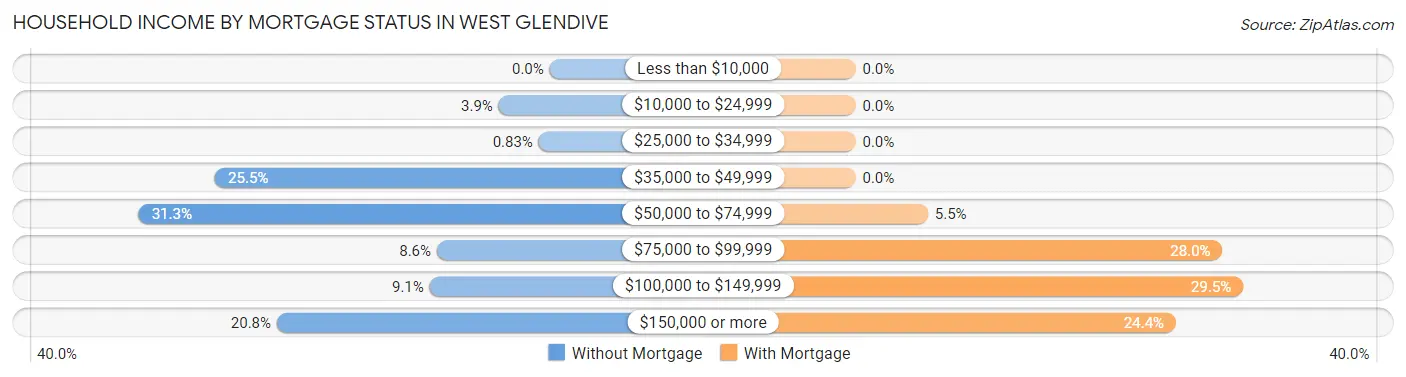
| Household Income | Without Mortgage | With Mortgage |
| Less than $10,000 | 0 (0.0%) | 0 (0.0%) |
| $10,000 to $24,999 | 14 (3.9%) | 0 (0.0%) |
| $25,000 to $34,999 | 3 (0.8%) | 0 (0.0%) |
| $35,000 to $49,999 | 92 (25.5%) | 0 (0.0%) |
| $50,000 to $74,999 | 113 (31.3%) | 14 (5.5%) |
| $75,000 to $99,999 | 31 (8.6%) | 71 (28.0%) |
| $100,000 to $149,999 | 33 (9.1%) | 75 (29.5%) |
| $150,000 or more | 75 (20.8%) | 62 (24.4%) |
| Total | 361 (100.0%) | 254 (100.0%) |
Property Value to Household Income Ratio in West Glendive
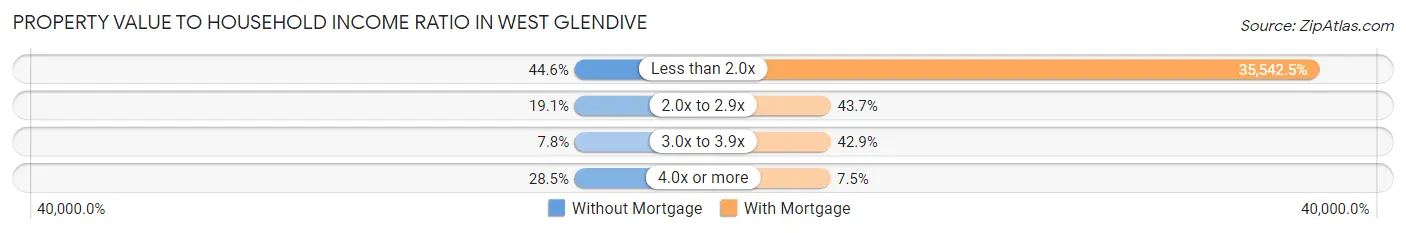
| Value-to-Income Ratio | Without Mortgage | With Mortgage |
| Less than 2.0x | 161 (44.6%) | 90,278 (35,542.5%) |
| 2.0x to 2.9x | 69 (19.1%) | 111 (43.7%) |
| 3.0x to 3.9x | 28 (7.8%) | 109 (42.9%) |
| 4.0x or more | 103 (28.5%) | 19 (7.5%) |
| Total | 361 (100.0%) | 254 (100.0%) |
Real Estate Taxes by Mortgage Status in West Glendive
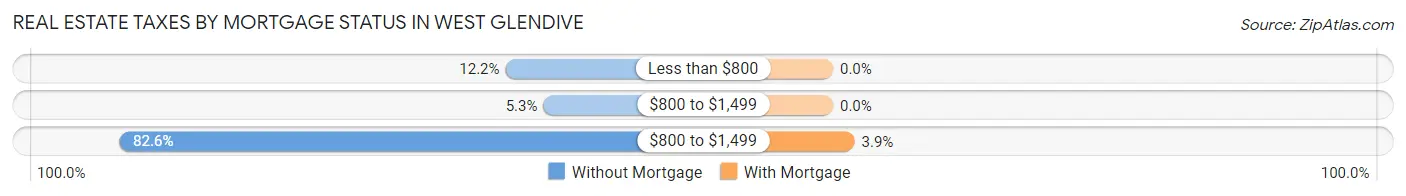
| Property Taxes | Without Mortgage | With Mortgage |
| Less than $800 | 44 (12.2%) | 0 (0.0%) |
| $800 to $1,499 | 19 (5.3%) | 0 (0.0%) |
| $800 to $1,499 | 298 (82.6%) | 10 (3.9%) |
| Total | 361 (100.0%) | 254 (100.0%) |
Health & Disability in West Glendive
Health Insurance Coverage by Age in West Glendive
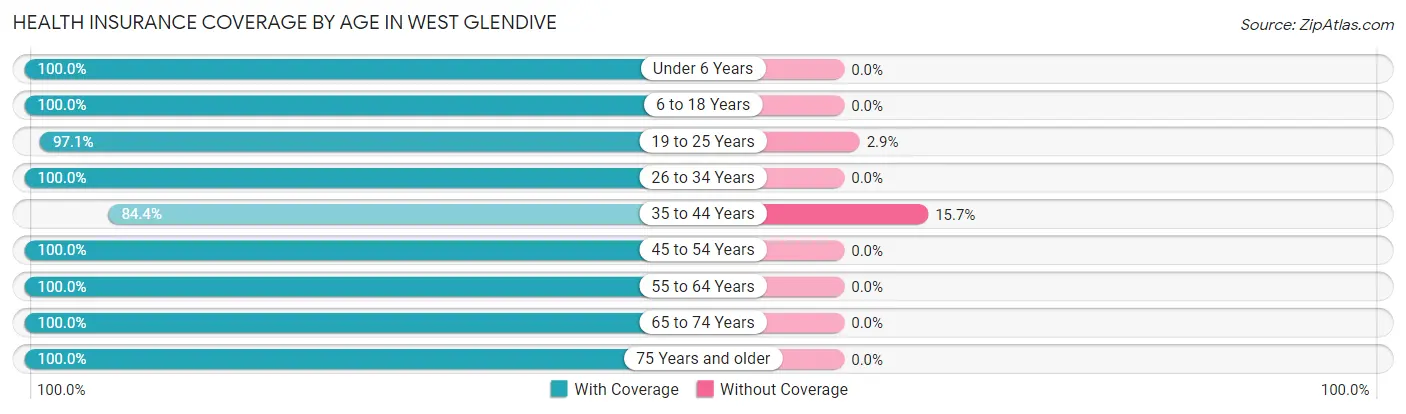
| Age Bracket | With Coverage | Without Coverage |
| Under 6 Years | 160 (100.0%) | 0 (0.0%) |
| 6 to 18 Years | 287 (100.0%) | 0 (0.0%) |
| 19 to 25 Years | 202 (97.1%) | 6 (2.9%) |
| 26 to 34 Years | 292 (100.0%) | 0 (0.0%) |
| 35 to 44 Years | 97 (84.4%) | 18 (15.7%) |
| 45 to 54 Years | 263 (100.0%) | 0 (0.0%) |
| 55 to 64 Years | 212 (100.0%) | 0 (0.0%) |
| 65 to 74 Years | 232 (100.0%) | 0 (0.0%) |
| 75 Years and older | 143 (100.0%) | 0 (0.0%) |
| Total | 1,888 (98.7%) | 24 (1.3%) |
Health Insurance Coverage by Citizenship Status in West Glendive
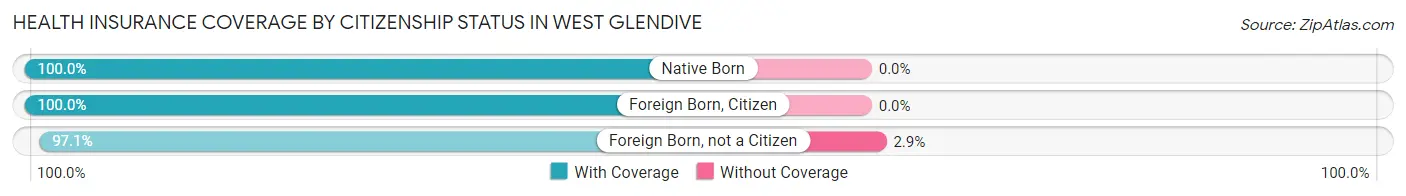
| Citizenship Status | With Coverage | Without Coverage |
| Native Born | 160 (100.0%) | 0 (0.0%) |
| Foreign Born, Citizen | 287 (100.0%) | 0 (0.0%) |
| Foreign Born, not a Citizen | 202 (97.1%) | 6 (2.9%) |
Health Insurance Coverage by Household Income in West Glendive
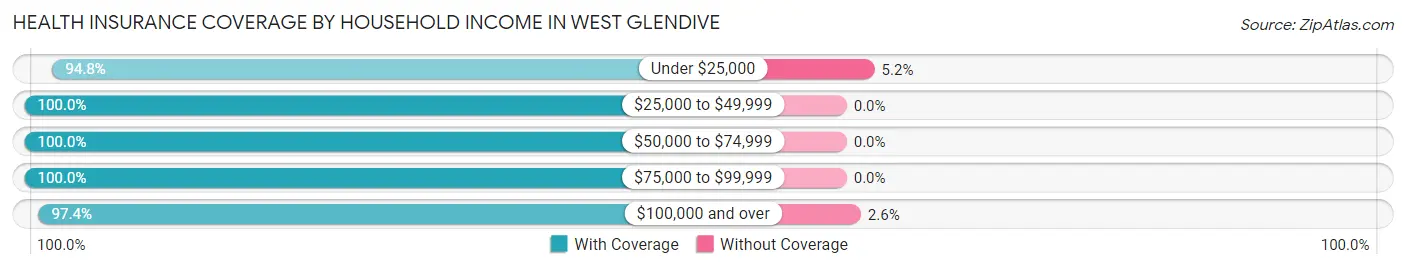
| Household Income | With Coverage | Without Coverage |
| Under $25,000 | 109 (94.8%) | 6 (5.2%) |
| $25,000 to $49,999 | 304 (100.0%) | 0 (0.0%) |
| $50,000 to $74,999 | 498 (100.0%) | 0 (0.0%) |
| $75,000 to $99,999 | 313 (100.0%) | 0 (0.0%) |
| $100,000 and over | 664 (97.4%) | 18 (2.6%) |
Public vs Private Health Insurance Coverage by Age in West Glendive
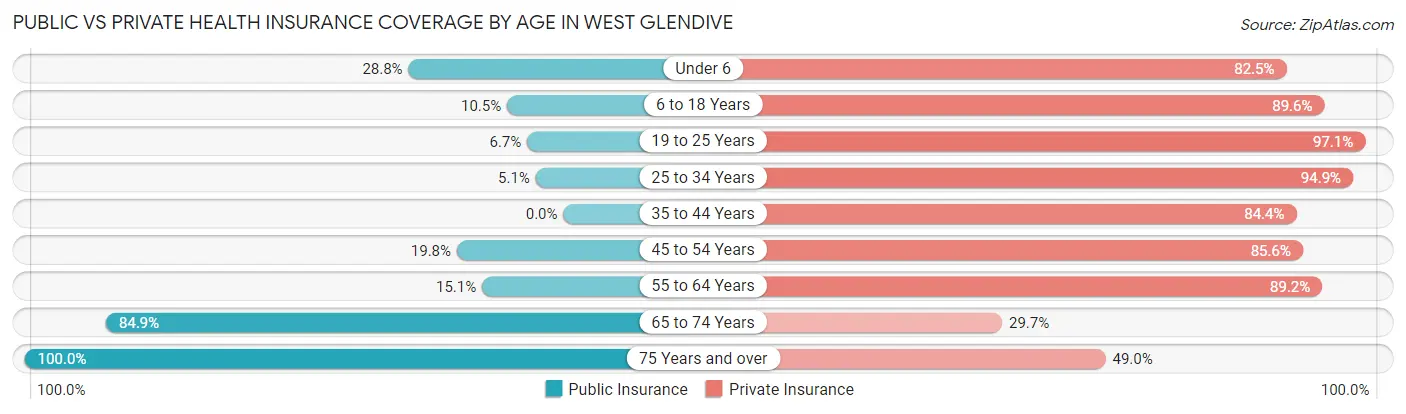
| Age Bracket | Public Insurance | Private Insurance |
| Under 6 | 46 (28.7%) | 132 (82.5%) |
| 6 to 18 Years | 30 (10.4%) | 257 (89.5%) |
| 19 to 25 Years | 14 (6.7%) | 202 (97.1%) |
| 25 to 34 Years | 15 (5.1%) | 277 (94.9%) |
| 35 to 44 Years | 0 (0.0%) | 97 (84.4%) |
| 45 to 54 Years | 52 (19.8%) | 225 (85.6%) |
| 55 to 64 Years | 32 (15.1%) | 189 (89.1%) |
| 65 to 74 Years | 197 (84.9%) | 69 (29.7%) |
| 75 Years and over | 143 (100.0%) | 70 (48.9%) |
| Total | 529 (27.7%) | 1,518 (79.4%) |
Disability Status by Sex by Age in West Glendive
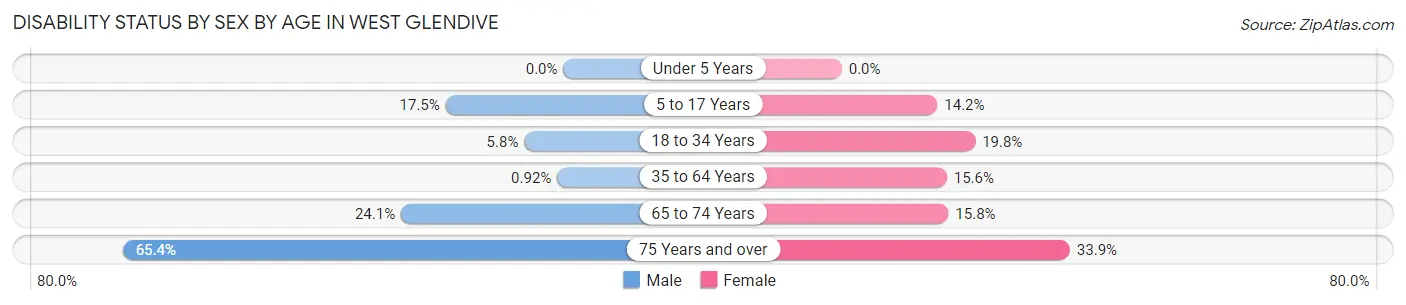
| Age Bracket | Male | Female |
| Under 5 Years | 0 (0.0%) | 0 (0.0%) |
| 5 to 17 Years | 18 (17.5%) | 22 (14.2%) |
| 18 to 34 Years | 14 (5.8%) | 64 (19.8%) |
| 35 to 64 Years | 3 (0.9%) | 41 (15.6%) |
| 65 to 74 Years | 27 (24.1%) | 19 (15.8%) |
| 75 Years and over | 53 (65.4%) | 21 (33.9%) |
Disability Class by Sex by Age in West Glendive
Disability Class: Hearing Difficulty
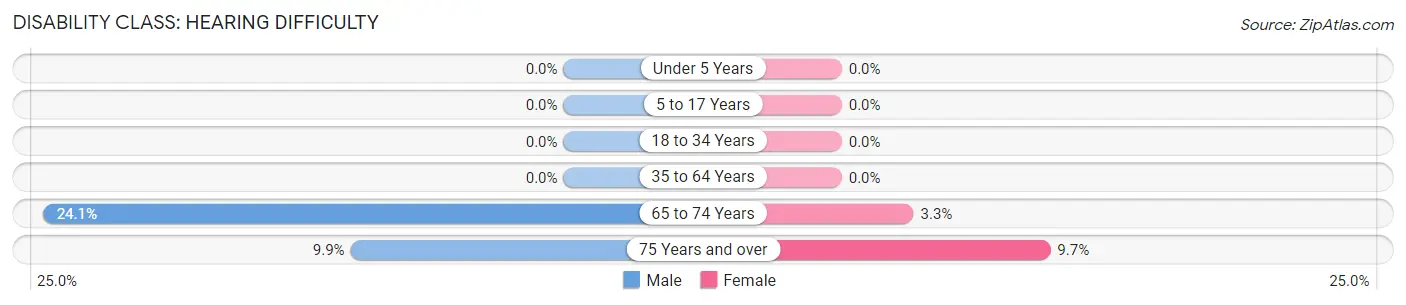
| Age Bracket | Male | Female |
| Under 5 Years | 0 (0.0%) | 0 (0.0%) |
| 5 to 17 Years | 0 (0.0%) | 0 (0.0%) |
| 18 to 34 Years | 0 (0.0%) | 0 (0.0%) |
| 35 to 64 Years | 0 (0.0%) | 0 (0.0%) |
| 65 to 74 Years | 27 (24.1%) | 4 (3.3%) |
| 75 Years and over | 8 (9.9%) | 6 (9.7%) |
Disability Class: Vision Difficulty
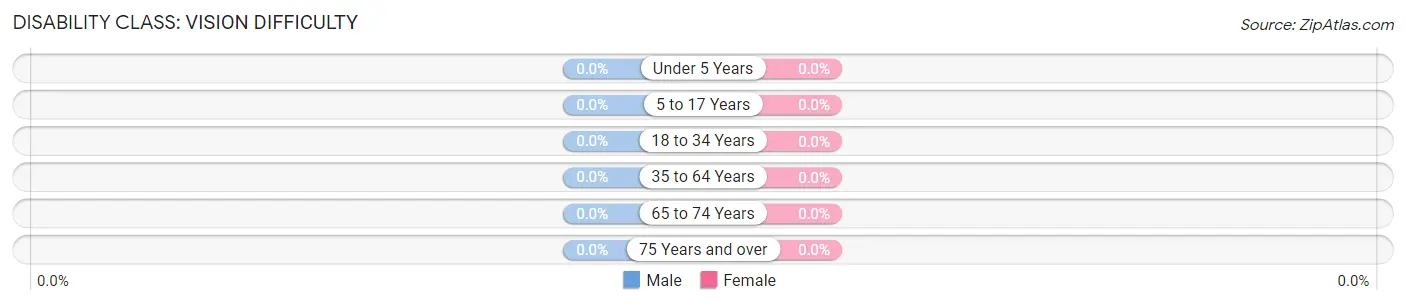
| Age Bracket | Male | Female |
| Under 5 Years | 0 (0.0%) | 0 (0.0%) |
| 5 to 17 Years | 0 (0.0%) | 0 (0.0%) |
| 18 to 34 Years | 0 (0.0%) | 0 (0.0%) |
| 35 to 64 Years | 0 (0.0%) | 0 (0.0%) |
| 65 to 74 Years | 0 (0.0%) | 0 (0.0%) |
| 75 Years and over | 0 (0.0%) | 0 (0.0%) |
Disability Class: Cognitive Difficulty
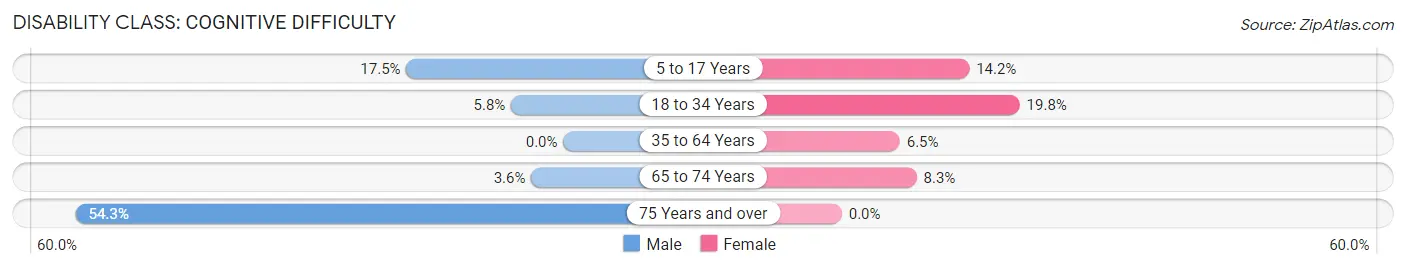
| Age Bracket | Male | Female |
| 5 to 17 Years | 18 (17.5%) | 22 (14.2%) |
| 18 to 34 Years | 14 (5.8%) | 64 (19.8%) |
| 35 to 64 Years | 0 (0.0%) | 17 (6.5%) |
| 65 to 74 Years | 4 (3.6%) | 10 (8.3%) |
| 75 Years and over | 44 (54.3%) | 0 (0.0%) |
Disability Class: Ambulatory Difficulty
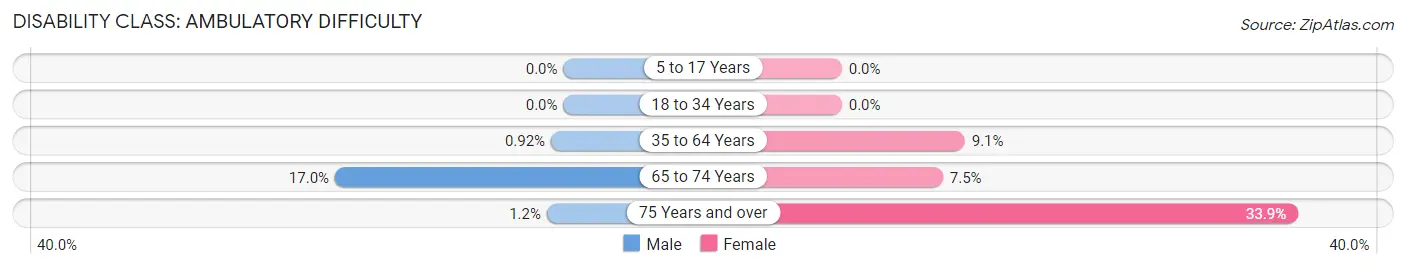
| Age Bracket | Male | Female |
| 5 to 17 Years | 0 (0.0%) | 0 (0.0%) |
| 18 to 34 Years | 0 (0.0%) | 0 (0.0%) |
| 35 to 64 Years | 3 (0.9%) | 24 (9.1%) |
| 65 to 74 Years | 19 (17.0%) | 9 (7.5%) |
| 75 Years and over | 1 (1.2%) | 21 (33.9%) |
Disability Class: Self-Care Difficulty
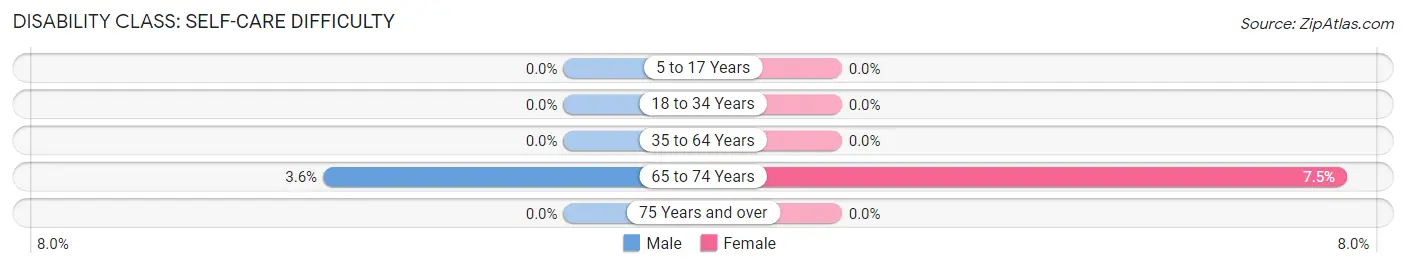
| Age Bracket | Male | Female |
| 5 to 17 Years | 0 (0.0%) | 0 (0.0%) |
| 18 to 34 Years | 0 (0.0%) | 0 (0.0%) |
| 35 to 64 Years | 0 (0.0%) | 0 (0.0%) |
| 65 to 74 Years | 4 (3.6%) | 9 (7.5%) |
| 75 Years and over | 0 (0.0%) | 0 (0.0%) |
Technology Access in West Glendive
Computing Device Access in West Glendive
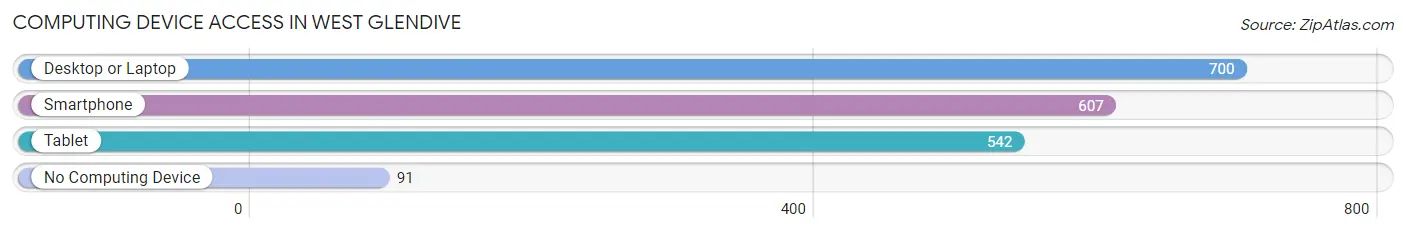
| Device Type | # Households | % Households |
| Desktop or Laptop | 700 | 84.5% |
| Smartphone | 607 | 73.3% |
| Tablet | 542 | 65.5% |
| No Computing Device | 91 | 11.0% |
| Total | 828 | 100.0% |
Internet Access in West Glendive
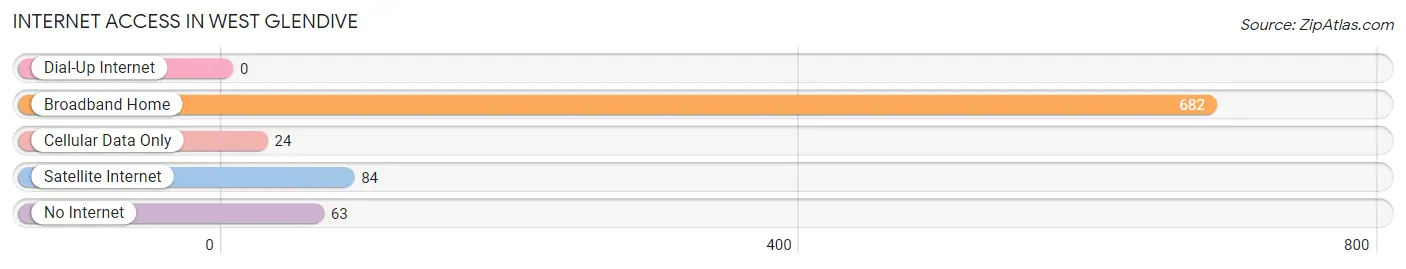
| Internet Type | # Households | % Households |
| Dial-Up Internet | 0 | 0.0% |
| Broadband Home | 682 | 82.4% |
| Cellular Data Only | 24 | 2.9% |
| Satellite Internet | 84 | 10.1% |
| No Internet | 63 | 7.6% |
| Total | 828 | 100.0% |
West Glendive Summary
History
West Glendive is a small city located in eastern Montana, in the United States. It is the county seat of Dawson County and is located on the Yellowstone River. The city was founded in 1881 and was originally known as Glendive City. The city was named after the nearby Glendive Creek, which was named after the Scottish explorer, John Glendive.
The area around West Glendive was first inhabited by the Assiniboine and Sioux Native American tribes. The first white settlers arrived in the area in the late 1800s and began to establish homesteads. The city was officially incorporated in 1881 and was named after the nearby Glendive Creek.
The city quickly grew and became an important trading center for the surrounding area. The city was also an important stop on the Northern Pacific Railroad, which connected the city to the rest of the country.
In the early 1900s, the city experienced a period of growth and prosperity. The city was home to several businesses, including a flour mill, a creamery, a brewery, and a brickyard. The city also had a number of churches, schools, and other civic organizations.
In the late 1900s, the city began to experience a period of decline. The city’s population began to decline as people moved away in search of better economic opportunities. The city’s economy also suffered as the railroad industry declined.
Today, West Glendive is a small city with a population of about 3,000 people. The city is home to a number of small businesses, including a grocery store, a hardware store, and a few restaurants. The city is also home to a number of churches, schools, and other civic organizations.
Geography
West Glendive is located in eastern Montana, in the United States. The city is located on the Yellowstone River and is the county seat of Dawson County. The city is located in the Great Plains region of the United States and is surrounded by rolling hills and prairies.
The city has a total area of 2.2 square miles, all of which is land. The city has an elevation of 2,845 feet above sea level. The city is located in a semi-arid climate zone and experiences hot summers and cold winters.
Economy
West Glendive’s economy is largely based on agriculture and tourism. The city is home to a number of small businesses, including a grocery store, a hardware store, and a few restaurants. The city is also home to a number of churches, schools, and other civic organizations.
The city is also home to a number of agricultural businesses, including cattle ranches, wheat farms, and dairy farms. The city is also home to a number of oil and gas companies, which are involved in the exploration and production of oil and gas in the area.
The city is also home to a number of tourist attractions, including the Glendive Dinosaur and Fossil Museum, the Glendive Historical Museum, and the Glendive Water Park. The city is also home to a number of outdoor recreation areas, including the Glendive Wildlife Refuge and the Glendive State Park.
Demographics
As of the 2010 census, West Glendive had a population of 3,122 people. The city has a population density of 1,417 people per square mile. The city is predominantly white, with 87.3% of the population identifying as white. The city also has a small Hispanic population, with 5.3% of the population identifying as Hispanic or Latino.
The median household income in West Glendive is $41,944, and the median family income is $50,917. The city has a poverty rate of 17.3%, which is higher than the national average. The city also has a high unemployment rate, with 8.2% of the population being unemployed.
Common Questions
What is the Total Population of West Glendive?
Total Population of West Glendive is 1,912.
What is the Total Male Population of West Glendive?
Total Male Population of West Glendive is 962.
What is the Total Female Population of West Glendive?
Total Female Population of West Glendive is 950.
What is the Ratio of Males per 100 Females in West Glendive?
There are 101.26 Males per 100 Females in West Glendive.
What is the Ratio of Females per 100 Males in West Glendive?
There are 98.75 Females per 100 Males in West Glendive.
What is the Median Population Age in West Glendive?
Median Population Age in West Glendive is 35.5 Years.
What is the Average Family Size in West Glendive
Average Family Size in West Glendive is 2.8 People.
What is the Average Household Size in West Glendive
Average Household Size in West Glendive is 2.3 People.
What is Per Capita Income in West Glendive?
Per Capita income in West Glendive is $36,567.
What is the Median Family Income in West Glendive?
Median Family Income in West Glendive is $79,293.
What is the Median Household income in West Glendive?
Median Household Income in West Glendive is $66,725.
What is Income or Wage Gap in West Glendive?
Income or Wage Gap in West Glendive is 29.0%.
Women in West Glendive earn 71.0 cents for every dollar earned by a man.
What is Family Income Deficit in West Glendive?
Family Income Deficit in West Glendive is $11,261.
Families that are below poverty line in West Glendive earn $11,261 less on average than the poverty threshold level.
What is Inequality or Gini Index in West Glendive?
Inequality or Gini Index in West Glendive is 0.33.
How Large is the Labor Force in West Glendive?
There are 1,107 People in the Labor Forcein in West Glendive.
What is the Percentage of People in the Labor Force in West Glendive?
71.3% of People are in the Labor Force in West Glendive.
What is the Unemployment Rate in West Glendive?
Unemployment Rate in West Glendive is 2.4%.