Osgood, MO
Osgood Map
Osgood Overview
36
TOTAL POPULATION
26
MALE POPULATION
10
FEMALE POPULATION
260.00
MALES / 100 FEMALES
38.46
FEMALES / 100 MALES
21.5
MEDIAN AGE
6.2
AVG FAMILY SIZE
3.6
AVG HOUSEHOLD SIZE
$46,872
PER CAPITA INCOME
0.63
INEQUALITY / GINI INDEX
17
LABOR FORCE [ PEOPLE ]
77.3%
PERCENT IN LABOR FORCE
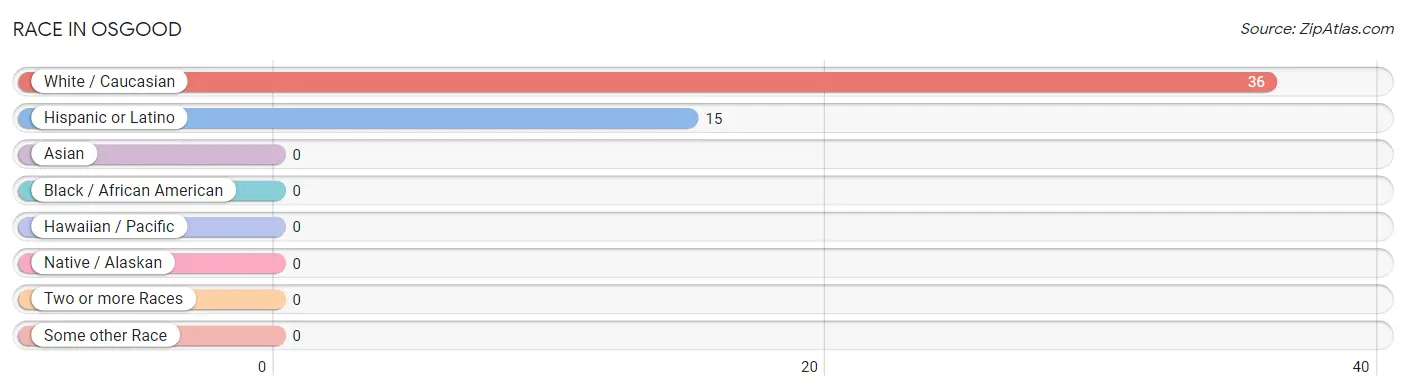
Race in Osgood
The most populous races in Osgood are White / Caucasian (36 | 100.0%), and Hispanic or Latino (15 | 41.7%).
| Race | # Population | % Population |
| Asian | 0 | 0.0% |
| Black / African American | 0 | 0.0% |
| Hawaiian / Pacific | 0 | 0.0% |
| Hispanic or Latino | 15 | 41.7% |
| Native / Alaskan | 0 | 0.0% |
| White / Caucasian | 36 | 100.0% |
| Two or more Races | 0 | 0.0% |
| Some other Race | 0 | 0.0% |
| Total | 36 | 100.0% |
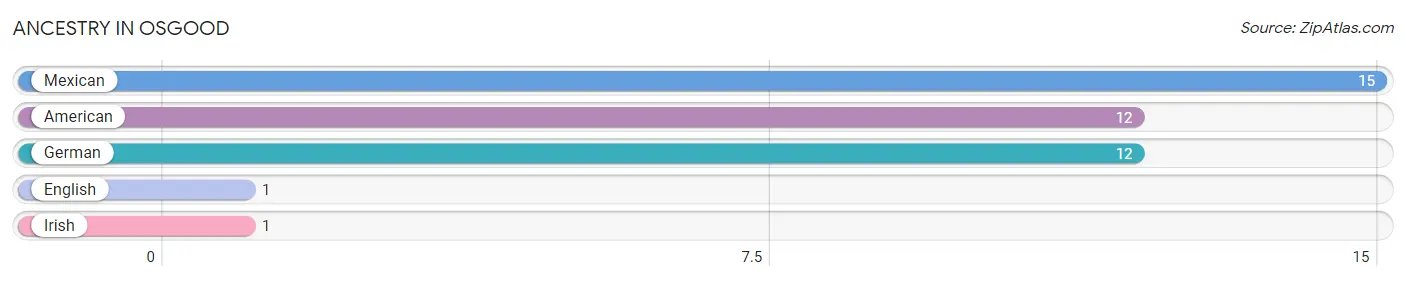
Ancestry in Osgood
The most populous ancestries reported in Osgood are Mexican (15 | 41.7%), American (12 | 33.3%), German (12 | 33.3%), English (1 | 2.8%), and Irish (1 | 2.8%), together accounting for 113.9% of all Osgood residents.
| Ancestry | # Population | % Population |
| American | 12 | 33.3% |
| English | 1 | 2.8% |
| German | 12 | 33.3% |
| Irish | 1 | 2.8% |
| Mexican | 15 | 41.7% | View All 5 Rows |
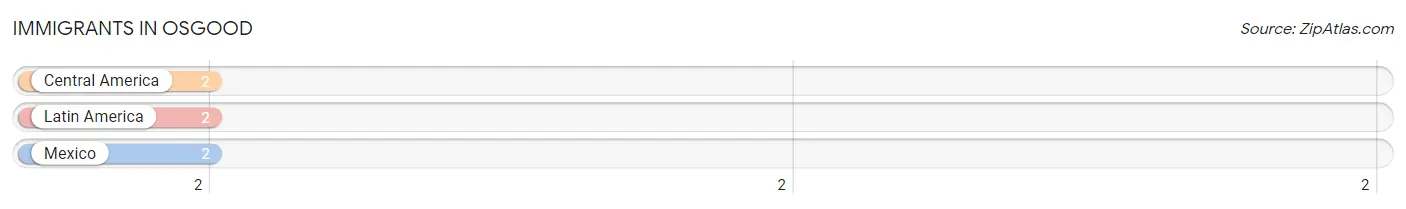
Immigrants in Osgood
The most numerous immigrant groups reported in Osgood came from Central America (2 | 5.6%), Latin America (2 | 5.6%), and Mexico (2 | 5.6%), together accounting for 16.7% of all Osgood residents.
| Immigration Origin | # Population | % Population |
| Central America | 2 | 5.6% |
| Latin America | 2 | 5.6% |
| Mexico | 2 | 5.6% | View All 3 Rows |
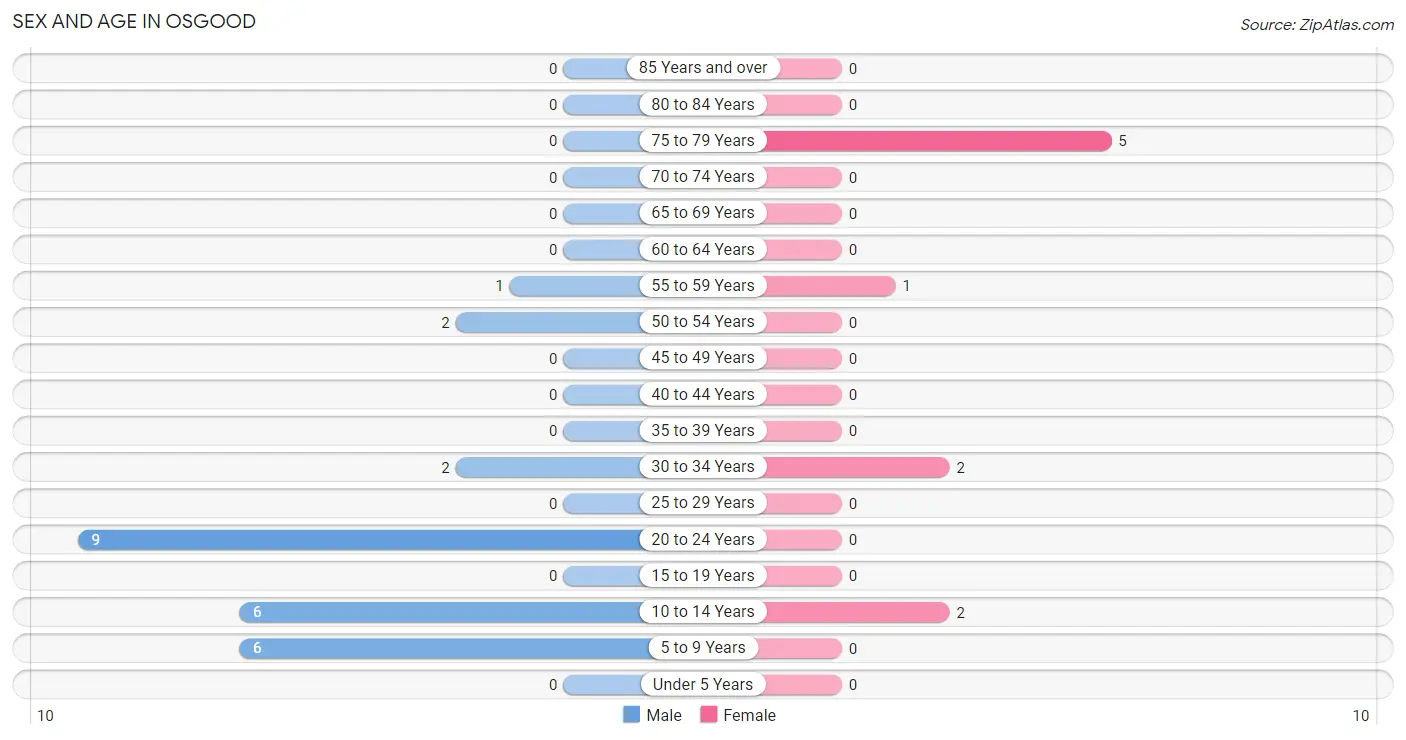
Sex and Age in Osgood
Sex and Age in Osgood
The most populous age groups in Osgood are 20 to 24 Years (9 | 34.6%) for men and 75 to 79 Years (5 | 50.0%) for women.
| Age Bracket | Male | Female |
| Under 5 Years | 0 (0.0%) | 0 (0.0%) |
| 5 to 9 Years | 6 (23.1%) | 0 (0.0%) |
| 10 to 14 Years | 6 (23.1%) | 2 (20.0%) |
| 15 to 19 Years | 0 (0.0%) | 0 (0.0%) |
| 20 to 24 Years | 9 (34.6%) | 0 (0.0%) |
| 25 to 29 Years | 0 (0.0%) | 0 (0.0%) |
| 30 to 34 Years | 2 (7.7%) | 2 (20.0%) |
| 35 to 39 Years | 0 (0.0%) | 0 (0.0%) |
| 40 to 44 Years | 0 (0.0%) | 0 (0.0%) |
| 45 to 49 Years | 0 (0.0%) | 0 (0.0%) |
| 50 to 54 Years | 2 (7.7%) | 0 (0.0%) |
| 55 to 59 Years | 1 (3.8%) | 1 (10.0%) |
| 60 to 64 Years | 0 (0.0%) | 0 (0.0%) |
| 65 to 69 Years | 0 (0.0%) | 0 (0.0%) |
| 70 to 74 Years | 0 (0.0%) | 0 (0.0%) |
| 75 to 79 Years | 0 (0.0%) | 5 (50.0%) |
| 80 to 84 Years | 0 (0.0%) | 0 (0.0%) |
| 85 Years and over | 0 (0.0%) | 0 (0.0%) |
| Total | 26 (100.0%) | 10 (100.0%) |
Families and Households in Osgood
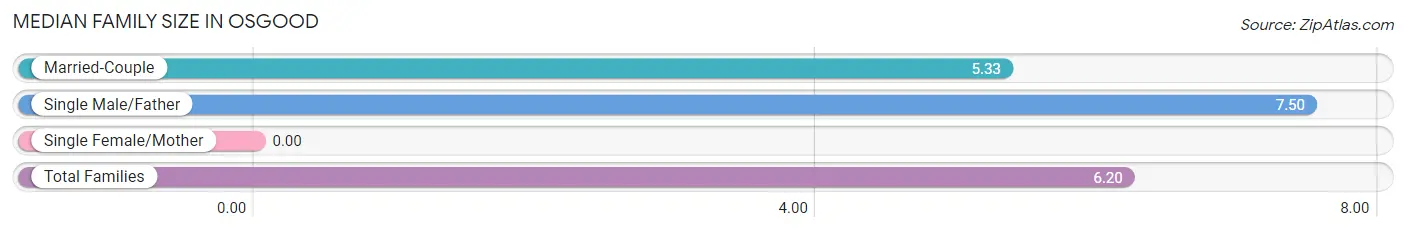
Median Family Size in Osgood
| Family Type | # Families | Family Size |
| Married-Couple | 3 (60.0%) | 5.33 |
| Single Male/Father | 2 (40.0%) | 7.50 |
| Single Female/Mother | 0 (0.0%) | - |
| Total Families | 5 (100.0%) | 6.20 |
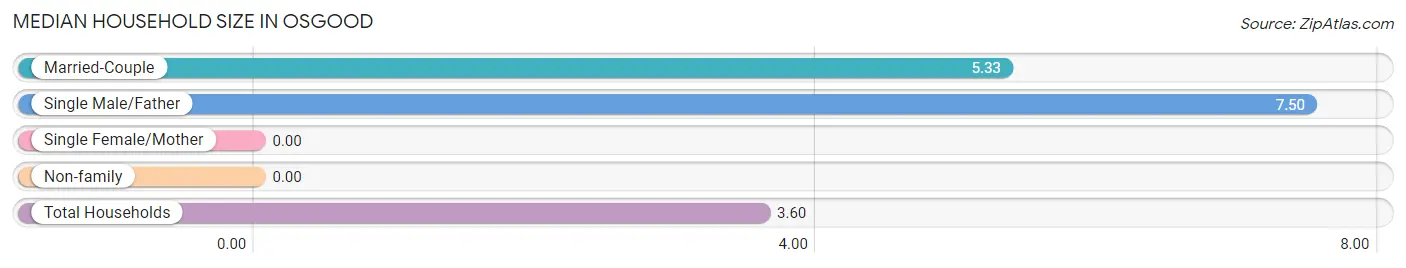
Median Household Size in Osgood
| Household Type | # Households | Household Size |
| Married-Couple | 3 (30.0%) | 5.33 |
| Single Male/Father | 2 (20.0%) | 7.50 |
| Single Female/Mother | 0 (0.0%) | - |
| Non-family | 5 (50.0%) | - |
| Total Households | 10 (100.0%) | 3.60 |
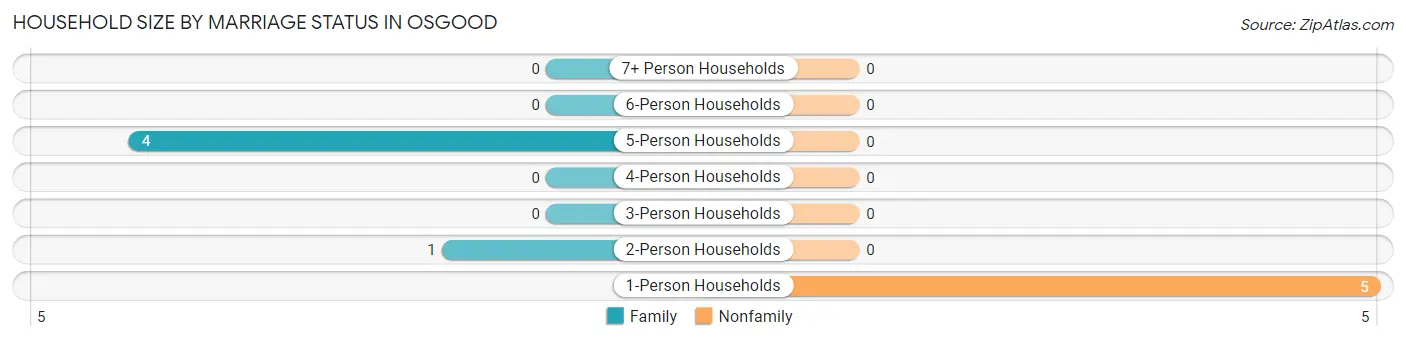
Household Size by Marriage Status in Osgood
Out of a total of 10 households in Osgood, 5 (50.0%) are family households, while 5 (50.0%) are nonfamily households. The most numerous type of family households are 5-person households, comprising 4, and the most common type of nonfamily households are 1-person households, comprising 5.
| Household Size | Family Households | Nonfamily Households |
| 1-Person Households | - | 5 (50.0%) |
| 2-Person Households | 1 (10.0%) | 0 (0.0%) |
| 3-Person Households | 0 (0.0%) | 0 (0.0%) |
| 4-Person Households | 0 (0.0%) | 0 (0.0%) |
| 5-Person Households | 4 (40.0%) | 0 (0.0%) |
| 6-Person Households | 0 (0.0%) | 0 (0.0%) |
| 7+ Person Households | 0 (0.0%) | 0 (0.0%) |
| Total | 5 (50.0%) | 5 (50.0%) |
Female Fertility in Osgood
Fertility by Age in Osgood
| Age Bracket | Women with Births | Births / 1,000 Women |
| 15 to 19 years | 0 (0.0%) | 0.0 |
| 20 to 34 years | 0 (0.0%) | 0.0 |
| 35 to 50 years | 0 (0.0%) | 0.0 |
| Total | 0 (0.0%) | 0.0 |
Fertility by Age by Marriage Status in Osgood
| Age Bracket | Married | Unmarried |
| 15 to 19 years | 0 (0.0%) | 0 (0.0%) |
| 20 to 34 years | 0 (0.0%) | 0 (0.0%) |
| 35 to 50 years | 0 (0.0%) | 0 (0.0%) |
| Total | 0 (0.0%) | 0 (0.0%) |
Fertility by Education in Osgood
| Educational Attainment | Women with Births | Births / 1,000 Women |
| Less than High School | 0 (0.0%) | 0.0 |
| High School Diploma | 0 (0.0%) | 0.0 |
| College or Associate's Degree | 0 (0.0%) | 0.0 |
| Bachelor's Degree | 0 (0.0%) | 0.0 |
| Graduate Degree | 0 (0.0%) | 0.0 |
| Total | 0 (0.0%) | 0.0 |
Fertility by Education by Marriage Status in Osgood
| Educational Attainment | Married | Unmarried |
| Less than High School | 0 (0.0%) | 0 (0.0%) |
| High School Diploma | 0 (0.0%) | 0 (0.0%) |
| College or Associate's Degree | 0 (0.0%) | 0 (0.0%) |
| Bachelor's Degree | 0 (0.0%) | 0 (0.0%) |
| Graduate Degree | 0 (0.0%) | 0 (0.0%) |
| Total | 0 (0.0%) | 0 (0.0%) |
Income in Osgood
Income Overview in Osgood
| Characteristic | Number | Measure |
| Per Capita Income | 36 | $46,872 |
| Median Family Income | 5 | $0 |
| Mean Family Income | 5 | $290,880 |
| Median Household Income | 10 | $0 |
| Mean Household Income | 10 | $155,310 |
| Income Deficit | 5 | $0 |
| Wage / Income Gap (%) | 36 | 0.00% |
| Wage / Income Gap ($) | 36 | 100.00¢ per $1 |
| Gini / Inequality Index | 36 | 0.63 |
Earnings by Sex in Osgood
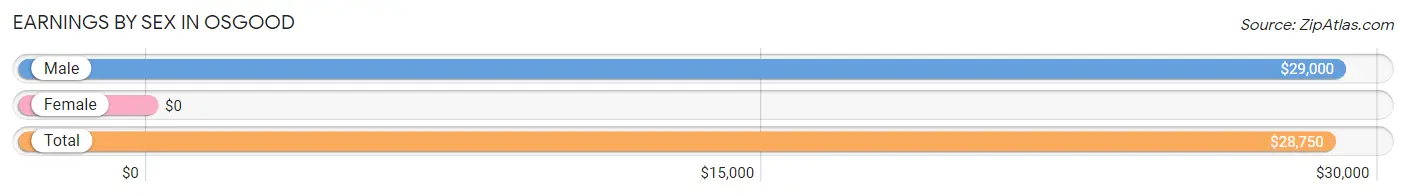
| Sex | Number | Average Earnings |
| Male | 14 (82.4%) | $29,000 |
| Female | 3 (17.6%) | $0 |
| Total | 17 (100.0%) | $28,750 |
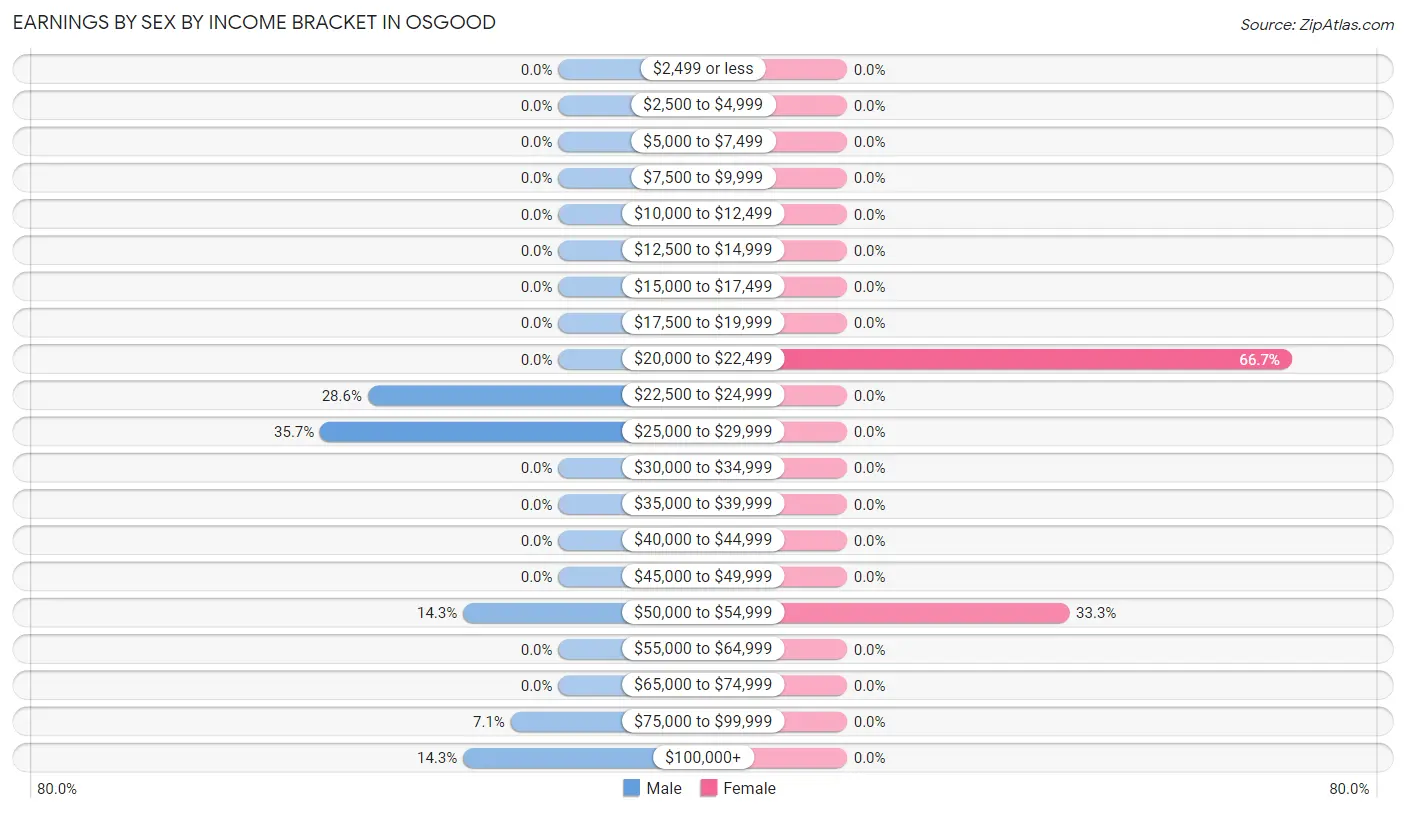
Earnings by Sex by Income Bracket in Osgood
The most common earnings brackets in Osgood are $25,000 to $29,999 for men (5 | 35.7%) and $20,000 to $22,499 for women (2 | 66.7%).
| Income | Male | Female |
| $2,499 or less | 0 (0.0%) | 0 (0.0%) |
| $2,500 to $4,999 | 0 (0.0%) | 0 (0.0%) |
| $5,000 to $7,499 | 0 (0.0%) | 0 (0.0%) |
| $7,500 to $9,999 | 0 (0.0%) | 0 (0.0%) |
| $10,000 to $12,499 | 0 (0.0%) | 0 (0.0%) |
| $12,500 to $14,999 | 0 (0.0%) | 0 (0.0%) |
| $15,000 to $17,499 | 0 (0.0%) | 0 (0.0%) |
| $17,500 to $19,999 | 0 (0.0%) | 0 (0.0%) |
| $20,000 to $22,499 | 0 (0.0%) | 2 (66.7%) |
| $22,500 to $24,999 | 4 (28.6%) | 0 (0.0%) |
| $25,000 to $29,999 | 5 (35.7%) | 0 (0.0%) |
| $30,000 to $34,999 | 0 (0.0%) | 0 (0.0%) |
| $35,000 to $39,999 | 0 (0.0%) | 0 (0.0%) |
| $40,000 to $44,999 | 0 (0.0%) | 0 (0.0%) |
| $45,000 to $49,999 | 0 (0.0%) | 0 (0.0%) |
| $50,000 to $54,999 | 2 (14.3%) | 1 (33.3%) |
| $55,000 to $64,999 | 0 (0.0%) | 0 (0.0%) |
| $65,000 to $74,999 | 0 (0.0%) | 0 (0.0%) |
| $75,000 to $99,999 | 1 (7.1%) | 0 (0.0%) |
| $100,000+ | 2 (14.3%) | 0 (0.0%) |
| Total | 14 (100.0%) | 3 (100.0%) |
Earnings by Sex by Educational Attainment in Osgood
| Educational Attainment | Male Income | Female Income |
| Less than High School | - | - |
| High School Diploma | - | - |
| College or Associate's Degree | - | - |
| Bachelor's Degree | - | - |
| Graduate Degree | - | - |
| Total | - | - |
Family Income in Osgood
Family Income Brackets in Osgood
According to the Osgood family income data, there are 2 families falling into the $75,000 to $99,999 income range, which is the most common income bracket and makes up 40.0% of all families.
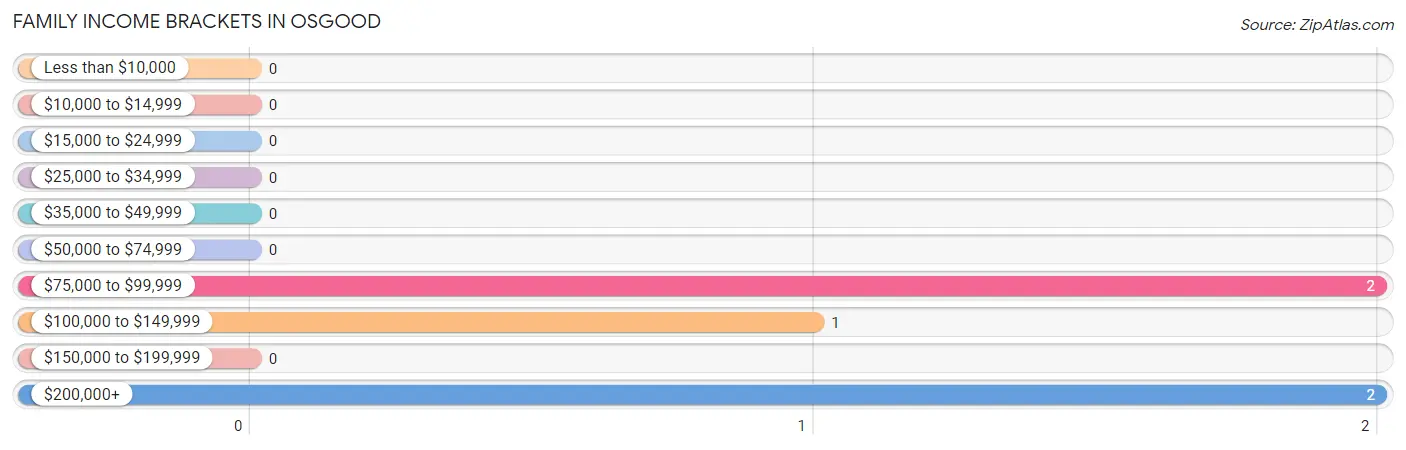
| Income Bracket | # Families | % Families |
| Less than $10,000 | 0 | 0.0% |
| $10,000 to $14,999 | 0 | 0.0% |
| $15,000 to $24,999 | 0 | 0.0% |
| $25,000 to $34,999 | 0 | 0.0% |
| $35,000 to $49,999 | 0 | 0.0% |
| $50,000 to $74,999 | 0 | 0.0% |
| $75,000 to $99,999 | 2 | 40.0% |
| $100,000 to $149,999 | 1 | 20.0% |
| $150,000 to $199,999 | 0 | 0.0% |
| $200,000+ | 2 | 40.0% |
Family Income by Famaliy Size in Osgood
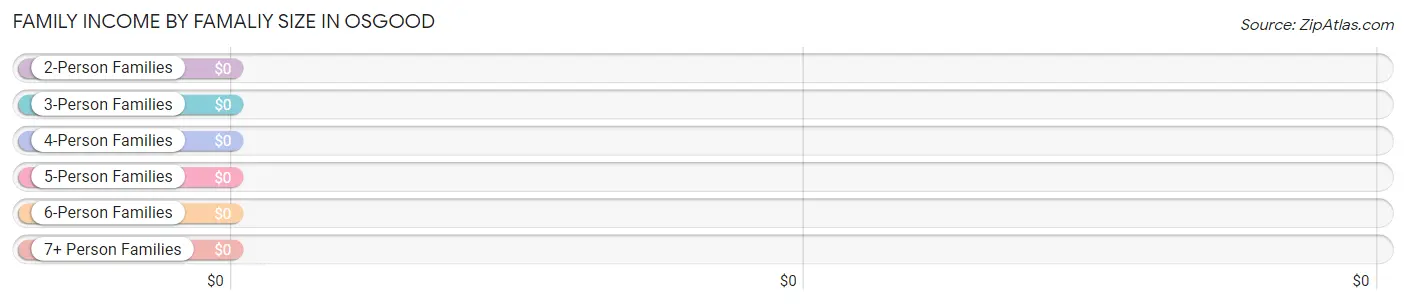
| Income Bracket | # Families | Median Income |
| 2-Person Families | 1 (20.0%) | $0 |
| 3-Person Families | 0 (0.0%) | $0 |
| 4-Person Families | 0 (0.0%) | $0 |
| 5-Person Families | 4 (80.0%) | $0 |
| 6-Person Families | 0 (0.0%) | $0 |
| 7+ Person Families | 0 (0.0%) | $0 |
| Total | 5 (100.0%) | $0 |
Family Income by Number of Earners in Osgood
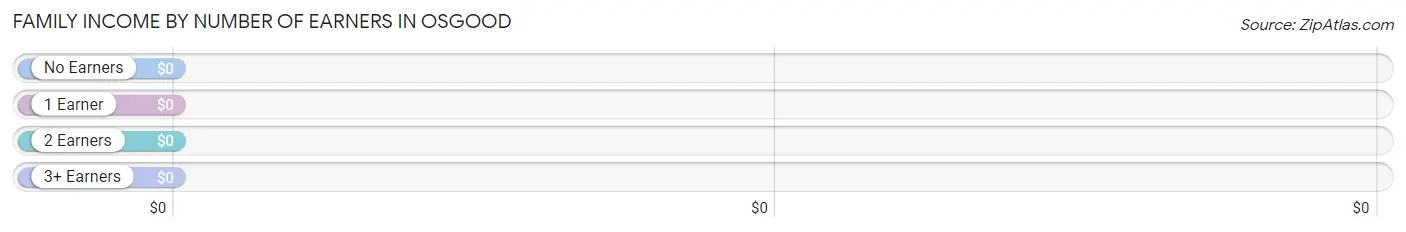
| Number of Earners | # Families | Median Income |
| No Earners | 0 (0.0%) | $0 |
| 1 Earner | 0 (0.0%) | $0 |
| 2 Earners | 3 (60.0%) | $0 |
| 3+ Earners | 2 (40.0%) | $0 |
| Total | 5 (100.0%) | $0 |
Household Income in Osgood
Household Income Brackets in Osgood
With 5 households falling in the category, the $15,000 to $24,999 income range is the most frequent in Osgood, accounting for 50.0% of all households.
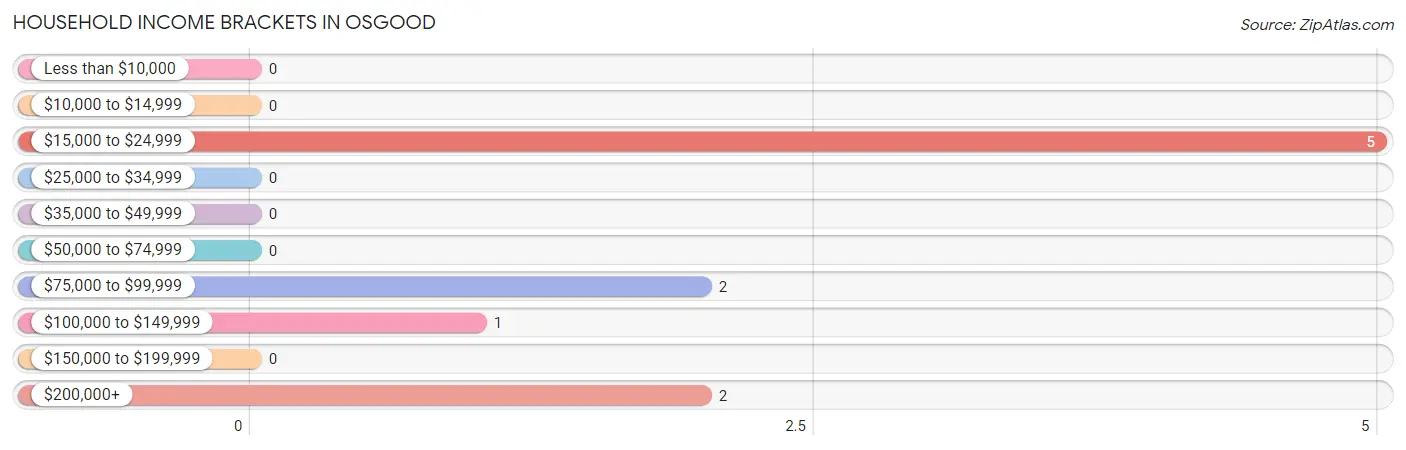
| Income Bracket | # Households | % Households |
| Less than $10,000 | 0 | 0.0% |
| $10,000 to $14,999 | 0 | 0.0% |
| $15,000 to $24,999 | 5 | 50.0% |
| $25,000 to $34,999 | 0 | 0.0% |
| $35,000 to $49,999 | 0 | 0.0% |
| $50,000 to $74,999 | 0 | 0.0% |
| $75,000 to $99,999 | 2 | 20.0% |
| $100,000 to $149,999 | 1 | 10.0% |
| $150,000 to $199,999 | 0 | 0.0% |
| $200,000+ | 2 | 20.0% |
Household Income by Householder Age in Osgood

| Income Bracket | # Households | Median Income |
| 15 to 24 Years | 0 (0.0%) | $0 |
| 25 to 44 Years | 2 (20.0%) | $0 |
| 45 to 64 Years | 3 (30.0%) | $0 |
| 65+ Years | 5 (50.0%) | $0 |
| Total | 10 (100.0%) | $0 |
Poverty in Osgood
Income Below Poverty by Sex and Age in Osgood
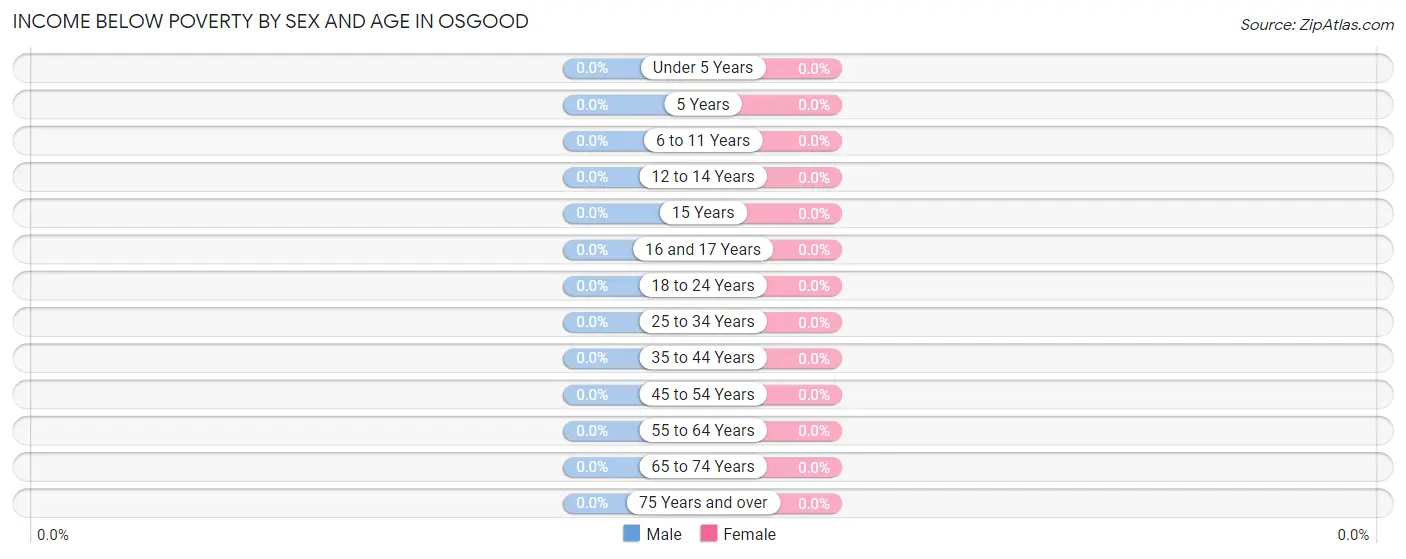
| Age Bracket | Male | Female |
| Under 5 Years | 0 (0.0%) | 0 (0.0%) |
| 5 Years | 0 (0.0%) | 0 (0.0%) |
| 6 to 11 Years | 0 (0.0%) | 0 (0.0%) |
| 12 to 14 Years | 0 (0.0%) | 0 (0.0%) |
| 15 Years | 0 (0.0%) | 0 (0.0%) |
| 16 and 17 Years | 0 (0.0%) | 0 (0.0%) |
| 18 to 24 Years | 0 (0.0%) | 0 (0.0%) |
| 25 to 34 Years | 0 (0.0%) | 0 (0.0%) |
| 35 to 44 Years | 0 (0.0%) | 0 (0.0%) |
| 45 to 54 Years | 0 (0.0%) | 0 (0.0%) |
| 55 to 64 Years | 0 (0.0%) | 0 (0.0%) |
| 65 to 74 Years | 0 (0.0%) | 0 (0.0%) |
| 75 Years and over | 0 (0.0%) | 0 (0.0%) |
| Total | 0 (0.0%) | 0 (0.0%) |
Income Above Poverty by Sex and Age in Osgood
According to the poverty statistics in Osgood, males aged 5 years and females aged 6 to 11 years are the age groups that are most secure financially, with 100.0% of males and 100.0% of females in these age groups living above the poverty line.
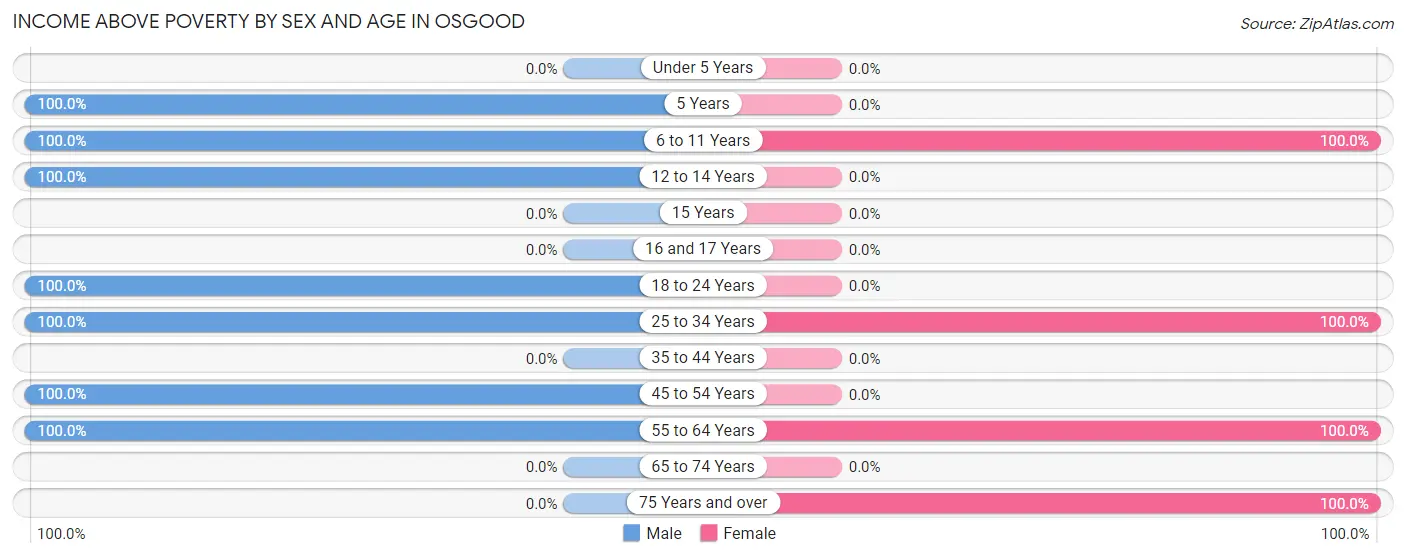
| Age Bracket | Male | Female |
| Under 5 Years | 0 (0.0%) | 0 (0.0%) |
| 5 Years | 4 (100.0%) | 0 (0.0%) |
| 6 to 11 Years | 5 (100.0%) | 2 (100.0%) |
| 12 to 14 Years | 3 (100.0%) | 0 (0.0%) |
| 15 Years | 0 (0.0%) | 0 (0.0%) |
| 16 and 17 Years | 0 (0.0%) | 0 (0.0%) |
| 18 to 24 Years | 9 (100.0%) | 0 (0.0%) |
| 25 to 34 Years | 2 (100.0%) | 2 (100.0%) |
| 35 to 44 Years | 0 (0.0%) | 0 (0.0%) |
| 45 to 54 Years | 2 (100.0%) | 0 (0.0%) |
| 55 to 64 Years | 1 (100.0%) | 1 (100.0%) |
| 65 to 74 Years | 0 (0.0%) | 0 (0.0%) |
| 75 Years and over | 0 (0.0%) | 5 (100.0%) |
| Total | 26 (100.0%) | 10 (100.0%) |
Income Below Poverty Among Married-Couple Families in Osgood
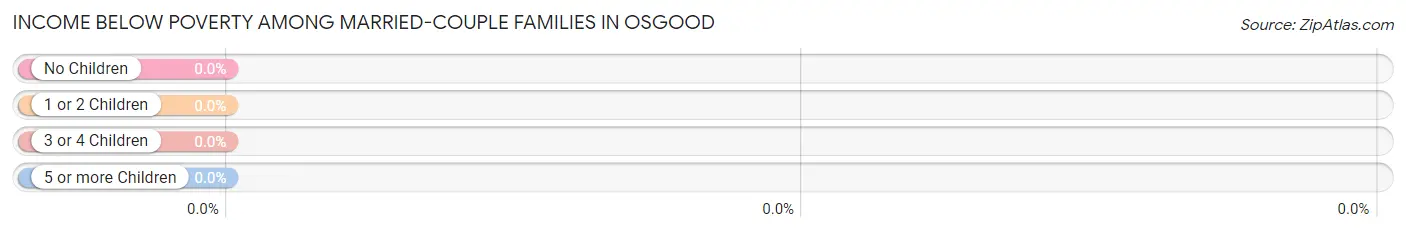
| Children | Above Poverty | Below Poverty |
| No Children | 1 (100.0%) | 0 (0.0%) |
| 1 or 2 Children | 0 (0.0%) | 0 (0.0%) |
| 3 or 4 Children | 2 (100.0%) | 0 (0.0%) |
| 5 or more Children | 0 (0.0%) | 0 (0.0%) |
| Total | 3 (100.0%) | 0 (0.0%) |
Income Below Poverty Among Single-Parent Households in Osgood
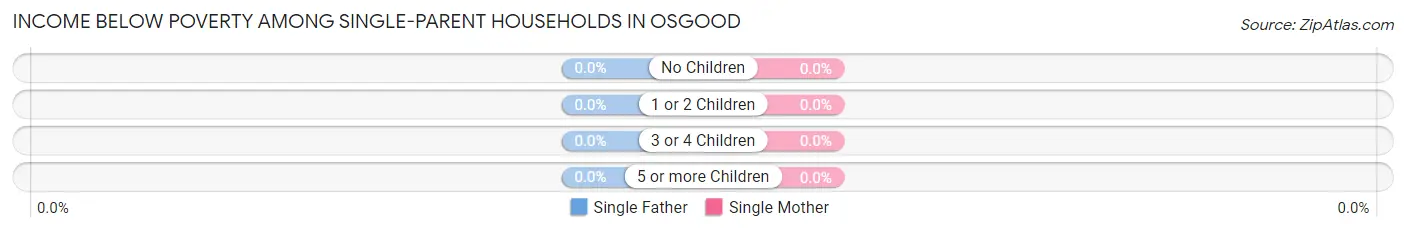
| Children | Single Father | Single Mother |
| No Children | 0 (0.0%) | 0 (0.0%) |
| 1 or 2 Children | 0 (0.0%) | 0 (0.0%) |
| 3 or 4 Children | 0 (0.0%) | 0 (0.0%) |
| 5 or more Children | 0 (0.0%) | 0 (0.0%) |
| Total | 0 (0.0%) | 0 (0.0%) |
Income Below Poverty Among Married-Couple vs Single-Parent Households in Osgood
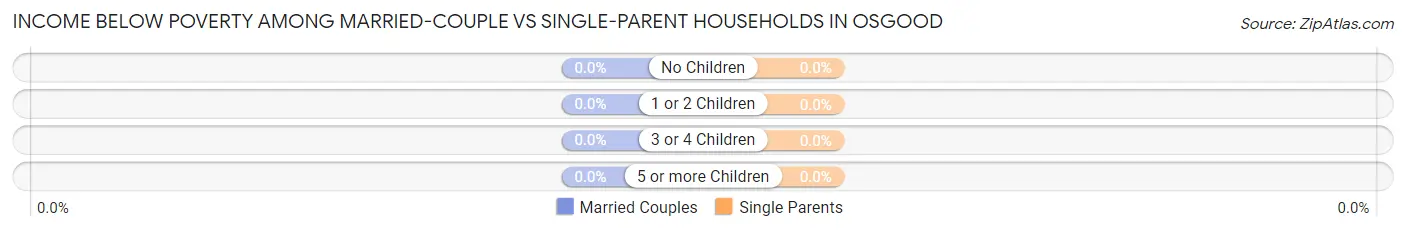
| Children | Married-Couple Families | Single-Parent Households |
| No Children | 0 (0.0%) | 0 (0.0%) |
| 1 or 2 Children | 0 (0.0%) | 0 (0.0%) |
| 3 or 4 Children | 0 (0.0%) | 0 (0.0%) |
| 5 or more Children | 0 (0.0%) | 0 (0.0%) |
| Total | 0 (0.0%) | 0 (0.0%) |
Employment Characteristics in Osgood
Employment by Class of Employer in Osgood
Among the 17 employed individuals in Osgood, private company employees (15 | 88.2%), and local government employees (2 | 11.8%) make up the most common classes of employment.

| Employer Class | # Employees | % Employees |
| Private Company Employees | 15 | 88.2% |
| Self-Employed (Incorporated) | 0 | 0.0% |
| Self-Employed (Not Incorporated) | 0 | 0.0% |
| Not-for-profit Organizations | 0 | 0.0% |
| Local Government Employees | 2 | 11.8% |
| State Government Employees | 0 | 0.0% |
| Federal Government Employees | 0 | 0.0% |
| Unpaid Family Workers | 0 | 0.0% |
| Total | 17 | 100.0% |
Employment Status by Age in Osgood
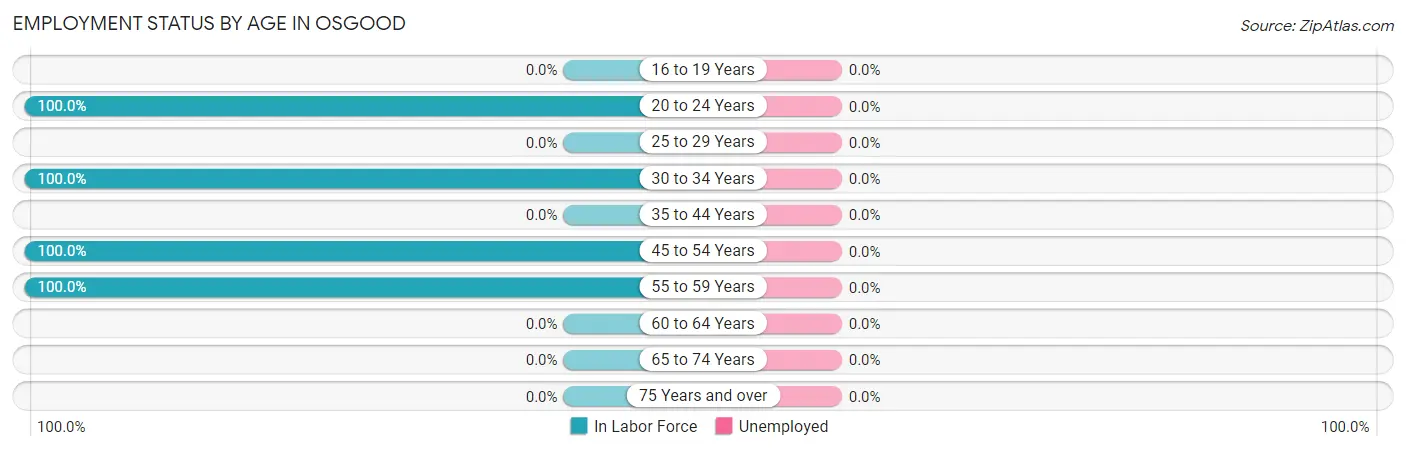
| Age Bracket | In Labor Force | Unemployed |
| 16 to 19 Years | 0 (0.0%) | 0 (0.0%) |
| 20 to 24 Years | 9 (100.0%) | 0 (0.0%) |
| 25 to 29 Years | 0 (0.0%) | 0 (0.0%) |
| 30 to 34 Years | 4 (100.0%) | 0 (0.0%) |
| 35 to 44 Years | 0 (0.0%) | 0 (0.0%) |
| 45 to 54 Years | 2 (100.0%) | 0 (0.0%) |
| 55 to 59 Years | 2 (100.0%) | 0 (0.0%) |
| 60 to 64 Years | 0 (0.0%) | 0 (0.0%) |
| 65 to 74 Years | 0 (0.0%) | 0 (0.0%) |
| 75 Years and over | 0 (0.0%) | 0 (0.0%) |
| Total | 17 (77.3%) | 0 (0.0%) |
Employment Status by Educational Attainment in Osgood
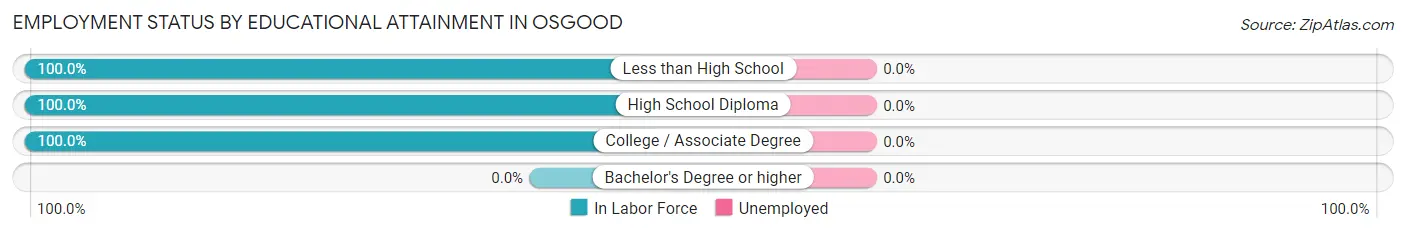
| Educational Attainment | In Labor Force | Unemployed |
| Less than High School | 2 (100.0%) | 0 (0.0%) |
| High School Diploma | 3 (100.0%) | 0 (0.0%) |
| College / Associate Degree | 3 (100.0%) | 0 (0.0%) |
| Bachelor's Degree or higher | 0 (0.0%) | 0 (0.0%) |
| Total | 8 (100.0%) | 0 (0.0%) |
Employment Occupations by Sex in Osgood
Management, Business, Science and Arts Occupations
The most common Management, Business, Science and Arts occupations in Osgood are Management (2 | 11.8%), Community & Social Service (2 | 11.8%), and Legal Services & Support (2 | 11.8%).
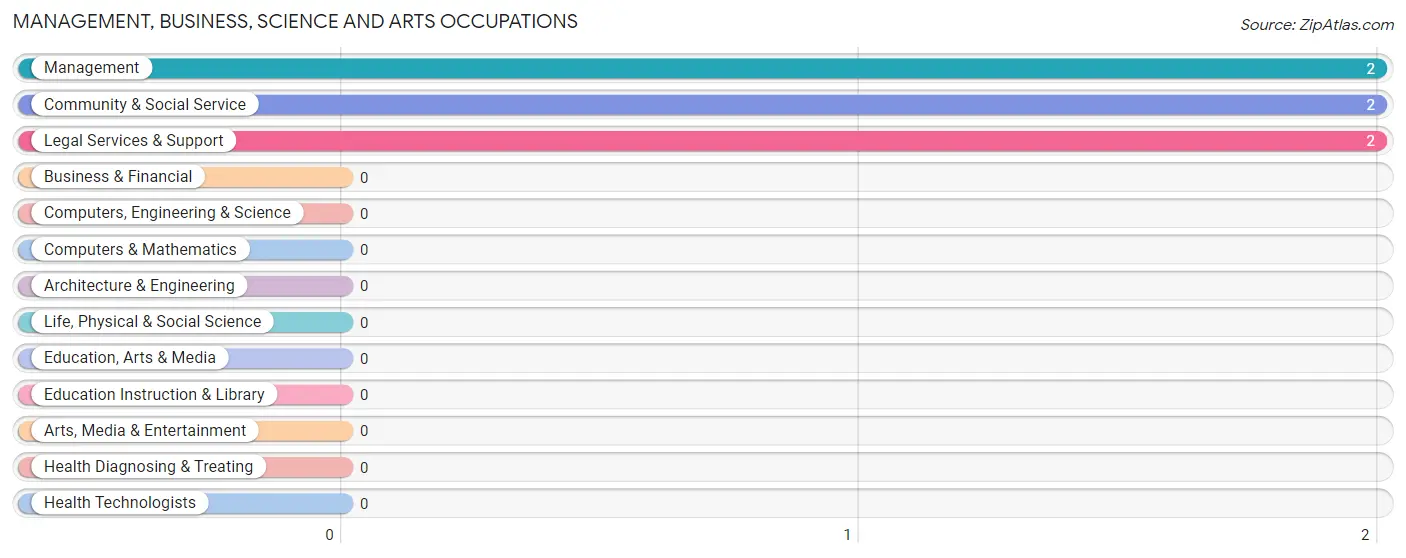
Management, Business, Science and Arts Occupations by Sex
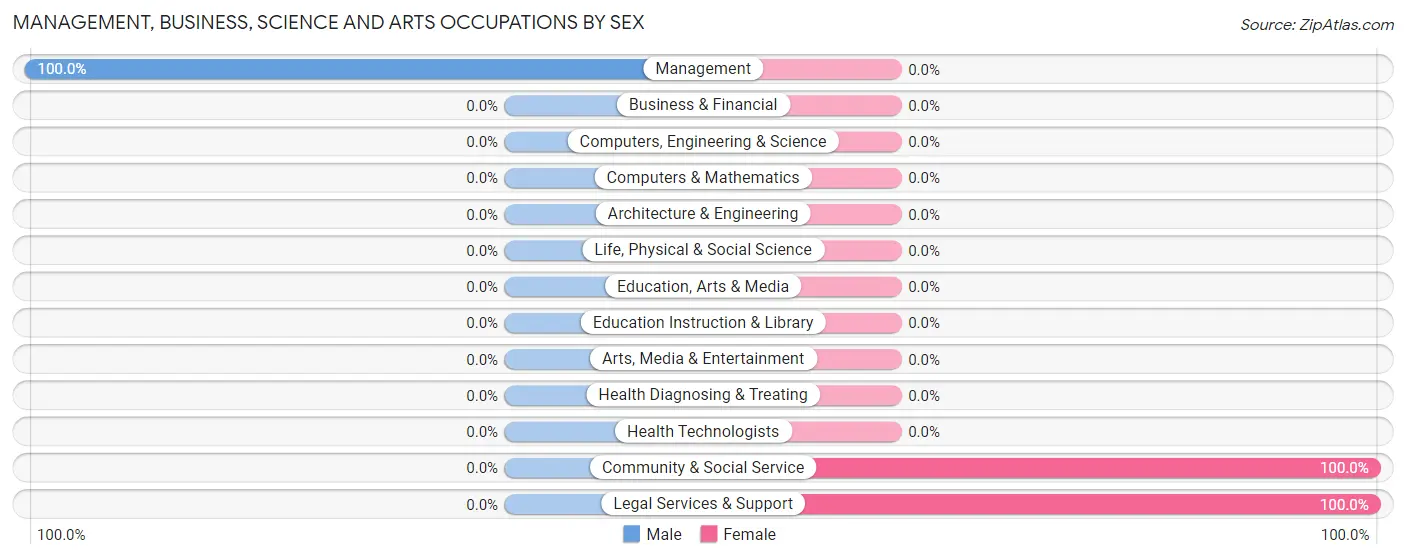
| Occupation | Male | Female |
| Management | 2 (100.0%) | 0 (0.0%) |
| Business & Financial | 0 (0.0%) | 0 (0.0%) |
| Computers, Engineering & Science | 0 (0.0%) | 0 (0.0%) |
| Computers & Mathematics | 0 (0.0%) | 0 (0.0%) |
| Architecture & Engineering | 0 (0.0%) | 0 (0.0%) |
| Life, Physical & Social Science | 0 (0.0%) | 0 (0.0%) |
| Community & Social Service | 0 (0.0%) | 2 (100.0%) |
| Education, Arts & Media | 0 (0.0%) | 0 (0.0%) |
| Legal Services & Support | 0 (0.0%) | 2 (100.0%) |
| Education Instruction & Library | 0 (0.0%) | 0 (0.0%) |
| Arts, Media & Entertainment | 0 (0.0%) | 0 (0.0%) |
| Health Diagnosing & Treating | 0 (0.0%) | 0 (0.0%) |
| Health Technologists | 0 (0.0%) | 0 (0.0%) |
| Total (Category) | 2 (50.0%) | 2 (50.0%) |
| Total (Overall) | 14 (82.4%) | 3 (17.6%) |
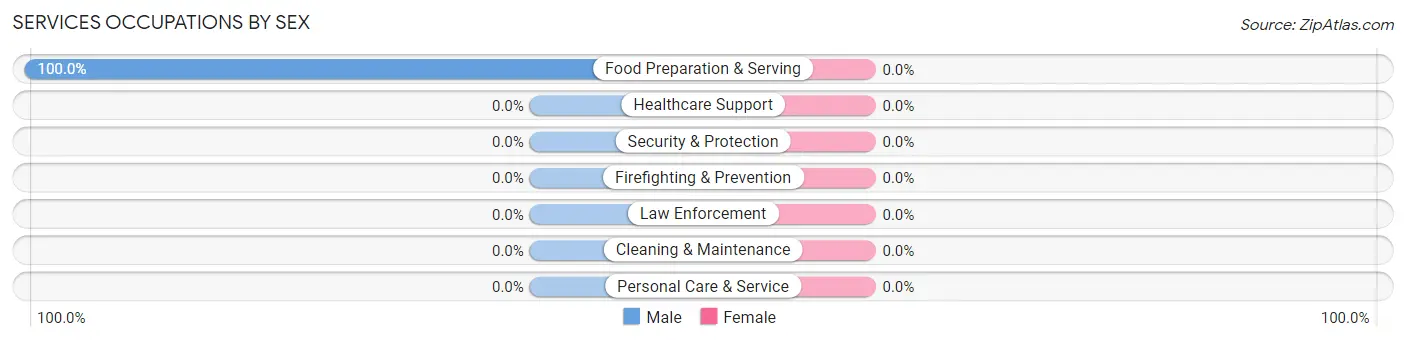
Services Occupations
The most common Services occupations in Osgood are , and Food Preparation & Serving (4 | 23.5%).
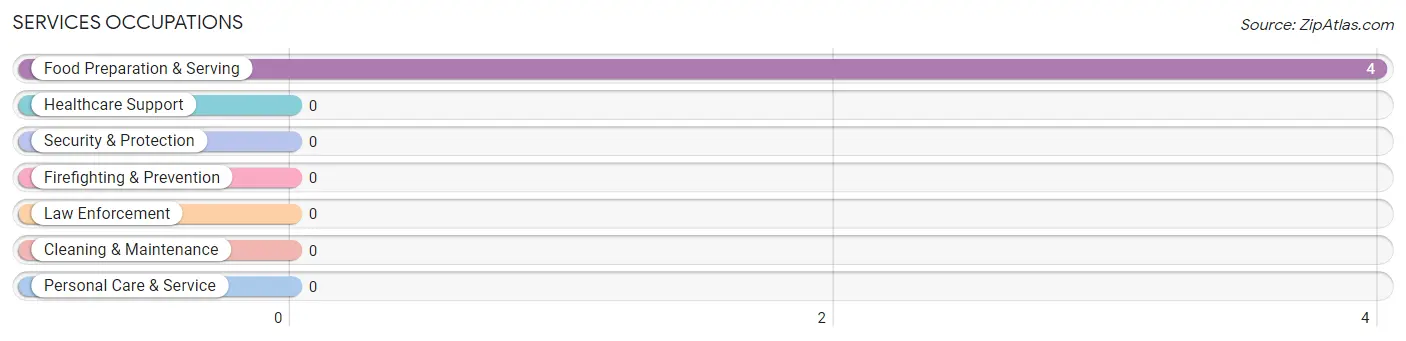
Services Occupations by Sex
| Occupation | Male | Female |
| Healthcare Support | 0 (0.0%) | 0 (0.0%) |
| Security & Protection | 0 (0.0%) | 0 (0.0%) |
| Firefighting & Prevention | 0 (0.0%) | 0 (0.0%) |
| Law Enforcement | 0 (0.0%) | 0 (0.0%) |
| Food Preparation & Serving | 4 (100.0%) | 0 (0.0%) |
| Cleaning & Maintenance | 0 (0.0%) | 0 (0.0%) |
| Personal Care & Service | 0 (0.0%) | 0 (0.0%) |
| Total (Category) | 4 (100.0%) | 0 (0.0%) |
| Total (Overall) | 14 (82.4%) | 3 (17.6%) |
Sales and Office Occupations
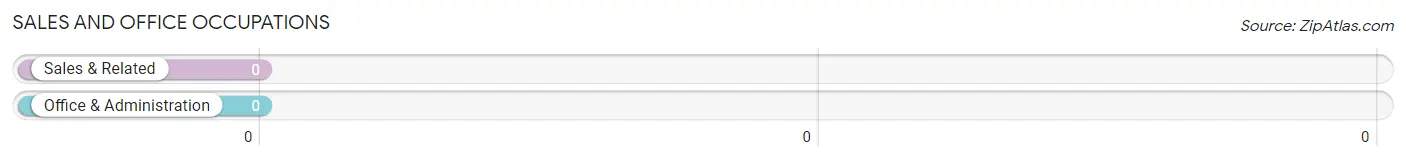
Sales and Office Occupations by Sex

| Occupation | Male | Female |
| Sales & Related | 0 (0.0%) | 0 (0.0%) |
| Office & Administration | 0 (0.0%) | 0 (0.0%) |
| Total (Category) | 0 (0.0%) | 0 (0.0%) |
| Total (Overall) | 14 (82.4%) | 3 (17.6%) |
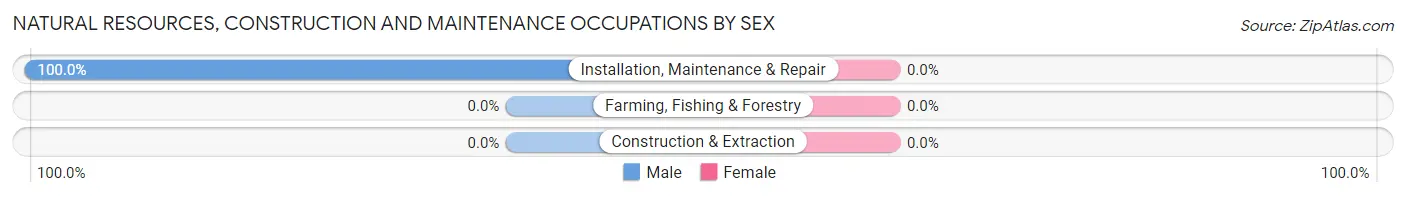
Natural Resources, Construction and Maintenance Occupations
The most common Natural Resources, Construction and Maintenance occupations in Osgood are , and Installation, Maintenance & Repair (7 | 41.2%).

Natural Resources, Construction and Maintenance Occupations by Sex
| Occupation | Male | Female |
| Farming, Fishing & Forestry | 0 (0.0%) | 0 (0.0%) |
| Construction & Extraction | 0 (0.0%) | 0 (0.0%) |
| Installation, Maintenance & Repair | 7 (100.0%) | 0 (0.0%) |
| Total (Category) | 7 (100.0%) | 0 (0.0%) |
| Total (Overall) | 14 (82.4%) | 3 (17.6%) |
Production, Transportation and Moving Occupations
The most common Production, Transportation and Moving occupations in Osgood are , and Production (2 | 11.8%).
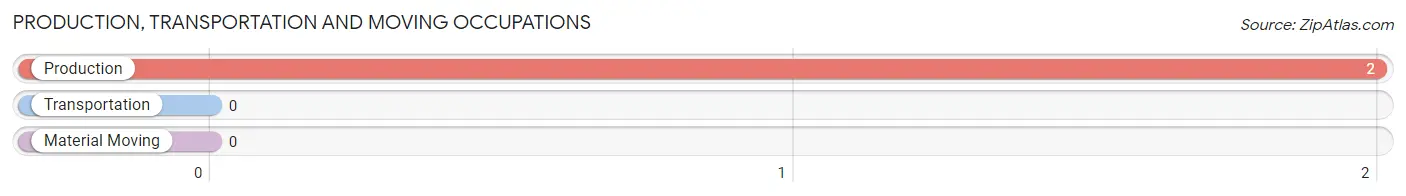
Production, Transportation and Moving Occupations by Sex
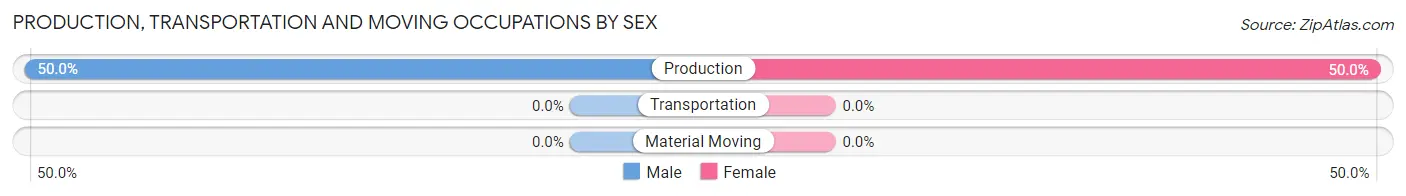
| Occupation | Male | Female |
| Production | 1 (50.0%) | 1 (50.0%) |
| Transportation | 0 (0.0%) | 0 (0.0%) |
| Material Moving | 0 (0.0%) | 0 (0.0%) |
| Total (Category) | 1 (50.0%) | 1 (50.0%) |
| Total (Overall) | 14 (82.4%) | 3 (17.6%) |
Employment Industries by Sex in Osgood
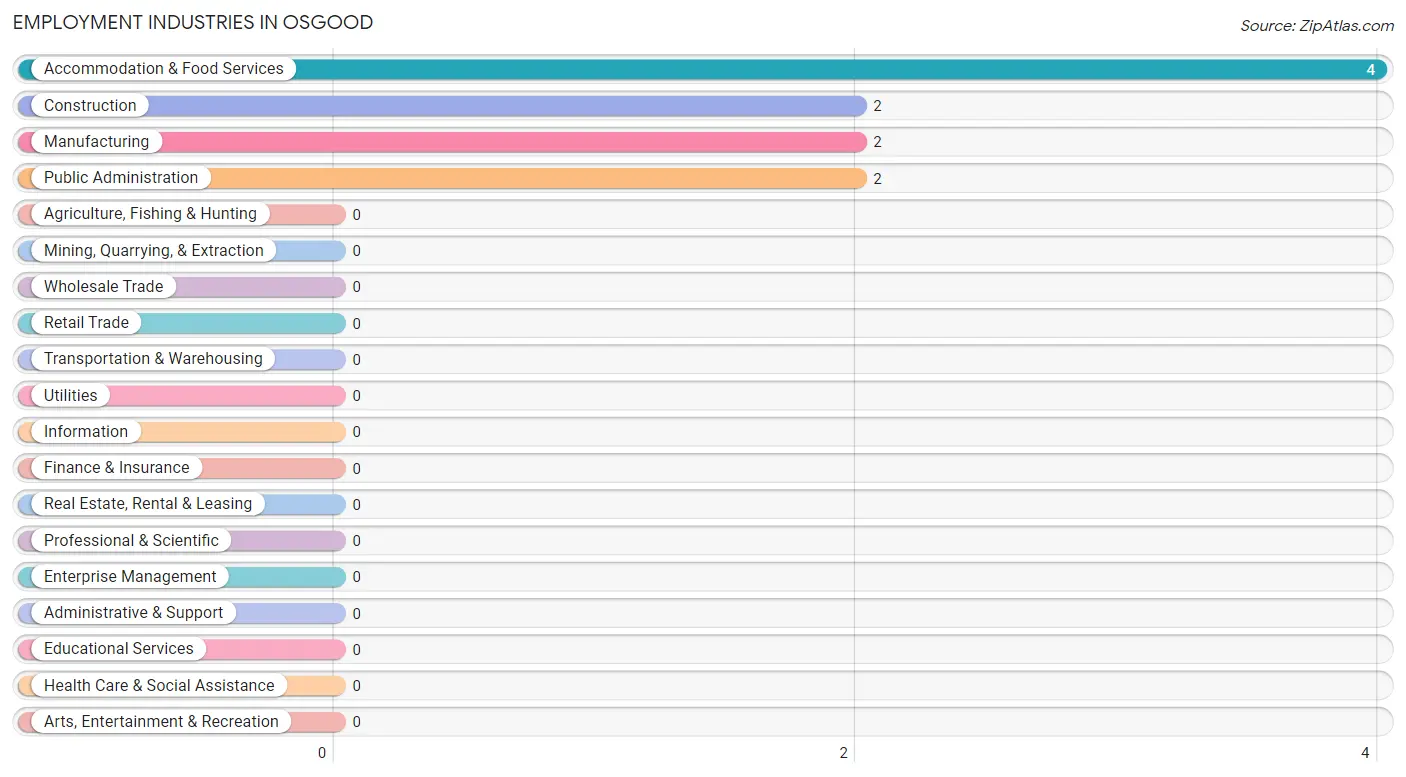
Employment Industries in Osgood
The major employment industries in Osgood include Accommodation & Food Services (4 | 23.5%), Construction (2 | 11.8%), Manufacturing (2 | 11.8%), and Public Administration (2 | 11.8%).
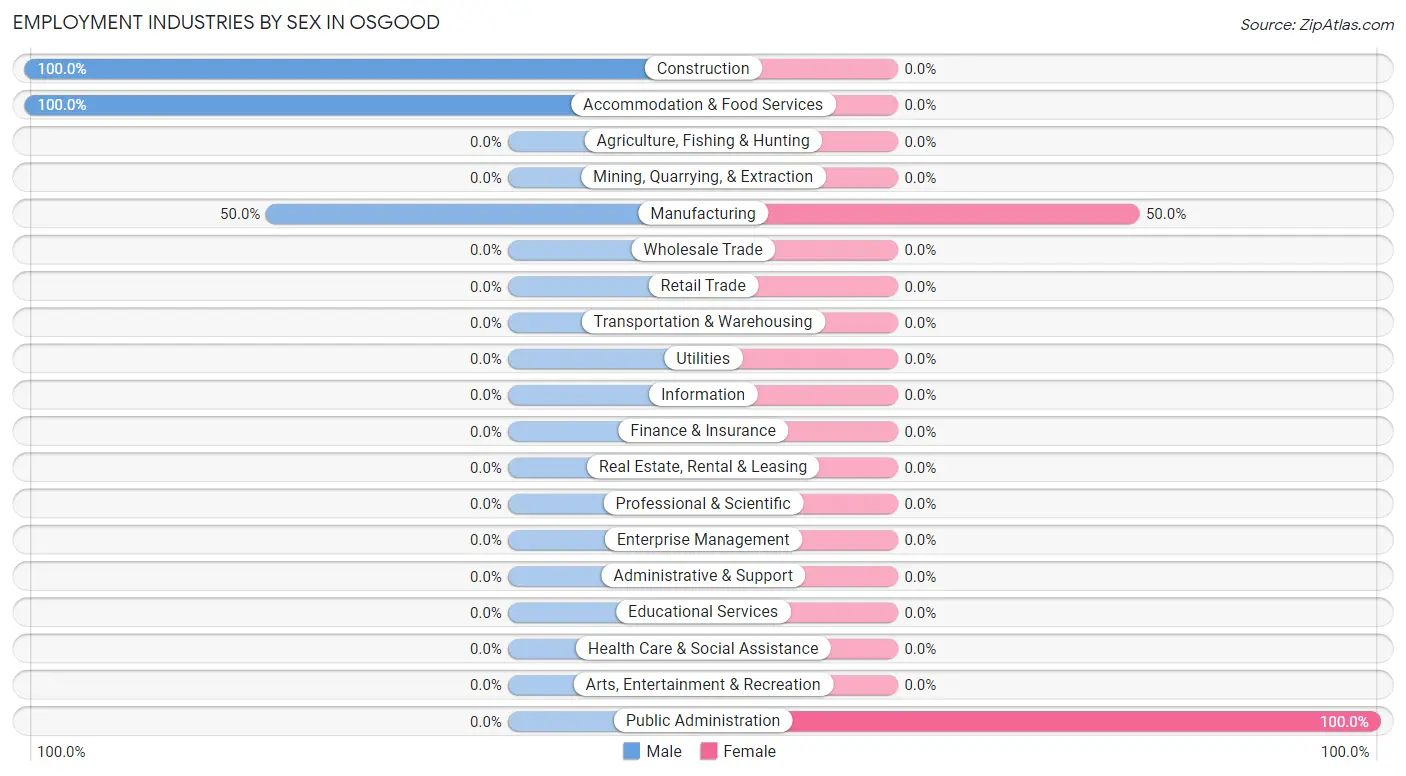
Employment Industries by Sex in Osgood
The Osgood industries that see more men than women are Construction (100.0%), Accommodation & Food Services (100.0%), and Manufacturing (50.0%), whereas the industries that tend to have a higher number of women are Public Administration (100.0%), and Manufacturing (50.0%).
| Industry | Male | Female |
| Agriculture, Fishing & Hunting | 0 (0.0%) | 0 (0.0%) |
| Mining, Quarrying, & Extraction | 0 (0.0%) | 0 (0.0%) |
| Construction | 2 (100.0%) | 0 (0.0%) |
| Manufacturing | 1 (50.0%) | 1 (50.0%) |
| Wholesale Trade | 0 (0.0%) | 0 (0.0%) |
| Retail Trade | 0 (0.0%) | 0 (0.0%) |
| Transportation & Warehousing | 0 (0.0%) | 0 (0.0%) |
| Utilities | 0 (0.0%) | 0 (0.0%) |
| Information | 0 (0.0%) | 0 (0.0%) |
| Finance & Insurance | 0 (0.0%) | 0 (0.0%) |
| Real Estate, Rental & Leasing | 0 (0.0%) | 0 (0.0%) |
| Professional & Scientific | 0 (0.0%) | 0 (0.0%) |
| Enterprise Management | 0 (0.0%) | 0 (0.0%) |
| Administrative & Support | 0 (0.0%) | 0 (0.0%) |
| Educational Services | 0 (0.0%) | 0 (0.0%) |
| Health Care & Social Assistance | 0 (0.0%) | 0 (0.0%) |
| Arts, Entertainment & Recreation | 0 (0.0%) | 0 (0.0%) |
| Accommodation & Food Services | 4 (100.0%) | 0 (0.0%) |
| Public Administration | 0 (0.0%) | 2 (100.0%) |
| Total | 14 (82.4%) | 3 (17.6%) |
Education in Osgood
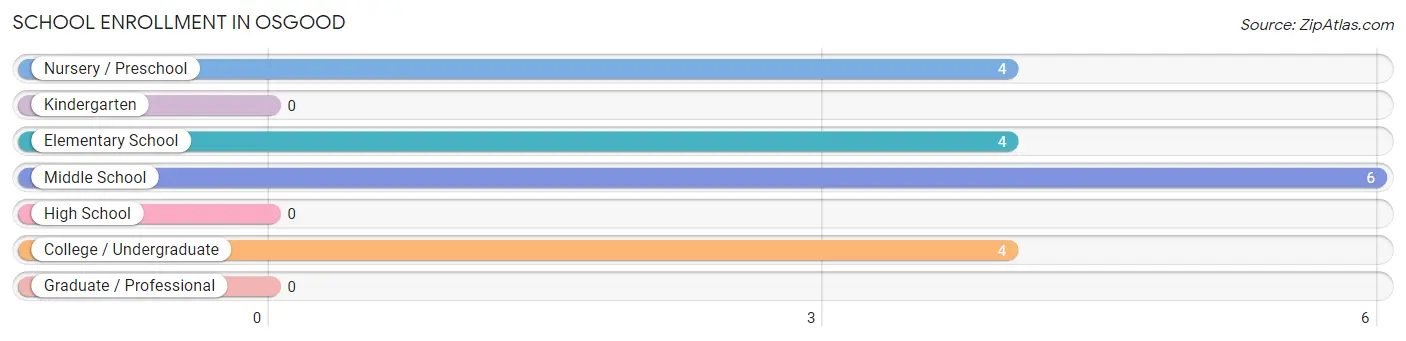
School Enrollment in Osgood
The most common levels of schooling among the 18 students in Osgood are middle school (6 | 33.3%), nursery / preschool (4 | 22.2%), and elementary school (4 | 22.2%).
| School Level | # Students | % Students |
| Nursery / Preschool | 4 | 22.2% |
| Kindergarten | 0 | 0.0% |
| Elementary School | 4 | 22.2% |
| Middle School | 6 | 33.3% |
| High School | 0 | 0.0% |
| College / Undergraduate | 4 | 22.2% |
| Graduate / Professional | 0 | 0.0% |
| Total | 18 | 100.0% |
School Enrollment by Age by Funding Source in Osgood

| Age Bracket | Public School | Private School |
| 3 to 4 Year Olds | 0 (0.0%) | 0 (0.0%) |
| 5 to 9 Year Old | 6 (100.0%) | 0 (0.0%) |
| 10 to 14 Year Olds | 8 (100.0%) | 0 (0.0%) |
| 15 to 17 Year Olds | 0 (0.0%) | 0 (0.0%) |
| 18 to 19 Year Olds | 0 (0.0%) | 0 (0.0%) |
| 20 to 24 Year Olds | 4 (100.0%) | 0 (0.0%) |
| 25 to 34 Year Olds | 0 (0.0%) | 0 (0.0%) |
| 35 Years and over | 0 (0.0%) | 0 (0.0%) |
| Total | 18 (100.0%) | 0 (0.0%) |
Educational Attainment by Field of Study in Osgood
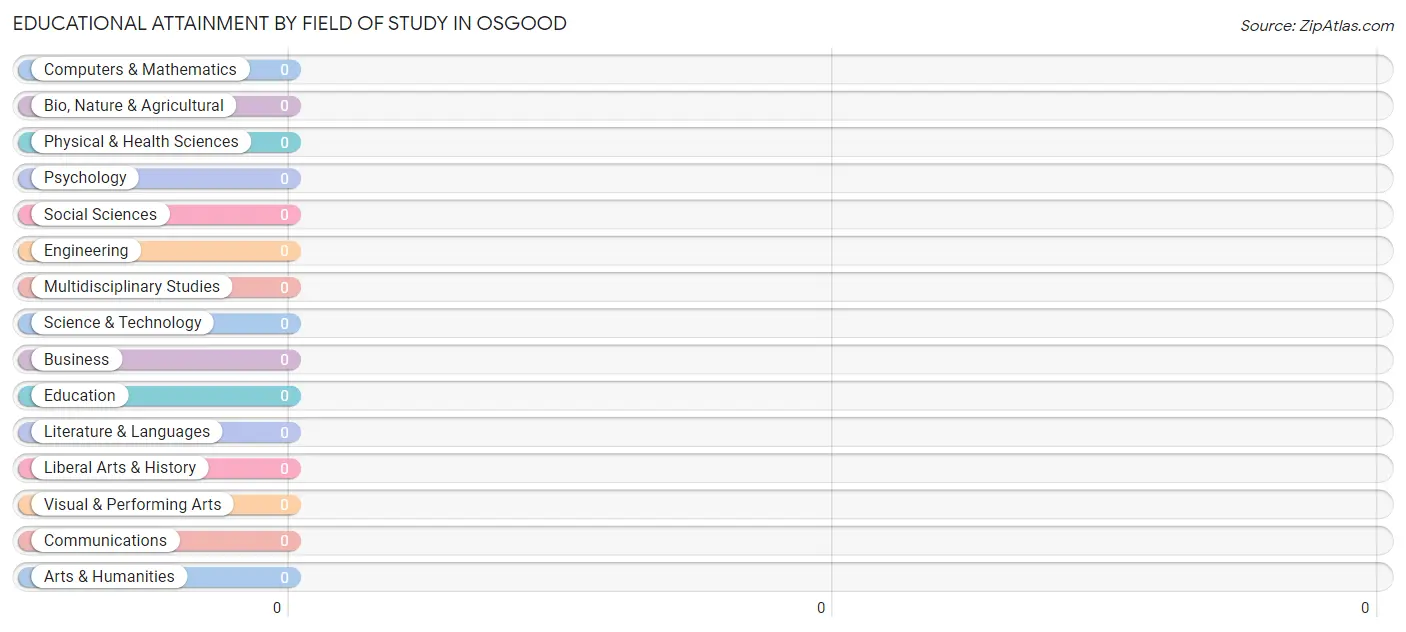
| Field of Study | # Graduates | % Graduates |
| Computers & Mathematics | 0 | 0.0% |
| Bio, Nature & Agricultural | 0 | 0.0% |
| Physical & Health Sciences | 0 | 0.0% |
| Psychology | 0 | 0.0% |
| Social Sciences | 0 | 0.0% |
| Engineering | 0 | 0.0% |
| Multidisciplinary Studies | 0 | 0.0% |
| Science & Technology | 0 | 0.0% |
| Business | 0 | 0.0% |
| Education | 0 | 0.0% |
| Literature & Languages | 0 | 0.0% |
| Liberal Arts & History | 0 | 0.0% |
| Visual & Performing Arts | 0 | 0.0% |
| Communications | 0 | 0.0% |
| Arts & Humanities | 0 | 0.0% |
| Total | 0 | 0.0% |
Transportation & Commute in Osgood
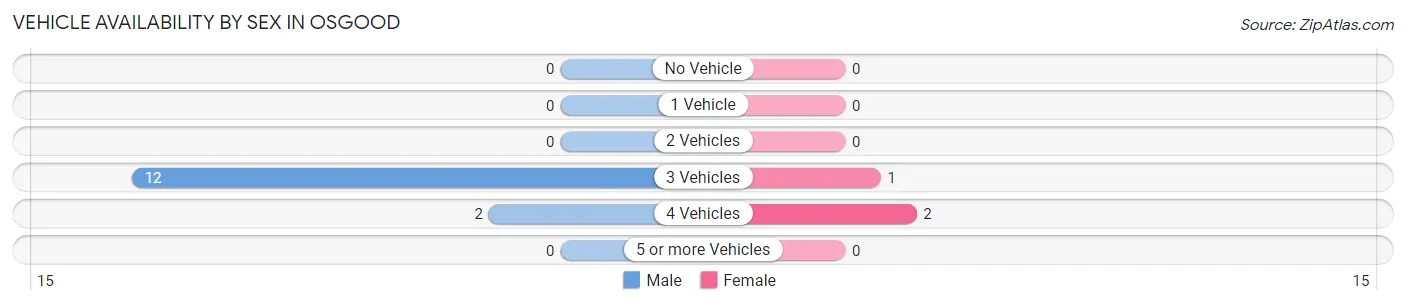
Vehicle Availability by Sex in Osgood
The most prevalent vehicle ownership categories in Osgood are males with 3 vehicles (12, accounting for 85.7%) and females with 3 vehicles (1, making up 400.0%).
| Vehicles Available | Male | Female |
| No Vehicle | 0 (0.0%) | 0 (0.0%) |
| 1 Vehicle | 0 (0.0%) | 0 (0.0%) |
| 2 Vehicles | 0 (0.0%) | 0 (0.0%) |
| 3 Vehicles | 12 (85.7%) | 1 (33.3%) |
| 4 Vehicles | 2 (14.3%) | 2 (66.7%) |
| 5 or more Vehicles | 0 (0.0%) | 0 (0.0%) |
| Total | 14 (100.0%) | 3 (100.0%) |
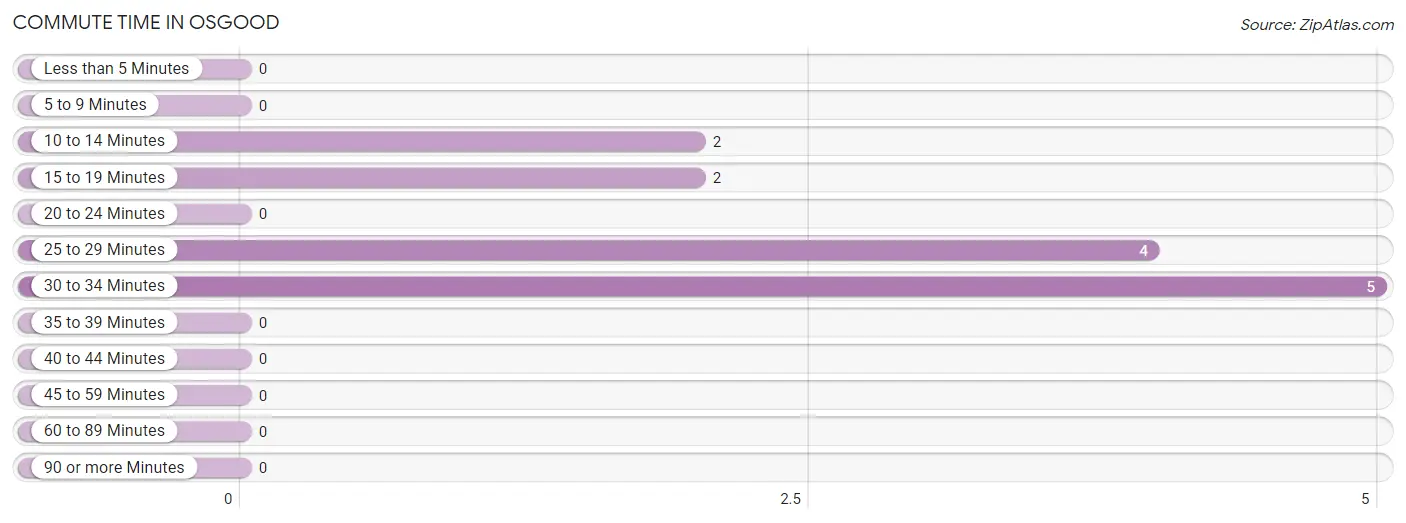
Commute Time in Osgood
The most frequently occuring commute durations in Osgood are 30 to 34 minutes (5 commuters, 38.5%), 25 to 29 minutes (4 commuters, 30.8%), and 10 to 14 minutes (2 commuters, 15.4%).
| Commute Time | # Commuters | % Commuters |
| Less than 5 Minutes | 0 | 0.0% |
| 5 to 9 Minutes | 0 | 0.0% |
| 10 to 14 Minutes | 2 | 15.4% |
| 15 to 19 Minutes | 2 | 15.4% |
| 20 to 24 Minutes | 0 | 0.0% |
| 25 to 29 Minutes | 4 | 30.8% |
| 30 to 34 Minutes | 5 | 38.5% |
| 35 to 39 Minutes | 0 | 0.0% |
| 40 to 44 Minutes | 0 | 0.0% |
| 45 to 59 Minutes | 0 | 0.0% |
| 60 to 89 Minutes | 0 | 0.0% |
| 90 or more Minutes | 0 | 0.0% |
Commute Time by Sex in Osgood
The most common commute times in Osgood are 30 to 34 minutes (5 commuters, 50.0%) for males and 25 to 29 minutes (3 commuters, 100.0%) for females.
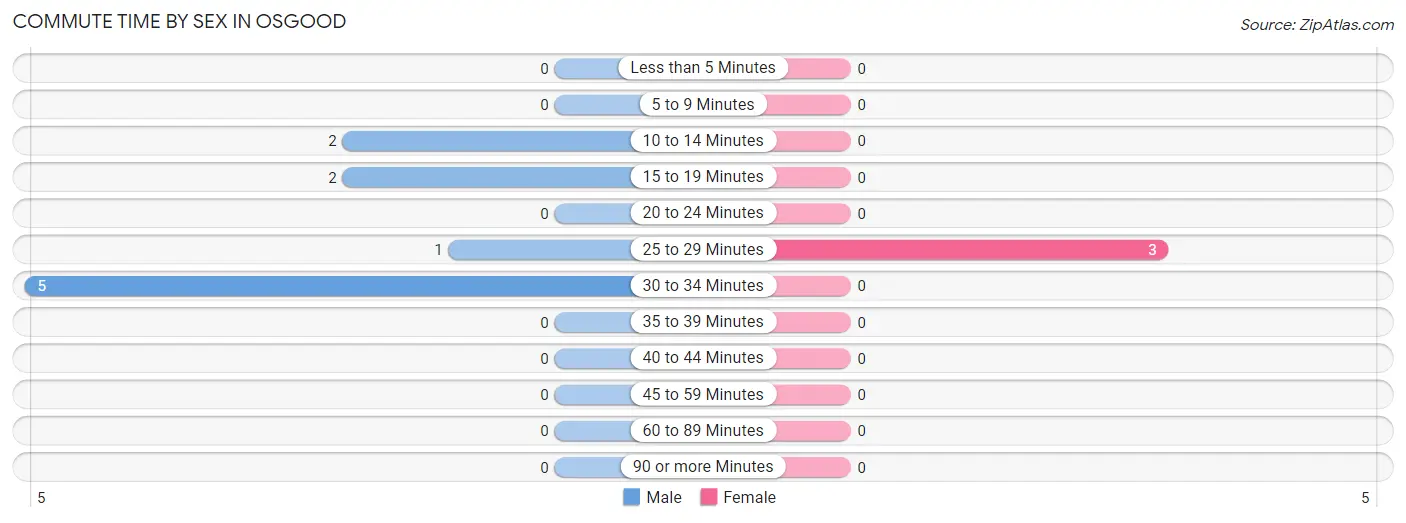
| Commute Time | Male | Female |
| Less than 5 Minutes | 0 (0.0%) | 0 (0.0%) |
| 5 to 9 Minutes | 0 (0.0%) | 0 (0.0%) |
| 10 to 14 Minutes | 2 (20.0%) | 0 (0.0%) |
| 15 to 19 Minutes | 2 (20.0%) | 0 (0.0%) |
| 20 to 24 Minutes | 0 (0.0%) | 0 (0.0%) |
| 25 to 29 Minutes | 1 (10.0%) | 3 (100.0%) |
| 30 to 34 Minutes | 5 (50.0%) | 0 (0.0%) |
| 35 to 39 Minutes | 0 (0.0%) | 0 (0.0%) |
| 40 to 44 Minutes | 0 (0.0%) | 0 (0.0%) |
| 45 to 59 Minutes | 0 (0.0%) | 0 (0.0%) |
| 60 to 89 Minutes | 0 (0.0%) | 0 (0.0%) |
| 90 or more Minutes | 0 (0.0%) | 0 (0.0%) |
Time of Departure to Work by Sex in Osgood
The most frequent times of departure to work in Osgood are 7:00 AM to 7:29 AM (7, 70.0%) for males and 7:30 AM to 7:59 AM (2, 66.7%) for females.
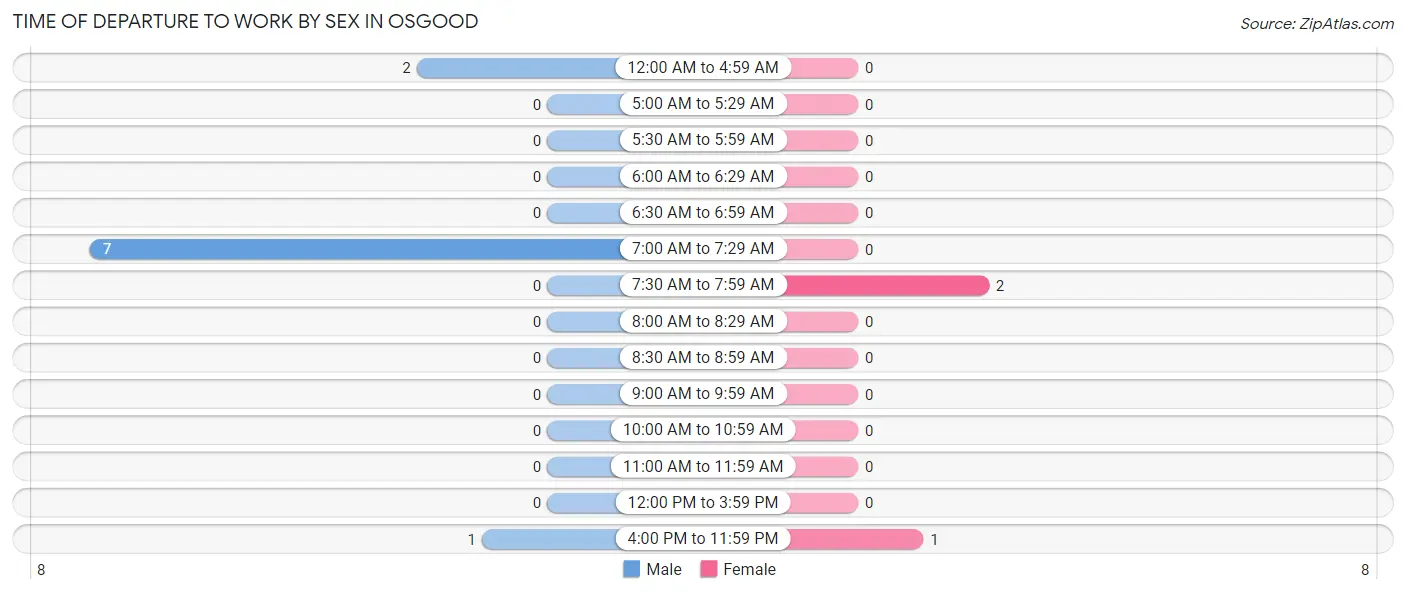
| Time of Departure | Male | Female |
| 12:00 AM to 4:59 AM | 2 (20.0%) | 0 (0.0%) |
| 5:00 AM to 5:29 AM | 0 (0.0%) | 0 (0.0%) |
| 5:30 AM to 5:59 AM | 0 (0.0%) | 0 (0.0%) |
| 6:00 AM to 6:29 AM | 0 (0.0%) | 0 (0.0%) |
| 6:30 AM to 6:59 AM | 0 (0.0%) | 0 (0.0%) |
| 7:00 AM to 7:29 AM | 7 (70.0%) | 0 (0.0%) |
| 7:30 AM to 7:59 AM | 0 (0.0%) | 2 (66.7%) |
| 8:00 AM to 8:29 AM | 0 (0.0%) | 0 (0.0%) |
| 8:30 AM to 8:59 AM | 0 (0.0%) | 0 (0.0%) |
| 9:00 AM to 9:59 AM | 0 (0.0%) | 0 (0.0%) |
| 10:00 AM to 10:59 AM | 0 (0.0%) | 0 (0.0%) |
| 11:00 AM to 11:59 AM | 0 (0.0%) | 0 (0.0%) |
| 12:00 PM to 3:59 PM | 0 (0.0%) | 0 (0.0%) |
| 4:00 PM to 11:59 PM | 1 (10.0%) | 1 (33.3%) |
| Total | 10 (100.0%) | 3 (100.0%) |
Housing Occupancy in Osgood
Occupancy by Ownership in Osgood
Of the total 10 dwellings in Osgood, owner-occupied units account for 10 (100.0%), while renter-occupied units make up 0 (0.0%).
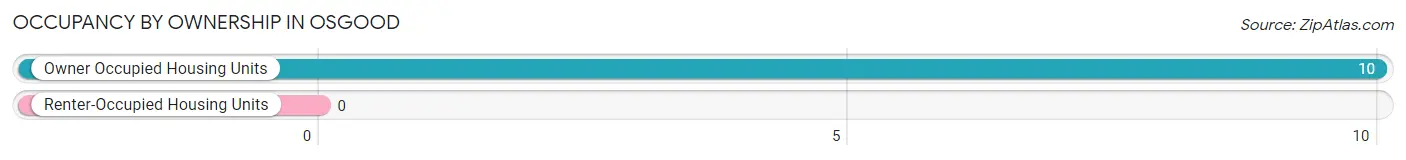
| Occupancy | # Housing Units | % Housing Units |
| Owner Occupied Housing Units | 10 | 100.0% |
| Renter-Occupied Housing Units | 0 | 0.0% |
| Total Occupied Housing Units | 10 | 100.0% |
Occupancy by Household Size in Osgood
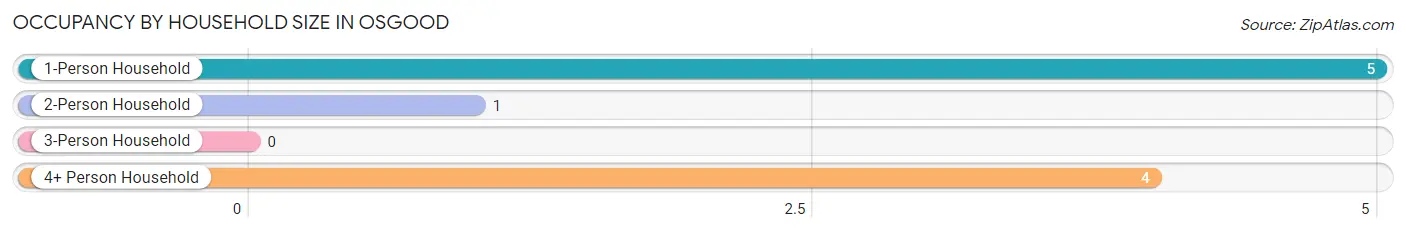
| Household Size | # Housing Units | % Housing Units |
| 1-Person Household | 5 | 50.0% |
| 2-Person Household | 1 | 10.0% |
| 3-Person Household | 0 | 0.0% |
| 4+ Person Household | 4 | 40.0% |
| Total Housing Units | 10 | 100.0% |
Occupancy by Ownership by Household Size in Osgood
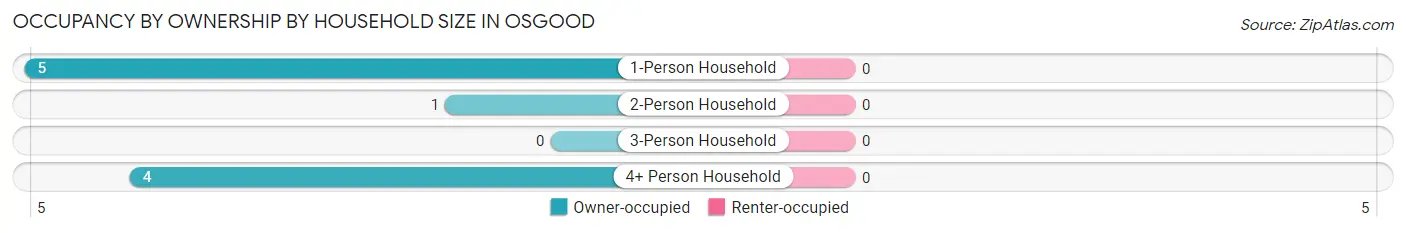
| Household Size | Owner-occupied | Renter-occupied |
| 1-Person Household | 5 (100.0%) | 0 (0.0%) |
| 2-Person Household | 1 (100.0%) | 0 (0.0%) |
| 3-Person Household | 0 (0.0%) | 0 (0.0%) |
| 4+ Person Household | 4 (100.0%) | 0 (0.0%) |
| Total Housing Units | 10 (100.0%) | 0 (0.0%) |
Occupancy by Educational Attainment in Osgood
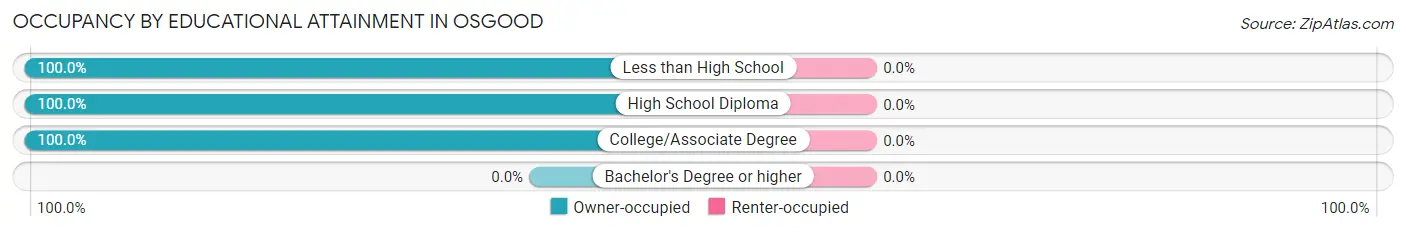
| Household Size | Owner-occupied | Renter-occupied |
| Less than High School | 2 (100.0%) | 0 (0.0%) |
| High School Diploma | 5 (100.0%) | 0 (0.0%) |
| College/Associate Degree | 3 (100.0%) | 0 (0.0%) |
| Bachelor's Degree or higher | 0 (0.0%) | 0 (0.0%) |
Occupancy by Age of Householder in Osgood
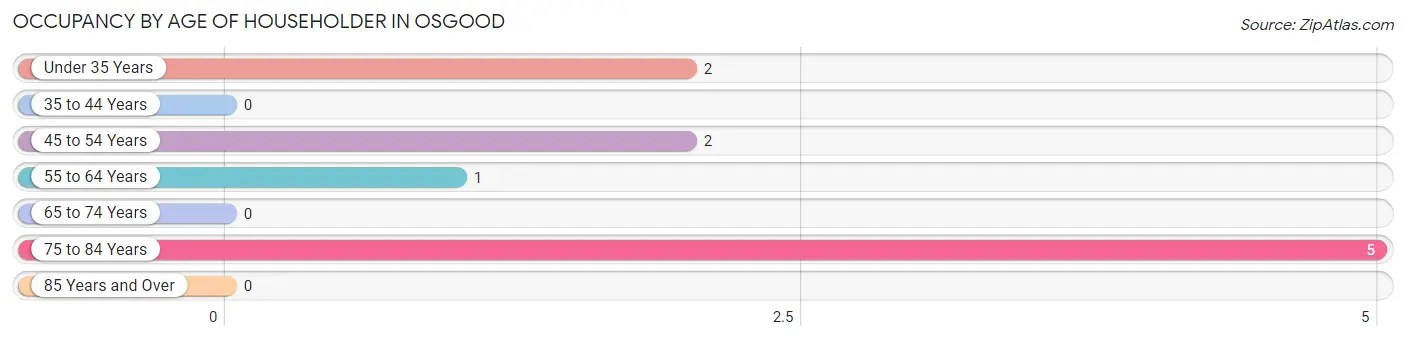
| Age Bracket | # Households | % Households |
| Under 35 Years | 2 | 20.0% |
| 35 to 44 Years | 0 | 0.0% |
| 45 to 54 Years | 2 | 20.0% |
| 55 to 64 Years | 1 | 10.0% |
| 65 to 74 Years | 0 | 0.0% |
| 75 to 84 Years | 5 | 50.0% |
| 85 Years and Over | 0 | 0.0% |
| Total | 10 | 100.0% |
Housing Finances in Osgood
Median Income by Occupancy in Osgood

| Occupancy Type | # Households | Median Income |
| Owner-Occupied | 10 (100.0%) | $0 |
| Renter-Occupied | 0 (0.0%) | $0 |
| Average | 10 (100.0%) | $0 |
Occupancy by Householder Income Bracket in Osgood
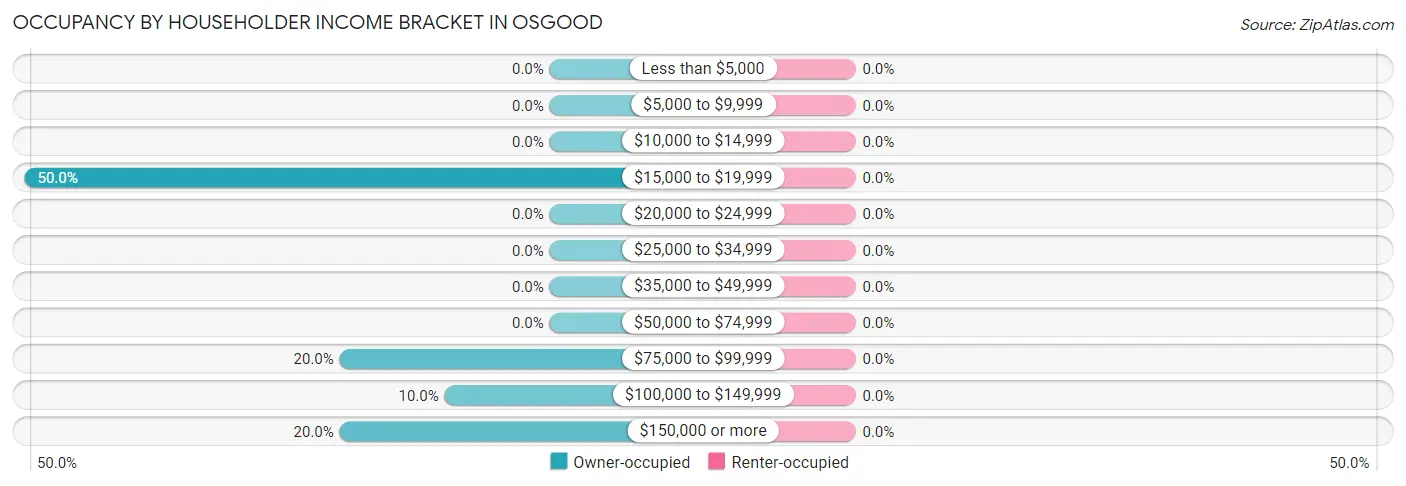
| Income Bracket | Owner-occupied | Renter-occupied |
| Less than $5,000 | 0 (0.0%) | 0 (0.0%) |
| $5,000 to $9,999 | 0 (0.0%) | 0 (0.0%) |
| $10,000 to $14,999 | 0 (0.0%) | 0 (0.0%) |
| $15,000 to $19,999 | 5 (50.0%) | 0 (0.0%) |
| $20,000 to $24,999 | 0 (0.0%) | 0 (0.0%) |
| $25,000 to $34,999 | 0 (0.0%) | 0 (0.0%) |
| $35,000 to $49,999 | 0 (0.0%) | 0 (0.0%) |
| $50,000 to $74,999 | 0 (0.0%) | 0 (0.0%) |
| $75,000 to $99,999 | 2 (20.0%) | 0 (0.0%) |
| $100,000 to $149,999 | 1 (10.0%) | 0 (0.0%) |
| $150,000 or more | 2 (20.0%) | 0 (0.0%) |
| Total | 10 (100.0%) | 0 (0.0%) |
Monthly Housing Cost Tiers in Osgood
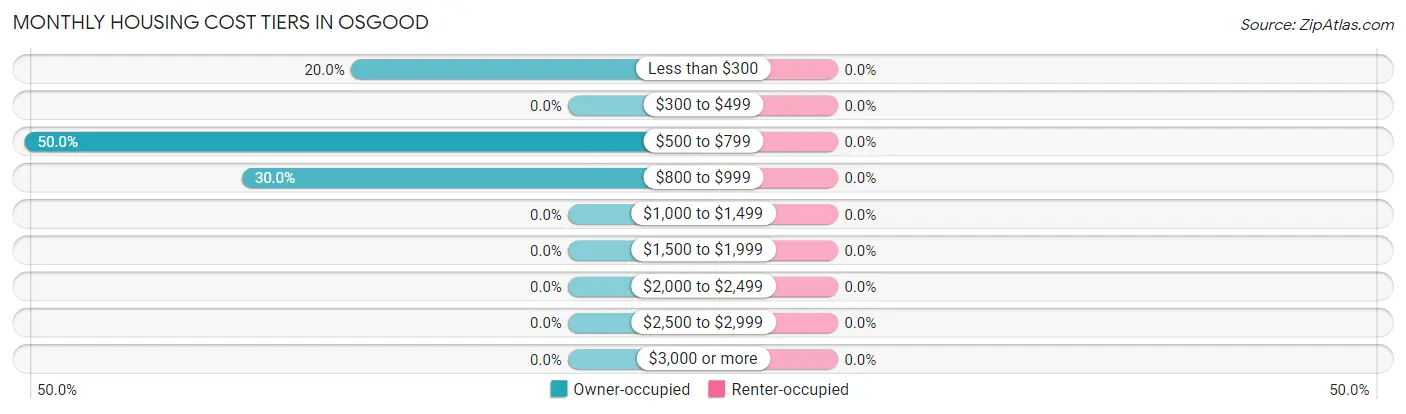
| Monthly Cost | Owner-occupied | Renter-occupied |
| Less than $300 | 2 (20.0%) | 0 (0.0%) |
| $300 to $499 | 0 (0.0%) | 0 (0.0%) |
| $500 to $799 | 5 (50.0%) | 0 (0.0%) |
| $800 to $999 | 3 (30.0%) | 0 (0.0%) |
| $1,000 to $1,499 | 0 (0.0%) | 0 (0.0%) |
| $1,500 to $1,999 | 0 (0.0%) | 0 (0.0%) |
| $2,000 to $2,499 | 0 (0.0%) | 0 (0.0%) |
| $2,500 to $2,999 | 0 (0.0%) | 0 (0.0%) |
| $3,000 or more | 0 (0.0%) | 0 (0.0%) |
| Total | 10 (100.0%) | 0 (0.0%) |
Physical Housing Characteristics in Osgood
Housing Structures in Osgood
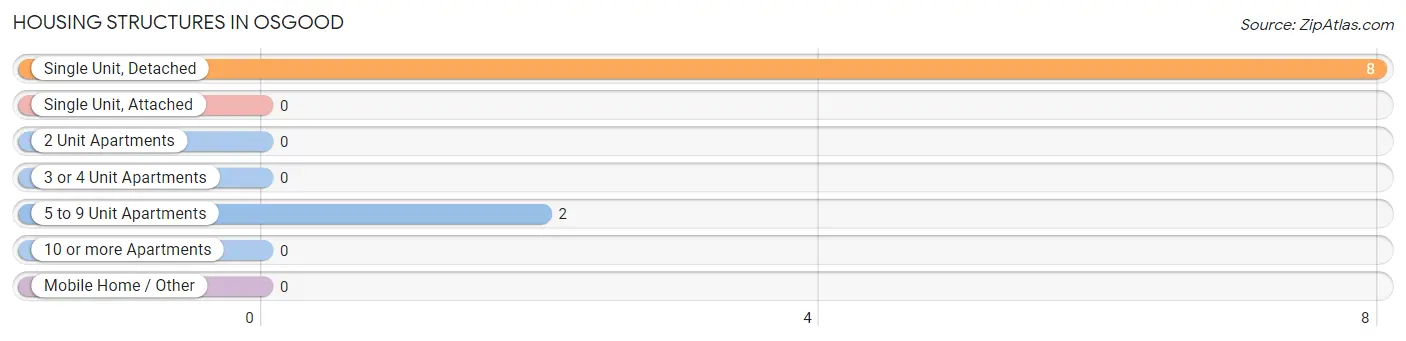
| Structure Type | # Housing Units | % Housing Units |
| Single Unit, Detached | 8 | 80.0% |
| Single Unit, Attached | 0 | 0.0% |
| 2 Unit Apartments | 0 | 0.0% |
| 3 or 4 Unit Apartments | 0 | 0.0% |
| 5 to 9 Unit Apartments | 2 | 20.0% |
| 10 or more Apartments | 0 | 0.0% |
| Mobile Home / Other | 0 | 0.0% |
| Total | 10 | 100.0% |
Housing Structures by Occupancy in Osgood
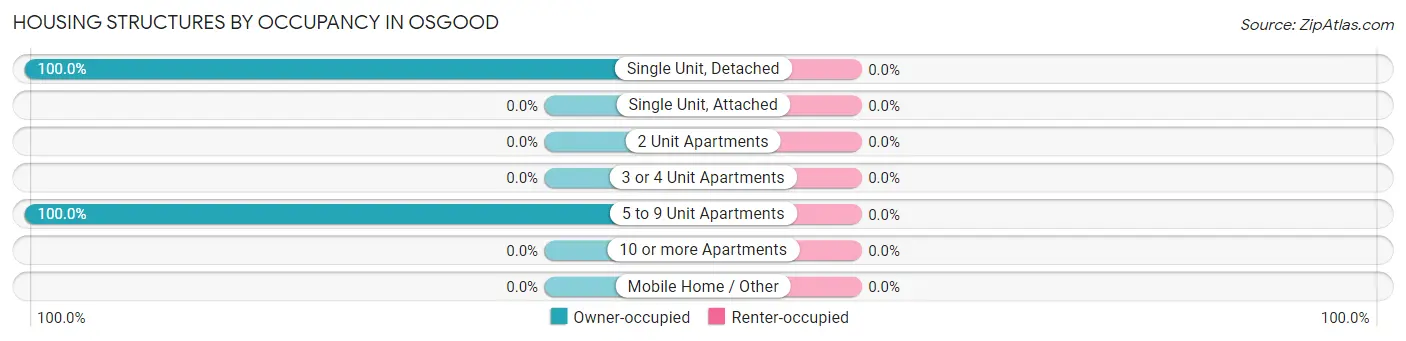
| Structure Type | Owner-occupied | Renter-occupied |
| Single Unit, Detached | 8 (100.0%) | 0 (0.0%) |
| Single Unit, Attached | 0 (0.0%) | 0 (0.0%) |
| 2 Unit Apartments | 0 (0.0%) | 0 (0.0%) |
| 3 or 4 Unit Apartments | 0 (0.0%) | 0 (0.0%) |
| 5 to 9 Unit Apartments | 2 (100.0%) | 0 (0.0%) |
| 10 or more Apartments | 0 (0.0%) | 0 (0.0%) |
| Mobile Home / Other | 0 (0.0%) | 0 (0.0%) |
| Total | 10 (100.0%) | 0 (0.0%) |
Housing Structures by Number of Rooms in Osgood
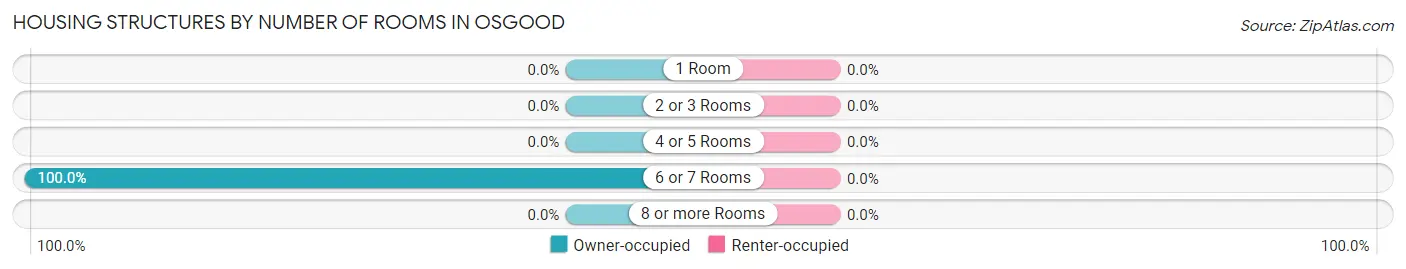
| Number of Rooms | Owner-occupied | Renter-occupied |
| 1 Room | 0 (0.0%) | 0 (0.0%) |
| 2 or 3 Rooms | 0 (0.0%) | 0 (0.0%) |
| 4 or 5 Rooms | 0 (0.0%) | 0 (0.0%) |
| 6 or 7 Rooms | 10 (100.0%) | 0 (0.0%) |
| 8 or more Rooms | 0 (0.0%) | 0 (0.0%) |
| Total | 10 (100.0%) | 0 (0.0%) |
Housing Structure by Heating Type in Osgood
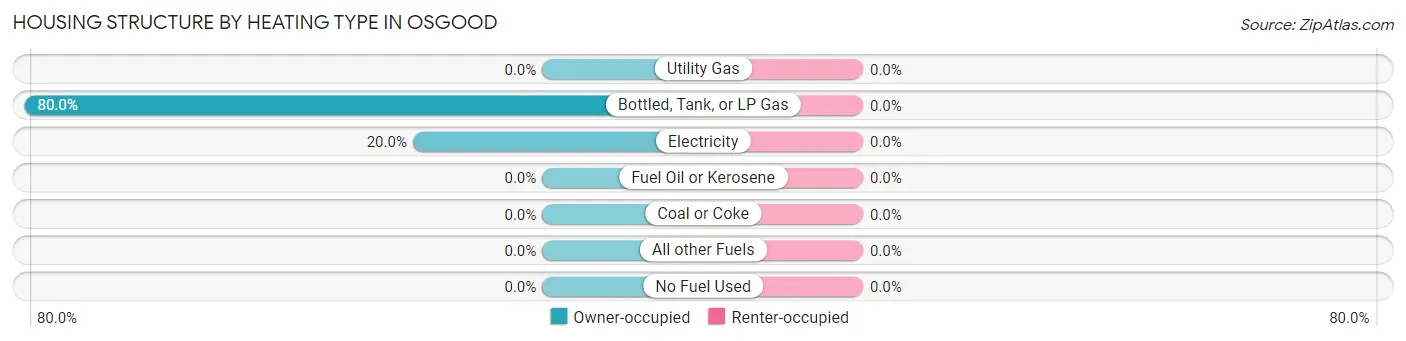
| Heating Type | Owner-occupied | Renter-occupied |
| Utility Gas | 0 (0.0%) | 0 (0.0%) |
| Bottled, Tank, or LP Gas | 8 (80.0%) | 0 (0.0%) |
| Electricity | 2 (20.0%) | 0 (0.0%) |
| Fuel Oil or Kerosene | 0 (0.0%) | 0 (0.0%) |
| Coal or Coke | 0 (0.0%) | 0 (0.0%) |
| All other Fuels | 0 (0.0%) | 0 (0.0%) |
| No Fuel Used | 0 (0.0%) | 0 (0.0%) |
| Total | 10 (100.0%) | 0 (0.0%) |
Household Vehicle Usage in Osgood
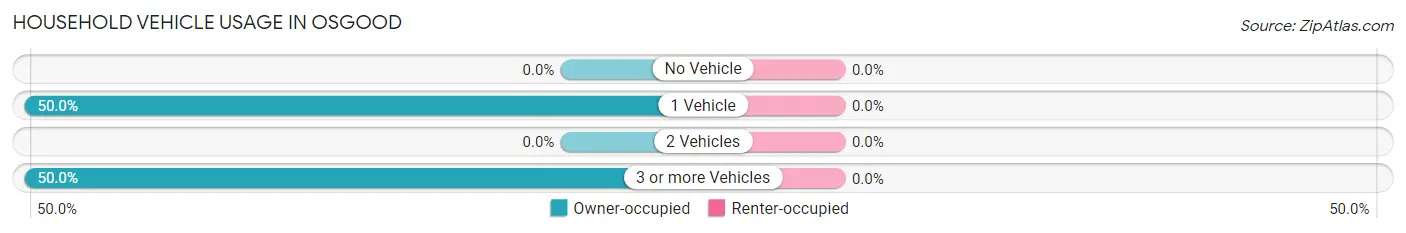
| Vehicles per Household | Owner-occupied | Renter-occupied |
| No Vehicle | 0 (0.0%) | 0 (0.0%) |
| 1 Vehicle | 5 (50.0%) | 0 (0.0%) |
| 2 Vehicles | 0 (0.0%) | 0 (0.0%) |
| 3 or more Vehicles | 5 (50.0%) | 0 (0.0%) |
| Total | 10 (100.0%) | 0 (0.0%) |
Real Estate & Mortgages in Osgood
Real Estate and Mortgage Overview in Osgood
| Characteristic | Without Mortgage | With Mortgage |
| Housing Units | 8 | 2 |
| Median Property Value | - | - |
| Median Household Income | - | - |
| Monthly Housing Costs | $540 | $0 |
| Real Estate Taxes | $760 | $0 |
Property Value by Mortgage Status in Osgood
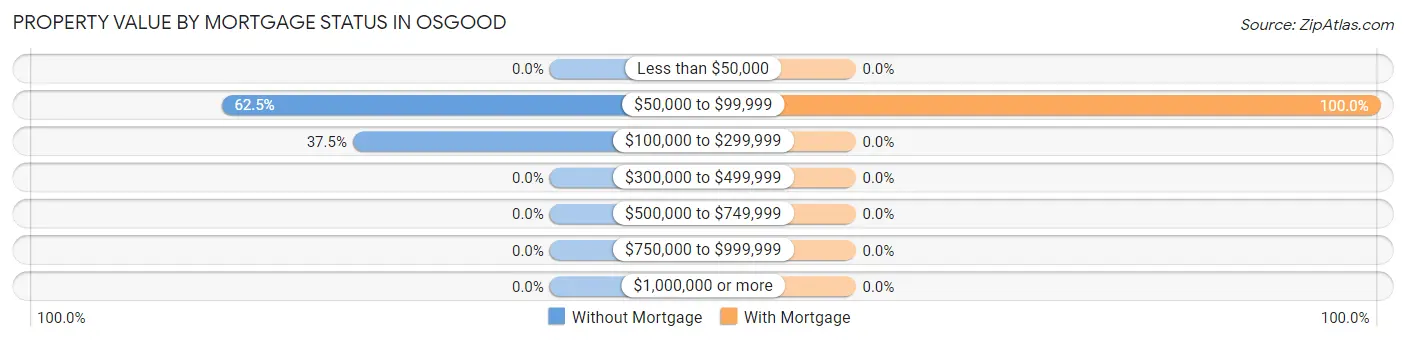
| Property Value | Without Mortgage | With Mortgage |
| Less than $50,000 | 0 (0.0%) | 0 (0.0%) |
| $50,000 to $99,999 | 5 (62.5%) | 2 (100.0%) |
| $100,000 to $299,999 | 3 (37.5%) | 0 (0.0%) |
| $300,000 to $499,999 | 0 (0.0%) | 0 (0.0%) |
| $500,000 to $749,999 | 0 (0.0%) | 0 (0.0%) |
| $750,000 to $999,999 | 0 (0.0%) | 0 (0.0%) |
| $1,000,000 or more | 0 (0.0%) | 0 (0.0%) |
| Total | 8 (100.0%) | 2 (100.0%) |
Household Income by Mortgage Status in Osgood
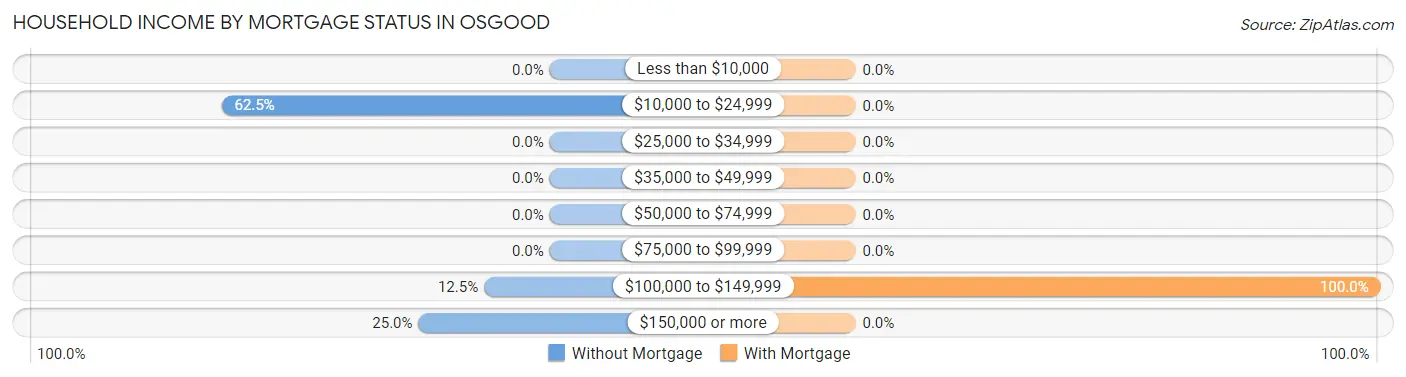
| Household Income | Without Mortgage | With Mortgage |
| Less than $10,000 | 0 (0.0%) | 0 (0.0%) |
| $10,000 to $24,999 | 5 (62.5%) | 0 (0.0%) |
| $25,000 to $34,999 | 0 (0.0%) | 0 (0.0%) |
| $35,000 to $49,999 | 0 (0.0%) | 0 (0.0%) |
| $50,000 to $74,999 | 0 (0.0%) | 0 (0.0%) |
| $75,000 to $99,999 | 0 (0.0%) | 0 (0.0%) |
| $100,000 to $149,999 | 1 (12.5%) | 2 (100.0%) |
| $150,000 or more | 2 (25.0%) | 0 (0.0%) |
| Total | 8 (100.0%) | 2 (100.0%) |
Property Value to Household Income Ratio in Osgood
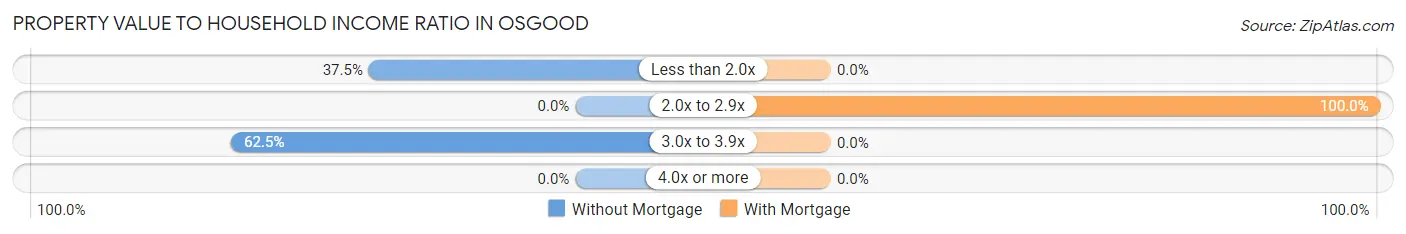
| Value-to-Income Ratio | Without Mortgage | With Mortgage |
| Less than 2.0x | 3 (37.5%) | 0 (0.0%) |
| 2.0x to 2.9x | 0 (0.0%) | 2 (100.0%) |
| 3.0x to 3.9x | 5 (62.5%) | 0 (0.0%) |
| 4.0x or more | 0 (0.0%) | 0 (0.0%) |
| Total | 8 (100.0%) | 2 (100.0%) |
Real Estate Taxes by Mortgage Status in Osgood

| Property Taxes | Without Mortgage | With Mortgage |
| Less than $800 | 5 (62.5%) | 0 (0.0%) |
| $800 to $1,499 | 2 (25.0%) | 2 (100.0%) |
| $800 to $1,499 | 1 (12.5%) | 0 (0.0%) |
| Total | 8 (100.0%) | 2 (100.0%) |
Health & Disability in Osgood
Health Insurance Coverage by Age in Osgood
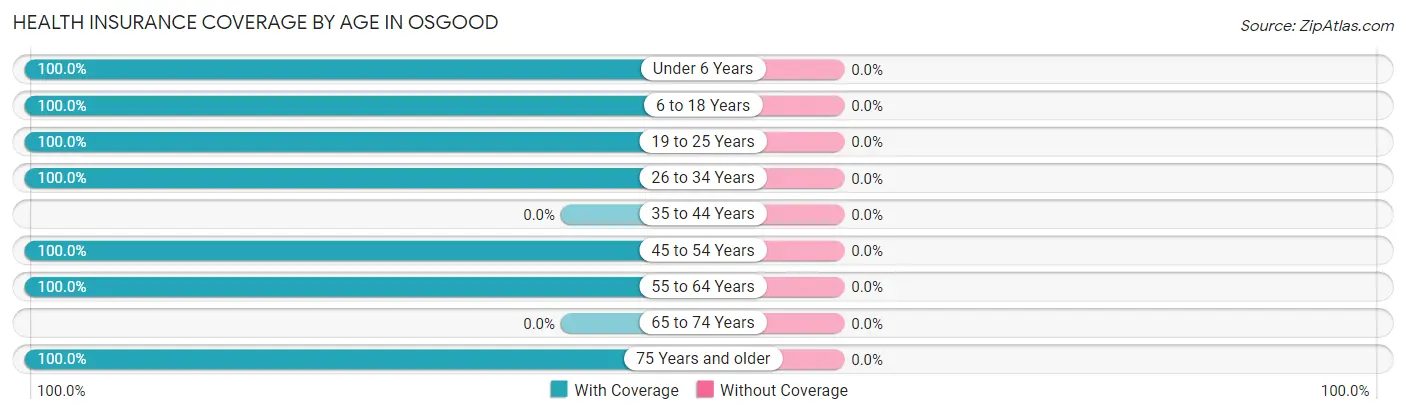
| Age Bracket | With Coverage | Without Coverage |
| Under 6 Years | 4 (100.0%) | 0 (0.0%) |
| 6 to 18 Years | 10 (100.0%) | 0 (0.0%) |
| 19 to 25 Years | 9 (100.0%) | 0 (0.0%) |
| 26 to 34 Years | 4 (100.0%) | 0 (0.0%) |
| 35 to 44 Years | 0 (0.0%) | 0 (0.0%) |
| 45 to 54 Years | 2 (100.0%) | 0 (0.0%) |
| 55 to 64 Years | 2 (100.0%) | 0 (0.0%) |
| 65 to 74 Years | 0 (0.0%) | 0 (0.0%) |
| 75 Years and older | 5 (100.0%) | 0 (0.0%) |
| Total | 36 (100.0%) | 0 (0.0%) |
Health Insurance Coverage by Citizenship Status in Osgood
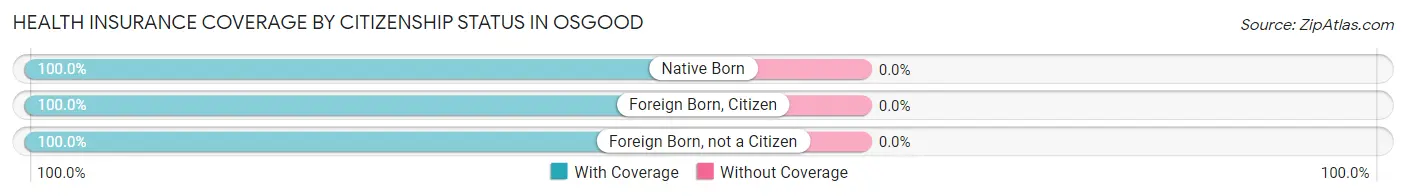
| Citizenship Status | With Coverage | Without Coverage |
| Native Born | 4 (100.0%) | 0 (0.0%) |
| Foreign Born, Citizen | 10 (100.0%) | 0 (0.0%) |
| Foreign Born, not a Citizen | 9 (100.0%) | 0 (0.0%) |
Health Insurance Coverage by Household Income in Osgood
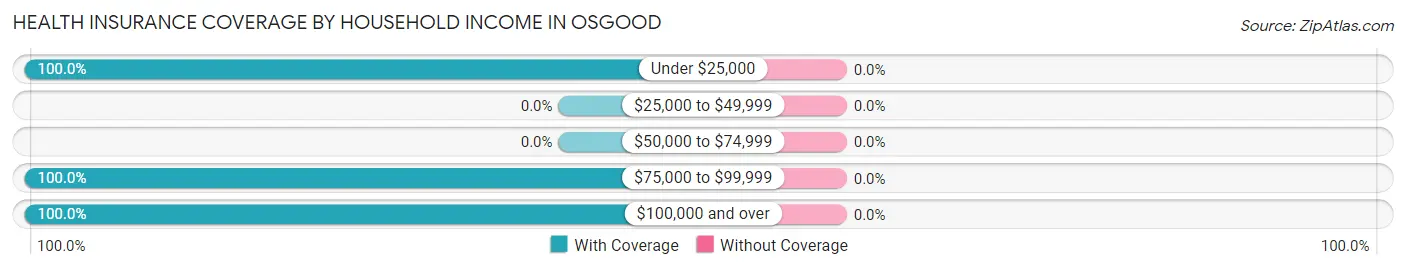
| Household Income | With Coverage | Without Coverage |
| Under $25,000 | 5 (100.0%) | 0 (0.0%) |
| $25,000 to $49,999 | 0 (0.0%) | 0 (0.0%) |
| $50,000 to $74,999 | 0 (0.0%) | 0 (0.0%) |
| $75,000 to $99,999 | 14 (100.0%) | 0 (0.0%) |
| $100,000 and over | 17 (100.0%) | 0 (0.0%) |
Public vs Private Health Insurance Coverage by Age in Osgood
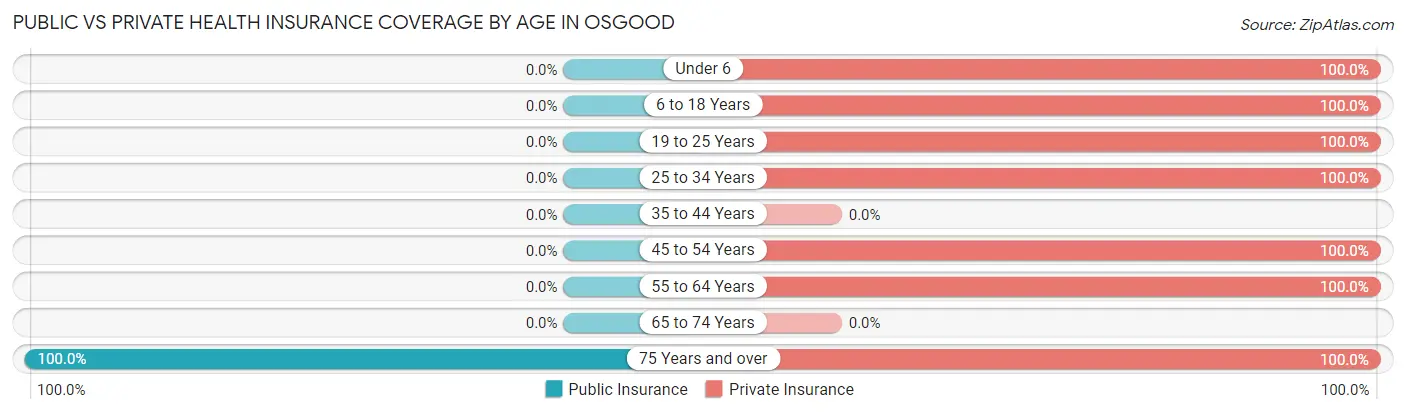
| Age Bracket | Public Insurance | Private Insurance |
| Under 6 | 0 (0.0%) | 4 (100.0%) |
| 6 to 18 Years | 0 (0.0%) | 10 (100.0%) |
| 19 to 25 Years | 0 (0.0%) | 9 (100.0%) |
| 25 to 34 Years | 0 (0.0%) | 4 (100.0%) |
| 35 to 44 Years | 0 (0.0%) | 0 (0.0%) |
| 45 to 54 Years | 0 (0.0%) | 2 (100.0%) |
| 55 to 64 Years | 0 (0.0%) | 2 (100.0%) |
| 65 to 74 Years | 0 (0.0%) | 0 (0.0%) |
| 75 Years and over | 5 (100.0%) | 5 (100.0%) |
| Total | 5 (13.9%) | 36 (100.0%) |
Disability Status by Sex by Age in Osgood
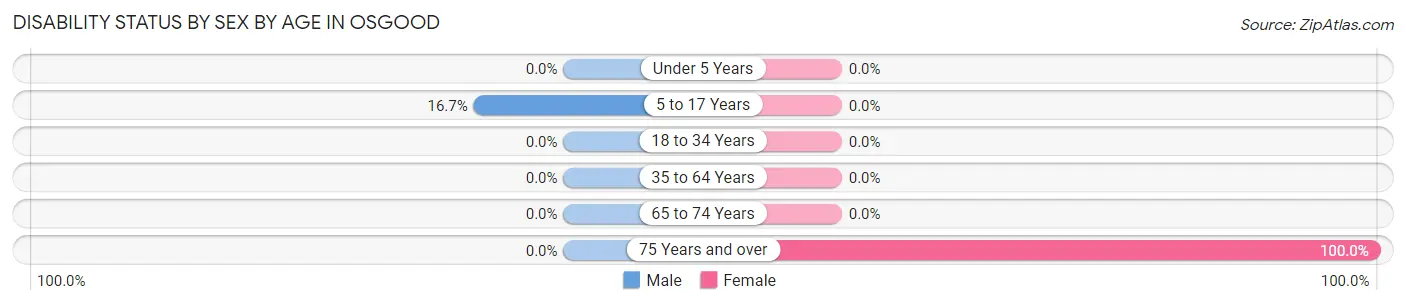
| Age Bracket | Male | Female |
| Under 5 Years | 0 (0.0%) | 0 (0.0%) |
| 5 to 17 Years | 2 (16.7%) | 0 (0.0%) |
| 18 to 34 Years | 0 (0.0%) | 0 (0.0%) |
| 35 to 64 Years | 0 (0.0%) | 0 (0.0%) |
| 65 to 74 Years | 0 (0.0%) | 0 (0.0%) |
| 75 Years and over | 0 (0.0%) | 5 (100.0%) |
Disability Class by Sex by Age in Osgood
Disability Class: Hearing Difficulty
| Age Bracket | Male | Female |
| Under 5 Years | 0 (0.0%) | 0 (0.0%) |
| 5 to 17 Years | 0 (0.0%) | 0 (0.0%) |
| 18 to 34 Years | 0 (0.0%) | 0 (0.0%) |
| 35 to 64 Years | 0 (0.0%) | 0 (0.0%) |
| 65 to 74 Years | 0 (0.0%) | 0 (0.0%) |
| 75 Years and over | 0 (0.0%) | 0 (0.0%) |
Disability Class: Vision Difficulty
| Age Bracket | Male | Female |
| Under 5 Years | 0 (0.0%) | 0 (0.0%) |
| 5 to 17 Years | 0 (0.0%) | 0 (0.0%) |
| 18 to 34 Years | 0 (0.0%) | 0 (0.0%) |
| 35 to 64 Years | 0 (0.0%) | 0 (0.0%) |
| 65 to 74 Years | 0 (0.0%) | 0 (0.0%) |
| 75 Years and over | 0 (0.0%) | 0 (0.0%) |
Disability Class: Cognitive Difficulty
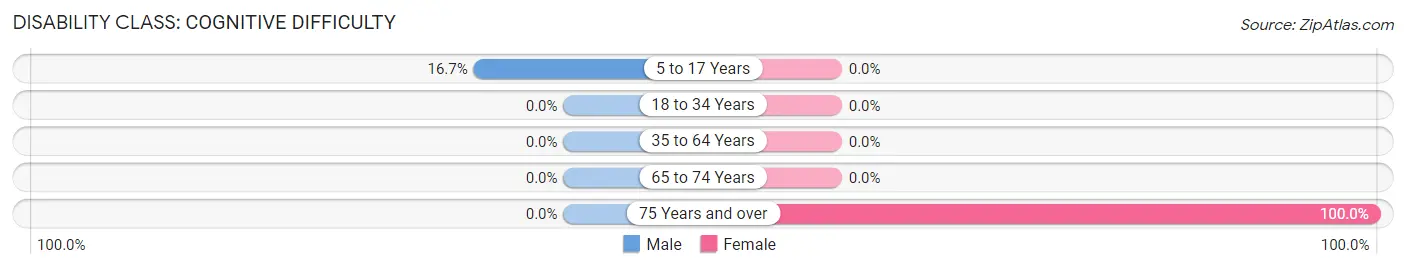
| Age Bracket | Male | Female |
| 5 to 17 Years | 2 (16.7%) | 0 (0.0%) |
| 18 to 34 Years | 0 (0.0%) | 0 (0.0%) |
| 35 to 64 Years | 0 (0.0%) | 0 (0.0%) |
| 65 to 74 Years | 0 (0.0%) | 0 (0.0%) |
| 75 Years and over | 0 (0.0%) | 5 (100.0%) |
Disability Class: Ambulatory Difficulty
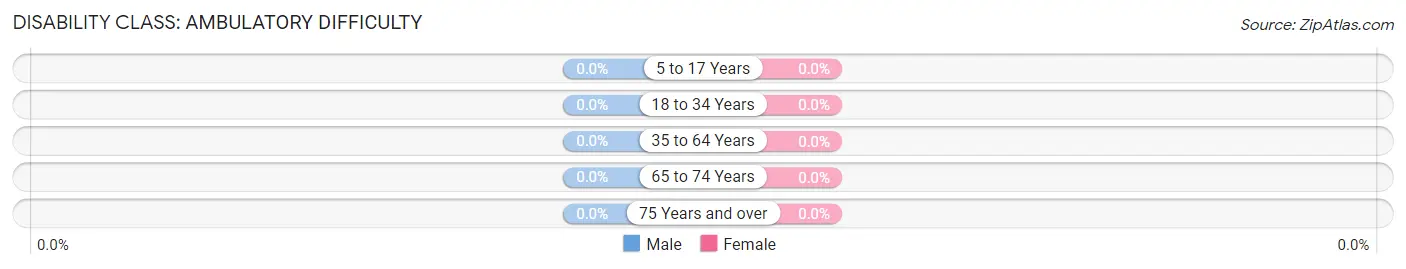
| Age Bracket | Male | Female |
| 5 to 17 Years | 0 (0.0%) | 0 (0.0%) |
| 18 to 34 Years | 0 (0.0%) | 0 (0.0%) |
| 35 to 64 Years | 0 (0.0%) | 0 (0.0%) |
| 65 to 74 Years | 0 (0.0%) | 0 (0.0%) |
| 75 Years and over | 0 (0.0%) | 0 (0.0%) |
Disability Class: Self-Care Difficulty
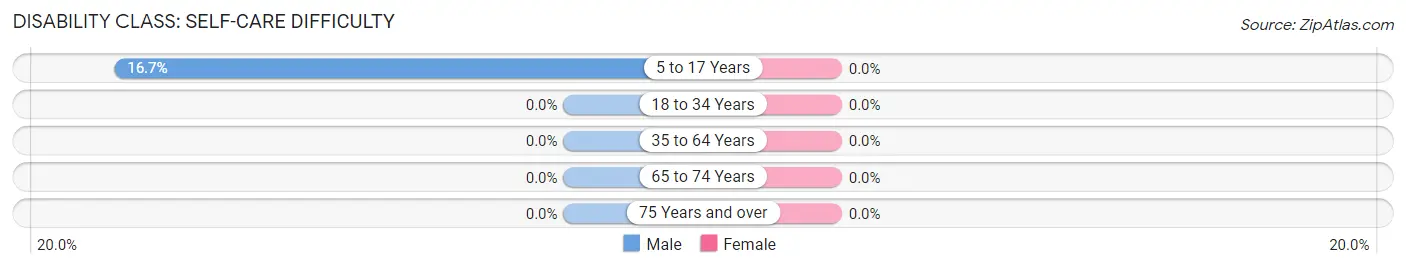
| Age Bracket | Male | Female |
| 5 to 17 Years | 2 (16.7%) | 0 (0.0%) |
| 18 to 34 Years | 0 (0.0%) | 0 (0.0%) |
| 35 to 64 Years | 0 (0.0%) | 0 (0.0%) |
| 65 to 74 Years | 0 (0.0%) | 0 (0.0%) |
| 75 Years and over | 0 (0.0%) | 0 (0.0%) |
Technology Access in Osgood
Computing Device Access in Osgood
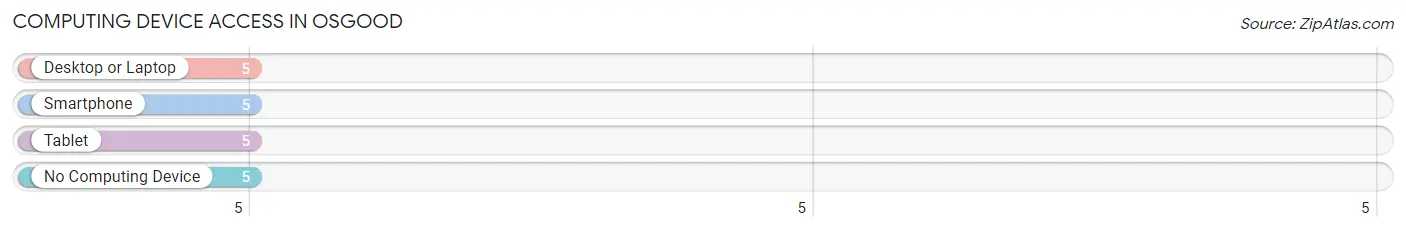
| Device Type | # Households | % Households |
| Desktop or Laptop | 5 | 50.0% |
| Smartphone | 5 | 50.0% |
| Tablet | 5 | 50.0% |
| No Computing Device | 5 | 50.0% |
| Total | 10 | 100.0% |
Internet Access in Osgood
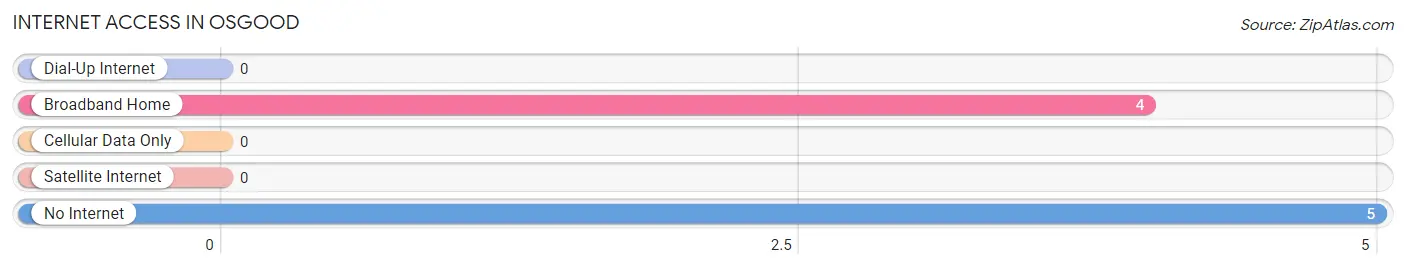
| Internet Type | # Households | % Households |
| Dial-Up Internet | 0 | 0.0% |
| Broadband Home | 4 | 40.0% |
| Cellular Data Only | 0 | 0.0% |
| Satellite Internet | 0 | 0.0% |
| No Internet | 5 | 50.0% |
| Total | 10 | 100.0% |
Osgood Summary
Osgood is a small town located in the northwest corner of Missouri, in the United States. It is situated in the northwest corner of the state, near the Iowa border. The town was founded in 1871 and is named after the Osgood family, who were early settlers in the area. The population of Osgood was estimated to be 1,072 in 2020.
Geography
Osgood is located in the northwest corner of Missouri, near the Iowa border. It is situated in the northwest corner of the state, near the Iowa border. The town is located in the Ozark Plateau region of Missouri, and is surrounded by rolling hills and wooded areas. The town is located in the Osage River Valley, and is situated on the banks of the Osage River. The town is located in the Central Time Zone.
Economy
Osgood’s economy is largely based on agriculture and manufacturing. The town is home to several small businesses, including a grocery store, a hardware store, a restaurant, and a gas station. The town is also home to several manufacturing companies, including a furniture factory, a plastics factory, and a metal fabrication plant.
Demographics
As of the 2020 census, the population of Osgood was estimated to be 1,072. The racial makeup of the town was 97.2% White, 0.7% African American, 0.3% Native American, 0.2% Asian, 0.1% Pacific Islander, 0.2% from other races, and 1.3% from two or more races. Hispanic or Latino of any race were 1.3% of the population.
The median income for a household in Osgood was $37,500, and the median income for a family was $45,000. The per capita income for the town was $18,000. About 11.2% of families and 14.2% of the population were below the poverty line, including 18.2% of those under age 18 and 8.3% of those age 65 or over.
History
Osgood was founded in 1871 by the Osgood family, who were early settlers in the area. The town was originally known as Osgoodville, but the name was changed to Osgood in 1876. The town was incorporated in 1883.
Osgood has a long history of agriculture and manufacturing. The town was home to several small businesses, including a grocery store, a hardware store, a restaurant, and a gas station. The town was also home to several manufacturing companies, including a furniture factory, a plastics factory, and a metal fabrication plant.
Osgood has also been home to several notable people, including former Missouri Governor Warren Hearnes, former U.S. Senator Thomas Eagleton, and former U.S. Representative Ike Skelton.
Osgood is a small town with a rich history and a bright future. The town is home to a diverse population and a strong economy. The town is also home to several small businesses and manufacturing companies, and is a great place to live and work.
Common Questions
What is the Total Population of Osgood?
Total Population of Osgood is 36.
What is the Total Male Population of Osgood?
Total Male Population of Osgood is 26.
What is the Total Female Population of Osgood?
Total Female Population of Osgood is 10.
What is the Ratio of Males per 100 Females in Osgood?
There are 260.00 Males per 100 Females in Osgood.
What is the Ratio of Females per 100 Males in Osgood?
There are 38.46 Females per 100 Males in Osgood.
What is the Median Population Age in Osgood?
Median Population Age in Osgood is 21.5 Years.
What is the Average Family Size in Osgood
Average Family Size in Osgood is 6.2 People.
What is the Average Household Size in Osgood
Average Household Size in Osgood is 3.6 People.
What is Per Capita Income in Osgood?
Per Capita income in Osgood is $46,872.
What is Inequality or Gini Index in Osgood?
Inequality or Gini Index in Osgood is 0.63.
How Large is the Labor Force in Osgood?
There are 17 People in the Labor Forcein in Osgood.
What is the Percentage of People in the Labor Force in Osgood?
77.3% of People are in the Labor Force in Osgood.