Greendale, MO
Greendale Map
Greendale Overview
833
TOTAL POPULATION
300
MALE POPULATION
533
FEMALE POPULATION
56.29
MALES / 100 FEMALES
177.67
FEMALES / 100 MALES
43.4
MEDIAN AGE
3.2
AVG FAMILY SIZE
2.3
AVG HOUSEHOLD SIZE
$24,570
PER CAPITA INCOME
$35,096
AVG HOUSEHOLD INCOME
5.6%
WAGE / INCOME GAP [ % ]
94.4¢/ $1
WAGE / INCOME GAP [ $ ]
0.47
INEQUALITY / GINI INDEX
266
LABOR FORCE [ PEOPLE ]
41.9%
PERCENT IN LABOR FORCE
7.5%
UNEMPLOYMENT RATE
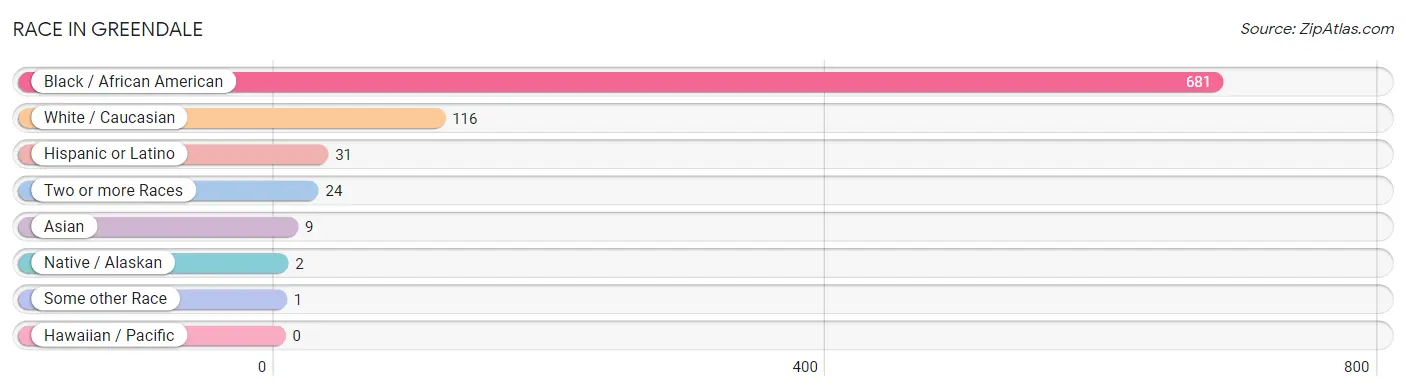
Race in Greendale
The most populous races in Greendale are Black / African American (681 | 81.8%), White / Caucasian (116 | 13.9%), and Hispanic or Latino (31 | 3.7%).
| Race | # Population | % Population |
| Asian | 9 | 1.1% |
| Black / African American | 681 | 81.8% |
| Hawaiian / Pacific | 0 | 0.0% |
| Hispanic or Latino | 31 | 3.7% |
| Native / Alaskan | 2 | 0.2% |
| White / Caucasian | 116 | 13.9% |
| Two or more Races | 24 | 2.9% |
| Some other Race | 1 | 0.1% |
| Total | 833 | 100.0% |
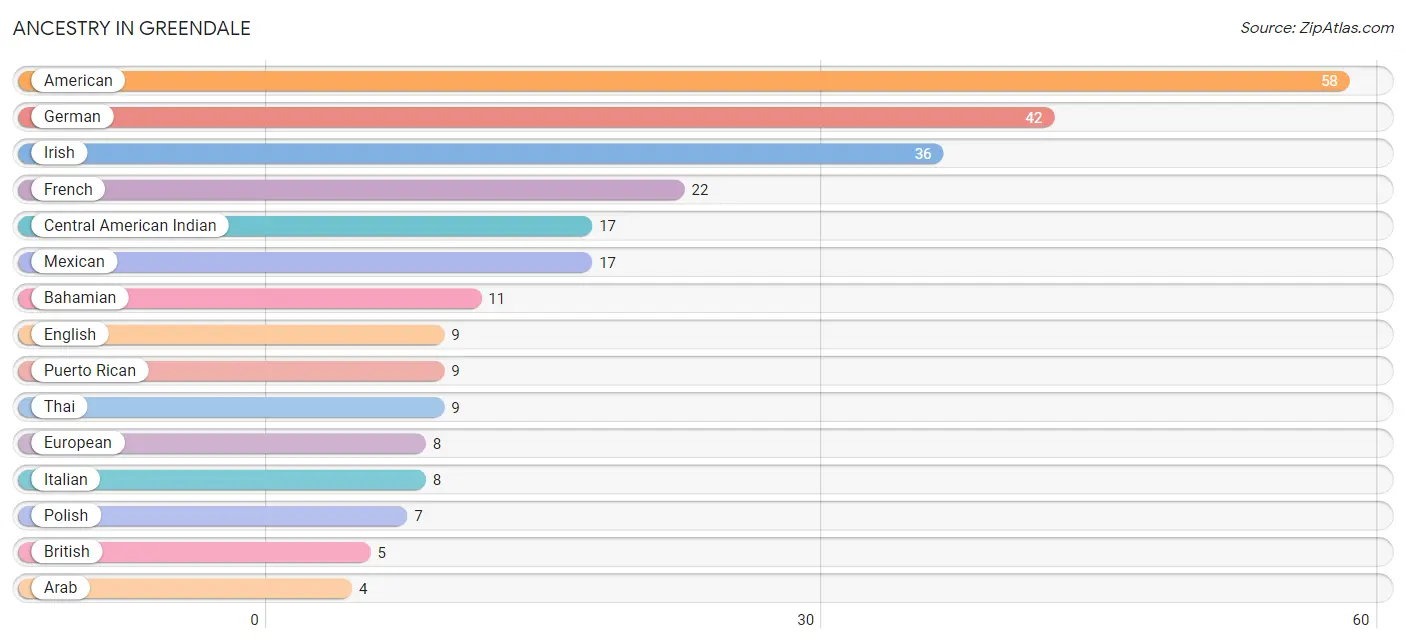
Ancestry in Greendale
The most populous ancestries reported in Greendale are American (58 | 7.0%), German (42 | 5.0%), Irish (36 | 4.3%), French (22 | 2.6%), and Central American Indian (17 | 2.0%), together accounting for 21.0% of all Greendale residents.
| Ancestry | # Population | % Population |
| American | 58 | 7.0% |
| Arab | 4 | 0.5% |
| Austrian | 2 | 0.2% |
| Bahamian | 11 | 1.3% |
| Belgian | 2 | 0.2% |
| British | 5 | 0.6% |
| Central American | 1 | 0.1% |
| Central American Indian | 17 | 2.0% |
| Cuban | 4 | 0.5% |
| English | 9 | 1.1% |
| European | 8 | 1.0% |
| French | 22 | 2.6% |
| German | 42 | 5.0% |
| Greek | 2 | 0.2% |
| Guatemalan | 1 | 0.1% |
| Hungarian | 2 | 0.2% |
| Irish | 36 | 4.3% |
| Italian | 8 | 1.0% |
| Korean | 2 | 0.2% |
| Mexican | 17 | 2.0% |
| Nigerian | 2 | 0.2% |
| Polish | 7 | 0.8% |
| Puerto Rican | 9 | 1.1% |
| Russian | 2 | 0.2% |
| Scotch-Irish | 1 | 0.1% |
| Scottish | 2 | 0.2% |
| Subsaharan African | 2 | 0.2% |
| Swedish | 2 | 0.2% |
| Thai | 9 | 1.1% | View All 29 Rows |
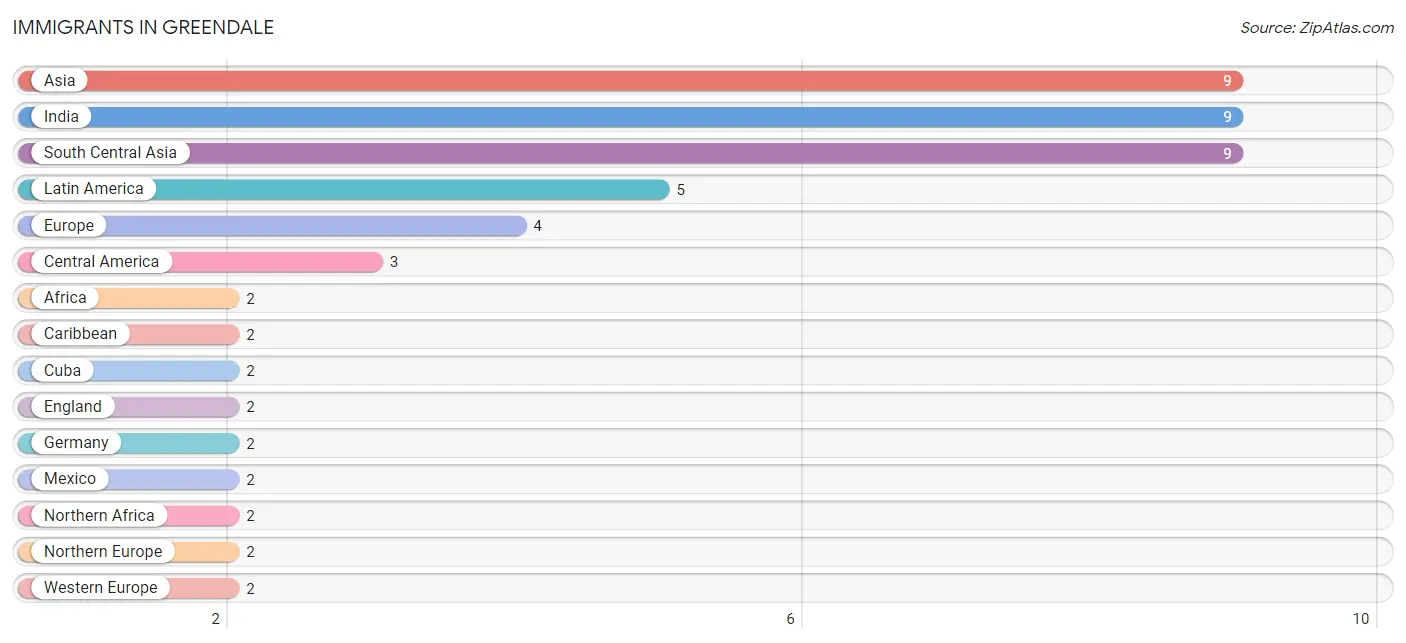
Immigrants in Greendale
The most numerous immigrant groups reported in Greendale came from Asia (9 | 1.1%), India (9 | 1.1%), South Central Asia (9 | 1.1%), Latin America (5 | 0.6%), and Europe (4 | 0.5%), together accounting for 4.3% of all Greendale residents.
| Immigration Origin | # Population | % Population |
| Africa | 2 | 0.2% |
| Asia | 9 | 1.1% |
| Caribbean | 2 | 0.2% |
| Central America | 3 | 0.4% |
| Cuba | 2 | 0.2% |
| England | 2 | 0.2% |
| Europe | 4 | 0.5% |
| Germany | 2 | 0.2% |
| Guatemala | 1 | 0.1% |
| India | 9 | 1.1% |
| Latin America | 5 | 0.6% |
| Mexico | 2 | 0.2% |
| Northern Africa | 2 | 0.2% |
| Northern Europe | 2 | 0.2% |
| South Central Asia | 9 | 1.1% |
| Western Europe | 2 | 0.2% | View All 16 Rows |
Sex and Age in Greendale
Sex and Age in Greendale
The most populous age groups in Greendale are Under 5 Years (74 | 24.7%) for men and 65 to 69 Years (110 | 20.6%) for women.
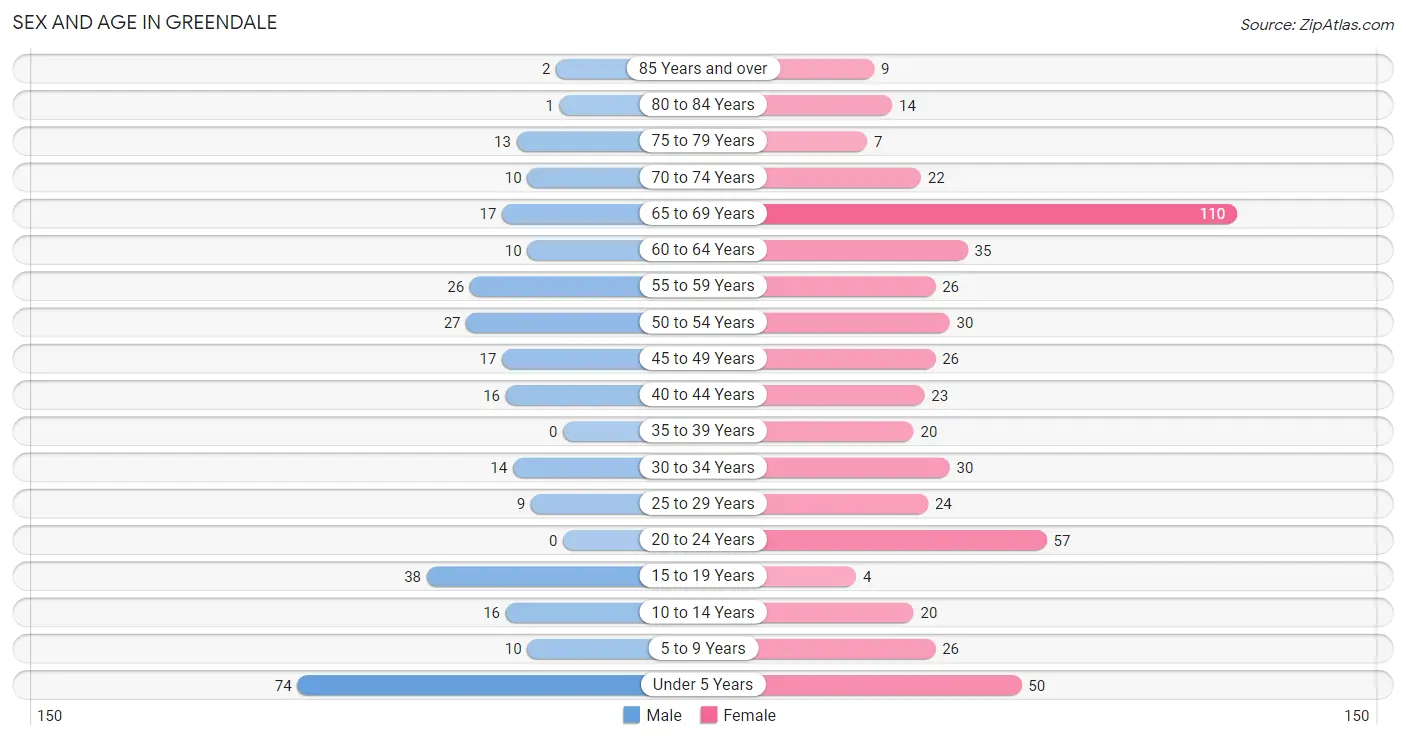
| Age Bracket | Male | Female |
| Under 5 Years | 74 (24.7%) | 50 (9.4%) |
| 5 to 9 Years | 10 (3.3%) | 26 (4.9%) |
| 10 to 14 Years | 16 (5.3%) | 20 (3.7%) |
| 15 to 19 Years | 38 (12.7%) | 4 (0.7%) |
| 20 to 24 Years | 0 (0.0%) | 57 (10.7%) |
| 25 to 29 Years | 9 (3.0%) | 24 (4.5%) |
| 30 to 34 Years | 14 (4.7%) | 30 (5.6%) |
| 35 to 39 Years | 0 (0.0%) | 20 (3.7%) |
| 40 to 44 Years | 16 (5.3%) | 23 (4.3%) |
| 45 to 49 Years | 17 (5.7%) | 26 (4.9%) |
| 50 to 54 Years | 27 (9.0%) | 30 (5.6%) |
| 55 to 59 Years | 26 (8.7%) | 26 (4.9%) |
| 60 to 64 Years | 10 (3.3%) | 35 (6.6%) |
| 65 to 69 Years | 17 (5.7%) | 110 (20.6%) |
| 70 to 74 Years | 10 (3.3%) | 22 (4.1%) |
| 75 to 79 Years | 13 (4.3%) | 7 (1.3%) |
| 80 to 84 Years | 1 (0.3%) | 14 (2.6%) |
| 85 Years and over | 2 (0.7%) | 9 (1.7%) |
| Total | 300 (100.0%) | 533 (100.0%) |
Families and Households in Greendale
Median Family Size in Greendale
The median family size in Greendale is 3.20 persons per family, with single male/father families (16 | 7.8%) accounting for the largest median family size of 3.38 persons per family. On the other hand, married-couple families (65 | 31.7%) represent the smallest median family size with 3.08 persons per family.
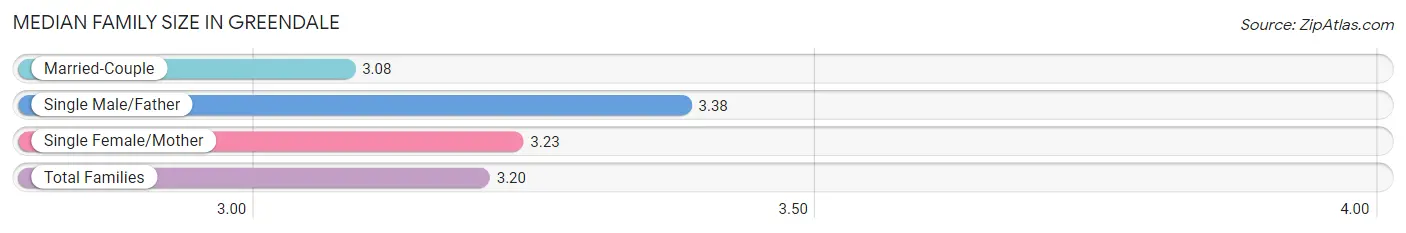
| Family Type | # Families | Family Size |
| Married-Couple | 65 (31.7%) | 3.08 |
| Single Male/Father | 16 (7.8%) | 3.38 |
| Single Female/Mother | 124 (60.5%) | 3.23 |
| Total Families | 205 (100.0%) | 3.20 |
Median Household Size in Greendale
The median household size in Greendale is 2.32 persons per household, with single male/father households (16 | 4.5%) accounting for the largest median household size of 3.38 persons per household. non-family households (154 | 42.9%) represent the smallest median household size with 1.06 persons per household.
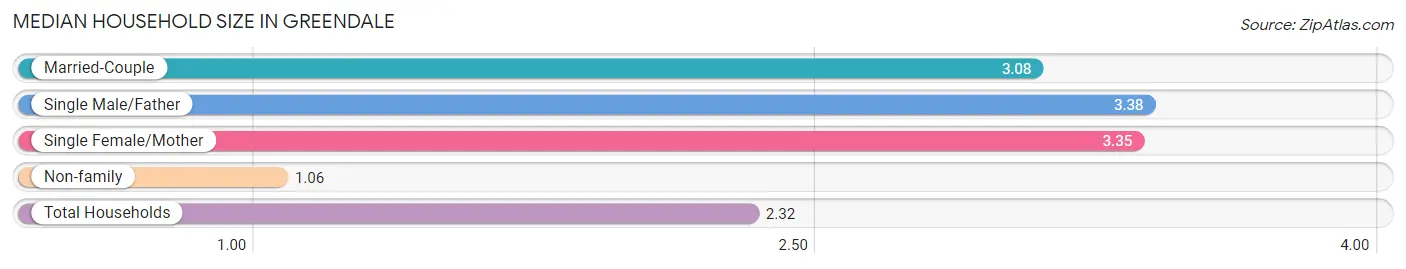
| Household Type | # Households | Household Size |
| Married-Couple | 65 (18.1%) | 3.08 |
| Single Male/Father | 16 (4.5%) | 3.38 |
| Single Female/Mother | 124 (34.5%) | 3.35 |
| Non-family | 154 (42.9%) | 1.06 |
| Total Households | 359 (100.0%) | 2.32 |
Household Size by Marriage Status in Greendale
Out of a total of 359 households in Greendale, 205 (57.1%) are family households, while 154 (42.9%) are nonfamily households. The most numerous type of family households are 5-person households, comprising 83, and the most common type of nonfamily households are 1-person households, comprising 145.
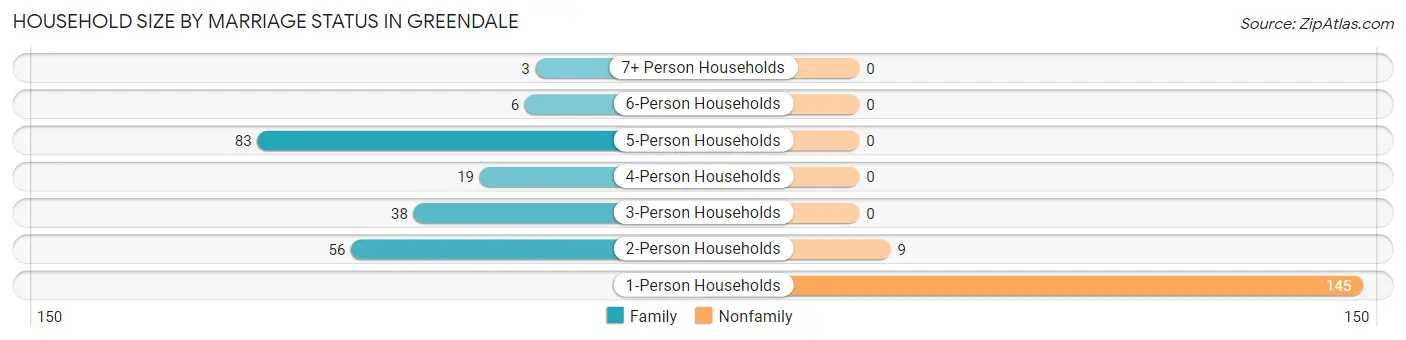
| Household Size | Family Households | Nonfamily Households |
| 1-Person Households | - | 145 (40.4%) |
| 2-Person Households | 56 (15.6%) | 9 (2.5%) |
| 3-Person Households | 38 (10.6%) | 0 (0.0%) |
| 4-Person Households | 19 (5.3%) | 0 (0.0%) |
| 5-Person Households | 83 (23.1%) | 0 (0.0%) |
| 6-Person Households | 6 (1.7%) | 0 (0.0%) |
| 7+ Person Households | 3 (0.8%) | 0 (0.0%) |
| Total | 205 (57.1%) | 154 (42.9%) |
Female Fertility in Greendale
Fertility by Age in Greendale
Average fertility rate in Greendale is 122.0 births per 1,000 women. Women in the age bracket of 20 to 34 years have the highest fertility rate with 216.0 births per 1,000 women. Women in the age bracket of 20 to 34 years acount for 100.0% of all women with births.
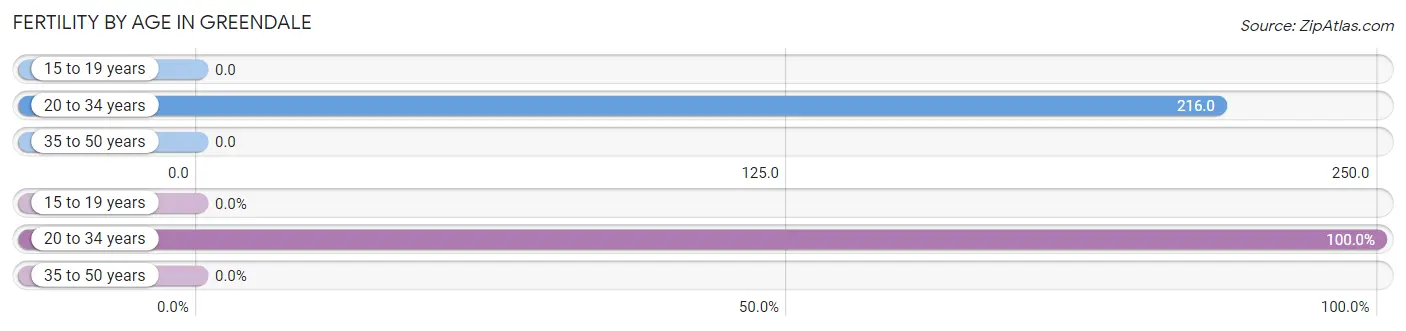
| Age Bracket | Women with Births | Births / 1,000 Women |
| 15 to 19 years | 0 (0.0%) | 0.0 |
| 20 to 34 years | 24 (100.0%) | 216.0 |
| 35 to 50 years | 0 (0.0%) | 0.0 |
| Total | 24 (100.0%) | 122.0 |
Fertility by Age by Marriage Status in Greendale
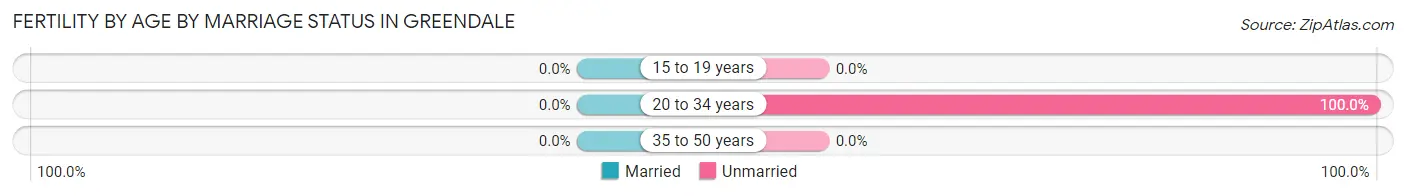
| Age Bracket | Married | Unmarried |
| 15 to 19 years | 0 (0.0%) | 0 (0.0%) |
| 20 to 34 years | 0 (0.0%) | 24 (100.0%) |
| 35 to 50 years | 0 (0.0%) | 0 (0.0%) |
| Total | 0 (0.0%) | 24 (100.0%) |
Fertility by Education in Greendale
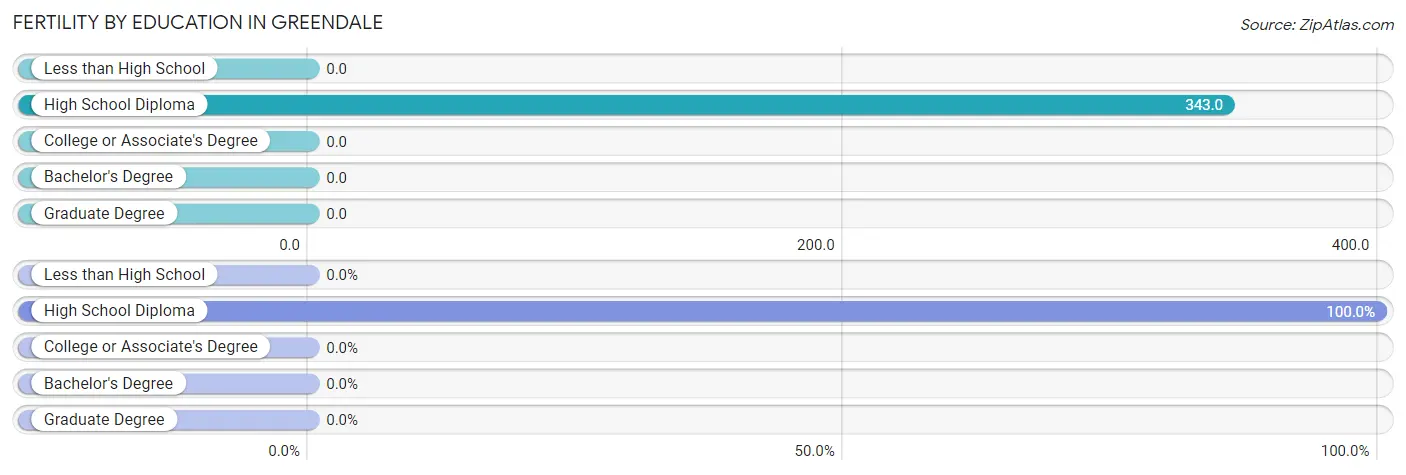
| Educational Attainment | Women with Births | Births / 1,000 Women |
| Less than High School | 0 (0.0%) | 0.0 |
| High School Diploma | 24 (100.0%) | 343.0 |
| College or Associate's Degree | 0 (0.0%) | 0.0 |
| Bachelor's Degree | 0 (0.0%) | 0.0 |
| Graduate Degree | 0 (0.0%) | 0.0 |
| Total | 24 (100.0%) | 122.0 |
Fertility by Education by Marriage Status in Greendale
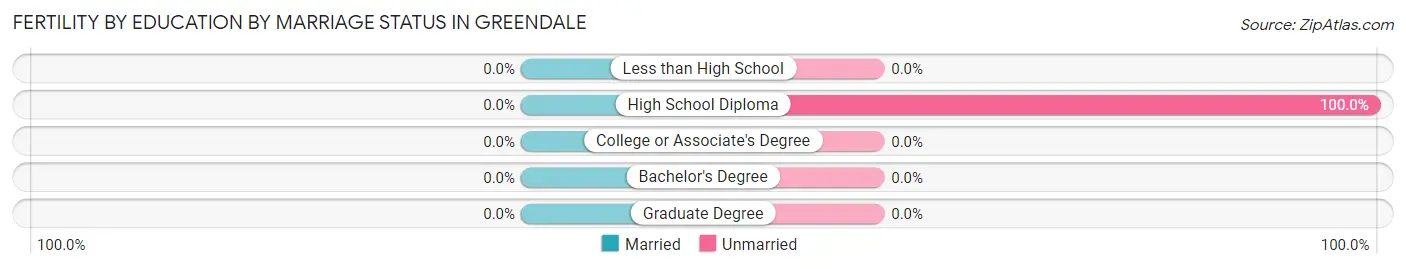
| Educational Attainment | Married | Unmarried |
| Less than High School | 0 (0.0%) | 0 (0.0%) |
| High School Diploma | 0 (0.0%) | 24 (100.0%) |
| College or Associate's Degree | 0 (0.0%) | 0 (0.0%) |
| Bachelor's Degree | 0 (0.0%) | 0 (0.0%) |
| Graduate Degree | 0 (0.0%) | 0 (0.0%) |
| Total | 0 (0.0%) | 24 (100.0%) |
Income in Greendale
Income Overview in Greendale
| Characteristic | Number | Measure |
| Per Capita Income | 833 | $24,570 |
| Median Family Income | 205 | $0 |
| Mean Family Income | 205 | $47,236 |
| Median Household Income | 359 | $35,096 |
| Mean Household Income | 359 | $56,558 |
| Income Deficit | 205 | $0 |
| Wage / Income Gap (%) | 833 | 5.55% |
| Wage / Income Gap ($) | 833 | 94.45¢ per $1 |
| Gini / Inequality Index | 833 | 0.47 |
Earnings by Sex in Greendale
Average Earnings in Greendale are $36,250, $37,167 for men and $35,104 for women, a difference of 5.6%.
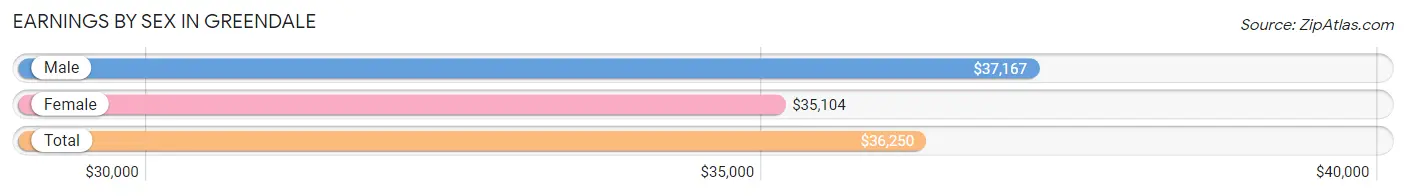
| Sex | Number | Average Earnings |
| Male | 98 (37.3%) | $37,167 |
| Female | 165 (62.7%) | $35,104 |
| Total | 263 (100.0%) | $36,250 |
Earnings by Sex by Income Bracket in Greendale
The most common earnings brackets in Greendale are $35,000 to $39,999 for men (23 | 23.5%) and $12,500 to $14,999 for women (21 | 12.7%).
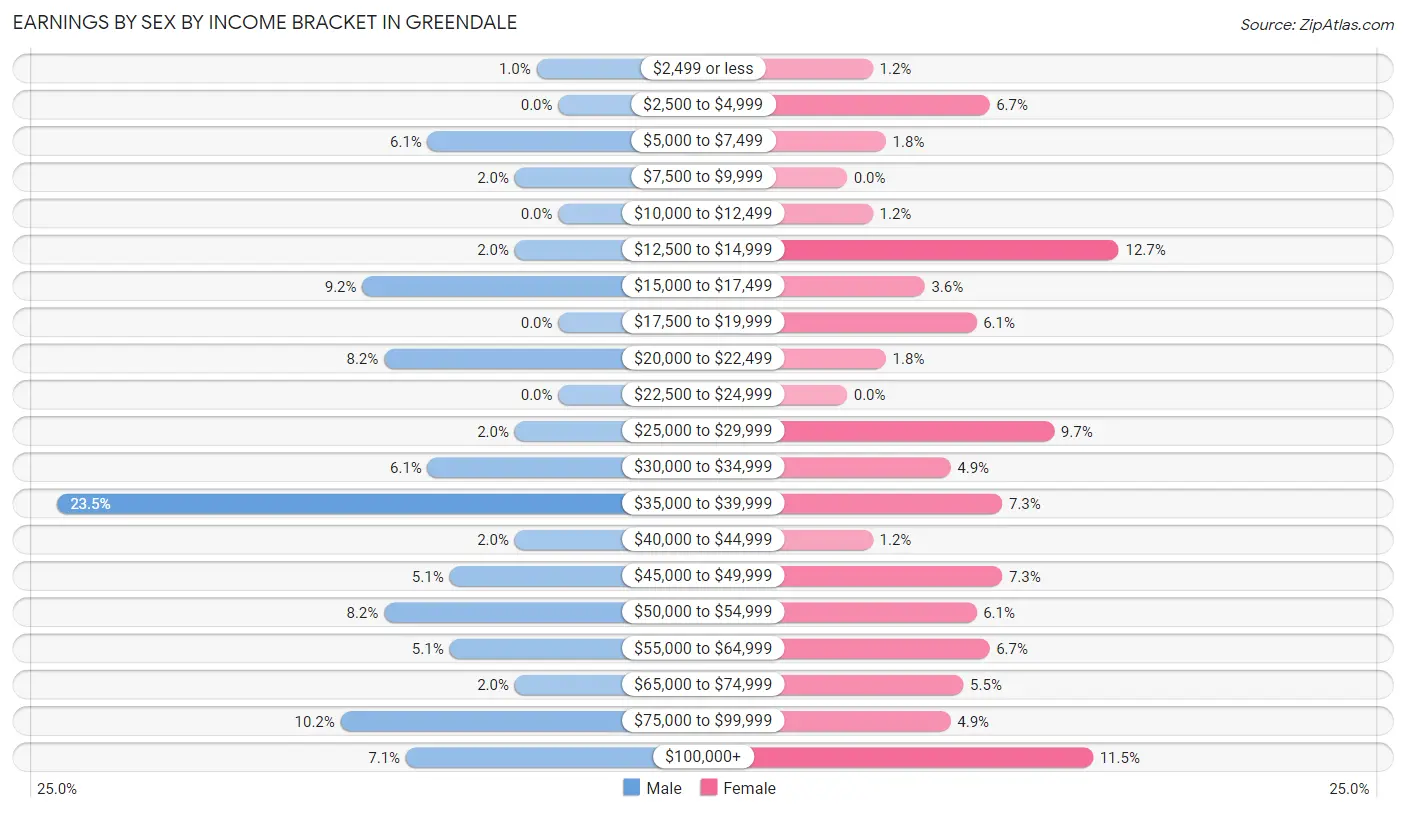
| Income | Male | Female |
| $2,499 or less | 1 (1.0%) | 2 (1.2%) |
| $2,500 to $4,999 | 0 (0.0%) | 11 (6.7%) |
| $5,000 to $7,499 | 6 (6.1%) | 3 (1.8%) |
| $7,500 to $9,999 | 2 (2.0%) | 0 (0.0%) |
| $10,000 to $12,499 | 0 (0.0%) | 2 (1.2%) |
| $12,500 to $14,999 | 2 (2.0%) | 21 (12.7%) |
| $15,000 to $17,499 | 9 (9.2%) | 6 (3.6%) |
| $17,500 to $19,999 | 0 (0.0%) | 10 (6.1%) |
| $20,000 to $22,499 | 8 (8.2%) | 3 (1.8%) |
| $22,500 to $24,999 | 0 (0.0%) | 0 (0.0%) |
| $25,000 to $29,999 | 2 (2.0%) | 16 (9.7%) |
| $30,000 to $34,999 | 6 (6.1%) | 8 (4.9%) |
| $35,000 to $39,999 | 23 (23.5%) | 12 (7.3%) |
| $40,000 to $44,999 | 2 (2.0%) | 2 (1.2%) |
| $45,000 to $49,999 | 5 (5.1%) | 12 (7.3%) |
| $50,000 to $54,999 | 8 (8.2%) | 10 (6.1%) |
| $55,000 to $64,999 | 5 (5.1%) | 11 (6.7%) |
| $65,000 to $74,999 | 2 (2.0%) | 9 (5.4%) |
| $75,000 to $99,999 | 10 (10.2%) | 8 (4.9%) |
| $100,000+ | 7 (7.1%) | 19 (11.5%) |
| Total | 98 (100.0%) | 165 (100.0%) |
Earnings by Sex by Educational Attainment in Greendale
Average earnings in Greendale are $37,250 for men and $32,188 for women, a difference of 13.6%. Men with an educational attainment of bachelor's degree enjoy the highest average annual earnings of $86,875, while those with college or associate's degree education earn the least with $33,750. Women with an educational attainment of graduate degree earn the most with the average annual earnings of $76,250, while those with high school diploma education have the smallest earnings of $27,917.
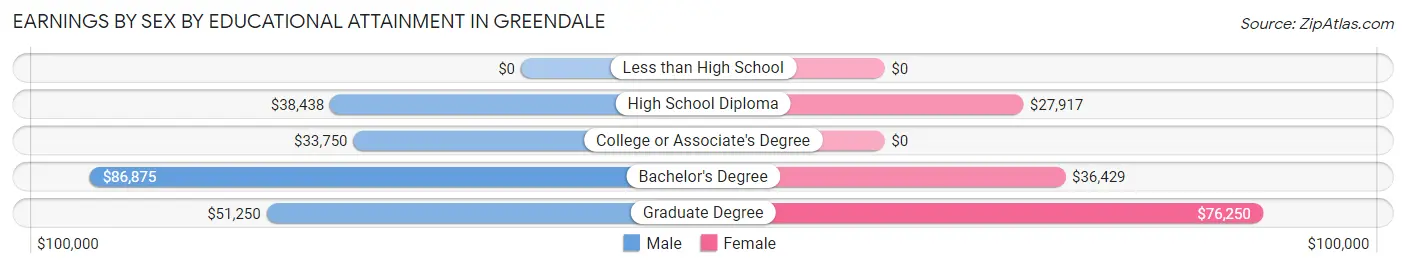
| Educational Attainment | Male Income | Female Income |
| Less than High School | - | - |
| High School Diploma | $38,438 | $27,917 |
| College or Associate's Degree | $33,750 | $0 |
| Bachelor's Degree | $86,875 | $36,429 |
| Graduate Degree | $51,250 | $76,250 |
| Total | $37,250 | $32,188 |
Family Income in Greendale
Family Income Brackets in Greendale
According to the Greendale family income data, there are 86 families falling into the $10,000 to $14,999 income range, which is the most common income bracket and makes up 41.9% of all families. Conversely, the $150,000 to $199,999 income bracket is the least frequent group with only 2 families (1.0%) belonging to this category.
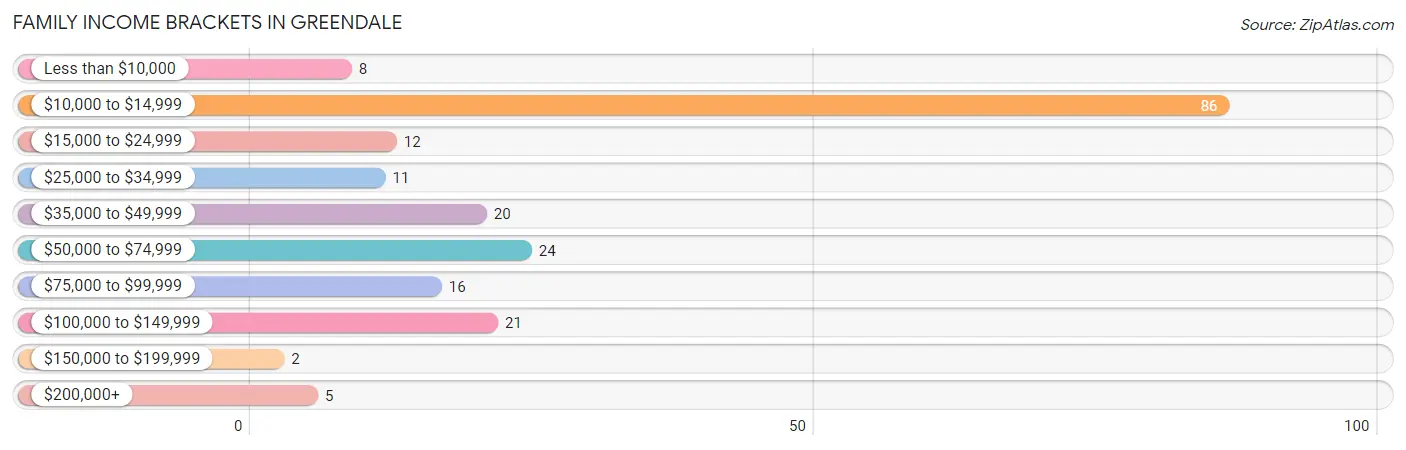
| Income Bracket | # Families | % Families |
| Less than $10,000 | 8 | 3.9% |
| $10,000 to $14,999 | 86 | 42.0% |
| $15,000 to $24,999 | 12 | 5.9% |
| $25,000 to $34,999 | 11 | 5.4% |
| $35,000 to $49,999 | 20 | 9.8% |
| $50,000 to $74,999 | 24 | 11.7% |
| $75,000 to $99,999 | 16 | 7.8% |
| $100,000 to $149,999 | 21 | 10.2% |
| $150,000 to $199,999 | 2 | 1.0% |
| $200,000+ | 5 | 2.4% |
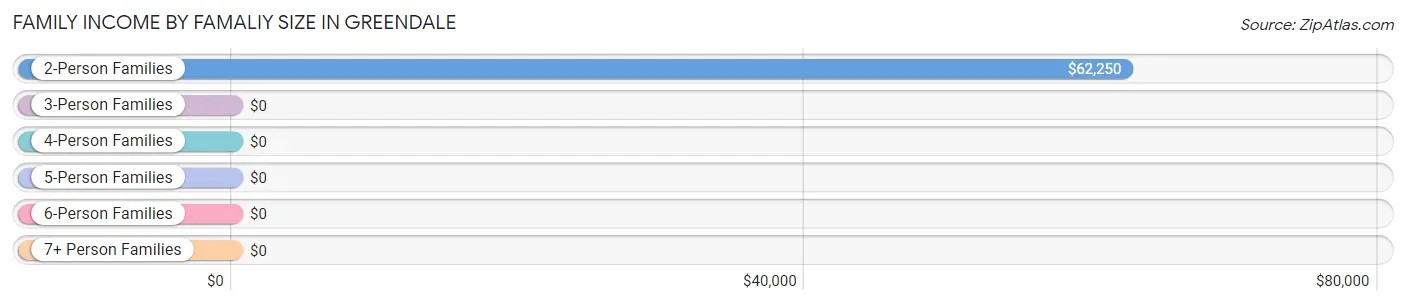
Family Income by Famaliy Size in Greendale
2-person families (57 | 27.8%) account for the highest median family income in Greendale with $62,250 per family, while 2-person families (57 | 27.8%) have the highest median income of $31,125 per family member.
| Income Bracket | # Families | Median Income |
| 2-Person Families | 57 (27.8%) | $62,250 |
| 3-Person Families | 37 (18.0%) | $0 |
| 4-Person Families | 90 (43.9%) | $0 |
| 5-Person Families | 12 (5.9%) | $0 |
| 6-Person Families | 6 (2.9%) | $0 |
| 7+ Person Families | 3 (1.5%) | $0 |
| Total | 205 (100.0%) | $0 |
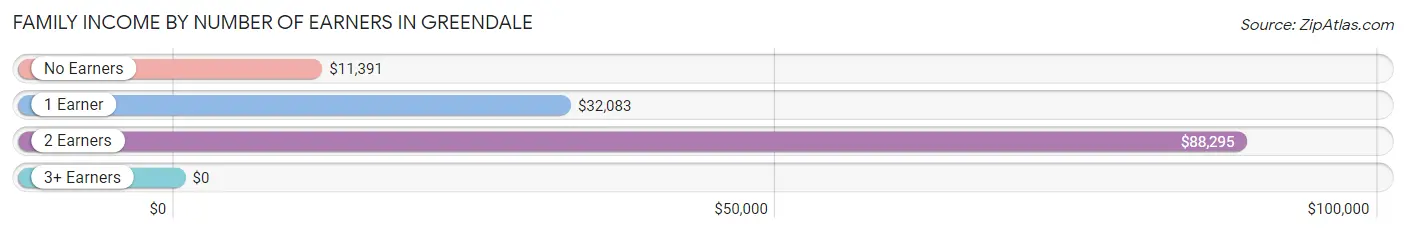
Family Income by Number of Earners in Greendale
| Number of Earners | # Families | Median Income |
| No Earners | 91 (44.4%) | $11,391 |
| 1 Earner | 69 (33.7%) | $32,083 |
| 2 Earners | 37 (18.0%) | $88,295 |
| 3+ Earners | 8 (3.9%) | $0 |
| Total | 205 (100.0%) | $0 |
Household Income in Greendale
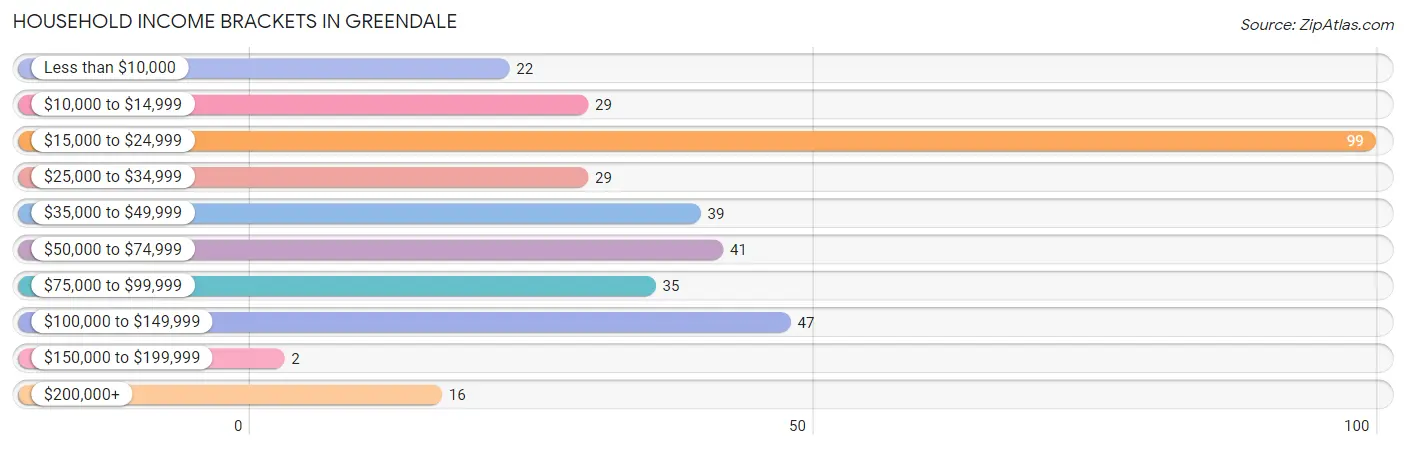
Household Income Brackets in Greendale
With 99 households falling in the category, the $15,000 to $24,999 income range is the most frequent in Greendale, accounting for 27.6% of all households. In contrast, only 2 households (0.6%) fall into the $150,000 to $199,999 income bracket, making it the least populous group.
| Income Bracket | # Households | % Households |
| Less than $10,000 | 22 | 6.1% |
| $10,000 to $14,999 | 29 | 8.1% |
| $15,000 to $24,999 | 99 | 27.6% |
| $25,000 to $34,999 | 29 | 8.1% |
| $35,000 to $49,999 | 39 | 10.9% |
| $50,000 to $74,999 | 41 | 11.4% |
| $75,000 to $99,999 | 35 | 9.7% |
| $100,000 to $149,999 | 47 | 13.1% |
| $150,000 to $199,999 | 2 | 0.6% |
| $200,000+ | 16 | 4.5% |
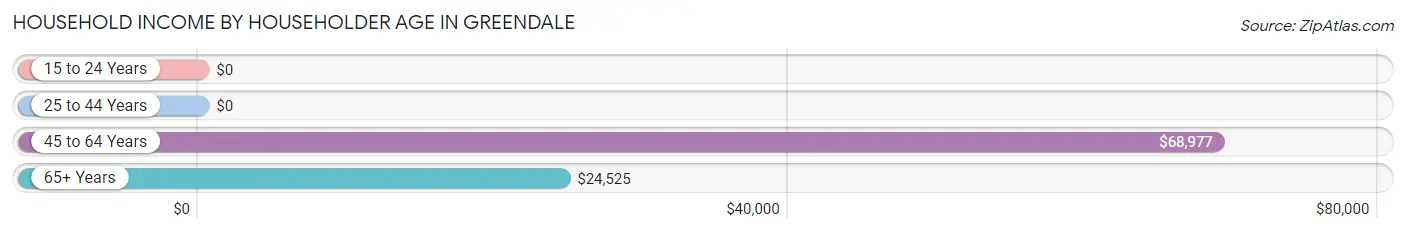
Household Income by Householder Age in Greendale
The median household income in Greendale is $35,096, with the highest median household income of $68,977 found in the 45 to 64 years age bracket for the primary householder. A total of 125 households (34.8%) fall into this category.
| Income Bracket | # Households | Median Income |
| 15 to 24 Years | 0 (0.0%) | $0 |
| 25 to 44 Years | 59 (16.4%) | $0 |
| 45 to 64 Years | 125 (34.8%) | $68,977 |
| 65+ Years | 175 (48.7%) | $24,525 |
| Total | 359 (100.0%) | $35,096 |
Poverty in Greendale
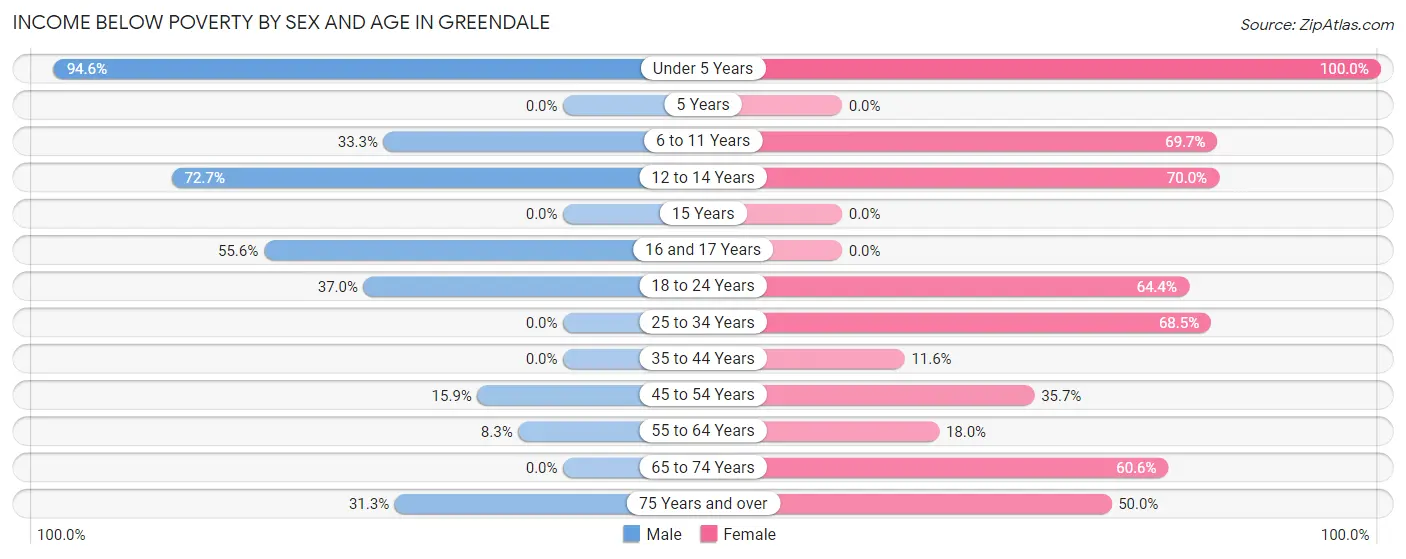
Income Below Poverty by Sex and Age in Greendale
With 37.7% poverty level for males and 53.7% for females among the residents of Greendale, under 5 year old males and under 5 year old females are the most vulnerable to poverty, with 70 males (94.6%) and 50 females (100.0%) in their respective age groups living below the poverty level.
| Age Bracket | Male | Female |
| Under 5 Years | 70 (94.6%) | 50 (100.0%) |
| 5 Years | 0 (0.0%) | 0 (0.0%) |
| 6 to 11 Years | 5 (33.3%) | 23 (69.7%) |
| 12 to 14 Years | 8 (72.7%) | 7 (70.0%) |
| 15 Years | 0 (0.0%) | 0 (0.0%) |
| 16 and 17 Years | 5 (55.6%) | 0 (0.0%) |
| 18 to 24 Years | 10 (37.0%) | 38 (64.4%) |
| 25 to 34 Years | 0 (0.0%) | 37 (68.5%) |
| 35 to 44 Years | 0 (0.0%) | 5 (11.6%) |
| 45 to 54 Years | 7 (15.9%) | 20 (35.7%) |
| 55 to 64 Years | 3 (8.3%) | 11 (18.0%) |
| 65 to 74 Years | 0 (0.0%) | 80 (60.6%) |
| 75 Years and over | 5 (31.2%) | 15 (50.0%) |
| Total | 113 (37.7%) | 286 (53.7%) |
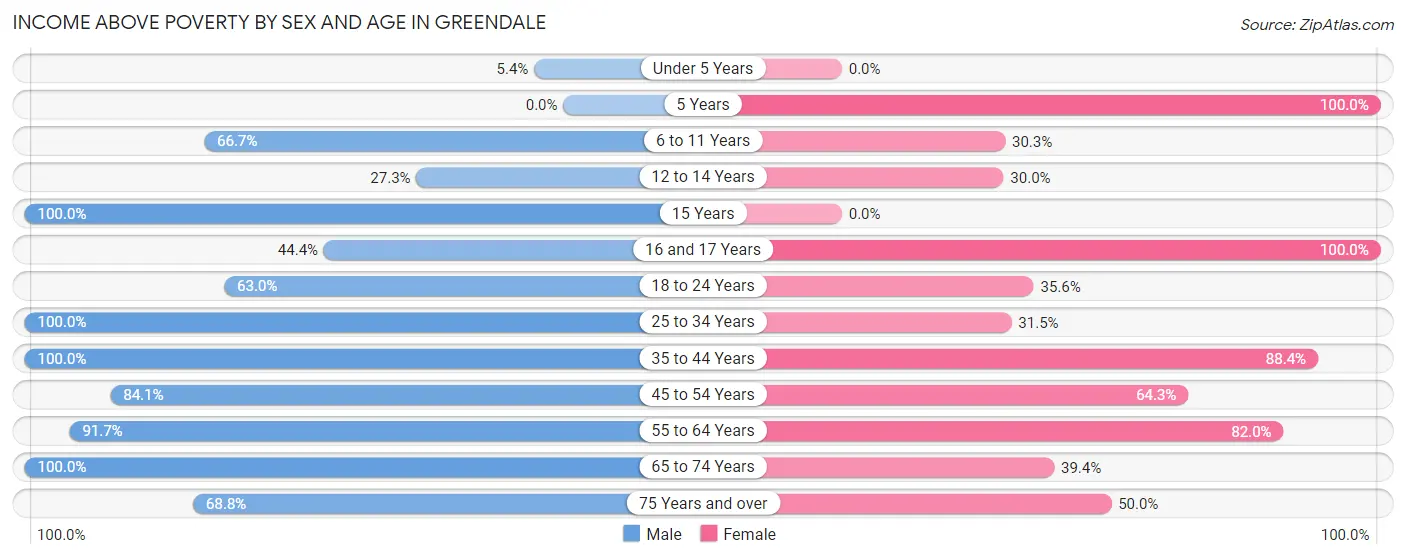
Income Above Poverty by Sex and Age in Greendale
According to the poverty statistics in Greendale, males aged 15 years and females aged 5 years are the age groups that are most secure financially, with 100.0% of males and 100.0% of females in these age groups living above the poverty line.
| Age Bracket | Male | Female |
| Under 5 Years | 4 (5.4%) | 0 (0.0%) |
| 5 Years | 0 (0.0%) | 3 (100.0%) |
| 6 to 11 Years | 10 (66.7%) | 10 (30.3%) |
| 12 to 14 Years | 3 (27.3%) | 3 (30.0%) |
| 15 Years | 2 (100.0%) | 0 (0.0%) |
| 16 and 17 Years | 4 (44.4%) | 2 (100.0%) |
| 18 to 24 Years | 17 (63.0%) | 21 (35.6%) |
| 25 to 34 Years | 23 (100.0%) | 17 (31.5%) |
| 35 to 44 Years | 16 (100.0%) | 38 (88.4%) |
| 45 to 54 Years | 37 (84.1%) | 36 (64.3%) |
| 55 to 64 Years | 33 (91.7%) | 50 (82.0%) |
| 65 to 74 Years | 27 (100.0%) | 52 (39.4%) |
| 75 Years and over | 11 (68.8%) | 15 (50.0%) |
| Total | 187 (62.3%) | 247 (46.3%) |
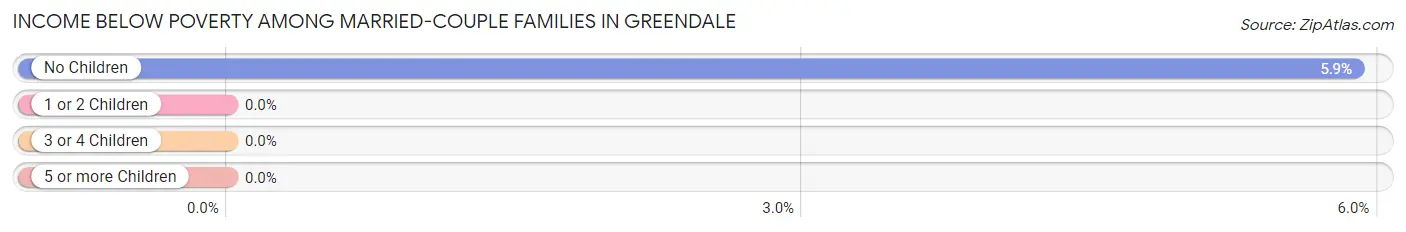
Income Below Poverty Among Married-Couple Families in Greendale
The poverty statistics for married-couple families in Greendale show that 4.6% or 3 of the total 65 families live below the poverty line. Families with no children have the highest poverty rate of 5.9%, comprising of 3 families. On the other hand, families with 1 or 2 children have the lowest poverty rate of 0.0%, which includes 0 families.
| Children | Above Poverty | Below Poverty |
| No Children | 48 (94.1%) | 3 (5.9%) |
| 1 or 2 Children | 8 (100.0%) | 0 (0.0%) |
| 3 or 4 Children | 3 (100.0%) | 0 (0.0%) |
| 5 or more Children | 3 (100.0%) | 0 (0.0%) |
| Total | 62 (95.4%) | 3 (4.6%) |
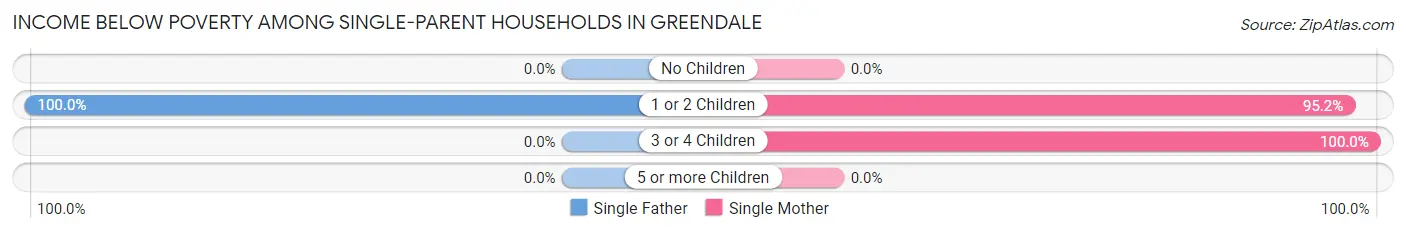
Income Below Poverty Among Single-Parent Households in Greendale
According to the poverty data in Greendale, 43.8% or 7 single-father households and 83.1% or 103 single-mother households are living below the poverty line. Among single-father households, those with 1 or 2 children have the highest poverty rate, with 7 households (100.0%) experiencing poverty. Likewise, among single-mother households, those with 3 or 4 children have the highest poverty rate, with 3 households (100.0%) falling below the poverty line.
| Children | Single Father | Single Mother |
| No Children | 0 (0.0%) | 0 (0.0%) |
| 1 or 2 Children | 7 (100.0%) | 100 (95.2%) |
| 3 or 4 Children | 0 (0.0%) | 3 (100.0%) |
| 5 or more Children | 0 (0.0%) | 0 (0.0%) |
| Total | 7 (43.8%) | 103 (83.1%) |
Income Below Poverty Among Married-Couple vs Single-Parent Households in Greendale
The poverty data for Greendale shows that 3 of the married-couple family households (4.6%) and 110 of the single-parent households (78.6%) are living below the poverty level. Within the married-couple family households, those with no children have the highest poverty rate, with 3 households (5.9%) falling below the poverty line. Among the single-parent households, those with 3 or 4 children have the highest poverty rate, with 3 household (100.0%) living below poverty.
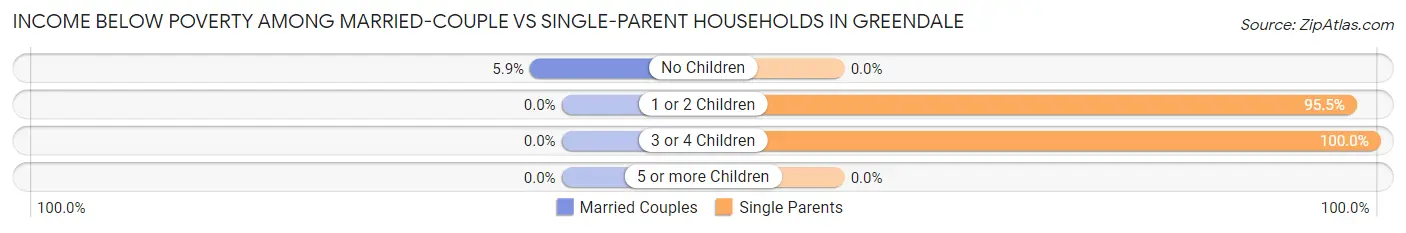
| Children | Married-Couple Families | Single-Parent Households |
| No Children | 3 (5.9%) | 0 (0.0%) |
| 1 or 2 Children | 0 (0.0%) | 107 (95.5%) |
| 3 or 4 Children | 0 (0.0%) | 3 (100.0%) |
| 5 or more Children | 0 (0.0%) | 0 (0.0%) |
| Total | 3 (4.6%) | 110 (78.6%) |
Employment Characteristics in Greendale
Employment by Class of Employer in Greendale
Among the 244 employed individuals in Greendale, private company employees (154 | 63.1%), not-for-profit organizations (29 | 11.9%), and federal government employees (23 | 9.4%) make up the most common classes of employment.
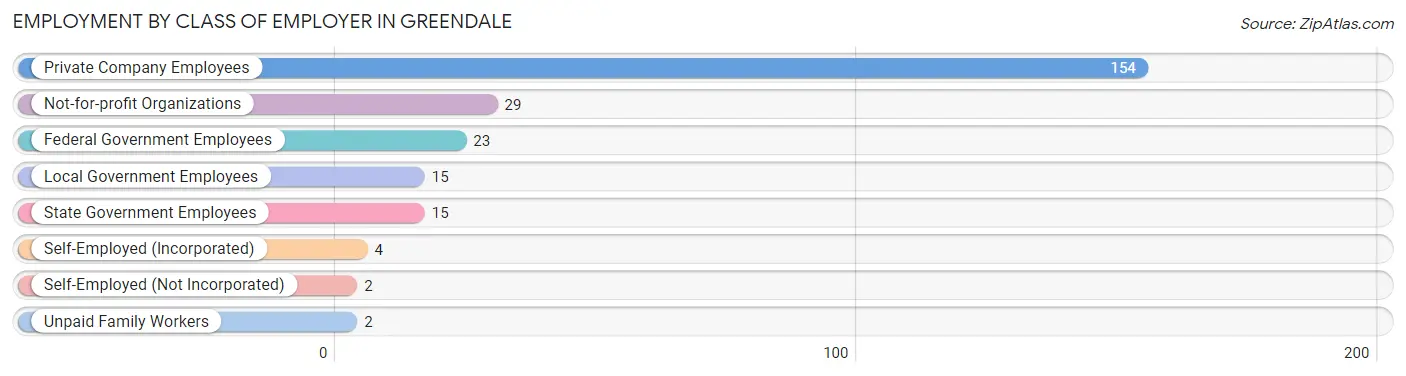
| Employer Class | # Employees | % Employees |
| Private Company Employees | 154 | 63.1% |
| Self-Employed (Incorporated) | 4 | 1.6% |
| Self-Employed (Not Incorporated) | 2 | 0.8% |
| Not-for-profit Organizations | 29 | 11.9% |
| Local Government Employees | 15 | 6.1% |
| State Government Employees | 15 | 6.1% |
| Federal Government Employees | 23 | 9.4% |
| Unpaid Family Workers | 2 | 0.8% |
| Total | 244 | 100.0% |
Employment Status by Age in Greendale
According to the labor force statistics for Greendale, out of the total population over 16 years of age (635), 41.9% or 266 individuals are in the labor force, with 7.5% or 20 of them unemployed. The age group with the highest labor force participation rate is 35 to 44 years, with 89.8% or 53 individuals in the labor force. Within the labor force, the 20 to 24 years age range has the highest percentage of unemployed individuals, with 66.7% or 10 of them being unemployed.
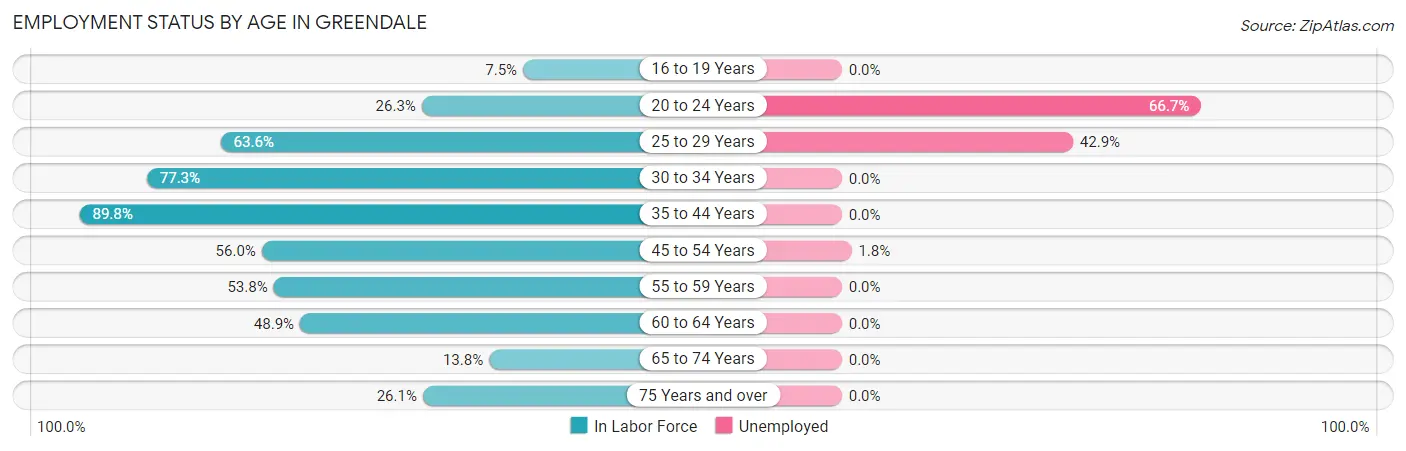
| Age Bracket | In Labor Force | Unemployed |
| 16 to 19 Years | 3 (7.5%) | 0 (0.0%) |
| 20 to 24 Years | 15 (26.3%) | 10 (66.7%) |
| 25 to 29 Years | 21 (63.6%) | 9 (42.9%) |
| 30 to 34 Years | 34 (77.3%) | 0 (0.0%) |
| 35 to 44 Years | 53 (89.8%) | 0 (0.0%) |
| 45 to 54 Years | 56 (56.0%) | 1 (1.8%) |
| 55 to 59 Years | 28 (53.8%) | 0 (0.0%) |
| 60 to 64 Years | 22 (48.9%) | 0 (0.0%) |
| 65 to 74 Years | 22 (13.8%) | 0 (0.0%) |
| 75 Years and over | 12 (26.1%) | 0 (0.0%) |
| Total | 266 (41.9%) | 20 (7.5%) |
Employment Status by Educational Attainment in Greendale
According to labor force statistics for Greendale, 64.3% of individuals (214) out of the total population between 25 and 64 years of age (333) are in the labor force, with 4.7% or 10 of them being unemployed. The group with the highest labor force participation rate are those with the educational attainment of bachelor's degree or higher, with 90.2% or 92 individuals in the labor force. Within the labor force, individuals with less than high school education have the highest percentage of unemployment, with 64.3% or 9 of them being unemployed.
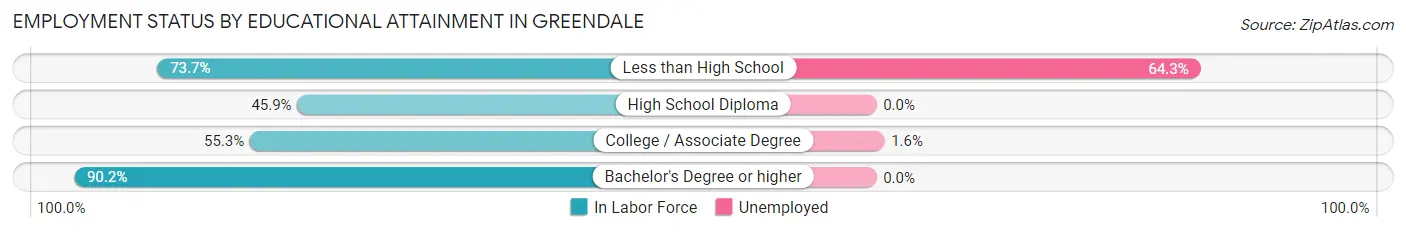
| Educational Attainment | In Labor Force | Unemployed |
| Less than High School | 14 (73.7%) | 12 (64.3%) |
| High School Diploma | 45 (45.9%) | 0 (0.0%) |
| College / Associate Degree | 63 (55.3%) | 2 (1.6%) |
| Bachelor's Degree or higher | 92 (90.2%) | 0 (0.0%) |
| Total | 214 (64.3%) | 16 (4.7%) |
Employment Occupations by Sex in Greendale
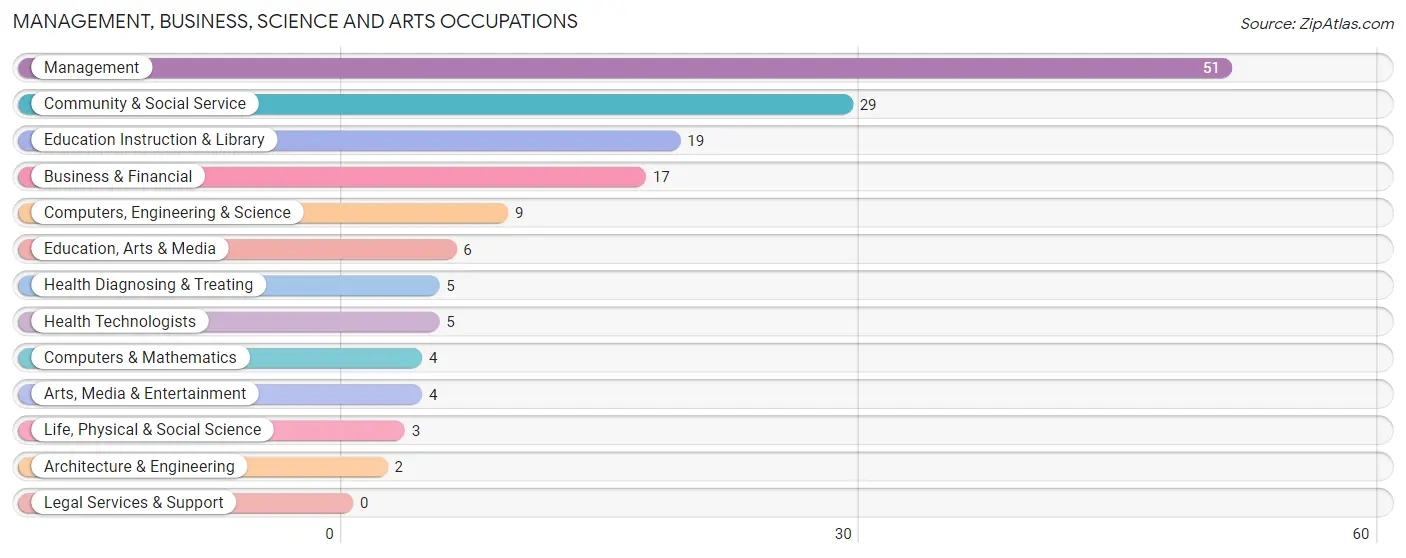
Management, Business, Science and Arts Occupations
The most common Management, Business, Science and Arts occupations in Greendale are Management (51 | 20.7%), Community & Social Service (29 | 11.8%), Education Instruction & Library (19 | 7.7%), Business & Financial (17 | 6.9%), and Computers, Engineering & Science (9 | 3.7%).
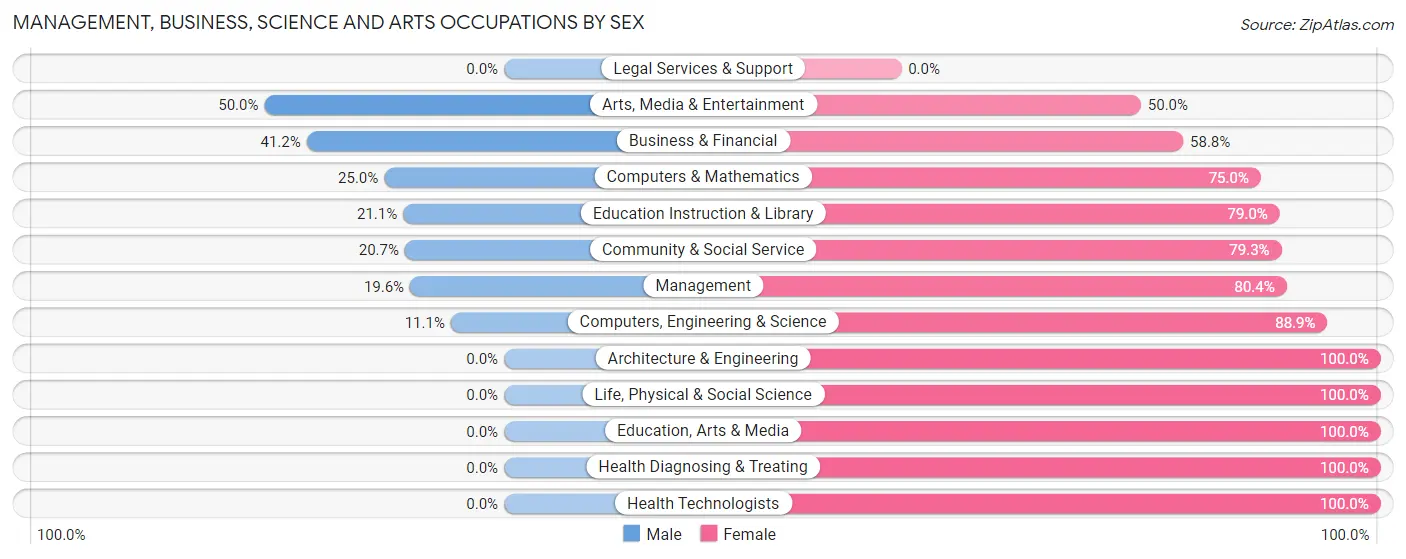
Management, Business, Science and Arts Occupations by Sex
Within the Management, Business, Science and Arts occupations in Greendale, the most male-oriented occupations are Arts, Media & Entertainment (50.0%), Business & Financial (41.2%), and Computers & Mathematics (25.0%), while the most female-oriented occupations are Architecture & Engineering (100.0%), Life, Physical & Social Science (100.0%), and Education, Arts & Media (100.0%).
| Occupation | Male | Female |
| Management | 10 (19.6%) | 41 (80.4%) |
| Business & Financial | 7 (41.2%) | 10 (58.8%) |
| Computers, Engineering & Science | 1 (11.1%) | 8 (88.9%) |
| Computers & Mathematics | 1 (25.0%) | 3 (75.0%) |
| Architecture & Engineering | 0 (0.0%) | 2 (100.0%) |
| Life, Physical & Social Science | 0 (0.0%) | 3 (100.0%) |
| Community & Social Service | 6 (20.7%) | 23 (79.3%) |
| Education, Arts & Media | 0 (0.0%) | 6 (100.0%) |
| Legal Services & Support | 0 (0.0%) | 0 (0.0%) |
| Education Instruction & Library | 4 (21.0%) | 15 (78.9%) |
| Arts, Media & Entertainment | 2 (50.0%) | 2 (50.0%) |
| Health Diagnosing & Treating | 0 (0.0%) | 5 (100.0%) |
| Health Technologists | 0 (0.0%) | 5 (100.0%) |
| Total (Category) | 24 (21.6%) | 87 (78.4%) |
| Total (Overall) | 86 (35.0%) | 160 (65.0%) |
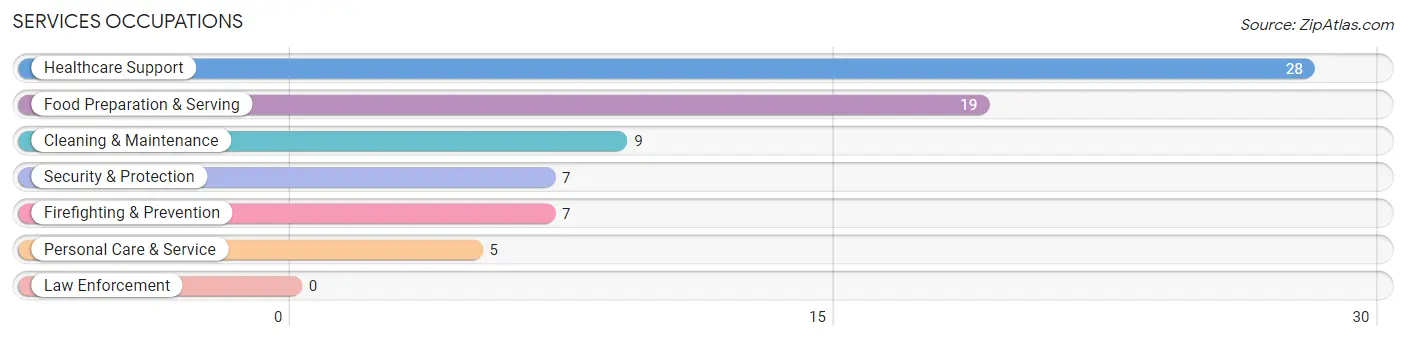
Services Occupations
The most common Services occupations in Greendale are Healthcare Support (28 | 11.4%), Food Preparation & Serving (19 | 7.7%), Cleaning & Maintenance (9 | 3.7%), Security & Protection (7 | 2.9%), and Firefighting & Prevention (7 | 2.9%).
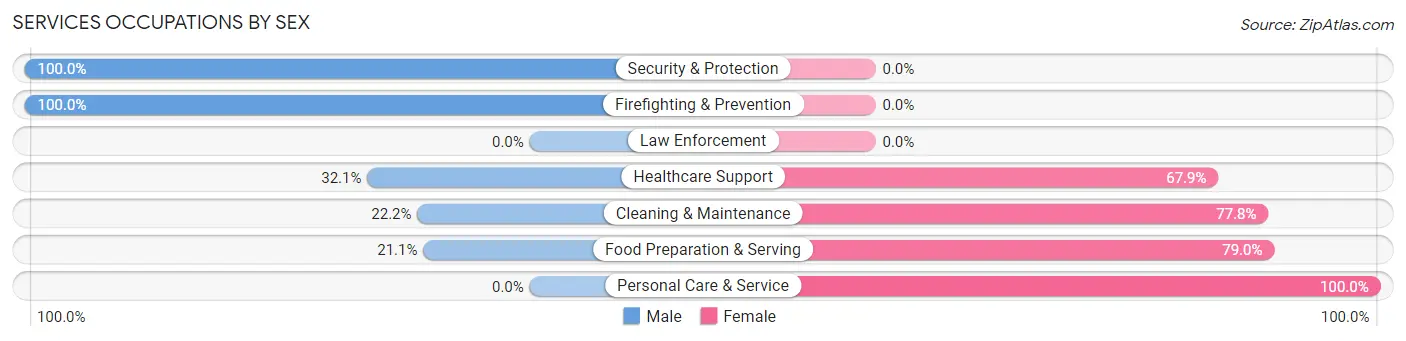
Services Occupations by Sex
Within the Services occupations in Greendale, the most male-oriented occupations are Security & Protection (100.0%), Firefighting & Prevention (100.0%), and Healthcare Support (32.1%), while the most female-oriented occupations are Personal Care & Service (100.0%), Food Preparation & Serving (78.9%), and Cleaning & Maintenance (77.8%).
| Occupation | Male | Female |
| Healthcare Support | 9 (32.1%) | 19 (67.9%) |
| Security & Protection | 7 (100.0%) | 0 (0.0%) |
| Firefighting & Prevention | 7 (100.0%) | 0 (0.0%) |
| Law Enforcement | 0 (0.0%) | 0 (0.0%) |
| Food Preparation & Serving | 4 (21.0%) | 15 (78.9%) |
| Cleaning & Maintenance | 2 (22.2%) | 7 (77.8%) |
| Personal Care & Service | 0 (0.0%) | 5 (100.0%) |
| Total (Category) | 22 (32.4%) | 46 (67.6%) |
| Total (Overall) | 86 (35.0%) | 160 (65.0%) |
Sales and Office Occupations
The most common Sales and Office occupations in Greendale are Office & Administration (35 | 14.2%), and Sales & Related (20 | 8.1%).
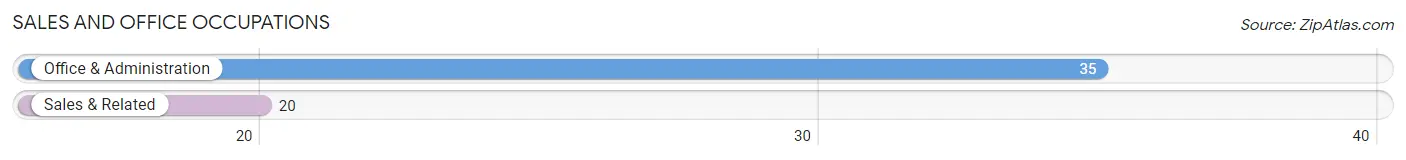
Sales and Office Occupations by Sex
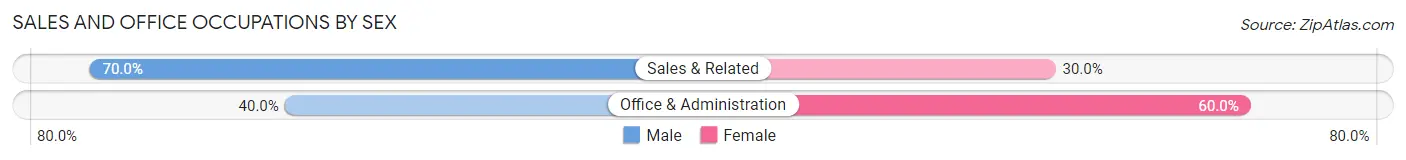
| Occupation | Male | Female |
| Sales & Related | 14 (70.0%) | 6 (30.0%) |
| Office & Administration | 14 (40.0%) | 21 (60.0%) |
| Total (Category) | 28 (50.9%) | 27 (49.1%) |
| Total (Overall) | 86 (35.0%) | 160 (65.0%) |
Natural Resources, Construction and Maintenance Occupations
The most common Natural Resources, Construction and Maintenance occupations in Greendale are , and Installation, Maintenance & Repair (2 | 0.8%).
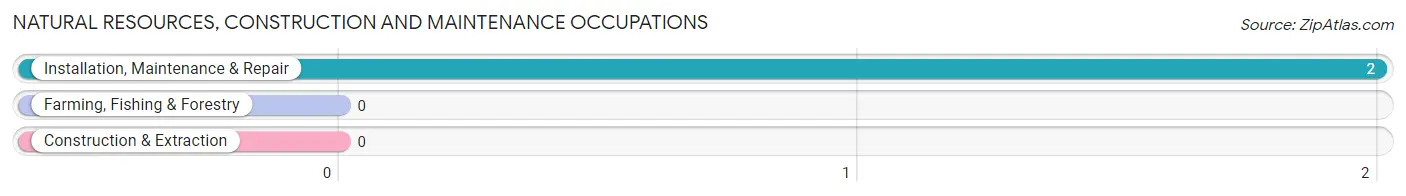
Natural Resources, Construction and Maintenance Occupations by Sex
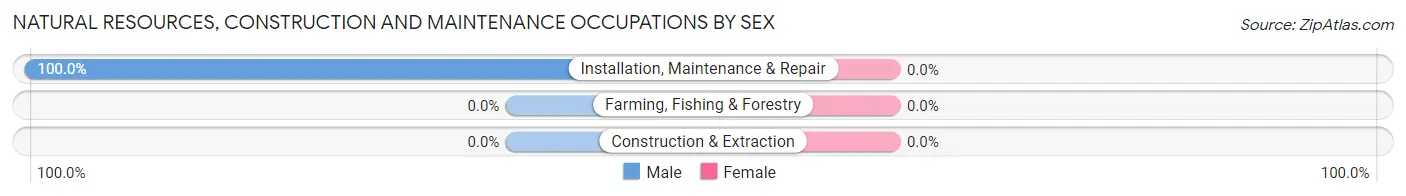
| Occupation | Male | Female |
| Farming, Fishing & Forestry | 0 (0.0%) | 0 (0.0%) |
| Construction & Extraction | 0 (0.0%) | 0 (0.0%) |
| Installation, Maintenance & Repair | 2 (100.0%) | 0 (0.0%) |
| Total (Category) | 2 (100.0%) | 0 (0.0%) |
| Total (Overall) | 86 (35.0%) | 160 (65.0%) |
Production, Transportation and Moving Occupations
The most common Production, Transportation and Moving occupations in Greendale are Production (8 | 3.3%), and Transportation (2 | 0.8%).
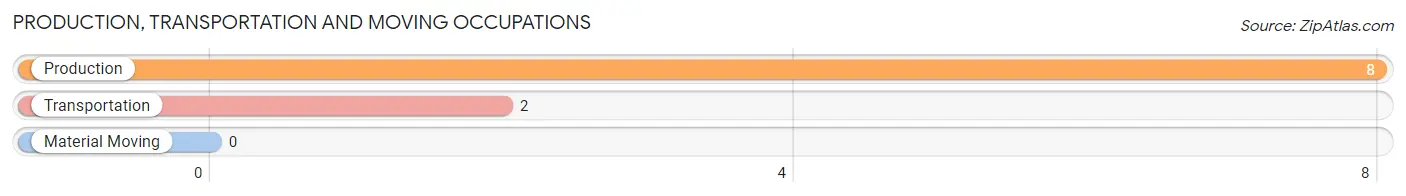
Production, Transportation and Moving Occupations by Sex
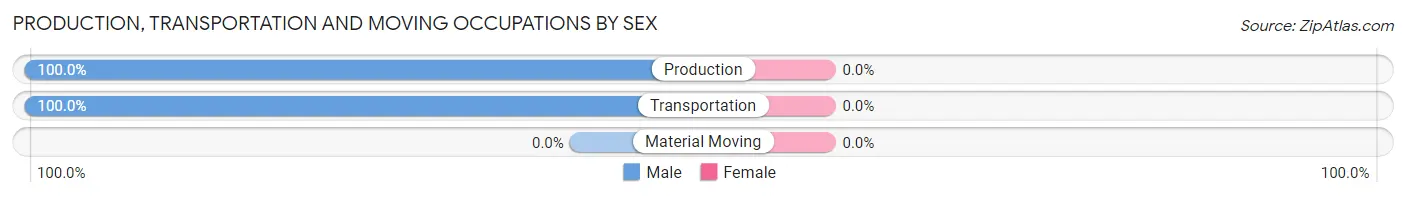
| Occupation | Male | Female |
| Production | 8 (100.0%) | 0 (0.0%) |
| Transportation | 2 (100.0%) | 0 (0.0%) |
| Material Moving | 0 (0.0%) | 0 (0.0%) |
| Total (Category) | 10 (100.0%) | 0 (0.0%) |
| Total (Overall) | 86 (35.0%) | 160 (65.0%) |
Employment Industries by Sex in Greendale
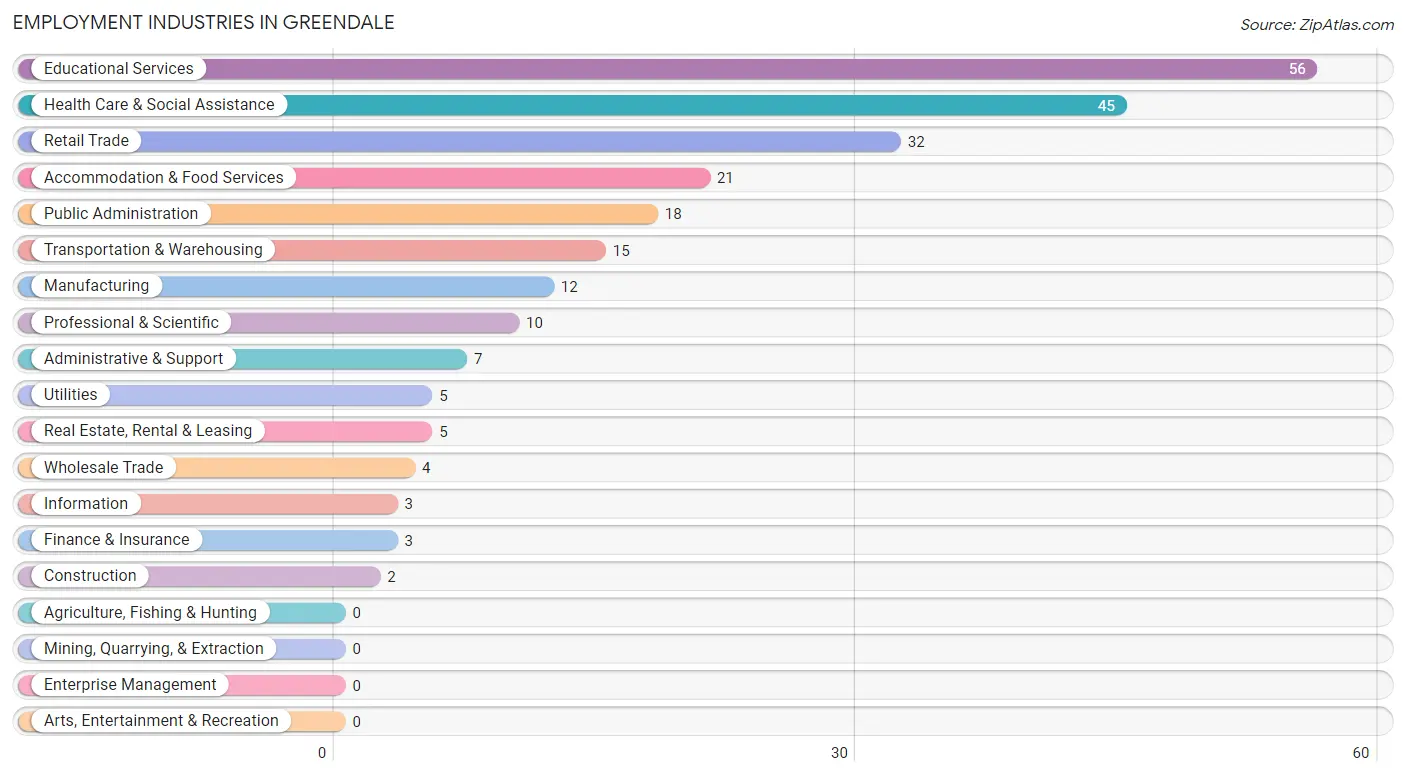
Employment Industries in Greendale
The major employment industries in Greendale include Educational Services (56 | 22.8%), Health Care & Social Assistance (45 | 18.3%), Retail Trade (32 | 13.0%), Accommodation & Food Services (21 | 8.5%), and Public Administration (18 | 7.3%).
Employment Industries by Sex in Greendale
The Greendale industries that see more men than women are Manufacturing (83.3%), Professional & Scientific (80.0%), and Administrative & Support (71.4%), whereas the industries that tend to have a higher number of women are Construction (100.0%), Utilities (100.0%), and Information (100.0%).
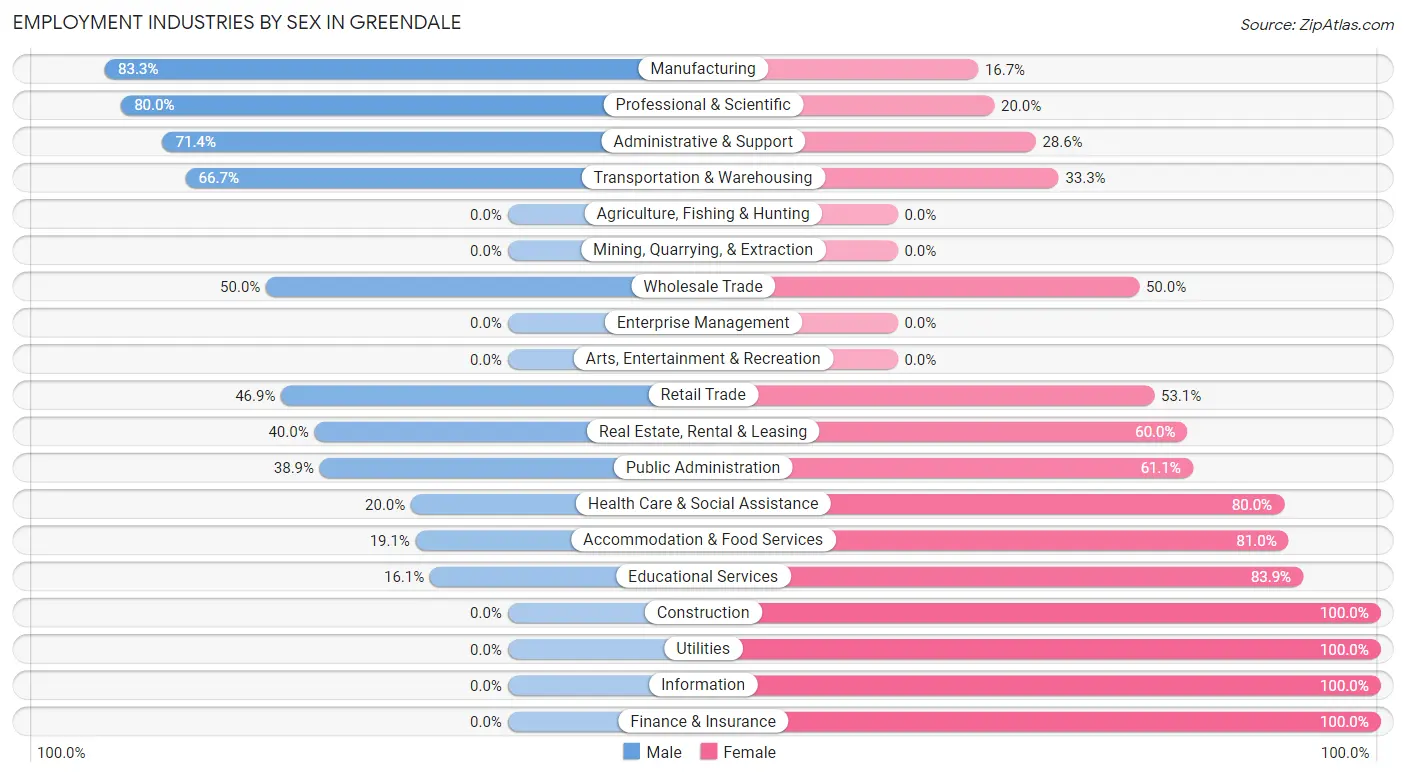
| Industry | Male | Female |
| Agriculture, Fishing & Hunting | 0 (0.0%) | 0 (0.0%) |
| Mining, Quarrying, & Extraction | 0 (0.0%) | 0 (0.0%) |
| Construction | 0 (0.0%) | 2 (100.0%) |
| Manufacturing | 10 (83.3%) | 2 (16.7%) |
| Wholesale Trade | 2 (50.0%) | 2 (50.0%) |
| Retail Trade | 15 (46.9%) | 17 (53.1%) |
| Transportation & Warehousing | 10 (66.7%) | 5 (33.3%) |
| Utilities | 0 (0.0%) | 5 (100.0%) |
| Information | 0 (0.0%) | 3 (100.0%) |
| Finance & Insurance | 0 (0.0%) | 3 (100.0%) |
| Real Estate, Rental & Leasing | 2 (40.0%) | 3 (60.0%) |
| Professional & Scientific | 8 (80.0%) | 2 (20.0%) |
| Enterprise Management | 0 (0.0%) | 0 (0.0%) |
| Administrative & Support | 5 (71.4%) | 2 (28.6%) |
| Educational Services | 9 (16.1%) | 47 (83.9%) |
| Health Care & Social Assistance | 9 (20.0%) | 36 (80.0%) |
| Arts, Entertainment & Recreation | 0 (0.0%) | 0 (0.0%) |
| Accommodation & Food Services | 4 (19.1%) | 17 (80.9%) |
| Public Administration | 7 (38.9%) | 11 (61.1%) |
| Total | 86 (35.0%) | 160 (65.0%) |
Education in Greendale
School Enrollment in Greendale
The most common levels of schooling among the 123 students in Greendale are college / undergraduate (36 | 29.3%), elementary school (30 | 24.4%), and middle school (24 | 19.5%).
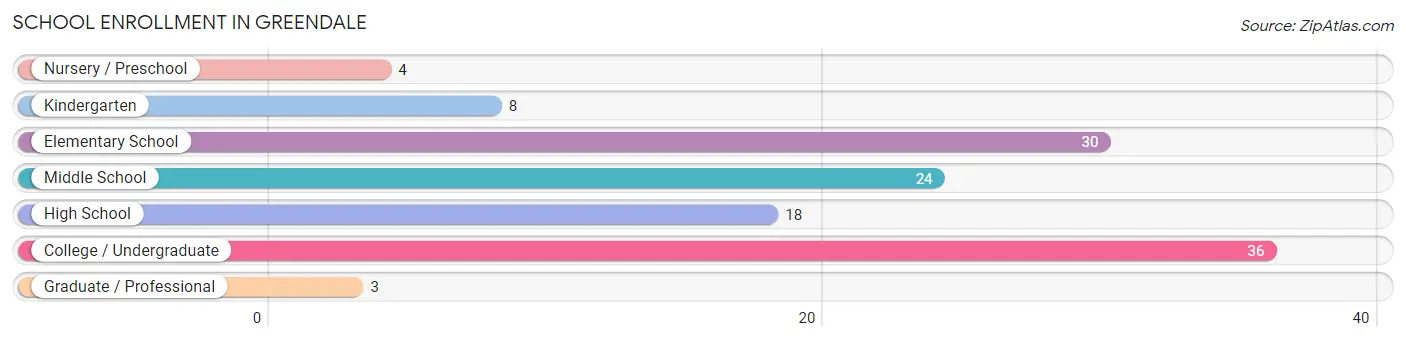
| School Level | # Students | % Students |
| Nursery / Preschool | 4 | 3.3% |
| Kindergarten | 8 | 6.5% |
| Elementary School | 30 | 24.4% |
| Middle School | 24 | 19.5% |
| High School | 18 | 14.6% |
| College / Undergraduate | 36 | 29.3% |
| Graduate / Professional | 3 | 2.4% |
| Total | 123 | 100.0% |
School Enrollment by Age by Funding Source in Greendale
Out of a total of 123 students who are enrolled in schools in Greendale, 37 (30.1%) attend a private institution, while the remaining 86 (69.9%) are enrolled in public schools. The age group of 3 to 4 year olds has the highest likelihood of being enrolled in private schools, with 4 (100.0% in the age bracket) enrolled. Conversely, the age group of 15 to 17 year olds has the lowest likelihood of being enrolled in a private school, with 13 (100.0% in the age bracket) attending a public institution.
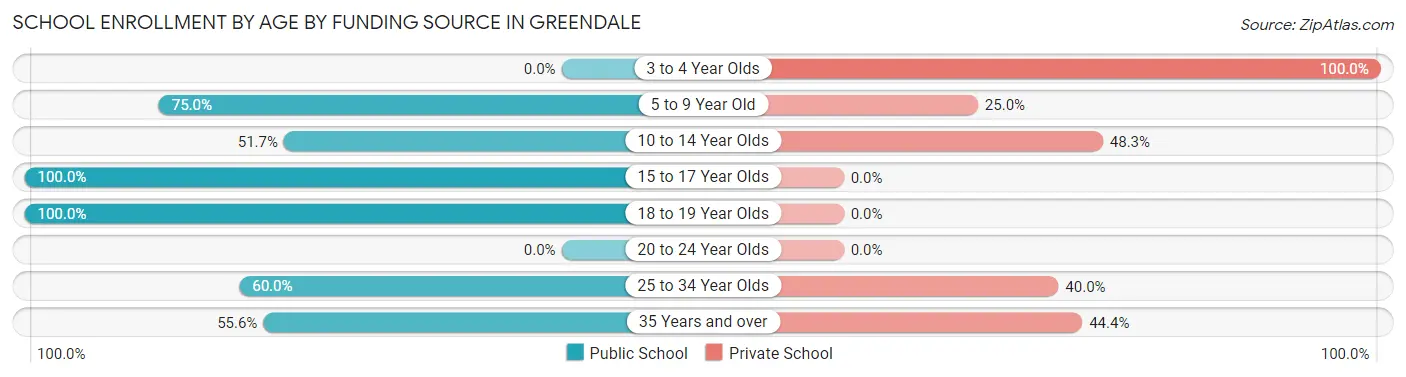
| Age Bracket | Public School | Private School |
| 3 to 4 Year Olds | 0 (0.0%) | 4 (100.0%) |
| 5 to 9 Year Old | 27 (75.0%) | 9 (25.0%) |
| 10 to 14 Year Olds | 15 (51.7%) | 14 (48.3%) |
| 15 to 17 Year Olds | 13 (100.0%) | 0 (0.0%) |
| 18 to 19 Year Olds | 18 (100.0%) | 0 (0.0%) |
| 20 to 24 Year Olds | 0 (0.0%) | 0 (0.0%) |
| 25 to 34 Year Olds | 3 (60.0%) | 2 (40.0%) |
| 35 Years and over | 10 (55.6%) | 8 (44.4%) |
| Total | 86 (69.9%) | 37 (30.1%) |
Educational Attainment by Field of Study in Greendale
Business (43 | 24.3%), education (23 | 13.0%), psychology (22 | 12.4%), science & technology (16 | 9.0%), and social sciences (14 | 7.9%) are the most common fields of study among 177 individuals in Greendale who have obtained a bachelor's degree or higher.
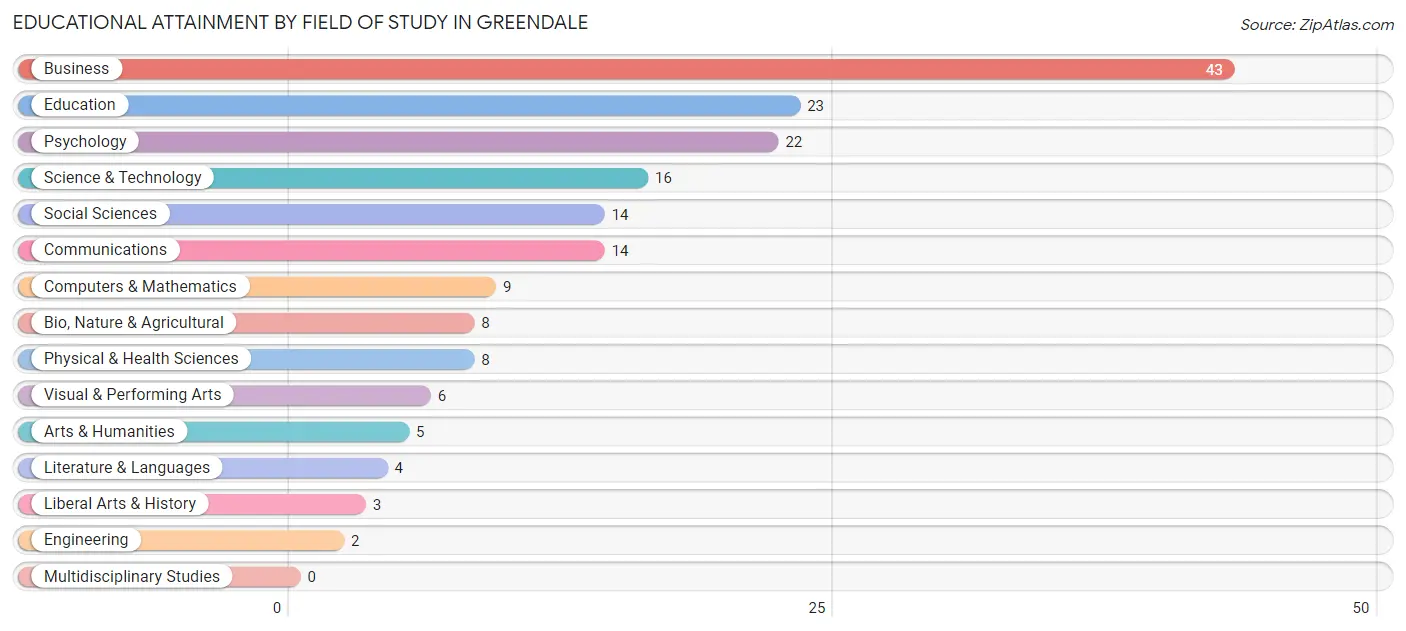
| Field of Study | # Graduates | % Graduates |
| Computers & Mathematics | 9 | 5.1% |
| Bio, Nature & Agricultural | 8 | 4.5% |
| Physical & Health Sciences | 8 | 4.5% |
| Psychology | 22 | 12.4% |
| Social Sciences | 14 | 7.9% |
| Engineering | 2 | 1.1% |
| Multidisciplinary Studies | 0 | 0.0% |
| Science & Technology | 16 | 9.0% |
| Business | 43 | 24.3% |
| Education | 23 | 13.0% |
| Literature & Languages | 4 | 2.3% |
| Liberal Arts & History | 3 | 1.7% |
| Visual & Performing Arts | 6 | 3.4% |
| Communications | 14 | 7.9% |
| Arts & Humanities | 5 | 2.8% |
| Total | 177 | 100.0% |
Transportation & Commute in Greendale
Vehicle Availability by Sex in Greendale
The most prevalent vehicle ownership categories in Greendale are males with 2 vehicles (30, accounting for 35.7%) and females with 2 vehicles (70, making up 18.8%).
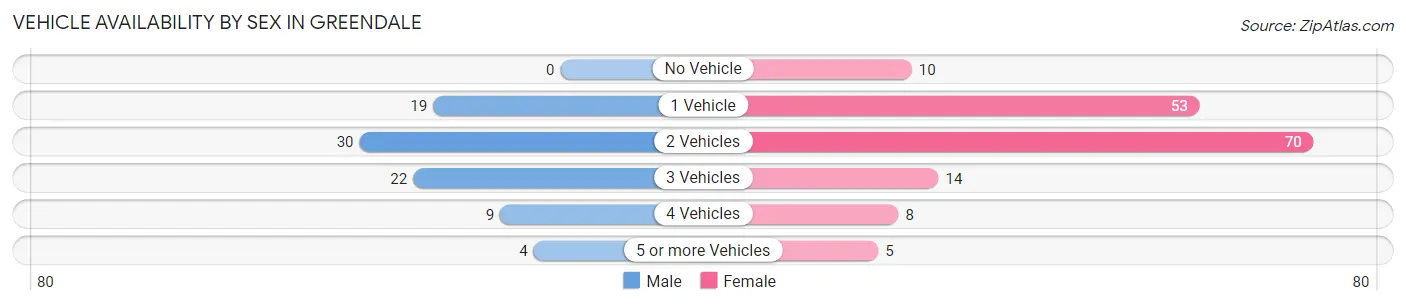
| Vehicles Available | Male | Female |
| No Vehicle | 0 (0.0%) | 10 (6.2%) |
| 1 Vehicle | 19 (22.6%) | 53 (33.1%) |
| 2 Vehicles | 30 (35.7%) | 70 (43.8%) |
| 3 Vehicles | 22 (26.2%) | 14 (8.7%) |
| 4 Vehicles | 9 (10.7%) | 8 (5.0%) |
| 5 or more Vehicles | 4 (4.8%) | 5 (3.1%) |
| Total | 84 (100.0%) | 160 (100.0%) |
Commute Time in Greendale
The most frequently occuring commute durations in Greendale are 20 to 24 minutes (62 commuters, 30.5%), 15 to 19 minutes (43 commuters, 21.2%), and 10 to 14 minutes (33 commuters, 16.3%).
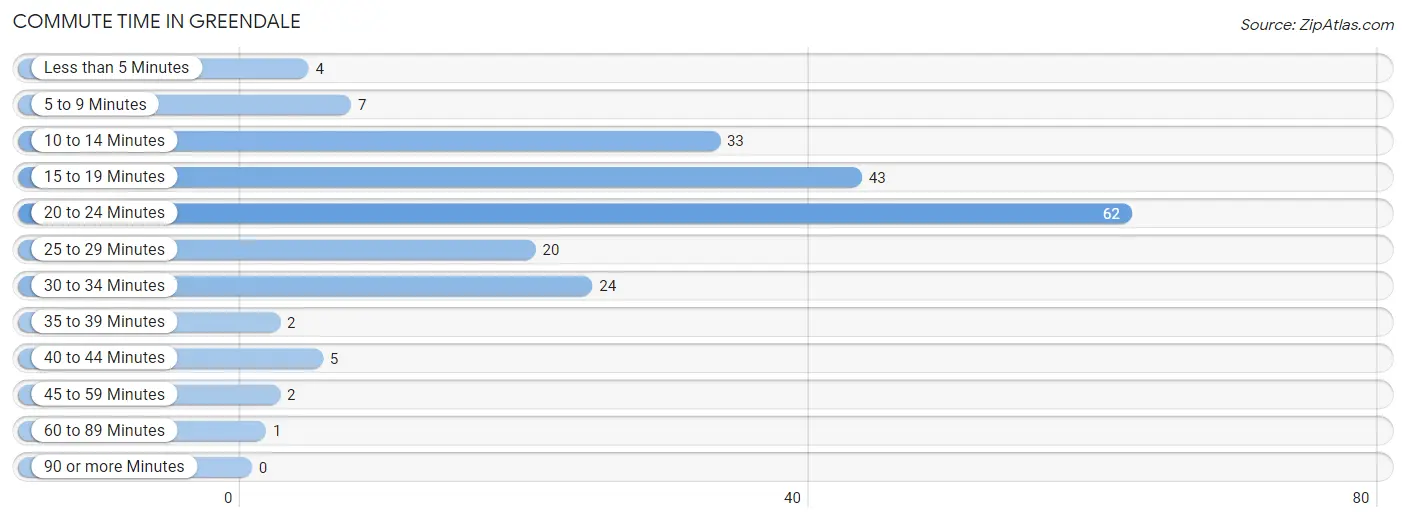
| Commute Time | # Commuters | % Commuters |
| Less than 5 Minutes | 4 | 2.0% |
| 5 to 9 Minutes | 7 | 3.5% |
| 10 to 14 Minutes | 33 | 16.3% |
| 15 to 19 Minutes | 43 | 21.2% |
| 20 to 24 Minutes | 62 | 30.5% |
| 25 to 29 Minutes | 20 | 9.9% |
| 30 to 34 Minutes | 24 | 11.8% |
| 35 to 39 Minutes | 2 | 1.0% |
| 40 to 44 Minutes | 5 | 2.5% |
| 45 to 59 Minutes | 2 | 1.0% |
| 60 to 89 Minutes | 1 | 0.5% |
| 90 or more Minutes | 0 | 0.0% |
Commute Time by Sex in Greendale
The most common commute times in Greendale are 20 to 24 minutes (18 commuters, 24.7%) for males and 20 to 24 minutes (44 commuters, 33.9%) for females.
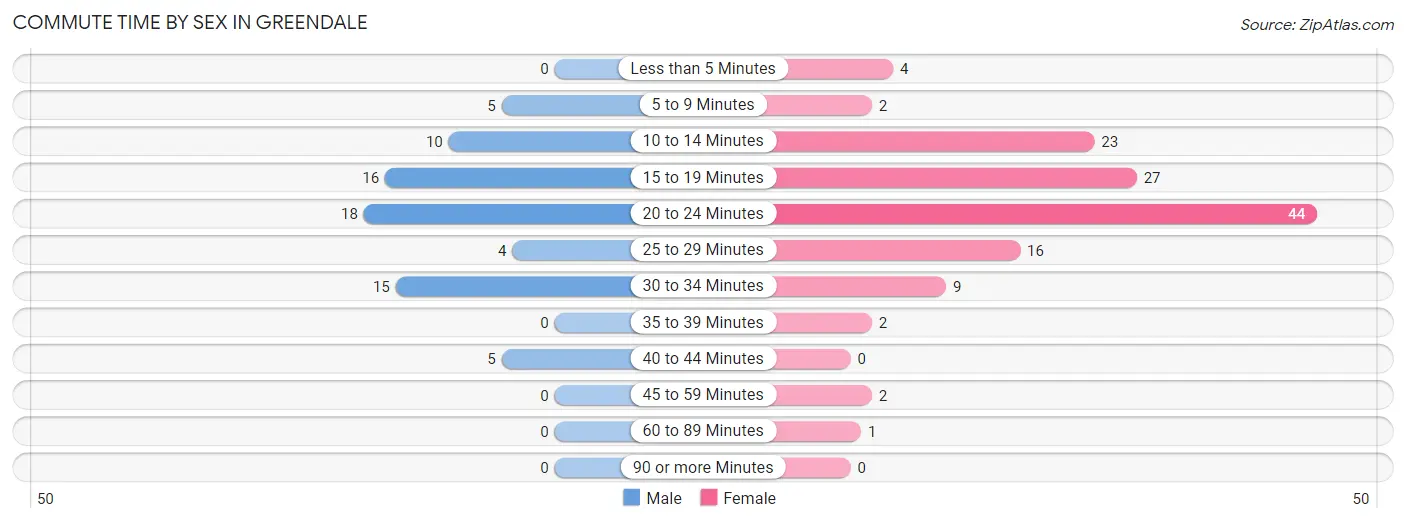
| Commute Time | Male | Female |
| Less than 5 Minutes | 0 (0.0%) | 4 (3.1%) |
| 5 to 9 Minutes | 5 (6.9%) | 2 (1.5%) |
| 10 to 14 Minutes | 10 (13.7%) | 23 (17.7%) |
| 15 to 19 Minutes | 16 (21.9%) | 27 (20.8%) |
| 20 to 24 Minutes | 18 (24.7%) | 44 (33.9%) |
| 25 to 29 Minutes | 4 (5.5%) | 16 (12.3%) |
| 30 to 34 Minutes | 15 (20.5%) | 9 (6.9%) |
| 35 to 39 Minutes | 0 (0.0%) | 2 (1.5%) |
| 40 to 44 Minutes | 5 (6.9%) | 0 (0.0%) |
| 45 to 59 Minutes | 0 (0.0%) | 2 (1.5%) |
| 60 to 89 Minutes | 0 (0.0%) | 1 (0.8%) |
| 90 or more Minutes | 0 (0.0%) | 0 (0.0%) |
Time of Departure to Work by Sex in Greendale
The most frequent times of departure to work in Greendale are 7:30 AM to 7:59 AM (17, 23.3%) for males and 7:00 AM to 7:29 AM (31, 23.8%) for females.
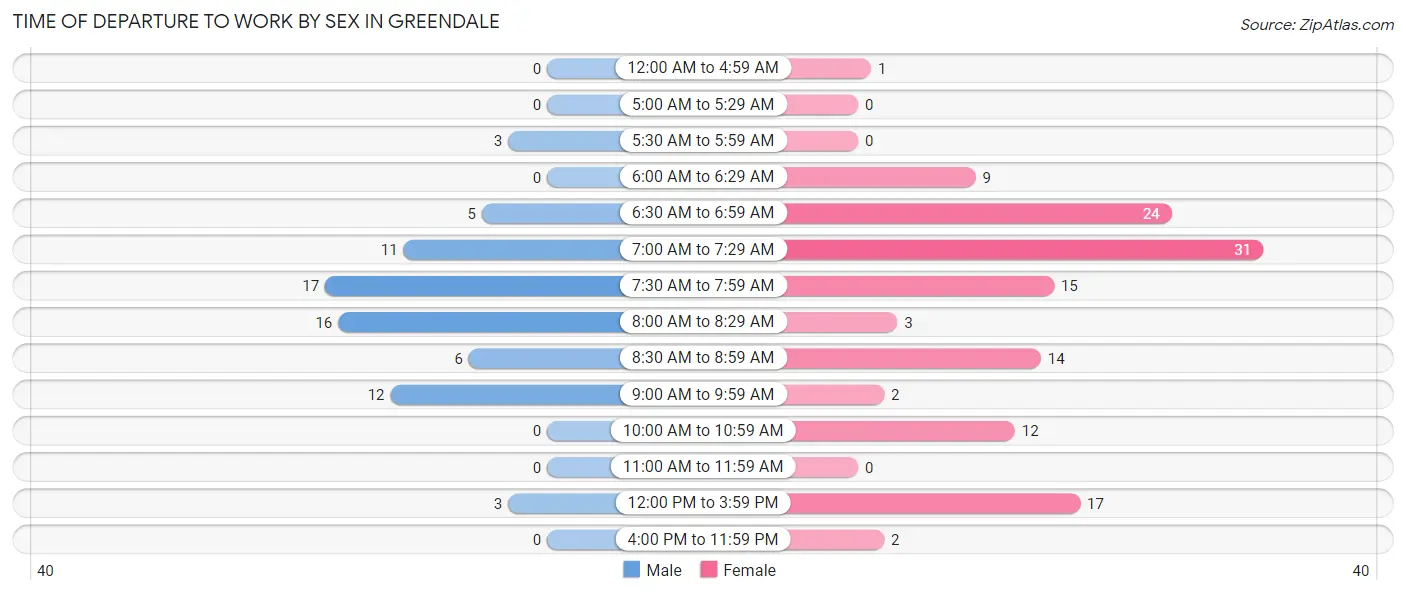
| Time of Departure | Male | Female |
| 12:00 AM to 4:59 AM | 0 (0.0%) | 1 (0.8%) |
| 5:00 AM to 5:29 AM | 0 (0.0%) | 0 (0.0%) |
| 5:30 AM to 5:59 AM | 3 (4.1%) | 0 (0.0%) |
| 6:00 AM to 6:29 AM | 0 (0.0%) | 9 (6.9%) |
| 6:30 AM to 6:59 AM | 5 (6.9%) | 24 (18.5%) |
| 7:00 AM to 7:29 AM | 11 (15.1%) | 31 (23.8%) |
| 7:30 AM to 7:59 AM | 17 (23.3%) | 15 (11.5%) |
| 8:00 AM to 8:29 AM | 16 (21.9%) | 3 (2.3%) |
| 8:30 AM to 8:59 AM | 6 (8.2%) | 14 (10.8%) |
| 9:00 AM to 9:59 AM | 12 (16.4%) | 2 (1.5%) |
| 10:00 AM to 10:59 AM | 0 (0.0%) | 12 (9.2%) |
| 11:00 AM to 11:59 AM | 0 (0.0%) | 0 (0.0%) |
| 12:00 PM to 3:59 PM | 3 (4.1%) | 17 (13.1%) |
| 4:00 PM to 11:59 PM | 0 (0.0%) | 2 (1.5%) |
| Total | 73 (100.0%) | 130 (100.0%) |
Housing Occupancy in Greendale
Occupancy by Ownership in Greendale
Of the total 359 dwellings in Greendale, owner-occupied units account for 294 (81.9%), while renter-occupied units make up 65 (18.1%).
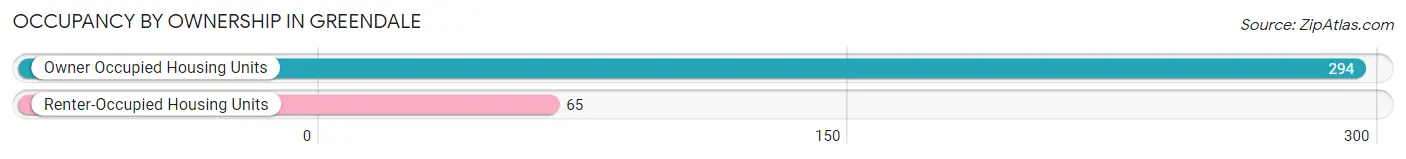
| Occupancy | # Housing Units | % Housing Units |
| Owner Occupied Housing Units | 294 | 81.9% |
| Renter-Occupied Housing Units | 65 | 18.1% |
| Total Occupied Housing Units | 359 | 100.0% |
Occupancy by Household Size in Greendale
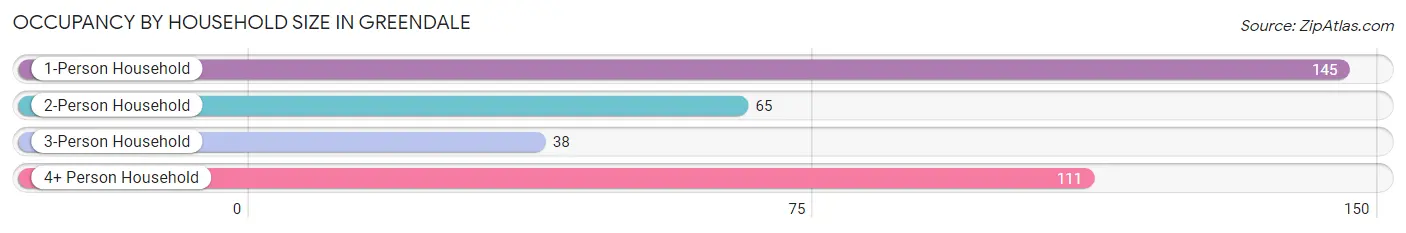
| Household Size | # Housing Units | % Housing Units |
| 1-Person Household | 145 | 40.4% |
| 2-Person Household | 65 | 18.1% |
| 3-Person Household | 38 | 10.6% |
| 4+ Person Household | 111 | 30.9% |
| Total Housing Units | 359 | 100.0% |
Occupancy by Ownership by Household Size in Greendale
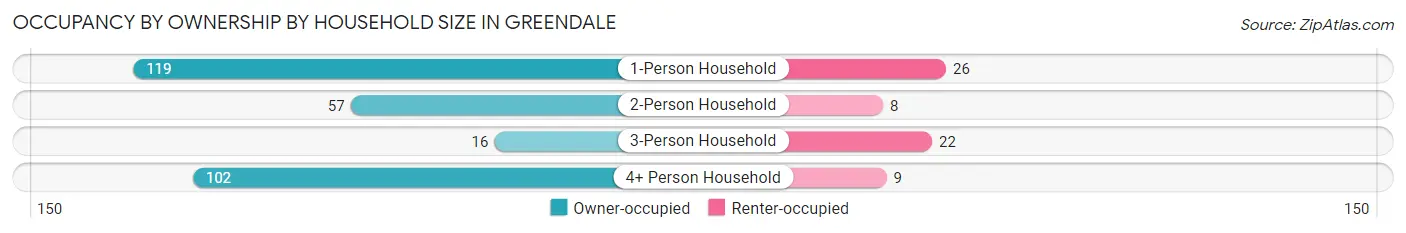
| Household Size | Owner-occupied | Renter-occupied |
| 1-Person Household | 119 (82.1%) | 26 (17.9%) |
| 2-Person Household | 57 (87.7%) | 8 (12.3%) |
| 3-Person Household | 16 (42.1%) | 22 (57.9%) |
| 4+ Person Household | 102 (91.9%) | 9 (8.1%) |
| Total Housing Units | 294 (81.9%) | 65 (18.1%) |
Occupancy by Educational Attainment in Greendale
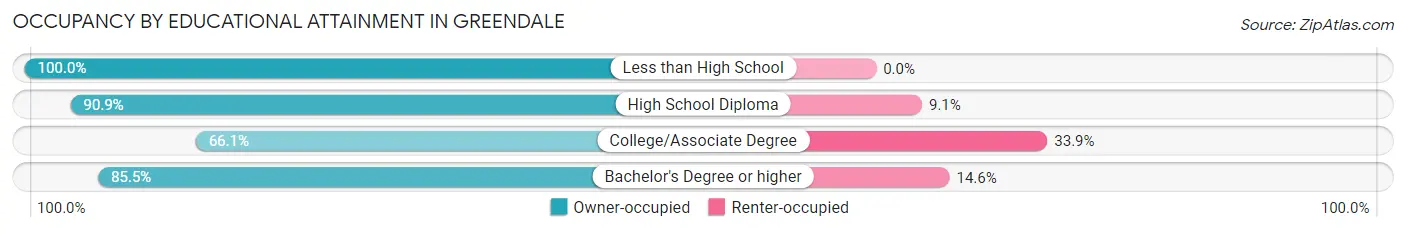
| Household Size | Owner-occupied | Renter-occupied |
| Less than High School | 8 (100.0%) | 0 (0.0%) |
| High School Diploma | 120 (90.9%) | 12 (9.1%) |
| College/Associate Degree | 72 (66.1%) | 37 (33.9%) |
| Bachelor's Degree or higher | 94 (85.5%) | 16 (14.5%) |
Occupancy by Age of Householder in Greendale
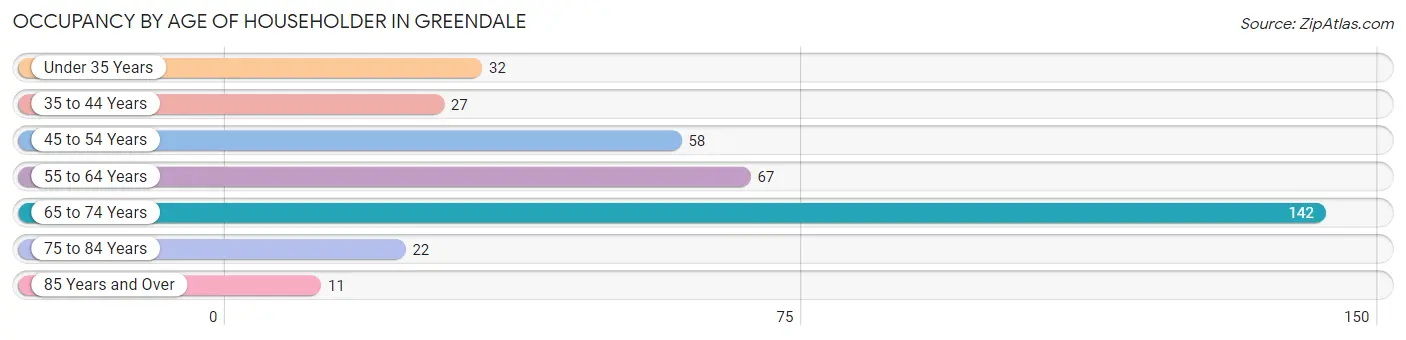
| Age Bracket | # Households | % Households |
| Under 35 Years | 32 | 8.9% |
| 35 to 44 Years | 27 | 7.5% |
| 45 to 54 Years | 58 | 16.2% |
| 55 to 64 Years | 67 | 18.7% |
| 65 to 74 Years | 142 | 39.6% |
| 75 to 84 Years | 22 | 6.1% |
| 85 Years and Over | 11 | 3.1% |
| Total | 359 | 100.0% |
Housing Finances in Greendale
Median Income by Occupancy in Greendale
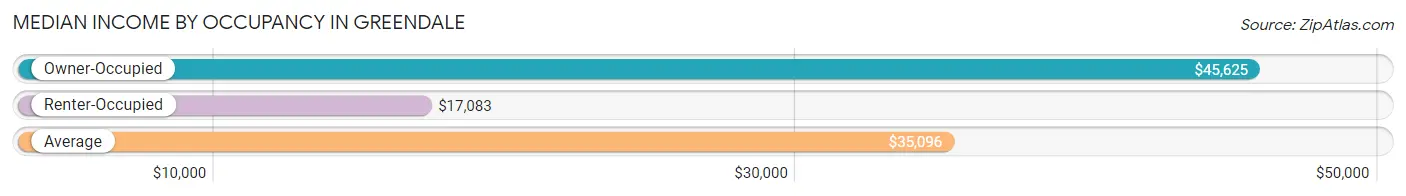
| Occupancy Type | # Households | Median Income |
| Owner-Occupied | 294 (81.9%) | $45,625 |
| Renter-Occupied | 65 (18.1%) | $17,083 |
| Average | 359 (100.0%) | $35,096 |
Occupancy by Householder Income Bracket in Greendale
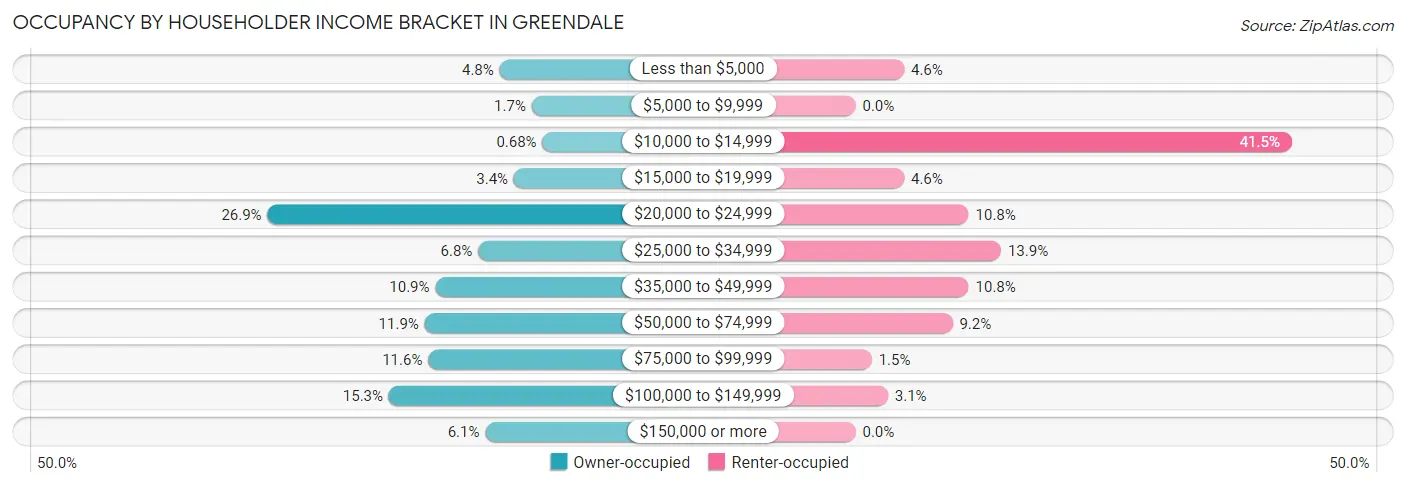
| Income Bracket | Owner-occupied | Renter-occupied |
| Less than $5,000 | 14 (4.8%) | 3 (4.6%) |
| $5,000 to $9,999 | 5 (1.7%) | 0 (0.0%) |
| $10,000 to $14,999 | 2 (0.7%) | 27 (41.5%) |
| $15,000 to $19,999 | 10 (3.4%) | 3 (4.6%) |
| $20,000 to $24,999 | 79 (26.9%) | 7 (10.8%) |
| $25,000 to $34,999 | 20 (6.8%) | 9 (13.9%) |
| $35,000 to $49,999 | 32 (10.9%) | 7 (10.8%) |
| $50,000 to $74,999 | 35 (11.9%) | 6 (9.2%) |
| $75,000 to $99,999 | 34 (11.6%) | 1 (1.5%) |
| $100,000 to $149,999 | 45 (15.3%) | 2 (3.1%) |
| $150,000 or more | 18 (6.1%) | 0 (0.0%) |
| Total | 294 (100.0%) | 65 (100.0%) |
Monthly Housing Cost Tiers in Greendale
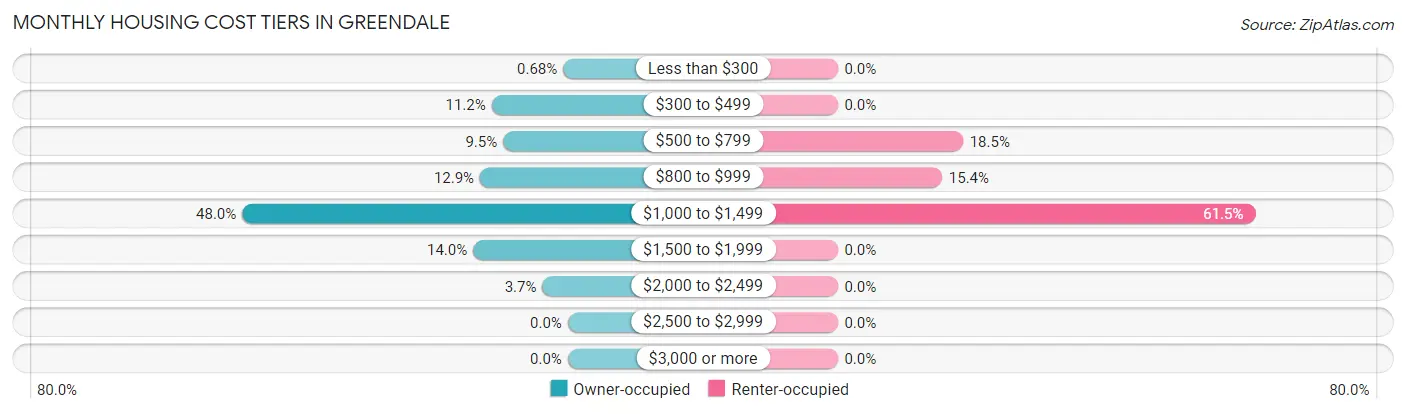
| Monthly Cost | Owner-occupied | Renter-occupied |
| Less than $300 | 2 (0.7%) | 0 (0.0%) |
| $300 to $499 | 33 (11.2%) | 0 (0.0%) |
| $500 to $799 | 28 (9.5%) | 12 (18.5%) |
| $800 to $999 | 38 (12.9%) | 10 (15.4%) |
| $1,000 to $1,499 | 141 (48.0%) | 40 (61.5%) |
| $1,500 to $1,999 | 41 (14.0%) | 0 (0.0%) |
| $2,000 to $2,499 | 11 (3.7%) | 0 (0.0%) |
| $2,500 to $2,999 | 0 (0.0%) | 0 (0.0%) |
| $3,000 or more | 0 (0.0%) | 0 (0.0%) |
| Total | 294 (100.0%) | 65 (100.0%) |
Physical Housing Characteristics in Greendale
Housing Structures in Greendale
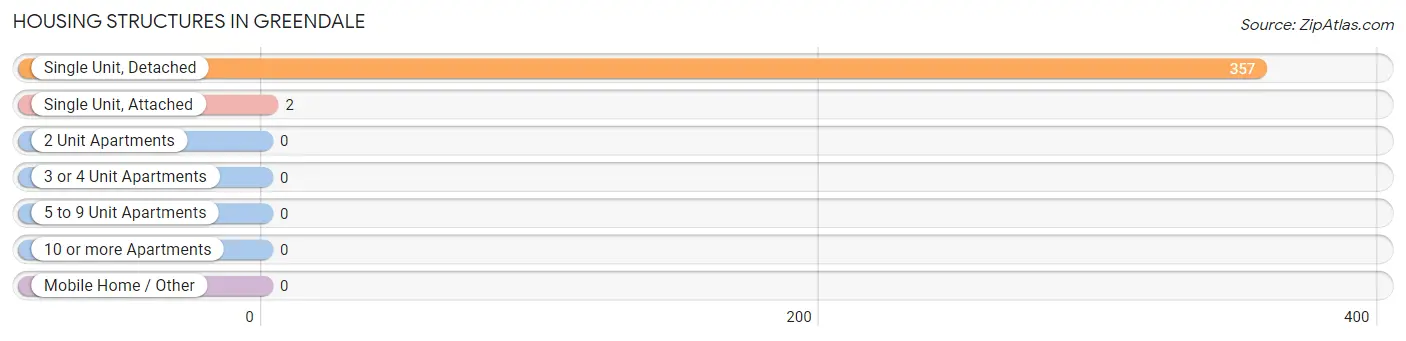
| Structure Type | # Housing Units | % Housing Units |
| Single Unit, Detached | 357 | 99.4% |
| Single Unit, Attached | 2 | 0.6% |
| 2 Unit Apartments | 0 | 0.0% |
| 3 or 4 Unit Apartments | 0 | 0.0% |
| 5 to 9 Unit Apartments | 0 | 0.0% |
| 10 or more Apartments | 0 | 0.0% |
| Mobile Home / Other | 0 | 0.0% |
| Total | 359 | 100.0% |
Housing Structures by Occupancy in Greendale
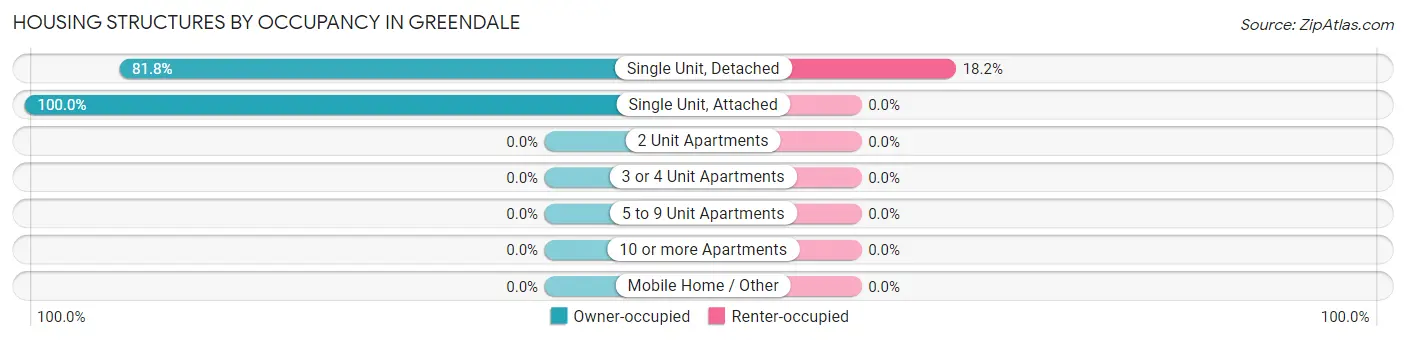
| Structure Type | Owner-occupied | Renter-occupied |
| Single Unit, Detached | 292 (81.8%) | 65 (18.2%) |
| Single Unit, Attached | 2 (100.0%) | 0 (0.0%) |
| 2 Unit Apartments | 0 (0.0%) | 0 (0.0%) |
| 3 or 4 Unit Apartments | 0 (0.0%) | 0 (0.0%) |
| 5 to 9 Unit Apartments | 0 (0.0%) | 0 (0.0%) |
| 10 or more Apartments | 0 (0.0%) | 0 (0.0%) |
| Mobile Home / Other | 0 (0.0%) | 0 (0.0%) |
| Total | 294 (81.9%) | 65 (18.1%) |
Housing Structures by Number of Rooms in Greendale
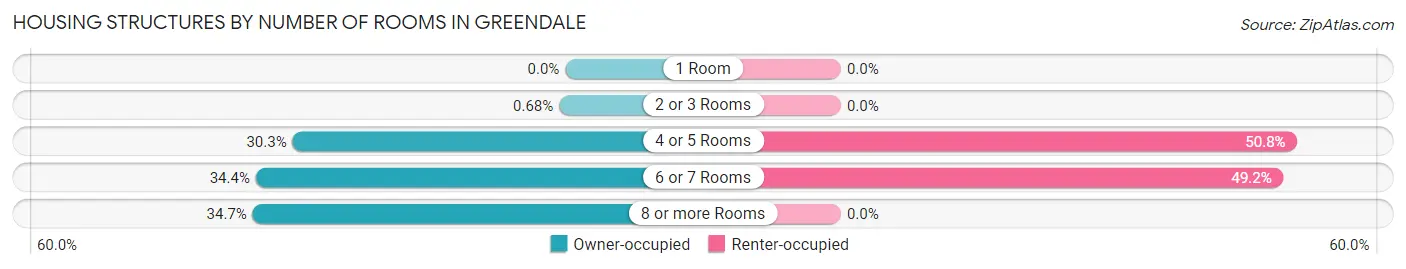
| Number of Rooms | Owner-occupied | Renter-occupied |
| 1 Room | 0 (0.0%) | 0 (0.0%) |
| 2 or 3 Rooms | 2 (0.7%) | 0 (0.0%) |
| 4 or 5 Rooms | 89 (30.3%) | 33 (50.8%) |
| 6 or 7 Rooms | 101 (34.4%) | 32 (49.2%) |
| 8 or more Rooms | 102 (34.7%) | 0 (0.0%) |
| Total | 294 (100.0%) | 65 (100.0%) |
Housing Structure by Heating Type in Greendale
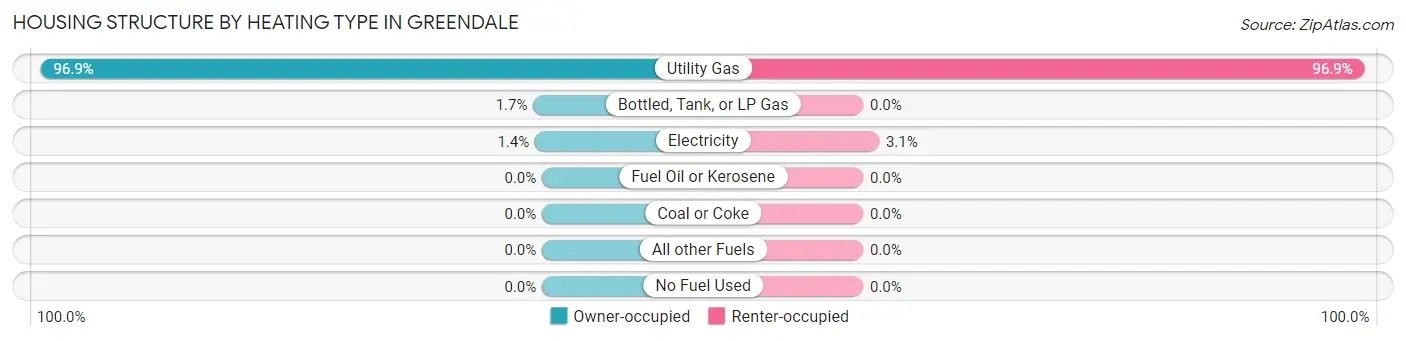
| Heating Type | Owner-occupied | Renter-occupied |
| Utility Gas | 285 (96.9%) | 63 (96.9%) |
| Bottled, Tank, or LP Gas | 5 (1.7%) | 0 (0.0%) |
| Electricity | 4 (1.4%) | 2 (3.1%) |
| Fuel Oil or Kerosene | 0 (0.0%) | 0 (0.0%) |
| Coal or Coke | 0 (0.0%) | 0 (0.0%) |
| All other Fuels | 0 (0.0%) | 0 (0.0%) |
| No Fuel Used | 0 (0.0%) | 0 (0.0%) |
| Total | 294 (100.0%) | 65 (100.0%) |
Household Vehicle Usage in Greendale
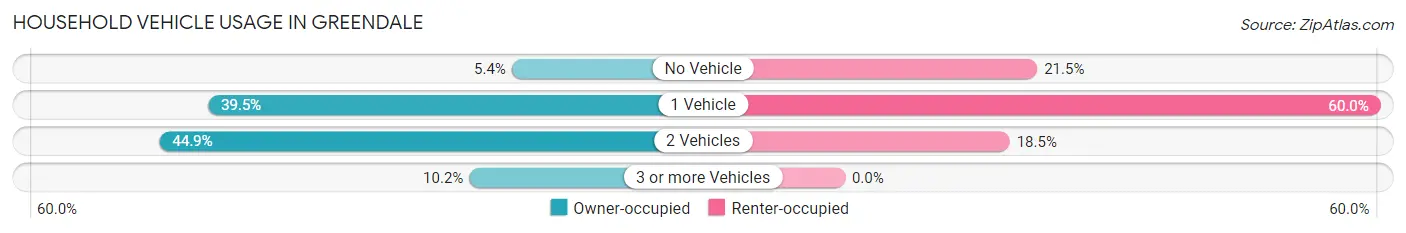
| Vehicles per Household | Owner-occupied | Renter-occupied |
| No Vehicle | 16 (5.4%) | 14 (21.5%) |
| 1 Vehicle | 116 (39.5%) | 39 (60.0%) |
| 2 Vehicles | 132 (44.9%) | 12 (18.5%) |
| 3 or more Vehicles | 30 (10.2%) | 0 (0.0%) |
| Total | 294 (100.0%) | 65 (100.0%) |
Real Estate & Mortgages in Greendale
Real Estate and Mortgage Overview in Greendale
| Characteristic | Without Mortgage | With Mortgage |
| Housing Units | 64 | 230 |
| Median Property Value | $85,000 | $114,000 |
| Median Household Income | $56,250 | $14 |
| Monthly Housing Costs | $486 | $0 |
| Real Estate Taxes | $1,867 | $0 |
Property Value by Mortgage Status in Greendale
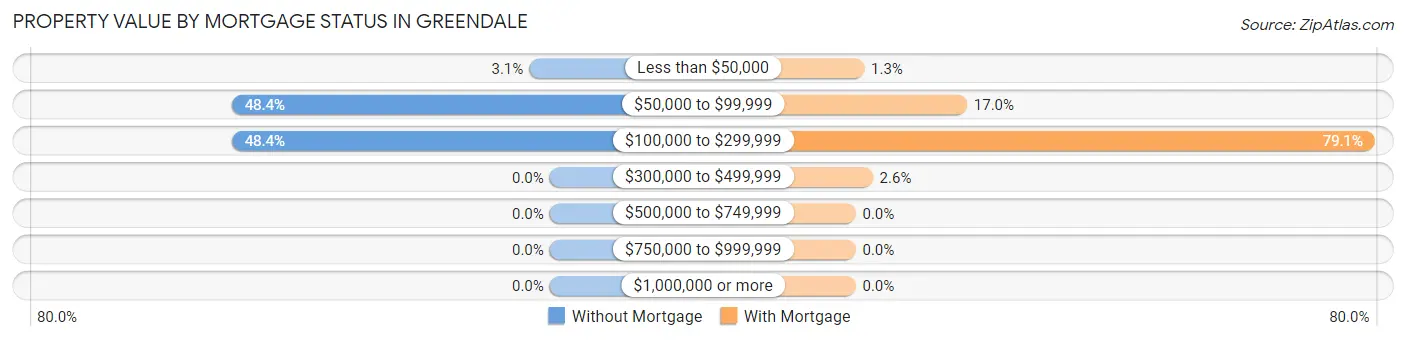
| Property Value | Without Mortgage | With Mortgage |
| Less than $50,000 | 2 (3.1%) | 3 (1.3%) |
| $50,000 to $99,999 | 31 (48.4%) | 39 (17.0%) |
| $100,000 to $299,999 | 31 (48.4%) | 182 (79.1%) |
| $300,000 to $499,999 | 0 (0.0%) | 6 (2.6%) |
| $500,000 to $749,999 | 0 (0.0%) | 0 (0.0%) |
| $750,000 to $999,999 | 0 (0.0%) | 0 (0.0%) |
| $1,000,000 or more | 0 (0.0%) | 0 (0.0%) |
| Total | 64 (100.0%) | 230 (100.0%) |
Household Income by Mortgage Status in Greendale
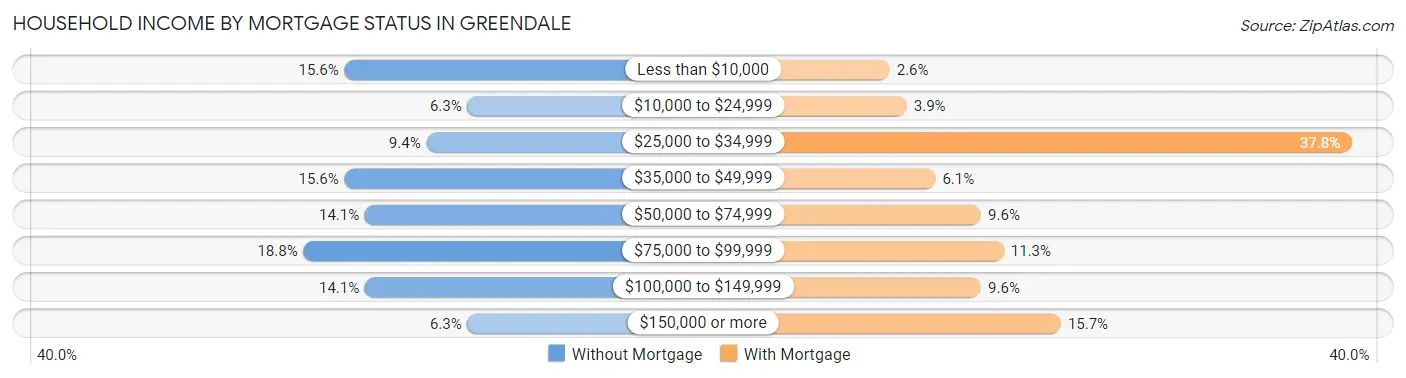
| Household Income | Without Mortgage | With Mortgage |
| Less than $10,000 | 10 (15.6%) | 6 (2.6%) |
| $10,000 to $24,999 | 4 (6.2%) | 9 (3.9%) |
| $25,000 to $34,999 | 6 (9.4%) | 87 (37.8%) |
| $35,000 to $49,999 | 10 (15.6%) | 14 (6.1%) |
| $50,000 to $74,999 | 9 (14.1%) | 22 (9.6%) |
| $75,000 to $99,999 | 12 (18.8%) | 26 (11.3%) |
| $100,000 to $149,999 | 9 (14.1%) | 22 (9.6%) |
| $150,000 or more | 4 (6.2%) | 36 (15.7%) |
| Total | 64 (100.0%) | 230 (100.0%) |
Property Value to Household Income Ratio in Greendale
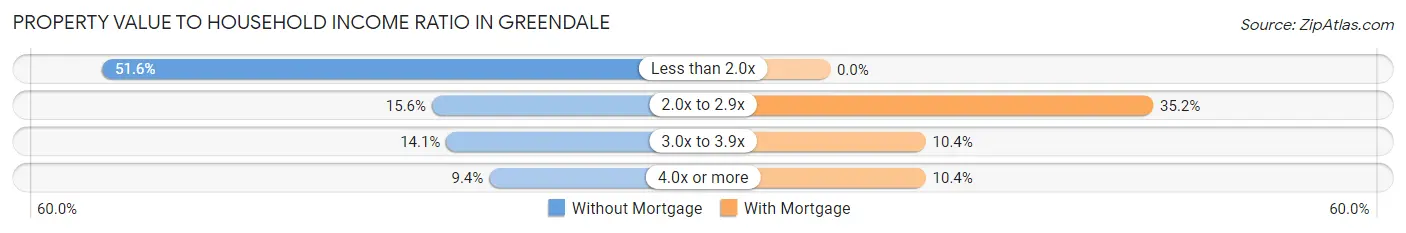
| Value-to-Income Ratio | Without Mortgage | With Mortgage |
| Less than 2.0x | 33 (51.6%) | 0 (0.0%) |
| 2.0x to 2.9x | 10 (15.6%) | 81 (35.2%) |
| 3.0x to 3.9x | 9 (14.1%) | 24 (10.4%) |
| 4.0x or more | 6 (9.4%) | 24 (10.4%) |
| Total | 64 (100.0%) | 230 (100.0%) |
Real Estate Taxes by Mortgage Status in Greendale
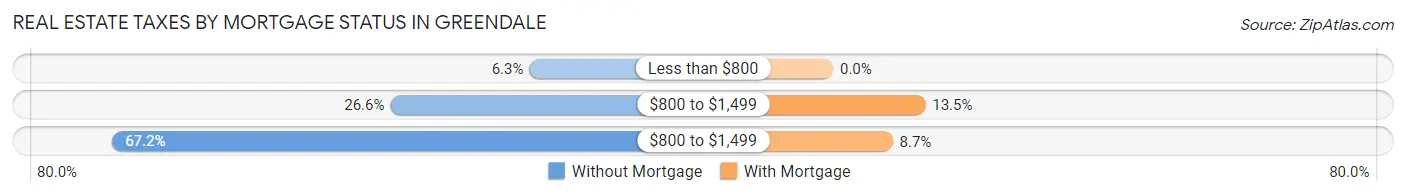
| Property Taxes | Without Mortgage | With Mortgage |
| Less than $800 | 4 (6.2%) | 0 (0.0%) |
| $800 to $1,499 | 17 (26.6%) | 31 (13.5%) |
| $800 to $1,499 | 43 (67.2%) | 20 (8.7%) |
| Total | 64 (100.0%) | 230 (100.0%) |
Health & Disability in Greendale
Health Insurance Coverage by Age in Greendale
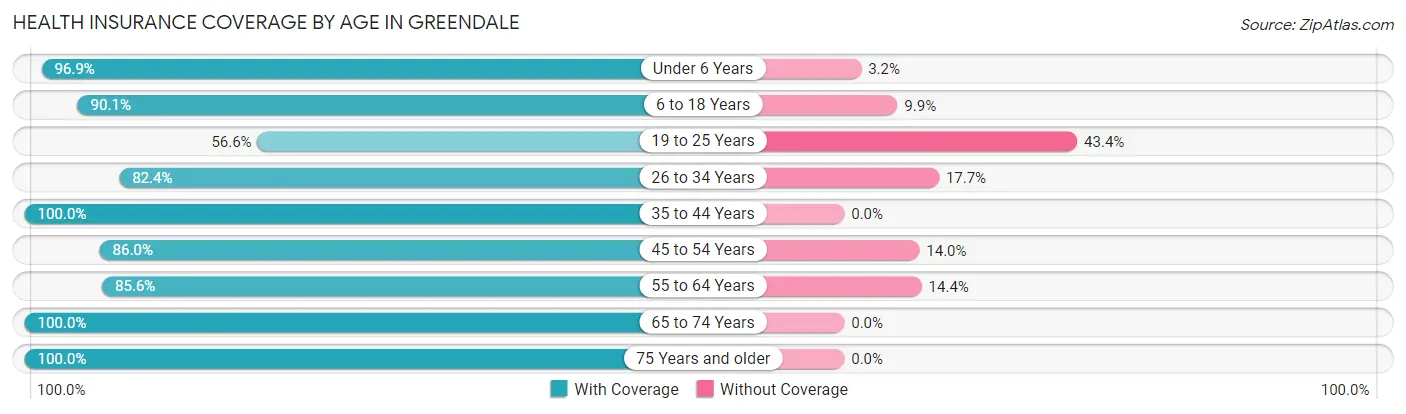
| Age Bracket | With Coverage | Without Coverage |
| Under 6 Years | 123 (96.9%) | 4 (3.2%) |
| 6 to 18 Years | 91 (90.1%) | 10 (9.9%) |
| 19 to 25 Years | 43 (56.6%) | 33 (43.4%) |
| 26 to 34 Years | 56 (82.4%) | 12 (17.6%) |
| 35 to 44 Years | 59 (100.0%) | 0 (0.0%) |
| 45 to 54 Years | 86 (86.0%) | 14 (14.0%) |
| 55 to 64 Years | 83 (85.6%) | 14 (14.4%) |
| 65 to 74 Years | 159 (100.0%) | 0 (0.0%) |
| 75 Years and older | 46 (100.0%) | 0 (0.0%) |
| Total | 746 (89.6%) | 87 (10.4%) |
Health Insurance Coverage by Citizenship Status in Greendale
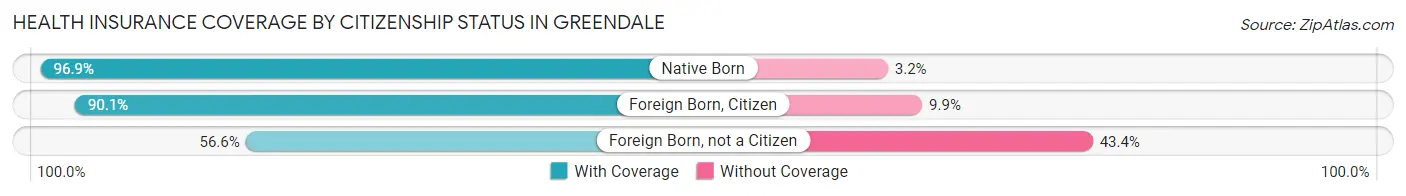
| Citizenship Status | With Coverage | Without Coverage |
| Native Born | 123 (96.9%) | 4 (3.2%) |
| Foreign Born, Citizen | 91 (90.1%) | 10 (9.9%) |
| Foreign Born, not a Citizen | 43 (56.6%) | 33 (43.4%) |
Health Insurance Coverage by Household Income in Greendale
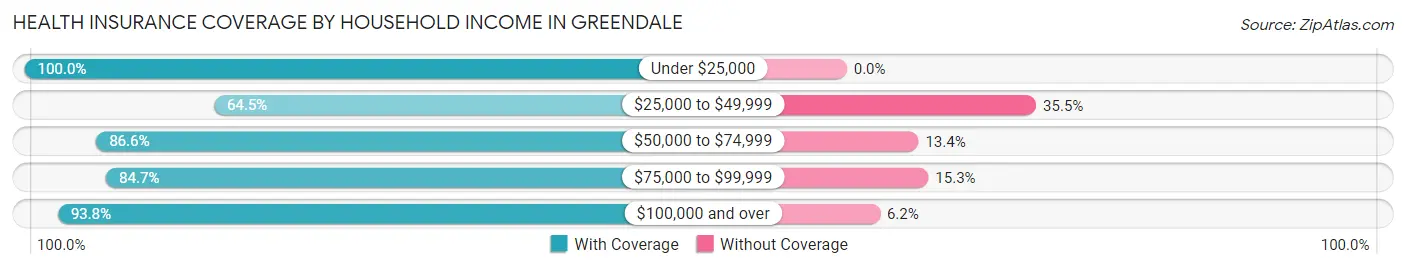
| Household Income | With Coverage | Without Coverage |
| Under $25,000 | 365 (100.0%) | 0 (0.0%) |
| $25,000 to $49,999 | 100 (64.5%) | 55 (35.5%) |
| $50,000 to $74,999 | 58 (86.6%) | 9 (13.4%) |
| $75,000 to $99,999 | 72 (84.7%) | 13 (15.3%) |
| $100,000 and over | 151 (93.8%) | 10 (6.2%) |
Public vs Private Health Insurance Coverage by Age in Greendale
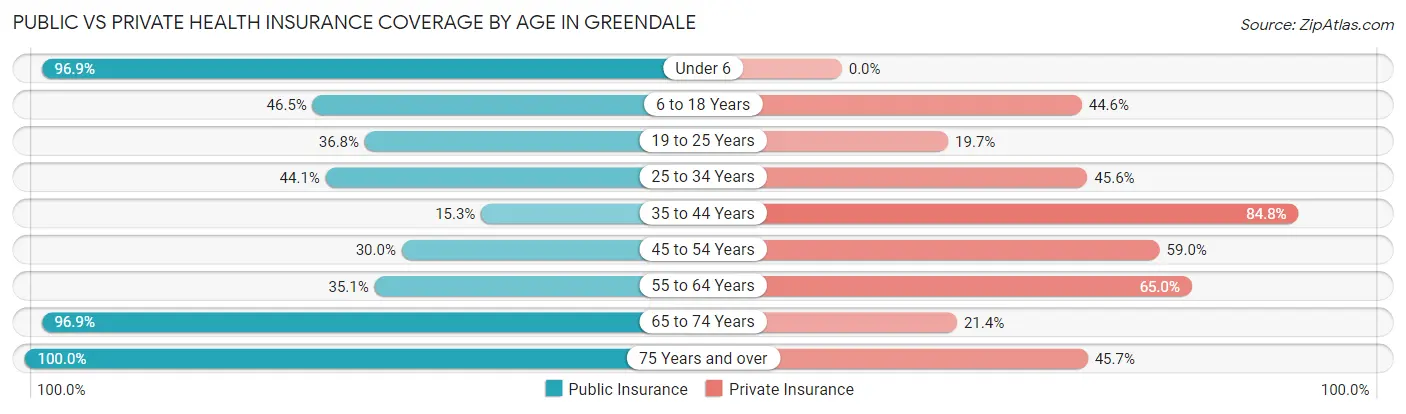
| Age Bracket | Public Insurance | Private Insurance |
| Under 6 | 123 (96.9%) | 0 (0.0%) |
| 6 to 18 Years | 47 (46.5%) | 45 (44.6%) |
| 19 to 25 Years | 28 (36.8%) | 15 (19.7%) |
| 25 to 34 Years | 30 (44.1%) | 31 (45.6%) |
| 35 to 44 Years | 9 (15.2%) | 50 (84.8%) |
| 45 to 54 Years | 30 (30.0%) | 59 (59.0%) |
| 55 to 64 Years | 34 (35.0%) | 63 (64.9%) |
| 65 to 74 Years | 154 (96.9%) | 34 (21.4%) |
| 75 Years and over | 46 (100.0%) | 21 (45.7%) |
| Total | 501 (60.1%) | 318 (38.2%) |
Disability Status by Sex by Age in Greendale
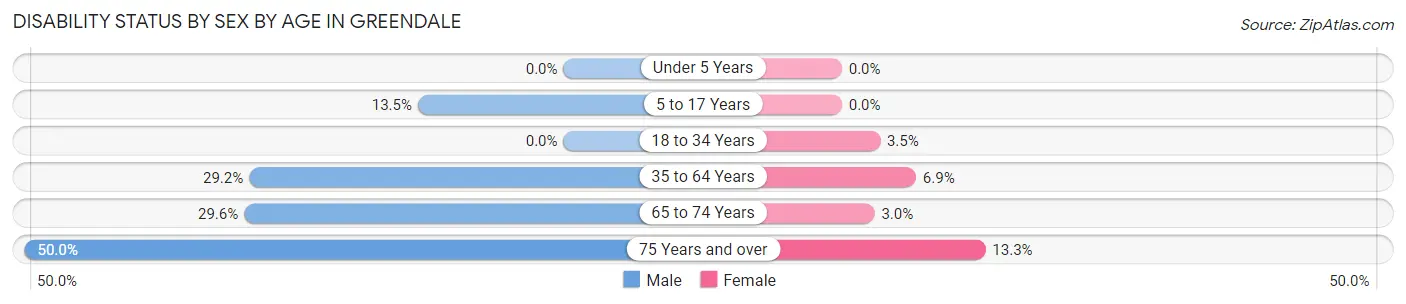
| Age Bracket | Male | Female |
| Under 5 Years | 0 (0.0%) | 0 (0.0%) |
| 5 to 17 Years | 5 (13.5%) | 0 (0.0%) |
| 18 to 34 Years | 0 (0.0%) | 4 (3.5%) |
| 35 to 64 Years | 28 (29.2%) | 11 (6.9%) |
| 65 to 74 Years | 8 (29.6%) | 4 (3.0%) |
| 75 Years and over | 8 (50.0%) | 4 (13.3%) |
Disability Class by Sex by Age in Greendale
Disability Class: Hearing Difficulty
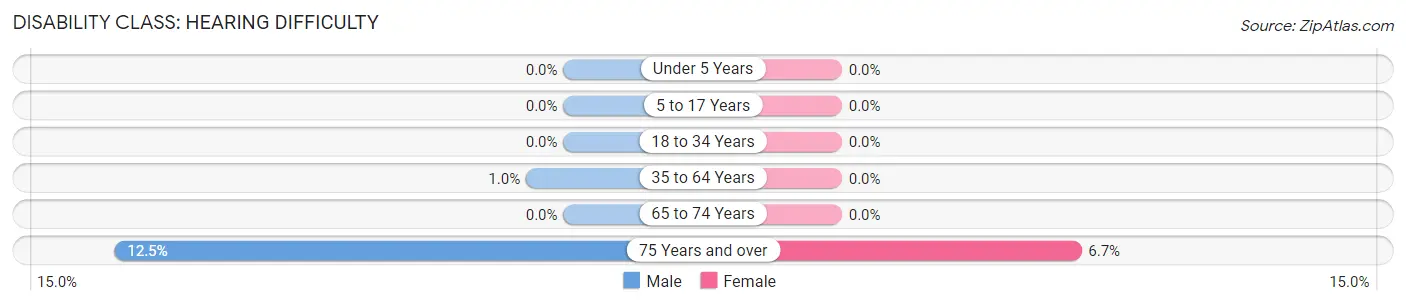
| Age Bracket | Male | Female |
| Under 5 Years | 0 (0.0%) | 0 (0.0%) |
| 5 to 17 Years | 0 (0.0%) | 0 (0.0%) |
| 18 to 34 Years | 0 (0.0%) | 0 (0.0%) |
| 35 to 64 Years | 1 (1.0%) | 0 (0.0%) |
| 65 to 74 Years | 0 (0.0%) | 0 (0.0%) |
| 75 Years and over | 2 (12.5%) | 2 (6.7%) |
Disability Class: Vision Difficulty
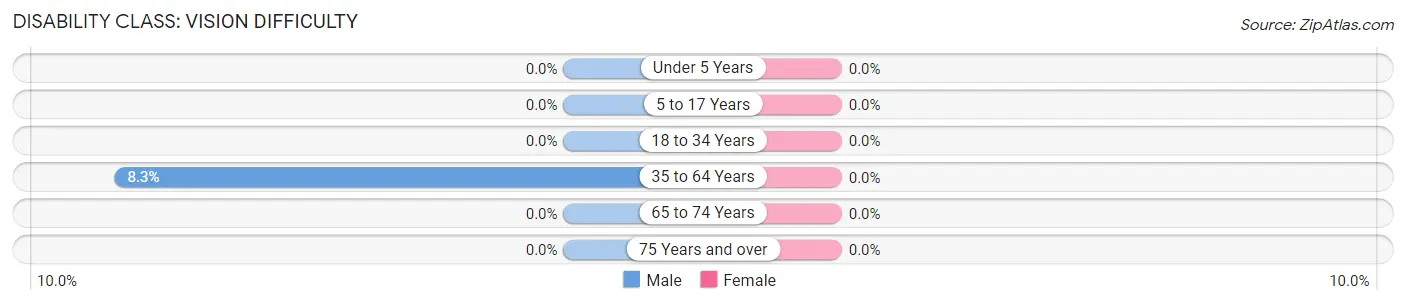
| Age Bracket | Male | Female |
| Under 5 Years | 0 (0.0%) | 0 (0.0%) |
| 5 to 17 Years | 0 (0.0%) | 0 (0.0%) |
| 18 to 34 Years | 0 (0.0%) | 0 (0.0%) |
| 35 to 64 Years | 8 (8.3%) | 0 (0.0%) |
| 65 to 74 Years | 0 (0.0%) | 0 (0.0%) |
| 75 Years and over | 0 (0.0%) | 0 (0.0%) |
Disability Class: Cognitive Difficulty
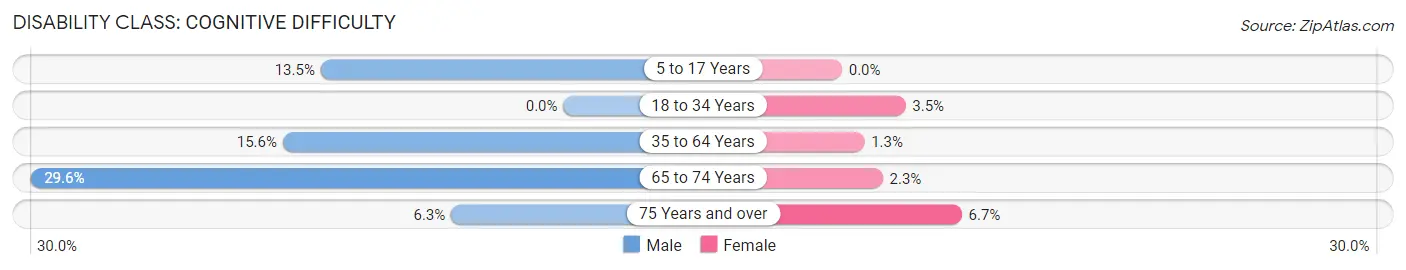
| Age Bracket | Male | Female |
| 5 to 17 Years | 5 (13.5%) | 0 (0.0%) |
| 18 to 34 Years | 0 (0.0%) | 4 (3.5%) |
| 35 to 64 Years | 15 (15.6%) | 2 (1.3%) |
| 65 to 74 Years | 8 (29.6%) | 3 (2.3%) |
| 75 Years and over | 1 (6.2%) | 2 (6.7%) |
Disability Class: Ambulatory Difficulty
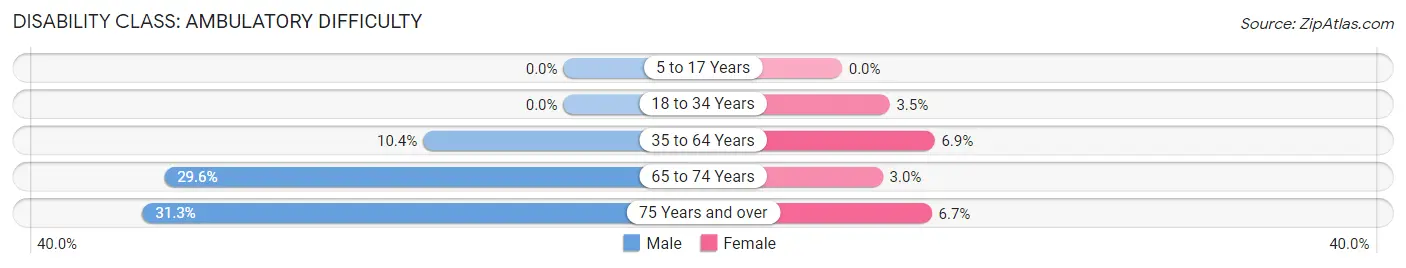
| Age Bracket | Male | Female |
| 5 to 17 Years | 0 (0.0%) | 0 (0.0%) |
| 18 to 34 Years | 0 (0.0%) | 4 (3.5%) |
| 35 to 64 Years | 10 (10.4%) | 11 (6.9%) |
| 65 to 74 Years | 8 (29.6%) | 4 (3.0%) |
| 75 Years and over | 5 (31.2%) | 2 (6.7%) |
Disability Class: Self-Care Difficulty
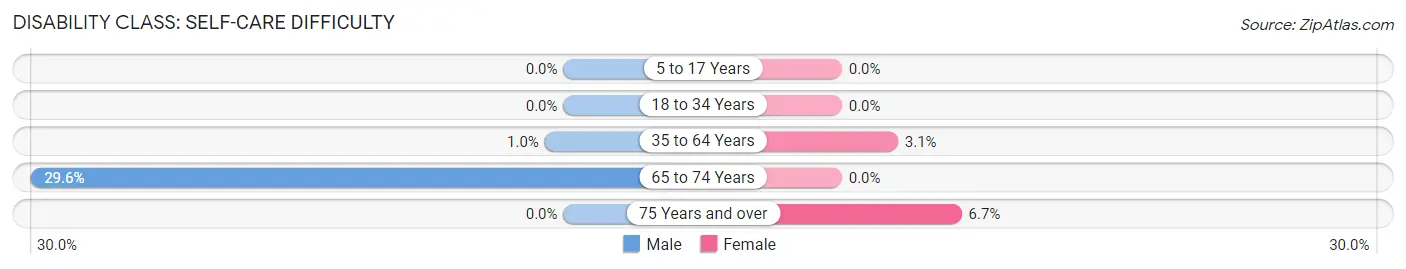
| Age Bracket | Male | Female |
| 5 to 17 Years | 0 (0.0%) | 0 (0.0%) |
| 18 to 34 Years | 0 (0.0%) | 0 (0.0%) |
| 35 to 64 Years | 1 (1.0%) | 5 (3.1%) |
| 65 to 74 Years | 8 (29.6%) | 0 (0.0%) |
| 75 Years and over | 0 (0.0%) | 2 (6.7%) |
Technology Access in Greendale
Computing Device Access in Greendale
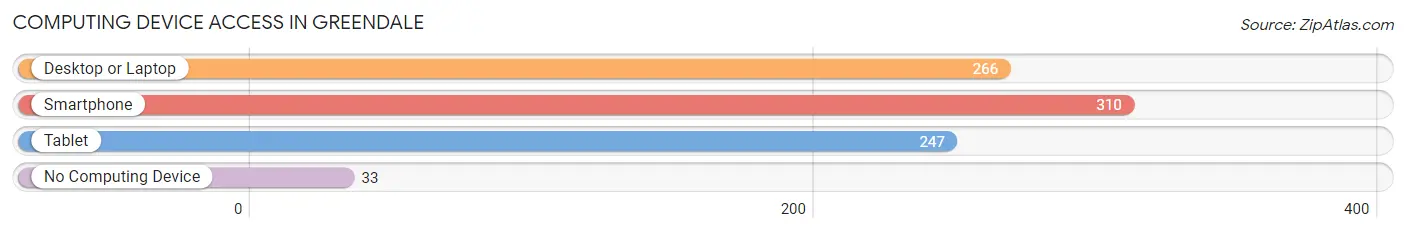
| Device Type | # Households | % Households |
| Desktop or Laptop | 266 | 74.1% |
| Smartphone | 310 | 86.4% |
| Tablet | 247 | 68.8% |
| No Computing Device | 33 | 9.2% |
| Total | 359 | 100.0% |
Internet Access in Greendale
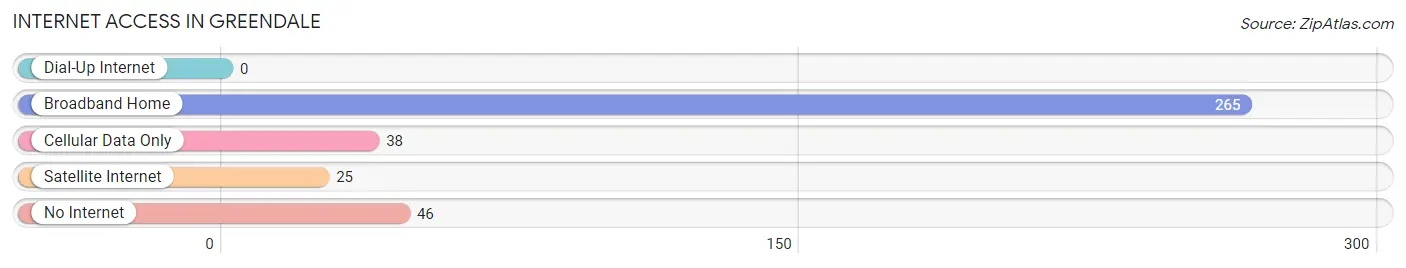
| Internet Type | # Households | % Households |
| Dial-Up Internet | 0 | 0.0% |
| Broadband Home | 265 | 73.8% |
| Cellular Data Only | 38 | 10.6% |
| Satellite Internet | 25 | 7.0% |
| No Internet | 46 | 12.8% |
| Total | 359 | 100.0% |
Greendale Summary
Greendale, Missouri is a small town located in the southeastern corner of the state, just north of the Arkansas border. It is part of the Ozark Mountains region and is situated in the foothills of the St. Francois Mountains. The town is located in St. Francois County and is home to a population of just over 1,000 people.
History
The area that is now Greendale was first settled in the early 1800s by a group of settlers from Kentucky. The town was originally known as “Greendale” after the green hills that surrounded the area. The town was officially incorporated in 1883 and was named after the nearby Greendale Creek.
In the late 1800s, the town was a thriving agricultural community, with many of the residents working in the local cotton and tobacco fields. The town also had a number of small businesses, including a general store, a blacksmith shop, and a sawmill.
In the early 1900s, the town began to experience a decline in population as many of the residents moved away to larger cities in search of better job opportunities. However, the town was able to remain relatively stable throughout the 20th century, and today it is still a small, rural community.
Geography
Greendale is located in the southeastern corner of Missouri, just north of the Arkansas border. It is part of the Ozark Mountains region and is situated in the foothills of the St. Francois Mountains. The town is located in St. Francois County and is home to a population of just over 1,000 people.
The town is situated on the banks of the St. Francis River, which is a tributary of the Mississippi River. The town is surrounded by rolling hills and is home to a number of small lakes and ponds. The town is also located near the Mark Twain National Forest, which is a popular destination for outdoor recreation.
Economy
The economy of Greendale is largely based on agriculture and tourism. The town is home to a number of small farms, which produce a variety of crops, including corn, soybeans, and wheat. The town is also home to a number of small businesses, including a general store, a blacksmith shop, and a sawmill.
The town is also a popular destination for tourists, who come to enjoy the natural beauty of the Ozark Mountains. The town is home to a number of small bed and breakfasts, as well as a number of restaurants and shops.
Demographics
As of the 2010 census, the population of Greendale was 1,072. The town is predominantly white, with 92.3% of the population identifying as such. The town also has a small African American population, with 4.2% of the population identifying as such. The town also has a small Hispanic population, with 1.3% of the population identifying as such.
The median household income in Greendale is $37,500, and the median home value is $90,000. The town has a poverty rate of 16.3%, which is slightly higher than the national average.
Conclusion
Greendale, Missouri is a small town located in the southeastern corner of the state, just north of the Arkansas border. It is part of the Ozark Mountains region and is situated in the foothills of the St. Francois Mountains. The town is located in St. Francois County and is home to a population of just over 1,000 people. The town is largely supported by agriculture and tourism, and is a popular destination for outdoor recreation. The town is predominantly white, with a small African American and Hispanic population. The median household income in Greendale is $37,500, and the median home value is $90,000.
Common Questions
What is the Total Population of Greendale?
Total Population of Greendale is 833.
What is the Total Male Population of Greendale?
Total Male Population of Greendale is 300.
What is the Total Female Population of Greendale?
Total Female Population of Greendale is 533.
What is the Ratio of Males per 100 Females in Greendale?
There are 56.29 Males per 100 Females in Greendale.
What is the Ratio of Females per 100 Males in Greendale?
There are 177.67 Females per 100 Males in Greendale.
What is the Median Population Age in Greendale?
Median Population Age in Greendale is 43.4 Years.
What is the Average Family Size in Greendale
Average Family Size in Greendale is 3.2 People.
What is the Average Household Size in Greendale
Average Household Size in Greendale is 2.3 People.
What is Per Capita Income in Greendale?
Per Capita income in Greendale is $24,570.
What is the Median Household income in Greendale?
Median Household Income in Greendale is $35,096.
What is Income or Wage Gap in Greendale?
Income or Wage Gap in Greendale is 5.6%.
Women in Greendale earn 94.4 cents for every dollar earned by a man.
What is Inequality or Gini Index in Greendale?
Inequality or Gini Index in Greendale is 0.47.
How Large is the Labor Force in Greendale?
There are 266 People in the Labor Forcein in Greendale.
What is the Percentage of People in the Labor Force in Greendale?
41.9% of People are in the Labor Force in Greendale.
What is the Unemployment Rate in Greendale?
Unemployment Rate in Greendale is 7.5%.