St James, MN
St James Map
St James Overview
4,757
TOTAL POPULATION
2,470
MALE POPULATION
2,287
FEMALE POPULATION
108.00
MALES / 100 FEMALES
92.59
FEMALES / 100 MALES
36.9
MEDIAN AGE
3.4
AVG FAMILY SIZE
2.5
AVG HOUSEHOLD SIZE
$30,308
PER CAPITA INCOME
$77,023
AVG FAMILY INCOME
$50,938
AVG HOUSEHOLD INCOME
48.6%
WAGE / INCOME GAP [ % ]
51.4¢/ $1
WAGE / INCOME GAP [ $ ]
$13,218
FAMILY INCOME DEFICIT
0.49
INEQUALITY / GINI INDEX
2,064
LABOR FORCE [ PEOPLE ]
58.8%
PERCENT IN LABOR FORCE
10.7%
UNEMPLOYMENT RATE
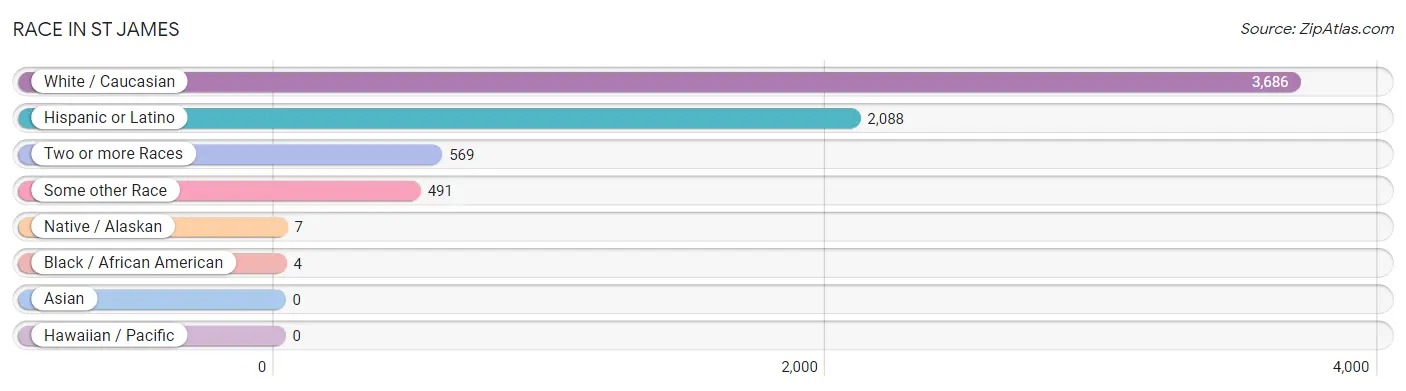
Race in St James
The most populous races in St James are White / Caucasian (3,686 | 77.5%), Hispanic or Latino (2,088 | 43.9%), and Two or more Races (569 | 12.0%).
| Race | # Population | % Population |
| Asian | 0 | 0.0% |
| Black / African American | 4 | 0.1% |
| Hawaiian / Pacific | 0 | 0.0% |
| Hispanic or Latino | 2,088 | 43.9% |
| Native / Alaskan | 7 | 0.2% |
| White / Caucasian | 3,686 | 77.5% |
| Two or more Races | 569 | 12.0% |
| Some other Race | 491 | 10.3% |
| Total | 4,757 | 100.0% |
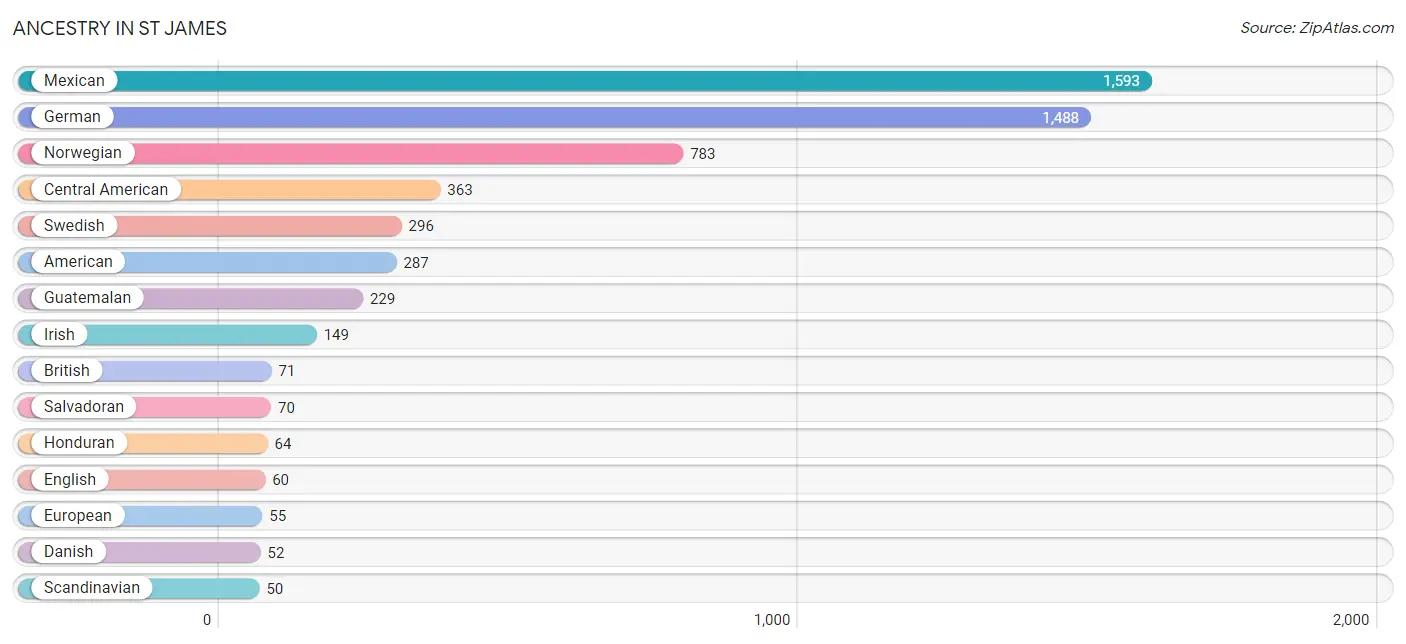
Ancestry in St James
The most populous ancestries reported in St James are Mexican (1,593 | 33.5%), German (1,488 | 31.3%), Norwegian (783 | 16.5%), Central American (363 | 7.6%), and Swedish (296 | 6.2%), together accounting for 95.1% of all St James residents.
| Ancestry | # Population | % Population |
| American | 287 | 6.0% |
| Basque | 5 | 0.1% |
| British | 71 | 1.5% |
| Central American | 363 | 7.6% |
| Czech | 24 | 0.5% |
| Danish | 52 | 1.1% |
| English | 60 | 1.3% |
| European | 55 | 1.2% |
| French | 17 | 0.4% |
| French Canadian | 17 | 0.4% |
| German | 1,488 | 31.3% |
| German Russian | 27 | 0.6% |
| Greek | 21 | 0.4% |
| Guatemalan | 229 | 4.8% |
| Honduran | 64 | 1.3% |
| Irish | 149 | 3.1% |
| Italian | 35 | 0.7% |
| Korean | 25 | 0.5% |
| Lithuanian | 15 | 0.3% |
| Mexican | 1,593 | 33.5% |
| Norwegian | 783 | 16.5% |
| Polish | 44 | 0.9% |
| Puerto Rican | 33 | 0.7% |
| Salvadoran | 70 | 1.5% |
| Scandinavian | 50 | 1.1% |
| Scotch-Irish | 11 | 0.2% |
| Scottish | 42 | 0.9% |
| Swedish | 296 | 6.2% |
| Swiss | 9 | 0.2% |
| Ukrainian | 9 | 0.2% |
| Welsh | 15 | 0.3% | View All 31 Rows |
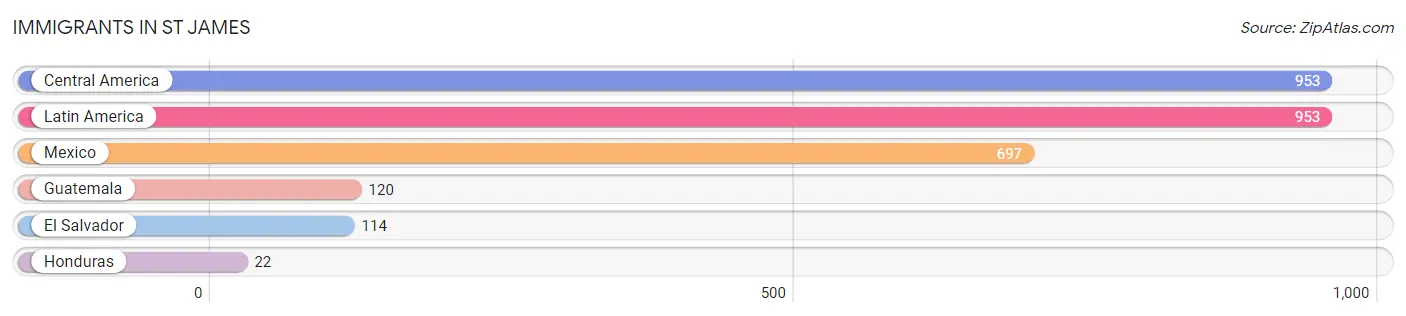
Immigrants in St James
The most numerous immigrant groups reported in St James came from Central America (953 | 20.0%), Latin America (953 | 20.0%), Mexico (697 | 14.6%), Guatemala (120 | 2.5%), and El Salvador (114 | 2.4%), together accounting for 59.6% of all St James residents.
| Immigration Origin | # Population | % Population |
| Central America | 953 | 20.0% |
| El Salvador | 114 | 2.4% |
| Guatemala | 120 | 2.5% |
| Honduras | 22 | 0.5% |
| Latin America | 953 | 20.0% |
| Mexico | 697 | 14.6% | View All 6 Rows |
Sex and Age in St James
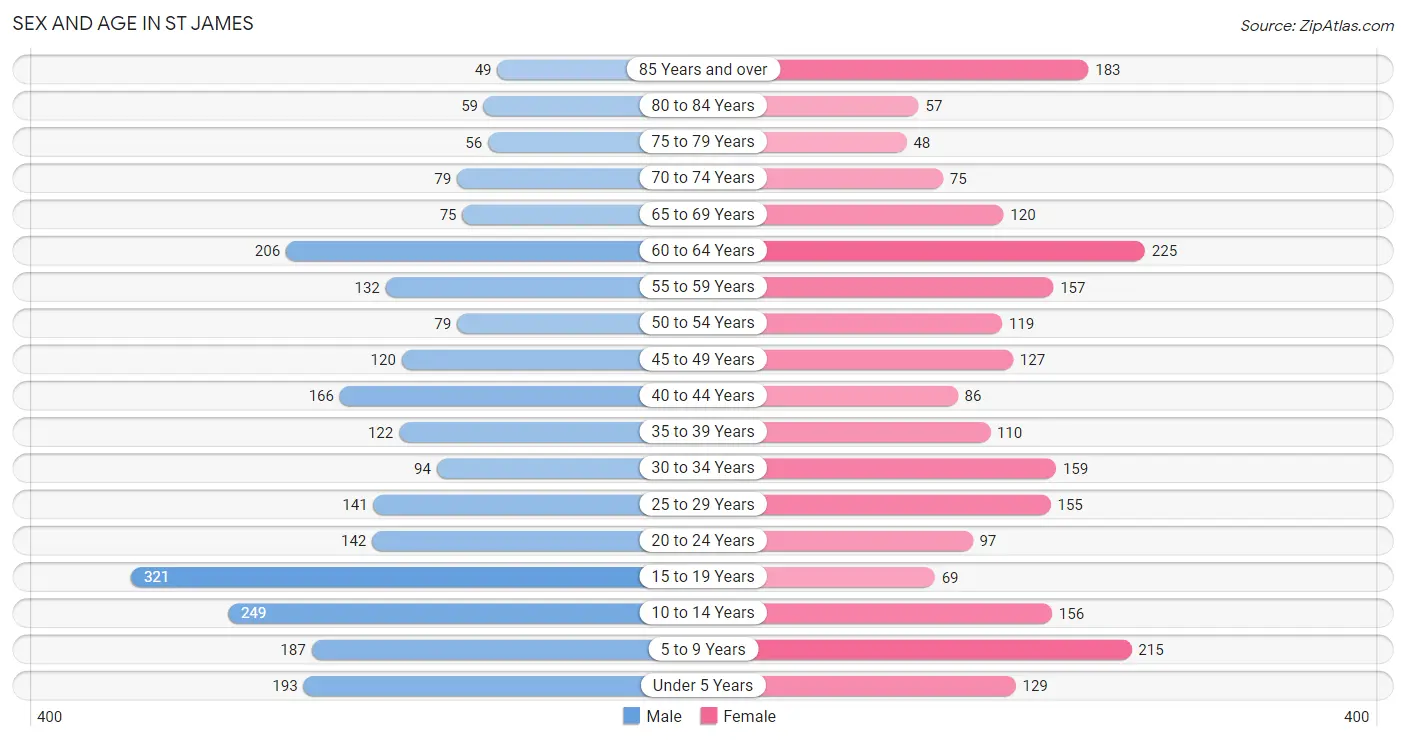
Sex and Age in St James
The most populous age groups in St James are 15 to 19 Years (321 | 13.0%) for men and 60 to 64 Years (225 | 9.8%) for women.
| Age Bracket | Male | Female |
| Under 5 Years | 193 (7.8%) | 129 (5.6%) |
| 5 to 9 Years | 187 (7.6%) | 215 (9.4%) |
| 10 to 14 Years | 249 (10.1%) | 156 (6.8%) |
| 15 to 19 Years | 321 (13.0%) | 69 (3.0%) |
| 20 to 24 Years | 142 (5.8%) | 97 (4.2%) |
| 25 to 29 Years | 141 (5.7%) | 155 (6.8%) |
| 30 to 34 Years | 94 (3.8%) | 159 (7.0%) |
| 35 to 39 Years | 122 (4.9%) | 110 (4.8%) |
| 40 to 44 Years | 166 (6.7%) | 86 (3.8%) |
| 45 to 49 Years | 120 (4.9%) | 127 (5.6%) |
| 50 to 54 Years | 79 (3.2%) | 119 (5.2%) |
| 55 to 59 Years | 132 (5.3%) | 157 (6.9%) |
| 60 to 64 Years | 206 (8.3%) | 225 (9.8%) |
| 65 to 69 Years | 75 (3.0%) | 120 (5.2%) |
| 70 to 74 Years | 79 (3.2%) | 75 (3.3%) |
| 75 to 79 Years | 56 (2.3%) | 48 (2.1%) |
| 80 to 84 Years | 59 (2.4%) | 57 (2.5%) |
| 85 Years and over | 49 (2.0%) | 183 (8.0%) |
| Total | 2,470 (100.0%) | 2,287 (100.0%) |
Families and Households in St James
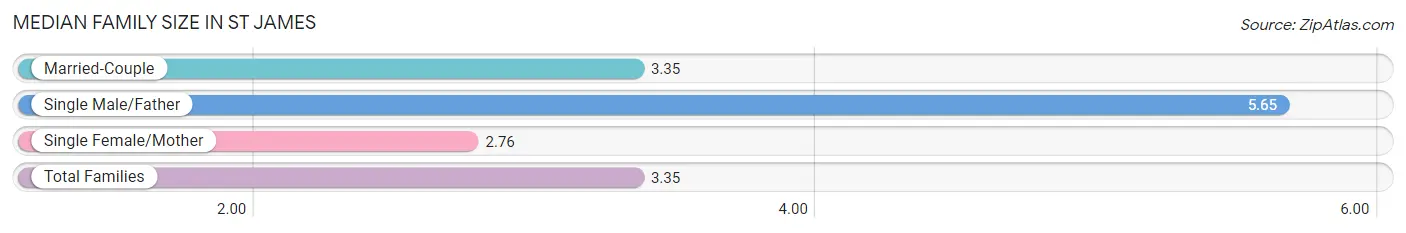
Median Family Size in St James
The median family size in St James is 3.35 persons per family, with single male/father families (55 | 4.9%) accounting for the largest median family size of 5.65 persons per family. On the other hand, single female/mother families (217 | 19.3%) represent the smallest median family size with 2.76 persons per family.
| Family Type | # Families | Family Size |
| Married-Couple | 855 (75.9%) | 3.35 |
| Single Male/Father | 55 (4.9%) | 5.65 |
| Single Female/Mother | 217 (19.3%) | 2.76 |
| Total Families | 1,127 (100.0%) | 3.35 |
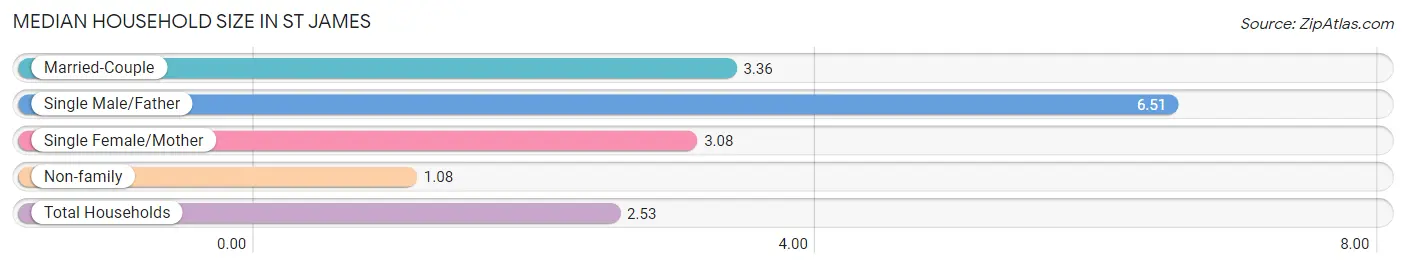
Median Household Size in St James
The median household size in St James is 2.53 persons per household, with single male/father households (55 | 3.0%) accounting for the largest median household size of 6.51 persons per household. non-family households (725 | 39.2%) represent the smallest median household size with 1.08 persons per household.
| Household Type | # Households | Household Size |
| Married-Couple | 855 (46.2%) | 3.36 |
| Single Male/Father | 55 (3.0%) | 6.51 |
| Single Female/Mother | 217 (11.7%) | 3.08 |
| Non-family | 725 (39.2%) | 1.08 |
| Total Households | 1,852 (100.0%) | 2.53 |
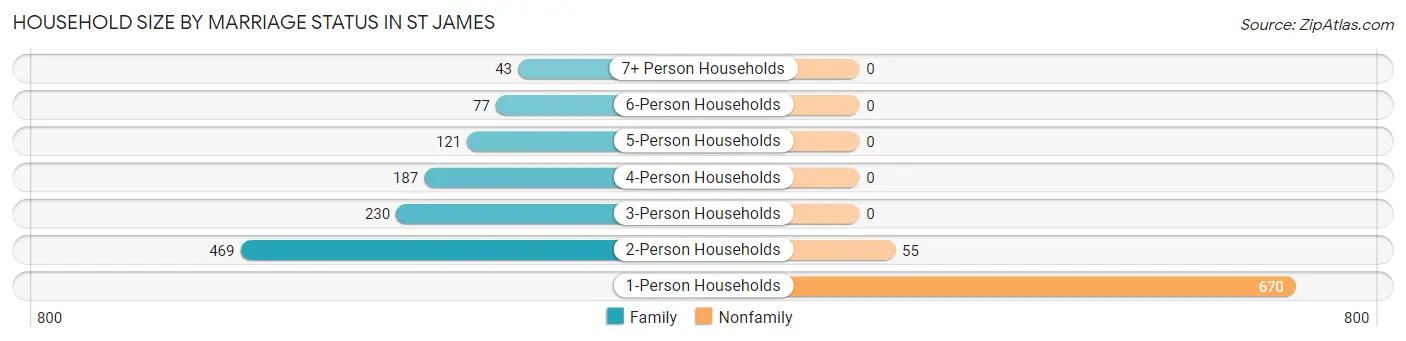
Household Size by Marriage Status in St James
Out of a total of 1,852 households in St James, 1,127 (60.9%) are family households, while 725 (39.2%) are nonfamily households. The most numerous type of family households are 2-person households, comprising 469, and the most common type of nonfamily households are 1-person households, comprising 670.
| Household Size | Family Households | Nonfamily Households |
| 1-Person Households | - | 670 (36.2%) |
| 2-Person Households | 469 (25.3%) | 55 (3.0%) |
| 3-Person Households | 230 (12.4%) | 0 (0.0%) |
| 4-Person Households | 187 (10.1%) | 0 (0.0%) |
| 5-Person Households | 121 (6.5%) | 0 (0.0%) |
| 6-Person Households | 77 (4.2%) | 0 (0.0%) |
| 7+ Person Households | 43 (2.3%) | 0 (0.0%) |
| Total | 1,127 (60.9%) | 725 (39.2%) |
Female Fertility in St James
Fertility by Age in St James
Average fertility rate in St James is 68.0 births per 1,000 women. Women in the age bracket of 20 to 34 years have the highest fertility rate with 144.0 births per 1,000 women. Women in the age bracket of 20 to 34 years acount for 100.0% of all women with births.
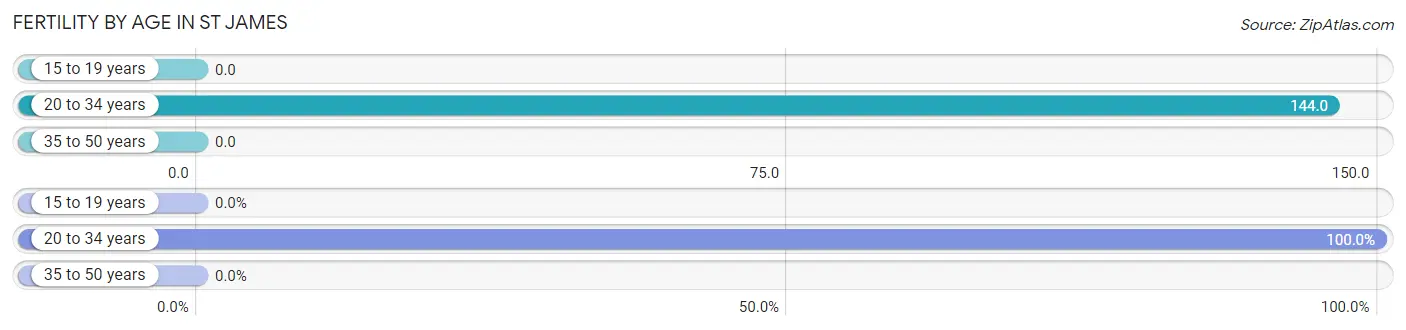
| Age Bracket | Women with Births | Births / 1,000 Women |
| 15 to 19 years | 0 (0.0%) | 0.0 |
| 20 to 34 years | 59 (100.0%) | 144.0 |
| 35 to 50 years | 0 (0.0%) | 0.0 |
| Total | 59 (100.0%) | 68.0 |
Fertility by Age by Marriage Status in St James
69.5% of women with births (59) in St James are married. The highest percentage of unmarried women with births falls into 20 to 34 years age bracket with 30.5% of them unmarried at the time of birth, while the lowest percentage of unmarried women with births belong to 20 to 34 years age bracket with 30.5% of them unmarried.
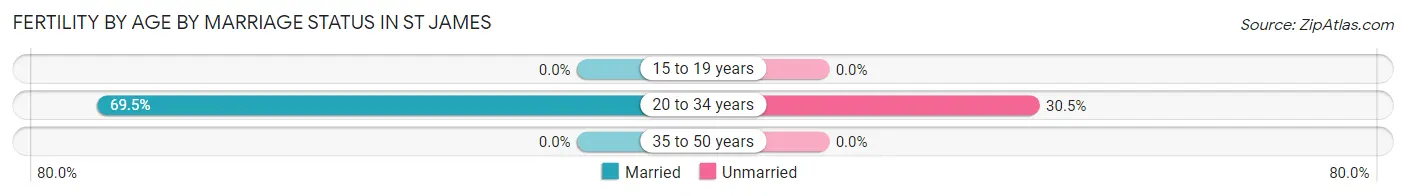
| Age Bracket | Married | Unmarried |
| 15 to 19 years | 0 (0.0%) | 0 (0.0%) |
| 20 to 34 years | 41 (69.5%) | 18 (30.5%) |
| 35 to 50 years | 0 (0.0%) | 0 (0.0%) |
| Total | 41 (69.5%) | 18 (30.5%) |
Fertility by Education in St James
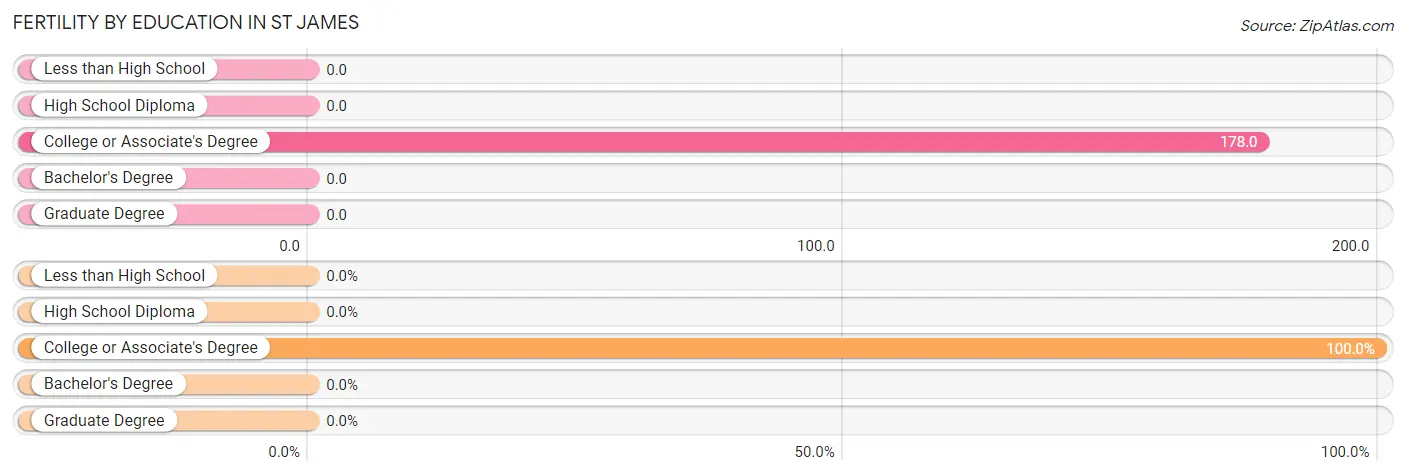
| Educational Attainment | Women with Births | Births / 1,000 Women |
| Less than High School | 0 (0.0%) | 0.0 |
| High School Diploma | 0 (0.0%) | 0.0 |
| College or Associate's Degree | 59 (100.0%) | 178.0 |
| Bachelor's Degree | 0 (0.0%) | 0.0 |
| Graduate Degree | 0 (0.0%) | 0.0 |
| Total | 59 (100.0%) | 68.0 |
Fertility by Education by Marriage Status in St James
30.5% of women with births in St James are unmarried. Women with the educational attainment of college or associate's degree are most likely to be married with 69.5% of them married at childbirth, while women with the educational attainment of college or associate's degree are least likely to be married with 30.5% of them unmarried at childbirth.
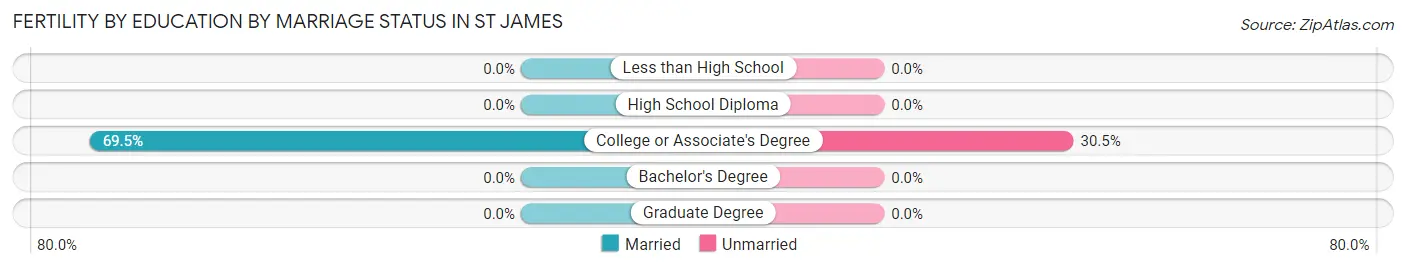
| Educational Attainment | Married | Unmarried |
| Less than High School | 0 (0.0%) | 0 (0.0%) |
| High School Diploma | 0 (0.0%) | 0 (0.0%) |
| College or Associate's Degree | 41 (69.5%) | 18 (30.5%) |
| Bachelor's Degree | 0 (0.0%) | 0 (0.0%) |
| Graduate Degree | 0 (0.0%) | 0 (0.0%) |
| Total | 41 (69.5%) | 18 (30.5%) |
Income in St James
Income Overview in St James
Per Capita Income in St James is $30,308, while median incomes of families and households are $77,023 and $50,938 respectively.
| Characteristic | Number | Measure |
| Per Capita Income | 4,757 | $30,308 |
| Median Family Income | 1,127 | $77,023 |
| Mean Family Income | 1,127 | $87,265 |
| Median Household Income | 1,852 | $50,938 |
| Mean Household Income | 1,852 | $76,057 |
| Income Deficit | 1,127 | $13,218 |
| Wage / Income Gap (%) | 4,757 | 48.59% |
| Wage / Income Gap ($) | 4,757 | 51.41¢ per $1 |
| Gini / Inequality Index | 4,757 | 0.49 |
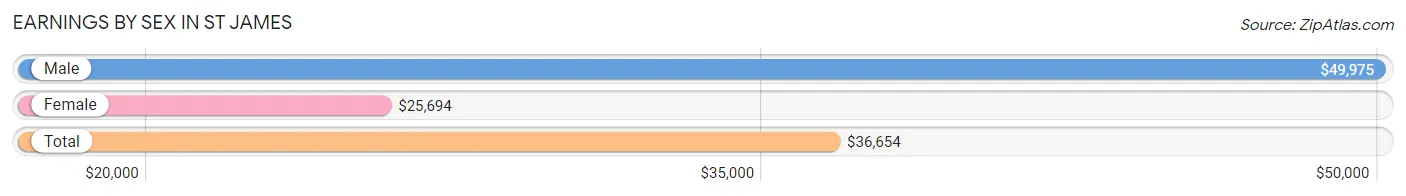
Earnings by Sex in St James
Average Earnings in St James are $36,654, $49,975 for men and $25,694 for women, a difference of 48.6%.
| Sex | Number | Average Earnings |
| Male | 1,303 (55.1%) | $49,975 |
| Female | 1,062 (44.9%) | $25,694 |
| Total | 2,365 (100.0%) | $36,654 |
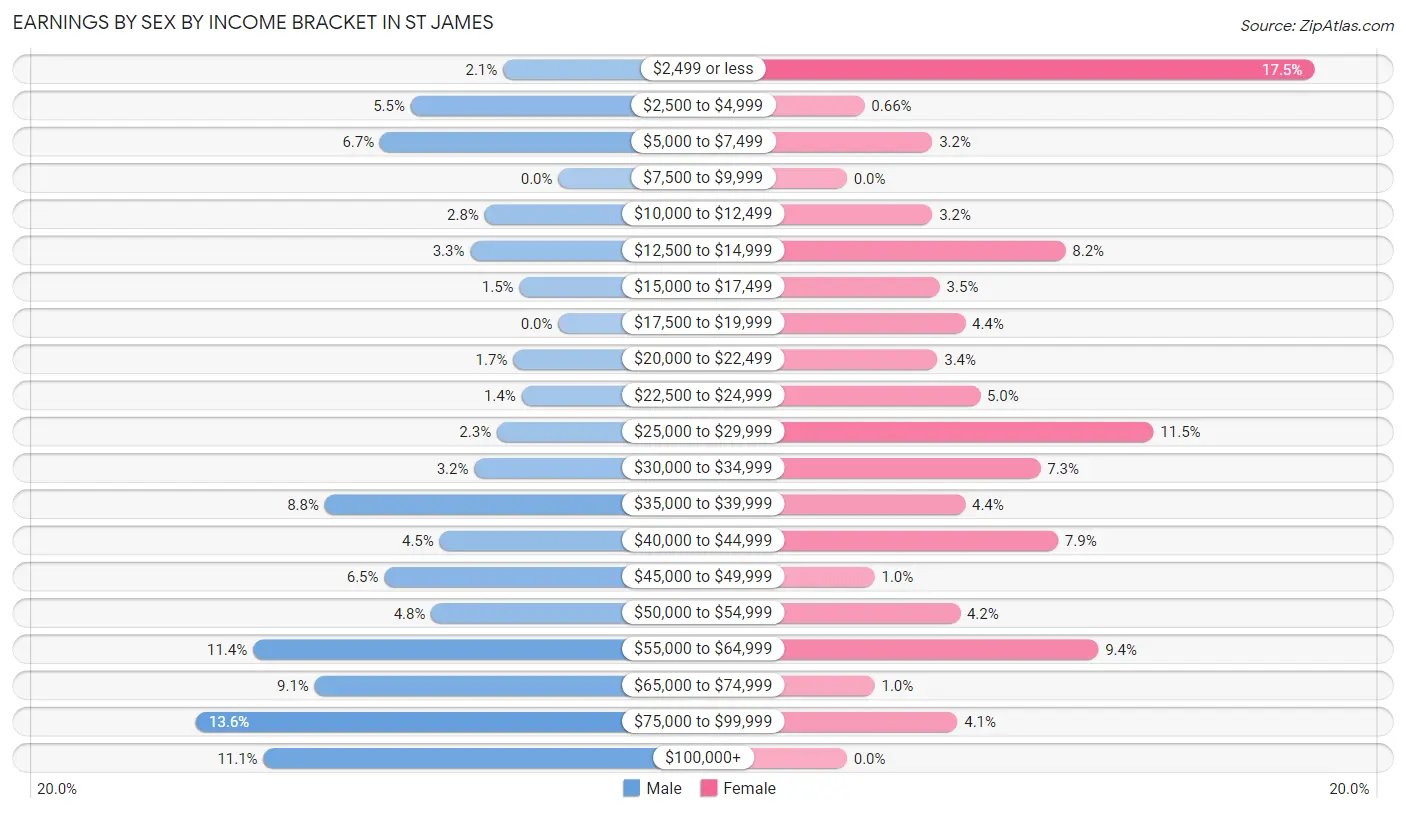
Earnings by Sex by Income Bracket in St James
The most common earnings brackets in St James are $75,000 to $99,999 for men (177 | 13.6%) and $2,499 or less for women (186 | 17.5%).
| Income | Male | Female |
| $2,499 or less | 27 (2.1%) | 186 (17.5%) |
| $2,500 to $4,999 | 72 (5.5%) | 7 (0.7%) |
| $5,000 to $7,499 | 87 (6.7%) | 34 (3.2%) |
| $7,500 to $9,999 | 0 (0.0%) | 0 (0.0%) |
| $10,000 to $12,499 | 36 (2.8%) | 34 (3.2%) |
| $12,500 to $14,999 | 43 (3.3%) | 87 (8.2%) |
| $15,000 to $17,499 | 19 (1.5%) | 37 (3.5%) |
| $17,500 to $19,999 | 0 (0.0%) | 47 (4.4%) |
| $20,000 to $22,499 | 22 (1.7%) | 36 (3.4%) |
| $22,500 to $24,999 | 18 (1.4%) | 53 (5.0%) |
| $25,000 to $29,999 | 30 (2.3%) | 122 (11.5%) |
| $30,000 to $34,999 | 41 (3.2%) | 77 (7.2%) |
| $35,000 to $39,999 | 114 (8.7%) | 47 (4.4%) |
| $40,000 to $44,999 | 58 (4.4%) | 84 (7.9%) |
| $45,000 to $49,999 | 85 (6.5%) | 11 (1.0%) |
| $50,000 to $54,999 | 62 (4.8%) | 45 (4.2%) |
| $55,000 to $64,999 | 149 (11.4%) | 100 (9.4%) |
| $65,000 to $74,999 | 119 (9.1%) | 11 (1.0%) |
| $75,000 to $99,999 | 177 (13.6%) | 44 (4.1%) |
| $100,000+ | 144 (11.1%) | 0 (0.0%) |
| Total | 1,303 (100.0%) | 1,062 (100.0%) |
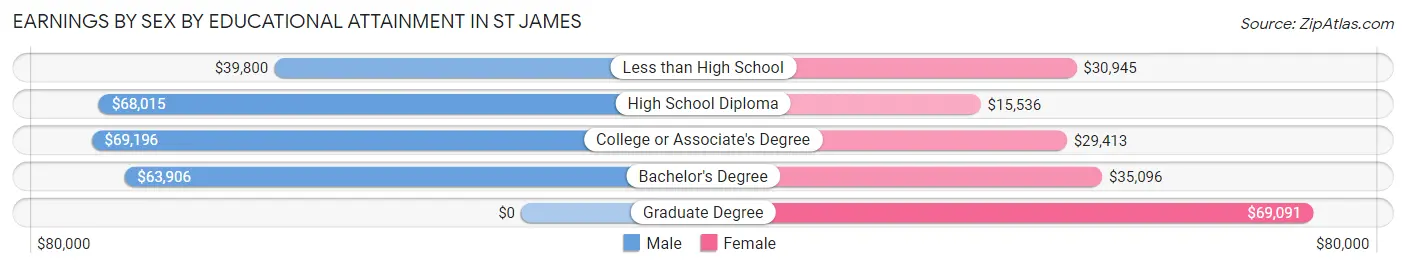
Earnings by Sex by Educational Attainment in St James
Average earnings in St James are $54,122 for men and $28,445 for women, a difference of 47.4%. Men with an educational attainment of college or associate's degree enjoy the highest average annual earnings of $69,196, while those with less than high school education earn the least with $39,800. Women with an educational attainment of graduate degree earn the most with the average annual earnings of $69,091, while those with high school diploma education have the smallest earnings of $15,536.
| Educational Attainment | Male Income | Female Income |
| Less than High School | $39,800 | $30,945 |
| High School Diploma | $68,015 | $15,536 |
| College or Associate's Degree | $69,196 | $29,413 |
| Bachelor's Degree | $63,906 | $35,096 |
| Graduate Degree | - | - |
| Total | $54,122 | $28,445 |
Family Income in St James
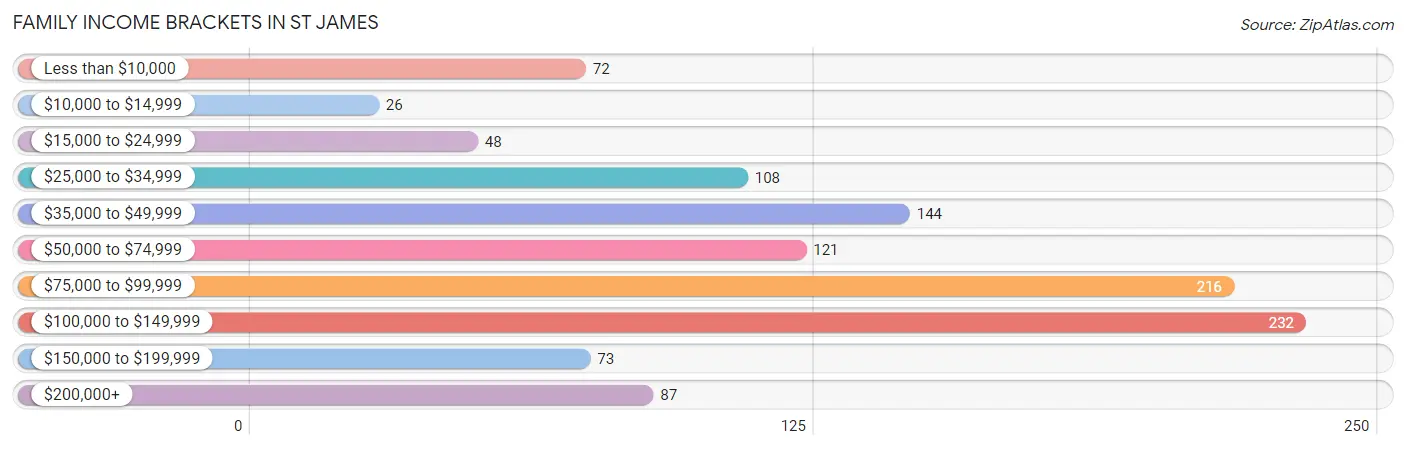
Family Income Brackets in St James
According to the St James family income data, there are 232 families falling into the $100,000 to $149,999 income range, which is the most common income bracket and makes up 20.6% of all families. Conversely, the $10,000 to $14,999 income bracket is the least frequent group with only 26 families (2.3%) belonging to this category.
| Income Bracket | # Families | % Families |
| Less than $10,000 | 72 | 6.4% |
| $10,000 to $14,999 | 26 | 2.3% |
| $15,000 to $24,999 | 48 | 4.3% |
| $25,000 to $34,999 | 108 | 9.6% |
| $35,000 to $49,999 | 144 | 12.8% |
| $50,000 to $74,999 | 121 | 10.7% |
| $75,000 to $99,999 | 216 | 19.2% |
| $100,000 to $149,999 | 232 | 20.6% |
| $150,000 to $199,999 | 73 | 6.5% |
| $200,000+ | 87 | 7.7% |
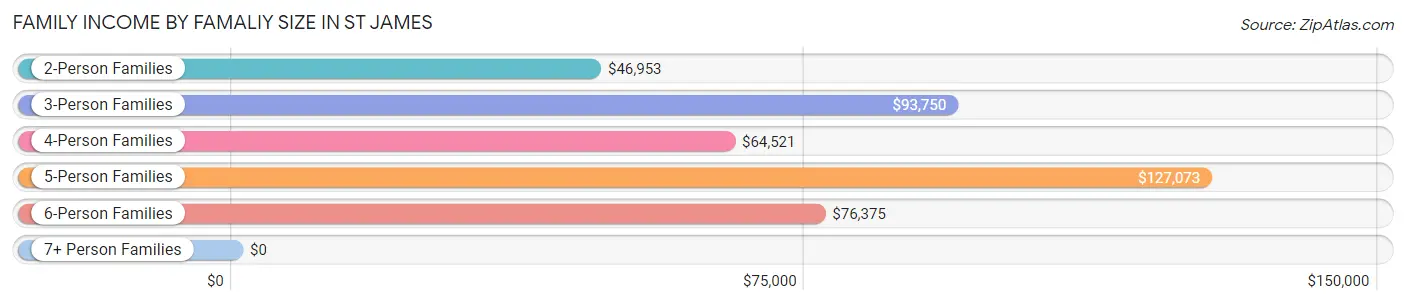
Family Income by Famaliy Size in St James
5-person families (116 | 10.3%) account for the highest median family income in St James with $127,073 per family, while 3-person families (284 | 25.2%) have the highest median income of $31,250 per family member.
| Income Bracket | # Families | Median Income |
| 2-Person Families | 477 (42.3%) | $46,953 |
| 3-Person Families | 284 (25.2%) | $93,750 |
| 4-Person Families | 130 (11.5%) | $64,521 |
| 5-Person Families | 116 (10.3%) | $127,073 |
| 6-Person Families | 89 (7.9%) | $76,375 |
| 7+ Person Families | 31 (2.8%) | $0 |
| Total | 1,127 (100.0%) | $77,023 |
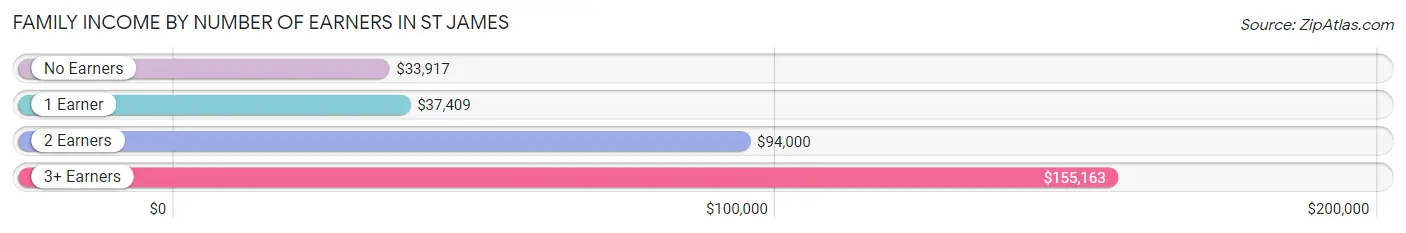
Family Income by Number of Earners in St James
The median family income in St James is $77,023, with families comprising 3+ earners (195) having the highest median family income of $155,163, while families with no earners (131) have the lowest median family income of $33,917, accounting for 17.3% and 11.6% of families, respectively.
| Number of Earners | # Families | Median Income |
| No Earners | 131 (11.6%) | $33,917 |
| 1 Earner | 329 (29.2%) | $37,409 |
| 2 Earners | 472 (41.9%) | $94,000 |
| 3+ Earners | 195 (17.3%) | $155,163 |
| Total | 1,127 (100.0%) | $77,023 |
Household Income in St James
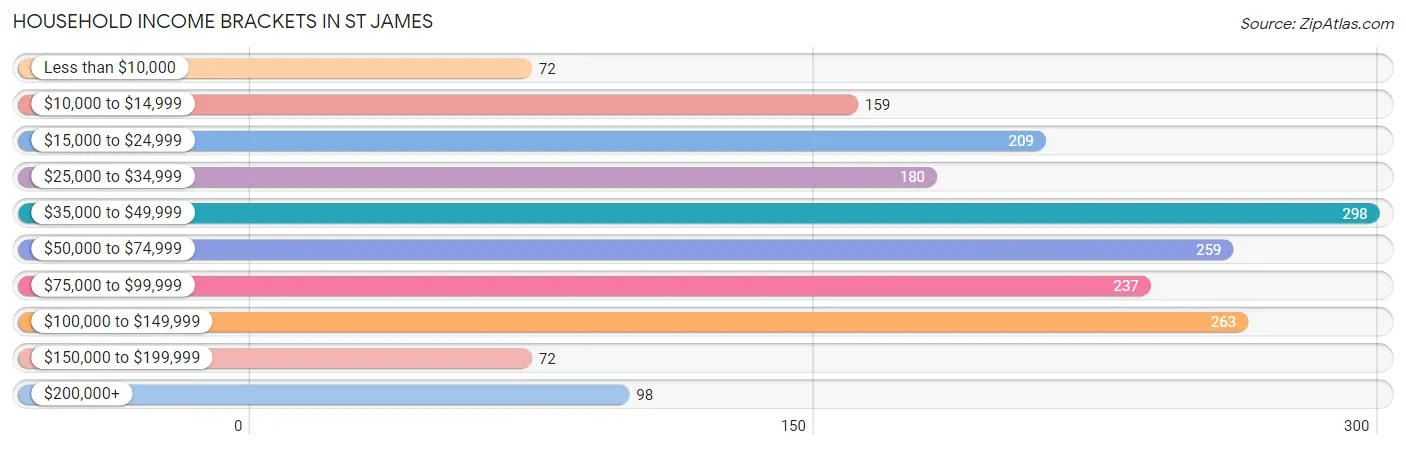
Household Income Brackets in St James
With 298 households falling in the category, the $35,000 to $49,999 income range is the most frequent in St James, accounting for 16.1% of all households. In contrast, only 72 households (3.9%) fall into the less than $10,000 income bracket, making it the least populous group.
| Income Bracket | # Households | % Households |
| Less than $10,000 | 72 | 3.9% |
| $10,000 to $14,999 | 159 | 8.6% |
| $15,000 to $24,999 | 209 | 11.3% |
| $25,000 to $34,999 | 180 | 9.7% |
| $35,000 to $49,999 | 298 | 16.1% |
| $50,000 to $74,999 | 259 | 14.0% |
| $75,000 to $99,999 | 237 | 12.8% |
| $100,000 to $149,999 | 263 | 14.2% |
| $150,000 to $199,999 | 72 | 3.9% |
| $200,000+ | 98 | 5.3% |
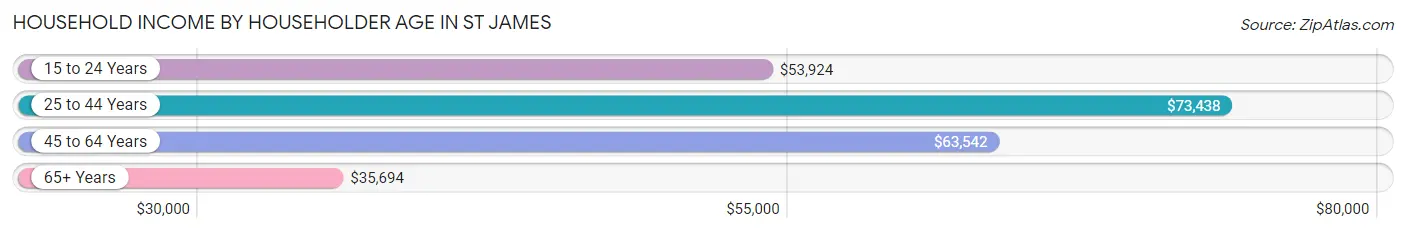
Household Income by Householder Age in St James
The median household income in St James is $50,938, with the highest median household income of $73,438 found in the 25 to 44 years age bracket for the primary householder. A total of 456 households (24.6%) fall into this category. Meanwhile, the 65+ years age bracket for the primary householder has the lowest median household income of $35,694, with 551 households (29.7%) in this group.
| Income Bracket | # Households | Median Income |
| 15 to 24 Years | 47 (2.5%) | $53,924 |
| 25 to 44 Years | 456 (24.6%) | $73,438 |
| 45 to 64 Years | 798 (43.1%) | $63,542 |
| 65+ Years | 551 (29.7%) | $35,694 |
| Total | 1,852 (100.0%) | $50,938 |
Poverty in St James
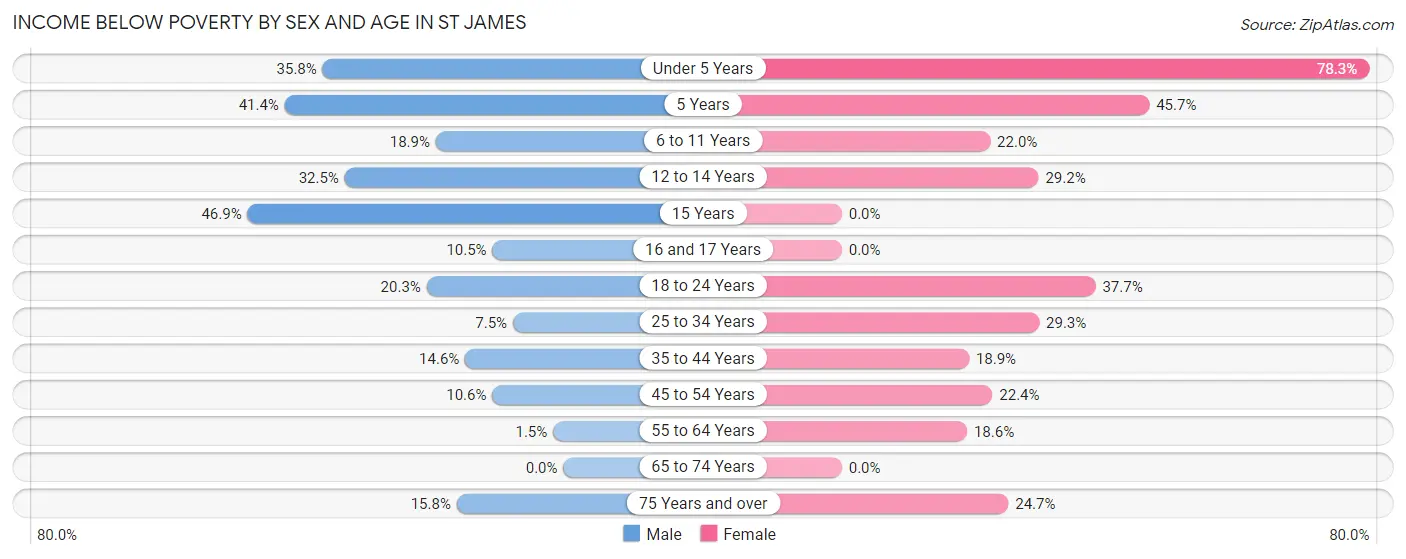
Income Below Poverty by Sex and Age in St James
With 16.5% poverty level for males and 25.5% for females among the residents of St James, 15 year old males and under 5 year old females are the most vulnerable to poverty, with 53 males (46.9%) and 101 females (78.3%) in their respective age groups living below the poverty level.
| Age Bracket | Male | Female |
| Under 5 Years | 69 (35.7%) | 101 (78.3%) |
| 5 Years | 24 (41.4%) | 21 (45.7%) |
| 6 to 11 Years | 57 (18.9%) | 52 (22.0%) |
| 12 to 14 Years | 25 (32.5%) | 26 (29.2%) |
| 15 Years | 53 (46.9%) | 0 (0.0%) |
| 16 and 17 Years | 8 (10.5%) | 0 (0.0%) |
| 18 to 24 Years | 55 (20.3%) | 55 (37.7%) |
| 25 to 34 Years | 17 (7.5%) | 92 (29.3%) |
| 35 to 44 Years | 42 (14.6%) | 37 (18.9%) |
| 45 to 54 Years | 21 (10.5%) | 55 (22.4%) |
| 55 to 64 Years | 5 (1.5%) | 71 (18.6%) |
| 65 to 74 Years | 0 (0.0%) | 0 (0.0%) |
| 75 Years and over | 22 (15.8%) | 68 (24.7%) |
| Total | 398 (16.5%) | 578 (25.5%) |
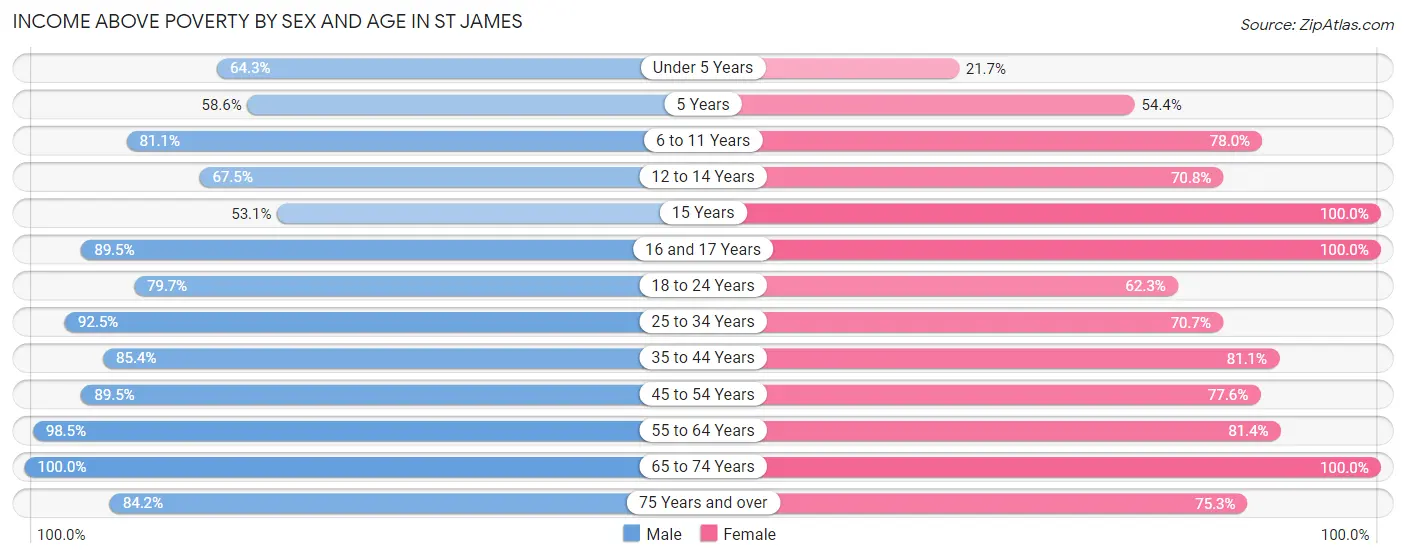
Income Above Poverty by Sex and Age in St James
According to the poverty statistics in St James, males aged 65 to 74 years and females aged 15 years are the age groups that are most secure financially, with 100.0% of males and 100.0% of females in these age groups living above the poverty line.
| Age Bracket | Male | Female |
| Under 5 Years | 124 (64.2%) | 28 (21.7%) |
| 5 Years | 34 (58.6%) | 25 (54.3%) |
| 6 to 11 Years | 244 (81.1%) | 184 (78.0%) |
| 12 to 14 Years | 52 (67.5%) | 63 (70.8%) |
| 15 Years | 60 (53.1%) | 4 (100.0%) |
| 16 and 17 Years | 68 (89.5%) | 9 (100.0%) |
| 18 to 24 Years | 216 (79.7%) | 91 (62.3%) |
| 25 to 34 Years | 210 (92.5%) | 222 (70.7%) |
| 35 to 44 Years | 246 (85.4%) | 159 (81.1%) |
| 45 to 54 Years | 178 (89.4%) | 191 (77.6%) |
| 55 to 64 Years | 324 (98.5%) | 311 (81.4%) |
| 65 to 74 Years | 145 (100.0%) | 195 (100.0%) |
| 75 Years and over | 117 (84.2%) | 207 (75.3%) |
| Total | 2,018 (83.5%) | 1,689 (74.5%) |
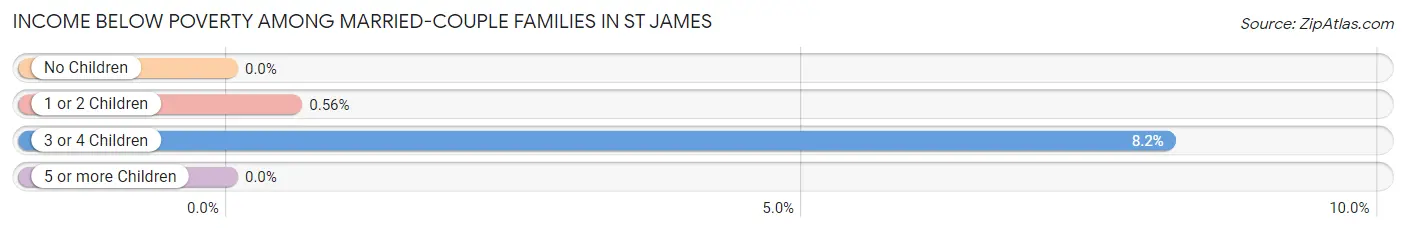
Income Below Poverty Among Married-Couple Families in St James
The poverty statistics for married-couple families in St James show that 2.0% or 17 of the total 855 families live below the poverty line. Families with 3 or 4 children have the highest poverty rate of 8.2%, comprising of 16 families. On the other hand, families with no children have the lowest poverty rate of 0.0%, which includes 0 families.
| Children | Above Poverty | Below Poverty |
| No Children | 481 (100.0%) | 0 (0.0%) |
| 1 or 2 Children | 177 (99.4%) | 1 (0.6%) |
| 3 or 4 Children | 180 (91.8%) | 16 (8.2%) |
| 5 or more Children | 0 (0.0%) | 0 (0.0%) |
| Total | 838 (98.0%) | 17 (2.0%) |
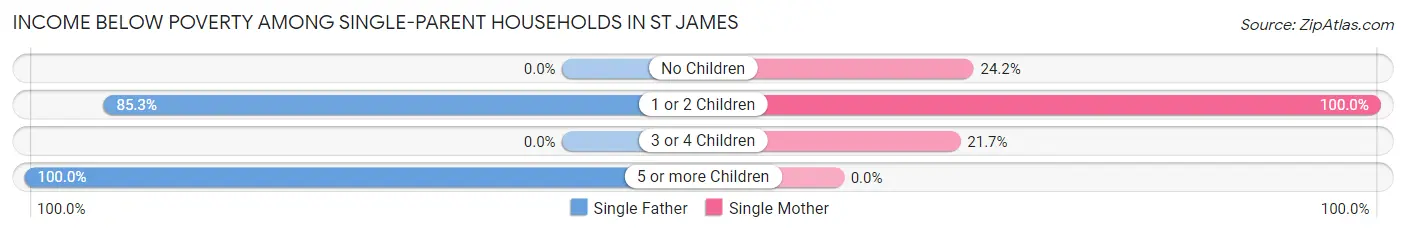
Income Below Poverty Among Single-Parent Households in St James
According to the poverty data in St James, 74.6% or 41 single-father households and 48.4% or 105 single-mother households are living below the poverty line. Among single-father households, those with 5 or more children have the highest poverty rate, with 12 households (100.0%) experiencing poverty. Likewise, among single-mother households, those with 1 or 2 children have the highest poverty rate, with 70 households (100.0%) falling below the poverty line.
| Children | Single Father | Single Mother |
| No Children | 0 (0.0%) | 30 (24.2%) |
| 1 or 2 Children | 29 (85.3%) | 70 (100.0%) |
| 3 or 4 Children | 0 (0.0%) | 5 (21.7%) |
| 5 or more Children | 12 (100.0%) | 0 (0.0%) |
| Total | 41 (74.6%) | 105 (48.4%) |
Income Below Poverty Among Married-Couple vs Single-Parent Households in St James
The poverty data for St James shows that 17 of the married-couple family households (2.0%) and 146 of the single-parent households (53.7%) are living below the poverty level. Within the married-couple family households, those with 3 or 4 children have the highest poverty rate, with 16 households (8.2%) falling below the poverty line. Among the single-parent households, those with 5 or more children have the highest poverty rate, with 12 household (100.0%) living below poverty.
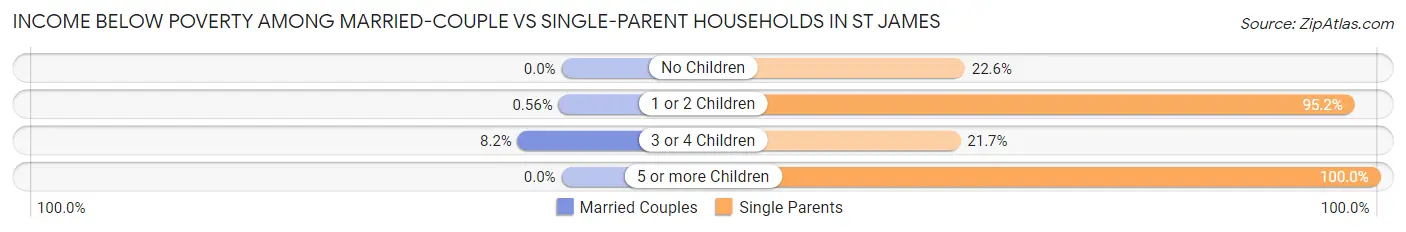
| Children | Married-Couple Families | Single-Parent Households |
| No Children | 0 (0.0%) | 30 (22.6%) |
| 1 or 2 Children | 1 (0.6%) | 99 (95.2%) |
| 3 or 4 Children | 16 (8.2%) | 5 (21.7%) |
| 5 or more Children | 0 (0.0%) | 12 (100.0%) |
| Total | 17 (2.0%) | 146 (53.7%) |
Employment Characteristics in St James
Employment by Class of Employer in St James
Among the 1,798 employed individuals in St James, private company employees (1,020 | 56.7%), local government employees (351 | 19.5%), and not-for-profit organizations (164 | 9.1%) make up the most common classes of employment.
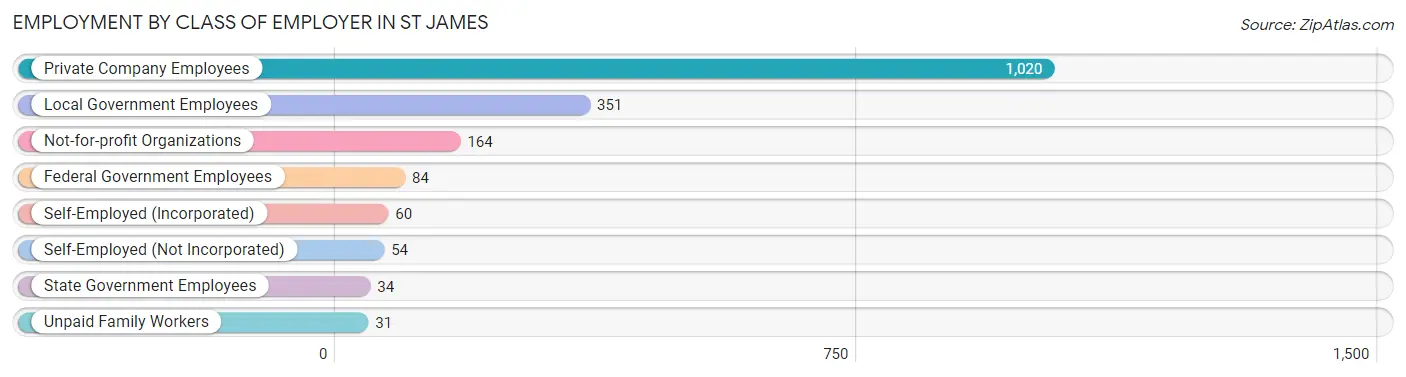
| Employer Class | # Employees | % Employees |
| Private Company Employees | 1,020 | 56.7% |
| Self-Employed (Incorporated) | 60 | 3.3% |
| Self-Employed (Not Incorporated) | 54 | 3.0% |
| Not-for-profit Organizations | 164 | 9.1% |
| Local Government Employees | 351 | 19.5% |
| State Government Employees | 34 | 1.9% |
| Federal Government Employees | 84 | 4.7% |
| Unpaid Family Workers | 31 | 1.7% |
| Total | 1,798 | 100.0% |
Employment Status by Age in St James
According to the labor force statistics for St James, out of the total population over 16 years of age (3,511), 58.8% or 2,064 individuals are in the labor force, with 10.7% or 221 of them unemployed. The age group with the highest labor force participation rate is 30 to 34 years, with 94.9% or 240 individuals in the labor force. Within the labor force, the 20 to 24 years age range has the highest percentage of unemployed individuals, with 55.9% or 57 of them being unemployed.
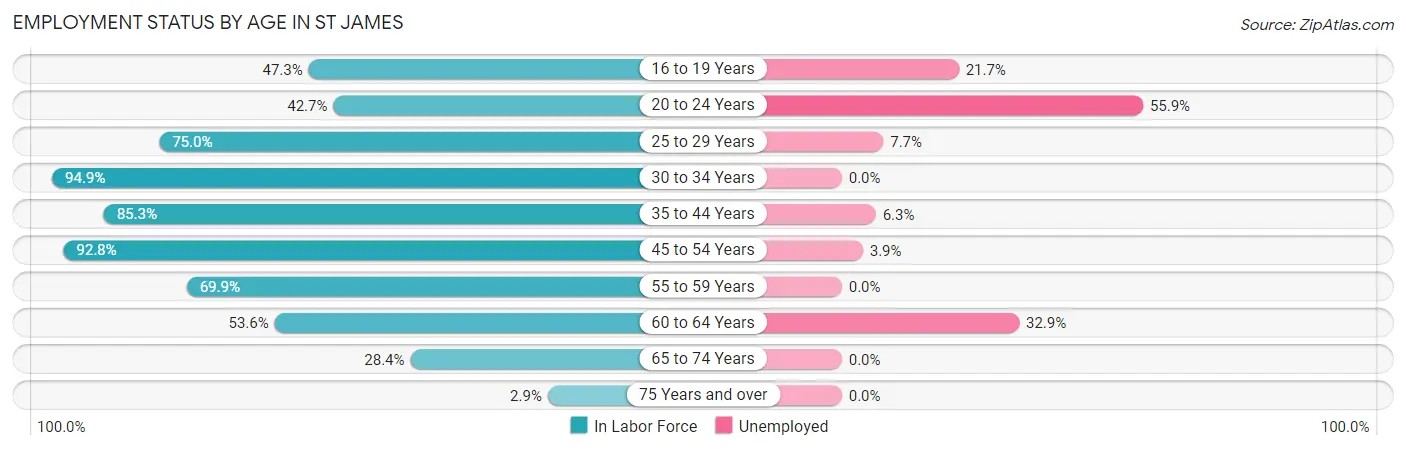
| Age Bracket | In Labor Force | Unemployed |
| 16 to 19 Years | 129 (47.3%) | 28 (21.7%) |
| 20 to 24 Years | 102 (42.7%) | 57 (55.9%) |
| 25 to 29 Years | 222 (75.0%) | 17 (7.7%) |
| 30 to 34 Years | 240 (94.9%) | 0 (0.0%) |
| 35 to 44 Years | 413 (85.3%) | 26 (6.3%) |
| 45 to 54 Years | 413 (92.8%) | 16 (3.9%) |
| 55 to 59 Years | 202 (69.9%) | 0 (0.0%) |
| 60 to 64 Years | 231 (53.6%) | 76 (32.9%) |
| 65 to 74 Years | 99 (28.4%) | 0 (0.0%) |
| 75 Years and over | 13 (2.9%) | 0 (0.0%) |
| Total | 2,064 (58.8%) | 221 (10.7%) |
Employment Status by Educational Attainment in St James
According to labor force statistics for St James, 78.3% of individuals (1,721) out of the total population between 25 and 64 years of age (2,198) are in the labor force, with 7.8% or 134 of them being unemployed. The group with the highest labor force participation rate are those with the educational attainment of bachelor's degree or higher, with 92.3% or 312 individuals in the labor force. Within the labor force, individuals with college / associate degree education have the highest percentage of unemployment, with 12.1% or 76 of them being unemployed.
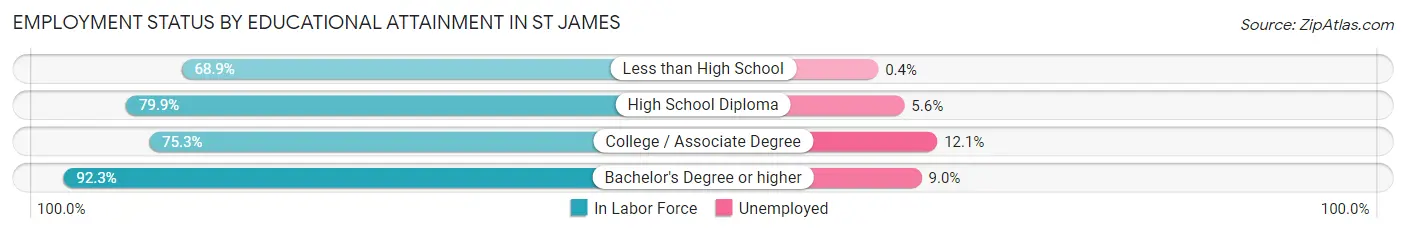
| Educational Attainment | In Labor Force | Unemployed |
| Less than High School | 244 (68.9%) | 1 (0.4%) |
| High School Diploma | 537 (79.9%) | 38 (5.6%) |
| College / Associate Degree | 628 (75.3%) | 101 (12.1%) |
| Bachelor's Degree or higher | 312 (92.3%) | 30 (9.0%) |
| Total | 1,721 (78.3%) | 171 (7.8%) |
Employment Occupations by Sex in St James
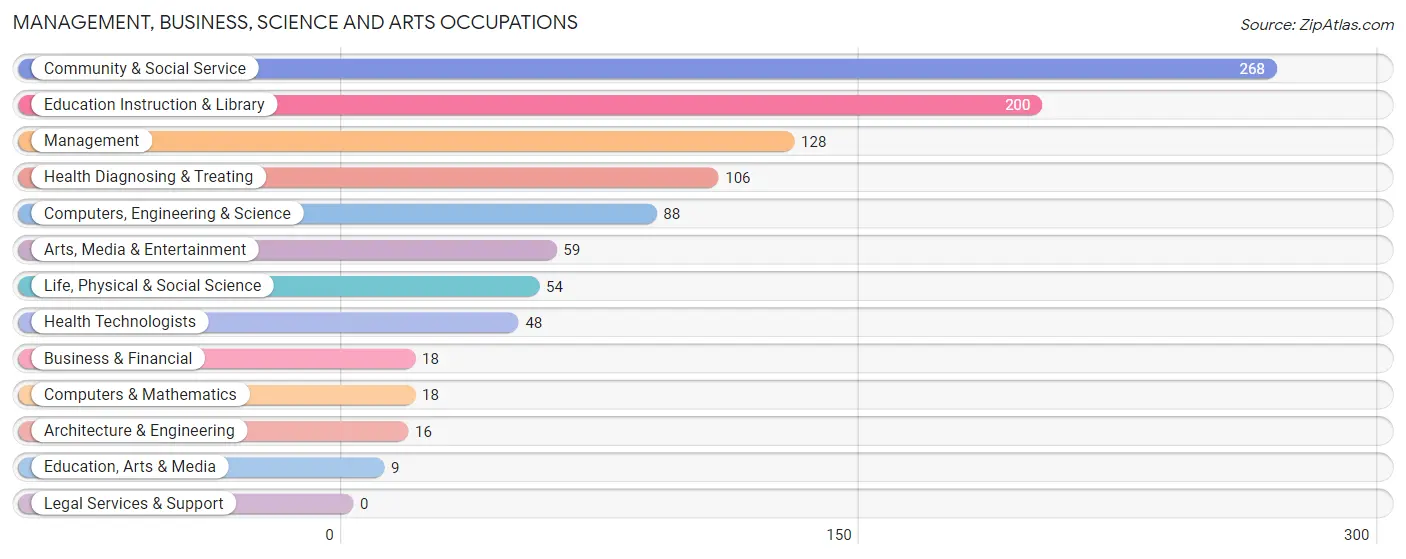
Management, Business, Science and Arts Occupations
The most common Management, Business, Science and Arts occupations in St James are Community & Social Service (268 | 14.5%), Education Instruction & Library (200 | 10.8%), Management (128 | 6.9%), Health Diagnosing & Treating (106 | 5.8%), and Computers, Engineering & Science (88 | 4.8%).
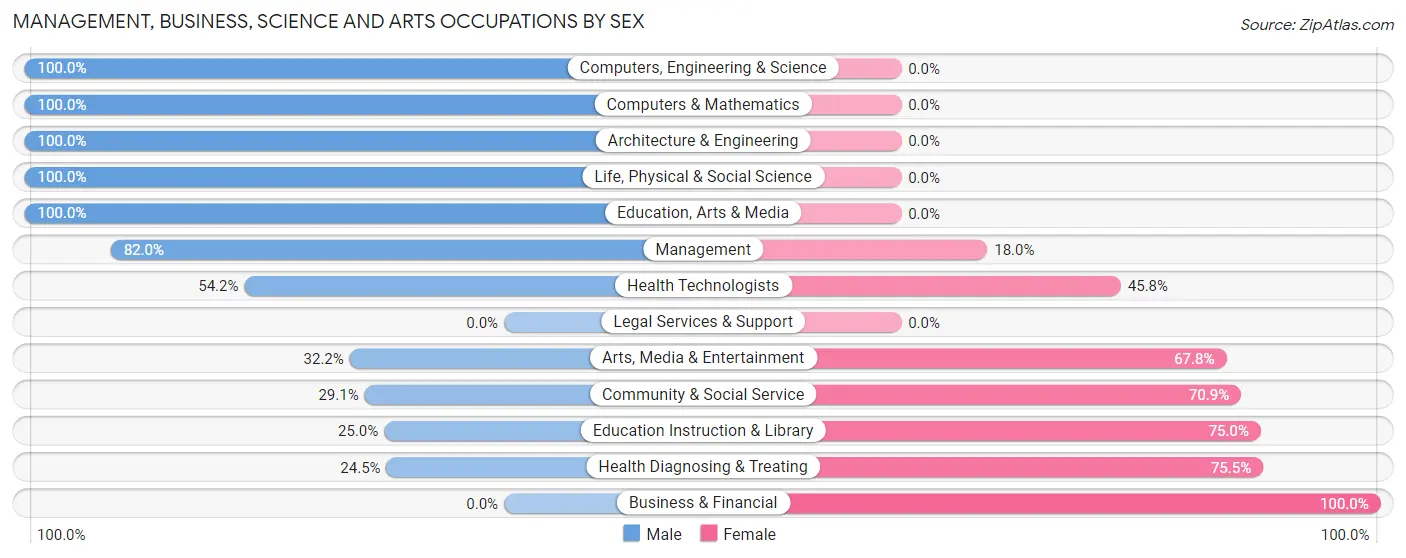
Management, Business, Science and Arts Occupations by Sex
Within the Management, Business, Science and Arts occupations in St James, the most male-oriented occupations are Computers, Engineering & Science (100.0%), Computers & Mathematics (100.0%), and Architecture & Engineering (100.0%), while the most female-oriented occupations are Business & Financial (100.0%), Health Diagnosing & Treating (75.5%), and Education Instruction & Library (75.0%).
| Occupation | Male | Female |
| Management | 105 (82.0%) | 23 (18.0%) |
| Business & Financial | 0 (0.0%) | 18 (100.0%) |
| Computers, Engineering & Science | 88 (100.0%) | 0 (0.0%) |
| Computers & Mathematics | 18 (100.0%) | 0 (0.0%) |
| Architecture & Engineering | 16 (100.0%) | 0 (0.0%) |
| Life, Physical & Social Science | 54 (100.0%) | 0 (0.0%) |
| Community & Social Service | 78 (29.1%) | 190 (70.9%) |
| Education, Arts & Media | 9 (100.0%) | 0 (0.0%) |
| Legal Services & Support | 0 (0.0%) | 0 (0.0%) |
| Education Instruction & Library | 50 (25.0%) | 150 (75.0%) |
| Arts, Media & Entertainment | 19 (32.2%) | 40 (67.8%) |
| Health Diagnosing & Treating | 26 (24.5%) | 80 (75.5%) |
| Health Technologists | 26 (54.2%) | 22 (45.8%) |
| Total (Category) | 297 (48.8%) | 311 (51.1%) |
| Total (Overall) | 1,005 (54.5%) | 839 (45.5%) |
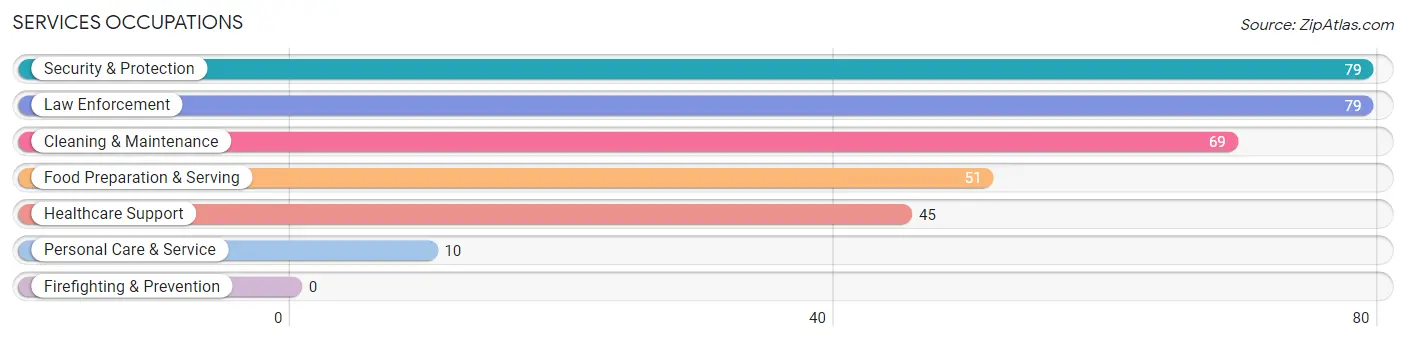
Services Occupations
The most common Services occupations in St James are Security & Protection (79 | 4.3%), Law Enforcement (79 | 4.3%), Cleaning & Maintenance (69 | 3.7%), Food Preparation & Serving (51 | 2.8%), and Healthcare Support (45 | 2.4%).
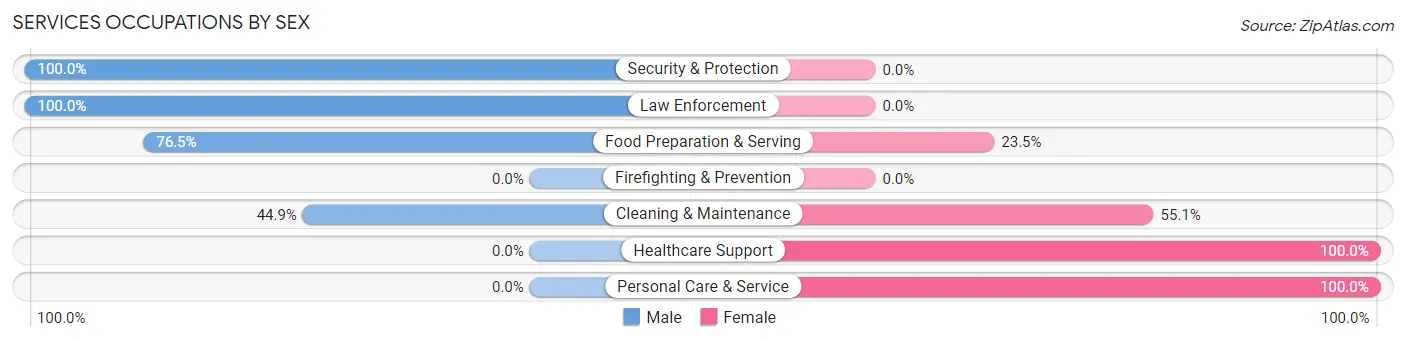
Services Occupations by Sex
Within the Services occupations in St James, the most male-oriented occupations are Security & Protection (100.0%), Law Enforcement (100.0%), and Food Preparation & Serving (76.5%), while the most female-oriented occupations are Healthcare Support (100.0%), Personal Care & Service (100.0%), and Cleaning & Maintenance (55.1%).
| Occupation | Male | Female |
| Healthcare Support | 0 (0.0%) | 45 (100.0%) |
| Security & Protection | 79 (100.0%) | 0 (0.0%) |
| Firefighting & Prevention | 0 (0.0%) | 0 (0.0%) |
| Law Enforcement | 79 (100.0%) | 0 (0.0%) |
| Food Preparation & Serving | 39 (76.5%) | 12 (23.5%) |
| Cleaning & Maintenance | 31 (44.9%) | 38 (55.1%) |
| Personal Care & Service | 0 (0.0%) | 10 (100.0%) |
| Total (Category) | 149 (58.7%) | 105 (41.3%) |
| Total (Overall) | 1,005 (54.5%) | 839 (45.5%) |
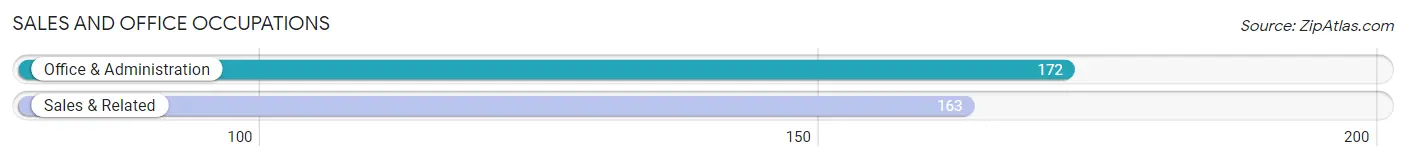
Sales and Office Occupations
The most common Sales and Office occupations in St James are Office & Administration (172 | 9.3%), and Sales & Related (163 | 8.8%).
Sales and Office Occupations by Sex
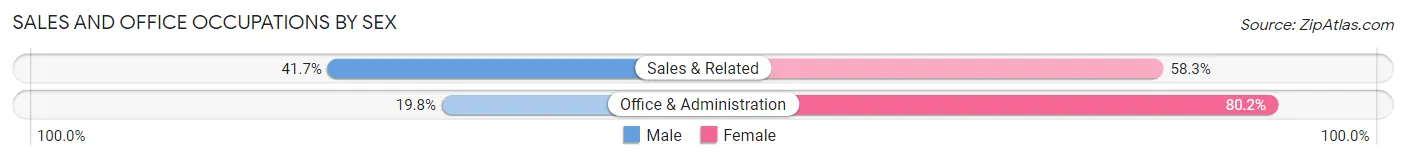
| Occupation | Male | Female |
| Sales & Related | 68 (41.7%) | 95 (58.3%) |
| Office & Administration | 34 (19.8%) | 138 (80.2%) |
| Total (Category) | 102 (30.4%) | 233 (69.6%) |
| Total (Overall) | 1,005 (54.5%) | 839 (45.5%) |
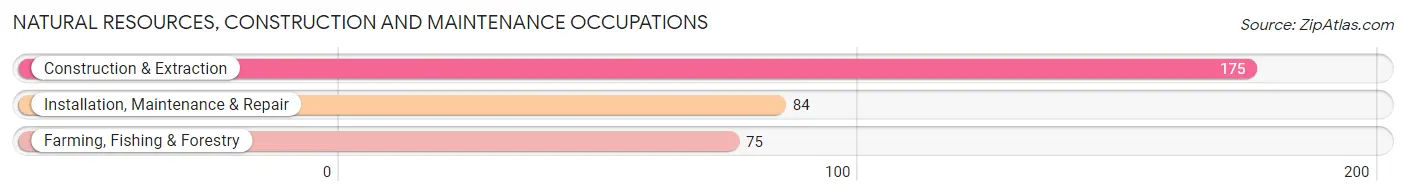
Natural Resources, Construction and Maintenance Occupations
The most common Natural Resources, Construction and Maintenance occupations in St James are Construction & Extraction (175 | 9.5%), Installation, Maintenance & Repair (84 | 4.6%), and Farming, Fishing & Forestry (75 | 4.1%).
Natural Resources, Construction and Maintenance Occupations by Sex
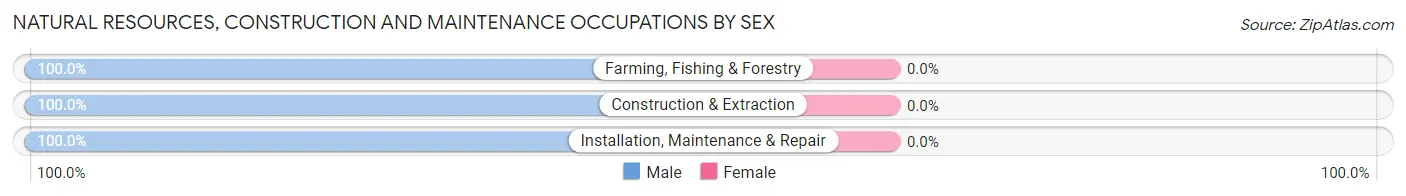
| Occupation | Male | Female |
| Farming, Fishing & Forestry | 75 (100.0%) | 0 (0.0%) |
| Construction & Extraction | 175 (100.0%) | 0 (0.0%) |
| Installation, Maintenance & Repair | 84 (100.0%) | 0 (0.0%) |
| Total (Category) | 334 (100.0%) | 0 (0.0%) |
| Total (Overall) | 1,005 (54.5%) | 839 (45.5%) |
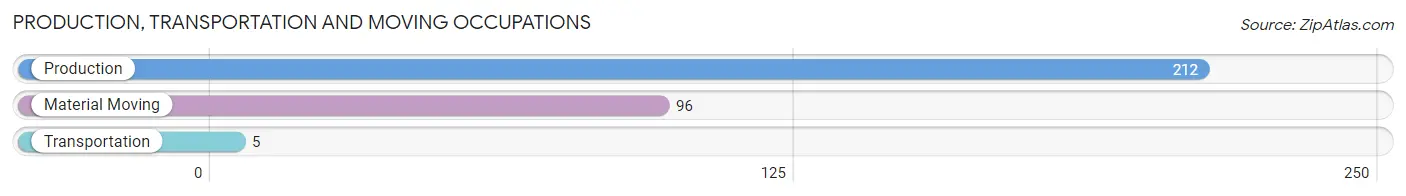
Production, Transportation and Moving Occupations
The most common Production, Transportation and Moving occupations in St James are Production (212 | 11.5%), Material Moving (96 | 5.2%), and Transportation (5 | 0.3%).
Production, Transportation and Moving Occupations by Sex
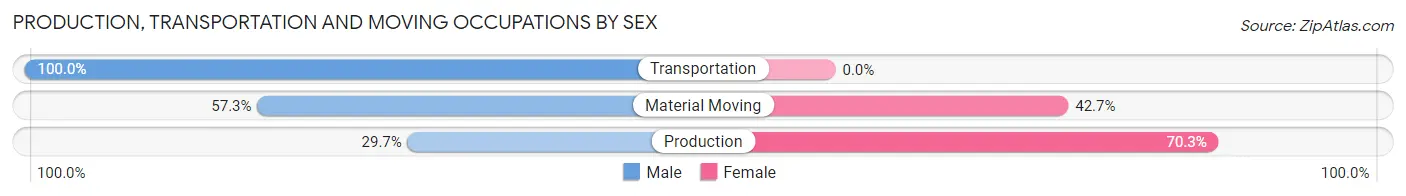
| Occupation | Male | Female |
| Production | 63 (29.7%) | 149 (70.3%) |
| Transportation | 5 (100.0%) | 0 (0.0%) |
| Material Moving | 55 (57.3%) | 41 (42.7%) |
| Total (Category) | 123 (39.3%) | 190 (60.7%) |
| Total (Overall) | 1,005 (54.5%) | 839 (45.5%) |
Employment Industries by Sex in St James
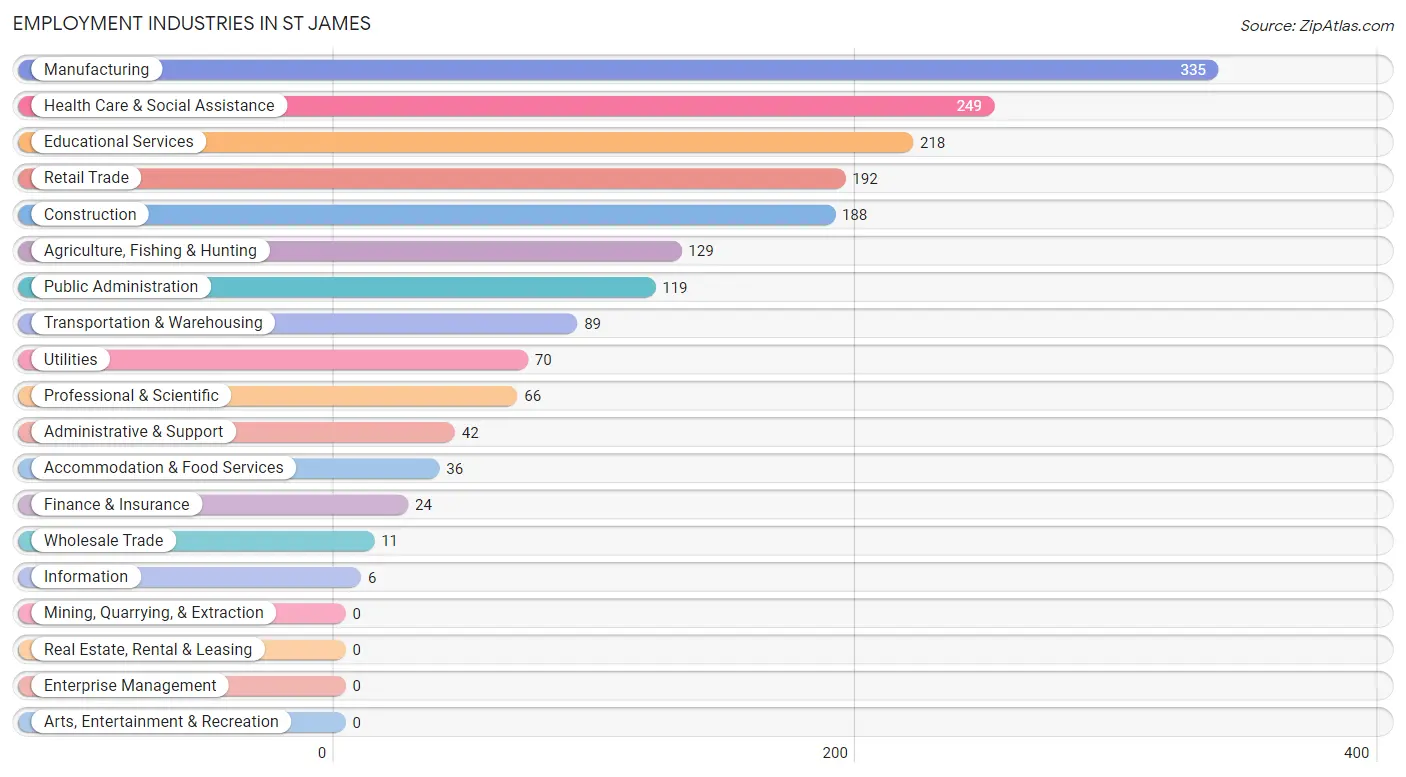
Employment Industries in St James
The major employment industries in St James include Manufacturing (335 | 18.2%), Health Care & Social Assistance (249 | 13.5%), Educational Services (218 | 11.8%), Retail Trade (192 | 10.4%), and Construction (188 | 10.2%).
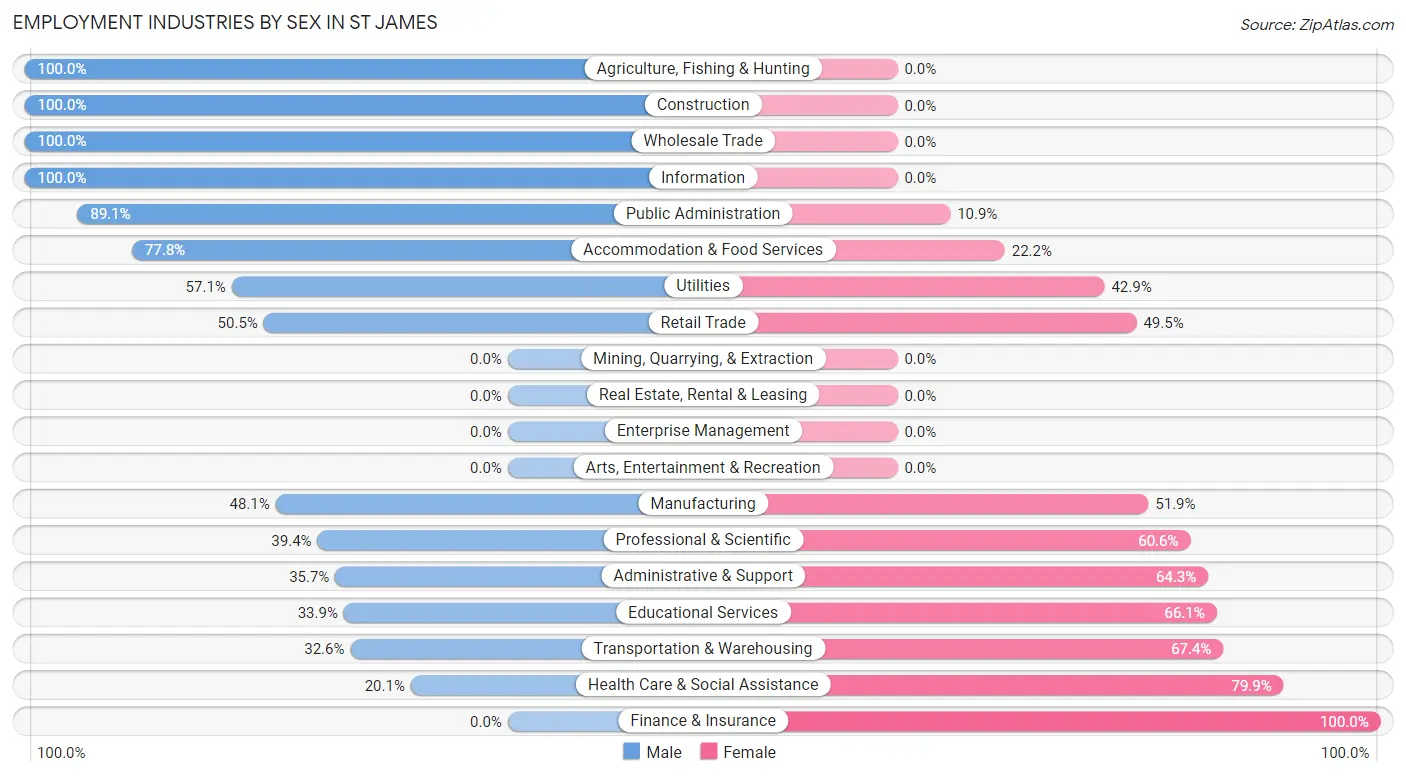
Employment Industries by Sex in St James
The St James industries that see more men than women are Agriculture, Fishing & Hunting (100.0%), Construction (100.0%), and Wholesale Trade (100.0%), whereas the industries that tend to have a higher number of women are Finance & Insurance (100.0%), Health Care & Social Assistance (79.9%), and Transportation & Warehousing (67.4%).
| Industry | Male | Female |
| Agriculture, Fishing & Hunting | 129 (100.0%) | 0 (0.0%) |
| Mining, Quarrying, & Extraction | 0 (0.0%) | 0 (0.0%) |
| Construction | 188 (100.0%) | 0 (0.0%) |
| Manufacturing | 161 (48.1%) | 174 (51.9%) |
| Wholesale Trade | 11 (100.0%) | 0 (0.0%) |
| Retail Trade | 97 (50.5%) | 95 (49.5%) |
| Transportation & Warehousing | 29 (32.6%) | 60 (67.4%) |
| Utilities | 40 (57.1%) | 30 (42.9%) |
| Information | 6 (100.0%) | 0 (0.0%) |
| Finance & Insurance | 0 (0.0%) | 24 (100.0%) |
| Real Estate, Rental & Leasing | 0 (0.0%) | 0 (0.0%) |
| Professional & Scientific | 26 (39.4%) | 40 (60.6%) |
| Enterprise Management | 0 (0.0%) | 0 (0.0%) |
| Administrative & Support | 15 (35.7%) | 27 (64.3%) |
| Educational Services | 74 (33.9%) | 144 (66.1%) |
| Health Care & Social Assistance | 50 (20.1%) | 199 (79.9%) |
| Arts, Entertainment & Recreation | 0 (0.0%) | 0 (0.0%) |
| Accommodation & Food Services | 28 (77.8%) | 8 (22.2%) |
| Public Administration | 106 (89.1%) | 13 (10.9%) |
| Total | 1,005 (54.5%) | 839 (45.5%) |
Education in St James
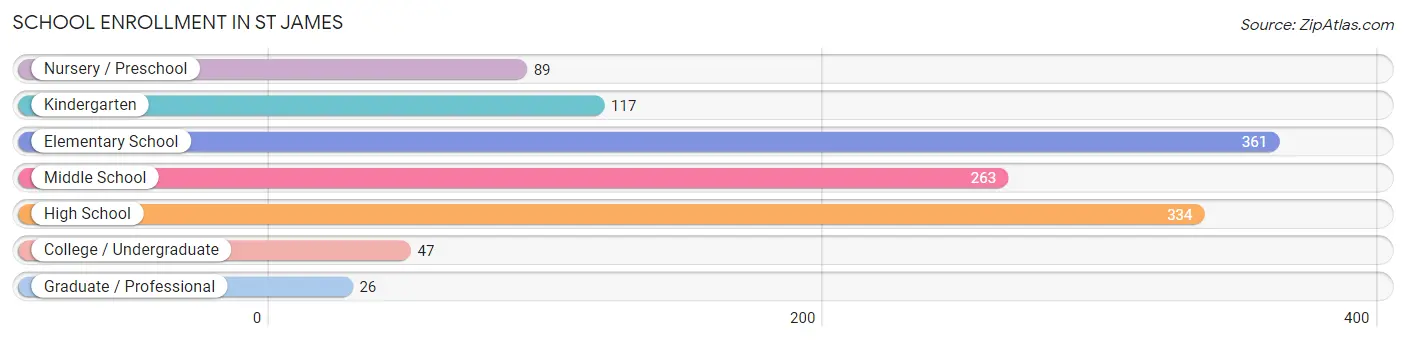
School Enrollment in St James
The most common levels of schooling among the 1,237 students in St James are elementary school (361 | 29.2%), high school (334 | 27.0%), and middle school (263 | 21.3%).
| School Level | # Students | % Students |
| Nursery / Preschool | 89 | 7.2% |
| Kindergarten | 117 | 9.5% |
| Elementary School | 361 | 29.2% |
| Middle School | 263 | 21.3% |
| High School | 334 | 27.0% |
| College / Undergraduate | 47 | 3.8% |
| Graduate / Professional | 26 | 2.1% |
| Total | 1,237 | 100.0% |
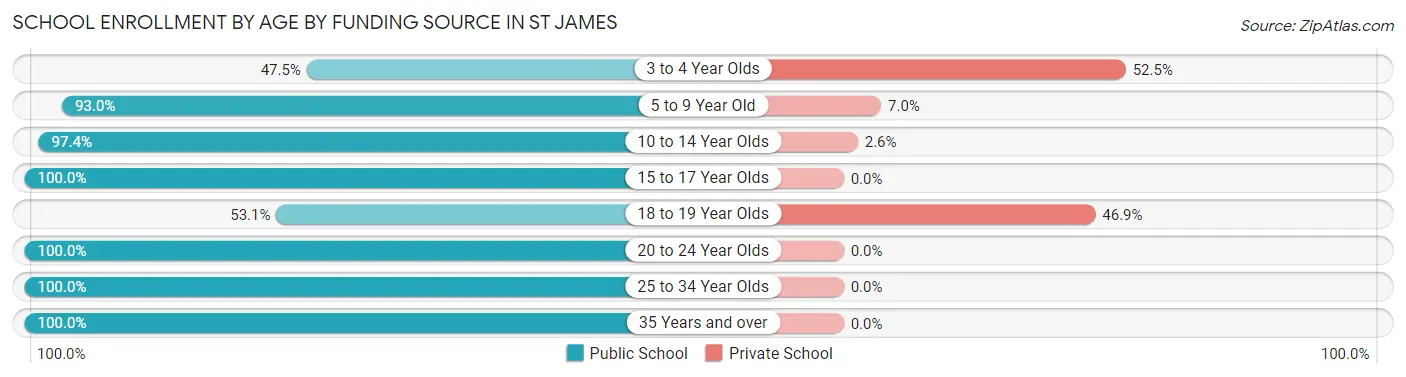
School Enrollment by Age by Funding Source in St James
Out of a total of 1,237 students who are enrolled in schools in St James, 84 (6.8%) attend a private institution, while the remaining 1,153 (93.2%) are enrolled in public schools. The age group of 3 to 4 year olds has the highest likelihood of being enrolled in private schools, with 31 (52.5% in the age bracket) enrolled. Conversely, the age group of 15 to 17 year olds has the lowest likelihood of being enrolled in a private school, with 202 (100.0% in the age bracket) attending a public institution.
| Age Bracket | Public School | Private School |
| 3 to 4 Year Olds | 28 (47.5%) | 31 (52.5%) |
| 5 to 9 Year Old | 374 (93.0%) | 28 (7.0%) |
| 10 to 14 Year Olds | 370 (97.4%) | 10 (2.6%) |
| 15 to 17 Year Olds | 202 (100.0%) | 0 (0.0%) |
| 18 to 19 Year Olds | 17 (53.1%) | 15 (46.9%) |
| 20 to 24 Year Olds | 110 (100.0%) | 0 (0.0%) |
| 25 to 34 Year Olds | 25 (100.0%) | 0 (0.0%) |
| 35 Years and over | 27 (100.0%) | 0 (0.0%) |
| Total | 1,153 (93.2%) | 84 (6.8%) |
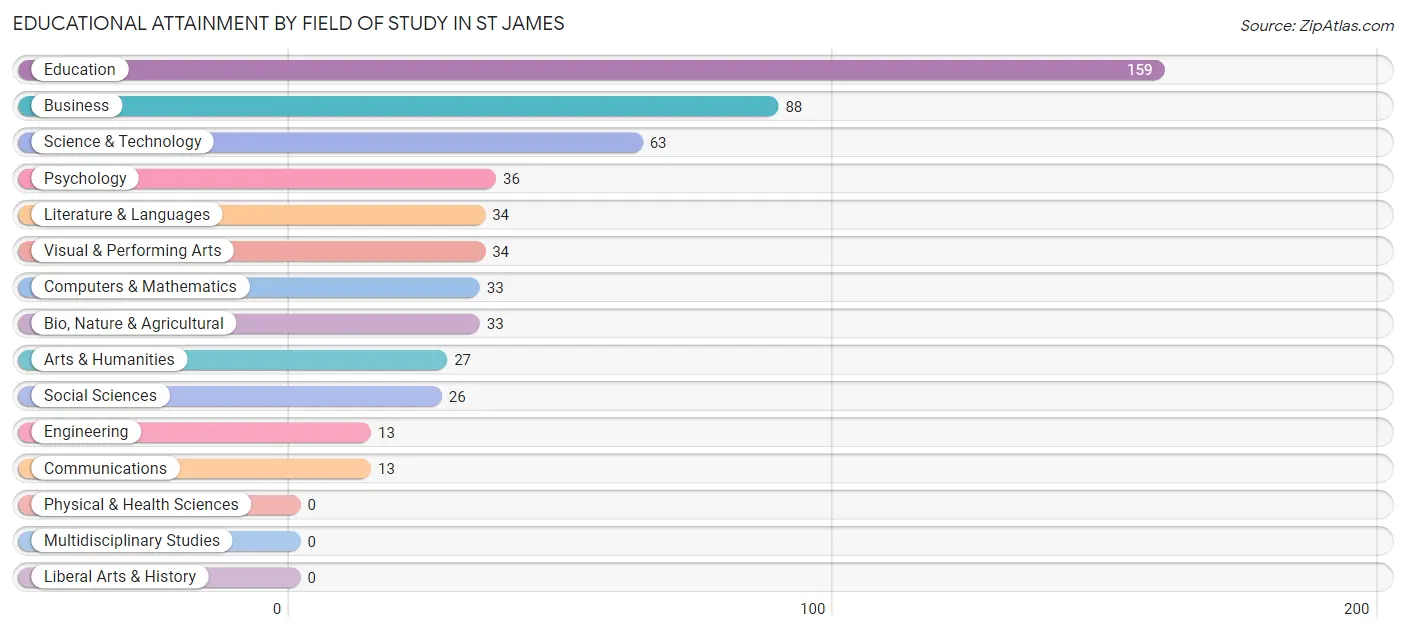
Educational Attainment by Field of Study in St James
Education (159 | 28.4%), business (88 | 15.7%), science & technology (63 | 11.3%), psychology (36 | 6.4%), and literature & languages (34 | 6.1%) are the most common fields of study among 559 individuals in St James who have obtained a bachelor's degree or higher.
| Field of Study | # Graduates | % Graduates |
| Computers & Mathematics | 33 | 5.9% |
| Bio, Nature & Agricultural | 33 | 5.9% |
| Physical & Health Sciences | 0 | 0.0% |
| Psychology | 36 | 6.4% |
| Social Sciences | 26 | 4.6% |
| Engineering | 13 | 2.3% |
| Multidisciplinary Studies | 0 | 0.0% |
| Science & Technology | 63 | 11.3% |
| Business | 88 | 15.7% |
| Education | 159 | 28.4% |
| Literature & Languages | 34 | 6.1% |
| Liberal Arts & History | 0 | 0.0% |
| Visual & Performing Arts | 34 | 6.1% |
| Communications | 13 | 2.3% |
| Arts & Humanities | 27 | 4.8% |
| Total | 559 | 100.0% |
Transportation & Commute in St James
Vehicle Availability by Sex in St James
The most prevalent vehicle ownership categories in St James are males with 2 vehicles (493, accounting for 49.9%) and females with 2 vehicles (408, making up 60.8%).

| Vehicles Available | Male | Female |
| No Vehicle | 28 (2.8%) | 32 (4.0%) |
| 1 Vehicle | 127 (12.9%) | 54 (6.7%) |
| 2 Vehicles | 493 (49.9%) | 408 (50.3%) |
| 3 Vehicles | 317 (32.1%) | 280 (34.5%) |
| 4 Vehicles | 17 (1.7%) | 37 (4.6%) |
| 5 or more Vehicles | 5 (0.5%) | 0 (0.0%) |
| Total | 987 (100.0%) | 811 (100.0%) |
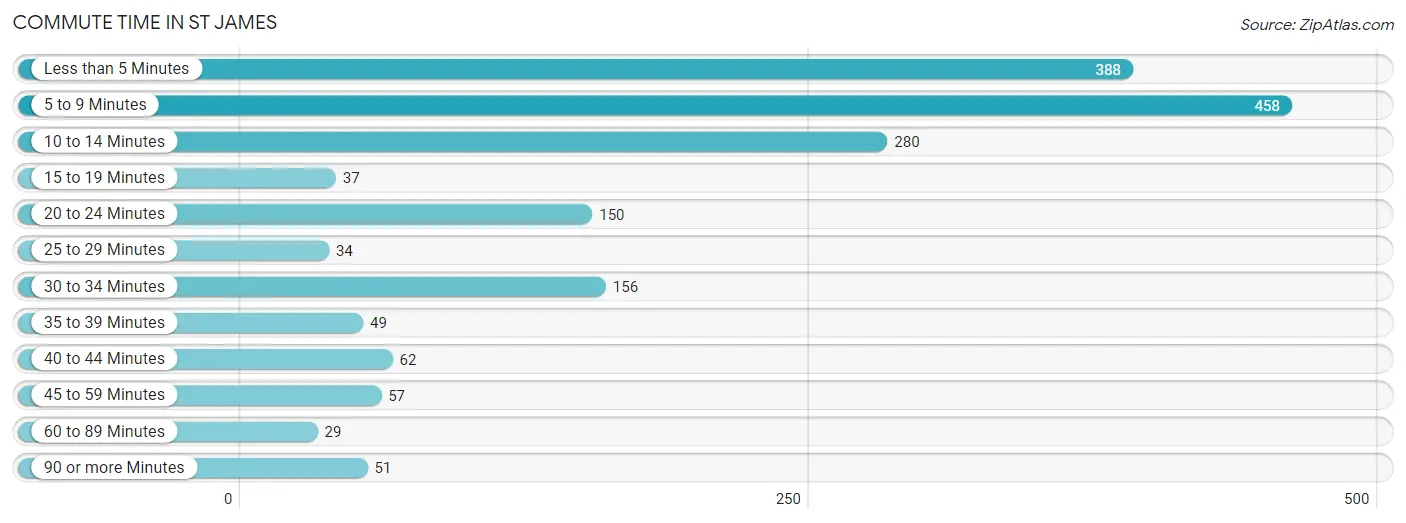
Commute Time in St James
The most frequently occuring commute durations in St James are 5 to 9 minutes (458 commuters, 26.2%), less than 5 minutes (388 commuters, 22.2%), and 10 to 14 minutes (280 commuters, 16.0%).
| Commute Time | # Commuters | % Commuters |
| Less than 5 Minutes | 388 | 22.2% |
| 5 to 9 Minutes | 458 | 26.2% |
| 10 to 14 Minutes | 280 | 16.0% |
| 15 to 19 Minutes | 37 | 2.1% |
| 20 to 24 Minutes | 150 | 8.6% |
| 25 to 29 Minutes | 34 | 1.9% |
| 30 to 34 Minutes | 156 | 8.9% |
| 35 to 39 Minutes | 49 | 2.8% |
| 40 to 44 Minutes | 62 | 3.5% |
| 45 to 59 Minutes | 57 | 3.3% |
| 60 to 89 Minutes | 29 | 1.7% |
| 90 or more Minutes | 51 | 2.9% |
Commute Time by Sex in St James
The most common commute times in St James are less than 5 minutes (222 commuters, 22.5%) for males and 5 to 9 minutes (237 commuters, 31.0%) for females.
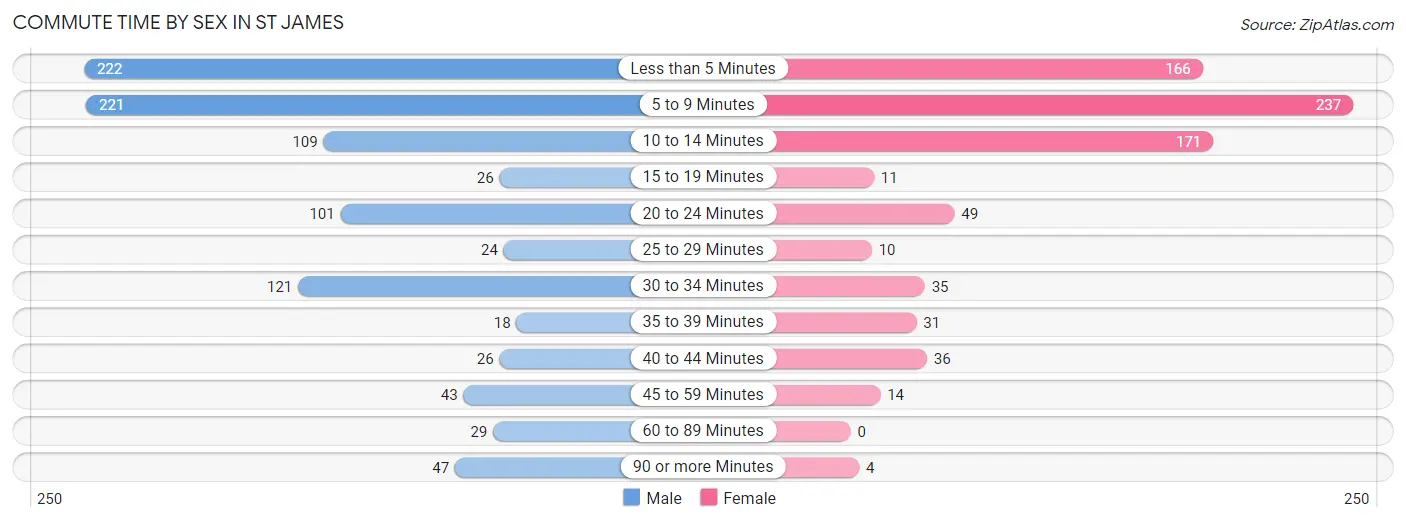
| Commute Time | Male | Female |
| Less than 5 Minutes | 222 (22.5%) | 166 (21.7%) |
| 5 to 9 Minutes | 221 (22.4%) | 237 (31.0%) |
| 10 to 14 Minutes | 109 (11.0%) | 171 (22.4%) |
| 15 to 19 Minutes | 26 (2.6%) | 11 (1.4%) |
| 20 to 24 Minutes | 101 (10.2%) | 49 (6.4%) |
| 25 to 29 Minutes | 24 (2.4%) | 10 (1.3%) |
| 30 to 34 Minutes | 121 (12.3%) | 35 (4.6%) |
| 35 to 39 Minutes | 18 (1.8%) | 31 (4.1%) |
| 40 to 44 Minutes | 26 (2.6%) | 36 (4.7%) |
| 45 to 59 Minutes | 43 (4.4%) | 14 (1.8%) |
| 60 to 89 Minutes | 29 (2.9%) | 0 (0.0%) |
| 90 or more Minutes | 47 (4.8%) | 4 (0.5%) |
Time of Departure to Work by Sex in St James
The most frequent times of departure to work in St James are 7:00 AM to 7:29 AM (188, 19.1%) for males and 7:00 AM to 7:29 AM (128, 16.8%) for females.
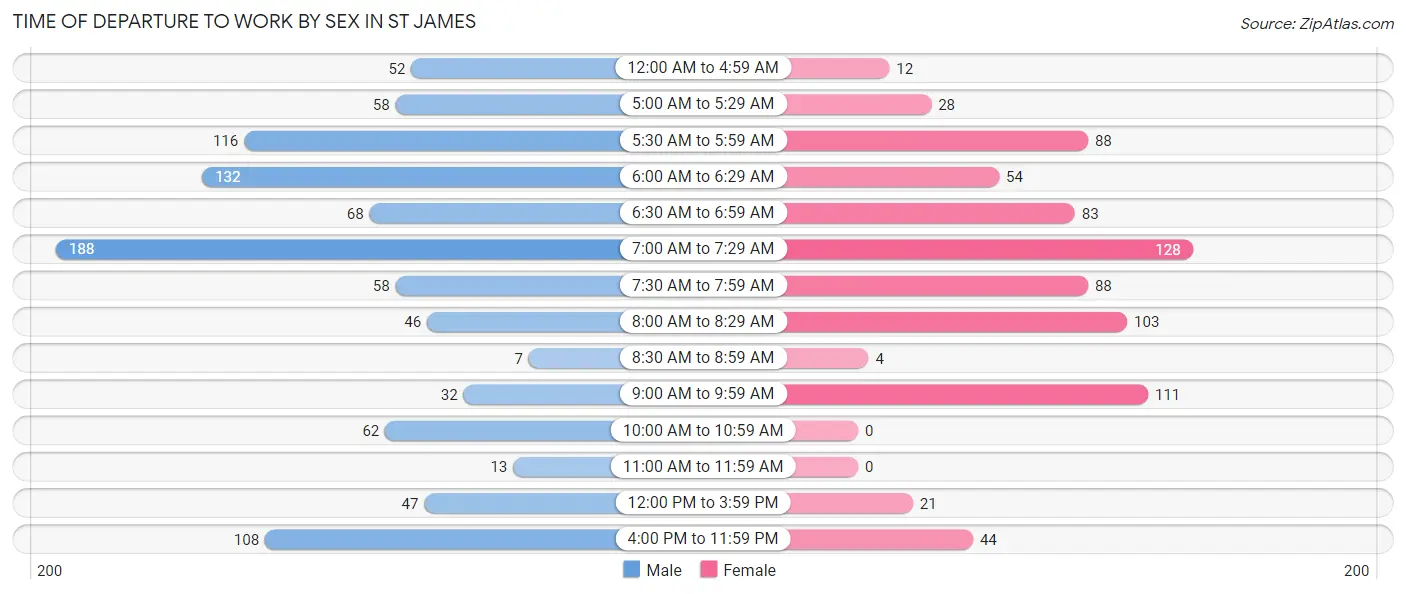
| Time of Departure | Male | Female |
| 12:00 AM to 4:59 AM | 52 (5.3%) | 12 (1.6%) |
| 5:00 AM to 5:29 AM | 58 (5.9%) | 28 (3.7%) |
| 5:30 AM to 5:59 AM | 116 (11.7%) | 88 (11.5%) |
| 6:00 AM to 6:29 AM | 132 (13.4%) | 54 (7.1%) |
| 6:30 AM to 6:59 AM | 68 (6.9%) | 83 (10.9%) |
| 7:00 AM to 7:29 AM | 188 (19.1%) | 128 (16.8%) |
| 7:30 AM to 7:59 AM | 58 (5.9%) | 88 (11.5%) |
| 8:00 AM to 8:29 AM | 46 (4.7%) | 103 (13.5%) |
| 8:30 AM to 8:59 AM | 7 (0.7%) | 4 (0.5%) |
| 9:00 AM to 9:59 AM | 32 (3.2%) | 111 (14.5%) |
| 10:00 AM to 10:59 AM | 62 (6.3%) | 0 (0.0%) |
| 11:00 AM to 11:59 AM | 13 (1.3%) | 0 (0.0%) |
| 12:00 PM to 3:59 PM | 47 (4.8%) | 21 (2.8%) |
| 4:00 PM to 11:59 PM | 108 (10.9%) | 44 (5.8%) |
| Total | 987 (100.0%) | 764 (100.0%) |
Housing Occupancy in St James
Occupancy by Ownership in St James
Of the total 1,852 dwellings in St James, owner-occupied units account for 1,375 (74.2%), while renter-occupied units make up 477 (25.8%).
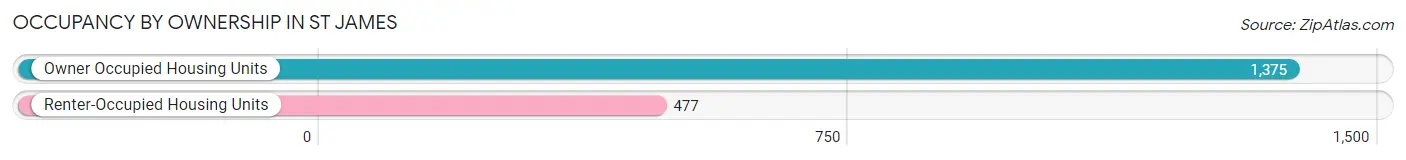
| Occupancy | # Housing Units | % Housing Units |
| Owner Occupied Housing Units | 1,375 | 74.2% |
| Renter-Occupied Housing Units | 477 | 25.8% |
| Total Occupied Housing Units | 1,852 | 100.0% |
Occupancy by Household Size in St James
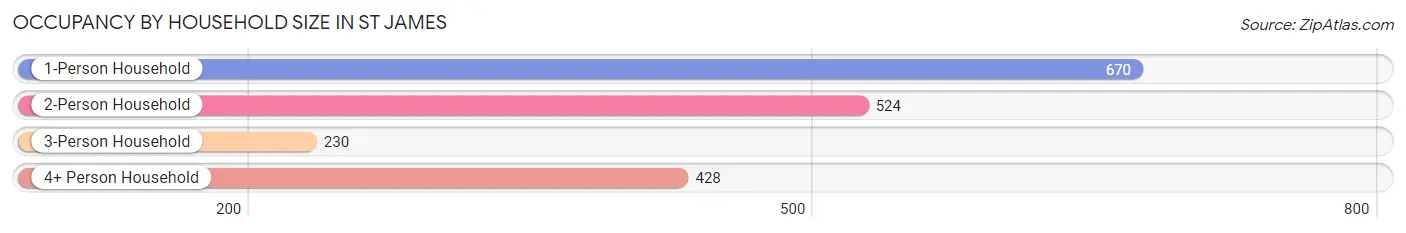
| Household Size | # Housing Units | % Housing Units |
| 1-Person Household | 670 | 36.2% |
| 2-Person Household | 524 | 28.3% |
| 3-Person Household | 230 | 12.4% |
| 4+ Person Household | 428 | 23.1% |
| Total Housing Units | 1,852 | 100.0% |
Occupancy by Ownership by Household Size in St James
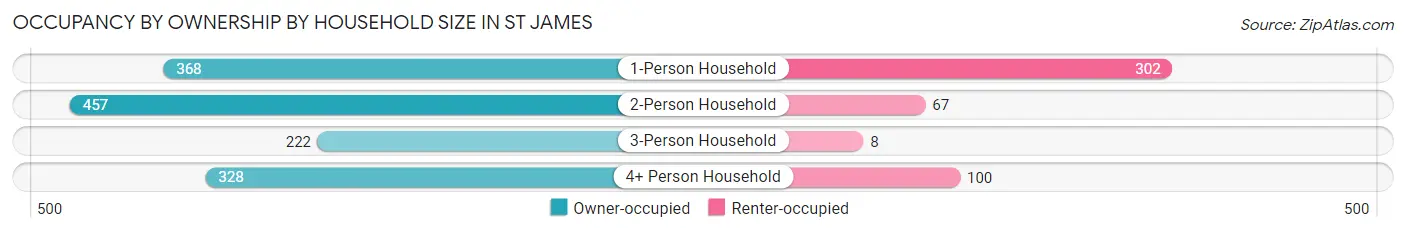
| Household Size | Owner-occupied | Renter-occupied |
| 1-Person Household | 368 (54.9%) | 302 (45.1%) |
| 2-Person Household | 457 (87.2%) | 67 (12.8%) |
| 3-Person Household | 222 (96.5%) | 8 (3.5%) |
| 4+ Person Household | 328 (76.6%) | 100 (23.4%) |
| Total Housing Units | 1,375 (74.2%) | 477 (25.8%) |
Occupancy by Educational Attainment in St James
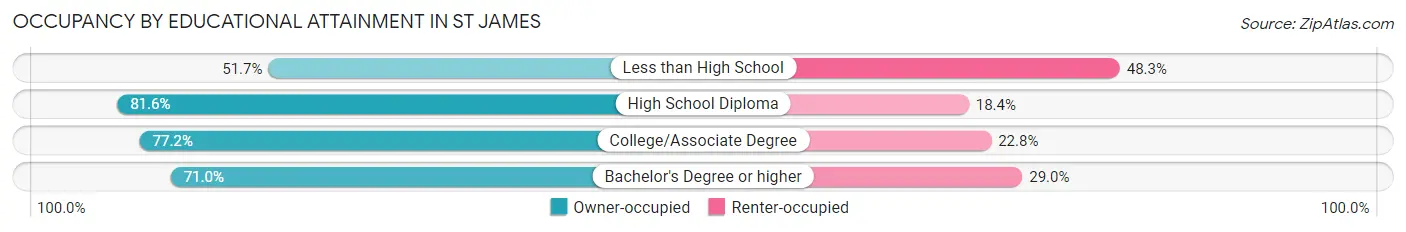
| Household Size | Owner-occupied | Renter-occupied |
| Less than High School | 122 (51.7%) | 114 (48.3%) |
| High School Diploma | 431 (81.6%) | 97 (18.4%) |
| College/Associate Degree | 616 (77.2%) | 182 (22.8%) |
| Bachelor's Degree or higher | 206 (71.0%) | 84 (29.0%) |
Occupancy by Age of Householder in St James
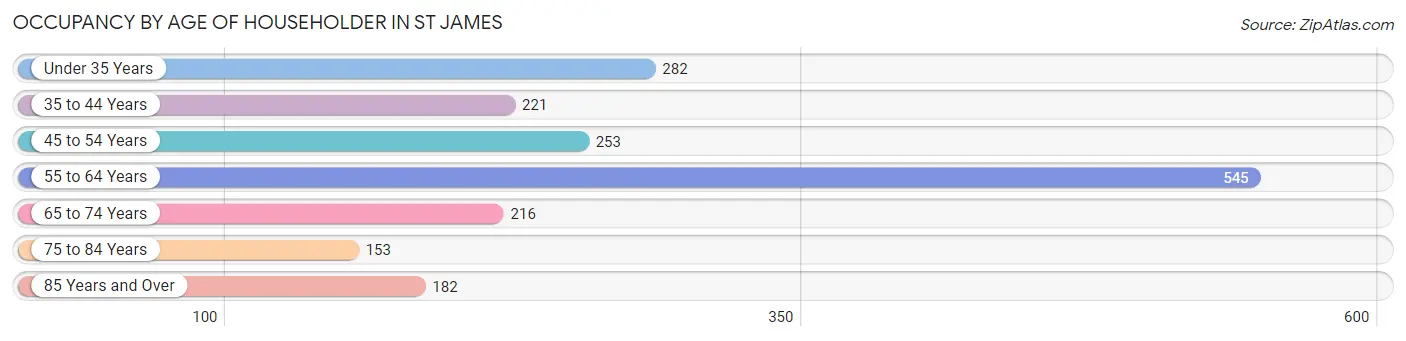
| Age Bracket | # Households | % Households |
| Under 35 Years | 282 | 15.2% |
| 35 to 44 Years | 221 | 11.9% |
| 45 to 54 Years | 253 | 13.7% |
| 55 to 64 Years | 545 | 29.4% |
| 65 to 74 Years | 216 | 11.7% |
| 75 to 84 Years | 153 | 8.3% |
| 85 Years and Over | 182 | 9.8% |
| Total | 1,852 | 100.0% |
Housing Finances in St James
Median Income by Occupancy in St James
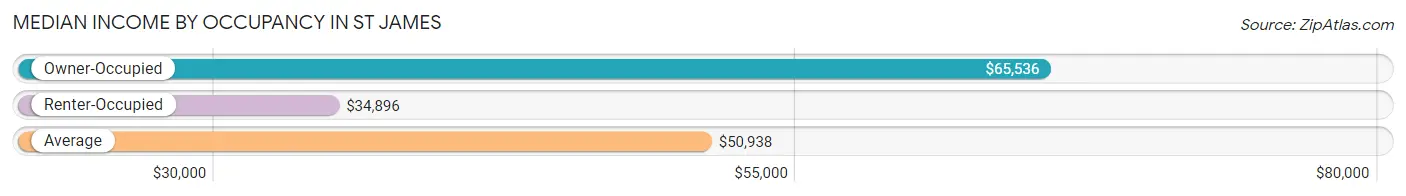
| Occupancy Type | # Households | Median Income |
| Owner-Occupied | 1,375 (74.2%) | $65,536 |
| Renter-Occupied | 477 (25.8%) | $34,896 |
| Average | 1,852 (100.0%) | $50,938 |
Occupancy by Householder Income Bracket in St James
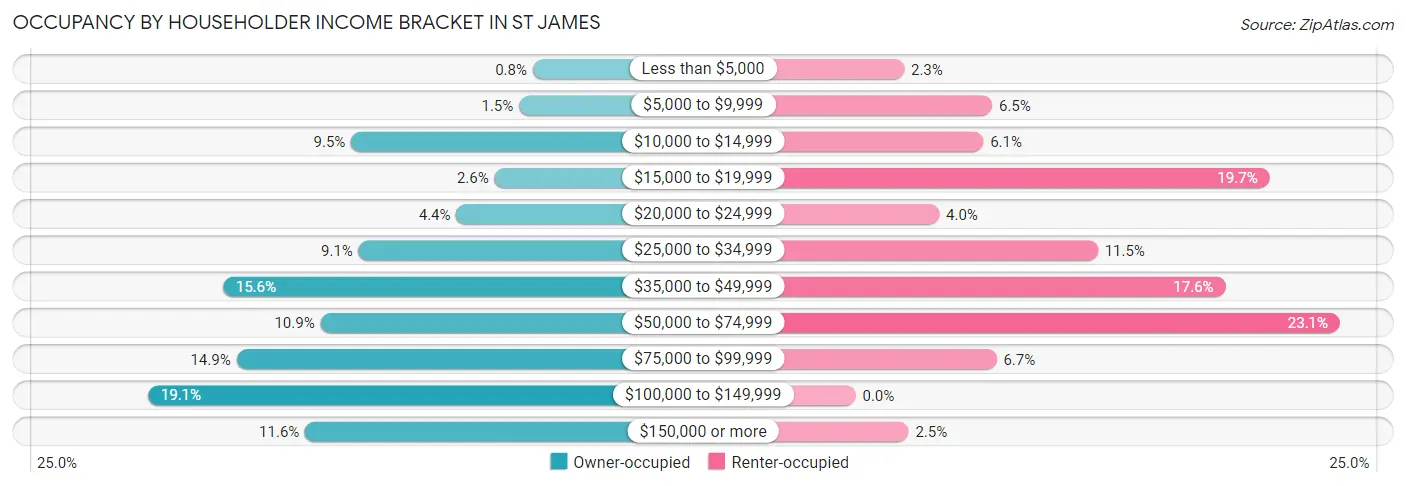
| Income Bracket | Owner-occupied | Renter-occupied |
| Less than $5,000 | 11 (0.8%) | 11 (2.3%) |
| $5,000 to $9,999 | 20 (1.5%) | 31 (6.5%) |
| $10,000 to $14,999 | 130 (9.5%) | 29 (6.1%) |
| $15,000 to $19,999 | 36 (2.6%) | 94 (19.7%) |
| $20,000 to $24,999 | 61 (4.4%) | 19 (4.0%) |
| $25,000 to $34,999 | 125 (9.1%) | 55 (11.5%) |
| $35,000 to $49,999 | 214 (15.6%) | 84 (17.6%) |
| $50,000 to $74,999 | 150 (10.9%) | 110 (23.1%) |
| $75,000 to $99,999 | 205 (14.9%) | 32 (6.7%) |
| $100,000 to $149,999 | 263 (19.1%) | 0 (0.0%) |
| $150,000 or more | 160 (11.6%) | 12 (2.5%) |
| Total | 1,375 (100.0%) | 477 (100.0%) |
Monthly Housing Cost Tiers in St James
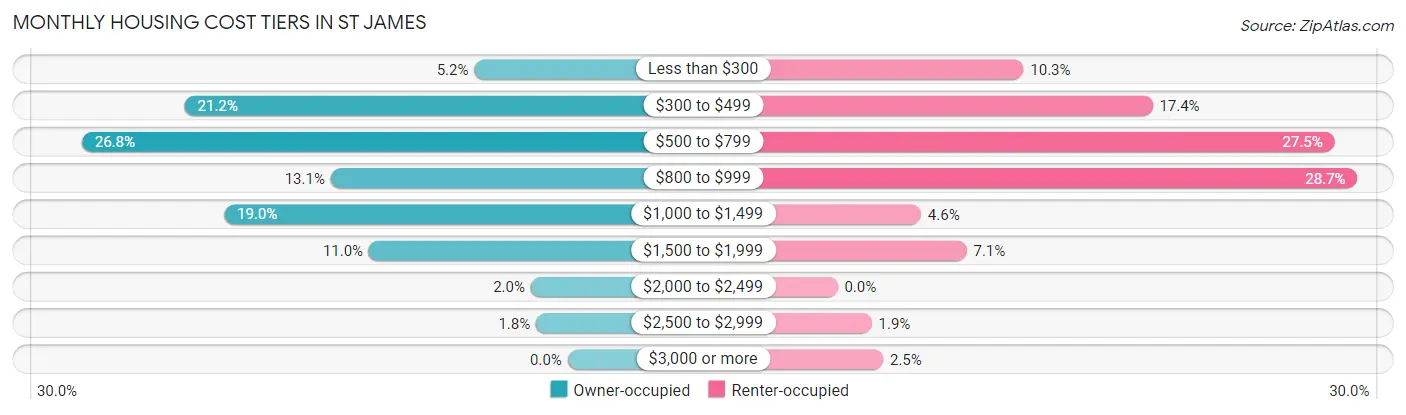
| Monthly Cost | Owner-occupied | Renter-occupied |
| Less than $300 | 71 (5.2%) | 49 (10.3%) |
| $300 to $499 | 291 (21.2%) | 83 (17.4%) |
| $500 to $799 | 369 (26.8%) | 131 (27.5%) |
| $800 to $999 | 180 (13.1%) | 137 (28.7%) |
| $1,000 to $1,499 | 261 (19.0%) | 22 (4.6%) |
| $1,500 to $1,999 | 151 (11.0%) | 34 (7.1%) |
| $2,000 to $2,499 | 28 (2.0%) | 0 (0.0%) |
| $2,500 to $2,999 | 24 (1.8%) | 9 (1.9%) |
| $3,000 or more | 0 (0.0%) | 12 (2.5%) |
| Total | 1,375 (100.0%) | 477 (100.0%) |
Physical Housing Characteristics in St James
Housing Structures in St James
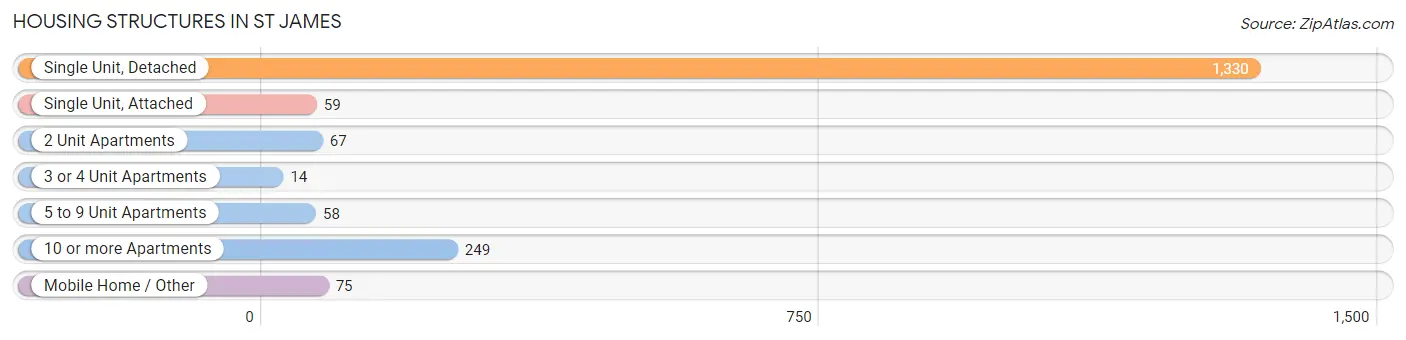
| Structure Type | # Housing Units | % Housing Units |
| Single Unit, Detached | 1,330 | 71.8% |
| Single Unit, Attached | 59 | 3.2% |
| 2 Unit Apartments | 67 | 3.6% |
| 3 or 4 Unit Apartments | 14 | 0.8% |
| 5 to 9 Unit Apartments | 58 | 3.1% |
| 10 or more Apartments | 249 | 13.4% |
| Mobile Home / Other | 75 | 4.1% |
| Total | 1,852 | 100.0% |
Housing Structures by Occupancy in St James
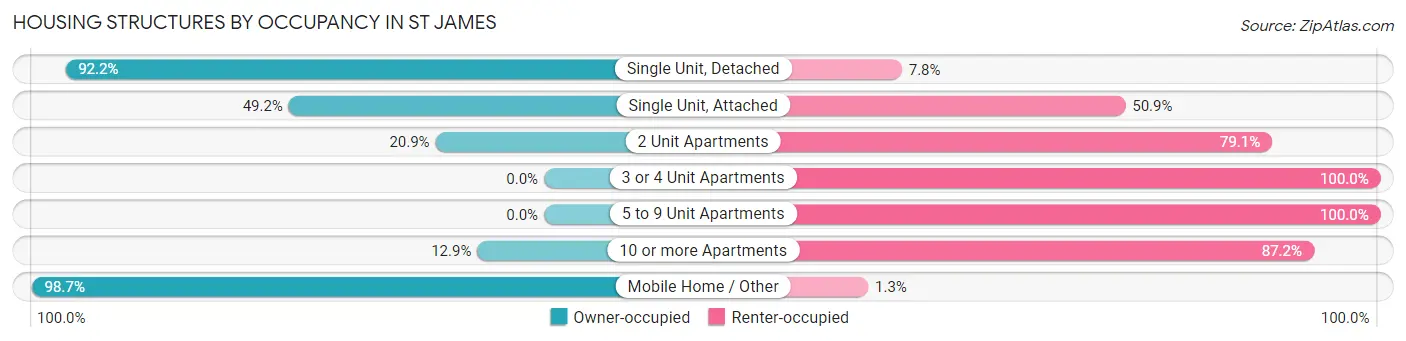
| Structure Type | Owner-occupied | Renter-occupied |
| Single Unit, Detached | 1,226 (92.2%) | 104 (7.8%) |
| Single Unit, Attached | 29 (49.1%) | 30 (50.8%) |
| 2 Unit Apartments | 14 (20.9%) | 53 (79.1%) |
| 3 or 4 Unit Apartments | 0 (0.0%) | 14 (100.0%) |
| 5 to 9 Unit Apartments | 0 (0.0%) | 58 (100.0%) |
| 10 or more Apartments | 32 (12.9%) | 217 (87.2%) |
| Mobile Home / Other | 74 (98.7%) | 1 (1.3%) |
| Total | 1,375 (74.2%) | 477 (25.8%) |
Housing Structures by Number of Rooms in St James
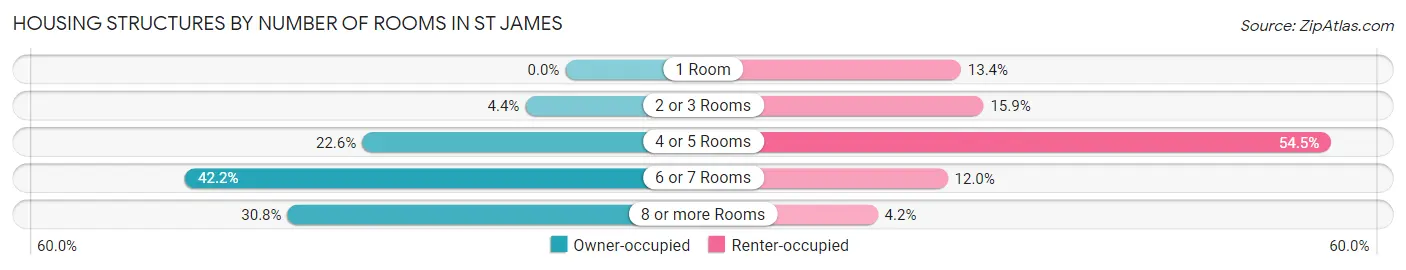
| Number of Rooms | Owner-occupied | Renter-occupied |
| 1 Room | 0 (0.0%) | 64 (13.4%) |
| 2 or 3 Rooms | 61 (4.4%) | 76 (15.9%) |
| 4 or 5 Rooms | 310 (22.6%) | 260 (54.5%) |
| 6 or 7 Rooms | 580 (42.2%) | 57 (11.9%) |
| 8 or more Rooms | 424 (30.8%) | 20 (4.2%) |
| Total | 1,375 (100.0%) | 477 (100.0%) |
Housing Structure by Heating Type in St James
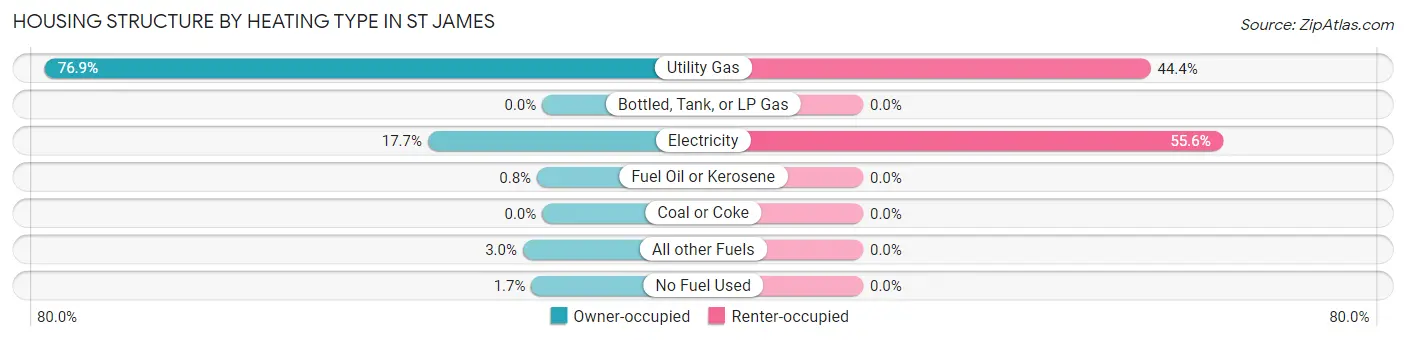
| Heating Type | Owner-occupied | Renter-occupied |
| Utility Gas | 1,057 (76.9%) | 212 (44.4%) |
| Bottled, Tank, or LP Gas | 0 (0.0%) | 0 (0.0%) |
| Electricity | 243 (17.7%) | 265 (55.6%) |
| Fuel Oil or Kerosene | 11 (0.8%) | 0 (0.0%) |
| Coal or Coke | 0 (0.0%) | 0 (0.0%) |
| All other Fuels | 41 (3.0%) | 0 (0.0%) |
| No Fuel Used | 23 (1.7%) | 0 (0.0%) |
| Total | 1,375 (100.0%) | 477 (100.0%) |
Household Vehicle Usage in St James
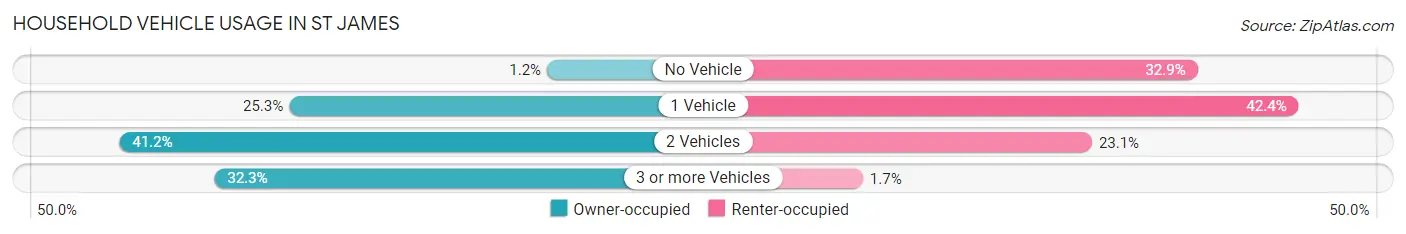
| Vehicles per Household | Owner-occupied | Renter-occupied |
| No Vehicle | 17 (1.2%) | 157 (32.9%) |
| 1 Vehicle | 348 (25.3%) | 202 (42.3%) |
| 2 Vehicles | 566 (41.2%) | 110 (23.1%) |
| 3 or more Vehicles | 444 (32.3%) | 8 (1.7%) |
| Total | 1,375 (100.0%) | 477 (100.0%) |
Real Estate & Mortgages in St James
Real Estate and Mortgage Overview in St James
| Characteristic | Without Mortgage | With Mortgage |
| Housing Units | 666 | 709 |
| Median Property Value | $91,700 | $97,500 |
| Median Household Income | $47,500 | $84 |
| Monthly Housing Costs | $499 | $0 |
| Real Estate Taxes | $921 | $41 |
Property Value by Mortgage Status in St James
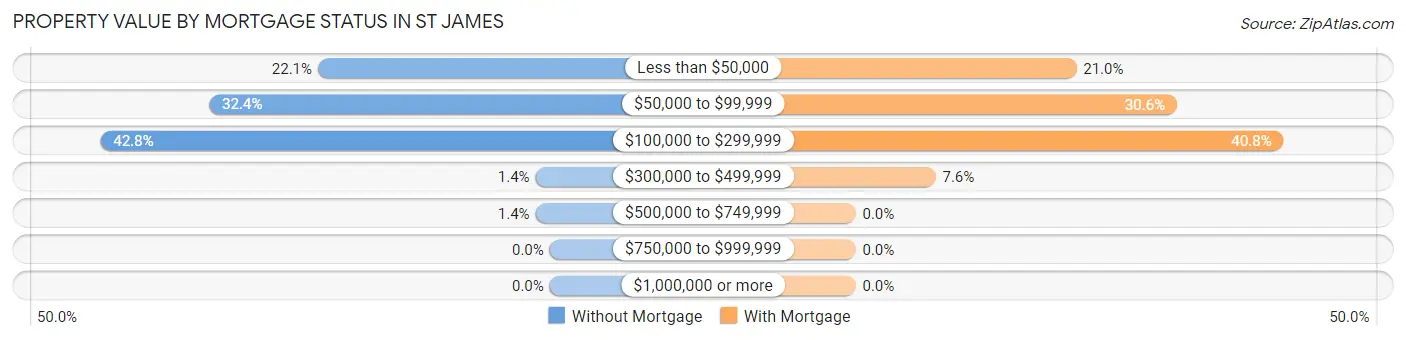
| Property Value | Without Mortgage | With Mortgage |
| Less than $50,000 | 147 (22.1%) | 149 (21.0%) |
| $50,000 to $99,999 | 216 (32.4%) | 217 (30.6%) |
| $100,000 to $299,999 | 285 (42.8%) | 289 (40.8%) |
| $300,000 to $499,999 | 9 (1.3%) | 54 (7.6%) |
| $500,000 to $749,999 | 9 (1.3%) | 0 (0.0%) |
| $750,000 to $999,999 | 0 (0.0%) | 0 (0.0%) |
| $1,000,000 or more | 0 (0.0%) | 0 (0.0%) |
| Total | 666 (100.0%) | 709 (100.0%) |
Household Income by Mortgage Status in St James
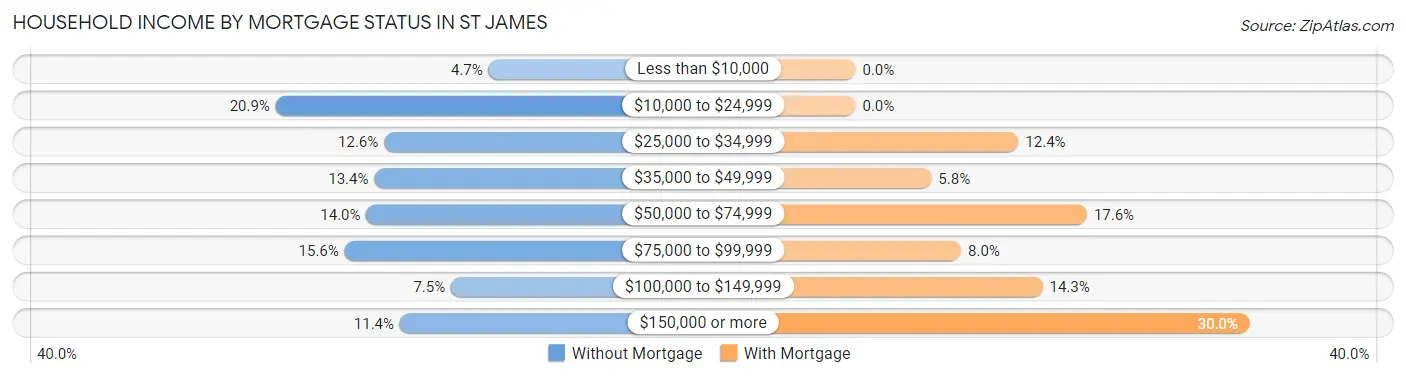
| Household Income | Without Mortgage | With Mortgage |
| Less than $10,000 | 31 (4.6%) | 0 (0.0%) |
| $10,000 to $24,999 | 139 (20.9%) | 0 (0.0%) |
| $25,000 to $34,999 | 84 (12.6%) | 88 (12.4%) |
| $35,000 to $49,999 | 89 (13.4%) | 41 (5.8%) |
| $50,000 to $74,999 | 93 (14.0%) | 125 (17.6%) |
| $75,000 to $99,999 | 104 (15.6%) | 57 (8.0%) |
| $100,000 to $149,999 | 50 (7.5%) | 101 (14.2%) |
| $150,000 or more | 76 (11.4%) | 213 (30.0%) |
| Total | 666 (100.0%) | 709 (100.0%) |
Property Value to Household Income Ratio in St James
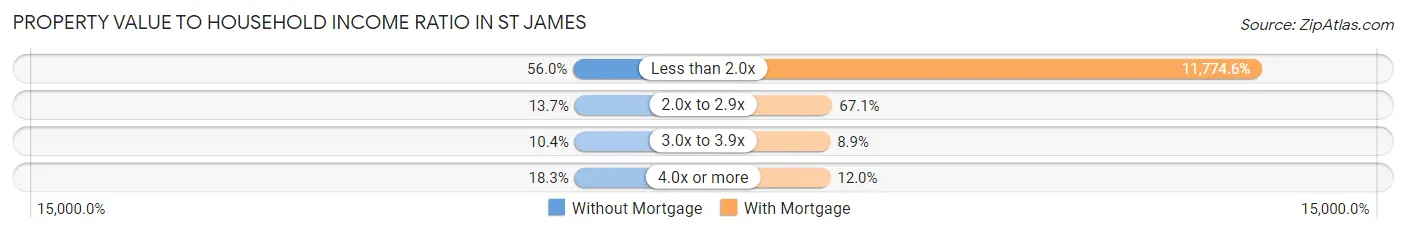
| Value-to-Income Ratio | Without Mortgage | With Mortgage |
| Less than 2.0x | 373 (56.0%) | 83,482 (11,774.6%) |
| 2.0x to 2.9x | 91 (13.7%) | 476 (67.1%) |
| 3.0x to 3.9x | 69 (10.4%) | 63 (8.9%) |
| 4.0x or more | 122 (18.3%) | 85 (12.0%) |
| Total | 666 (100.0%) | 709 (100.0%) |
Real Estate Taxes by Mortgage Status in St James
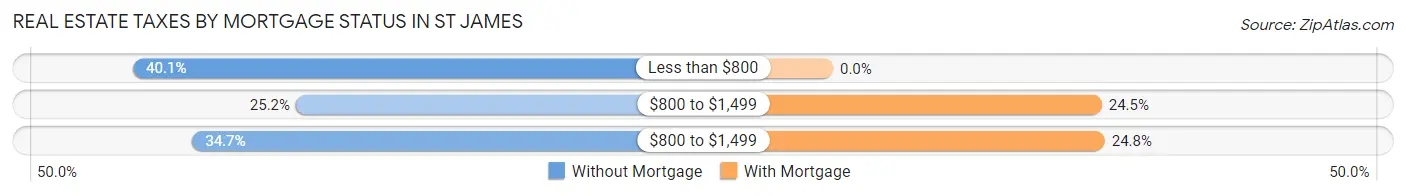
| Property Taxes | Without Mortgage | With Mortgage |
| Less than $800 | 267 (40.1%) | 0 (0.0%) |
| $800 to $1,499 | 168 (25.2%) | 174 (24.5%) |
| $800 to $1,499 | 231 (34.7%) | 176 (24.8%) |
| Total | 666 (100.0%) | 709 (100.0%) |
Health & Disability in St James
Health Insurance Coverage by Age in St James
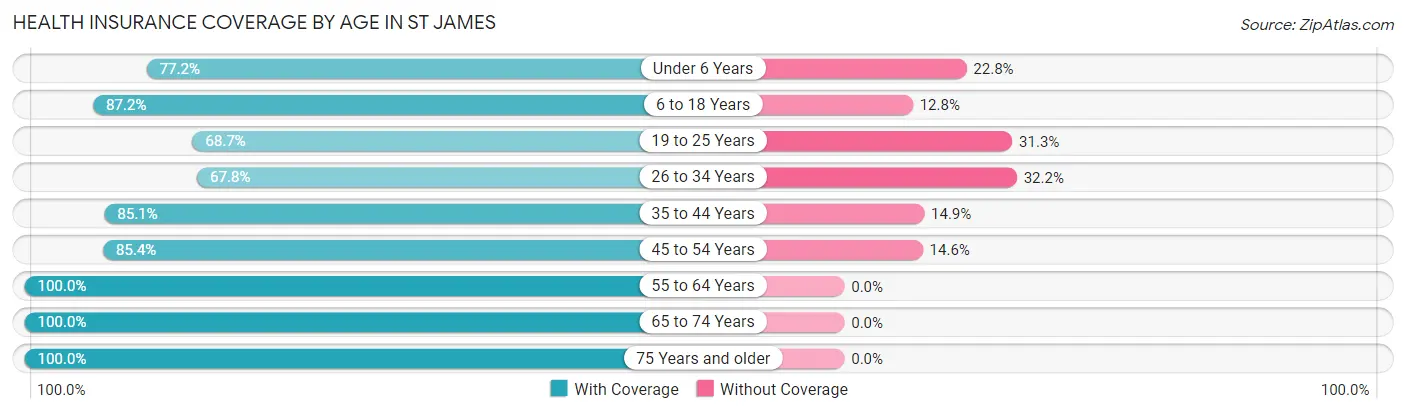
| Age Bracket | With Coverage | Without Coverage |
| Under 6 Years | 329 (77.2%) | 97 (22.8%) |
| 6 to 18 Years | 848 (87.2%) | 124 (12.8%) |
| 19 to 25 Years | 281 (68.7%) | 128 (31.3%) |
| 26 to 34 Years | 327 (67.8%) | 155 (32.2%) |
| 35 to 44 Years | 412 (85.1%) | 72 (14.9%) |
| 45 to 54 Years | 380 (85.4%) | 65 (14.6%) |
| 55 to 64 Years | 711 (100.0%) | 0 (0.0%) |
| 65 to 74 Years | 340 (100.0%) | 0 (0.0%) |
| 75 Years and older | 414 (100.0%) | 0 (0.0%) |
| Total | 4,042 (86.3%) | 641 (13.7%) |
Health Insurance Coverage by Citizenship Status in St James
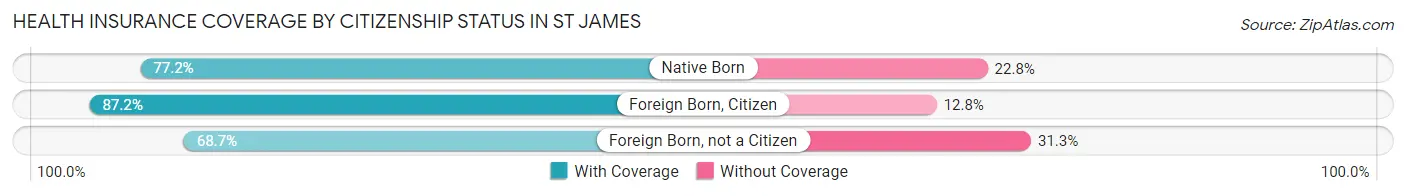
| Citizenship Status | With Coverage | Without Coverage |
| Native Born | 329 (77.2%) | 97 (22.8%) |
| Foreign Born, Citizen | 848 (87.2%) | 124 (12.8%) |
| Foreign Born, not a Citizen | 281 (68.7%) | 128 (31.3%) |
Health Insurance Coverage by Household Income in St James
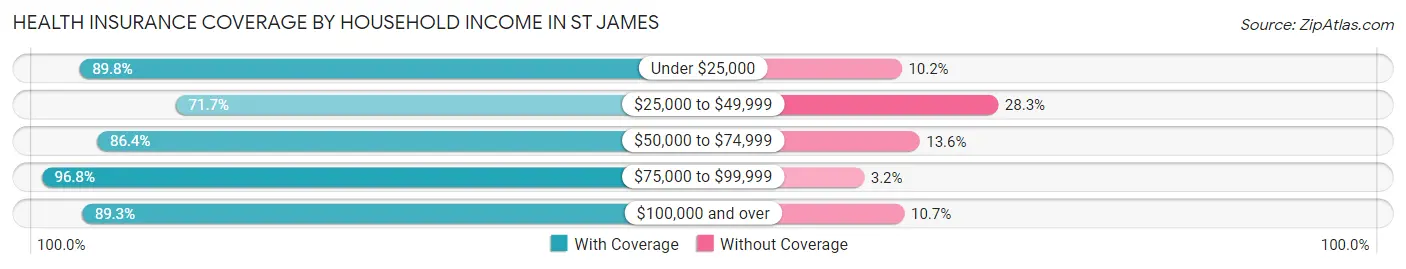
| Household Income | With Coverage | Without Coverage |
| Under $25,000 | 649 (89.8%) | 74 (10.2%) |
| $25,000 to $49,999 | 732 (71.7%) | 289 (28.3%) |
| $50,000 to $74,999 | 598 (86.4%) | 94 (13.6%) |
| $75,000 to $99,999 | 731 (96.8%) | 24 (3.2%) |
| $100,000 and over | 1,332 (89.3%) | 160 (10.7%) |
Public vs Private Health Insurance Coverage by Age in St James
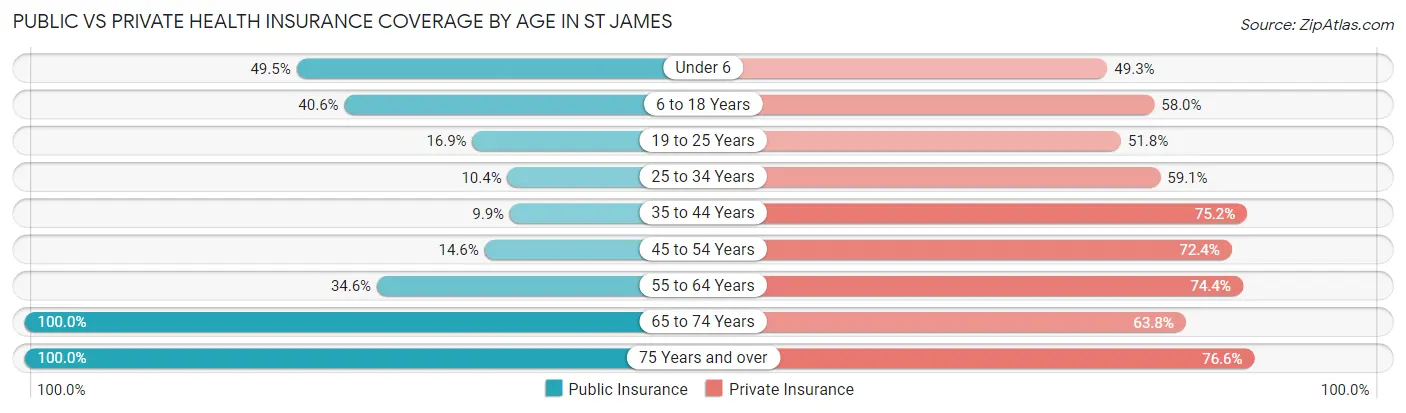
| Age Bracket | Public Insurance | Private Insurance |
| Under 6 | 211 (49.5%) | 210 (49.3%) |
| 6 to 18 Years | 395 (40.6%) | 564 (58.0%) |
| 19 to 25 Years | 69 (16.9%) | 212 (51.8%) |
| 25 to 34 Years | 50 (10.4%) | 285 (59.1%) |
| 35 to 44 Years | 48 (9.9%) | 364 (75.2%) |
| 45 to 54 Years | 65 (14.6%) | 322 (72.4%) |
| 55 to 64 Years | 246 (34.6%) | 529 (74.4%) |
| 65 to 74 Years | 340 (100.0%) | 217 (63.8%) |
| 75 Years and over | 414 (100.0%) | 317 (76.6%) |
| Total | 1,838 (39.3%) | 3,020 (64.5%) |
Disability Status by Sex by Age in St James
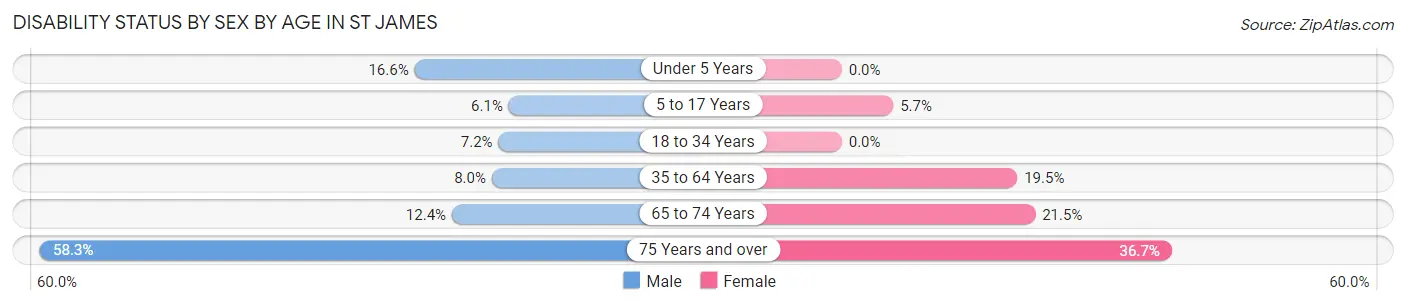
| Age Bracket | Male | Female |
| Under 5 Years | 32 (16.6%) | 0 (0.0%) |
| 5 to 17 Years | 38 (6.1%) | 22 (5.7%) |
| 18 to 34 Years | 36 (7.2%) | 0 (0.0%) |
| 35 to 64 Years | 65 (8.0%) | 161 (19.5%) |
| 65 to 74 Years | 18 (12.4%) | 42 (21.5%) |
| 75 Years and over | 81 (58.3%) | 101 (36.7%) |
Disability Class by Sex by Age in St James
Disability Class: Hearing Difficulty
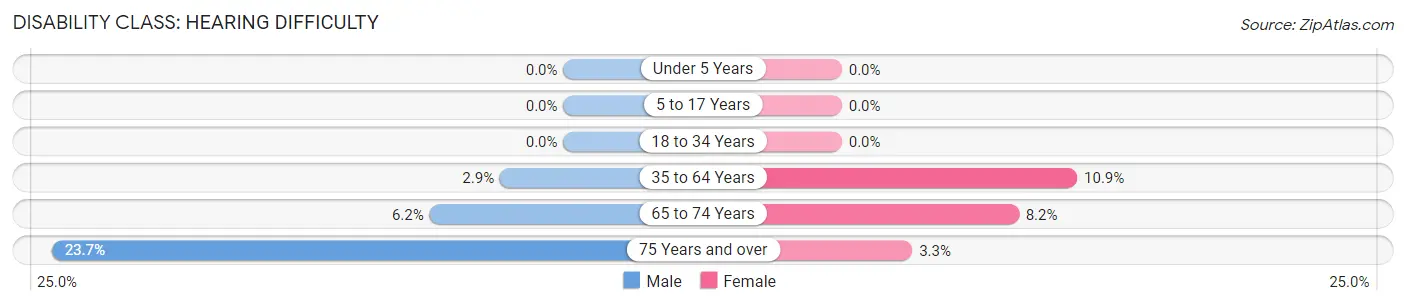
| Age Bracket | Male | Female |
| Under 5 Years | 0 (0.0%) | 0 (0.0%) |
| 5 to 17 Years | 0 (0.0%) | 0 (0.0%) |
| 18 to 34 Years | 0 (0.0%) | 0 (0.0%) |
| 35 to 64 Years | 24 (2.9%) | 90 (10.9%) |
| 65 to 74 Years | 9 (6.2%) | 16 (8.2%) |
| 75 Years and over | 33 (23.7%) | 9 (3.3%) |
Disability Class: Vision Difficulty
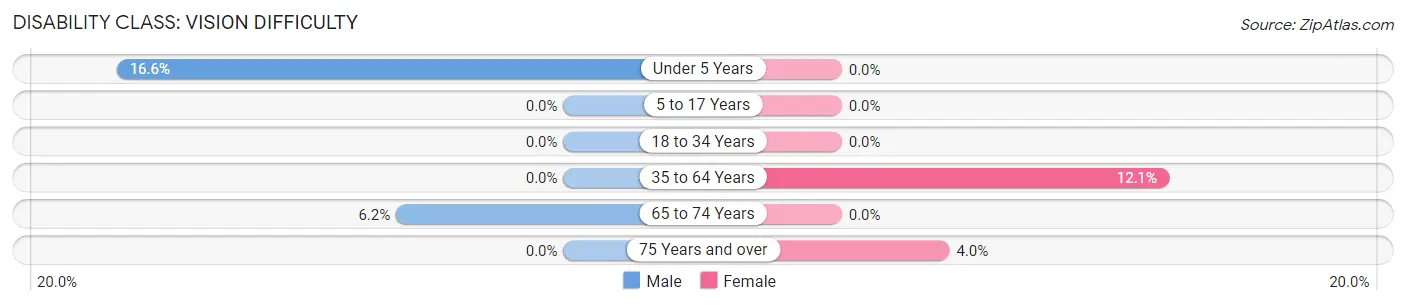
| Age Bracket | Male | Female |
| Under 5 Years | 32 (16.6%) | 0 (0.0%) |
| 5 to 17 Years | 0 (0.0%) | 0 (0.0%) |
| 18 to 34 Years | 0 (0.0%) | 0 (0.0%) |
| 35 to 64 Years | 0 (0.0%) | 100 (12.1%) |
| 65 to 74 Years | 9 (6.2%) | 0 (0.0%) |
| 75 Years and over | 0 (0.0%) | 11 (4.0%) |
Disability Class: Cognitive Difficulty
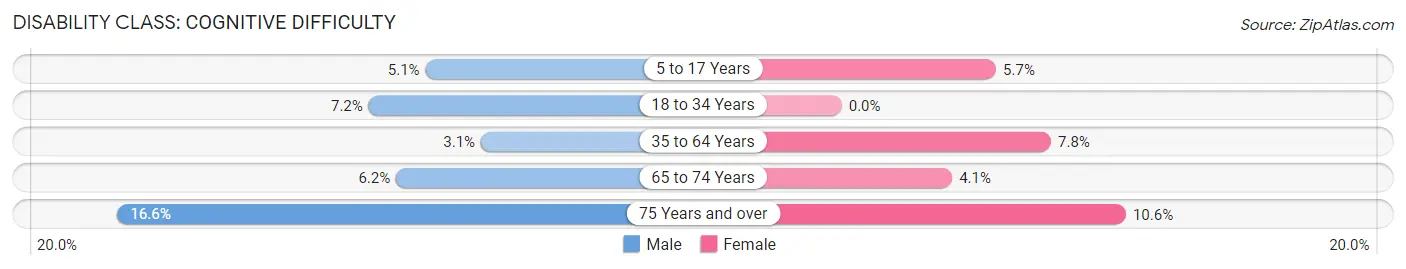
| Age Bracket | Male | Female |
| 5 to 17 Years | 32 (5.1%) | 22 (5.7%) |
| 18 to 34 Years | 36 (7.2%) | 0 (0.0%) |
| 35 to 64 Years | 25 (3.1%) | 64 (7.8%) |
| 65 to 74 Years | 9 (6.2%) | 8 (4.1%) |
| 75 Years and over | 23 (16.6%) | 29 (10.5%) |
Disability Class: Ambulatory Difficulty
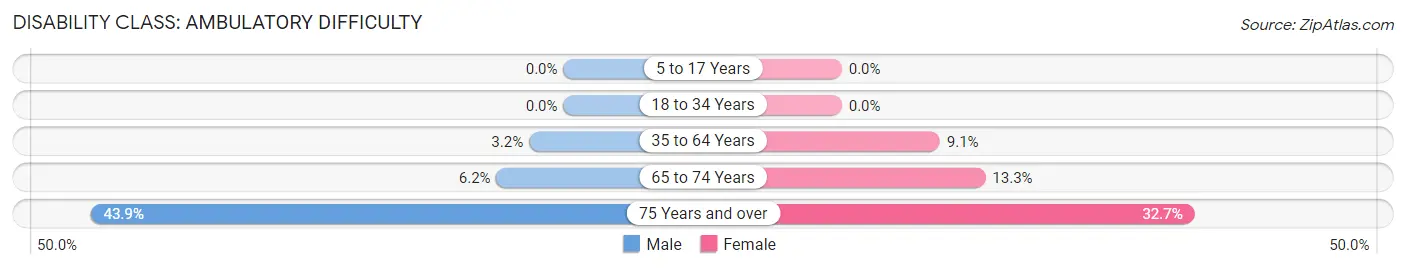
| Age Bracket | Male | Female |
| 5 to 17 Years | 0 (0.0%) | 0 (0.0%) |
| 18 to 34 Years | 0 (0.0%) | 0 (0.0%) |
| 35 to 64 Years | 26 (3.2%) | 75 (9.1%) |
| 65 to 74 Years | 9 (6.2%) | 26 (13.3%) |
| 75 Years and over | 61 (43.9%) | 90 (32.7%) |
Disability Class: Self-Care Difficulty
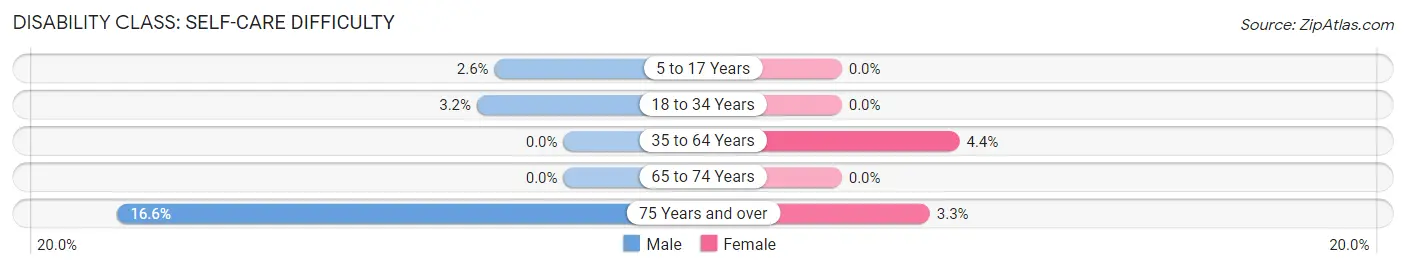
| Age Bracket | Male | Female |
| 5 to 17 Years | 16 (2.6%) | 0 (0.0%) |
| 18 to 34 Years | 16 (3.2%) | 0 (0.0%) |
| 35 to 64 Years | 0 (0.0%) | 36 (4.4%) |
| 65 to 74 Years | 0 (0.0%) | 0 (0.0%) |
| 75 Years and over | 23 (16.6%) | 9 (3.3%) |
Technology Access in St James
Computing Device Access in St James
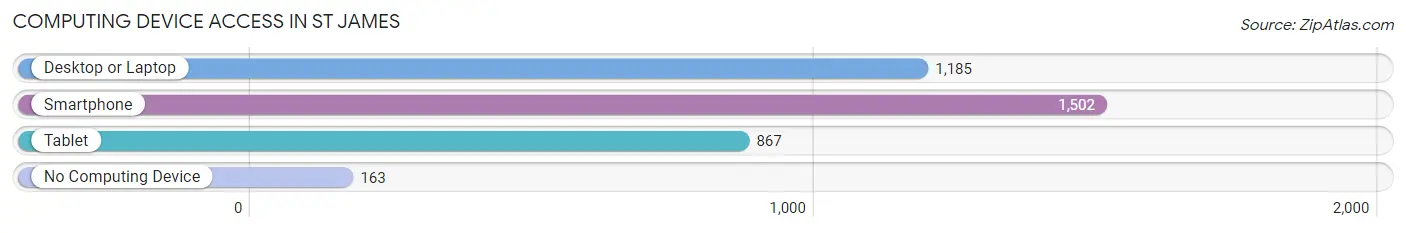
| Device Type | # Households | % Households |
| Desktop or Laptop | 1,185 | 64.0% |
| Smartphone | 1,502 | 81.1% |
| Tablet | 867 | 46.8% |
| No Computing Device | 163 | 8.8% |
| Total | 1,852 | 100.0% |
Internet Access in St James
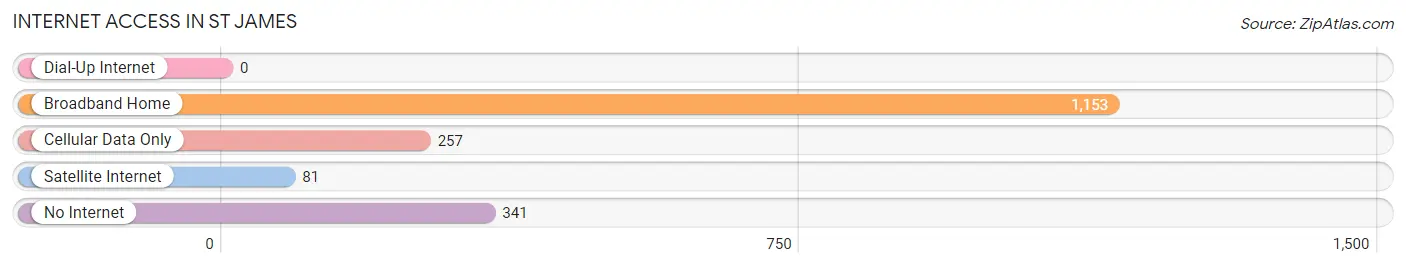
| Internet Type | # Households | % Households |
| Dial-Up Internet | 0 | 0.0% |
| Broadband Home | 1,153 | 62.3% |
| Cellular Data Only | 257 | 13.9% |
| Satellite Internet | 81 | 4.4% |
| No Internet | 341 | 18.4% |
| Total | 1,852 | 100.0% |
St James Summary
St. James, Minnesota is a small city located in Watonwan County in the south-central part of the state. It is situated on the banks of the Watonwan River, and is home to a population of approximately 3,500 people. The city is known for its rich history, diverse geography, and vibrant economy.
History
St. James was founded in 1856 by a group of settlers from New York. The city was named after the nearby St. James Church, which was built in 1857. The city quickly grew, and by the late 19th century, it had become a major hub for the lumber industry. The city was also home to a number of other businesses, including a flour mill, a creamery, and a brickyard.
In the early 20th century, St. James experienced a period of rapid growth. The city was home to a number of new businesses, including a bank, a newspaper, and a movie theater. The city also became a popular tourist destination, with visitors coming from all over the country to enjoy the city’s natural beauty.
Geography
St. James is located in the south-central part of Minnesota, on the banks of the Watonwan River. The city is surrounded by rolling hills and lush forests, and is home to a number of lakes and streams. The city is also home to a number of parks, including the St. James City Park and the St. James State Park.
The city is located approximately 50 miles from the Twin Cities, and is easily accessible by car or bus. The city is also served by a number of highways, including Interstate 90 and U.S. Highway 14.
Economy
St. James is home to a diverse economy, with a number of businesses and industries. The city is home to a number of manufacturing companies, including a paper mill, a furniture factory, and a printing company. The city is also home to a number of retail stores, restaurants, and other businesses.
The city is also home to a number of healthcare facilities, including a hospital and a number of clinics. The city is also home to a number of educational institutions, including a community college and a number of elementary and secondary schools.
Demographics
As of the 2010 census, the population of St. James was 3,521. The city is home to a diverse population, with a number of different ethnic and racial backgrounds. The city is also home to a number of different religious denominations, including Catholic, Lutheran, and Methodist.
The median household income in St. James is $41,945, and the median home value is $117,400. The city has a low unemployment rate, and the cost of living is relatively low.
St. James is a small city with a rich history, diverse geography, and vibrant economy. The city is home to a diverse population, and is a great place to live and work. The city is also home to a number of businesses, healthcare facilities, and educational institutions, making it a great place to raise a family.
Common Questions
What is the Total Population of St James?
Total Population of St James is 4,757.
What is the Total Male Population of St James?
Total Male Population of St James is 2,470.
What is the Total Female Population of St James?
Total Female Population of St James is 2,287.
What is the Ratio of Males per 100 Females in St James?
There are 108.00 Males per 100 Females in St James.
What is the Ratio of Females per 100 Males in St James?
There are 92.59 Females per 100 Males in St James.
What is the Median Population Age in St James?
Median Population Age in St James is 36.9 Years.
What is the Average Family Size in St James
Average Family Size in St James is 3.4 People.
What is the Average Household Size in St James
Average Household Size in St James is 2.5 People.
What is Per Capita Income in St James?
Per Capita income in St James is $30,308.
What is the Median Family Income in St James?
Median Family Income in St James is $77,023.
What is the Median Household income in St James?
Median Household Income in St James is $50,938.
What is Income or Wage Gap in St James?
Income or Wage Gap in St James is 48.6%.
Women in St James earn 51.4 cents for every dollar earned by a man.
What is Family Income Deficit in St James?
Family Income Deficit in St James is $13,218.
Families that are below poverty line in St James earn $13,218 less on average than the poverty threshold level.
What is Inequality or Gini Index in St James?
Inequality or Gini Index in St James is 0.49.
How Large is the Labor Force in St James?
There are 2,064 People in the Labor Forcein in St James.
What is the Percentage of People in the Labor Force in St James?
58.8% of People are in the Labor Force in St James.
What is the Unemployment Rate in St James?
Unemployment Rate in St James is 10.7%.