Oxford, MD
Oxford Map
Oxford Overview
817
TOTAL POPULATION
420
MALE POPULATION
397
FEMALE POPULATION
105.79
MALES / 100 FEMALES
94.52
FEMALES / 100 MALES
63.8
MEDIAN AGE
2.2
AVG FAMILY SIZE
1.9
AVG HOUSEHOLD SIZE
$60,886
PER CAPITA INCOME
$90,295
AVG FAMILY INCOME
$77,170
AVG HOUSEHOLD INCOME
41.5%
WAGE / INCOME GAP [ % ]
58.5¢/ $1
WAGE / INCOME GAP [ $ ]
0.48
INEQUALITY / GINI INDEX
314
LABOR FORCE [ PEOPLE ]
40.6%
PERCENT IN LABOR FORCE
14.0%
UNEMPLOYMENT RATE
Oxford Zip Codes
Oxford Area Codes
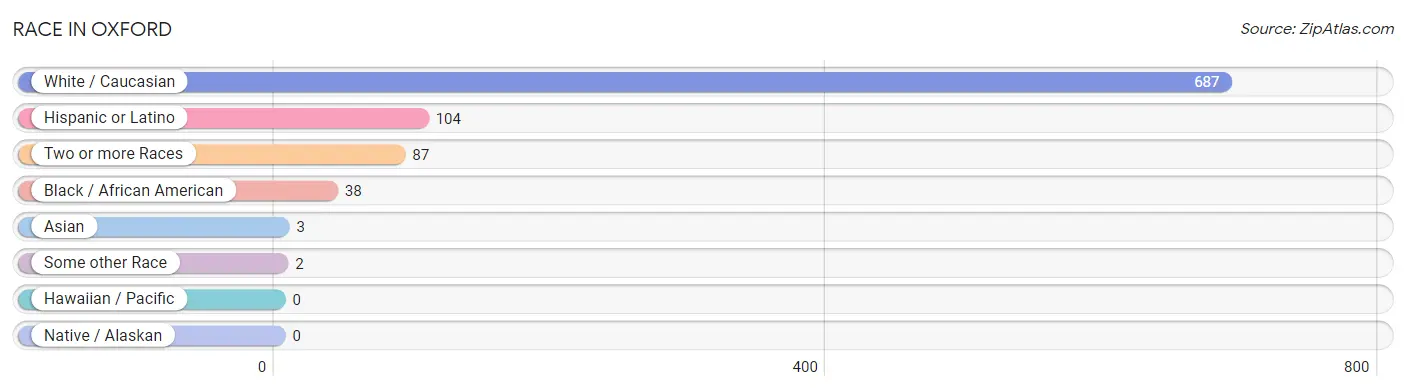
Race in Oxford
The most populous races in Oxford are White / Caucasian (687 | 84.1%), Hispanic or Latino (104 | 12.7%), and Two or more Races (87 | 10.6%).
| Race | # Population | % Population |
| Asian | 3 | 0.4% |
| Black / African American | 38 | 4.6% |
| Hawaiian / Pacific | 0 | 0.0% |
| Hispanic or Latino | 104 | 12.7% |
| Native / Alaskan | 0 | 0.0% |
| White / Caucasian | 687 | 84.1% |
| Two or more Races | 87 | 10.6% |
| Some other Race | 2 | 0.2% |
| Total | 817 | 100.0% |
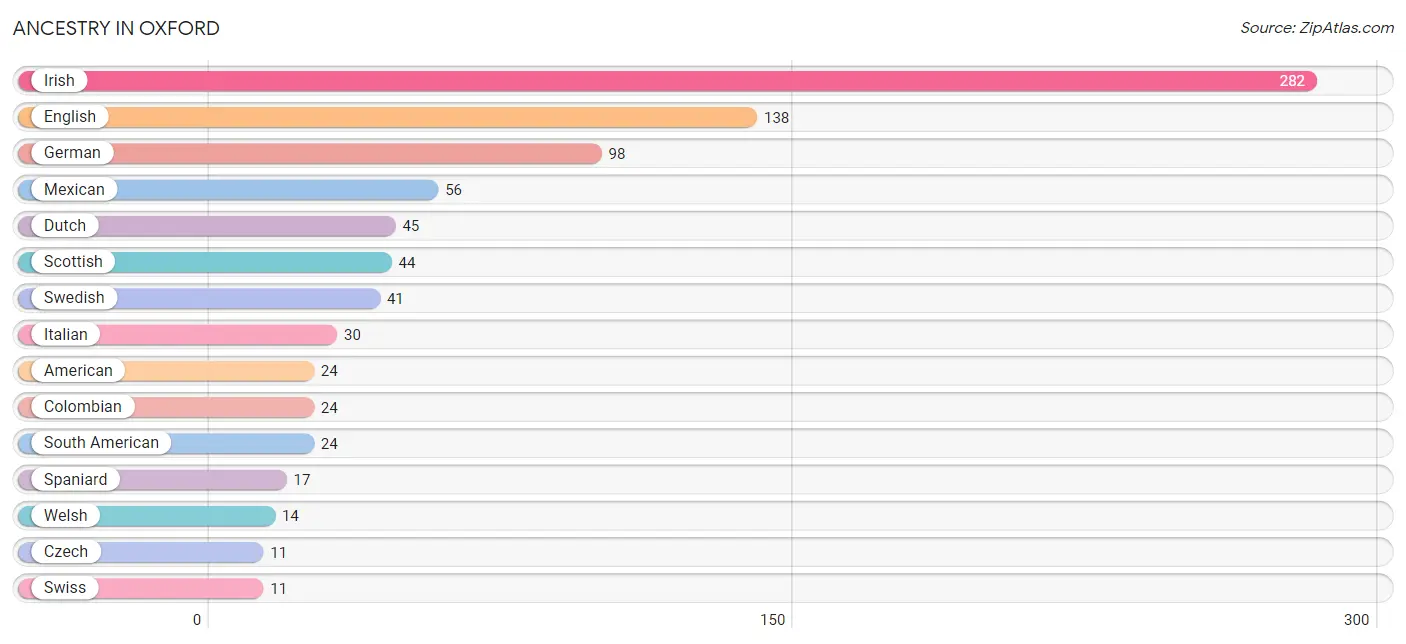
Ancestry in Oxford
The most populous ancestries reported in Oxford are Irish (282 | 34.5%), English (138 | 16.9%), German (98 | 12.0%), Mexican (56 | 6.9%), and Dutch (45 | 5.5%), together accounting for 75.8% of all Oxford residents.
| Ancestry | # Population | % Population |
| American | 24 | 2.9% |
| Armenian | 3 | 0.4% |
| British | 2 | 0.2% |
| Burmese | 3 | 0.4% |
| Central American | 5 | 0.6% |
| Colombian | 24 | 2.9% |
| Cuban | 2 | 0.2% |
| Cypriot | 3 | 0.4% |
| Czech | 11 | 1.3% |
| Danish | 7 | 0.9% |
| Dutch | 45 | 5.5% |
| Eastern European | 2 | 0.2% |
| English | 138 | 16.9% |
| French | 6 | 0.7% |
| French Canadian | 6 | 0.7% |
| German | 98 | 12.0% |
| Greek | 4 | 0.5% |
| Honduran | 5 | 0.6% |
| Irish | 282 | 34.5% |
| Italian | 30 | 3.7% |
| Lithuanian | 2 | 0.2% |
| Mexican | 56 | 6.9% |
| Northern European | 6 | 0.7% |
| Polish | 10 | 1.2% |
| Russian | 2 | 0.2% |
| Scotch-Irish | 10 | 1.2% |
| Scottish | 44 | 5.4% |
| South American | 24 | 2.9% |
| Spaniard | 17 | 2.1% |
| Swedish | 41 | 5.0% |
| Swiss | 11 | 1.3% |
| Welsh | 14 | 1.7% | View All 32 Rows |
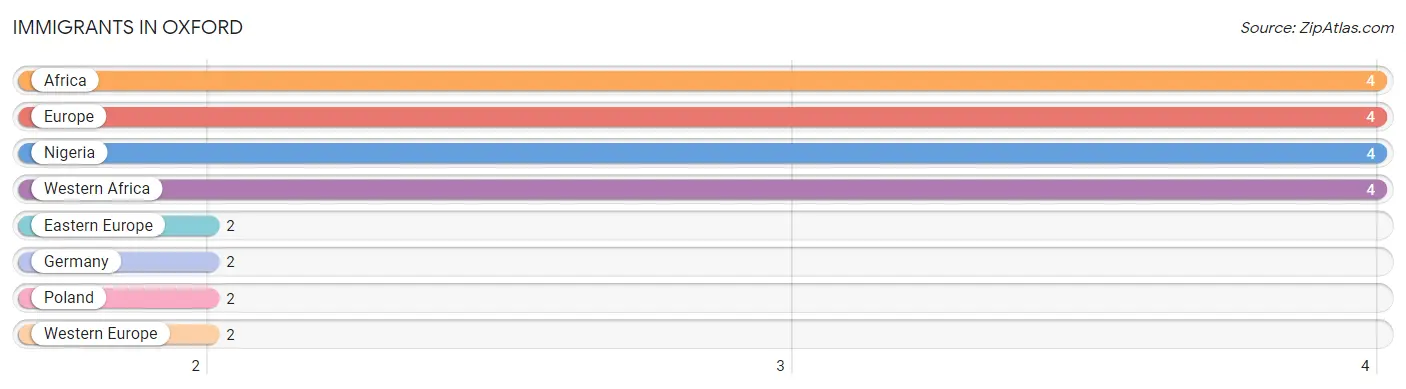
Immigrants in Oxford
The most numerous immigrant groups reported in Oxford came from Africa (4 | 0.5%), Europe (4 | 0.5%), Nigeria (4 | 0.5%), Western Africa (4 | 0.5%), and Eastern Europe (2 | 0.2%), together accounting for 2.2% of all Oxford residents.
| Immigration Origin | # Population | % Population |
| Africa | 4 | 0.5% |
| Eastern Europe | 2 | 0.2% |
| Europe | 4 | 0.5% |
| Germany | 2 | 0.2% |
| Nigeria | 4 | 0.5% |
| Poland | 2 | 0.2% |
| Western Africa | 4 | 0.5% |
| Western Europe | 2 | 0.2% | View All 8 Rows |
Sex and Age in Oxford
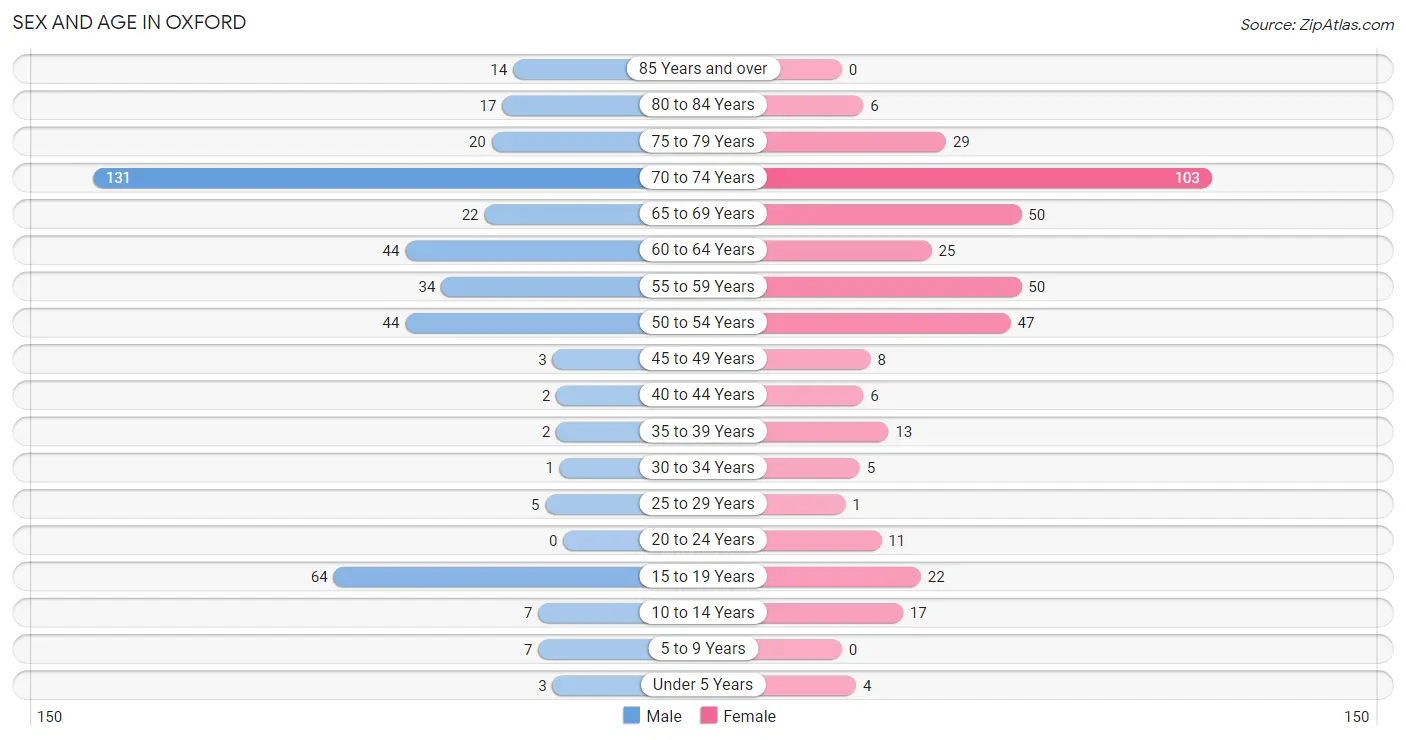
Sex and Age in Oxford
The most populous age groups in Oxford are 70 to 74 Years (131 | 31.2%) for men and 70 to 74 Years (103 | 25.9%) for women.
| Age Bracket | Male | Female |
| Under 5 Years | 3 (0.7%) | 4 (1.0%) |
| 5 to 9 Years | 7 (1.7%) | 0 (0.0%) |
| 10 to 14 Years | 7 (1.7%) | 17 (4.3%) |
| 15 to 19 Years | 64 (15.2%) | 22 (5.5%) |
| 20 to 24 Years | 0 (0.0%) | 11 (2.8%) |
| 25 to 29 Years | 5 (1.2%) | 1 (0.3%) |
| 30 to 34 Years | 1 (0.2%) | 5 (1.3%) |
| 35 to 39 Years | 2 (0.5%) | 13 (3.3%) |
| 40 to 44 Years | 2 (0.5%) | 6 (1.5%) |
| 45 to 49 Years | 3 (0.7%) | 8 (2.0%) |
| 50 to 54 Years | 44 (10.5%) | 47 (11.8%) |
| 55 to 59 Years | 34 (8.1%) | 50 (12.6%) |
| 60 to 64 Years | 44 (10.5%) | 25 (6.3%) |
| 65 to 69 Years | 22 (5.2%) | 50 (12.6%) |
| 70 to 74 Years | 131 (31.2%) | 103 (25.9%) |
| 75 to 79 Years | 20 (4.8%) | 29 (7.3%) |
| 80 to 84 Years | 17 (4.1%) | 6 (1.5%) |
| 85 Years and over | 14 (3.3%) | 0 (0.0%) |
| Total | 420 (100.0%) | 397 (100.0%) |
Families and Households in Oxford
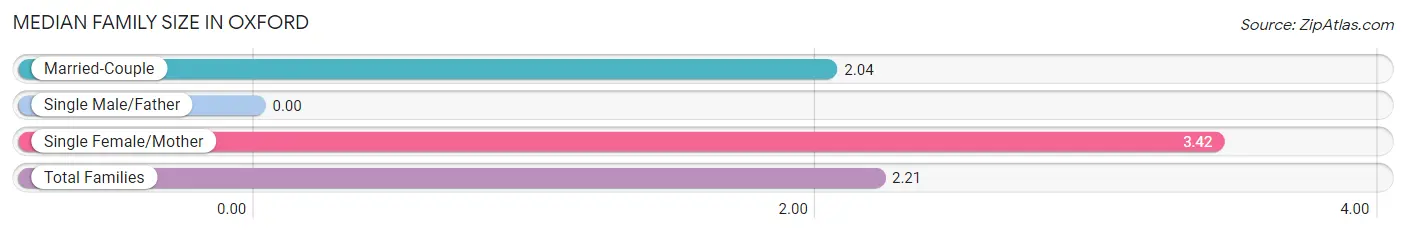
Median Family Size in Oxford
| Family Type | # Families | Family Size |
| Married-Couple | 251 (87.5%) | 2.04 |
| Single Male/Father | 0 (0.0%) | - |
| Single Female/Mother | 36 (12.5%) | 3.42 |
| Total Families | 287 (100.0%) | 2.21 |
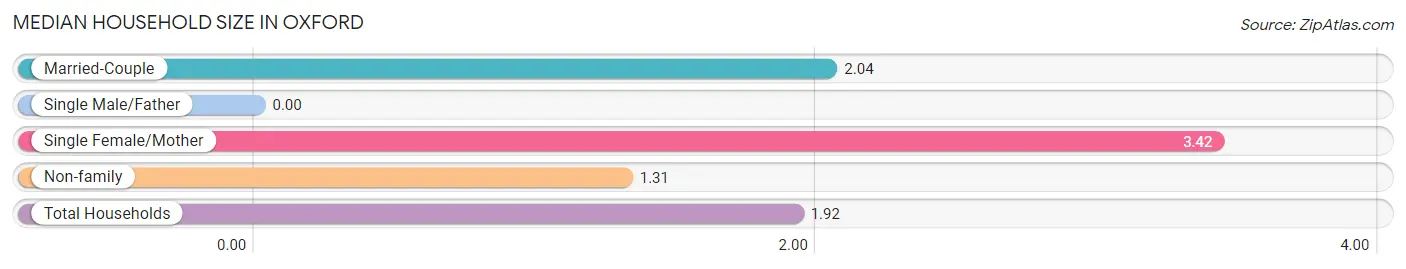
Median Household Size in Oxford
| Household Type | # Households | Household Size |
| Married-Couple | 251 (58.9%) | 2.04 |
| Single Male/Father | 0 (0.0%) | - |
| Single Female/Mother | 36 (8.5%) | 3.42 |
| Non-family | 139 (32.6%) | 1.31 |
| Total Households | 426 (100.0%) | 1.92 |
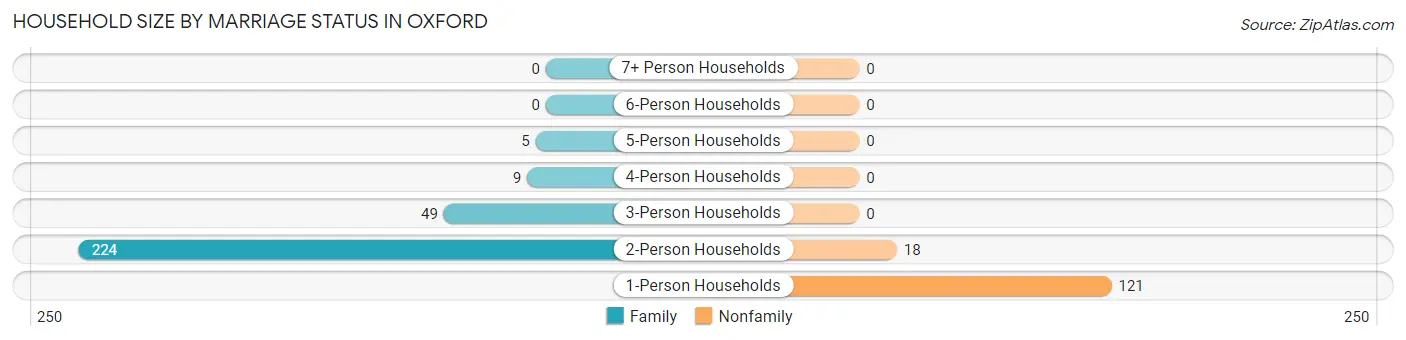
Household Size by Marriage Status in Oxford
Out of a total of 426 households in Oxford, 287 (67.4%) are family households, while 139 (32.6%) are nonfamily households. The most numerous type of family households are 2-person households, comprising 224, and the most common type of nonfamily households are 1-person households, comprising 121.
| Household Size | Family Households | Nonfamily Households |
| 1-Person Households | - | 121 (28.4%) |
| 2-Person Households | 224 (52.6%) | 18 (4.2%) |
| 3-Person Households | 49 (11.5%) | 0 (0.0%) |
| 4-Person Households | 9 (2.1%) | 0 (0.0%) |
| 5-Person Households | 5 (1.2%) | 0 (0.0%) |
| 6-Person Households | 0 (0.0%) | 0 (0.0%) |
| 7+ Person Households | 0 (0.0%) | 0 (0.0%) |
| Total | 287 (67.4%) | 139 (32.6%) |
Female Fertility in Oxford
Fertility by Age in Oxford
| Age Bracket | Women with Births | Births / 1,000 Women |
| 15 to 19 years | 0 (0.0%) | 0.0 |
| 20 to 34 years | 0 (0.0%) | 0.0 |
| 35 to 50 years | 0 (0.0%) | 0.0 |
| Total | 0 (0.0%) | 0.0 |
Fertility by Age by Marriage Status in Oxford
| Age Bracket | Married | Unmarried |
| 15 to 19 years | 0 (0.0%) | 0 (0.0%) |
| 20 to 34 years | 0 (0.0%) | 0 (0.0%) |
| 35 to 50 years | 0 (0.0%) | 0 (0.0%) |
| Total | 0 (0.0%) | 0 (0.0%) |
Fertility by Education in Oxford
| Educational Attainment | Women with Births | Births / 1,000 Women |
| Less than High School | 0 (0.0%) | 0.0 |
| High School Diploma | 0 (0.0%) | 0.0 |
| College or Associate's Degree | 0 (0.0%) | 0.0 |
| Bachelor's Degree | 0 (0.0%) | 0.0 |
| Graduate Degree | 0 (0.0%) | 0.0 |
| Total | 0 (0.0%) | 0.0 |
Fertility by Education by Marriage Status in Oxford
| Educational Attainment | Married | Unmarried |
| Less than High School | 0 (0.0%) | 0 (0.0%) |
| High School Diploma | 0 (0.0%) | 0 (0.0%) |
| College or Associate's Degree | 0 (0.0%) | 0 (0.0%) |
| Bachelor's Degree | 0 (0.0%) | 0 (0.0%) |
| Graduate Degree | 0 (0.0%) | 0 (0.0%) |
| Total | 0 (0.0%) | 0 (0.0%) |
Income in Oxford
Income Overview in Oxford
Per Capita Income in Oxford is $60,886, while median incomes of families and households are $90,295 and $77,170 respectively.
| Characteristic | Number | Measure |
| Per Capita Income | 817 | $60,886 |
| Median Family Income | 287 | $90,295 |
| Mean Family Income | 287 | $120,118 |
| Median Household Income | 426 | $77,170 |
| Mean Household Income | 426 | $119,554 |
| Income Deficit | 287 | $0 |
| Wage / Income Gap (%) | 817 | 41.46% |
| Wage / Income Gap ($) | 817 | 58.54¢ per $1 |
| Gini / Inequality Index | 817 | 0.48 |
Earnings by Sex in Oxford
Average Earnings in Oxford are $27,250, $33,385 for men and $19,542 for women, a difference of 41.5%.
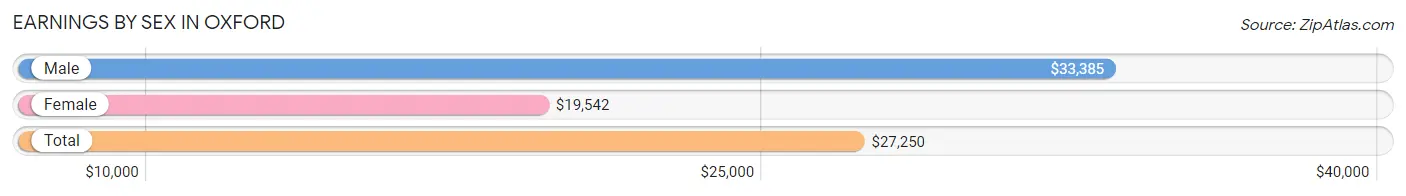
| Sex | Number | Average Earnings |
| Male | 167 (49.4%) | $33,385 |
| Female | 171 (50.6%) | $19,542 |
| Total | 338 (100.0%) | $27,250 |
Earnings by Sex by Income Bracket in Oxford
The most common earnings brackets in Oxford are $2,500 to $4,999 for men (58 | 34.7%) and $100,000+ for women (31 | 18.1%).
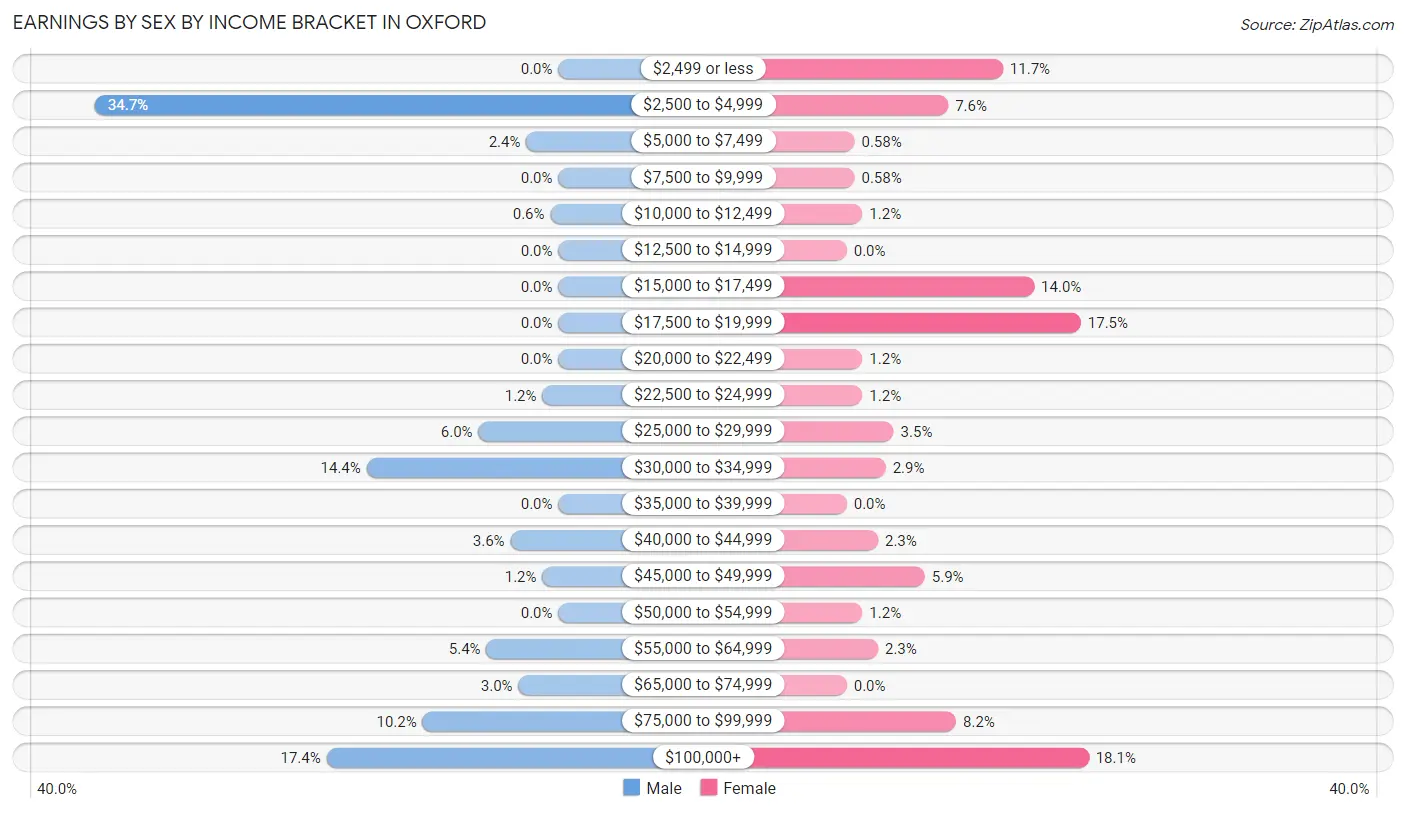
| Income | Male | Female |
| $2,499 or less | 0 (0.0%) | 20 (11.7%) |
| $2,500 to $4,999 | 58 (34.7%) | 13 (7.6%) |
| $5,000 to $7,499 | 4 (2.4%) | 1 (0.6%) |
| $7,500 to $9,999 | 0 (0.0%) | 1 (0.6%) |
| $10,000 to $12,499 | 1 (0.6%) | 2 (1.2%) |
| $12,500 to $14,999 | 0 (0.0%) | 0 (0.0%) |
| $15,000 to $17,499 | 0 (0.0%) | 24 (14.0%) |
| $17,500 to $19,999 | 0 (0.0%) | 30 (17.5%) |
| $20,000 to $22,499 | 0 (0.0%) | 2 (1.2%) |
| $22,500 to $24,999 | 2 (1.2%) | 2 (1.2%) |
| $25,000 to $29,999 | 10 (6.0%) | 6 (3.5%) |
| $30,000 to $34,999 | 24 (14.4%) | 5 (2.9%) |
| $35,000 to $39,999 | 0 (0.0%) | 0 (0.0%) |
| $40,000 to $44,999 | 6 (3.6%) | 4 (2.3%) |
| $45,000 to $49,999 | 2 (1.2%) | 10 (5.9%) |
| $50,000 to $54,999 | 0 (0.0%) | 2 (1.2%) |
| $55,000 to $64,999 | 9 (5.4%) | 4 (2.3%) |
| $65,000 to $74,999 | 5 (3.0%) | 0 (0.0%) |
| $75,000 to $99,999 | 17 (10.2%) | 14 (8.2%) |
| $100,000+ | 29 (17.4%) | 31 (18.1%) |
| Total | 167 (100.0%) | 171 (100.0%) |
Earnings by Sex by Educational Attainment in Oxford
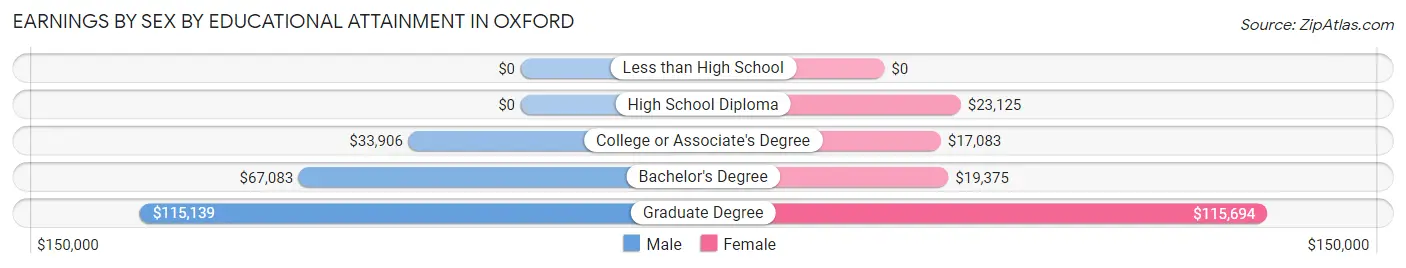
| Educational Attainment | Male Income | Female Income |
| Less than High School | - | - |
| High School Diploma | - | - |
| College or Associate's Degree | $33,906 | $17,083 |
| Bachelor's Degree | $67,083 | $19,375 |
| Graduate Degree | $115,139 | $115,694 |
| Total | $62,917 | $0 |
Family Income in Oxford
Family Income Brackets in Oxford
According to the Oxford family income data, there are 126 families falling into the $75,000 to $99,999 income range, which is the most common income bracket and makes up 43.9% of all families.
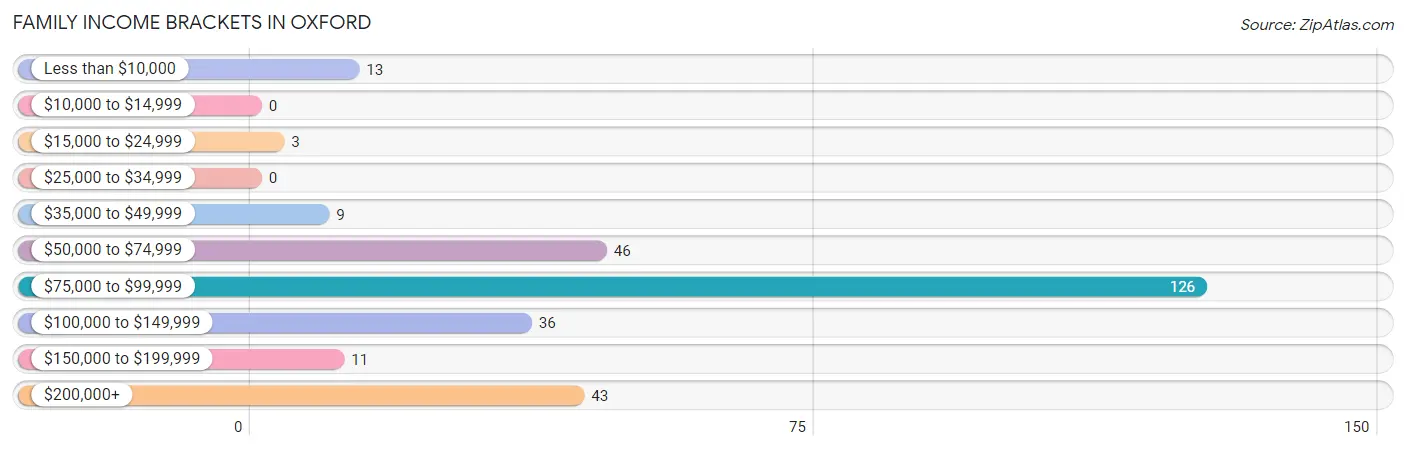
| Income Bracket | # Families | % Families |
| Less than $10,000 | 13 | 4.5% |
| $10,000 to $14,999 | 0 | 0.0% |
| $15,000 to $24,999 | 3 | 1.0% |
| $25,000 to $34,999 | 0 | 0.0% |
| $35,000 to $49,999 | 9 | 3.1% |
| $50,000 to $74,999 | 46 | 16.0% |
| $75,000 to $99,999 | 126 | 43.9% |
| $100,000 to $149,999 | 36 | 12.5% |
| $150,000 to $199,999 | 11 | 3.8% |
| $200,000+ | 43 | 15.0% |
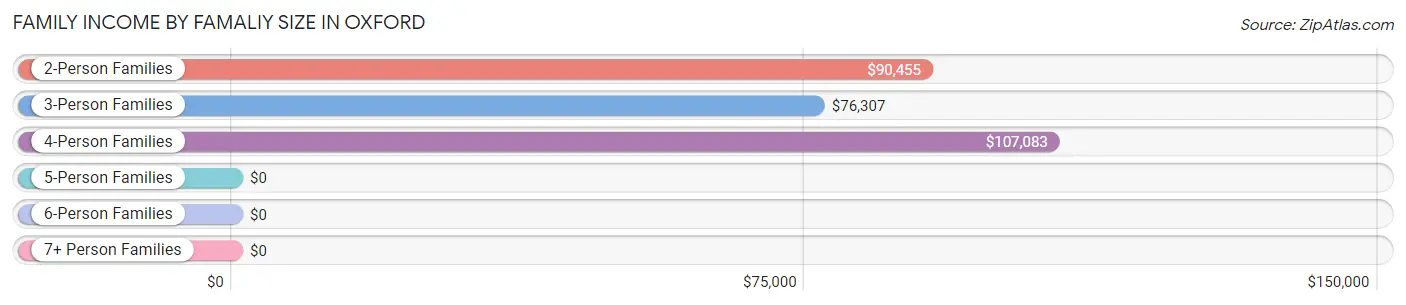
Family Income by Famaliy Size in Oxford
4-person families (9 | 3.1%) account for the highest median family income in Oxford with $107,083 per family, while 2-person families (224 | 78.0%) have the highest median income of $45,228 per family member.
| Income Bracket | # Families | Median Income |
| 2-Person Families | 224 (78.0%) | $90,455 |
| 3-Person Families | 49 (17.1%) | $76,307 |
| 4-Person Families | 9 (3.1%) | $107,083 |
| 5-Person Families | 5 (1.7%) | $0 |
| 6-Person Families | 0 (0.0%) | $0 |
| 7+ Person Families | 0 (0.0%) | $0 |
| Total | 287 (100.0%) | $90,295 |
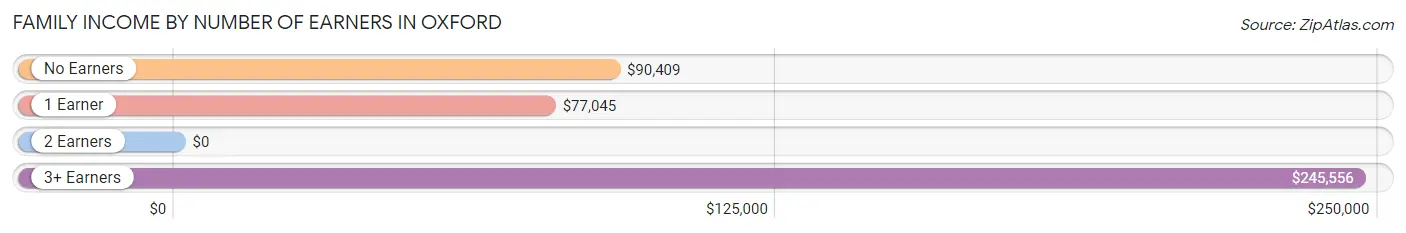
Family Income by Number of Earners in Oxford
| Number of Earners | # Families | Median Income |
| No Earners | 140 (48.8%) | $90,409 |
| 1 Earner | 76 (26.5%) | $77,045 |
| 2 Earners | 57 (19.9%) | $0 |
| 3+ Earners | 14 (4.9%) | $245,556 |
| Total | 287 (100.0%) | $90,295 |
Household Income in Oxford
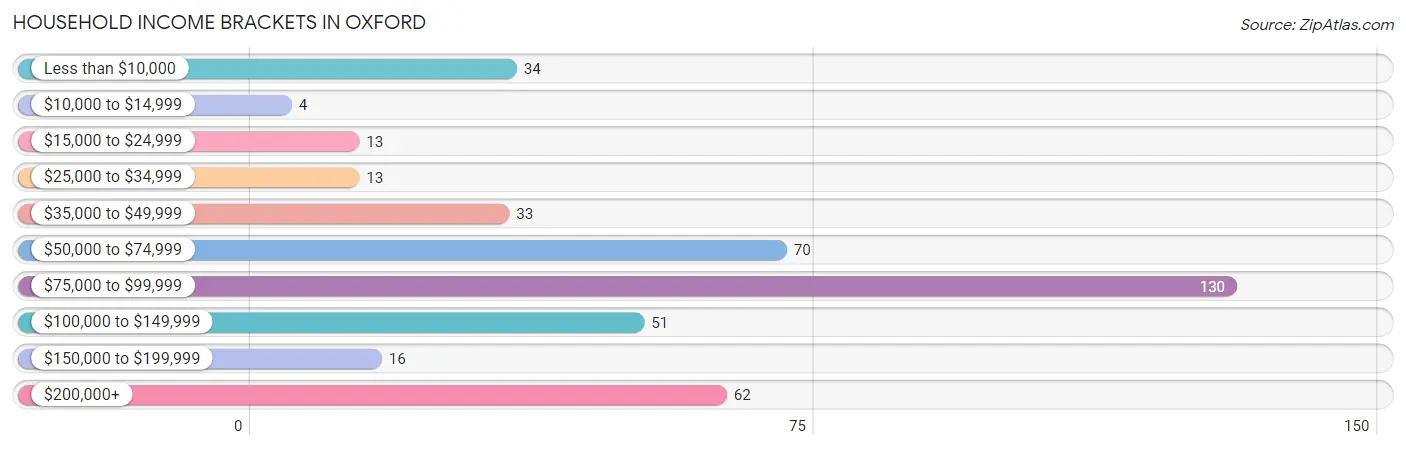
Household Income Brackets in Oxford
With 130 households falling in the category, the $75,000 to $99,999 income range is the most frequent in Oxford, accounting for 30.5% of all households. In contrast, only 4 households (0.9%) fall into the $10,000 to $14,999 income bracket, making it the least populous group.
| Income Bracket | # Households | % Households |
| Less than $10,000 | 34 | 8.0% |
| $10,000 to $14,999 | 4 | 0.9% |
| $15,000 to $24,999 | 13 | 3.1% |
| $25,000 to $34,999 | 13 | 3.1% |
| $35,000 to $49,999 | 33 | 7.7% |
| $50,000 to $74,999 | 70 | 16.4% |
| $75,000 to $99,999 | 130 | 30.5% |
| $100,000 to $149,999 | 51 | 12.0% |
| $150,000 to $199,999 | 16 | 3.8% |
| $200,000+ | 62 | 14.6% |
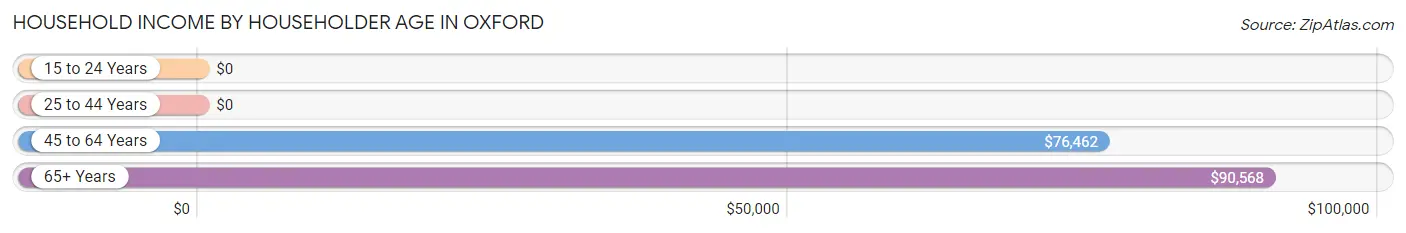
Household Income by Householder Age in Oxford
The median household income in Oxford is $77,170, with the highest median household income of $90,568 found in the 65+ years age bracket for the primary householder. A total of 225 households (52.8%) fall into this category. Meanwhile, the 15 to 24 years age bracket for the primary householder has the lowest median household income of $0, with 11 households (2.6%) in this group.
| Income Bracket | # Households | Median Income |
| 15 to 24 Years | 11 (2.6%) | $0 |
| 25 to 44 Years | 22 (5.2%) | $0 |
| 45 to 64 Years | 168 (39.4%) | $76,462 |
| 65+ Years | 225 (52.8%) | $90,568 |
| Total | 426 (100.0%) | $77,170 |
Poverty in Oxford
Income Below Poverty by Sex and Age in Oxford
With 24.8% poverty level for males and 7.6% for females among the residents of Oxford, 5 year old males and 35 to 44 year old females are the most vulnerable to poverty, with 5 males (100.0%) and 13 females (68.4%) in their respective age groups living below the poverty level.
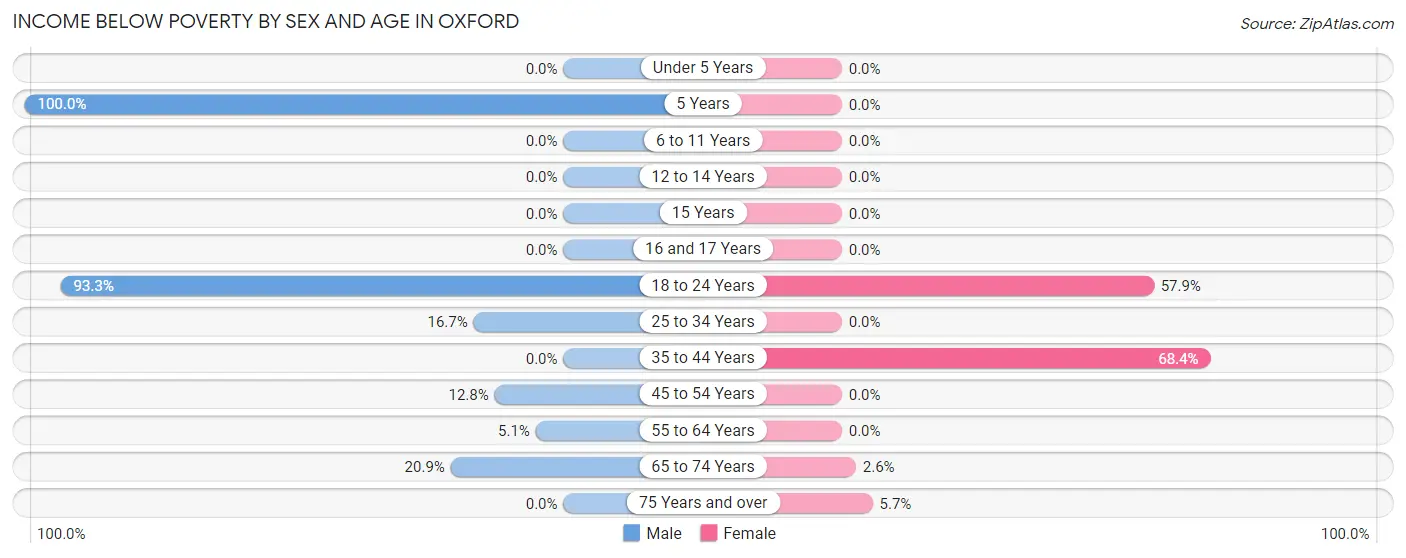
| Age Bracket | Male | Female |
| Under 5 Years | 0 (0.0%) | 0 (0.0%) |
| 5 Years | 5 (100.0%) | 0 (0.0%) |
| 6 to 11 Years | 0 (0.0%) | 0 (0.0%) |
| 12 to 14 Years | 0 (0.0%) | 0 (0.0%) |
| 15 Years | 0 (0.0%) | 0 (0.0%) |
| 16 and 17 Years | 0 (0.0%) | 0 (0.0%) |
| 18 to 24 Years | 56 (93.3%) | 11 (57.9%) |
| 25 to 34 Years | 1 (16.7%) | 0 (0.0%) |
| 35 to 44 Years | 0 (0.0%) | 13 (68.4%) |
| 45 to 54 Years | 6 (12.8%) | 0 (0.0%) |
| 55 to 64 Years | 4 (5.1%) | 0 (0.0%) |
| 65 to 74 Years | 32 (20.9%) | 4 (2.6%) |
| 75 Years and over | 0 (0.0%) | 2 (5.7%) |
| Total | 104 (24.8%) | 30 (7.6%) |
Income Above Poverty by Sex and Age in Oxford
According to the poverty statistics in Oxford, males aged under 5 years and females aged under 5 years are the age groups that are most secure financially, with 100.0% of males and 100.0% of females in these age groups living above the poverty line.
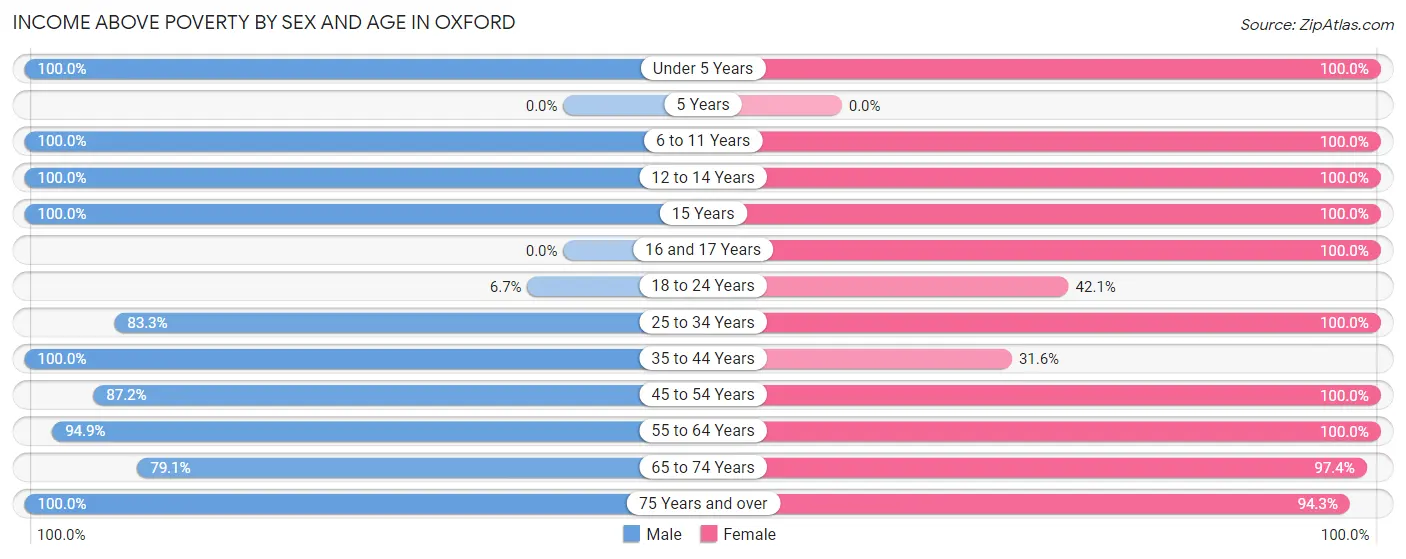
| Age Bracket | Male | Female |
| Under 5 Years | 3 (100.0%) | 4 (100.0%) |
| 5 Years | 0 (0.0%) | 0 (0.0%) |
| 6 to 11 Years | 6 (100.0%) | 1 (100.0%) |
| 12 to 14 Years | 3 (100.0%) | 16 (100.0%) |
| 15 Years | 4 (100.0%) | 2 (100.0%) |
| 16 and 17 Years | 0 (0.0%) | 12 (100.0%) |
| 18 to 24 Years | 4 (6.7%) | 8 (42.1%) |
| 25 to 34 Years | 5 (83.3%) | 6 (100.0%) |
| 35 to 44 Years | 4 (100.0%) | 6 (31.6%) |
| 45 to 54 Years | 41 (87.2%) | 55 (100.0%) |
| 55 to 64 Years | 74 (94.9%) | 75 (100.0%) |
| 65 to 74 Years | 121 (79.1%) | 149 (97.4%) |
| 75 Years and over | 51 (100.0%) | 33 (94.3%) |
| Total | 316 (75.2%) | 367 (92.4%) |
Income Below Poverty Among Married-Couple Families in Oxford
The poverty statistics for married-couple families in Oxford show that 1.2% or 3 of the total 251 families live below the poverty line. Families with no children have the highest poverty rate of 1.3%, comprising of 3 families. On the other hand, families with 1 or 2 children have the lowest poverty rate of 0.0%, which includes 0 families.
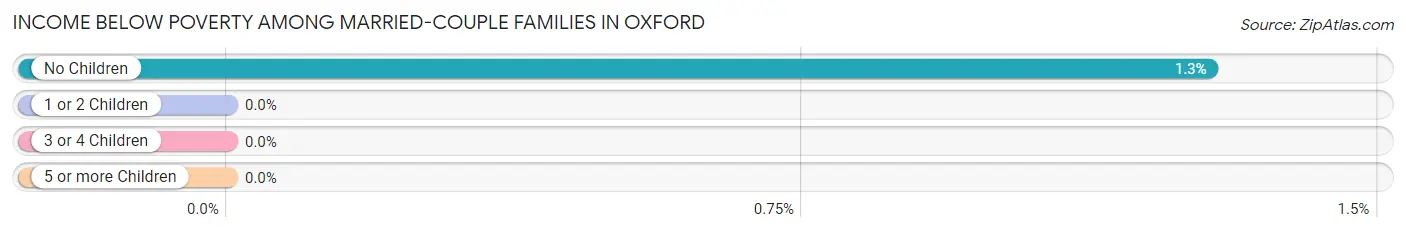
| Children | Above Poverty | Below Poverty |
| No Children | 232 (98.7%) | 3 (1.3%) |
| 1 or 2 Children | 14 (100.0%) | 0 (0.0%) |
| 3 or 4 Children | 2 (100.0%) | 0 (0.0%) |
| 5 or more Children | 0 (0.0%) | 0 (0.0%) |
| Total | 248 (98.8%) | 3 (1.2%) |
Income Below Poverty Among Single-Parent Households in Oxford
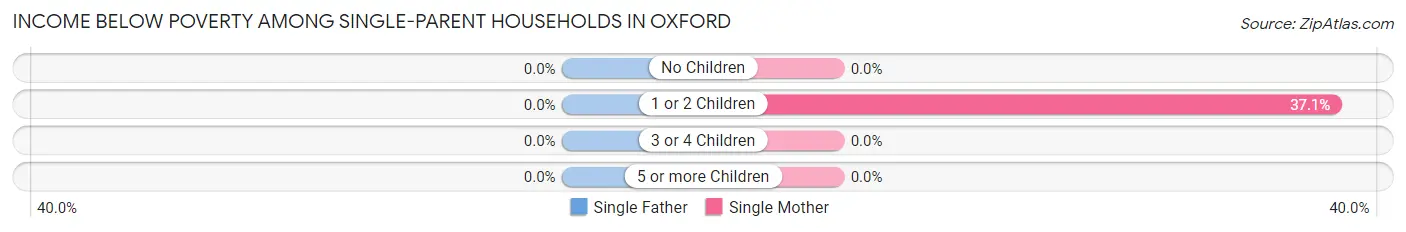
| Children | Single Father | Single Mother |
| No Children | 0 (0.0%) | 0 (0.0%) |
| 1 or 2 Children | 0 (0.0%) | 13 (37.1%) |
| 3 or 4 Children | 0 (0.0%) | 0 (0.0%) |
| 5 or more Children | 0 (0.0%) | 0 (0.0%) |
| Total | 0 (0.0%) | 13 (36.1%) |
Income Below Poverty Among Married-Couple vs Single-Parent Households in Oxford
The poverty data for Oxford shows that 3 of the married-couple family households (1.2%) and 13 of the single-parent households (36.1%) are living below the poverty level. Within the married-couple family households, those with no children have the highest poverty rate, with 3 households (1.3%) falling below the poverty line. Among the single-parent households, those with 1 or 2 children have the highest poverty rate, with 13 household (37.1%) living below poverty.
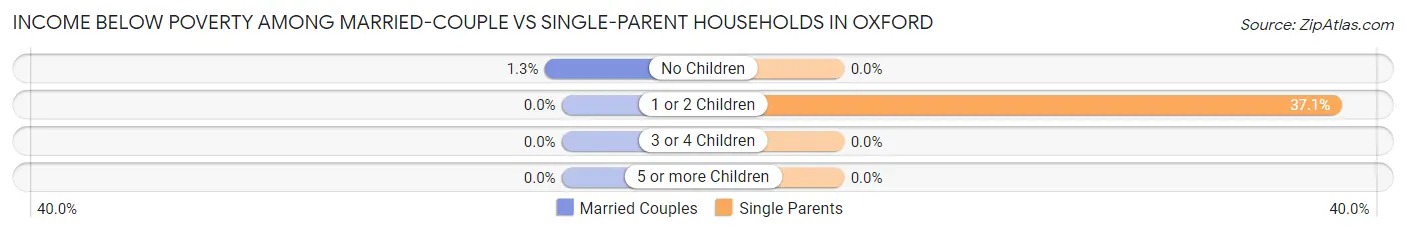
| Children | Married-Couple Families | Single-Parent Households |
| No Children | 3 (1.3%) | 0 (0.0%) |
| 1 or 2 Children | 0 (0.0%) | 13 (37.1%) |
| 3 or 4 Children | 0 (0.0%) | 0 (0.0%) |
| 5 or more Children | 0 (0.0%) | 0 (0.0%) |
| Total | 3 (1.2%) | 13 (36.1%) |
Employment Characteristics in Oxford
Employment by Class of Employer in Oxford
Among the 269 employed individuals in Oxford, private company employees (160 | 59.5%), self-employed (not incorporated) (40 | 14.9%), and self-employed (incorporated) (22 | 8.2%) make up the most common classes of employment.
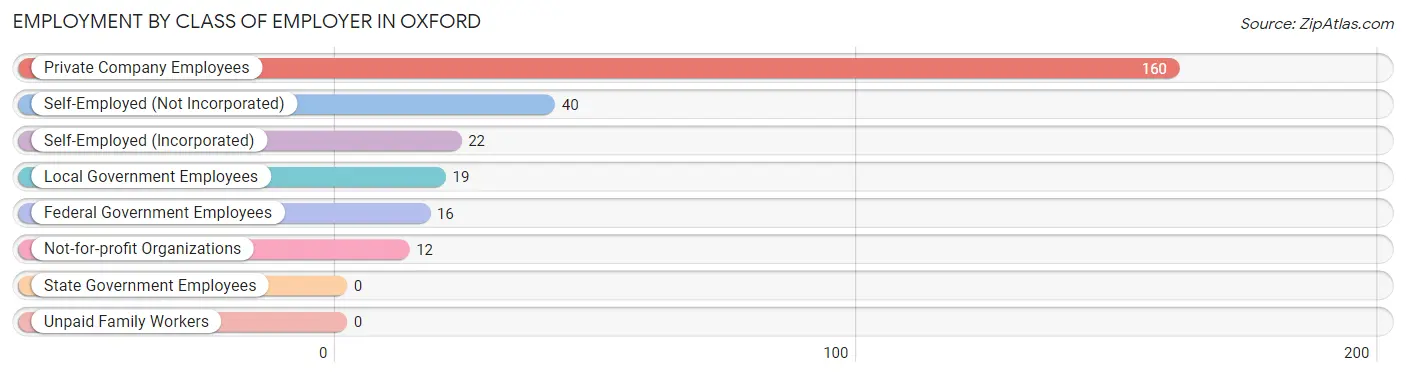
| Employer Class | # Employees | % Employees |
| Private Company Employees | 160 | 59.5% |
| Self-Employed (Incorporated) | 22 | 8.2% |
| Self-Employed (Not Incorporated) | 40 | 14.9% |
| Not-for-profit Organizations | 12 | 4.5% |
| Local Government Employees | 19 | 7.1% |
| State Government Employees | 0 | 0.0% |
| Federal Government Employees | 16 | 5.9% |
| Unpaid Family Workers | 0 | 0.0% |
| Total | 269 | 100.0% |
Employment Status by Age in Oxford
According to the labor force statistics for Oxford, out of the total population over 16 years of age (773), 40.6% or 314 individuals are in the labor force, with 14.0% or 44 of them unemployed. The age group with the highest labor force participation rate is 20 to 24 years, with 100.0% or 11 individuals in the labor force. Within the labor force, the 55 to 59 years age range has the highest percentage of unemployed individuals, with 28.9% or 22 of them being unemployed.
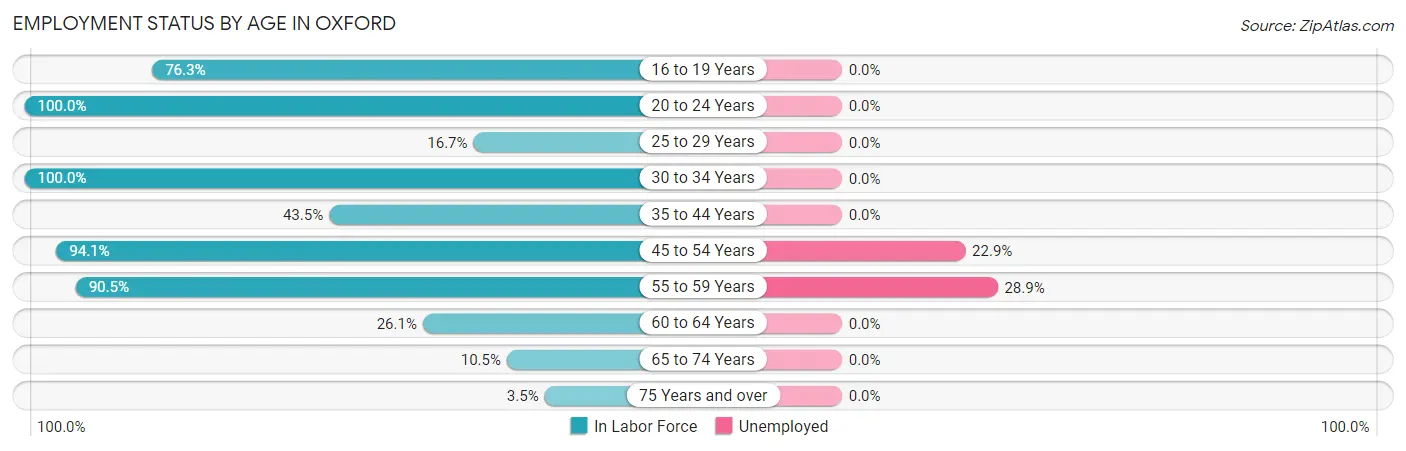
| Age Bracket | In Labor Force | Unemployed |
| 16 to 19 Years | 61 (76.3%) | 0 (0.0%) |
| 20 to 24 Years | 11 (100.0%) | 0 (0.0%) |
| 25 to 29 Years | 1 (16.7%) | 0 (0.0%) |
| 30 to 34 Years | 6 (100.0%) | 0 (0.0%) |
| 35 to 44 Years | 10 (43.5%) | 0 (0.0%) |
| 45 to 54 Years | 96 (94.1%) | 22 (22.9%) |
| 55 to 59 Years | 76 (90.5%) | 22 (28.9%) |
| 60 to 64 Years | 18 (26.1%) | 0 (0.0%) |
| 65 to 74 Years | 32 (10.5%) | 0 (0.0%) |
| 75 Years and over | 3 (3.5%) | 0 (0.0%) |
| Total | 314 (40.6%) | 44 (14.0%) |
Employment Status by Educational Attainment in Oxford
According to labor force statistics for Oxford, 71.4% of individuals (207) out of the total population between 25 and 64 years of age (290) are in the labor force, with 21.3% or 44 of them being unemployed. The group with the highest labor force participation rate are those with the educational attainment of college / associate degree, with 86.6% or 71 individuals in the labor force. Within the labor force, individuals with college / associate degree education have the highest percentage of unemployment, with 31.0% or 22 of them being unemployed.
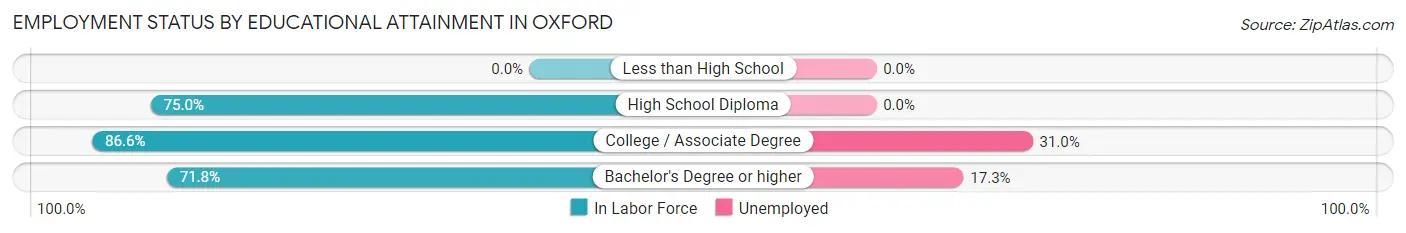
| Educational Attainment | In Labor Force | Unemployed |
| Less than High School | 0 (0.0%) | 0 (0.0%) |
| High School Diploma | 9 (75.0%) | 0 (0.0%) |
| College / Associate Degree | 71 (86.6%) | 25 (31.0%) |
| Bachelor's Degree or higher | 127 (71.8%) | 31 (17.3%) |
| Total | 207 (71.4%) | 62 (21.3%) |
Employment Occupations by Sex in Oxford
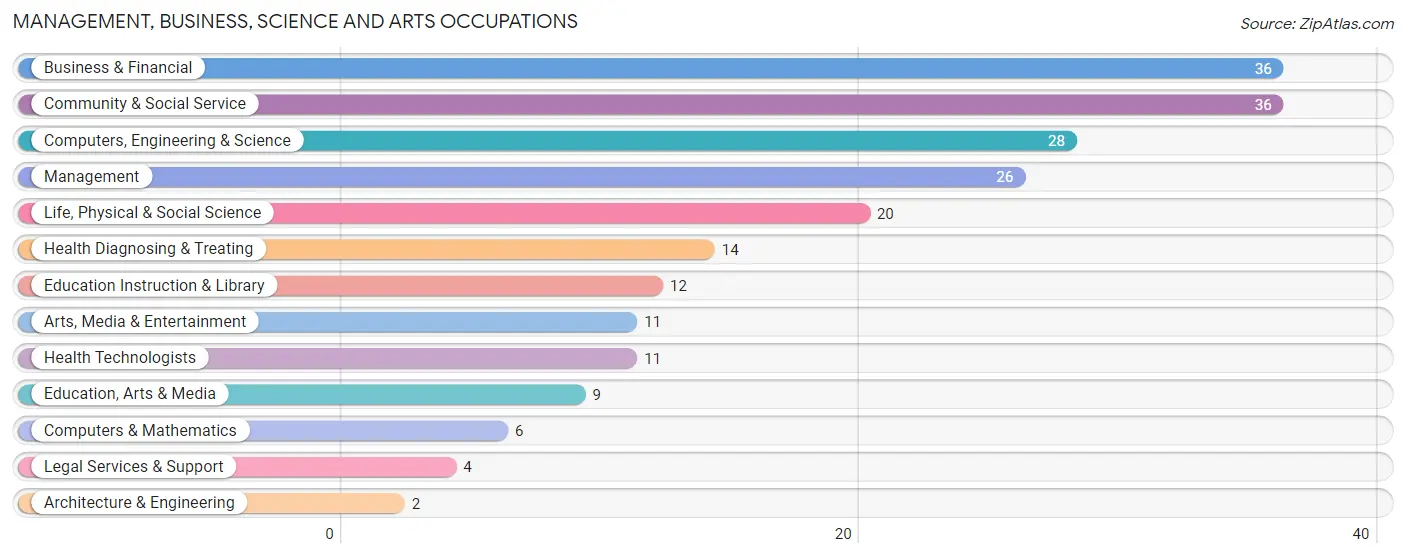
Management, Business, Science and Arts Occupations
The most common Management, Business, Science and Arts occupations in Oxford are Business & Financial (36 | 13.3%), Community & Social Service (36 | 13.3%), Computers, Engineering & Science (28 | 10.4%), Management (26 | 9.6%), and Life, Physical & Social Science (20 | 7.4%).
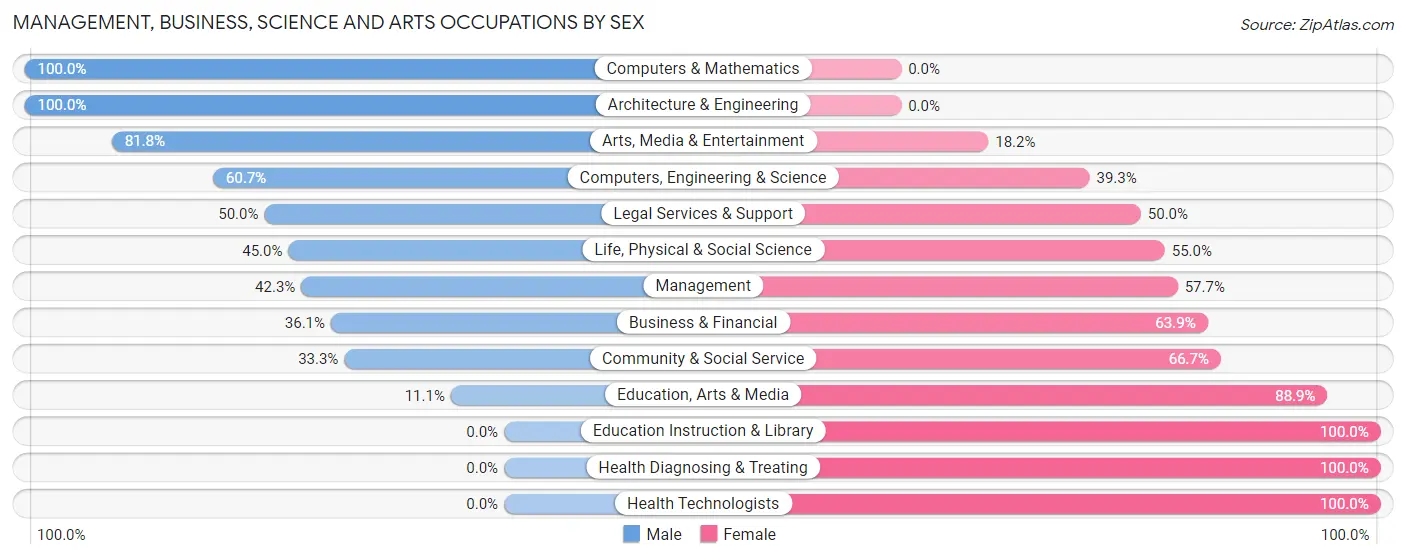
Management, Business, Science and Arts Occupations by Sex
Within the Management, Business, Science and Arts occupations in Oxford, the most male-oriented occupations are Computers & Mathematics (100.0%), Architecture & Engineering (100.0%), and Arts, Media & Entertainment (81.8%), while the most female-oriented occupations are Education Instruction & Library (100.0%), Health Diagnosing & Treating (100.0%), and Health Technologists (100.0%).
| Occupation | Male | Female |
| Management | 11 (42.3%) | 15 (57.7%) |
| Business & Financial | 13 (36.1%) | 23 (63.9%) |
| Computers, Engineering & Science | 17 (60.7%) | 11 (39.3%) |
| Computers & Mathematics | 6 (100.0%) | 0 (0.0%) |
| Architecture & Engineering | 2 (100.0%) | 0 (0.0%) |
| Life, Physical & Social Science | 9 (45.0%) | 11 (55.0%) |
| Community & Social Service | 12 (33.3%) | 24 (66.7%) |
| Education, Arts & Media | 1 (11.1%) | 8 (88.9%) |
| Legal Services & Support | 2 (50.0%) | 2 (50.0%) |
| Education Instruction & Library | 0 (0.0%) | 12 (100.0%) |
| Arts, Media & Entertainment | 9 (81.8%) | 2 (18.2%) |
| Health Diagnosing & Treating | 0 (0.0%) | 14 (100.0%) |
| Health Technologists | 0 (0.0%) | 11 (100.0%) |
| Total (Category) | 53 (37.9%) | 87 (62.1%) |
| Total (Overall) | 158 (58.5%) | 112 (41.5%) |
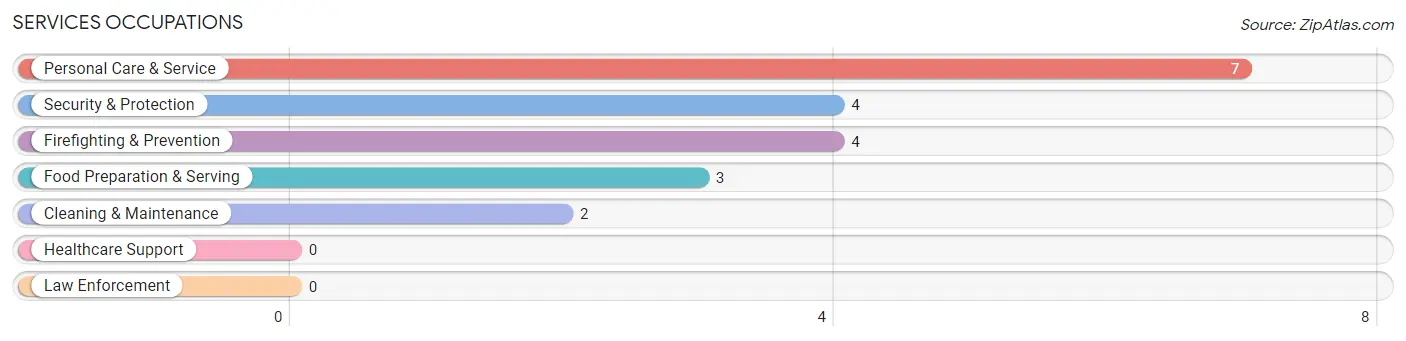
Services Occupations
The most common Services occupations in Oxford are Personal Care & Service (7 | 2.6%), Security & Protection (4 | 1.5%), Firefighting & Prevention (4 | 1.5%), Food Preparation & Serving (3 | 1.1%), and Cleaning & Maintenance (2 | 0.7%).
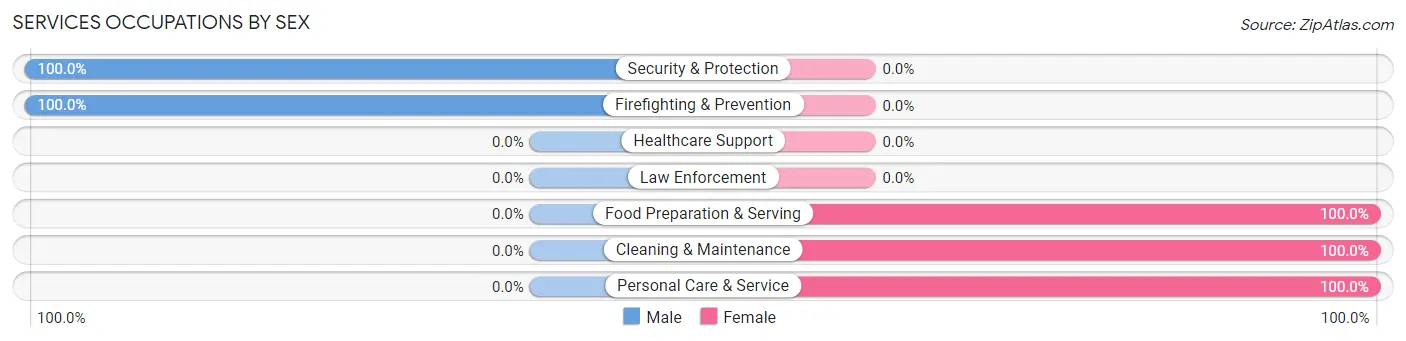
Services Occupations by Sex
Within the Services occupations in Oxford, the most male-oriented occupations are Security & Protection (100.0%), and Firefighting & Prevention (100.0%), while the most female-oriented occupations are Food Preparation & Serving (100.0%), Cleaning & Maintenance (100.0%), and Personal Care & Service (100.0%).
| Occupation | Male | Female |
| Healthcare Support | 0 (0.0%) | 0 (0.0%) |
| Security & Protection | 4 (100.0%) | 0 (0.0%) |
| Firefighting & Prevention | 4 (100.0%) | 0 (0.0%) |
| Law Enforcement | 0 (0.0%) | 0 (0.0%) |
| Food Preparation & Serving | 0 (0.0%) | 3 (100.0%) |
| Cleaning & Maintenance | 0 (0.0%) | 2 (100.0%) |
| Personal Care & Service | 0 (0.0%) | 7 (100.0%) |
| Total (Category) | 4 (25.0%) | 12 (75.0%) |
| Total (Overall) | 158 (58.5%) | 112 (41.5%) |
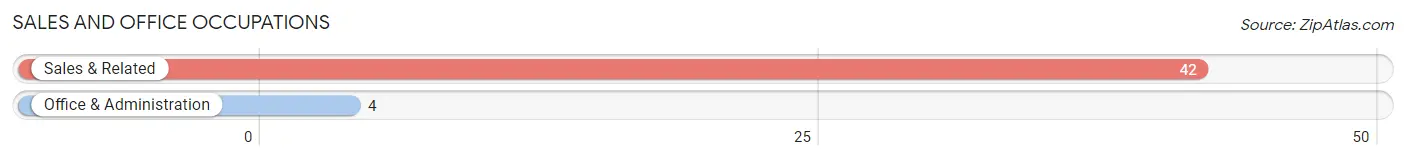
Sales and Office Occupations
The most common Sales and Office occupations in Oxford are Sales & Related (42 | 15.6%), and Office & Administration (4 | 1.5%).
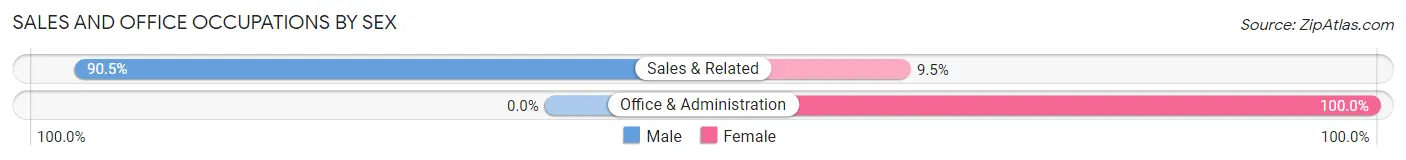
Sales and Office Occupations by Sex
| Occupation | Male | Female |
| Sales & Related | 38 (90.5%) | 4 (9.5%) |
| Office & Administration | 0 (0.0%) | 4 (100.0%) |
| Total (Category) | 38 (82.6%) | 8 (17.4%) |
| Total (Overall) | 158 (58.5%) | 112 (41.5%) |
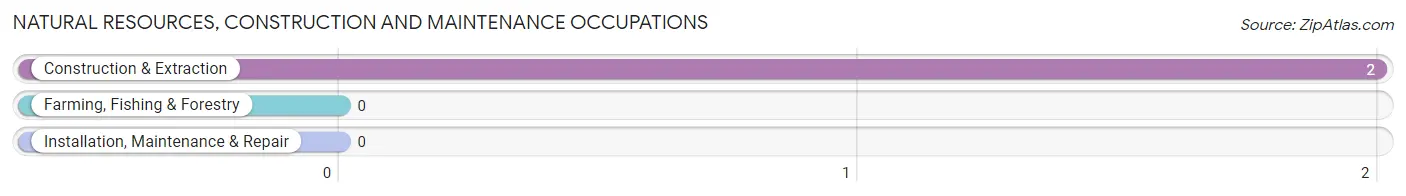
Natural Resources, Construction and Maintenance Occupations
The most common Natural Resources, Construction and Maintenance occupations in Oxford are , and Construction & Extraction (2 | 0.7%).
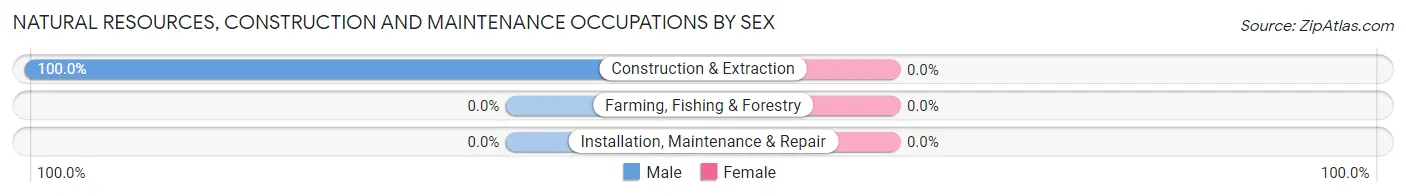
Natural Resources, Construction and Maintenance Occupations by Sex
| Occupation | Male | Female |
| Farming, Fishing & Forestry | 0 (0.0%) | 0 (0.0%) |
| Construction & Extraction | 2 (100.0%) | 0 (0.0%) |
| Installation, Maintenance & Repair | 0 (0.0%) | 0 (0.0%) |
| Total (Category) | 2 (100.0%) | 0 (0.0%) |
| Total (Overall) | 158 (58.5%) | 112 (41.5%) |
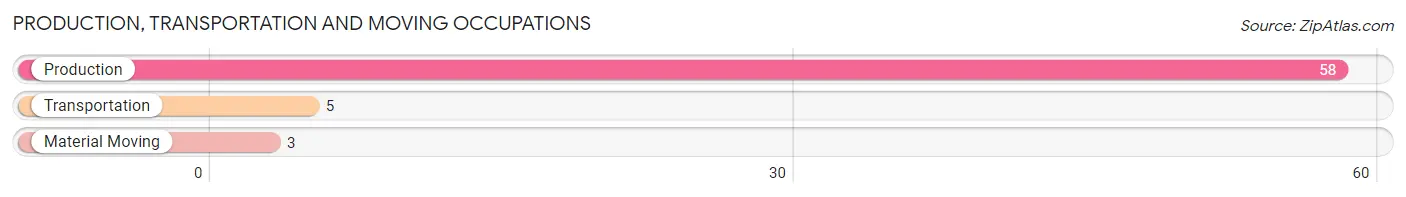
Production, Transportation and Moving Occupations
The most common Production, Transportation and Moving occupations in Oxford are Production (58 | 21.5%), Transportation (5 | 1.8%), and Material Moving (3 | 1.1%).
Production, Transportation and Moving Occupations by Sex
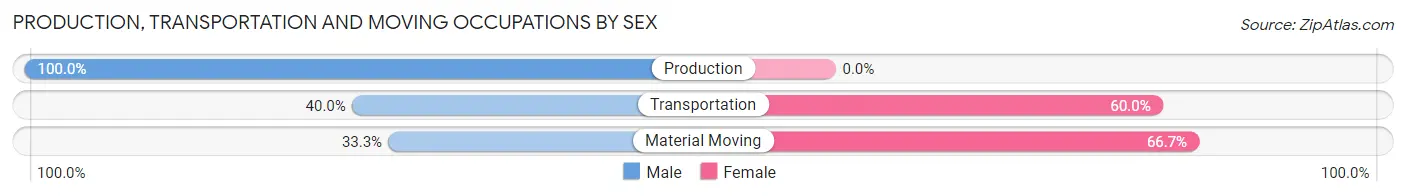
| Occupation | Male | Female |
| Production | 58 (100.0%) | 0 (0.0%) |
| Transportation | 2 (40.0%) | 3 (60.0%) |
| Material Moving | 1 (33.3%) | 2 (66.7%) |
| Total (Category) | 61 (92.4%) | 5 (7.6%) |
| Total (Overall) | 158 (58.5%) | 112 (41.5%) |
Employment Industries by Sex in Oxford
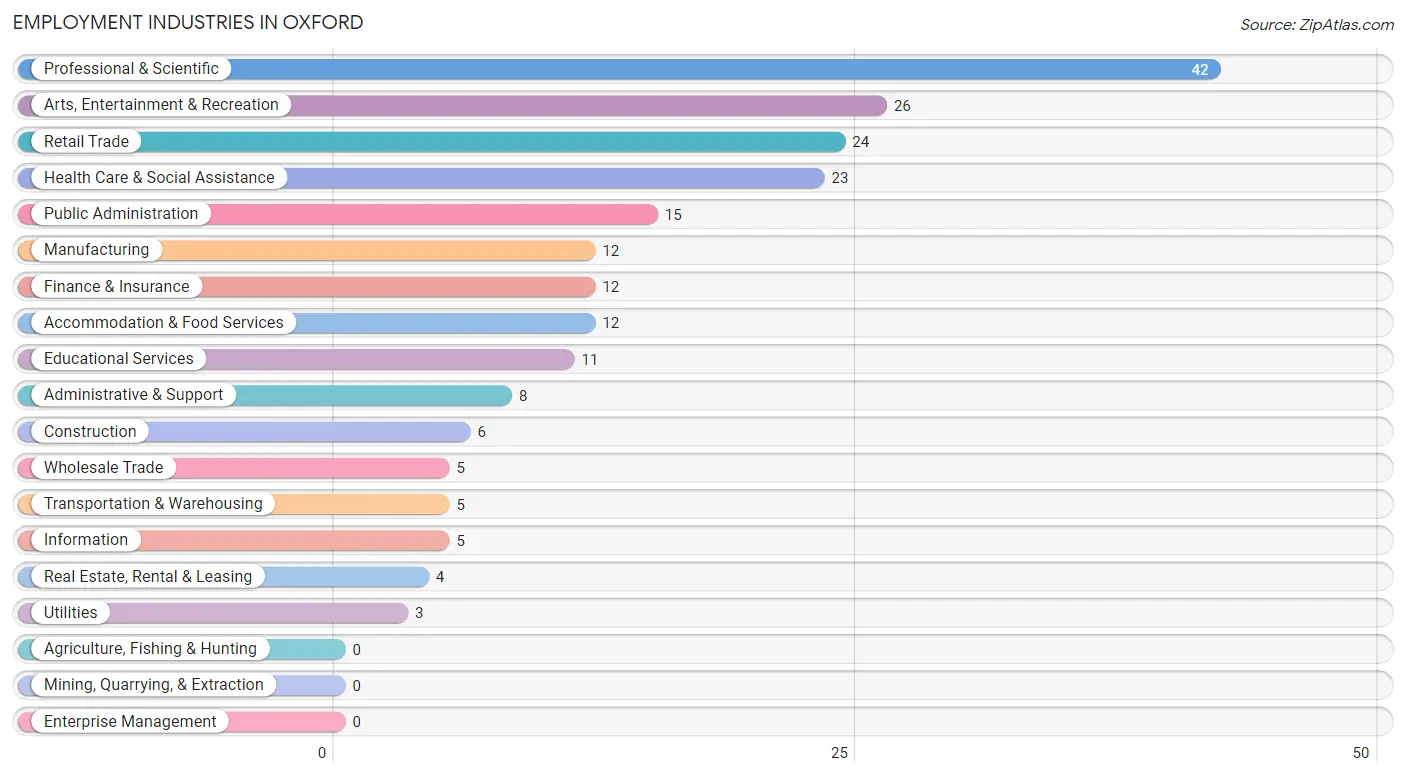
Employment Industries in Oxford
The major employment industries in Oxford include Professional & Scientific (42 | 15.6%), Arts, Entertainment & Recreation (26 | 9.6%), Retail Trade (24 | 8.9%), Health Care & Social Assistance (23 | 8.5%), and Public Administration (15 | 5.6%).
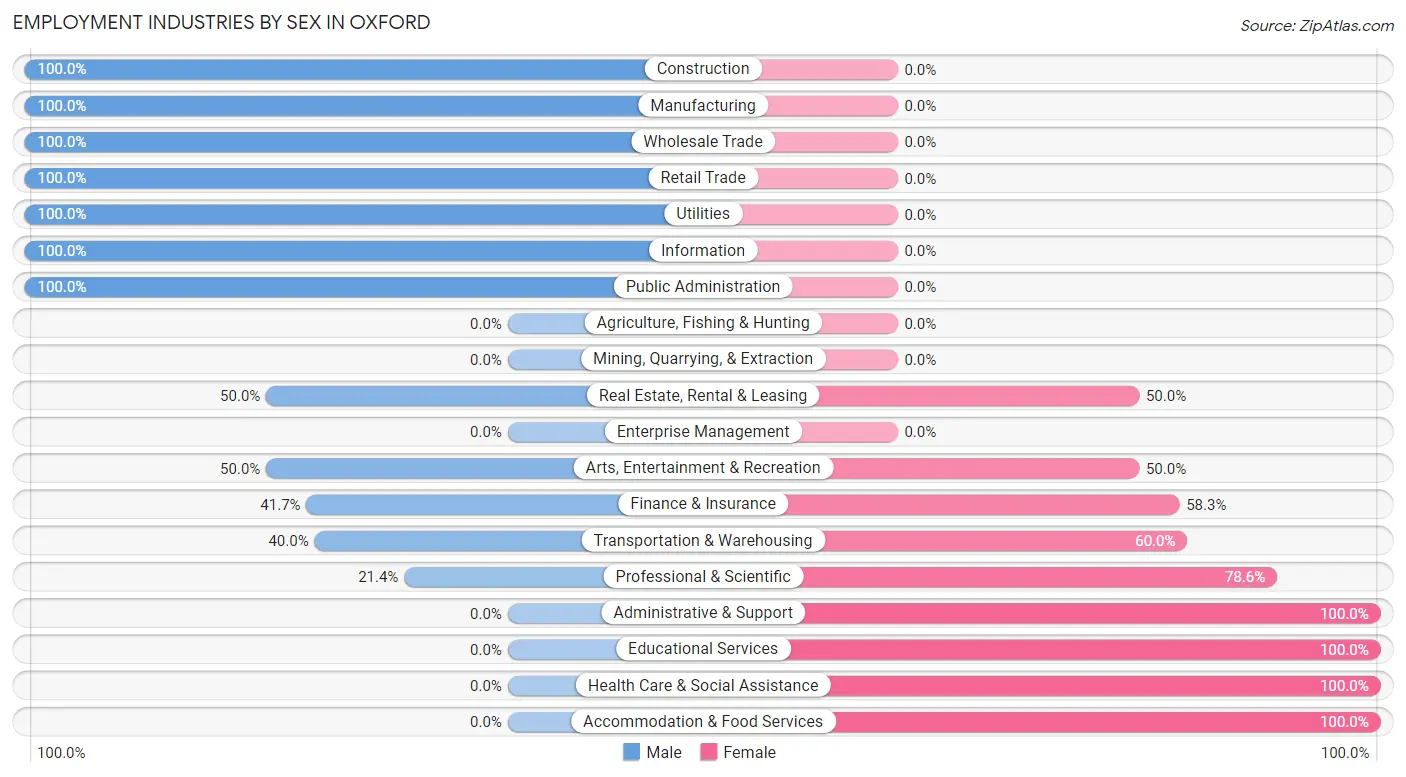
Employment Industries by Sex in Oxford
The Oxford industries that see more men than women are Construction (100.0%), Manufacturing (100.0%), and Wholesale Trade (100.0%), whereas the industries that tend to have a higher number of women are Administrative & Support (100.0%), Educational Services (100.0%), and Health Care & Social Assistance (100.0%).
| Industry | Male | Female |
| Agriculture, Fishing & Hunting | 0 (0.0%) | 0 (0.0%) |
| Mining, Quarrying, & Extraction | 0 (0.0%) | 0 (0.0%) |
| Construction | 6 (100.0%) | 0 (0.0%) |
| Manufacturing | 12 (100.0%) | 0 (0.0%) |
| Wholesale Trade | 5 (100.0%) | 0 (0.0%) |
| Retail Trade | 24 (100.0%) | 0 (0.0%) |
| Transportation & Warehousing | 2 (40.0%) | 3 (60.0%) |
| Utilities | 3 (100.0%) | 0 (0.0%) |
| Information | 5 (100.0%) | 0 (0.0%) |
| Finance & Insurance | 5 (41.7%) | 7 (58.3%) |
| Real Estate, Rental & Leasing | 2 (50.0%) | 2 (50.0%) |
| Professional & Scientific | 9 (21.4%) | 33 (78.6%) |
| Enterprise Management | 0 (0.0%) | 0 (0.0%) |
| Administrative & Support | 0 (0.0%) | 8 (100.0%) |
| Educational Services | 0 (0.0%) | 11 (100.0%) |
| Health Care & Social Assistance | 0 (0.0%) | 23 (100.0%) |
| Arts, Entertainment & Recreation | 13 (50.0%) | 13 (50.0%) |
| Accommodation & Food Services | 0 (0.0%) | 12 (100.0%) |
| Public Administration | 15 (100.0%) | 0 (0.0%) |
| Total | 158 (58.5%) | 112 (41.5%) |
Education in Oxford
School Enrollment in Oxford
The most common levels of schooling among the 83 students in Oxford are high school (43 | 51.8%), graduate / professional (24 | 28.9%), and middle school (9 | 10.8%).
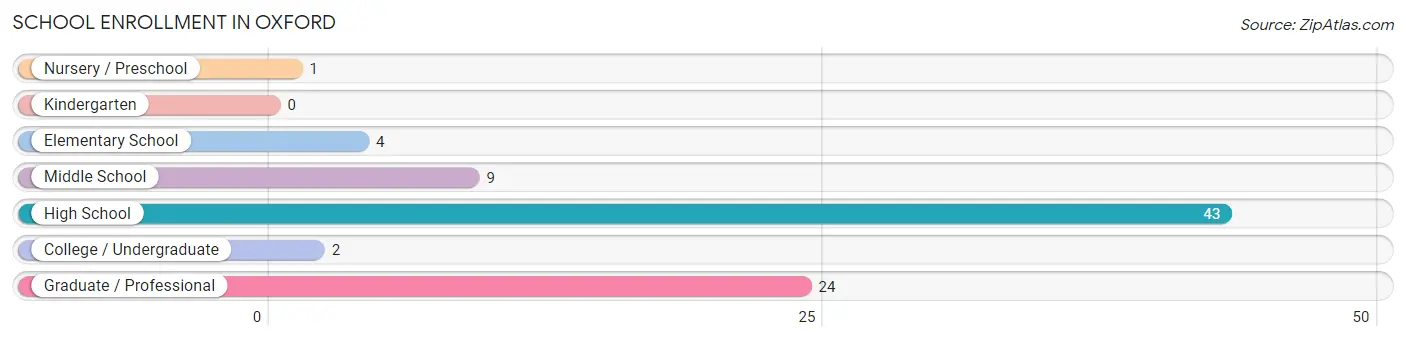
| School Level | # Students | % Students |
| Nursery / Preschool | 1 | 1.2% |
| Kindergarten | 0 | 0.0% |
| Elementary School | 4 | 4.8% |
| Middle School | 9 | 10.8% |
| High School | 43 | 51.8% |
| College / Undergraduate | 2 | 2.4% |
| Graduate / Professional | 24 | 28.9% |
| Total | 83 | 100.0% |
School Enrollment by Age by Funding Source in Oxford
Out of a total of 83 students who are enrolled in schools in Oxford, 28 (33.7%) attend a private institution, while the remaining 55 (66.3%) are enrolled in public schools. The age group of 15 to 17 year olds has the highest likelihood of being enrolled in private schools, with 16 (88.9% in the age bracket) enrolled. Conversely, the age group of 3 to 4 year olds has the lowest likelihood of being enrolled in a private school, with 1 (100.0% in the age bracket) attending a public institution.
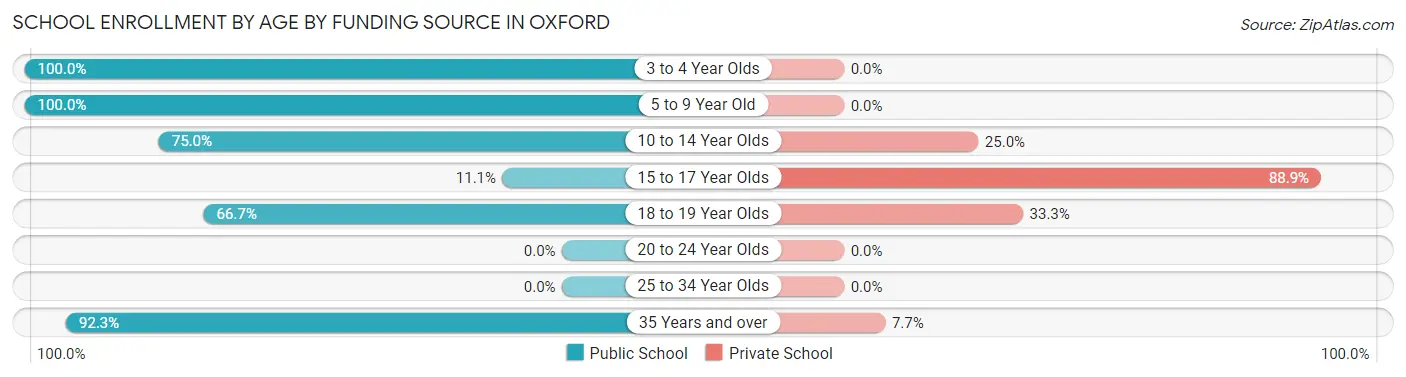
| Age Bracket | Public School | Private School |
| 3 to 4 Year Olds | 1 (100.0%) | 0 (0.0%) |
| 5 to 9 Year Old | 2 (100.0%) | 0 (0.0%) |
| 10 to 14 Year Olds | 18 (75.0%) | 6 (25.0%) |
| 15 to 17 Year Olds | 2 (11.1%) | 16 (88.9%) |
| 18 to 19 Year Olds | 8 (66.7%) | 4 (33.3%) |
| 20 to 24 Year Olds | 0 (0.0%) | 0 (0.0%) |
| 25 to 34 Year Olds | 0 (0.0%) | 0 (0.0%) |
| 35 Years and over | 24 (92.3%) | 2 (7.7%) |
| Total | 55 (66.3%) | 28 (33.7%) |
Educational Attainment by Field of Study in Oxford
Liberal arts & history (81 | 17.8%), psychology (70 | 15.3%), social sciences (70 | 15.3%), business (64 | 14.0%), and bio, nature & agricultural (29 | 6.4%) are the most common fields of study among 456 individuals in Oxford who have obtained a bachelor's degree or higher.
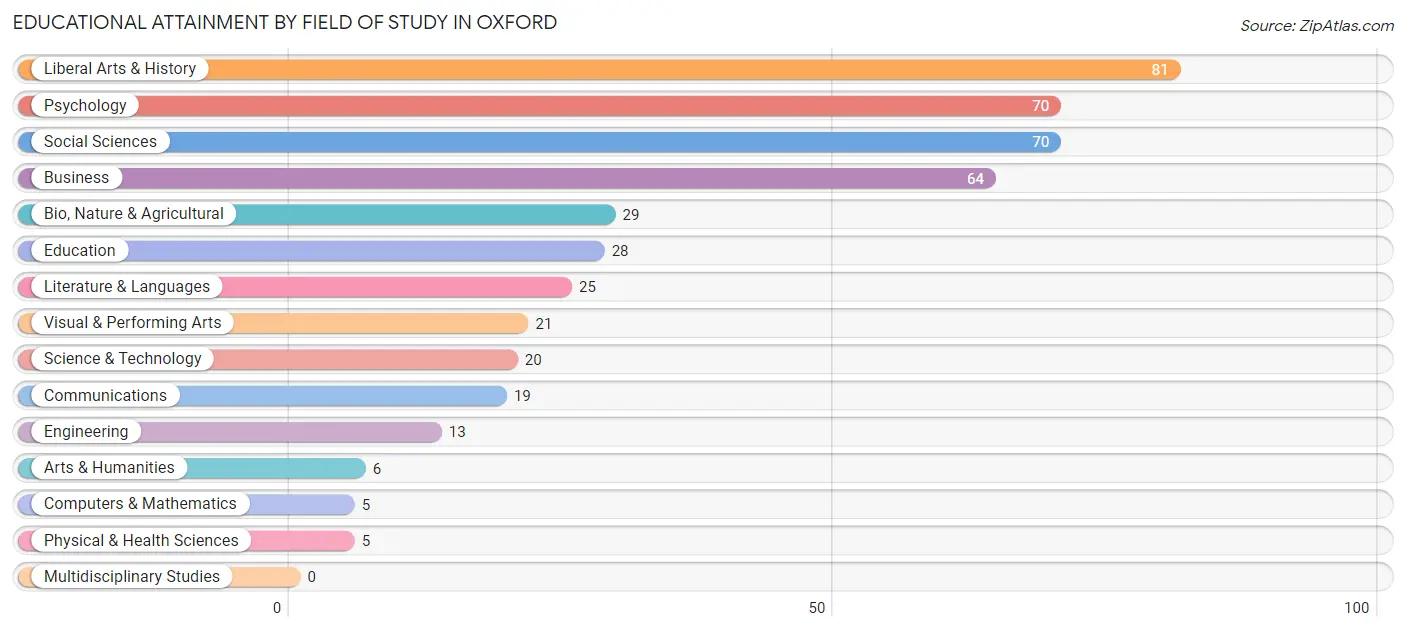
| Field of Study | # Graduates | % Graduates |
| Computers & Mathematics | 5 | 1.1% |
| Bio, Nature & Agricultural | 29 | 6.4% |
| Physical & Health Sciences | 5 | 1.1% |
| Psychology | 70 | 15.3% |
| Social Sciences | 70 | 15.3% |
| Engineering | 13 | 2.9% |
| Multidisciplinary Studies | 0 | 0.0% |
| Science & Technology | 20 | 4.4% |
| Business | 64 | 14.0% |
| Education | 28 | 6.1% |
| Literature & Languages | 25 | 5.5% |
| Liberal Arts & History | 81 | 17.8% |
| Visual & Performing Arts | 21 | 4.6% |
| Communications | 19 | 4.2% |
| Arts & Humanities | 6 | 1.3% |
| Total | 456 | 100.0% |
Transportation & Commute in Oxford
Vehicle Availability by Sex in Oxford
The most prevalent vehicle ownership categories in Oxford are males with 1 vehicle (89, accounting for 56.3%) and females with 1 vehicle (31, making up 80.2%).
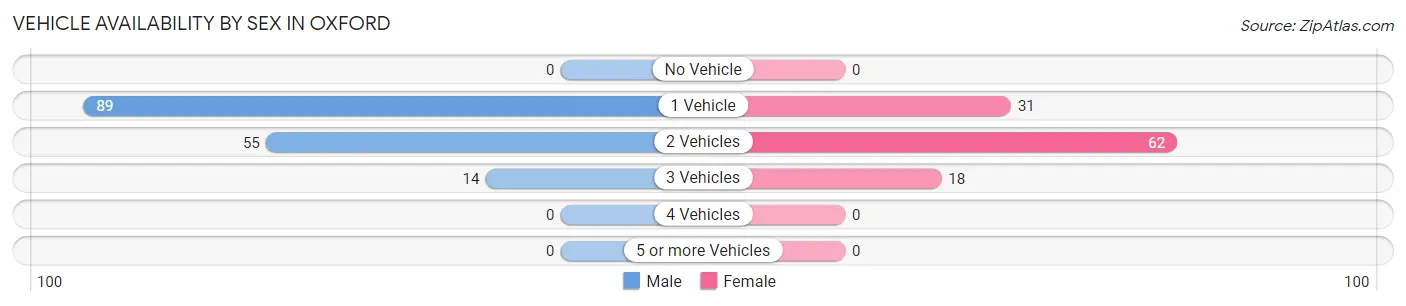
| Vehicles Available | Male | Female |
| No Vehicle | 0 (0.0%) | 0 (0.0%) |
| 1 Vehicle | 89 (56.3%) | 31 (27.9%) |
| 2 Vehicles | 55 (34.8%) | 62 (55.9%) |
| 3 Vehicles | 14 (8.9%) | 18 (16.2%) |
| 4 Vehicles | 0 (0.0%) | 0 (0.0%) |
| 5 or more Vehicles | 0 (0.0%) | 0 (0.0%) |
| Total | 158 (100.0%) | 111 (100.0%) |
Commute Time in Oxford
The most frequently occuring commute durations in Oxford are 90 or more minutes (86 commuters, 41.3%), 20 to 24 minutes (23 commuters, 11.1%), and less than 5 minutes (22 commuters, 10.6%).
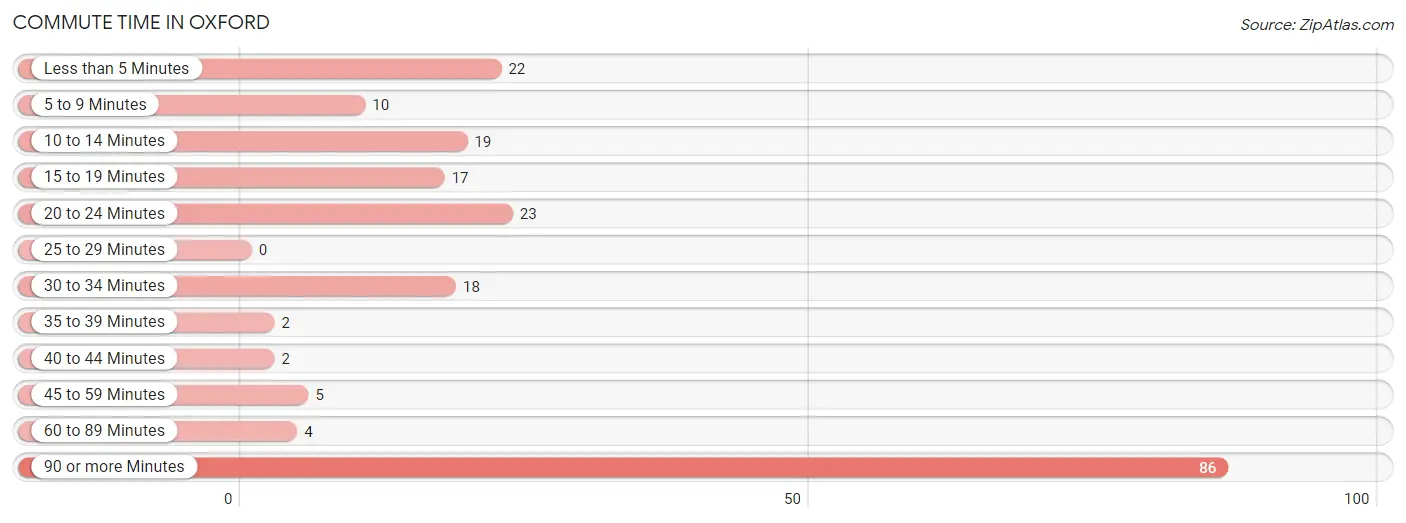
| Commute Time | # Commuters | % Commuters |
| Less than 5 Minutes | 22 | 10.6% |
| 5 to 9 Minutes | 10 | 4.8% |
| 10 to 14 Minutes | 19 | 9.1% |
| 15 to 19 Minutes | 17 | 8.2% |
| 20 to 24 Minutes | 23 | 11.1% |
| 25 to 29 Minutes | 0 | 0.0% |
| 30 to 34 Minutes | 18 | 8.6% |
| 35 to 39 Minutes | 2 | 1.0% |
| 40 to 44 Minutes | 2 | 1.0% |
| 45 to 59 Minutes | 5 | 2.4% |
| 60 to 89 Minutes | 4 | 1.9% |
| 90 or more Minutes | 86 | 41.3% |
Commute Time by Sex in Oxford
The most common commute times in Oxford are 90 or more minutes (83 commuters, 57.6%) for males and 20 to 24 minutes (17 commuters, 26.6%) for females.
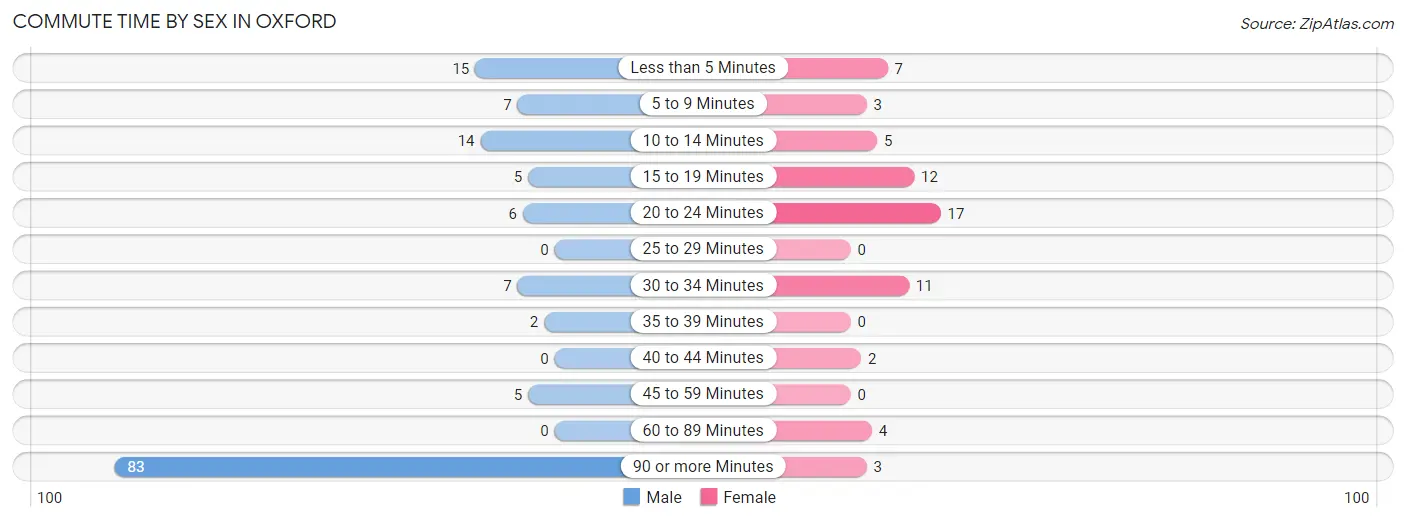
| Commute Time | Male | Female |
| Less than 5 Minutes | 15 (10.4%) | 7 (10.9%) |
| 5 to 9 Minutes | 7 (4.9%) | 3 (4.7%) |
| 10 to 14 Minutes | 14 (9.7%) | 5 (7.8%) |
| 15 to 19 Minutes | 5 (3.5%) | 12 (18.8%) |
| 20 to 24 Minutes | 6 (4.2%) | 17 (26.6%) |
| 25 to 29 Minutes | 0 (0.0%) | 0 (0.0%) |
| 30 to 34 Minutes | 7 (4.9%) | 11 (17.2%) |
| 35 to 39 Minutes | 2 (1.4%) | 0 (0.0%) |
| 40 to 44 Minutes | 0 (0.0%) | 2 (3.1%) |
| 45 to 59 Minutes | 5 (3.5%) | 0 (0.0%) |
| 60 to 89 Minutes | 0 (0.0%) | 4 (6.2%) |
| 90 or more Minutes | 83 (57.6%) | 3 (4.7%) |
Time of Departure to Work by Sex in Oxford
The most frequent times of departure to work in Oxford are 6:00 AM to 6:29 AM (88, 61.1%) for males and 6:30 AM to 6:59 AM (15, 23.4%) for females.
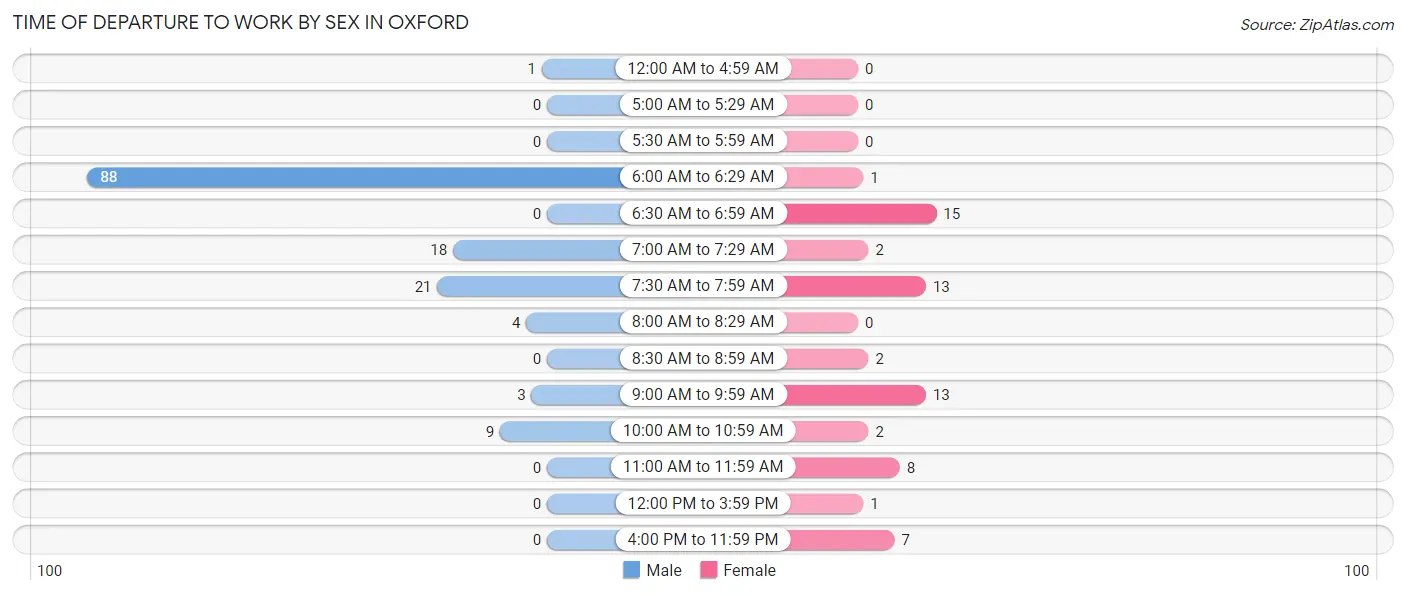
| Time of Departure | Male | Female |
| 12:00 AM to 4:59 AM | 1 (0.7%) | 0 (0.0%) |
| 5:00 AM to 5:29 AM | 0 (0.0%) | 0 (0.0%) |
| 5:30 AM to 5:59 AM | 0 (0.0%) | 0 (0.0%) |
| 6:00 AM to 6:29 AM | 88 (61.1%) | 1 (1.6%) |
| 6:30 AM to 6:59 AM | 0 (0.0%) | 15 (23.4%) |
| 7:00 AM to 7:29 AM | 18 (12.5%) | 2 (3.1%) |
| 7:30 AM to 7:59 AM | 21 (14.6%) | 13 (20.3%) |
| 8:00 AM to 8:29 AM | 4 (2.8%) | 0 (0.0%) |
| 8:30 AM to 8:59 AM | 0 (0.0%) | 2 (3.1%) |
| 9:00 AM to 9:59 AM | 3 (2.1%) | 13 (20.3%) |
| 10:00 AM to 10:59 AM | 9 (6.2%) | 2 (3.1%) |
| 11:00 AM to 11:59 AM | 0 (0.0%) | 8 (12.5%) |
| 12:00 PM to 3:59 PM | 0 (0.0%) | 1 (1.6%) |
| 4:00 PM to 11:59 PM | 0 (0.0%) | 7 (10.9%) |
| Total | 144 (100.0%) | 64 (100.0%) |
Housing Occupancy in Oxford
Occupancy by Ownership in Oxford
Of the total 426 dwellings in Oxford, owner-occupied units account for 363 (85.2%), while renter-occupied units make up 63 (14.8%).
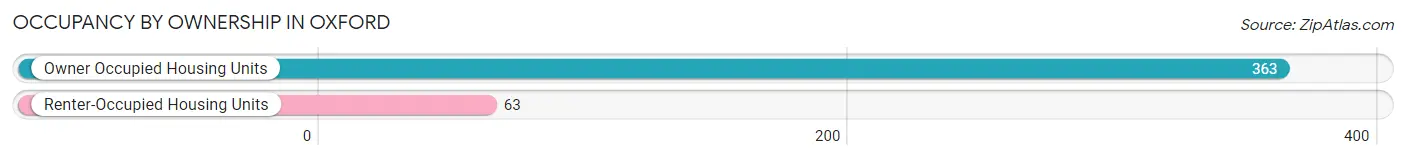
| Occupancy | # Housing Units | % Housing Units |
| Owner Occupied Housing Units | 363 | 85.2% |
| Renter-Occupied Housing Units | 63 | 14.8% |
| Total Occupied Housing Units | 426 | 100.0% |
Occupancy by Household Size in Oxford
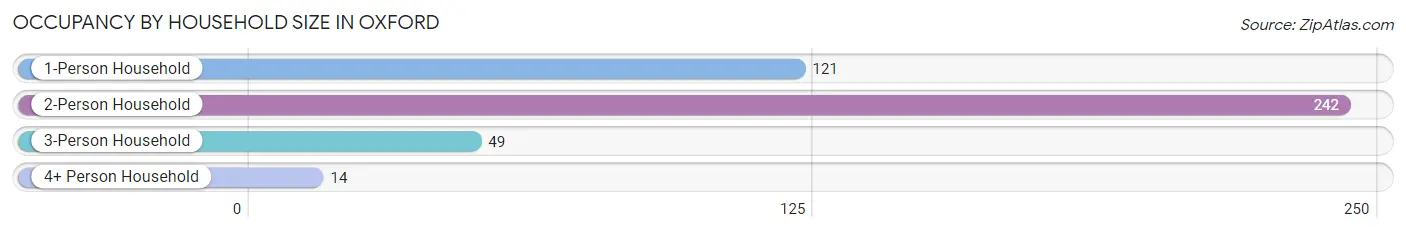
| Household Size | # Housing Units | % Housing Units |
| 1-Person Household | 121 | 28.4% |
| 2-Person Household | 242 | 56.8% |
| 3-Person Household | 49 | 11.5% |
| 4+ Person Household | 14 | 3.3% |
| Total Housing Units | 426 | 100.0% |
Occupancy by Ownership by Household Size in Oxford
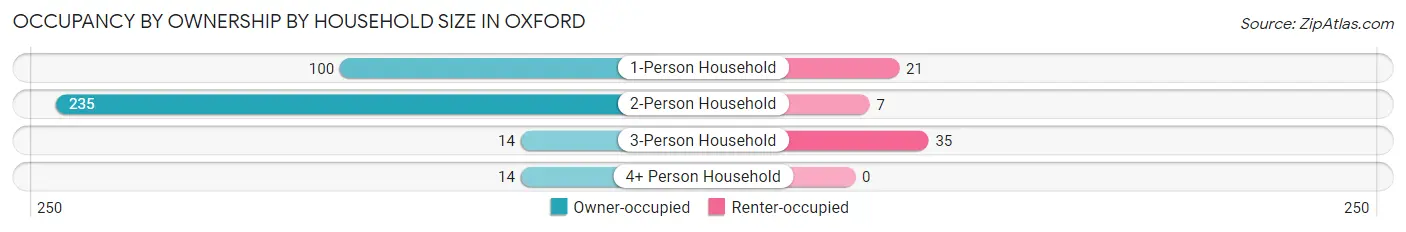
| Household Size | Owner-occupied | Renter-occupied |
| 1-Person Household | 100 (82.6%) | 21 (17.4%) |
| 2-Person Household | 235 (97.1%) | 7 (2.9%) |
| 3-Person Household | 14 (28.6%) | 35 (71.4%) |
| 4+ Person Household | 14 (100.0%) | 0 (0.0%) |
| Total Housing Units | 363 (85.2%) | 63 (14.8%) |
Occupancy by Educational Attainment in Oxford
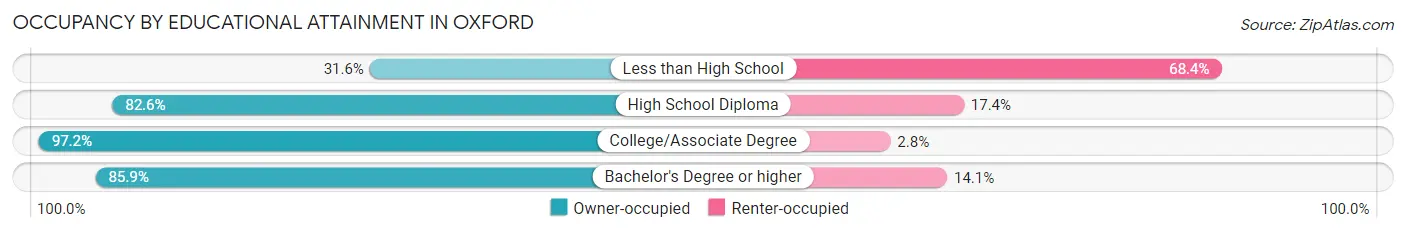
| Household Size | Owner-occupied | Renter-occupied |
| Less than High School | 6 (31.6%) | 13 (68.4%) |
| High School Diploma | 19 (82.6%) | 4 (17.4%) |
| College/Associate Degree | 69 (97.2%) | 2 (2.8%) |
| Bachelor's Degree or higher | 269 (85.9%) | 44 (14.1%) |
Occupancy by Age of Householder in Oxford
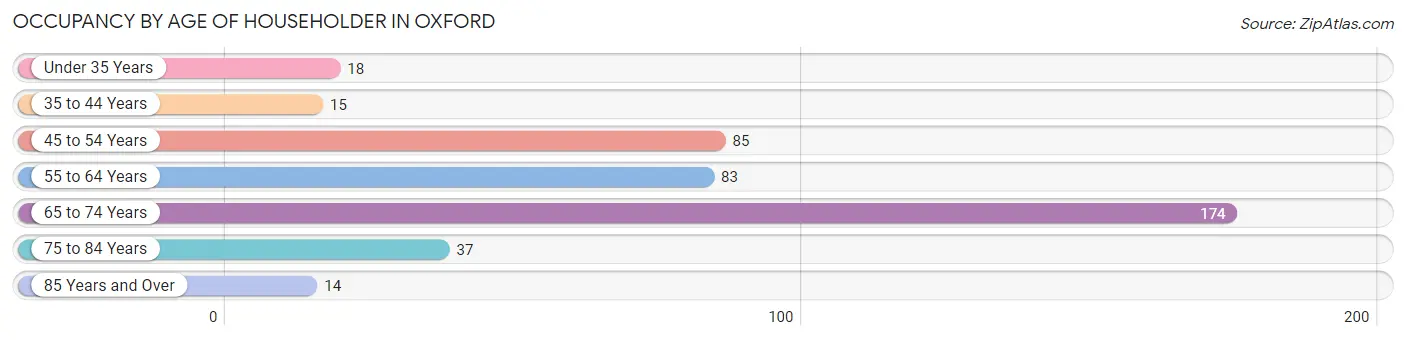
| Age Bracket | # Households | % Households |
| Under 35 Years | 18 | 4.2% |
| 35 to 44 Years | 15 | 3.5% |
| 45 to 54 Years | 85 | 20.0% |
| 55 to 64 Years | 83 | 19.5% |
| 65 to 74 Years | 174 | 40.8% |
| 75 to 84 Years | 37 | 8.7% |
| 85 Years and Over | 14 | 3.3% |
| Total | 426 | 100.0% |
Housing Finances in Oxford
Median Income by Occupancy in Oxford
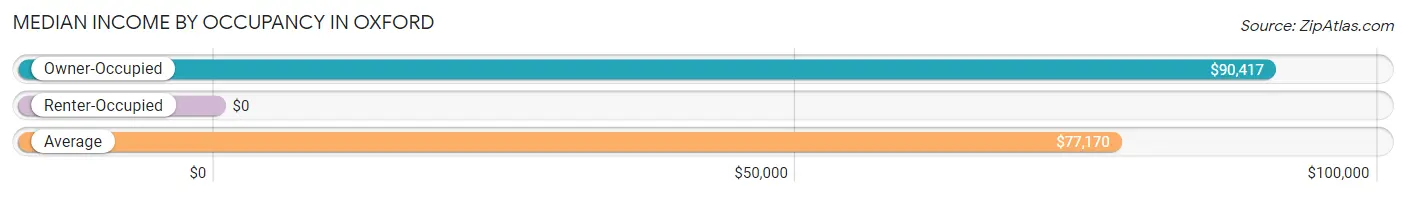
| Occupancy Type | # Households | Median Income |
| Owner-Occupied | 363 (85.2%) | $90,417 |
| Renter-Occupied | 63 (14.8%) | $0 |
| Average | 426 (100.0%) | $77,170 |
Occupancy by Householder Income Bracket in Oxford
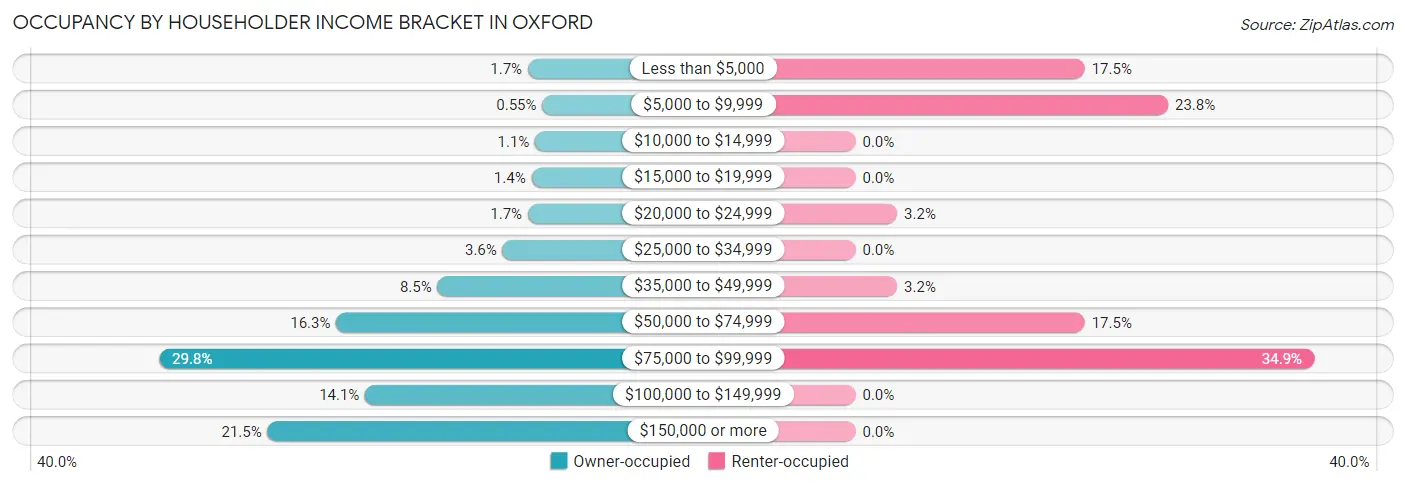
| Income Bracket | Owner-occupied | Renter-occupied |
| Less than $5,000 | 6 (1.7%) | 11 (17.5%) |
| $5,000 to $9,999 | 2 (0.5%) | 15 (23.8%) |
| $10,000 to $14,999 | 4 (1.1%) | 0 (0.0%) |
| $15,000 to $19,999 | 5 (1.4%) | 0 (0.0%) |
| $20,000 to $24,999 | 6 (1.7%) | 2 (3.2%) |
| $25,000 to $34,999 | 13 (3.6%) | 0 (0.0%) |
| $35,000 to $49,999 | 31 (8.5%) | 2 (3.2%) |
| $50,000 to $74,999 | 59 (16.3%) | 11 (17.5%) |
| $75,000 to $99,999 | 108 (29.7%) | 22 (34.9%) |
| $100,000 to $149,999 | 51 (14.1%) | 0 (0.0%) |
| $150,000 or more | 78 (21.5%) | 0 (0.0%) |
| Total | 363 (100.0%) | 63 (100.0%) |
Monthly Housing Cost Tiers in Oxford
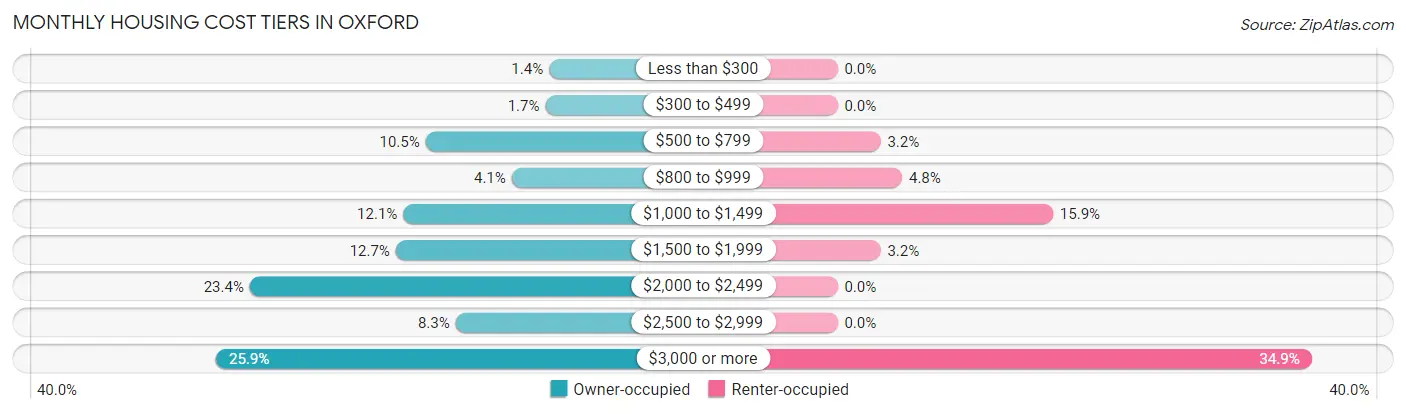
| Monthly Cost | Owner-occupied | Renter-occupied |
| Less than $300 | 5 (1.4%) | 0 (0.0%) |
| $300 to $499 | 6 (1.7%) | 0 (0.0%) |
| $500 to $799 | 38 (10.5%) | 2 (3.2%) |
| $800 to $999 | 15 (4.1%) | 3 (4.8%) |
| $1,000 to $1,499 | 44 (12.1%) | 10 (15.9%) |
| $1,500 to $1,999 | 46 (12.7%) | 2 (3.2%) |
| $2,000 to $2,499 | 85 (23.4%) | 0 (0.0%) |
| $2,500 to $2,999 | 30 (8.3%) | 0 (0.0%) |
| $3,000 or more | 94 (25.9%) | 22 (34.9%) |
| Total | 363 (100.0%) | 63 (100.0%) |
Physical Housing Characteristics in Oxford
Housing Structures in Oxford
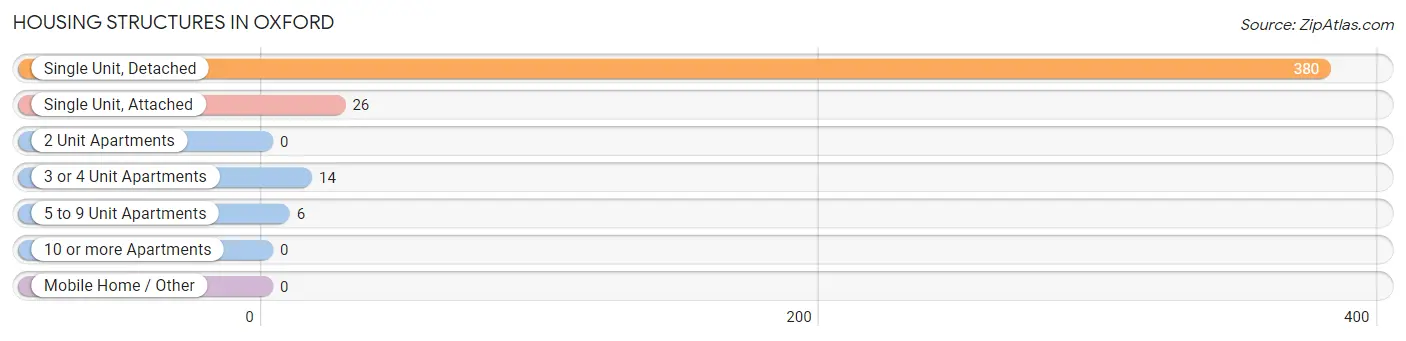
| Structure Type | # Housing Units | % Housing Units |
| Single Unit, Detached | 380 | 89.2% |
| Single Unit, Attached | 26 | 6.1% |
| 2 Unit Apartments | 0 | 0.0% |
| 3 or 4 Unit Apartments | 14 | 3.3% |
| 5 to 9 Unit Apartments | 6 | 1.4% |
| 10 or more Apartments | 0 | 0.0% |
| Mobile Home / Other | 0 | 0.0% |
| Total | 426 | 100.0% |
Housing Structures by Occupancy in Oxford
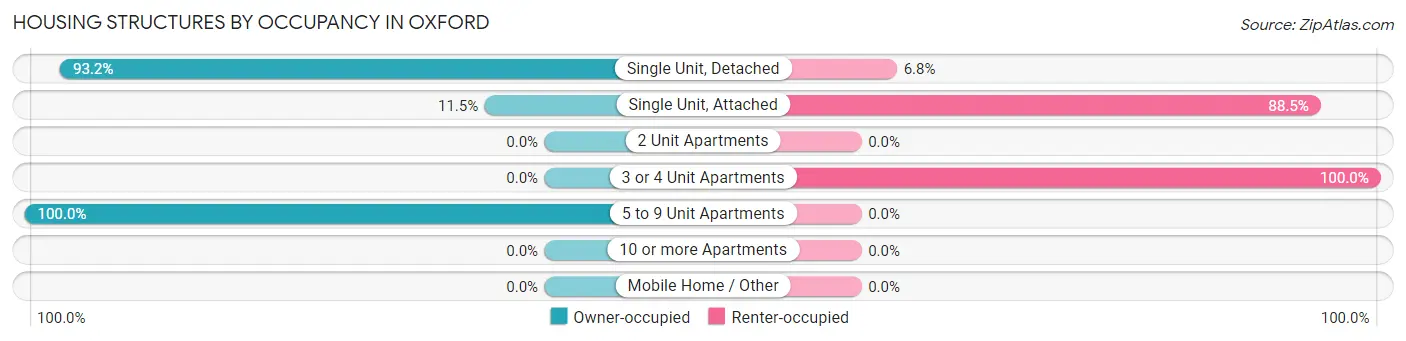
| Structure Type | Owner-occupied | Renter-occupied |
| Single Unit, Detached | 354 (93.2%) | 26 (6.8%) |
| Single Unit, Attached | 3 (11.5%) | 23 (88.5%) |
| 2 Unit Apartments | 0 (0.0%) | 0 (0.0%) |
| 3 or 4 Unit Apartments | 0 (0.0%) | 14 (100.0%) |
| 5 to 9 Unit Apartments | 6 (100.0%) | 0 (0.0%) |
| 10 or more Apartments | 0 (0.0%) | 0 (0.0%) |
| Mobile Home / Other | 0 (0.0%) | 0 (0.0%) |
| Total | 363 (85.2%) | 63 (14.8%) |
Housing Structures by Number of Rooms in Oxford
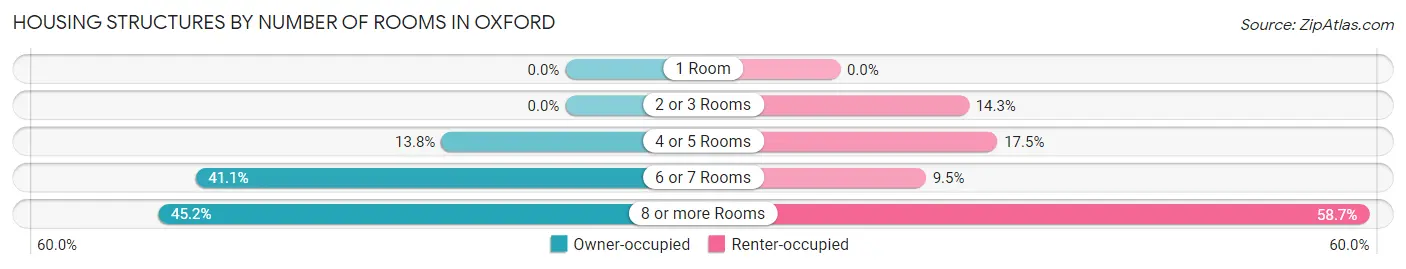
| Number of Rooms | Owner-occupied | Renter-occupied |
| 1 Room | 0 (0.0%) | 0 (0.0%) |
| 2 or 3 Rooms | 0 (0.0%) | 9 (14.3%) |
| 4 or 5 Rooms | 50 (13.8%) | 11 (17.5%) |
| 6 or 7 Rooms | 149 (41.0%) | 6 (9.5%) |
| 8 or more Rooms | 164 (45.2%) | 37 (58.7%) |
| Total | 363 (100.0%) | 63 (100.0%) |
Housing Structure by Heating Type in Oxford
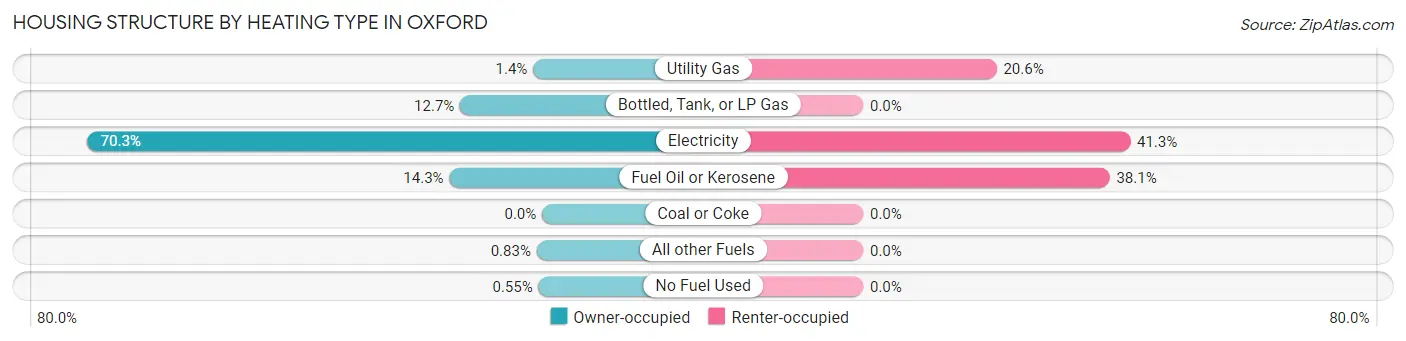
| Heating Type | Owner-occupied | Renter-occupied |
| Utility Gas | 5 (1.4%) | 13 (20.6%) |
| Bottled, Tank, or LP Gas | 46 (12.7%) | 0 (0.0%) |
| Electricity | 255 (70.3%) | 26 (41.3%) |
| Fuel Oil or Kerosene | 52 (14.3%) | 24 (38.1%) |
| Coal or Coke | 0 (0.0%) | 0 (0.0%) |
| All other Fuels | 3 (0.8%) | 0 (0.0%) |
| No Fuel Used | 2 (0.5%) | 0 (0.0%) |
| Total | 363 (100.0%) | 63 (100.0%) |
Household Vehicle Usage in Oxford
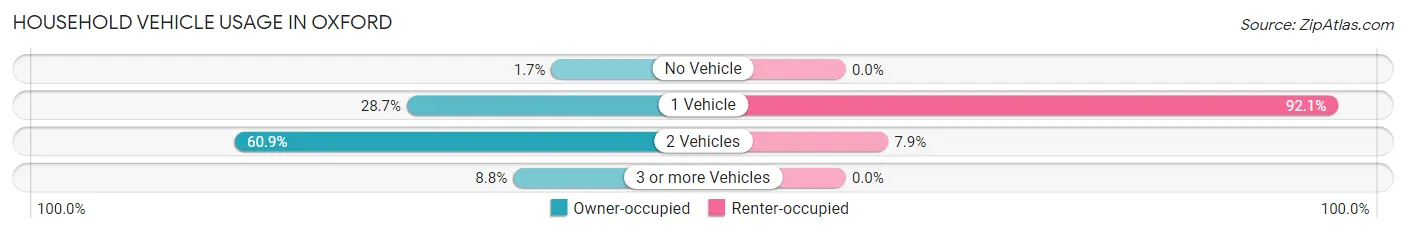
| Vehicles per Household | Owner-occupied | Renter-occupied |
| No Vehicle | 6 (1.7%) | 0 (0.0%) |
| 1 Vehicle | 104 (28.6%) | 58 (92.1%) |
| 2 Vehicles | 221 (60.9%) | 5 (7.9%) |
| 3 or more Vehicles | 32 (8.8%) | 0 (0.0%) |
| Total | 363 (100.0%) | 63 (100.0%) |
Real Estate & Mortgages in Oxford
Real Estate and Mortgage Overview in Oxford
| Characteristic | Without Mortgage | With Mortgage |
| Housing Units | 105 | 258 |
| Median Property Value | $760,400 | $655,900 |
| Median Household Income | $67,708 | $48 |
| Monthly Housing Costs | $869 | $94 |
| Real Estate Taxes | $4,023 | $0 |
Property Value by Mortgage Status in Oxford
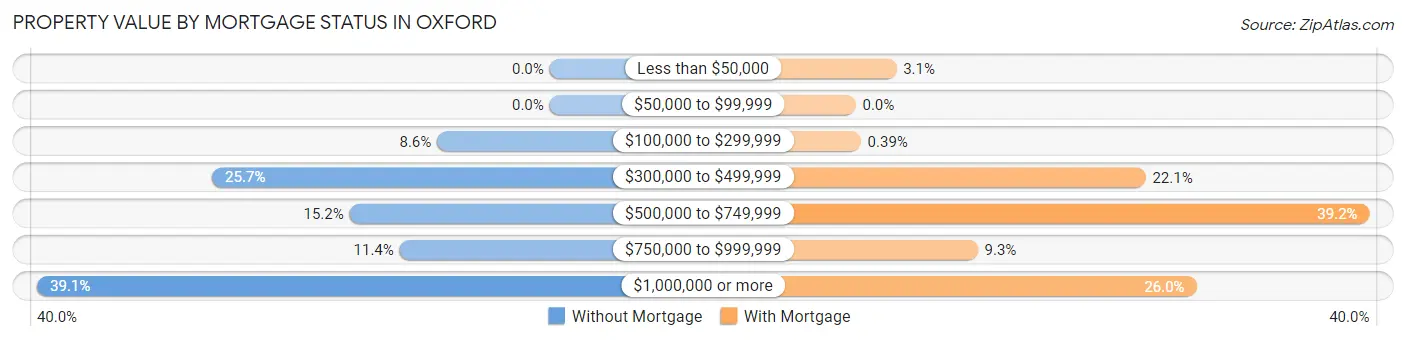
| Property Value | Without Mortgage | With Mortgage |
| Less than $50,000 | 0 (0.0%) | 8 (3.1%) |
| $50,000 to $99,999 | 0 (0.0%) | 0 (0.0%) |
| $100,000 to $299,999 | 9 (8.6%) | 1 (0.4%) |
| $300,000 to $499,999 | 27 (25.7%) | 57 (22.1%) |
| $500,000 to $749,999 | 16 (15.2%) | 101 (39.2%) |
| $750,000 to $999,999 | 12 (11.4%) | 24 (9.3%) |
| $1,000,000 or more | 41 (39.1%) | 67 (26.0%) |
| Total | 105 (100.0%) | 258 (100.0%) |
Household Income by Mortgage Status in Oxford
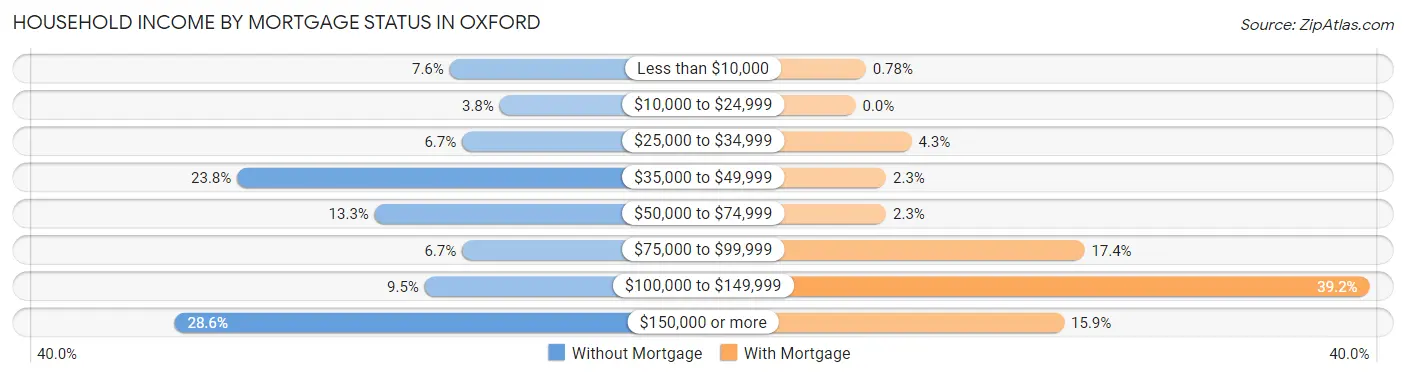
| Household Income | Without Mortgage | With Mortgage |
| Less than $10,000 | 8 (7.6%) | 2 (0.8%) |
| $10,000 to $24,999 | 4 (3.8%) | 0 (0.0%) |
| $25,000 to $34,999 | 7 (6.7%) | 11 (4.3%) |
| $35,000 to $49,999 | 25 (23.8%) | 6 (2.3%) |
| $50,000 to $74,999 | 14 (13.3%) | 6 (2.3%) |
| $75,000 to $99,999 | 7 (6.7%) | 45 (17.4%) |
| $100,000 to $149,999 | 10 (9.5%) | 101 (39.2%) |
| $150,000 or more | 30 (28.6%) | 41 (15.9%) |
| Total | 105 (100.0%) | 258 (100.0%) |
Property Value to Household Income Ratio in Oxford
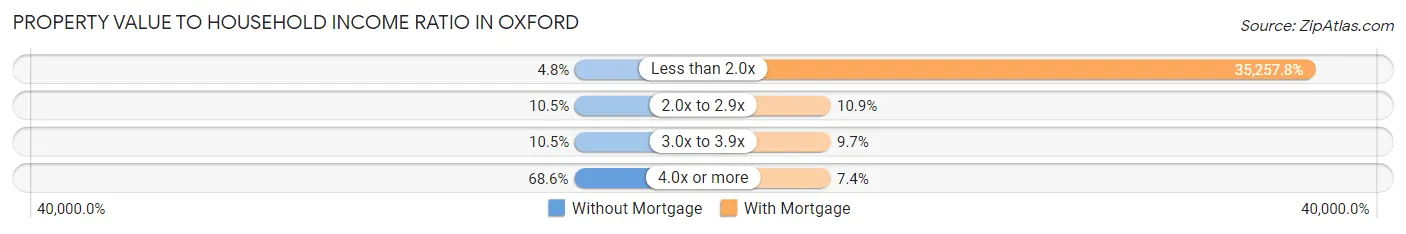
| Value-to-Income Ratio | Without Mortgage | With Mortgage |
| Less than 2.0x | 5 (4.8%) | 90,965 (35,257.7%) |
| 2.0x to 2.9x | 11 (10.5%) | 28 (10.8%) |
| 3.0x to 3.9x | 11 (10.5%) | 25 (9.7%) |
| 4.0x or more | 72 (68.6%) | 19 (7.4%) |
| Total | 105 (100.0%) | 258 (100.0%) |
Real Estate Taxes by Mortgage Status in Oxford
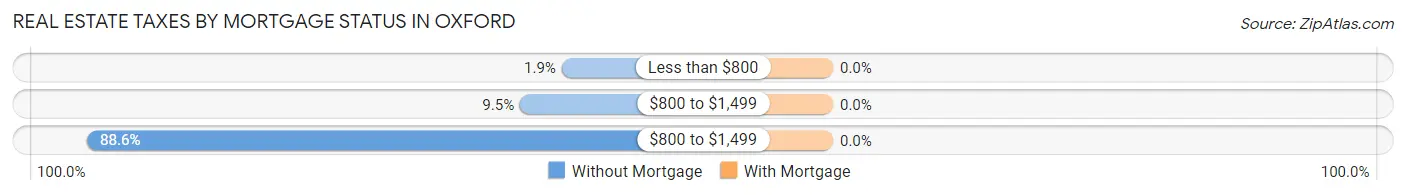
| Property Taxes | Without Mortgage | With Mortgage |
| Less than $800 | 2 (1.9%) | 0 (0.0%) |
| $800 to $1,499 | 10 (9.5%) | 0 (0.0%) |
| $800 to $1,499 | 93 (88.6%) | 0 (0.0%) |
| Total | 105 (100.0%) | 258 (100.0%) |
Health & Disability in Oxford
Health Insurance Coverage by Age in Oxford
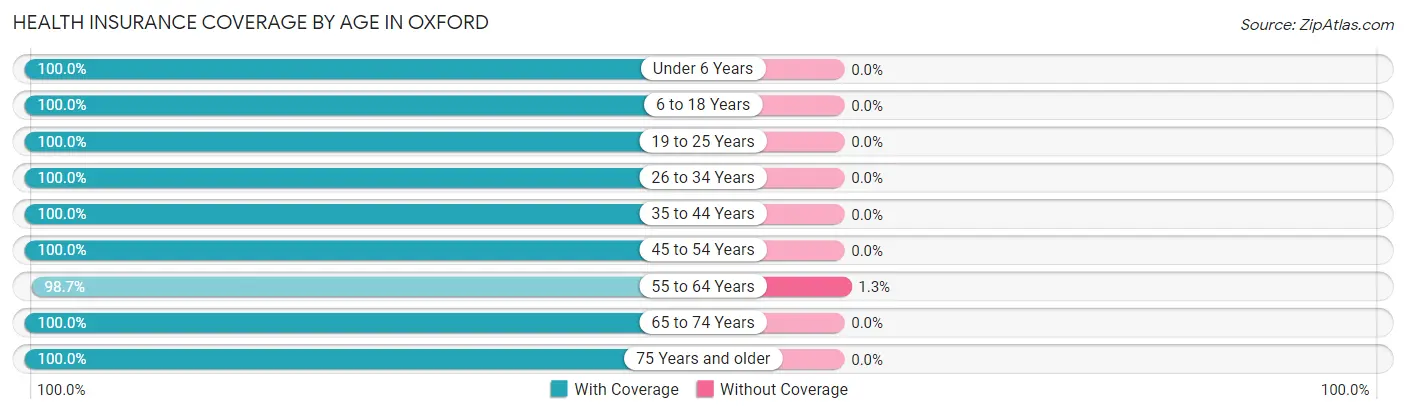
| Age Bracket | With Coverage | Without Coverage |
| Under 6 Years | 12 (100.0%) | 0 (0.0%) |
| 6 to 18 Years | 112 (100.0%) | 0 (0.0%) |
| 19 to 25 Years | 15 (100.0%) | 0 (0.0%) |
| 26 to 34 Years | 8 (100.0%) | 0 (0.0%) |
| 35 to 44 Years | 23 (100.0%) | 0 (0.0%) |
| 45 to 54 Years | 102 (100.0%) | 0 (0.0%) |
| 55 to 64 Years | 151 (98.7%) | 2 (1.3%) |
| 65 to 74 Years | 306 (100.0%) | 0 (0.0%) |
| 75 Years and older | 86 (100.0%) | 0 (0.0%) |
| Total | 815 (99.8%) | 2 (0.2%) |
Health Insurance Coverage by Citizenship Status in Oxford
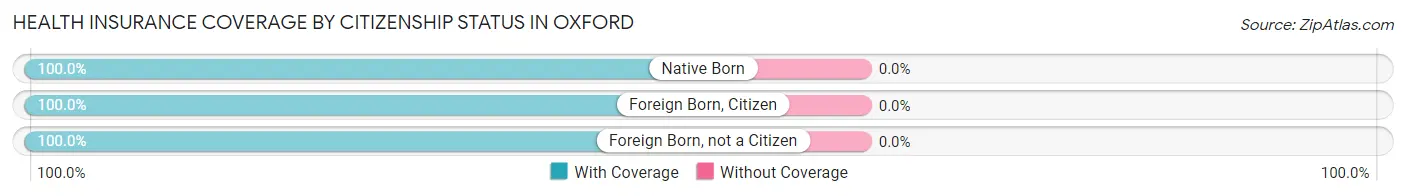
| Citizenship Status | With Coverage | Without Coverage |
| Native Born | 12 (100.0%) | 0 (0.0%) |
| Foreign Born, Citizen | 112 (100.0%) | 0 (0.0%) |
| Foreign Born, not a Citizen | 15 (100.0%) | 0 (0.0%) |
Health Insurance Coverage by Household Income in Oxford
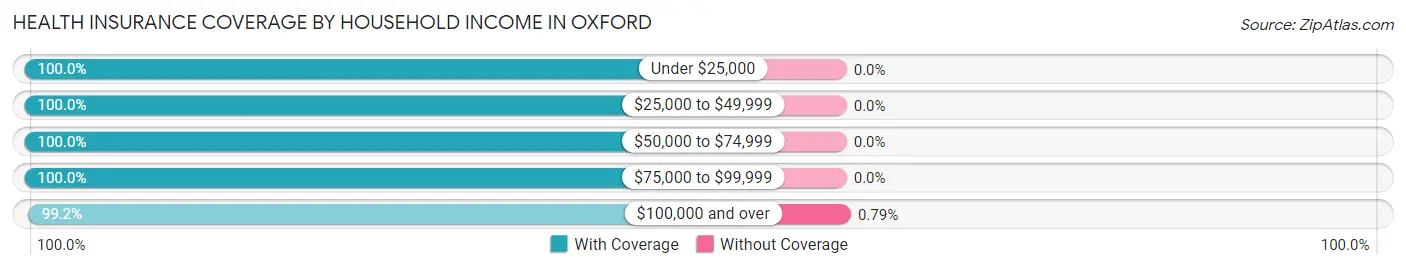
| Household Income | With Coverage | Without Coverage |
| Under $25,000 | 114 (100.0%) | 0 (0.0%) |
| $25,000 to $49,999 | 86 (100.0%) | 0 (0.0%) |
| $50,000 to $74,999 | 116 (100.0%) | 0 (0.0%) |
| $75,000 to $99,999 | 247 (100.0%) | 0 (0.0%) |
| $100,000 and over | 252 (99.2%) | 2 (0.8%) |
Public vs Private Health Insurance Coverage by Age in Oxford
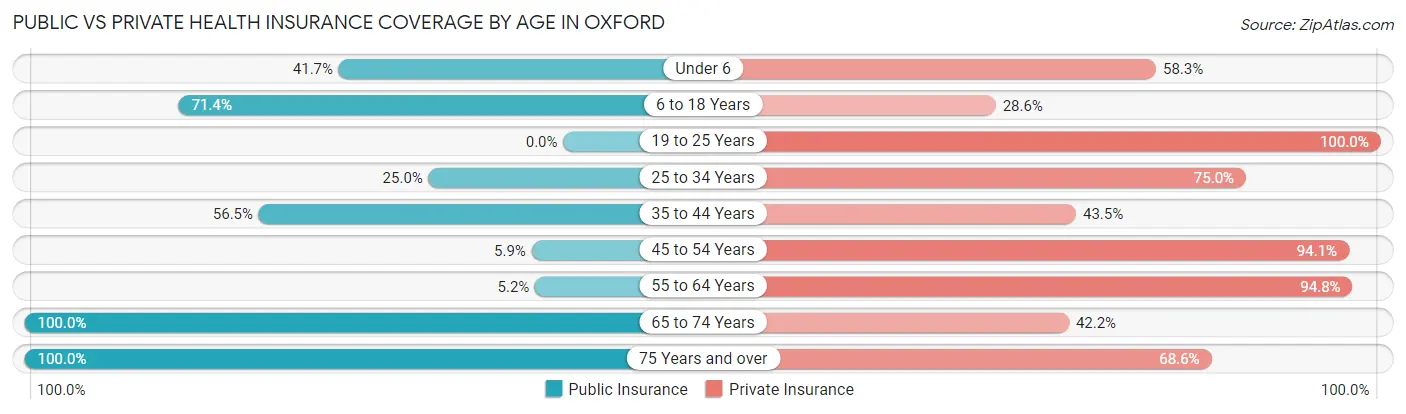
| Age Bracket | Public Insurance | Private Insurance |
| Under 6 | 5 (41.7%) | 7 (58.3%) |
| 6 to 18 Years | 80 (71.4%) | 32 (28.6%) |
| 19 to 25 Years | 0 (0.0%) | 15 (100.0%) |
| 25 to 34 Years | 2 (25.0%) | 6 (75.0%) |
| 35 to 44 Years | 13 (56.5%) | 10 (43.5%) |
| 45 to 54 Years | 6 (5.9%) | 96 (94.1%) |
| 55 to 64 Years | 8 (5.2%) | 145 (94.8%) |
| 65 to 74 Years | 306 (100.0%) | 129 (42.2%) |
| 75 Years and over | 86 (100.0%) | 59 (68.6%) |
| Total | 506 (61.9%) | 499 (61.1%) |
Disability Status by Sex by Age in Oxford
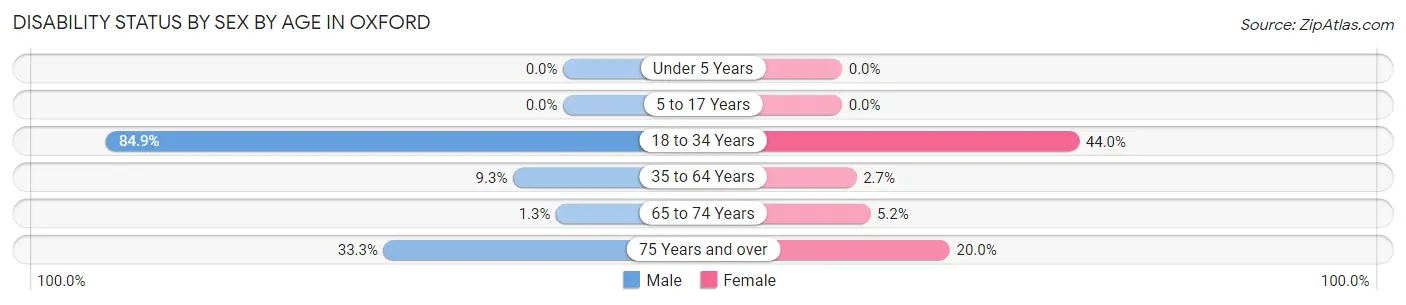
| Age Bracket | Male | Female |
| Under 5 Years | 0 (0.0%) | 0 (0.0%) |
| 5 to 17 Years | 0 (0.0%) | 0 (0.0%) |
| 18 to 34 Years | 56 (84.9%) | 11 (44.0%) |
| 35 to 64 Years | 12 (9.3%) | 4 (2.7%) |
| 65 to 74 Years | 2 (1.3%) | 8 (5.2%) |
| 75 Years and over | 17 (33.3%) | 7 (20.0%) |
Disability Class by Sex by Age in Oxford
Disability Class: Hearing Difficulty
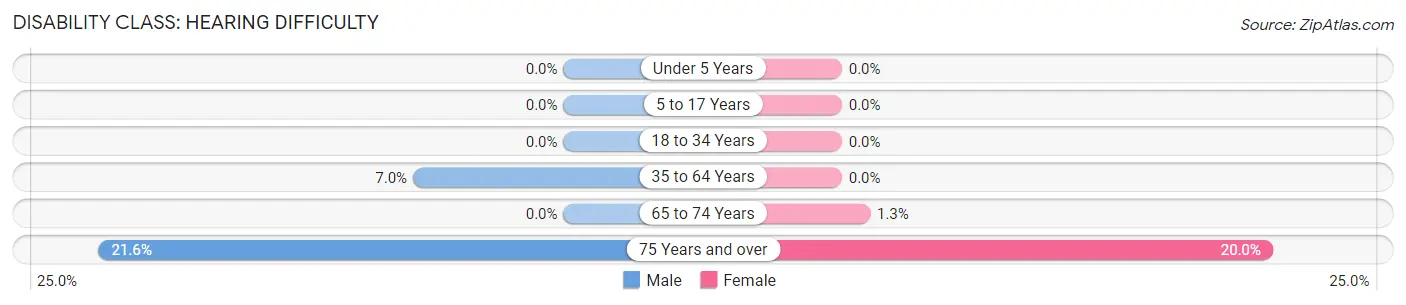
| Age Bracket | Male | Female |
| Under 5 Years | 0 (0.0%) | 0 (0.0%) |
| 5 to 17 Years | 0 (0.0%) | 0 (0.0%) |
| 18 to 34 Years | 0 (0.0%) | 0 (0.0%) |
| 35 to 64 Years | 9 (7.0%) | 0 (0.0%) |
| 65 to 74 Years | 0 (0.0%) | 2 (1.3%) |
| 75 Years and over | 11 (21.6%) | 7 (20.0%) |
Disability Class: Vision Difficulty
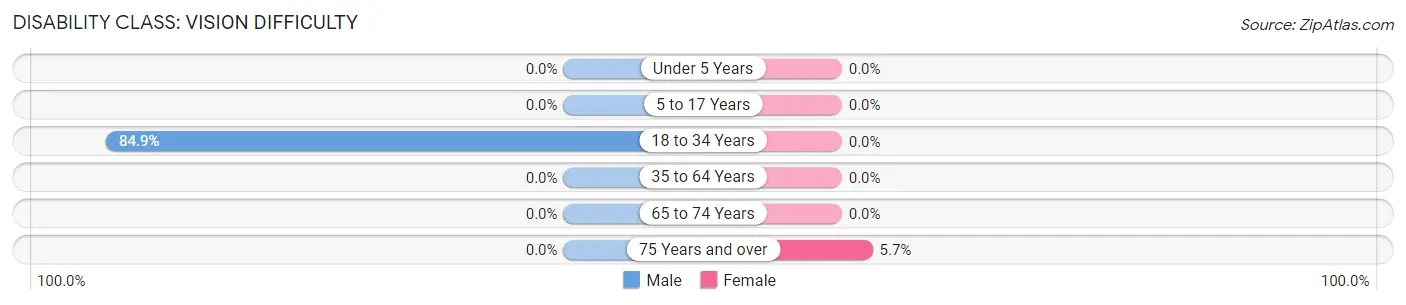
| Age Bracket | Male | Female |
| Under 5 Years | 0 (0.0%) | 0 (0.0%) |
| 5 to 17 Years | 0 (0.0%) | 0 (0.0%) |
| 18 to 34 Years | 56 (84.9%) | 0 (0.0%) |
| 35 to 64 Years | 0 (0.0%) | 0 (0.0%) |
| 65 to 74 Years | 0 (0.0%) | 0 (0.0%) |
| 75 Years and over | 0 (0.0%) | 2 (5.7%) |
Disability Class: Cognitive Difficulty
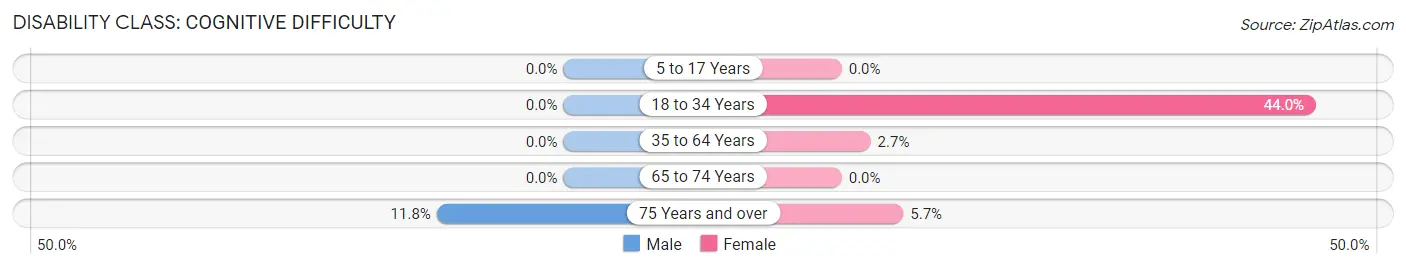
| Age Bracket | Male | Female |
| 5 to 17 Years | 0 (0.0%) | 0 (0.0%) |
| 18 to 34 Years | 0 (0.0%) | 11 (44.0%) |
| 35 to 64 Years | 0 (0.0%) | 4 (2.7%) |
| 65 to 74 Years | 0 (0.0%) | 0 (0.0%) |
| 75 Years and over | 6 (11.8%) | 2 (5.7%) |
Disability Class: Ambulatory Difficulty
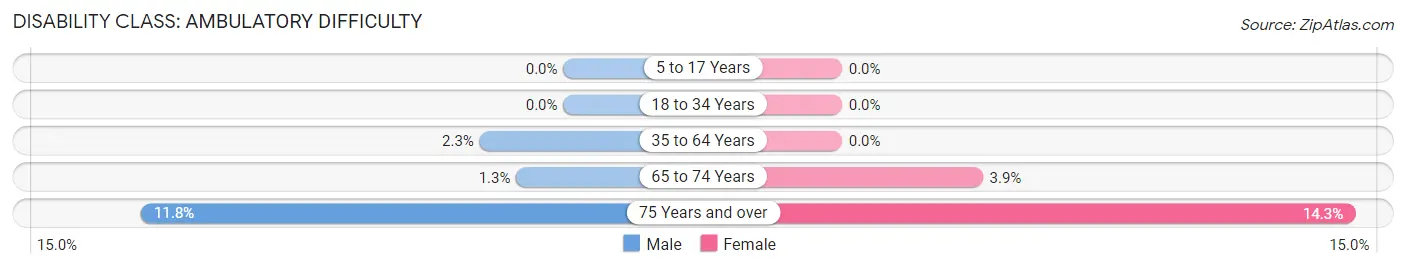
| Age Bracket | Male | Female |
| 5 to 17 Years | 0 (0.0%) | 0 (0.0%) |
| 18 to 34 Years | 0 (0.0%) | 0 (0.0%) |
| 35 to 64 Years | 3 (2.3%) | 0 (0.0%) |
| 65 to 74 Years | 2 (1.3%) | 6 (3.9%) |
| 75 Years and over | 6 (11.8%) | 5 (14.3%) |
Disability Class: Self-Care Difficulty
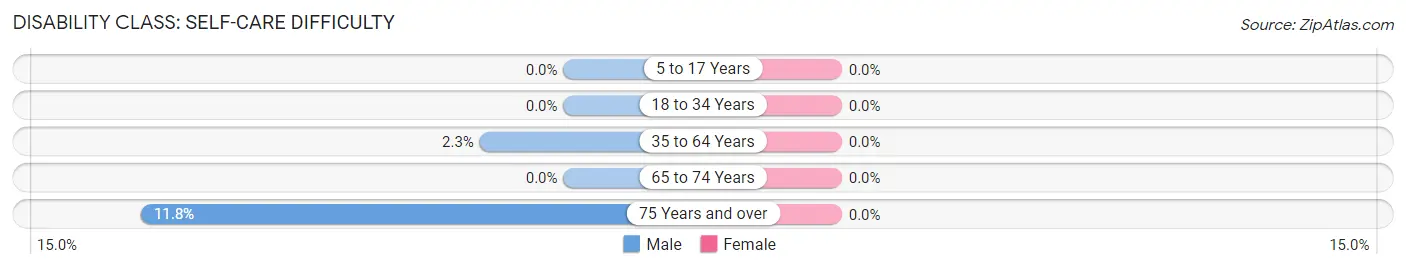
| Age Bracket | Male | Female |
| 5 to 17 Years | 0 (0.0%) | 0 (0.0%) |
| 18 to 34 Years | 0 (0.0%) | 0 (0.0%) |
| 35 to 64 Years | 3 (2.3%) | 0 (0.0%) |
| 65 to 74 Years | 0 (0.0%) | 0 (0.0%) |
| 75 Years and over | 6 (11.8%) | 0 (0.0%) |
Technology Access in Oxford
Computing Device Access in Oxford
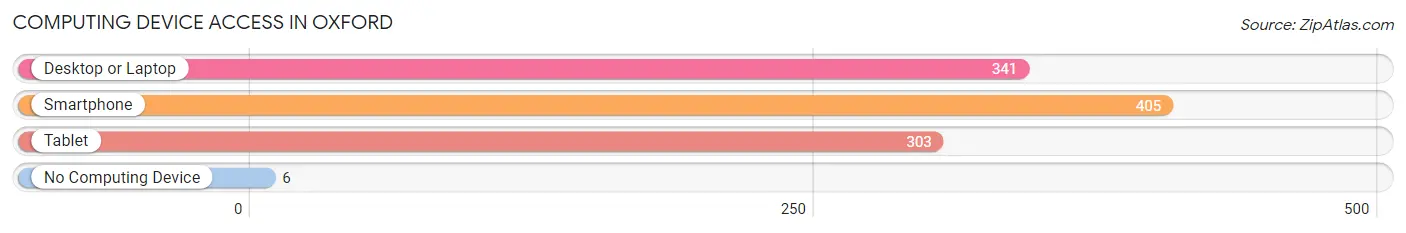
| Device Type | # Households | % Households |
| Desktop or Laptop | 341 | 80.0% |
| Smartphone | 405 | 95.1% |
| Tablet | 303 | 71.1% |
| No Computing Device | 6 | 1.4% |
| Total | 426 | 100.0% |
Internet Access in Oxford
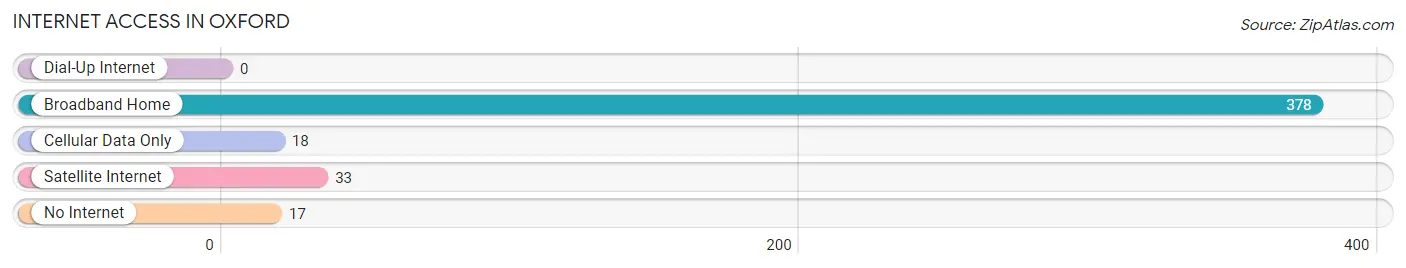
| Internet Type | # Households | % Households |
| Dial-Up Internet | 0 | 0.0% |
| Broadband Home | 378 | 88.7% |
| Cellular Data Only | 18 | 4.2% |
| Satellite Internet | 33 | 7.7% |
| No Internet | 17 | 4.0% |
| Total | 426 | 100.0% |
Oxford Summary
Oxford, Maryland is a small town located in Talbot County on the Eastern Shore of Maryland. It is situated on the Tred Avon River, which is part of the Chesapeake Bay watershed. The town has a population of about 1,000 people and is known for its quaint charm and historic buildings.
Geography
Oxford is located on the Eastern Shore of Maryland, approximately 40 miles east of Annapolis and 60 miles south of Baltimore. It is situated on the Tred Avon River, which is part of the Chesapeake Bay watershed. The town is surrounded by farmland and is bordered by the Choptank River to the north and the Miles River to the south. The town is located on a peninsula, with the Tred Avon River to the west and the Choptank River to the east.
The town is divided into two sections, the “Upper Town” and the “Lower Town”. The Upper Town is located on the peninsula and is the older, more established part of town. It is home to many of the town’s historic buildings, including the Oxford-Bellevue Ferry, the Oxford Museum, and the Oxford-Bellevue Ferry House. The Lower Town is located on the mainland and is the newer, more modern part of town. It is home to the Oxford Marina, the Oxford Yacht Club, and the Oxford-Bellevue Ferry Landing.
History
Oxford was founded in 1683 by English settlers from the Isle of Wight. The town was named after the English city of Oxford, and was originally part of Talbot County. The town was an important port of entry for goods and people coming to the Eastern Shore of Maryland. In the late 1700s, the town was a major center of trade and commerce, and was home to many wealthy merchants.
In the early 1800s, the town was a major center of the slave trade. Slaves were brought to the town to be sold and shipped to other parts of the country. The town was also a major center of the oyster industry, and oyster shucking houses were located throughout the town.
In the late 1800s, the town began to decline in importance as the railroad bypassed it and the oyster industry declined. The town was revitalized in the early 1900s when the Oxford-Bellevue Ferry was established, connecting the town to the mainland. The ferry is still in operation today and is the oldest privately owned ferry in the United States.
Economy
Oxford’s economy is largely based on tourism and the service industry. The town is a popular destination for tourists, who come to enjoy the town’s historic buildings, waterfront views, and charming atmosphere. The Oxford-Bellevue Ferry is a major tourist attraction, and the town is home to several restaurants, shops, and galleries.
The town is also home to several marinas, which provide services to boaters and fishermen. The Oxford Yacht Club is a popular destination for sailing and other water sports. The town is also home to several boatyards, which provide boat repair and maintenance services.
Demographics
As of the 2010 census, the population of Oxford was 1,026. The racial makeup of the town was 94.3% White, 2.7% African American, 0.3% Native American, 0.7% Asian, 0.1% Pacific Islander, 0.7% from other races, and 1.2% from two or more races. Hispanic or Latino of any race were 2.2% of the population.
The median household income in Oxford was $50,938, and the median family income was $60,625. The per capita income for the town was $27,945. About 8.3% of families and 10.2% of the population were below the poverty line, including 14.3% of those under age 18 and 5.2% of those age 65 or over.
Oxford is a small town with a rich history and a unique charm. It is a popular destination for tourists and a great place to live for those who appreciate its quaint atmosphere and waterfront views. The town’s economy is largely based on tourism and the service industry, and it is home to several marinas, boatyards, and restaurants. The town has a diverse population and a median household income that is slightly higher than the national average.
Common Questions
What is the Total Population of Oxford?
Total Population of Oxford is 817.
What is the Total Male Population of Oxford?
Total Male Population of Oxford is 420.
What is the Total Female Population of Oxford?
Total Female Population of Oxford is 397.
What is the Ratio of Males per 100 Females in Oxford?
There are 105.79 Males per 100 Females in Oxford.
What is the Ratio of Females per 100 Males in Oxford?
There are 94.52 Females per 100 Males in Oxford.
What is the Median Population Age in Oxford?
Median Population Age in Oxford is 63.8 Years.
What is the Average Family Size in Oxford
Average Family Size in Oxford is 2.2 People.
What is the Average Household Size in Oxford
Average Household Size in Oxford is 1.9 People.
What is Per Capita Income in Oxford?
Per Capita income in Oxford is $60,886.
What is the Median Family Income in Oxford?
Median Family Income in Oxford is $90,295.
What is the Median Household income in Oxford?
Median Household Income in Oxford is $77,170.
What is Income or Wage Gap in Oxford?
Income or Wage Gap in Oxford is 41.5%.
Women in Oxford earn 58.5 cents for every dollar earned by a man.
What is Inequality or Gini Index in Oxford?
Inequality or Gini Index in Oxford is 0.48.
How Large is the Labor Force in Oxford?
There are 314 People in the Labor Forcein in Oxford.
What is the Percentage of People in the Labor Force in Oxford?
40.6% of People are in the Labor Force in Oxford.
What is the Unemployment Rate in Oxford?
Unemployment Rate in Oxford is 14.0%.