Estonian vs Northern European Householder Income Under 25 years
COMPARE
Estonian
Northern European
Householder Income Under 25 years
Householder Income Under 25 years Comparison
Estonians
Northern Europeans
$51,523
HOUSEHOLDER INCOME UNDER 25 YEARS
16.4/ 100
METRIC RATING
195th/ 347
METRIC RANK
$51,678
HOUSEHOLDER INCOME UNDER 25 YEARS
22.2/ 100
METRIC RATING
188th/ 347
METRIC RANK
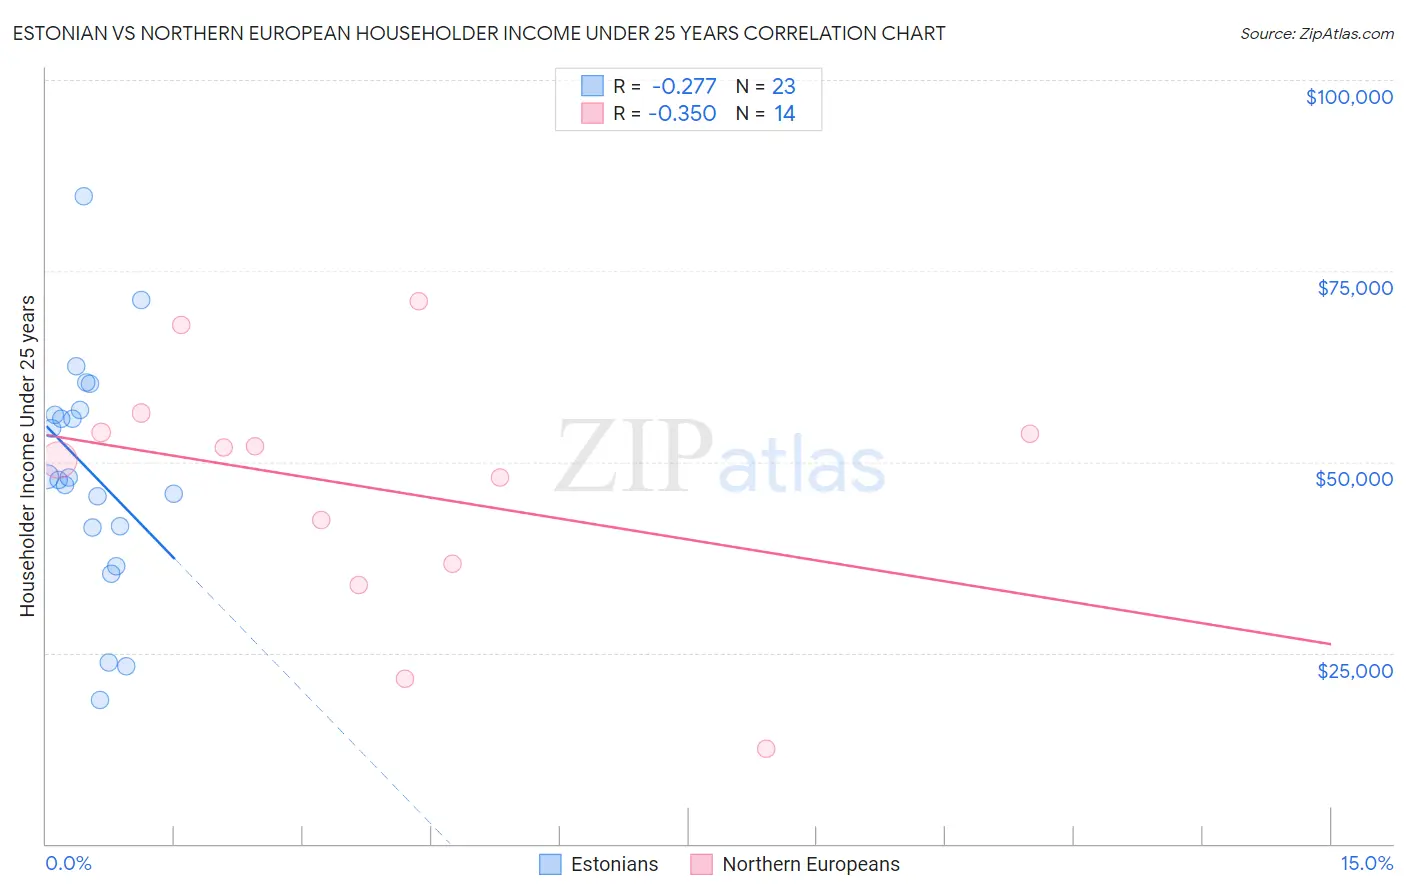
Estonian vs Northern European Householder Income Under 25 years Correlation Chart
The statistical analysis conducted on geographies consisting of 111,851,502 people shows a weak negative correlation between the proportion of Estonians and household income with householder under the age of 25 in the United States with a correlation coefficient (R) of -0.277 and weighted average of $51,523. Similarly, the statistical analysis conducted on geographies consisting of 340,537,384 people shows a mild negative correlation between the proportion of Northern Europeans and household income with householder under the age of 25 in the United States with a correlation coefficient (R) of -0.350 and weighted average of $51,678, a difference of 0.30%.
Householder Income Under 25 years Correlation Summary
| Measurement | Estonian | Northern European |
| Minimum | $18,790 | $12,500 |
| Maximum | $84,706 | $71,017 |
| Range | $65,916 | $58,517 |
| Mean | $48,704 | $46,566 |
| Median | $47,907 | $51,044 |
| Interquartile 25% (IQ1) | $41,381 | $36,723 |
| Interquartile 75% (IQ3) | $56,834 | $53,780 |
| Interquartile Range (IQR) | $15,453 | $17,057 |
| Standard Deviation (Sample) | $15,301 | $16,138 |
| Standard Deviation (Population) | $14,964 | $15,551 |
Demographics Similar to Estonians and Northern Europeans by Householder Income Under 25 years
In terms of householder income under 25 years, the demographic groups most similar to Estonians are Guatemalan ($51,525, a difference of 0.0%), Palestinian ($51,515, a difference of 0.020%), Pima ($51,503, a difference of 0.040%), Immigrants from Syria ($51,494, a difference of 0.060%), and Swiss ($51,493, a difference of 0.060%). Similarly, the demographic groups most similar to Northern Europeans are Croatian ($51,662, a difference of 0.030%), Immigrants from South Africa ($51,705, a difference of 0.050%), Alaskan Athabascan ($51,713, a difference of 0.070%), Immigrants from Latvia ($51,737, a difference of 0.11%), and Malaysian ($51,615, a difference of 0.12%).
| Demographics | Rating | Rank | Householder Income Under 25 years |
| Europeans | 27.6 /100 | #181 | Fair $51,796 |
| Jordanians | 27.6 /100 | #182 | Fair $51,796 |
| Mexican American Indians | 27.0 /100 | #183 | Fair $51,783 |
| Paiute | 25.1 /100 | #184 | Fair $51,743 |
| Immigrants | Latvia | 24.8 /100 | #185 | Fair $51,737 |
| Alaskan Athabascans | 23.8 /100 | #186 | Fair $51,713 |
| Immigrants | South Africa | 23.4 /100 | #187 | Fair $51,705 |
| Northern Europeans | 22.2 /100 | #188 | Fair $51,678 |
| Croatians | 21.6 /100 | #189 | Fair $51,662 |
| Malaysians | 19.7 /100 | #190 | Poor $51,615 |
| Panamanians | 19.5 /100 | #191 | Poor $51,611 |
| West Indians | 18.5 /100 | #192 | Poor $51,583 |
| Immigrants | Eritrea | 18.1 /100 | #193 | Poor $51,574 |
| Guatemalans | 16.4 /100 | #194 | Poor $51,525 |
| Estonians | 16.4 /100 | #195 | Poor $51,523 |
| Palestinians | 16.1 /100 | #196 | Poor $51,515 |
| Pima | 15.7 /100 | #197 | Poor $51,503 |
| Immigrants | Syria | 15.4 /100 | #198 | Poor $51,494 |
| Swiss | 15.4 /100 | #199 | Poor $51,493 |
| Immigrants | West Indies | 14.9 /100 | #200 | Poor $51,479 |
| British | 14.9 /100 | #201 | Poor $51,477 |