Wilmington Island, GA
Wilmington Island Map
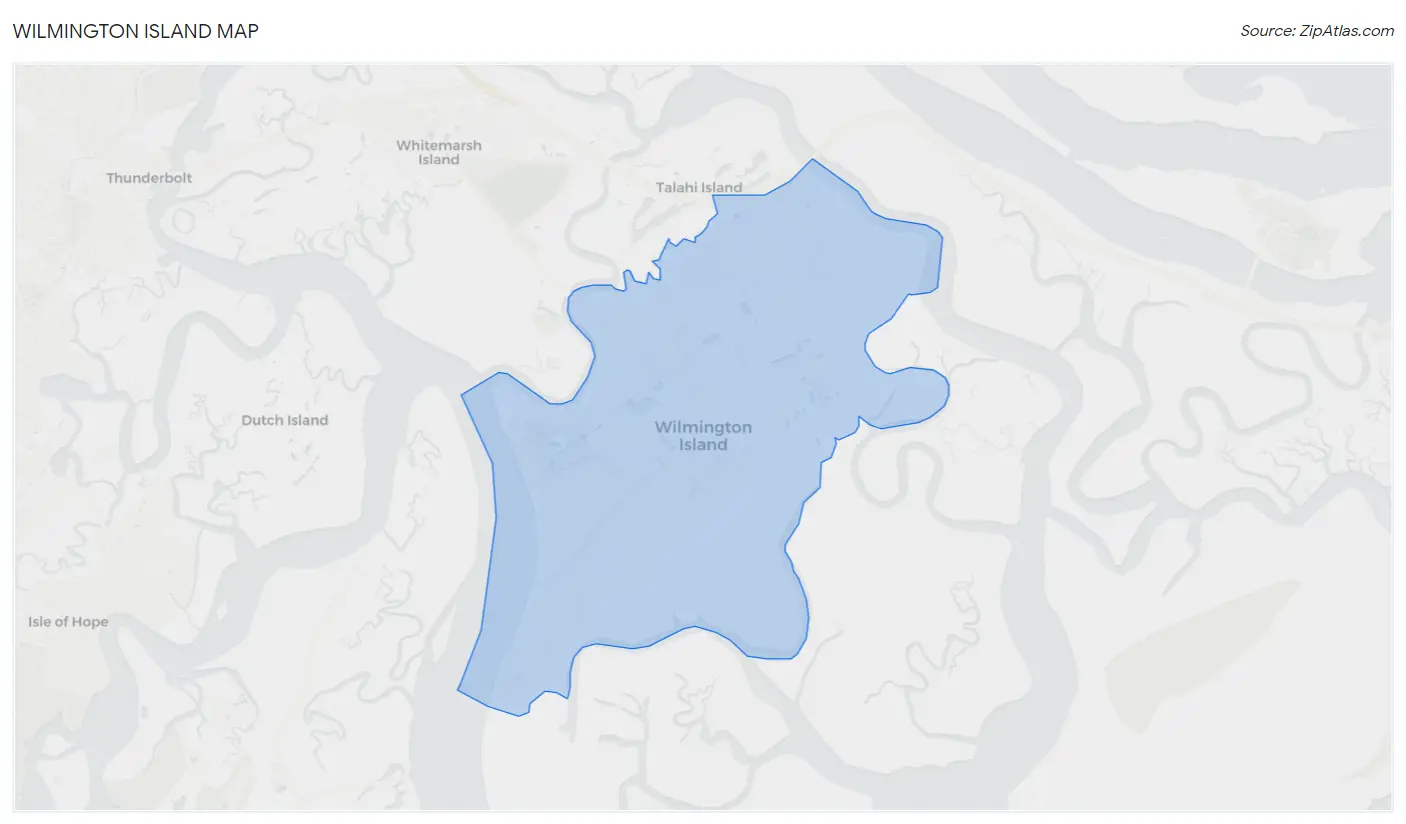
Wilmington Island Overview
15,235
TOTAL POPULATION
7,300
MALE POPULATION
7,935
FEMALE POPULATION
92.00
MALES / 100 FEMALES
108.70
FEMALES / 100 MALES
43.6
MEDIAN AGE
3.0
AVG FAMILY SIZE
2.4
AVG HOUSEHOLD SIZE
$46,250
PER CAPITA INCOME
$106,186
AVG FAMILY INCOME
$87,441
AVG HOUSEHOLD INCOME
44.2%
WAGE / INCOME GAP [ % ]
55.8¢/ $1
WAGE / INCOME GAP [ $ ]
0.41
INEQUALITY / GINI INDEX
8,033
LABOR FORCE [ PEOPLE ]
65.0%
PERCENT IN LABOR FORCE
3.3%
UNEMPLOYMENT RATE
Wilmington Island Area Codes
Race in Wilmington Island
The most populous races in Wilmington Island are White / Caucasian (13,616 | 89.4%), Two or more Races (653 | 4.3%), and Asian (418 | 2.7%).
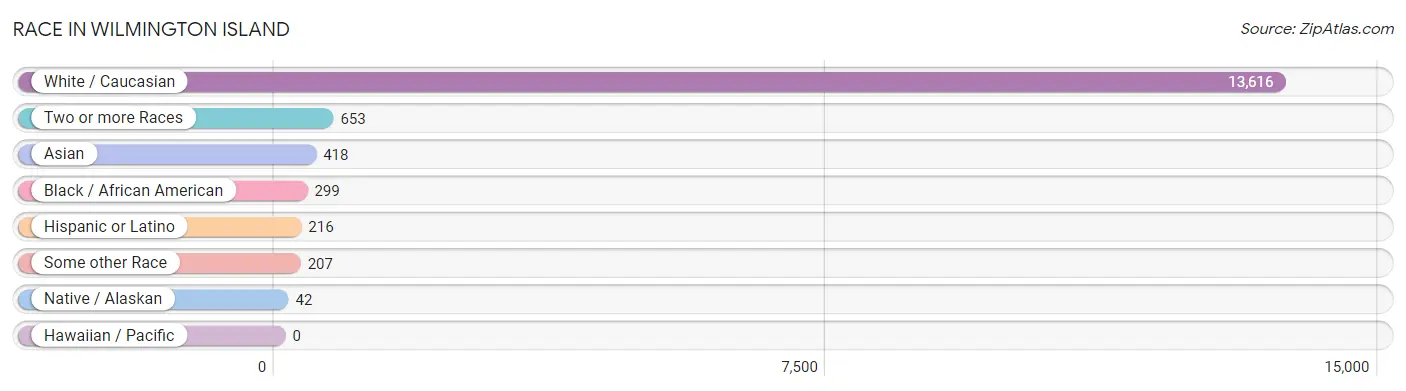
| Race | # Population | % Population |
| Asian | 418 | 2.7% |
| Black / African American | 299 | 2.0% |
| Hawaiian / Pacific | 0 | 0.0% |
| Hispanic or Latino | 216 | 1.4% |
| Native / Alaskan | 42 | 0.3% |
| White / Caucasian | 13,616 | 89.4% |
| Two or more Races | 653 | 4.3% |
| Some other Race | 207 | 1.4% |
| Total | 15,235 | 100.0% |
Ancestry in Wilmington Island
The most populous ancestries reported in Wilmington Island are English (3,889 | 25.5%), Irish (3,559 | 23.4%), German (2,117 | 13.9%), American (1,083 | 7.1%), and Scottish (696 | 4.6%), together accounting for 74.5% of all Wilmington Island residents.
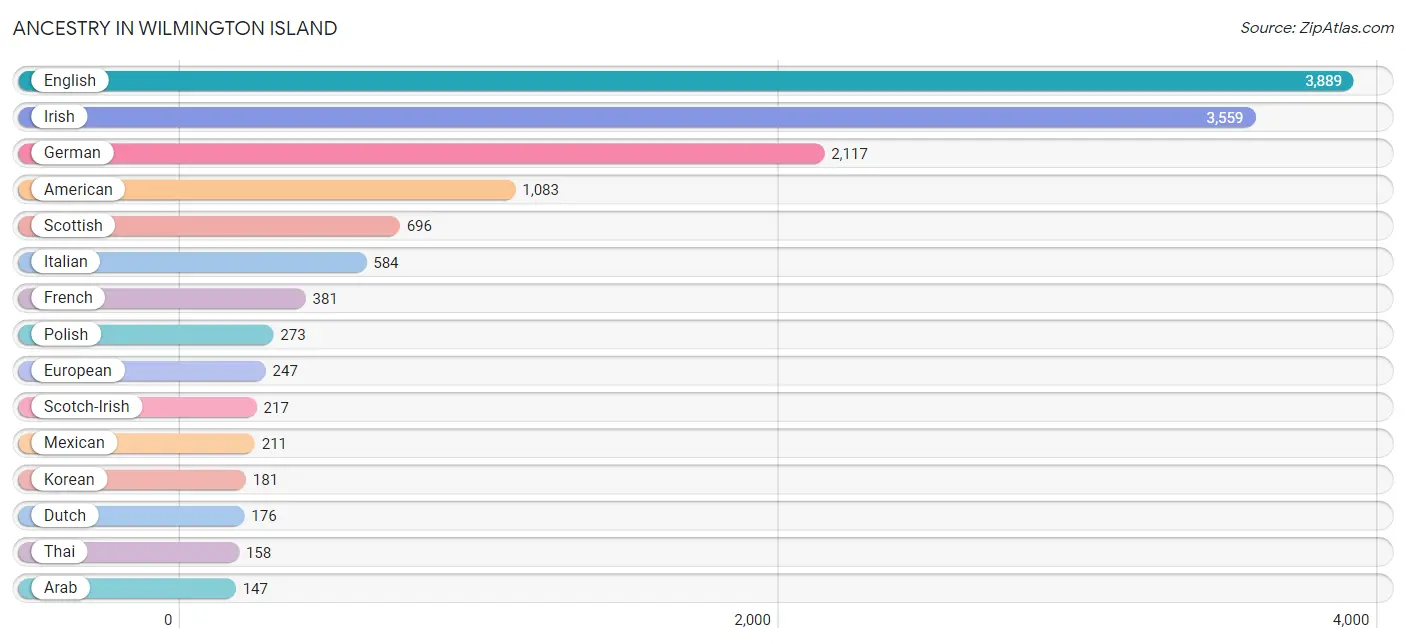
| Ancestry | # Population | % Population |
| Alsatian | 1 | 0.0% |
| American | 1,083 | 7.1% |
| Arab | 147 | 1.0% |
| Austrian | 50 | 0.3% |
| British | 56 | 0.4% |
| Burmese | 53 | 0.4% |
| Canadian | 15 | 0.1% |
| Cherokee | 25 | 0.2% |
| Croatian | 12 | 0.1% |
| Czech | 18 | 0.1% |
| Czechoslovakian | 15 | 0.1% |
| Danish | 11 | 0.1% |
| Dutch | 176 | 1.2% |
| Eastern European | 79 | 0.5% |
| Egyptian | 32 | 0.2% |
| English | 3,889 | 25.5% |
| European | 247 | 1.6% |
| Finnish | 10 | 0.1% |
| French | 381 | 2.5% |
| French Canadian | 107 | 0.7% |
| German | 2,117 | 13.9% |
| Greek | 49 | 0.3% |
| Hungarian | 44 | 0.3% |
| Indian (Asian) | 117 | 0.8% |
| Irish | 3,559 | 23.4% |
| Iroquois | 25 | 0.2% |
| Italian | 584 | 3.8% |
| Korean | 181 | 1.2% |
| Laotian | 12 | 0.1% |
| Lebanese | 115 | 0.7% |
| Lithuanian | 127 | 0.8% |
| Mexican | 211 | 1.4% |
| Northern European | 6 | 0.0% |
| Norwegian | 59 | 0.4% |
| Polish | 273 | 1.8% |
| Puerto Rican | 5 | 0.0% |
| Russian | 51 | 0.3% |
| Scotch-Irish | 217 | 1.4% |
| Scottish | 696 | 4.6% |
| Slovak | 18 | 0.1% |
| Sri Lankan | 40 | 0.3% |
| Swedish | 14 | 0.1% |
| Thai | 158 | 1.0% |
| Ukrainian | 27 | 0.2% |
| Welsh | 129 | 0.9% |
| Yugoslavian | 19 | 0.1% | View All 46 Rows |
Immigrants in Wilmington Island
The most numerous immigrant groups reported in Wilmington Island came from Asia (236 | 1.5%), Europe (184 | 1.2%), Northern Europe (126 | 0.8%), South Eastern Asia (88 | 0.6%), and India (85 | 0.6%), together accounting for 4.7% of all Wilmington Island residents.
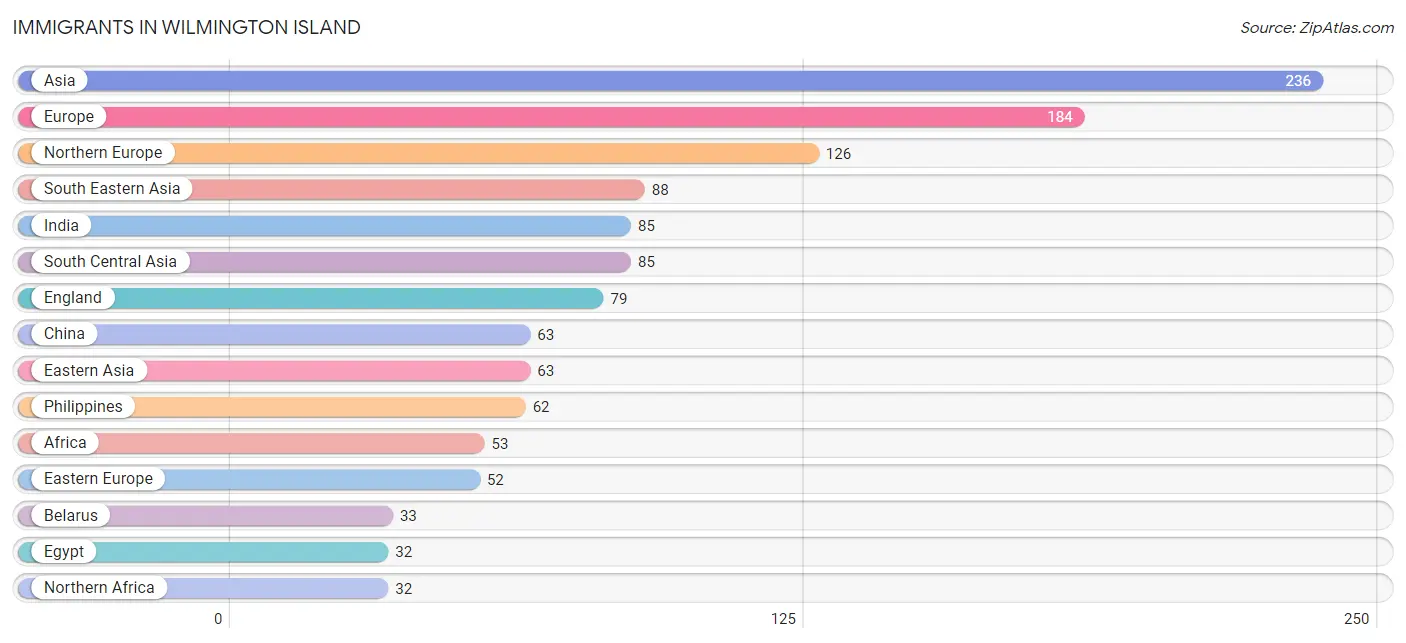
| Immigration Origin | # Population | % Population |
| Africa | 53 | 0.4% |
| Asia | 236 | 1.5% |
| Belarus | 33 | 0.2% |
| Canada | 14 | 0.1% |
| Central America | 27 | 0.2% |
| China | 63 | 0.4% |
| Eastern Asia | 63 | 0.4% |
| Eastern Europe | 52 | 0.3% |
| Egypt | 32 | 0.2% |
| England | 79 | 0.5% |
| Europe | 184 | 1.2% |
| Greece | 6 | 0.0% |
| India | 85 | 0.6% |
| Ireland | 18 | 0.1% |
| Latin America | 27 | 0.2% |
| Lithuania | 19 | 0.1% |
| Mexico | 27 | 0.2% |
| Northern Africa | 32 | 0.2% |
| Northern Europe | 126 | 0.8% |
| Norway | 12 | 0.1% |
| Philippines | 62 | 0.4% |
| South Africa | 21 | 0.1% |
| South Central Asia | 85 | 0.6% |
| South Eastern Asia | 88 | 0.6% |
| Southern Europe | 6 | 0.0% |
| Taiwan | 20 | 0.1% |
| Vietnam | 26 | 0.2% | View All 27 Rows |
Sex and Age in Wilmington Island
Sex and Age in Wilmington Island
The most populous age groups in Wilmington Island are 55 to 59 Years (685 | 9.4%) for men and 35 to 39 Years (794 | 10.0%) for women.
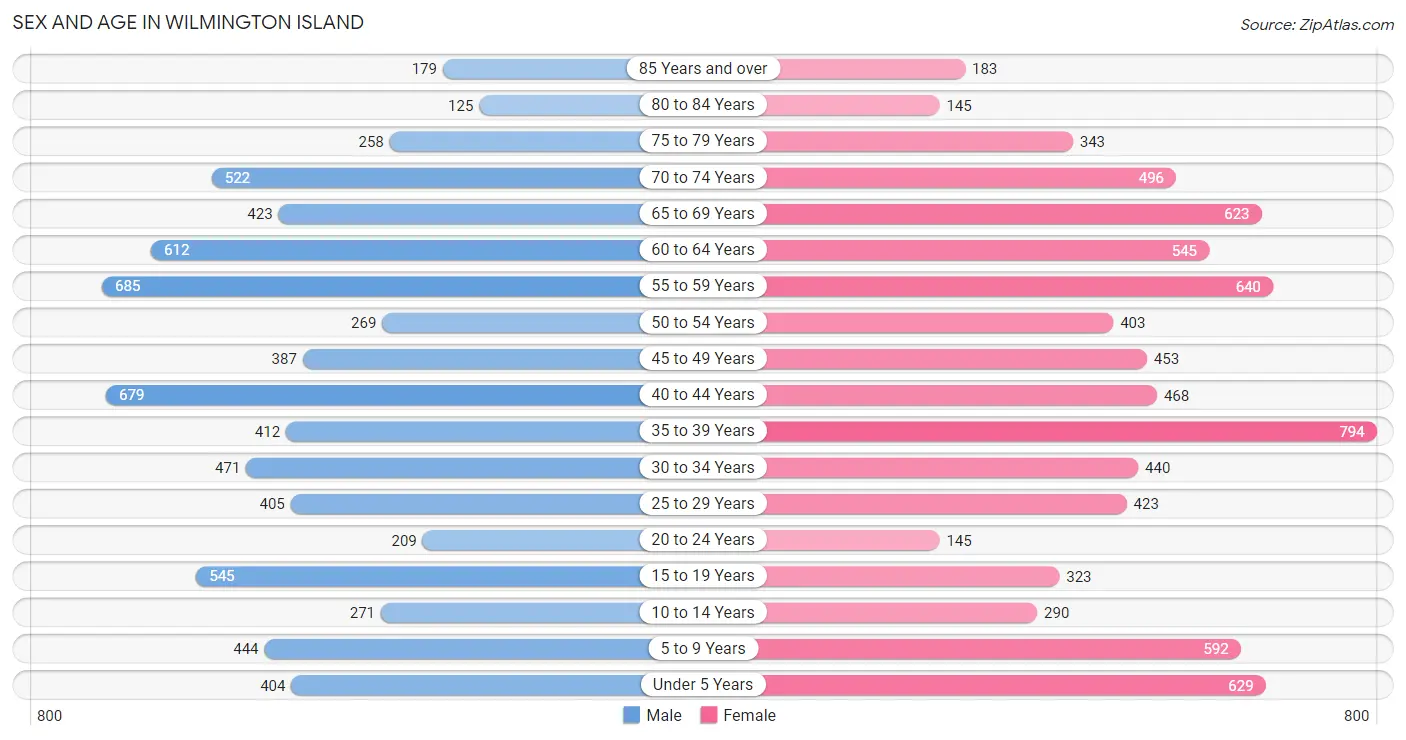
| Age Bracket | Male | Female |
| Under 5 Years | 404 (5.5%) | 629 (7.9%) |
| 5 to 9 Years | 444 (6.1%) | 592 (7.5%) |
| 10 to 14 Years | 271 (3.7%) | 290 (3.6%) |
| 15 to 19 Years | 545 (7.5%) | 323 (4.1%) |
| 20 to 24 Years | 209 (2.9%) | 145 (1.8%) |
| 25 to 29 Years | 405 (5.6%) | 423 (5.3%) |
| 30 to 34 Years | 471 (6.5%) | 440 (5.6%) |
| 35 to 39 Years | 412 (5.6%) | 794 (10.0%) |
| 40 to 44 Years | 679 (9.3%) | 468 (5.9%) |
| 45 to 49 Years | 387 (5.3%) | 453 (5.7%) |
| 50 to 54 Years | 269 (3.7%) | 403 (5.1%) |
| 55 to 59 Years | 685 (9.4%) | 640 (8.1%) |
| 60 to 64 Years | 612 (8.4%) | 545 (6.9%) |
| 65 to 69 Years | 423 (5.8%) | 623 (7.9%) |
| 70 to 74 Years | 522 (7.1%) | 496 (6.2%) |
| 75 to 79 Years | 258 (3.5%) | 343 (4.3%) |
| 80 to 84 Years | 125 (1.7%) | 145 (1.8%) |
| 85 Years and over | 179 (2.5%) | 183 (2.3%) |
| Total | 7,300 (100.0%) | 7,935 (100.0%) |
Families and Households in Wilmington Island
Median Family Size in Wilmington Island
The median family size in Wilmington Island is 3.00 persons per family, with single male/father families (81 | 2.0%) accounting for the largest median family size of 3.64 persons per family. On the other hand, single female/mother families (413 | 10.0%) represent the smallest median family size with 2.93 persons per family.
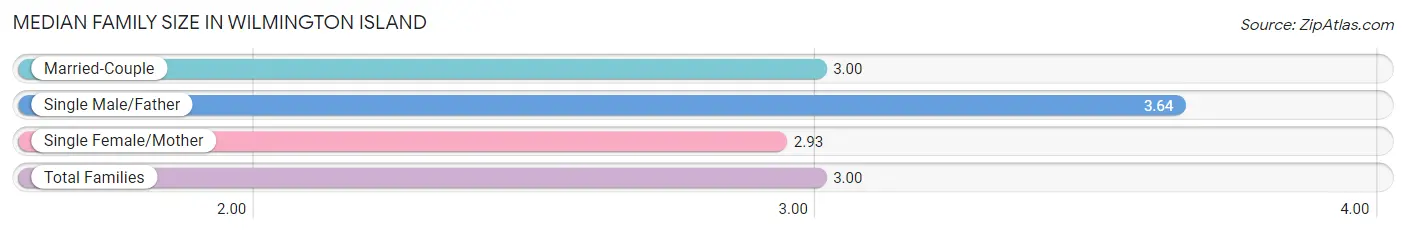
| Family Type | # Families | Family Size |
| Married-Couple | 3,623 (88.0%) | 3.00 |
| Single Male/Father | 81 (2.0%) | 3.64 |
| Single Female/Mother | 413 (10.0%) | 2.93 |
| Total Families | 4,117 (100.0%) | 3.00 |
Median Household Size in Wilmington Island
The median household size in Wilmington Island is 2.43 persons per household, with single male/father households (81 | 1.3%) accounting for the largest median household size of 4.06 persons per household. non-family households (2,133 | 34.1%) represent the smallest median household size with 1.20 persons per household.
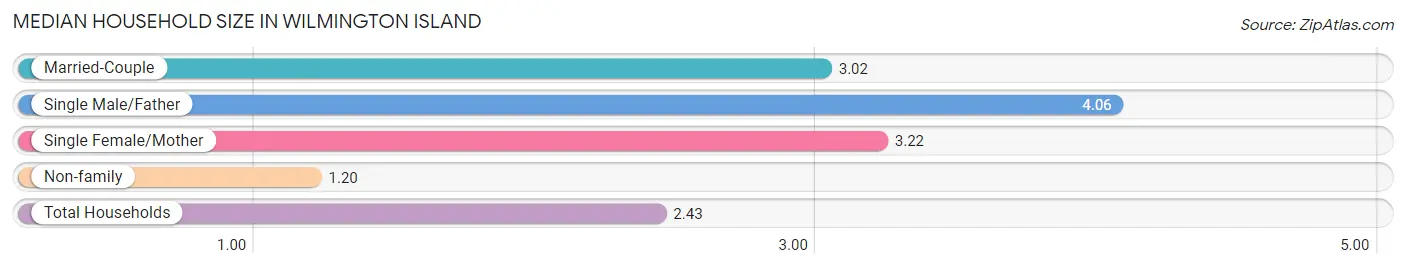
| Household Type | # Households | Household Size |
| Married-Couple | 3,623 (58.0%) | 3.02 |
| Single Male/Father | 81 (1.3%) | 4.06 |
| Single Female/Mother | 413 (6.6%) | 3.22 |
| Non-family | 2,133 (34.1%) | 1.20 |
| Total Households | 6,250 (100.0%) | 2.43 |
Household Size by Marriage Status in Wilmington Island
Out of a total of 6,250 households in Wilmington Island, 4,117 (65.9%) are family households, while 2,133 (34.1%) are nonfamily households. The most numerous type of family households are 2-person households, comprising 1,912, and the most common type of nonfamily households are 1-person households, comprising 1,778.
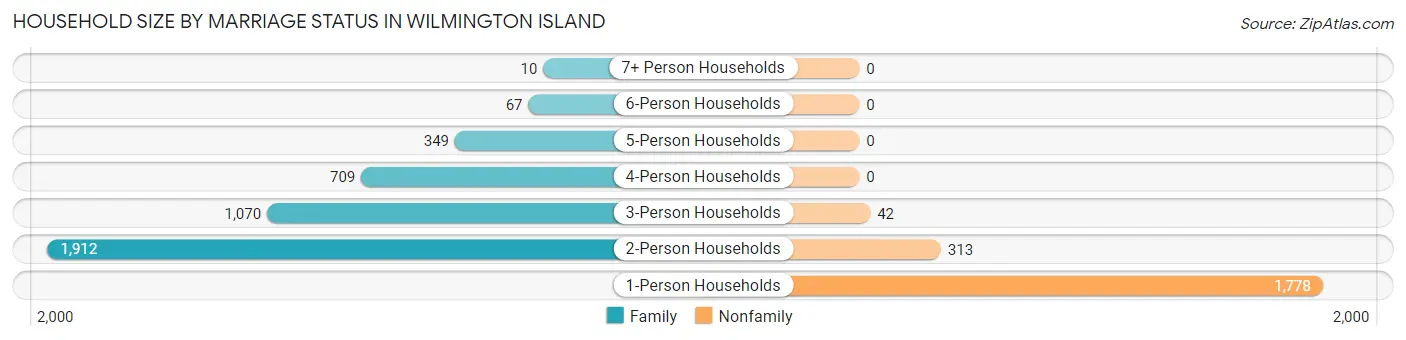
| Household Size | Family Households | Nonfamily Households |
| 1-Person Households | - | 1,778 (28.4%) |
| 2-Person Households | 1,912 (30.6%) | 313 (5.0%) |
| 3-Person Households | 1,070 (17.1%) | 42 (0.7%) |
| 4-Person Households | 709 (11.3%) | 0 (0.0%) |
| 5-Person Households | 349 (5.6%) | 0 (0.0%) |
| 6-Person Households | 67 (1.1%) | 0 (0.0%) |
| 7+ Person Households | 10 (0.2%) | 0 (0.0%) |
| Total | 4,117 (65.9%) | 2,133 (34.1%) |
Female Fertility in Wilmington Island
Fertility by Age in Wilmington Island
Average fertility rate in Wilmington Island is 64.0 births per 1,000 women. Women in the age bracket of 20 to 34 years have the highest fertility rate with 76.0 births per 1,000 women. Women in the age bracket of 35 to 50 years acount for 61.1% of all women with births.
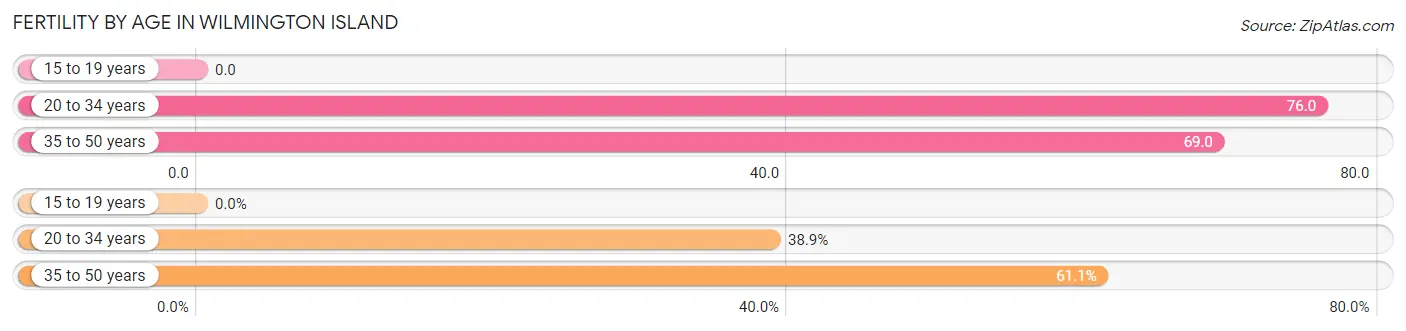
| Age Bracket | Women with Births | Births / 1,000 Women |
| 15 to 19 years | 0 (0.0%) | 0.0 |
| 20 to 34 years | 77 (38.9%) | 76.0 |
| 35 to 50 years | 121 (61.1%) | 69.0 |
| Total | 198 (100.0%) | 64.0 |
Fertility by Age by Marriage Status in Wilmington Island
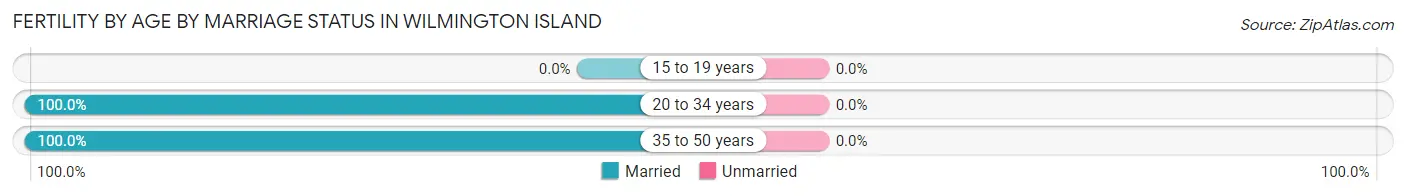
| Age Bracket | Married | Unmarried |
| 15 to 19 years | 0 (0.0%) | 0 (0.0%) |
| 20 to 34 years | 77 (100.0%) | 0 (0.0%) |
| 35 to 50 years | 121 (100.0%) | 0 (0.0%) |
| Total | 198 (100.0%) | 0 (0.0%) |
Fertility by Education in Wilmington Island
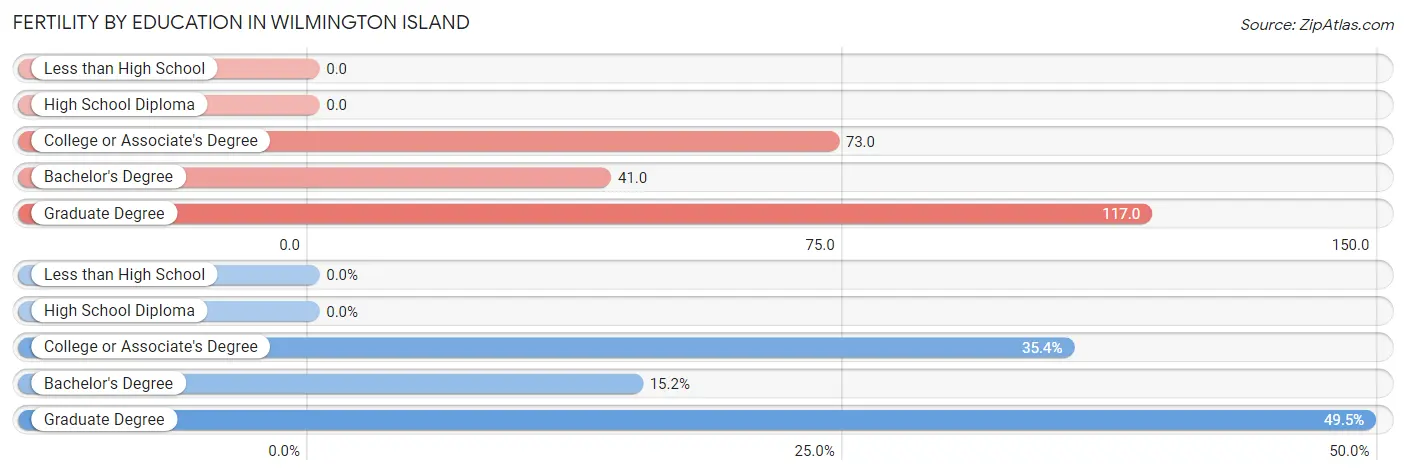
| Educational Attainment | Women with Births | Births / 1,000 Women |
| Less than High School | 0 (0.0%) | 0.0 |
| High School Diploma | 0 (0.0%) | 0.0 |
| College or Associate's Degree | 70 (35.3%) | 73.0 |
| Bachelor's Degree | 30 (15.1%) | 41.0 |
| Graduate Degree | 98 (49.5%) | 117.0 |
| Total | 198 (100.0%) | 64.0 |
Fertility by Education by Marriage Status in Wilmington Island
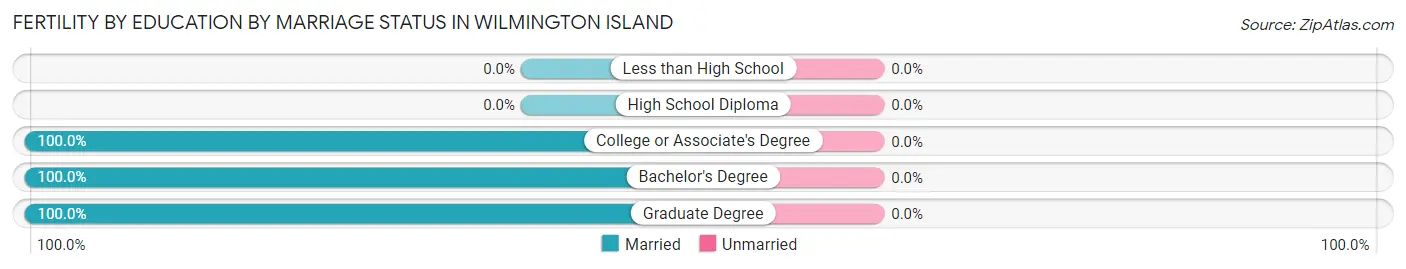
| Educational Attainment | Married | Unmarried |
| Less than High School | 0 (0.0%) | 0 (0.0%) |
| High School Diploma | 0 (0.0%) | 0 (0.0%) |
| College or Associate's Degree | 70 (100.0%) | 0 (0.0%) |
| Bachelor's Degree | 30 (100.0%) | 0 (0.0%) |
| Graduate Degree | 98 (100.0%) | 0 (0.0%) |
| Total | 198 (100.0%) | 0 (0.0%) |
Income in Wilmington Island
Income Overview in Wilmington Island
Per Capita Income in Wilmington Island is $46,250, while median incomes of families and households are $106,186 and $87,441 respectively.
| Characteristic | Number | Measure |
| Per Capita Income | 15,235 | $46,250 |
| Median Family Income | 4,117 | $106,186 |
| Mean Family Income | 4,117 | $125,907 |
| Median Household Income | 6,250 | $87,441 |
| Mean Household Income | 6,250 | $111,233 |
| Income Deficit | 4,117 | $0 |
| Wage / Income Gap (%) | 15,235 | 44.19% |
| Wage / Income Gap ($) | 15,235 | 55.81¢ per $1 |
| Gini / Inequality Index | 15,235 | 0.41 |
Earnings by Sex in Wilmington Island
Average Earnings in Wilmington Island are $52,709, $67,857 for men and $37,870 for women, a difference of 44.2%.
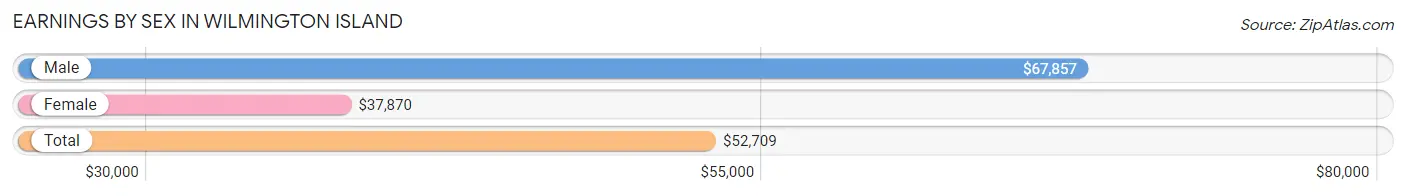
| Sex | Number | Average Earnings |
| Male | 4,470 (54.6%) | $67,857 |
| Female | 3,710 (45.4%) | $37,870 |
| Total | 8,180 (100.0%) | $52,709 |
Earnings by Sex by Income Bracket in Wilmington Island
The most common earnings brackets in Wilmington Island are $100,000+ for men (1,223 | 27.4%) and $55,000 to $64,999 for women (387 | 10.4%).
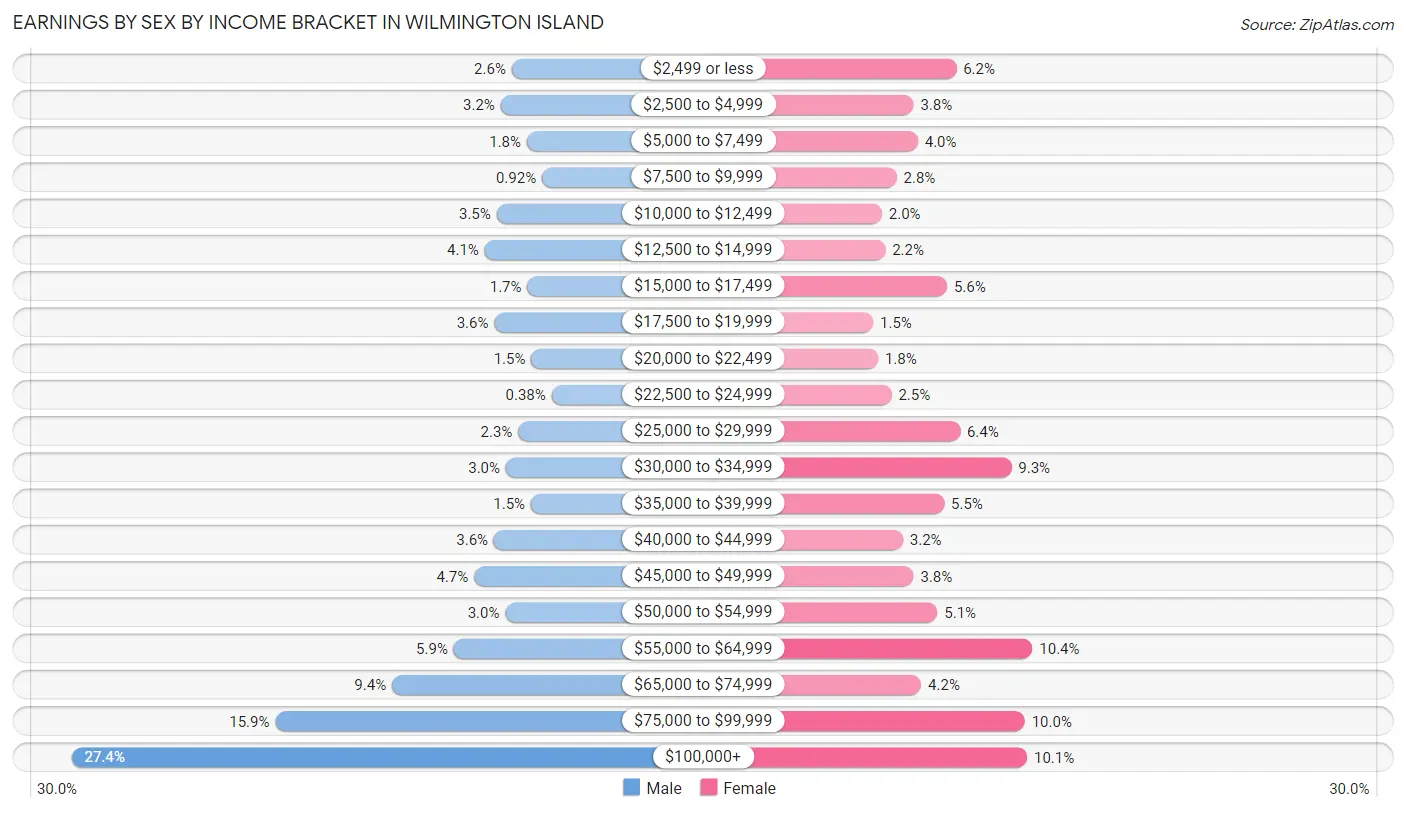
| Income | Male | Female |
| $2,499 or less | 117 (2.6%) | 228 (6.1%) |
| $2,500 to $4,999 | 145 (3.2%) | 139 (3.7%) |
| $5,000 to $7,499 | 79 (1.8%) | 148 (4.0%) |
| $7,500 to $9,999 | 41 (0.9%) | 104 (2.8%) |
| $10,000 to $12,499 | 155 (3.5%) | 73 (2.0%) |
| $12,500 to $14,999 | 185 (4.1%) | 80 (2.2%) |
| $15,000 to $17,499 | 78 (1.7%) | 209 (5.6%) |
| $17,500 to $19,999 | 161 (3.6%) | 55 (1.5%) |
| $20,000 to $22,499 | 68 (1.5%) | 65 (1.8%) |
| $22,500 to $24,999 | 17 (0.4%) | 93 (2.5%) |
| $25,000 to $29,999 | 101 (2.3%) | 236 (6.4%) |
| $30,000 to $34,999 | 132 (2.9%) | 343 (9.2%) |
| $35,000 to $39,999 | 69 (1.5%) | 203 (5.5%) |
| $40,000 to $44,999 | 162 (3.6%) | 117 (3.2%) |
| $45,000 to $49,999 | 212 (4.7%) | 139 (3.7%) |
| $50,000 to $54,999 | 133 (3.0%) | 189 (5.1%) |
| $55,000 to $64,999 | 263 (5.9%) | 387 (10.4%) |
| $65,000 to $74,999 | 418 (9.3%) | 155 (4.2%) |
| $75,000 to $99,999 | 711 (15.9%) | 371 (10.0%) |
| $100,000+ | 1,223 (27.4%) | 376 (10.1%) |
| Total | 4,470 (100.0%) | 3,710 (100.0%) |
Earnings by Sex by Educational Attainment in Wilmington Island
Average earnings in Wilmington Island are $71,602 for men and $39,569 for women, a difference of 44.7%. Men with an educational attainment of bachelor's degree enjoy the highest average annual earnings of $91,740, while those with high school diploma education earn the least with $42,408. Women with an educational attainment of graduate degree earn the most with the average annual earnings of $53,424, while those with high school diploma education have the smallest earnings of $15,160.
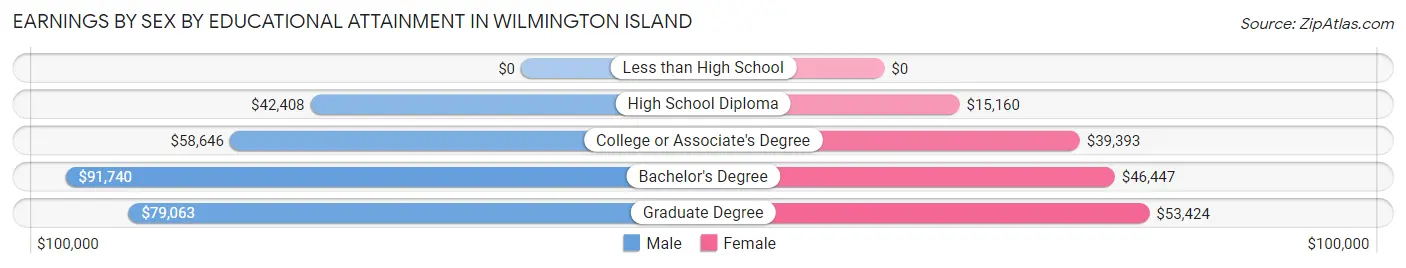
| Educational Attainment | Male Income | Female Income |
| Less than High School | - | - |
| High School Diploma | $42,408 | $15,160 |
| College or Associate's Degree | $58,646 | $39,393 |
| Bachelor's Degree | $91,740 | $46,447 |
| Graduate Degree | $79,063 | $53,424 |
| Total | $71,602 | $39,569 |
Family Income in Wilmington Island
Family Income Brackets in Wilmington Island
According to the Wilmington Island family income data, there are 947 families falling into the $100,000 to $149,999 income range, which is the most common income bracket and makes up 23.0% of all families. Conversely, the $15,000 to $24,999 income bracket is the least frequent group with only 41 families (1.0%) belonging to this category.
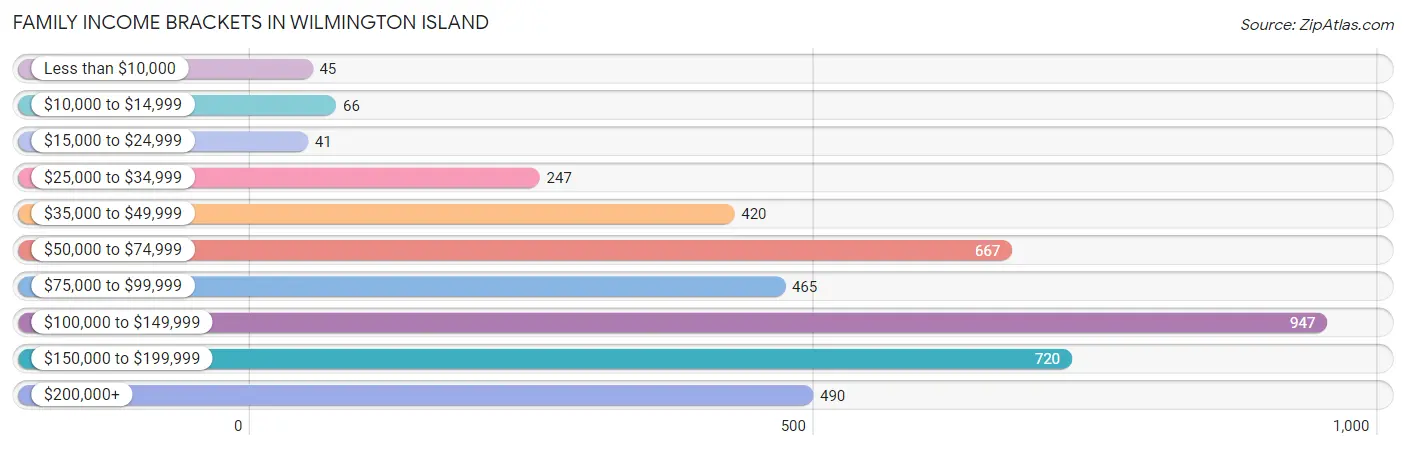
| Income Bracket | # Families | % Families |
| Less than $10,000 | 45 | 1.1% |
| $10,000 to $14,999 | 66 | 1.6% |
| $15,000 to $24,999 | 41 | 1.0% |
| $25,000 to $34,999 | 247 | 6.0% |
| $35,000 to $49,999 | 420 | 10.2% |
| $50,000 to $74,999 | 667 | 16.2% |
| $75,000 to $99,999 | 465 | 11.3% |
| $100,000 to $149,999 | 947 | 23.0% |
| $150,000 to $199,999 | 720 | 17.5% |
| $200,000+ | 490 | 11.9% |
Family Income by Famaliy Size in Wilmington Island
4-person families (643 | 15.6%) account for the highest median family income in Wilmington Island with $155,821 per family, while 2-person families (1,996 | 48.5%) have the highest median income of $40,608 per family member.
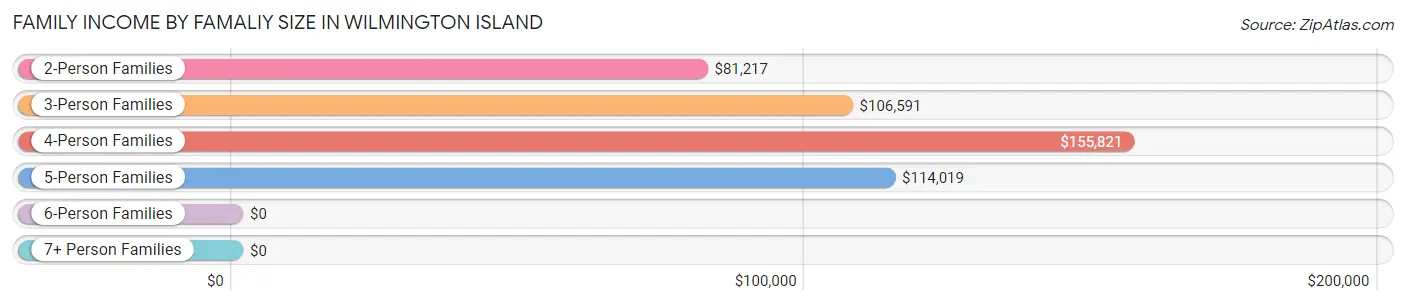
| Income Bracket | # Families | Median Income |
| 2-Person Families | 1,996 (48.5%) | $81,217 |
| 3-Person Families | 1,052 (25.6%) | $106,591 |
| 4-Person Families | 643 (15.6%) | $155,821 |
| 5-Person Families | 408 (9.9%) | $114,019 |
| 6-Person Families | 8 (0.2%) | $0 |
| 7+ Person Families | 10 (0.2%) | $0 |
| Total | 4,117 (100.0%) | $106,186 |
Family Income by Number of Earners in Wilmington Island
The median family income in Wilmington Island is $106,186, with families comprising 3+ earners (520) having the highest median family income of $169,286, while families with no earners (860) have the lowest median family income of $54,423, accounting for 12.6% and 20.9% of families, respectively.
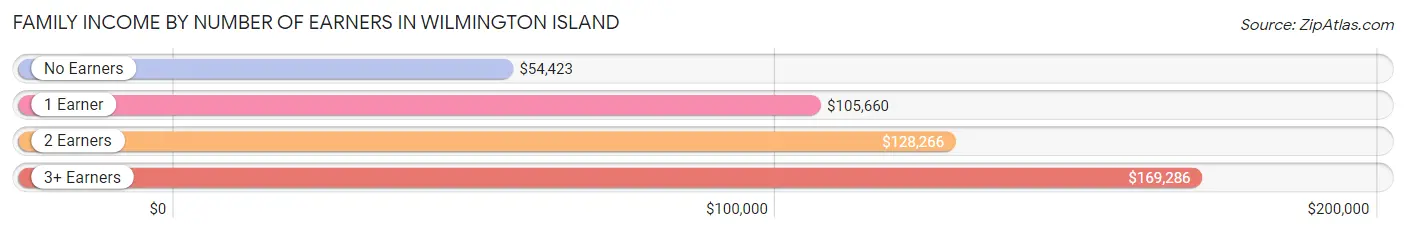
| Number of Earners | # Families | Median Income |
| No Earners | 860 (20.9%) | $54,423 |
| 1 Earner | 1,022 (24.8%) | $105,660 |
| 2 Earners | 1,715 (41.7%) | $128,266 |
| 3+ Earners | 520 (12.6%) | $169,286 |
| Total | 4,117 (100.0%) | $106,186 |
Household Income in Wilmington Island
Household Income Brackets in Wilmington Island
With 1,381 households falling in the category, the $100,000 to $149,999 income range is the most frequent in Wilmington Island, accounting for 22.1% of all households. In contrast, only 119 households (1.9%) fall into the less than $10,000 income bracket, making it the least populous group.
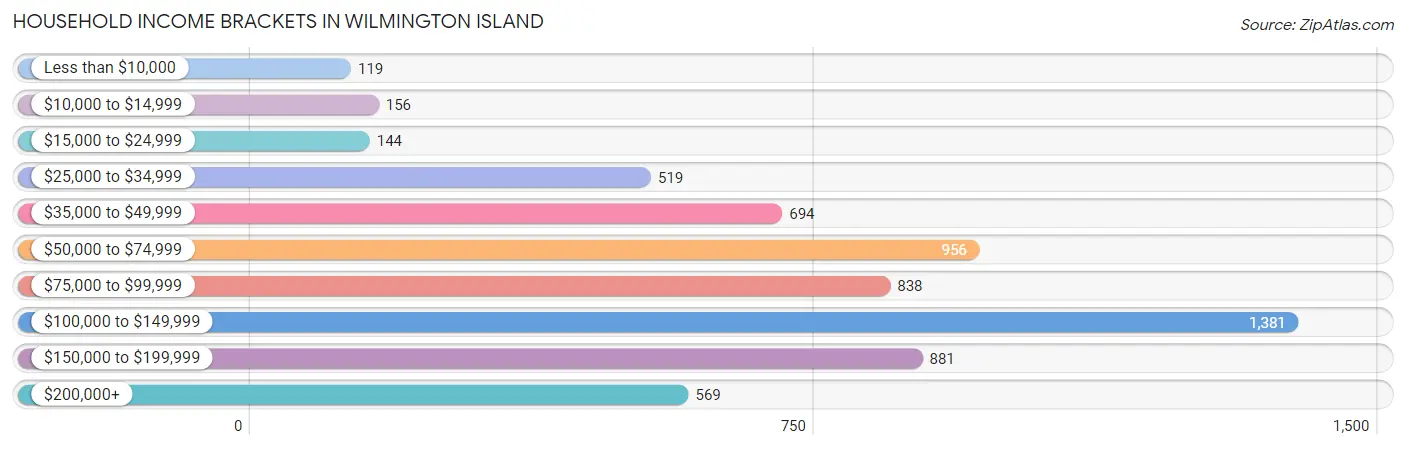
| Income Bracket | # Households | % Households |
| Less than $10,000 | 119 | 1.9% |
| $10,000 to $14,999 | 156 | 2.5% |
| $15,000 to $24,999 | 144 | 2.3% |
| $25,000 to $34,999 | 519 | 8.3% |
| $35,000 to $49,999 | 694 | 11.1% |
| $50,000 to $74,999 | 956 | 15.3% |
| $75,000 to $99,999 | 838 | 13.4% |
| $100,000 to $149,999 | 1,381 | 22.1% |
| $150,000 to $199,999 | 881 | 14.1% |
| $200,000+ | 569 | 9.1% |
Household Income by Householder Age in Wilmington Island
The median household income in Wilmington Island is $87,441, with the highest median household income of $113,839 found in the 25 to 44 years age bracket for the primary householder. A total of 1,993 households (31.9%) fall into this category. Meanwhile, the 15 to 24 years age bracket for the primary householder has the lowest median household income of $0, with 38 households (0.6%) in this group.
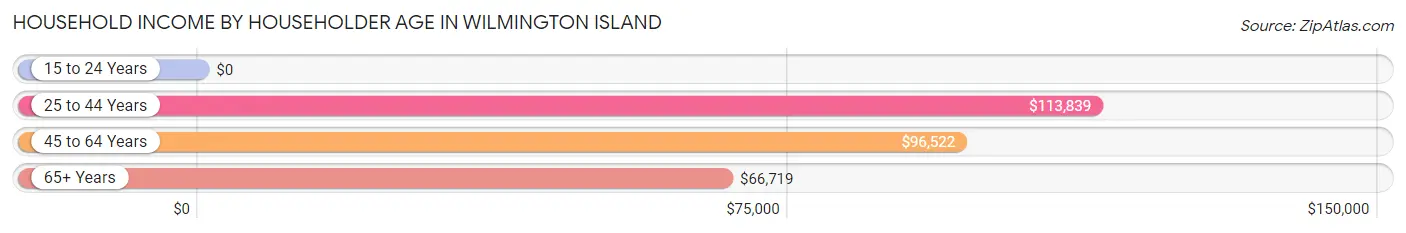
| Income Bracket | # Households | Median Income |
| 15 to 24 Years | 38 (0.6%) | $0 |
| 25 to 44 Years | 1,993 (31.9%) | $113,839 |
| 45 to 64 Years | 2,188 (35.0%) | $96,522 |
| 65+ Years | 2,031 (32.5%) | $66,719 |
| Total | 6,250 (100.0%) | $87,441 |
Poverty in Wilmington Island
Income Below Poverty by Sex and Age in Wilmington Island
With 4.0% poverty level for males and 4.3% for females among the residents of Wilmington Island, 15 year old males and 16 and 17 year old females are the most vulnerable to poverty, with 21 males (18.3%) and 16 females (13.3%) in their respective age groups living below the poverty level.
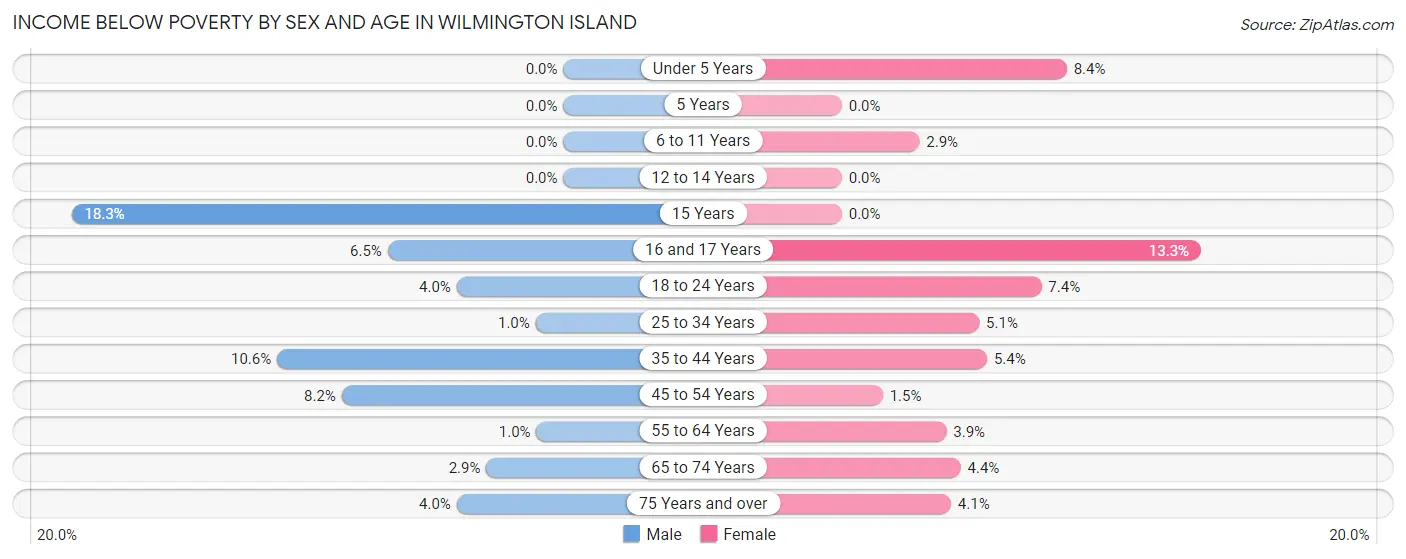
| Age Bracket | Male | Female |
| Under 5 Years | 0 (0.0%) | 48 (8.4%) |
| 5 Years | 0 (0.0%) | 0 (0.0%) |
| 6 to 11 Years | 0 (0.0%) | 13 (2.9%) |
| 12 to 14 Years | 0 (0.0%) | 0 (0.0%) |
| 15 Years | 21 (18.3%) | 0 (0.0%) |
| 16 and 17 Years | 12 (6.5%) | 16 (13.3%) |
| 18 to 24 Years | 18 (4.0%) | 16 (7.4%) |
| 25 to 34 Years | 9 (1.0%) | 44 (5.1%) |
| 35 to 44 Years | 116 (10.6%) | 68 (5.4%) |
| 45 to 54 Years | 54 (8.2%) | 13 (1.5%) |
| 55 to 64 Years | 13 (1.0%) | 46 (3.9%) |
| 65 to 74 Years | 27 (2.9%) | 49 (4.4%) |
| 75 Years and over | 22 (4.0%) | 25 (4.1%) |
| Total | 292 (4.0%) | 338 (4.3%) |
Income Above Poverty by Sex and Age in Wilmington Island
According to the poverty statistics in Wilmington Island, males aged under 5 years and females aged 5 years are the age groups that are most secure financially, with 100.0% of males and 100.0% of females in these age groups living above the poverty line.
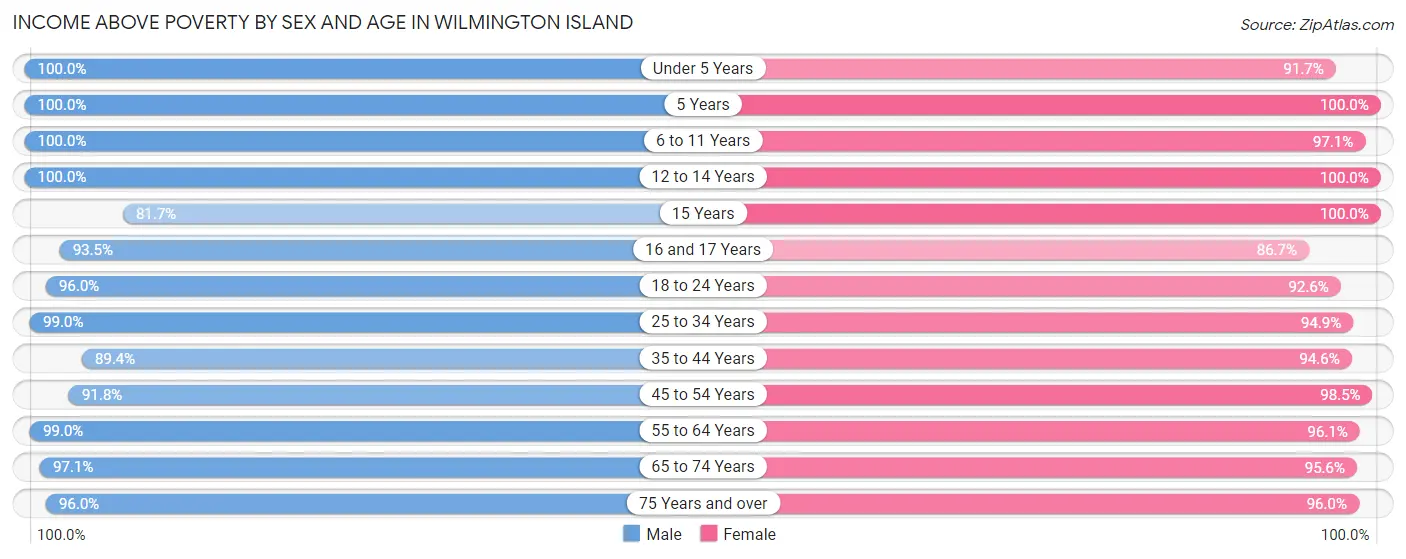
| Age Bracket | Male | Female |
| Under 5 Years | 404 (100.0%) | 527 (91.6%) |
| 5 Years | 15 (100.0%) | 209 (100.0%) |
| 6 to 11 Years | 525 (100.0%) | 439 (97.1%) |
| 12 to 14 Years | 166 (100.0%) | 221 (100.0%) |
| 15 Years | 94 (81.7%) | 132 (100.0%) |
| 16 and 17 Years | 172 (93.5%) | 104 (86.7%) |
| 18 to 24 Years | 437 (96.0%) | 200 (92.6%) |
| 25 to 34 Years | 867 (99.0%) | 819 (94.9%) |
| 35 to 44 Years | 975 (89.4%) | 1,194 (94.6%) |
| 45 to 54 Years | 602 (91.8%) | 843 (98.5%) |
| 55 to 64 Years | 1,284 (99.0%) | 1,139 (96.1%) |
| 65 to 74 Years | 918 (97.1%) | 1,062 (95.6%) |
| 75 Years and over | 533 (96.0%) | 592 (96.0%) |
| Total | 6,992 (96.0%) | 7,481 (95.7%) |
Income Below Poverty Among Married-Couple Families in Wilmington Island
The poverty statistics for married-couple families in Wilmington Island show that 3.5% or 125 of the total 3,623 families live below the poverty line. Families with 1 or 2 children have the highest poverty rate of 4.9%, comprising of 54 families. On the other hand, families with 3 or 4 children have the lowest poverty rate of 0.0%, which includes 0 families.
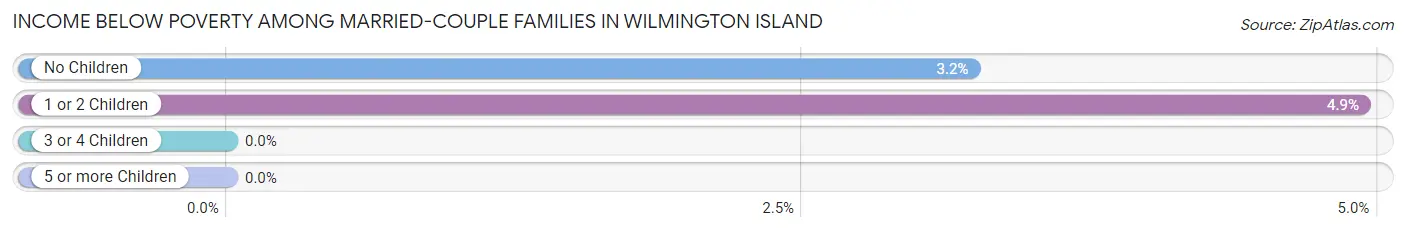
| Children | Above Poverty | Below Poverty |
| No Children | 2,128 (96.8%) | 71 (3.2%) |
| 1 or 2 Children | 1,042 (95.1%) | 54 (4.9%) |
| 3 or 4 Children | 318 (100.0%) | 0 (0.0%) |
| 5 or more Children | 10 (100.0%) | 0 (0.0%) |
| Total | 3,498 (96.6%) | 125 (3.5%) |
Income Below Poverty Among Single-Parent Households in Wilmington Island
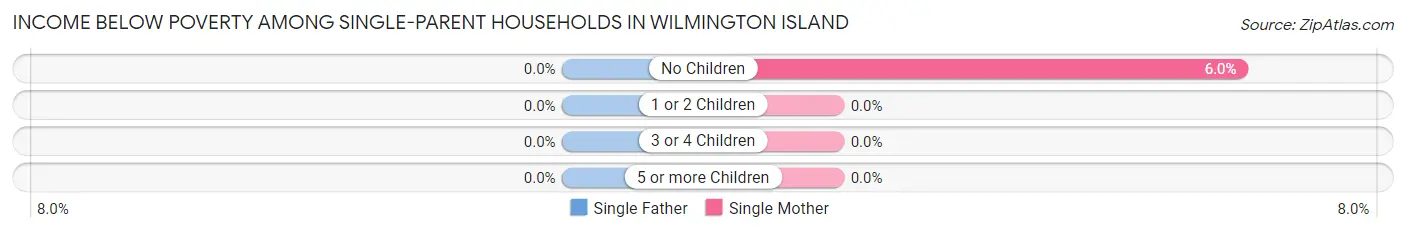
| Children | Single Father | Single Mother |
| No Children | 0 (0.0%) | 17 (6.0%) |
| 1 or 2 Children | 0 (0.0%) | 0 (0.0%) |
| 3 or 4 Children | 0 (0.0%) | 0 (0.0%) |
| 5 or more Children | 0 (0.0%) | 0 (0.0%) |
| Total | 0 (0.0%) | 17 (4.1%) |
Income Below Poverty Among Married-Couple vs Single-Parent Households in Wilmington Island
The poverty data for Wilmington Island shows that 125 of the married-couple family households (3.5%) and 17 of the single-parent households (3.4%) are living below the poverty level. Within the married-couple family households, those with 1 or 2 children have the highest poverty rate, with 54 households (4.9%) falling below the poverty line. Among the single-parent households, those with no children have the highest poverty rate, with 17 household (5.2%) living below poverty.
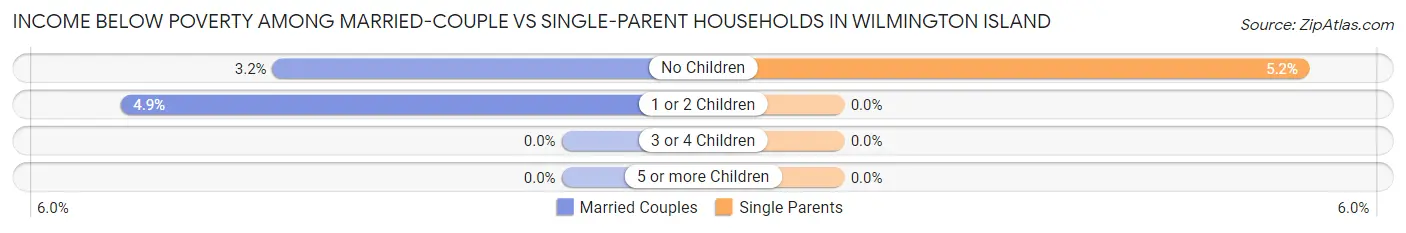
| Children | Married-Couple Families | Single-Parent Households |
| No Children | 71 (3.2%) | 17 (5.2%) |
| 1 or 2 Children | 54 (4.9%) | 0 (0.0%) |
| 3 or 4 Children | 0 (0.0%) | 0 (0.0%) |
| 5 or more Children | 0 (0.0%) | 0 (0.0%) |
| Total | 125 (3.5%) | 17 (3.4%) |
Employment Characteristics in Wilmington Island
Employment by Class of Employer in Wilmington Island
Among the 7,684 employed individuals in Wilmington Island, private company employees (5,273 | 68.6%), self-employed (not incorporated) (758 | 9.9%), and state government employees (411 | 5.3%) make up the most common classes of employment.
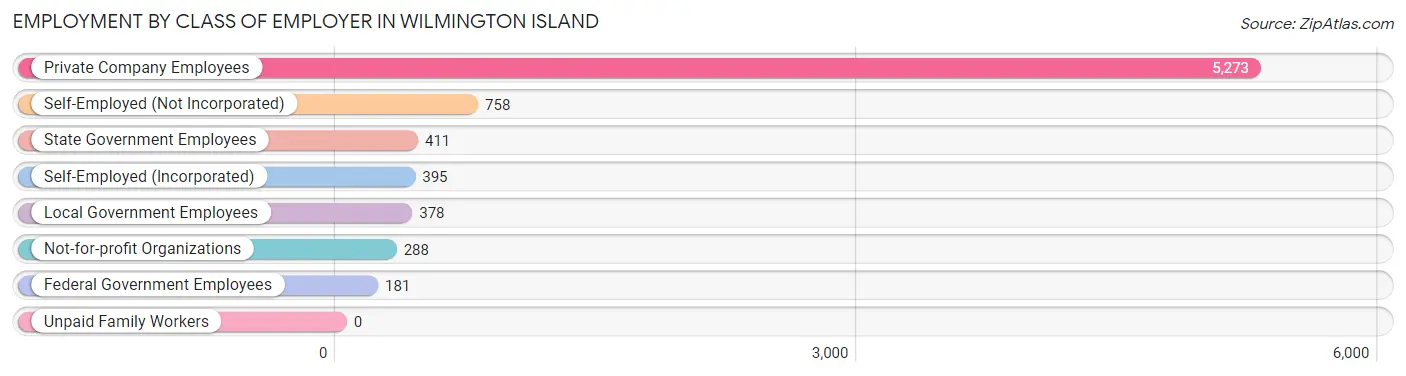
| Employer Class | # Employees | % Employees |
| Private Company Employees | 5,273 | 68.6% |
| Self-Employed (Incorporated) | 395 | 5.1% |
| Self-Employed (Not Incorporated) | 758 | 9.9% |
| Not-for-profit Organizations | 288 | 3.7% |
| Local Government Employees | 378 | 4.9% |
| State Government Employees | 411 | 5.3% |
| Federal Government Employees | 181 | 2.4% |
| Unpaid Family Workers | 0 | 0.0% |
| Total | 7,684 | 100.0% |
Employment Status by Age in Wilmington Island
According to the labor force statistics for Wilmington Island, out of the total population over 16 years of age (12,358), 65.0% or 8,033 individuals are in the labor force, with 3.3% or 265 of them unemployed. The age group with the highest labor force participation rate is 25 to 29 years, with 96.6% or 800 individuals in the labor force. Within the labor force, the 20 to 24 years age range has the highest percentage of unemployed individuals, with 12.9% or 36 of them being unemployed.
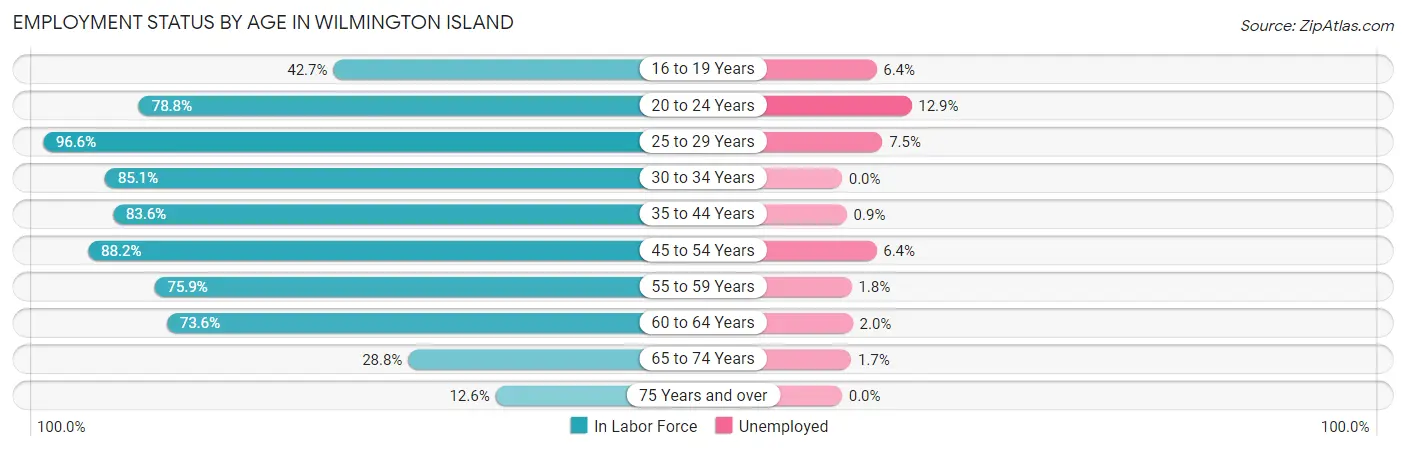
| Age Bracket | In Labor Force | Unemployed |
| 16 to 19 Years | 265 (42.7%) | 17 (6.4%) |
| 20 to 24 Years | 279 (78.8%) | 36 (12.9%) |
| 25 to 29 Years | 800 (96.6%) | 60 (7.5%) |
| 30 to 34 Years | 775 (85.1%) | 0 (0.0%) |
| 35 to 44 Years | 1,967 (83.6%) | 18 (0.9%) |
| 45 to 54 Years | 1,334 (88.2%) | 85 (6.4%) |
| 55 to 59 Years | 1,006 (75.9%) | 18 (1.8%) |
| 60 to 64 Years | 852 (73.6%) | 17 (2.0%) |
| 65 to 74 Years | 594 (28.8%) | 10 (1.7%) |
| 75 Years and over | 155 (12.6%) | 0 (0.0%) |
| Total | 8,033 (65.0%) | 265 (3.3%) |
Employment Status by Educational Attainment in Wilmington Island
According to labor force statistics for Wilmington Island, 83.3% of individuals (6,736) out of the total population between 25 and 64 years of age (8,086) are in the labor force, with 2.9% or 195 of them being unemployed. The group with the highest labor force participation rate are those with the educational attainment of less than high school, with 99.0% or 98 individuals in the labor force. Within the labor force, individuals with high school diploma education have the highest percentage of unemployment, with 6.7% or 64 of them being unemployed.
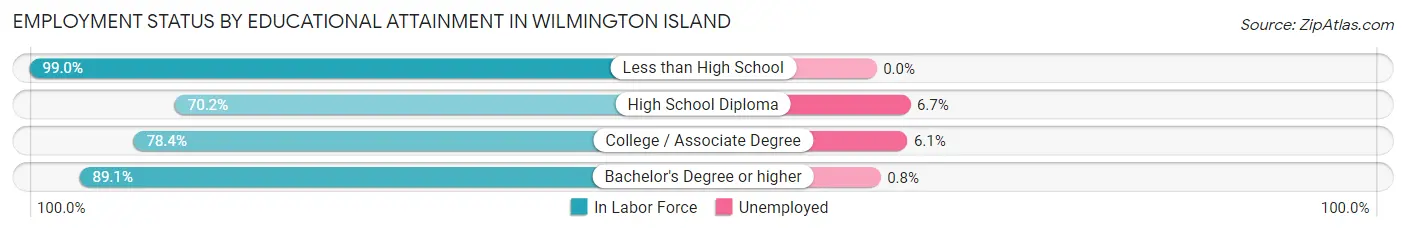
| Educational Attainment | In Labor Force | Unemployed |
| Less than High School | 98 (99.0%) | 0 (0.0%) |
| High School Diploma | 960 (70.2%) | 92 (6.7%) |
| College / Associate Degree | 1,644 (78.4%) | 128 (6.1%) |
| Bachelor's Degree or higher | 4,030 (89.1%) | 36 (0.8%) |
| Total | 6,736 (83.3%) | 234 (2.9%) |
Employment Occupations by Sex in Wilmington Island
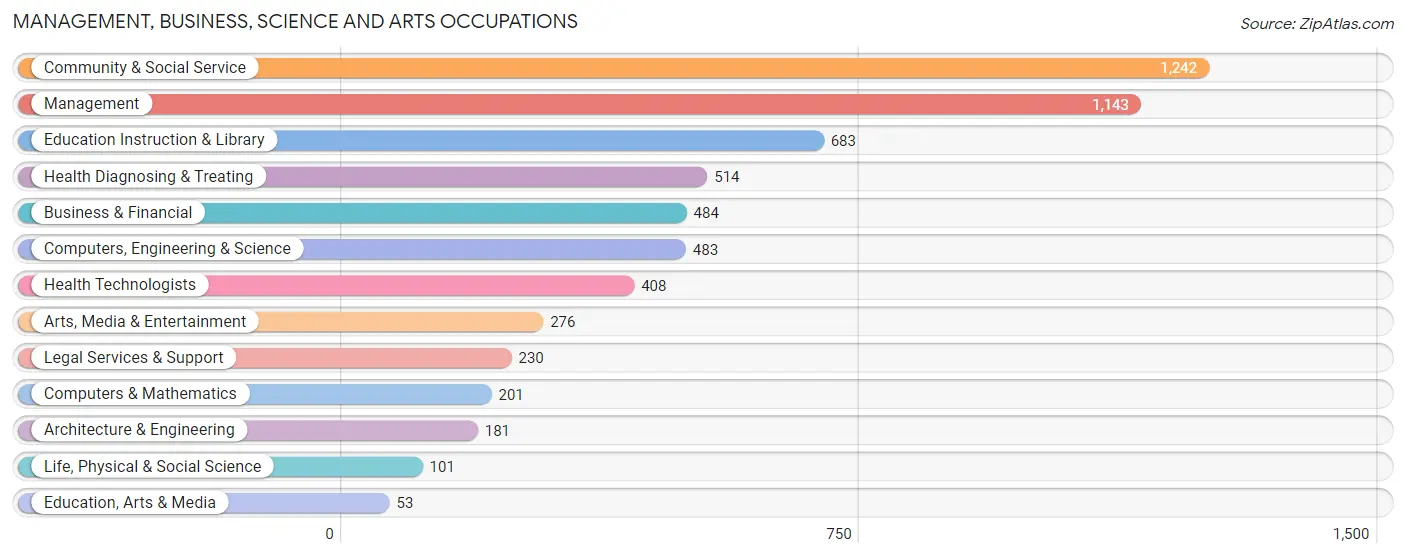
Management, Business, Science and Arts Occupations
The most common Management, Business, Science and Arts occupations in Wilmington Island are Community & Social Service (1,242 | 16.0%), Management (1,143 | 14.7%), Education Instruction & Library (683 | 8.8%), Health Diagnosing & Treating (514 | 6.6%), and Business & Financial (484 | 6.2%).
Management, Business, Science and Arts Occupations by Sex
Within the Management, Business, Science and Arts occupations in Wilmington Island, the most male-oriented occupations are Architecture & Engineering (100.0%), Life, Physical & Social Science (100.0%), and Computers, Engineering & Science (91.1%), while the most female-oriented occupations are Education, Arts & Media (69.8%), Education Instruction & Library (69.4%), and Arts, Media & Entertainment (67.0%).
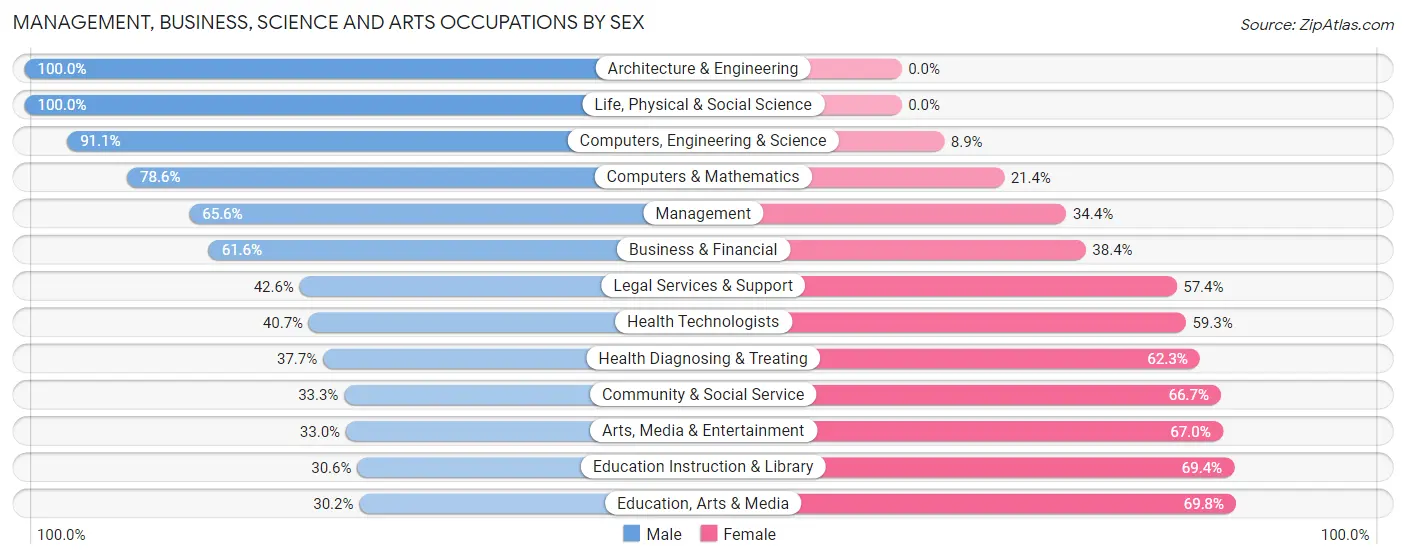
| Occupation | Male | Female |
| Management | 750 (65.6%) | 393 (34.4%) |
| Business & Financial | 298 (61.6%) | 186 (38.4%) |
| Computers, Engineering & Science | 440 (91.1%) | 43 (8.9%) |
| Computers & Mathematics | 158 (78.6%) | 43 (21.4%) |
| Architecture & Engineering | 181 (100.0%) | 0 (0.0%) |
| Life, Physical & Social Science | 101 (100.0%) | 0 (0.0%) |
| Community & Social Service | 414 (33.3%) | 828 (66.7%) |
| Education, Arts & Media | 16 (30.2%) | 37 (69.8%) |
| Legal Services & Support | 98 (42.6%) | 132 (57.4%) |
| Education Instruction & Library | 209 (30.6%) | 474 (69.4%) |
| Arts, Media & Entertainment | 91 (33.0%) | 185 (67.0%) |
| Health Diagnosing & Treating | 194 (37.7%) | 320 (62.3%) |
| Health Technologists | 166 (40.7%) | 242 (59.3%) |
| Total (Category) | 2,096 (54.2%) | 1,770 (45.8%) |
| Total (Overall) | 4,286 (55.2%) | 3,480 (44.8%) |
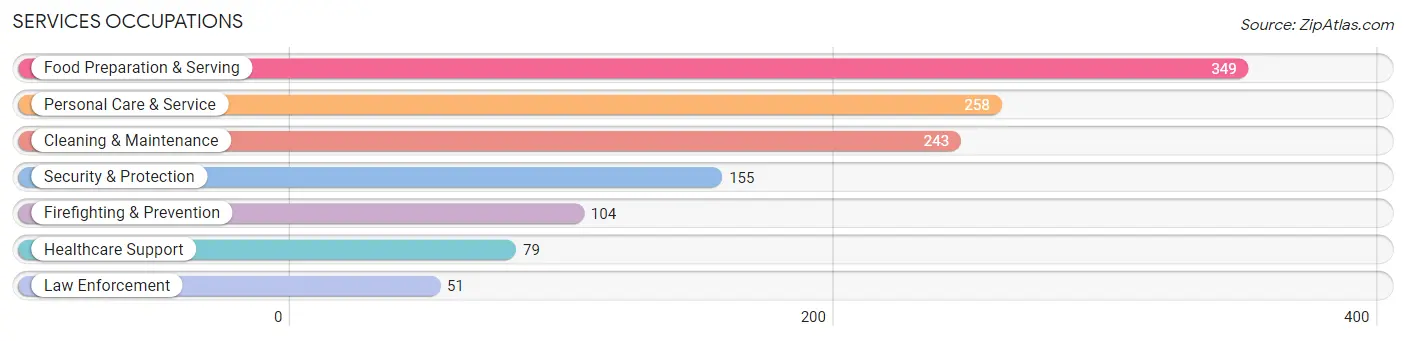
Services Occupations
The most common Services occupations in Wilmington Island are Food Preparation & Serving (349 | 4.5%), Personal Care & Service (258 | 3.3%), Cleaning & Maintenance (243 | 3.1%), Security & Protection (155 | 2.0%), and Firefighting & Prevention (104 | 1.3%).
Services Occupations by Sex
Within the Services occupations in Wilmington Island, the most male-oriented occupations are Law Enforcement (100.0%), Security & Protection (89.7%), and Firefighting & Prevention (84.6%), while the most female-oriented occupations are Healthcare Support (100.0%), Personal Care & Service (50.0%), and Cleaning & Maintenance (28.8%).
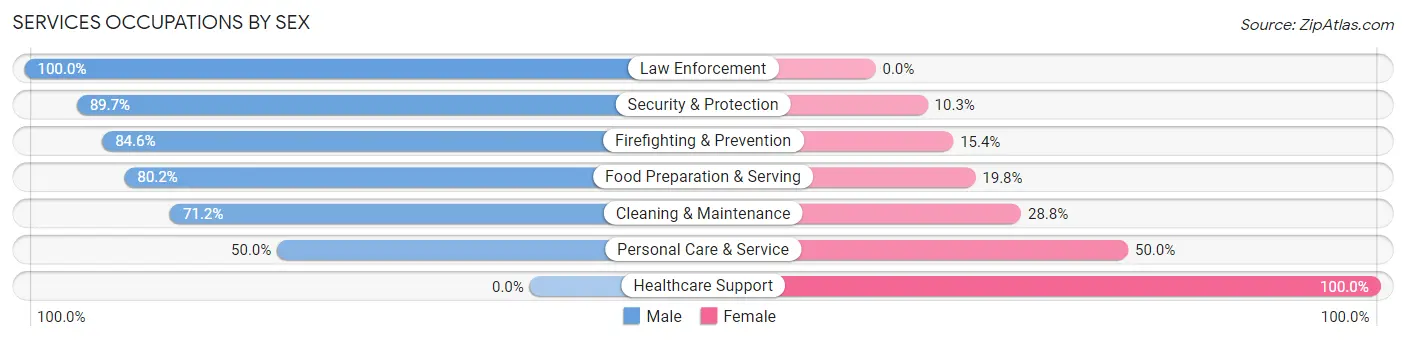
| Occupation | Male | Female |
| Healthcare Support | 0 (0.0%) | 79 (100.0%) |
| Security & Protection | 139 (89.7%) | 16 (10.3%) |
| Firefighting & Prevention | 88 (84.6%) | 16 (15.4%) |
| Law Enforcement | 51 (100.0%) | 0 (0.0%) |
| Food Preparation & Serving | 280 (80.2%) | 69 (19.8%) |
| Cleaning & Maintenance | 173 (71.2%) | 70 (28.8%) |
| Personal Care & Service | 129 (50.0%) | 129 (50.0%) |
| Total (Category) | 721 (66.5%) | 363 (33.5%) |
| Total (Overall) | 4,286 (55.2%) | 3,480 (44.8%) |
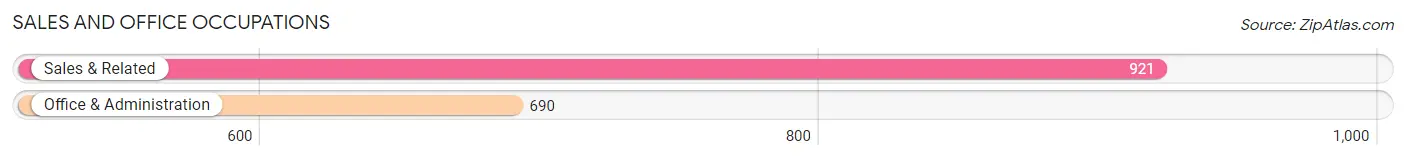
Sales and Office Occupations
The most common Sales and Office occupations in Wilmington Island are Sales & Related (921 | 11.9%), and Office & Administration (690 | 8.9%).
Sales and Office Occupations by Sex
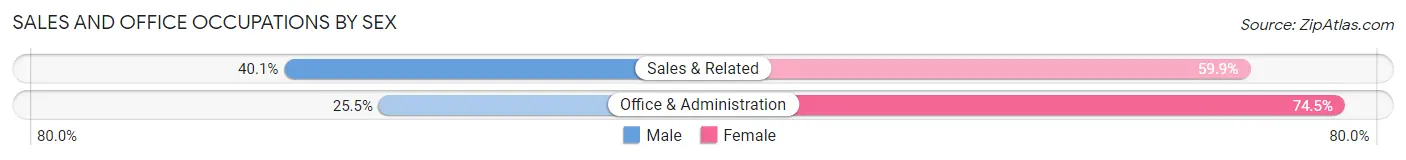
| Occupation | Male | Female |
| Sales & Related | 369 (40.1%) | 552 (59.9%) |
| Office & Administration | 176 (25.5%) | 514 (74.5%) |
| Total (Category) | 545 (33.8%) | 1,066 (66.2%) |
| Total (Overall) | 4,286 (55.2%) | 3,480 (44.8%) |
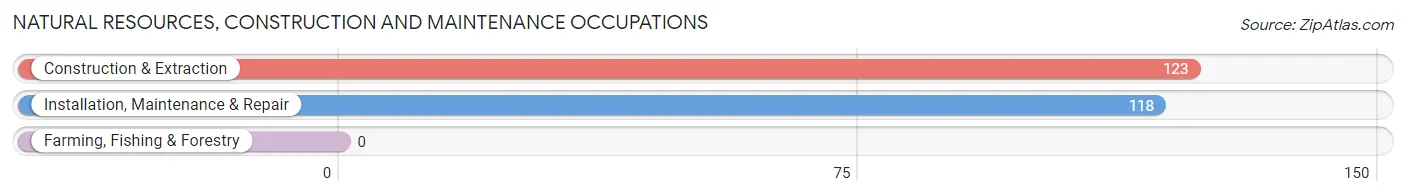
Natural Resources, Construction and Maintenance Occupations
The most common Natural Resources, Construction and Maintenance occupations in Wilmington Island are Construction & Extraction (123 | 1.6%), and Installation, Maintenance & Repair (118 | 1.5%).
Natural Resources, Construction and Maintenance Occupations by Sex
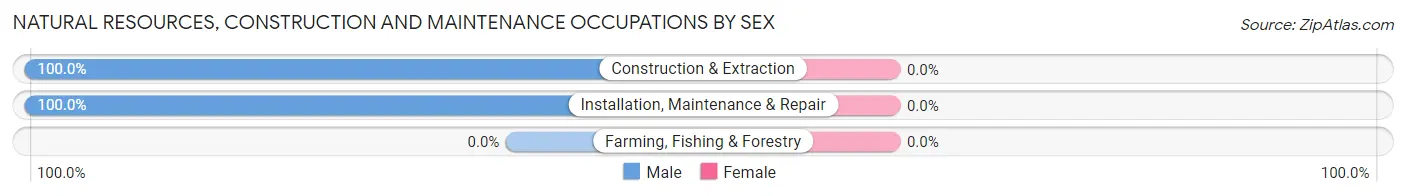
| Occupation | Male | Female |
| Farming, Fishing & Forestry | 0 (0.0%) | 0 (0.0%) |
| Construction & Extraction | 123 (100.0%) | 0 (0.0%) |
| Installation, Maintenance & Repair | 118 (100.0%) | 0 (0.0%) |
| Total (Category) | 241 (100.0%) | 0 (0.0%) |
| Total (Overall) | 4,286 (55.2%) | 3,480 (44.8%) |
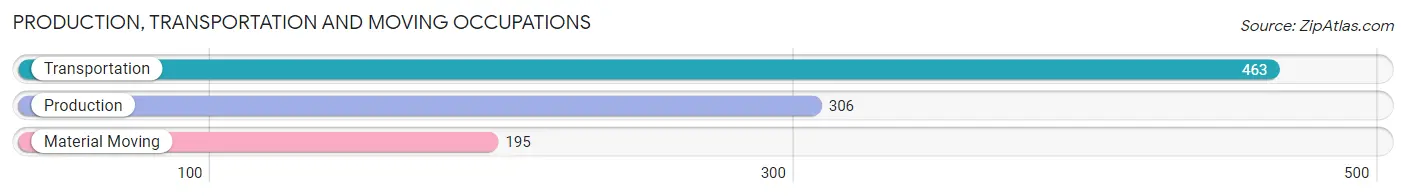
Production, Transportation and Moving Occupations
The most common Production, Transportation and Moving occupations in Wilmington Island are Transportation (463 | 6.0%), Production (306 | 3.9%), and Material Moving (195 | 2.5%).
Production, Transportation and Moving Occupations by Sex
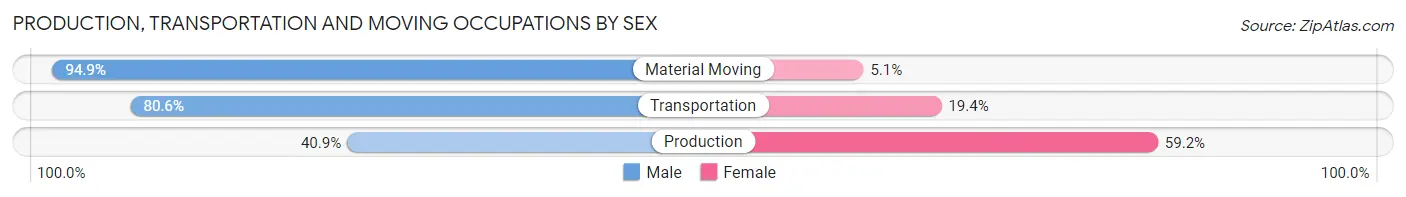
| Occupation | Male | Female |
| Production | 125 (40.8%) | 181 (59.2%) |
| Transportation | 373 (80.6%) | 90 (19.4%) |
| Material Moving | 185 (94.9%) | 10 (5.1%) |
| Total (Category) | 683 (70.9%) | 281 (29.1%) |
| Total (Overall) | 4,286 (55.2%) | 3,480 (44.8%) |
Employment Industries by Sex in Wilmington Island
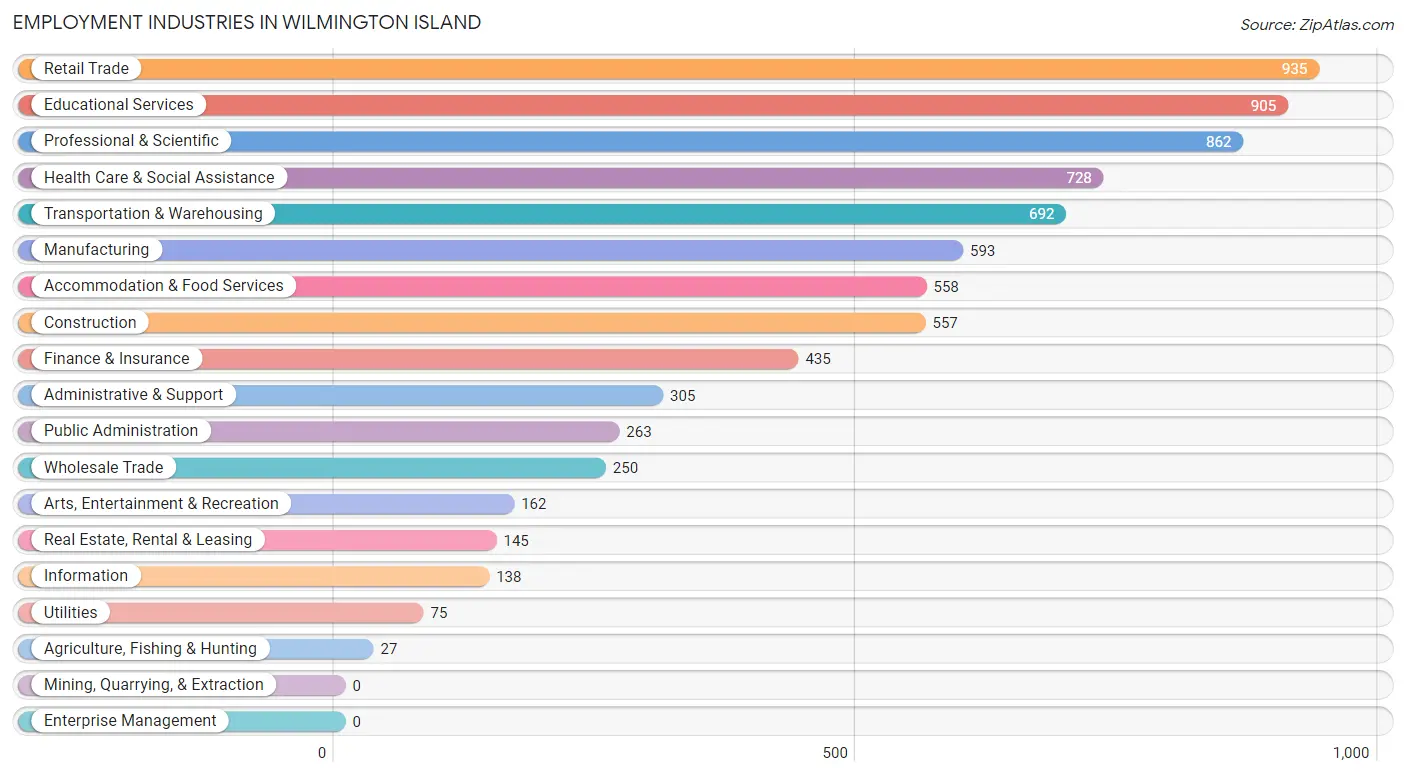
Employment Industries in Wilmington Island
The major employment industries in Wilmington Island include Retail Trade (935 | 12.0%), Educational Services (905 | 11.7%), Professional & Scientific (862 | 11.1%), Health Care & Social Assistance (728 | 9.4%), and Transportation & Warehousing (692 | 8.9%).
Employment Industries by Sex in Wilmington Island
The Wilmington Island industries that see more men than women are Agriculture, Fishing & Hunting (100.0%), Utilities (100.0%), and Construction (91.2%), whereas the industries that tend to have a higher number of women are Educational Services (68.8%), Health Care & Social Assistance (67.4%), and Retail Trade (59.4%).
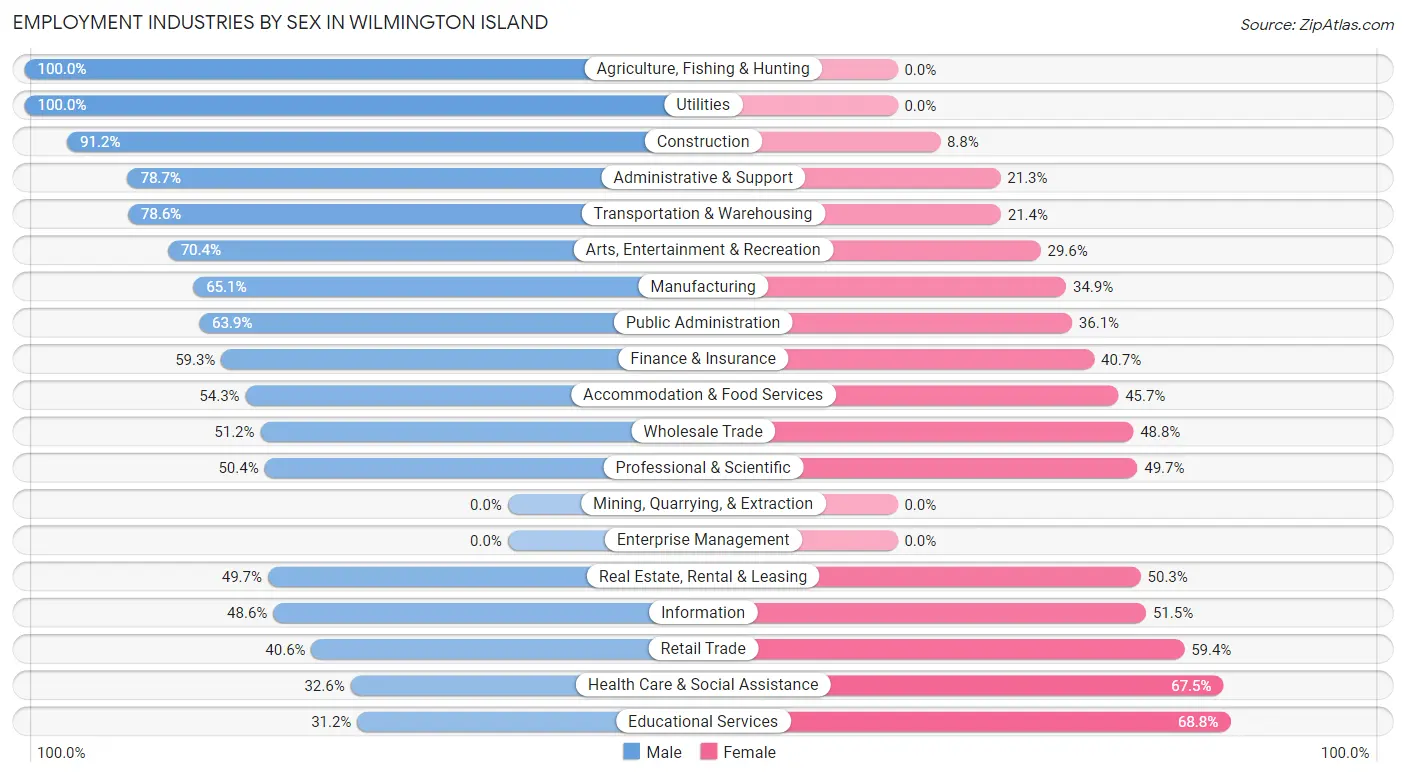
| Industry | Male | Female |
| Agriculture, Fishing & Hunting | 27 (100.0%) | 0 (0.0%) |
| Mining, Quarrying, & Extraction | 0 (0.0%) | 0 (0.0%) |
| Construction | 508 (91.2%) | 49 (8.8%) |
| Manufacturing | 386 (65.1%) | 207 (34.9%) |
| Wholesale Trade | 128 (51.2%) | 122 (48.8%) |
| Retail Trade | 380 (40.6%) | 555 (59.4%) |
| Transportation & Warehousing | 544 (78.6%) | 148 (21.4%) |
| Utilities | 75 (100.0%) | 0 (0.0%) |
| Information | 67 (48.5%) | 71 (51.4%) |
| Finance & Insurance | 258 (59.3%) | 177 (40.7%) |
| Real Estate, Rental & Leasing | 72 (49.7%) | 73 (50.3%) |
| Professional & Scientific | 434 (50.3%) | 428 (49.6%) |
| Enterprise Management | 0 (0.0%) | 0 (0.0%) |
| Administrative & Support | 240 (78.7%) | 65 (21.3%) |
| Educational Services | 282 (31.2%) | 623 (68.8%) |
| Health Care & Social Assistance | 237 (32.6%) | 491 (67.4%) |
| Arts, Entertainment & Recreation | 114 (70.4%) | 48 (29.6%) |
| Accommodation & Food Services | 303 (54.3%) | 255 (45.7%) |
| Public Administration | 168 (63.9%) | 95 (36.1%) |
| Total | 4,286 (55.2%) | 3,480 (44.8%) |
Education in Wilmington Island
School Enrollment in Wilmington Island
The most common levels of schooling among the 3,006 students in Wilmington Island are elementary school (820 | 27.3%), high school (775 | 25.8%), and middle school (461 | 15.3%).
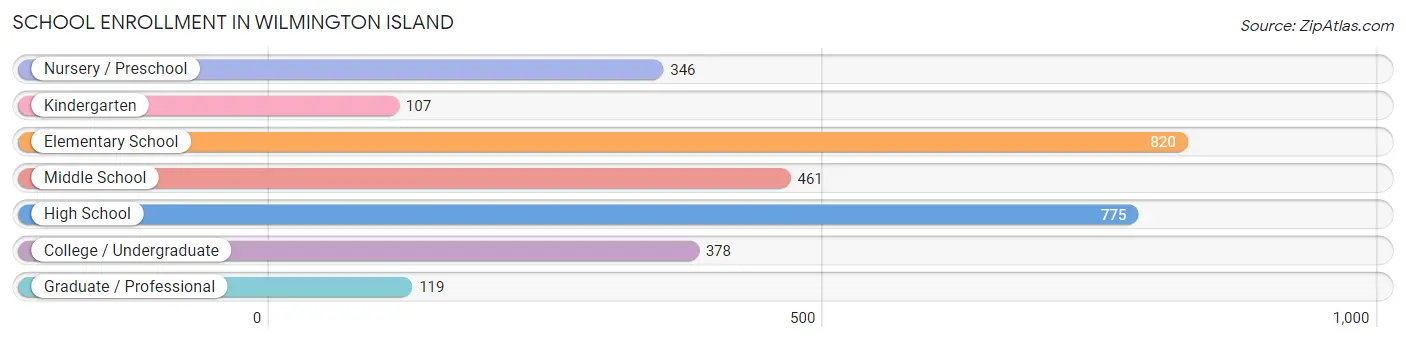
| School Level | # Students | % Students |
| Nursery / Preschool | 346 | 11.5% |
| Kindergarten | 107 | 3.6% |
| Elementary School | 820 | 27.3% |
| Middle School | 461 | 15.3% |
| High School | 775 | 25.8% |
| College / Undergraduate | 378 | 12.6% |
| Graduate / Professional | 119 | 4.0% |
| Total | 3,006 | 100.0% |
School Enrollment by Age by Funding Source in Wilmington Island
Out of a total of 3,006 students who are enrolled in schools in Wilmington Island, 1,347 (44.8%) attend a private institution, while the remaining 1,659 (55.2%) are enrolled in public schools. The age group of 3 to 4 year olds has the highest likelihood of being enrolled in private schools, with 150 (84.8% in the age bracket) enrolled. Conversely, the age group of 18 to 19 year olds has the lowest likelihood of being enrolled in a private school, with 246 (95.4% in the age bracket) attending a public institution.
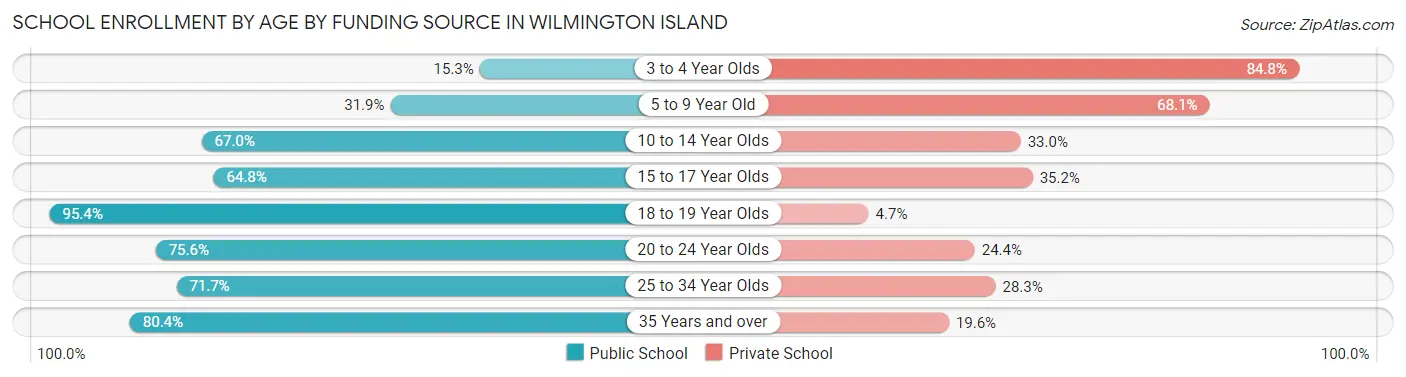
| Age Bracket | Public School | Private School |
| 3 to 4 Year Olds | 27 (15.2%) | 150 (84.8%) |
| 5 to 9 Year Old | 328 (31.9%) | 701 (68.1%) |
| 10 to 14 Year Olds | 376 (67.0%) | 185 (33.0%) |
| 15 to 17 Year Olds | 357 (64.8%) | 194 (35.2%) |
| 18 to 19 Year Olds | 246 (95.4%) | 12 (4.6%) |
| 20 to 24 Year Olds | 133 (75.6%) | 43 (24.4%) |
| 25 to 34 Year Olds | 109 (71.7%) | 43 (28.3%) |
| 35 Years and over | 82 (80.4%) | 20 (19.6%) |
| Total | 1,659 (55.2%) | 1,347 (44.8%) |
Educational Attainment by Field of Study in Wilmington Island
Business (1,184 | 19.7%), education (804 | 13.4%), science & technology (800 | 13.3%), engineering (552 | 9.2%), and liberal arts & history (431 | 7.2%) are the most common fields of study among 5,997 individuals in Wilmington Island who have obtained a bachelor's degree or higher.
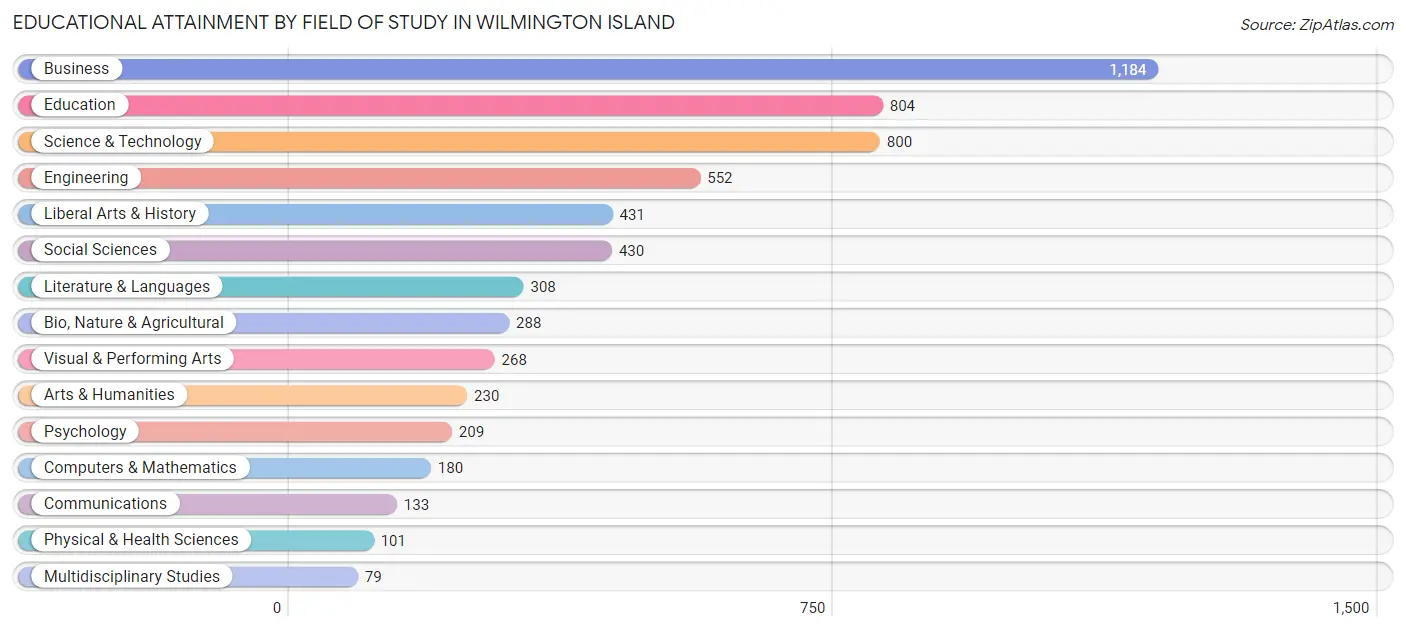
| Field of Study | # Graduates | % Graduates |
| Computers & Mathematics | 180 | 3.0% |
| Bio, Nature & Agricultural | 288 | 4.8% |
| Physical & Health Sciences | 101 | 1.7% |
| Psychology | 209 | 3.5% |
| Social Sciences | 430 | 7.2% |
| Engineering | 552 | 9.2% |
| Multidisciplinary Studies | 79 | 1.3% |
| Science & Technology | 800 | 13.3% |
| Business | 1,184 | 19.7% |
| Education | 804 | 13.4% |
| Literature & Languages | 308 | 5.1% |
| Liberal Arts & History | 431 | 7.2% |
| Visual & Performing Arts | 268 | 4.5% |
| Communications | 133 | 2.2% |
| Arts & Humanities | 230 | 3.8% |
| Total | 5,997 | 100.0% |
Transportation & Commute in Wilmington Island
Vehicle Availability by Sex in Wilmington Island
The most prevalent vehicle ownership categories in Wilmington Island are males with 2 vehicles (2,184, accounting for 51.3%) and females with 2 vehicles (1,573, making up 63.8%).
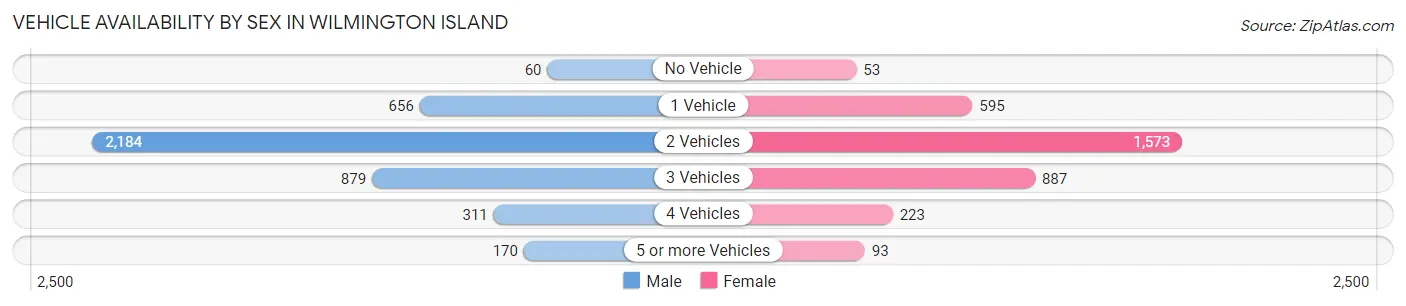
| Vehicles Available | Male | Female |
| No Vehicle | 60 (1.4%) | 53 (1.5%) |
| 1 Vehicle | 656 (15.4%) | 595 (17.4%) |
| 2 Vehicles | 2,184 (51.3%) | 1,573 (45.9%) |
| 3 Vehicles | 879 (20.6%) | 887 (25.9%) |
| 4 Vehicles | 311 (7.3%) | 223 (6.5%) |
| 5 or more Vehicles | 170 (4.0%) | 93 (2.7%) |
| Total | 4,260 (100.0%) | 3,424 (100.0%) |
Commute Time in Wilmington Island
The most frequently occuring commute durations in Wilmington Island are 20 to 24 minutes (1,429 commuters, 20.2%), 30 to 34 minutes (1,118 commuters, 15.8%), and 15 to 19 minutes (942 commuters, 13.3%).
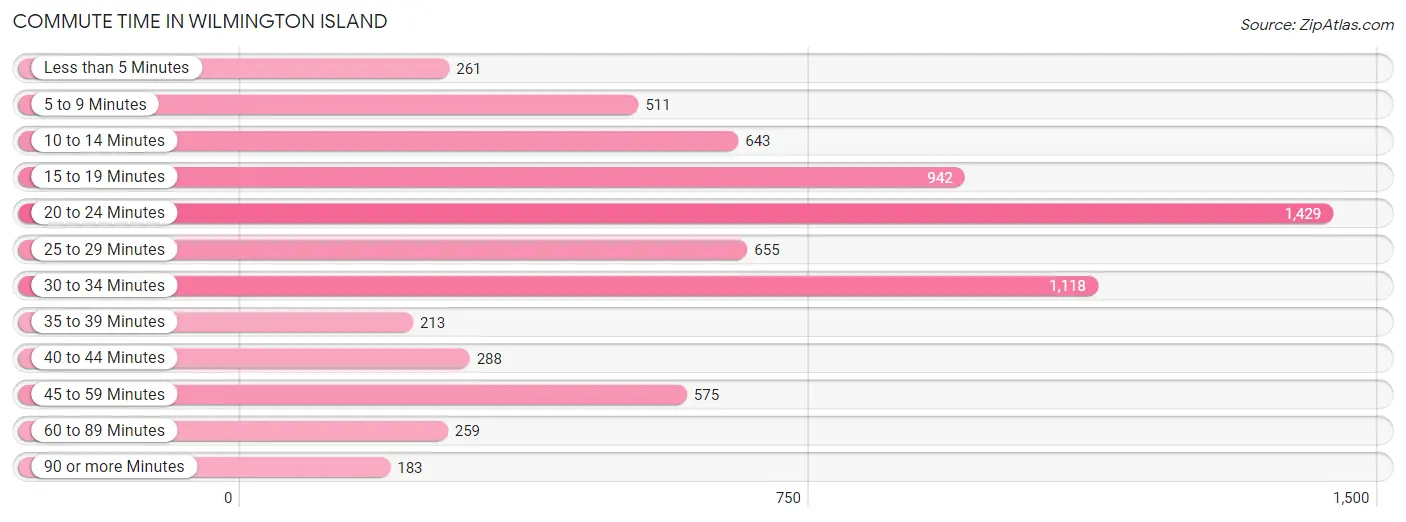
| Commute Time | # Commuters | % Commuters |
| Less than 5 Minutes | 261 | 3.7% |
| 5 to 9 Minutes | 511 | 7.2% |
| 10 to 14 Minutes | 643 | 9.1% |
| 15 to 19 Minutes | 942 | 13.3% |
| 20 to 24 Minutes | 1,429 | 20.2% |
| 25 to 29 Minutes | 655 | 9.3% |
| 30 to 34 Minutes | 1,118 | 15.8% |
| 35 to 39 Minutes | 213 | 3.0% |
| 40 to 44 Minutes | 288 | 4.1% |
| 45 to 59 Minutes | 575 | 8.1% |
| 60 to 89 Minutes | 259 | 3.7% |
| 90 or more Minutes | 183 | 2.6% |
Commute Time by Sex in Wilmington Island
The most common commute times in Wilmington Island are 20 to 24 minutes (730 commuters, 18.7%) for males and 20 to 24 minutes (699 commuters, 22.0%) for females.
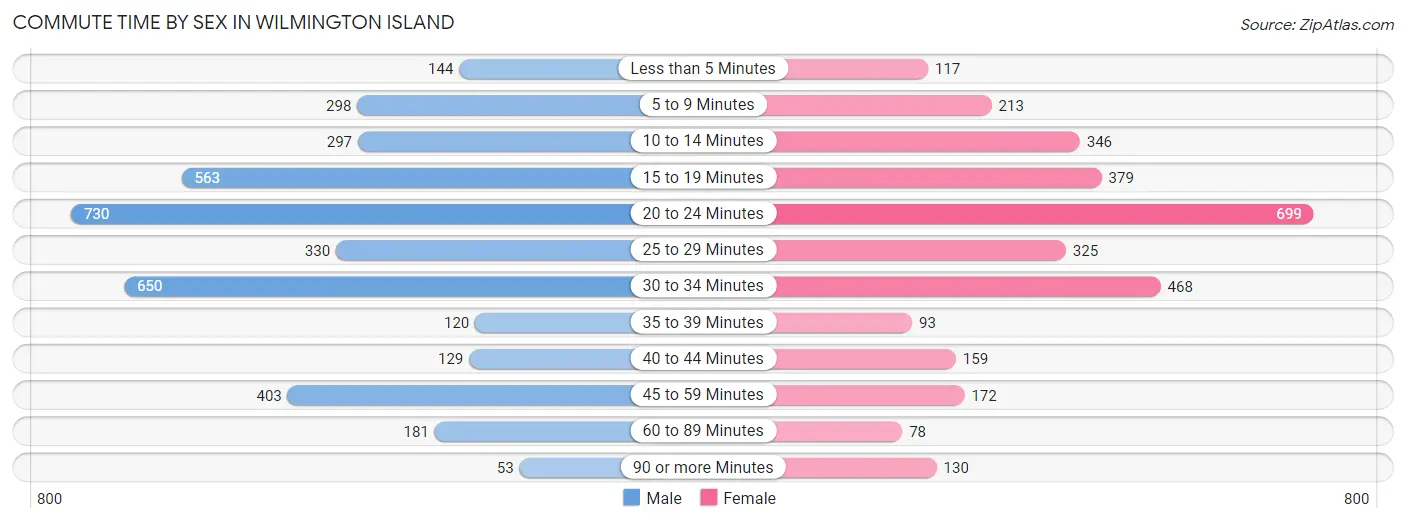
| Commute Time | Male | Female |
| Less than 5 Minutes | 144 (3.7%) | 117 (3.7%) |
| 5 to 9 Minutes | 298 (7.6%) | 213 (6.7%) |
| 10 to 14 Minutes | 297 (7.6%) | 346 (10.9%) |
| 15 to 19 Minutes | 563 (14.4%) | 379 (11.9%) |
| 20 to 24 Minutes | 730 (18.7%) | 699 (22.0%) |
| 25 to 29 Minutes | 330 (8.5%) | 325 (10.2%) |
| 30 to 34 Minutes | 650 (16.7%) | 468 (14.7%) |
| 35 to 39 Minutes | 120 (3.1%) | 93 (2.9%) |
| 40 to 44 Minutes | 129 (3.3%) | 159 (5.0%) |
| 45 to 59 Minutes | 403 (10.3%) | 172 (5.4%) |
| 60 to 89 Minutes | 181 (4.6%) | 78 (2.5%) |
| 90 or more Minutes | 53 (1.4%) | 130 (4.1%) |
Time of Departure to Work by Sex in Wilmington Island
The most frequent times of departure to work in Wilmington Island are 7:00 AM to 7:29 AM (787, 20.2%) for males and 7:30 AM to 7:59 AM (636, 20.0%) for females.
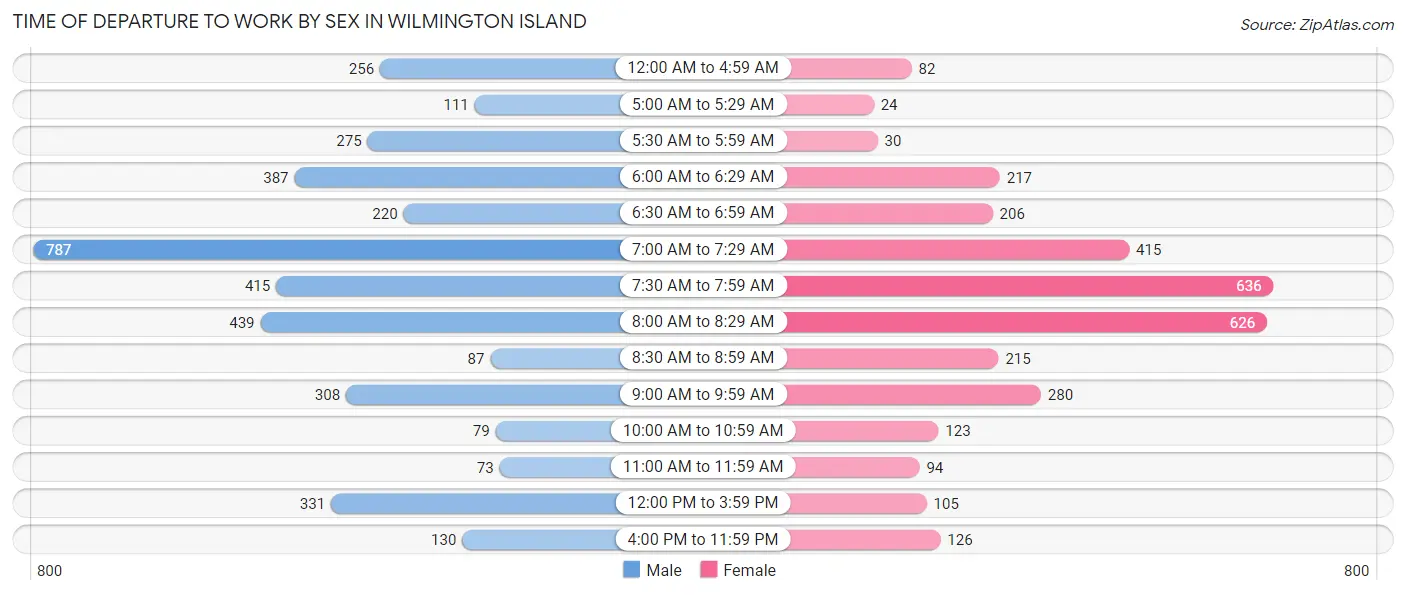
| Time of Departure | Male | Female |
| 12:00 AM to 4:59 AM | 256 (6.6%) | 82 (2.6%) |
| 5:00 AM to 5:29 AM | 111 (2.9%) | 24 (0.7%) |
| 5:30 AM to 5:59 AM | 275 (7.0%) | 30 (0.9%) |
| 6:00 AM to 6:29 AM | 387 (9.9%) | 217 (6.8%) |
| 6:30 AM to 6:59 AM | 220 (5.6%) | 206 (6.5%) |
| 7:00 AM to 7:29 AM | 787 (20.2%) | 415 (13.1%) |
| 7:30 AM to 7:59 AM | 415 (10.6%) | 636 (20.0%) |
| 8:00 AM to 8:29 AM | 439 (11.3%) | 626 (19.7%) |
| 8:30 AM to 8:59 AM | 87 (2.2%) | 215 (6.8%) |
| 9:00 AM to 9:59 AM | 308 (7.9%) | 280 (8.8%) |
| 10:00 AM to 10:59 AM | 79 (2.0%) | 123 (3.9%) |
| 11:00 AM to 11:59 AM | 73 (1.9%) | 94 (3.0%) |
| 12:00 PM to 3:59 PM | 331 (8.5%) | 105 (3.3%) |
| 4:00 PM to 11:59 PM | 130 (3.3%) | 126 (4.0%) |
| Total | 3,898 (100.0%) | 3,179 (100.0%) |
Housing Occupancy in Wilmington Island
Occupancy by Ownership in Wilmington Island
Of the total 6,250 dwellings in Wilmington Island, owner-occupied units account for 4,885 (78.2%), while renter-occupied units make up 1,365 (21.8%).
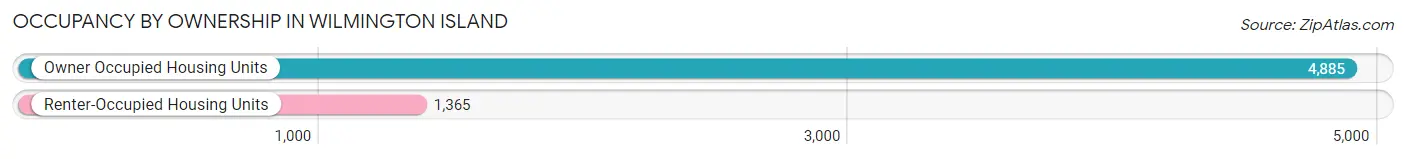
| Occupancy | # Housing Units | % Housing Units |
| Owner Occupied Housing Units | 4,885 | 78.2% |
| Renter-Occupied Housing Units | 1,365 | 21.8% |
| Total Occupied Housing Units | 6,250 | 100.0% |
Occupancy by Household Size in Wilmington Island
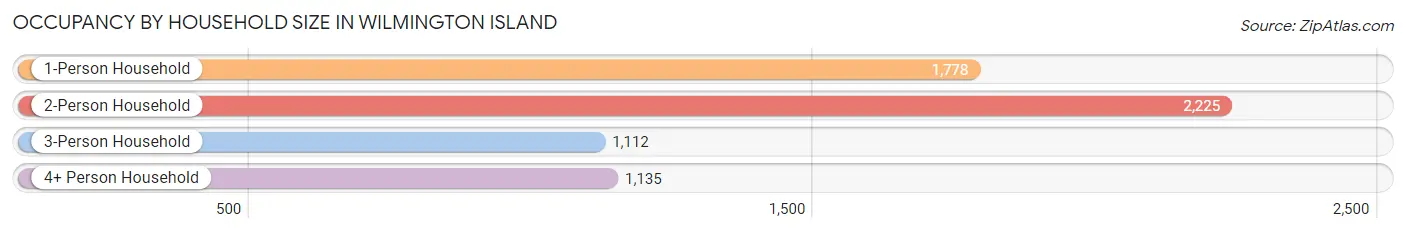
| Household Size | # Housing Units | % Housing Units |
| 1-Person Household | 1,778 | 28.4% |
| 2-Person Household | 2,225 | 35.6% |
| 3-Person Household | 1,112 | 17.8% |
| 4+ Person Household | 1,135 | 18.2% |
| Total Housing Units | 6,250 | 100.0% |
Occupancy by Ownership by Household Size in Wilmington Island
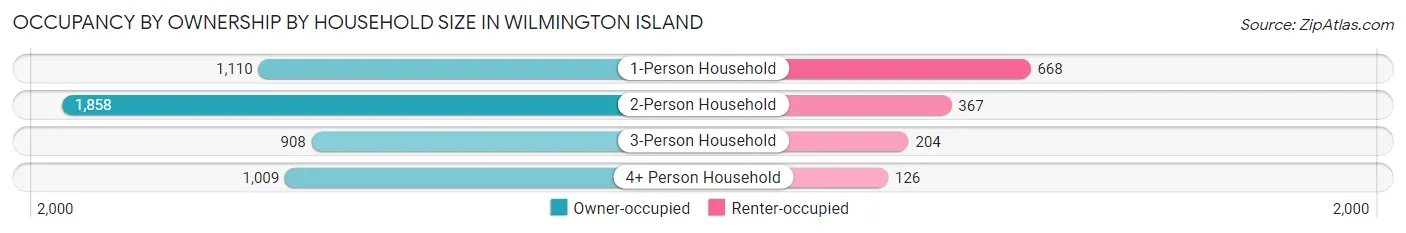
| Household Size | Owner-occupied | Renter-occupied |
| 1-Person Household | 1,110 (62.4%) | 668 (37.6%) |
| 2-Person Household | 1,858 (83.5%) | 367 (16.5%) |
| 3-Person Household | 908 (81.7%) | 204 (18.3%) |
| 4+ Person Household | 1,009 (88.9%) | 126 (11.1%) |
| Total Housing Units | 4,885 (78.2%) | 1,365 (21.8%) |
Occupancy by Educational Attainment in Wilmington Island
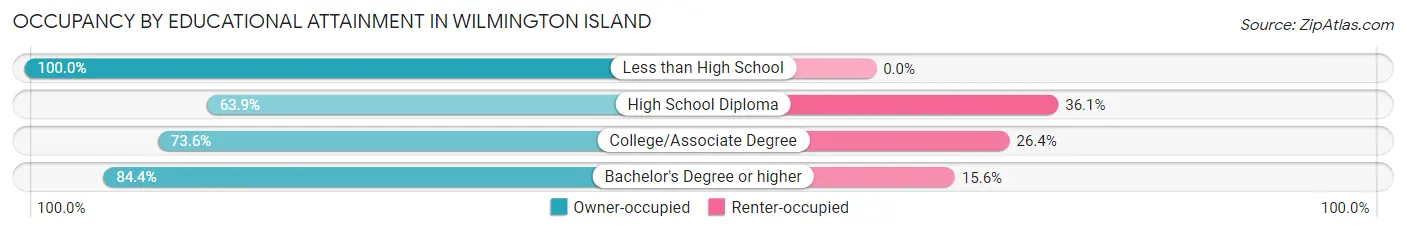
| Household Size | Owner-occupied | Renter-occupied |
| Less than High School | 118 (100.0%) | 0 (0.0%) |
| High School Diploma | 667 (63.9%) | 377 (36.1%) |
| College/Associate Degree | 1,316 (73.6%) | 473 (26.4%) |
| Bachelor's Degree or higher | 2,784 (84.4%) | 515 (15.6%) |
Occupancy by Age of Householder in Wilmington Island
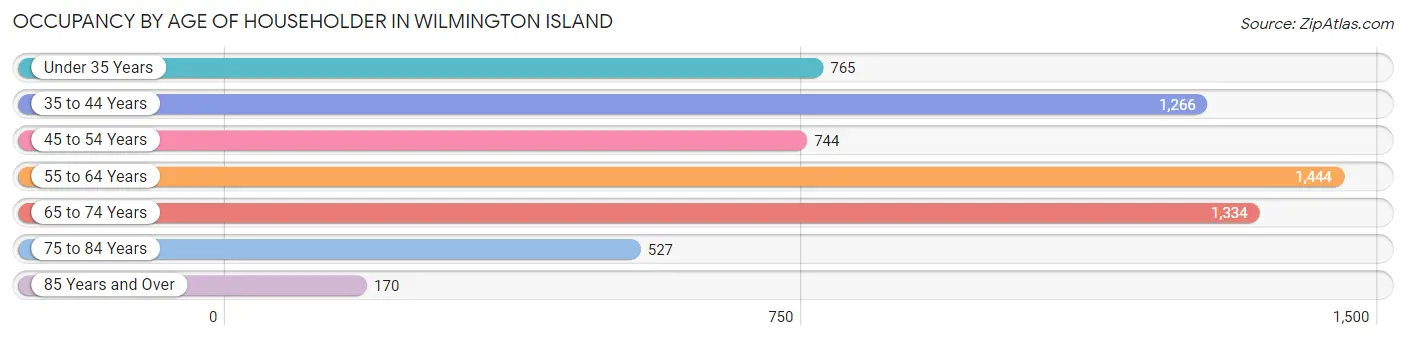
| Age Bracket | # Households | % Households |
| Under 35 Years | 765 | 12.2% |
| 35 to 44 Years | 1,266 | 20.3% |
| 45 to 54 Years | 744 | 11.9% |
| 55 to 64 Years | 1,444 | 23.1% |
| 65 to 74 Years | 1,334 | 21.3% |
| 75 to 84 Years | 527 | 8.4% |
| 85 Years and Over | 170 | 2.7% |
| Total | 6,250 | 100.0% |
Housing Finances in Wilmington Island
Median Income by Occupancy in Wilmington Island
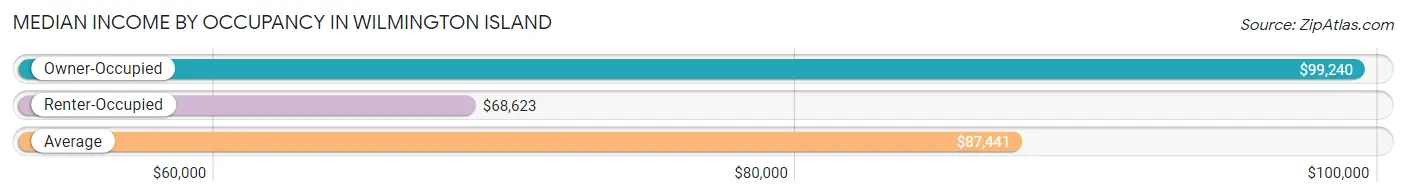
| Occupancy Type | # Households | Median Income |
| Owner-Occupied | 4,885 (78.2%) | $99,240 |
| Renter-Occupied | 1,365 (21.8%) | $68,623 |
| Average | 6,250 (100.0%) | $87,441 |
Occupancy by Householder Income Bracket in Wilmington Island
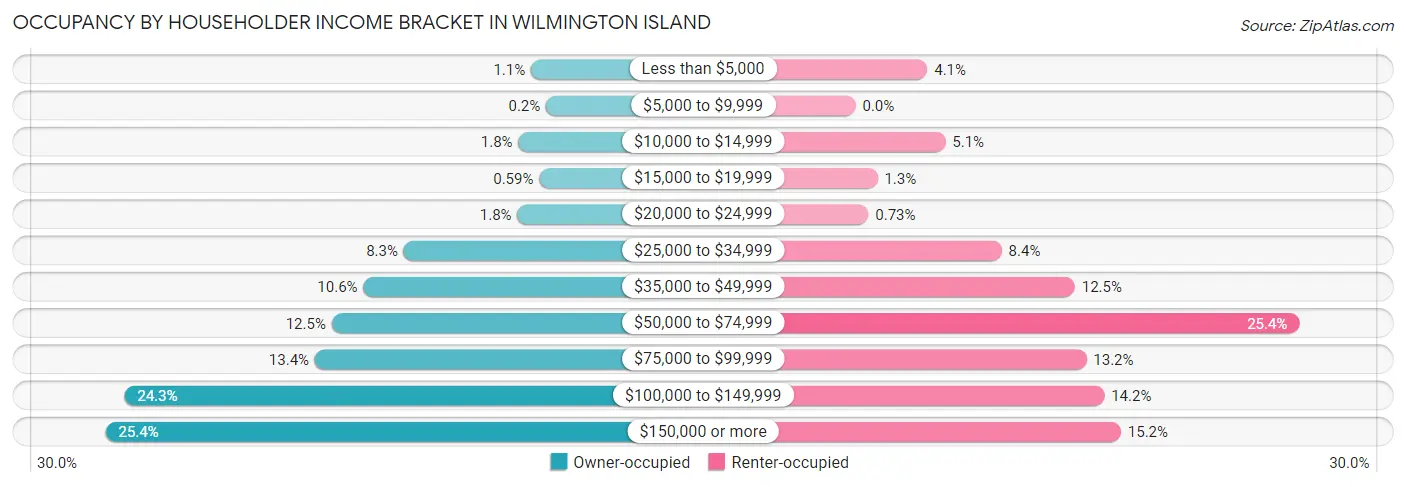
| Income Bracket | Owner-occupied | Renter-occupied |
| Less than $5,000 | 52 (1.1%) | 56 (4.1%) |
| $5,000 to $9,999 | 10 (0.2%) | 0 (0.0%) |
| $10,000 to $14,999 | 87 (1.8%) | 70 (5.1%) |
| $15,000 to $19,999 | 29 (0.6%) | 17 (1.3%) |
| $20,000 to $24,999 | 90 (1.8%) | 10 (0.7%) |
| $25,000 to $34,999 | 407 (8.3%) | 114 (8.4%) |
| $35,000 to $49,999 | 520 (10.6%) | 171 (12.5%) |
| $50,000 to $74,999 | 608 (12.4%) | 346 (25.4%) |
| $75,000 to $99,999 | 655 (13.4%) | 180 (13.2%) |
| $100,000 to $149,999 | 1,187 (24.3%) | 194 (14.2%) |
| $150,000 or more | 1,240 (25.4%) | 207 (15.2%) |
| Total | 4,885 (100.0%) | 1,365 (100.0%) |
Monthly Housing Cost Tiers in Wilmington Island
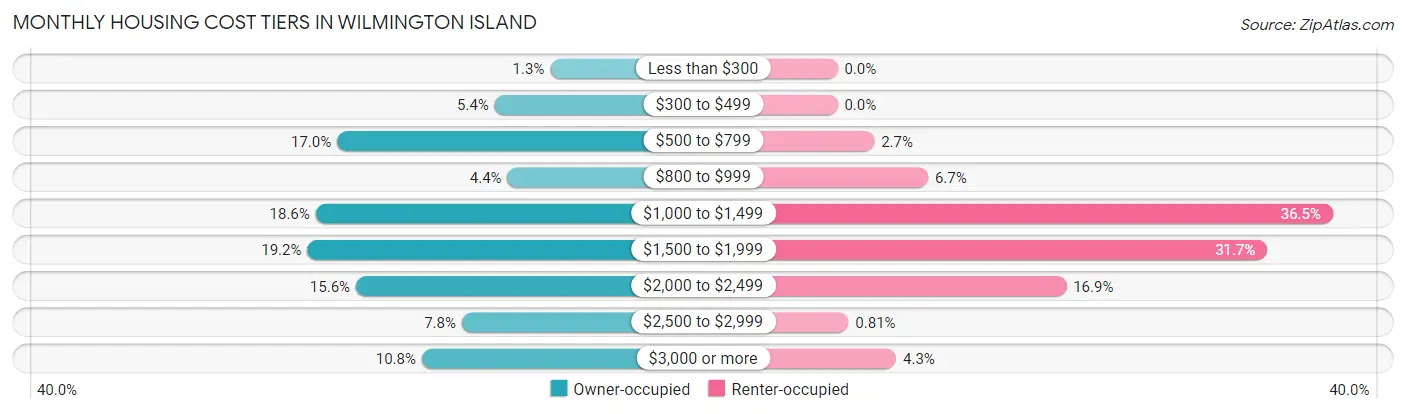
| Monthly Cost | Owner-occupied | Renter-occupied |
| Less than $300 | 63 (1.3%) | 0 (0.0%) |
| $300 to $499 | 263 (5.4%) | 0 (0.0%) |
| $500 to $799 | 830 (17.0%) | 37 (2.7%) |
| $800 to $999 | 217 (4.4%) | 91 (6.7%) |
| $1,000 to $1,499 | 907 (18.6%) | 498 (36.5%) |
| $1,500 to $1,999 | 937 (19.2%) | 432 (31.7%) |
| $2,000 to $2,499 | 762 (15.6%) | 230 (16.9%) |
| $2,500 to $2,999 | 381 (7.8%) | 11 (0.8%) |
| $3,000 or more | 525 (10.7%) | 59 (4.3%) |
| Total | 4,885 (100.0%) | 1,365 (100.0%) |
Physical Housing Characteristics in Wilmington Island
Housing Structures in Wilmington Island
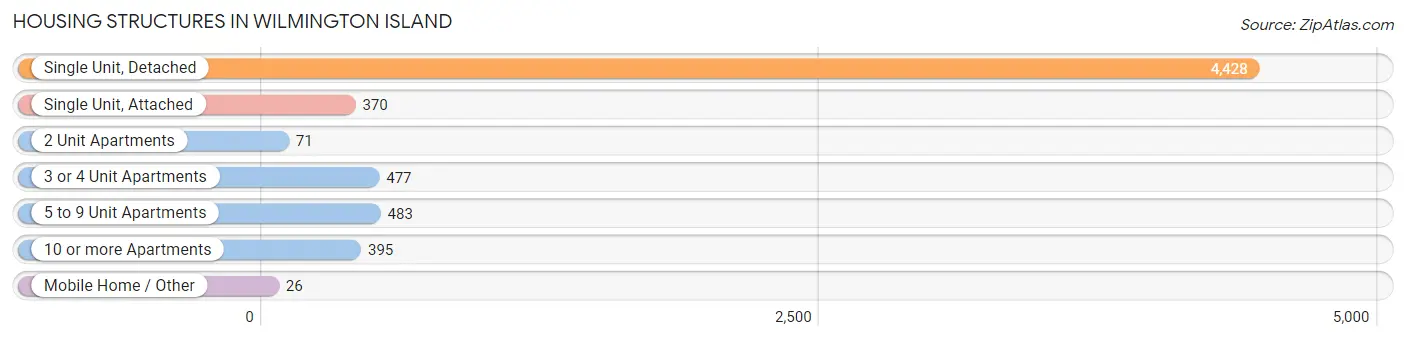
| Structure Type | # Housing Units | % Housing Units |
| Single Unit, Detached | 4,428 | 70.9% |
| Single Unit, Attached | 370 | 5.9% |
| 2 Unit Apartments | 71 | 1.1% |
| 3 or 4 Unit Apartments | 477 | 7.6% |
| 5 to 9 Unit Apartments | 483 | 7.7% |
| 10 or more Apartments | 395 | 6.3% |
| Mobile Home / Other | 26 | 0.4% |
| Total | 6,250 | 100.0% |
Housing Structures by Occupancy in Wilmington Island
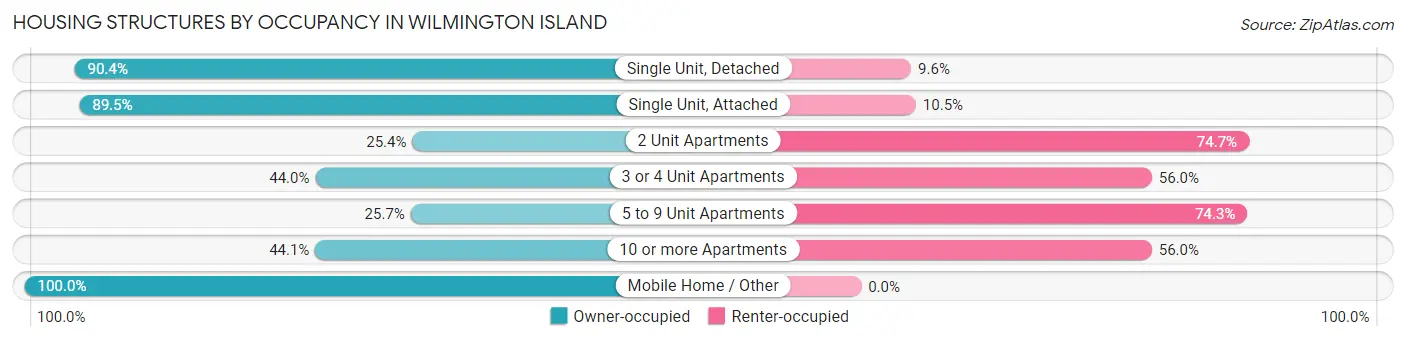
| Structure Type | Owner-occupied | Renter-occupied |
| Single Unit, Detached | 4,002 (90.4%) | 426 (9.6%) |
| Single Unit, Attached | 331 (89.5%) | 39 (10.5%) |
| 2 Unit Apartments | 18 (25.4%) | 53 (74.7%) |
| 3 or 4 Unit Apartments | 210 (44.0%) | 267 (56.0%) |
| 5 to 9 Unit Apartments | 124 (25.7%) | 359 (74.3%) |
| 10 or more Apartments | 174 (44.1%) | 221 (55.9%) |
| Mobile Home / Other | 26 (100.0%) | 0 (0.0%) |
| Total | 4,885 (78.2%) | 1,365 (21.8%) |
Housing Structures by Number of Rooms in Wilmington Island
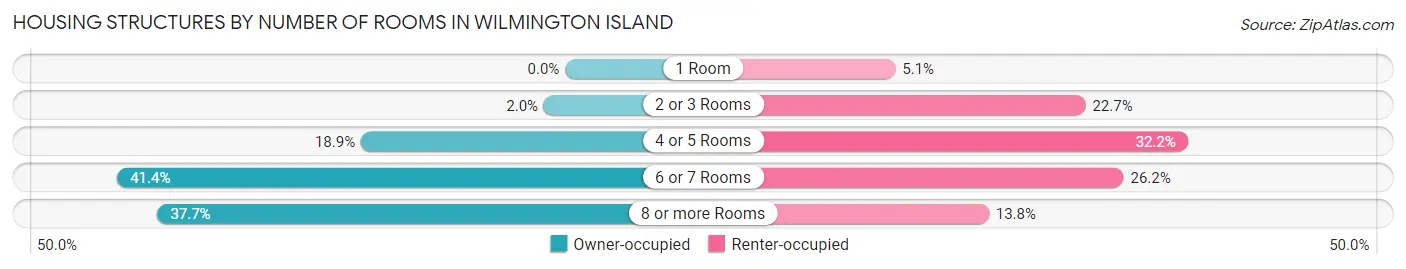
| Number of Rooms | Owner-occupied | Renter-occupied |
| 1 Room | 0 (0.0%) | 70 (5.1%) |
| 2 or 3 Rooms | 96 (2.0%) | 310 (22.7%) |
| 4 or 5 Rooms | 923 (18.9%) | 439 (32.2%) |
| 6 or 7 Rooms | 2,024 (41.4%) | 358 (26.2%) |
| 8 or more Rooms | 1,842 (37.7%) | 188 (13.8%) |
| Total | 4,885 (100.0%) | 1,365 (100.0%) |
Housing Structure by Heating Type in Wilmington Island
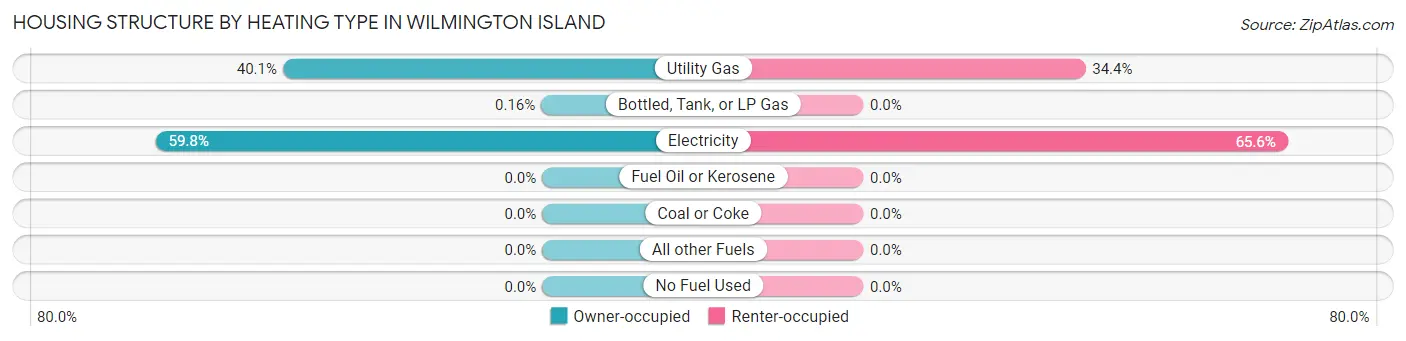
| Heating Type | Owner-occupied | Renter-occupied |
| Utility Gas | 1,958 (40.1%) | 469 (34.4%) |
| Bottled, Tank, or LP Gas | 8 (0.2%) | 0 (0.0%) |
| Electricity | 2,919 (59.8%) | 896 (65.6%) |
| Fuel Oil or Kerosene | 0 (0.0%) | 0 (0.0%) |
| Coal or Coke | 0 (0.0%) | 0 (0.0%) |
| All other Fuels | 0 (0.0%) | 0 (0.0%) |
| No Fuel Used | 0 (0.0%) | 0 (0.0%) |
| Total | 4,885 (100.0%) | 1,365 (100.0%) |
Household Vehicle Usage in Wilmington Island
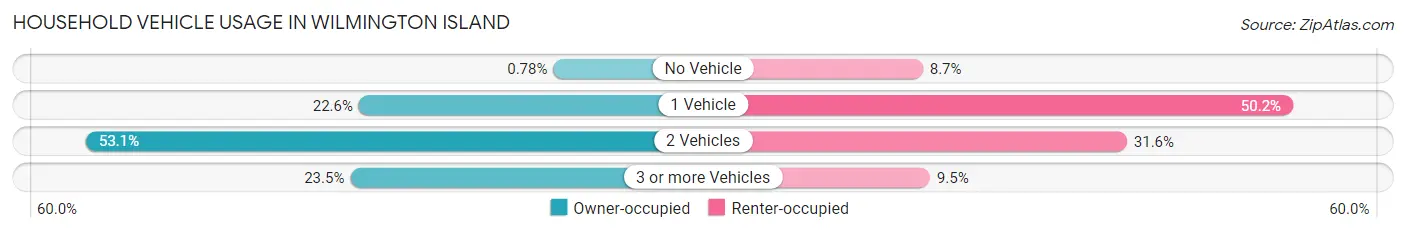
| Vehicles per Household | Owner-occupied | Renter-occupied |
| No Vehicle | 38 (0.8%) | 119 (8.7%) |
| 1 Vehicle | 1,102 (22.6%) | 685 (50.2%) |
| 2 Vehicles | 2,596 (53.1%) | 431 (31.6%) |
| 3 or more Vehicles | 1,149 (23.5%) | 130 (9.5%) |
| Total | 4,885 (100.0%) | 1,365 (100.0%) |
Real Estate & Mortgages in Wilmington Island
Real Estate and Mortgage Overview in Wilmington Island
| Characteristic | Without Mortgage | With Mortgage |
| Housing Units | 1,312 | 3,573 |
| Median Property Value | $277,500 | $340,500 |
| Median Household Income | $70,313 | $1,051 |
| Monthly Housing Costs | $586 | $494 |
| Real Estate Taxes | $2,483 | $40 |
Property Value by Mortgage Status in Wilmington Island
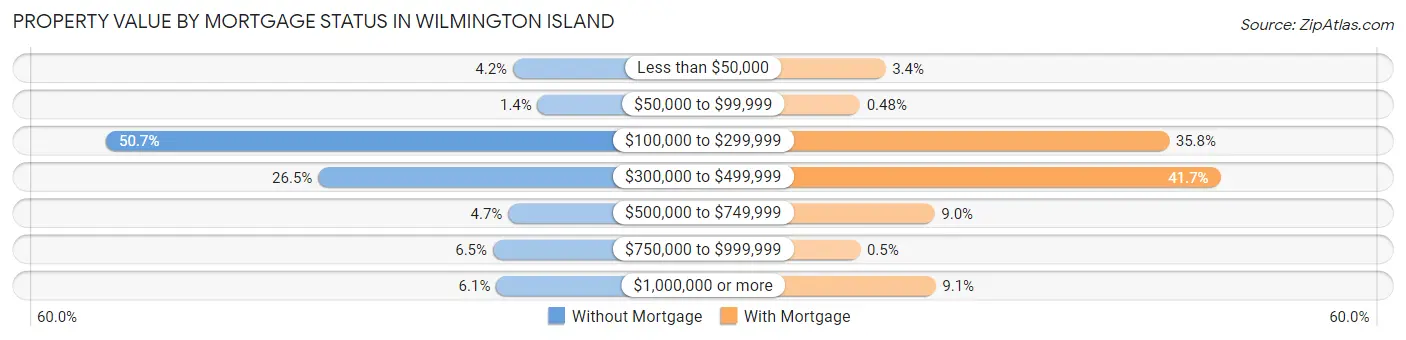
| Property Value | Without Mortgage | With Mortgage |
| Less than $50,000 | 55 (4.2%) | 121 (3.4%) |
| $50,000 to $99,999 | 18 (1.4%) | 17 (0.5%) |
| $100,000 to $299,999 | 665 (50.7%) | 1,279 (35.8%) |
| $300,000 to $499,999 | 347 (26.5%) | 1,490 (41.7%) |
| $500,000 to $749,999 | 62 (4.7%) | 322 (9.0%) |
| $750,000 to $999,999 | 85 (6.5%) | 18 (0.5%) |
| $1,000,000 or more | 80 (6.1%) | 326 (9.1%) |
| Total | 1,312 (100.0%) | 3,573 (100.0%) |
Household Income by Mortgage Status in Wilmington Island
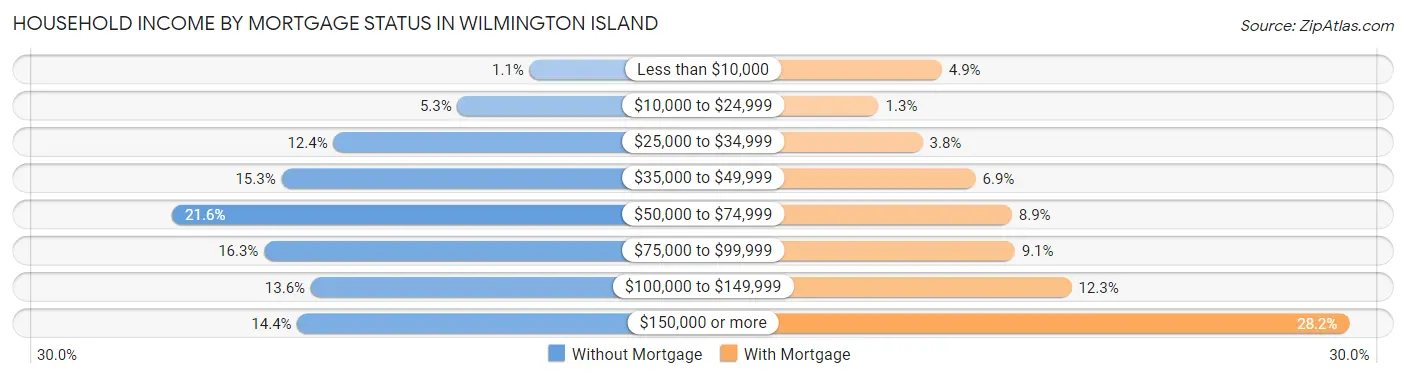
| Household Income | Without Mortgage | With Mortgage |
| Less than $10,000 | 15 (1.1%) | 176 (4.9%) |
| $10,000 to $24,999 | 69 (5.3%) | 47 (1.3%) |
| $25,000 to $34,999 | 162 (12.3%) | 137 (3.8%) |
| $35,000 to $49,999 | 201 (15.3%) | 245 (6.9%) |
| $50,000 to $74,999 | 283 (21.6%) | 319 (8.9%) |
| $75,000 to $99,999 | 214 (16.3%) | 325 (9.1%) |
| $100,000 to $149,999 | 179 (13.6%) | 441 (12.3%) |
| $150,000 or more | 189 (14.4%) | 1,008 (28.2%) |
| Total | 1,312 (100.0%) | 3,573 (100.0%) |
Property Value to Household Income Ratio in Wilmington Island
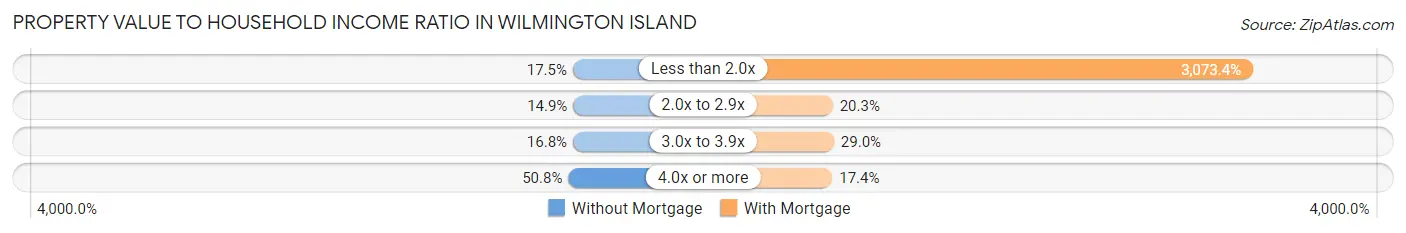
| Value-to-Income Ratio | Without Mortgage | With Mortgage |
| Less than 2.0x | 229 (17.4%) | 109,811 (3,073.4%) |
| 2.0x to 2.9x | 195 (14.9%) | 726 (20.3%) |
| 3.0x to 3.9x | 221 (16.8%) | 1,036 (29.0%) |
| 4.0x or more | 667 (50.8%) | 621 (17.4%) |
| Total | 1,312 (100.0%) | 3,573 (100.0%) |
Real Estate Taxes by Mortgage Status in Wilmington Island
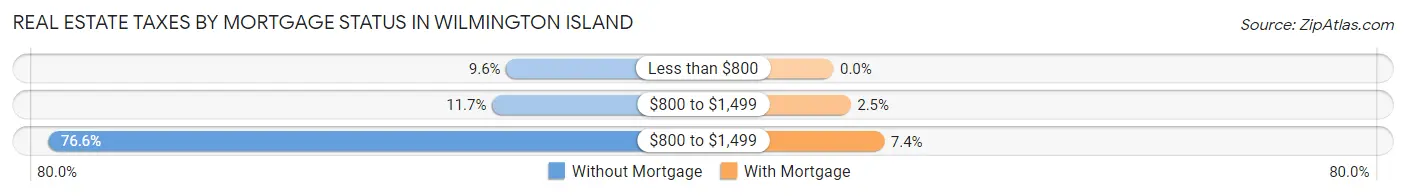
| Property Taxes | Without Mortgage | With Mortgage |
| Less than $800 | 126 (9.6%) | 0 (0.0%) |
| $800 to $1,499 | 153 (11.7%) | 90 (2.5%) |
| $800 to $1,499 | 1,005 (76.6%) | 265 (7.4%) |
| Total | 1,312 (100.0%) | 3,573 (100.0%) |
Health & Disability in Wilmington Island
Health Insurance Coverage by Age in Wilmington Island
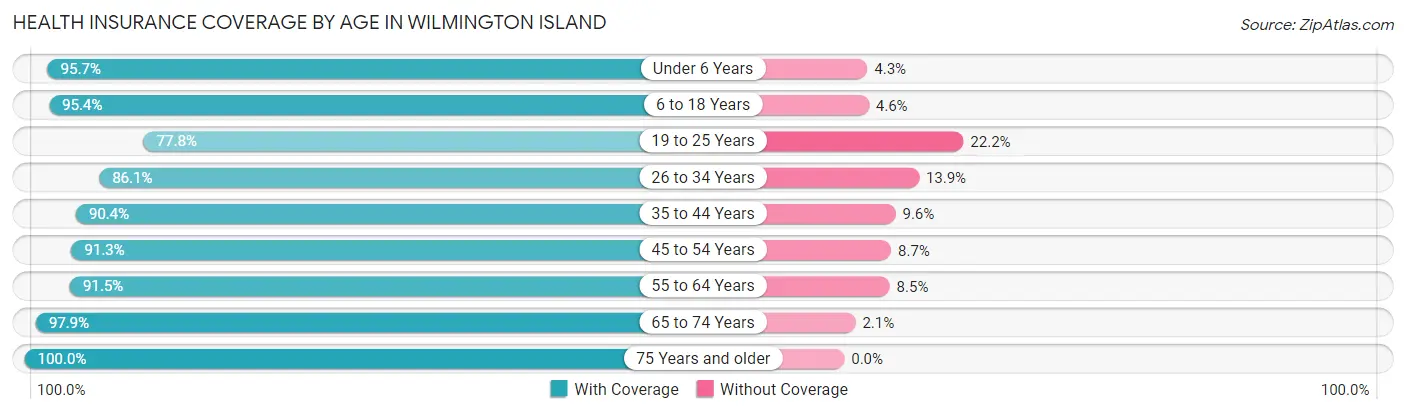
| Age Bracket | With Coverage | Without Coverage |
| Under 6 Years | 1,203 (95.7%) | 54 (4.3%) |
| 6 to 18 Years | 1,980 (95.4%) | 95 (4.6%) |
| 19 to 25 Years | 578 (77.8%) | 165 (22.2%) |
| 26 to 34 Years | 1,305 (86.1%) | 211 (13.9%) |
| 35 to 44 Years | 2,128 (90.4%) | 225 (9.6%) |
| 45 to 54 Years | 1,380 (91.3%) | 132 (8.7%) |
| 55 to 64 Years | 2,272 (91.5%) | 210 (8.5%) |
| 65 to 74 Years | 2,013 (97.9%) | 43 (2.1%) |
| 75 Years and older | 1,172 (100.0%) | 0 (0.0%) |
| Total | 14,031 (92.5%) | 1,135 (7.5%) |
Health Insurance Coverage by Citizenship Status in Wilmington Island
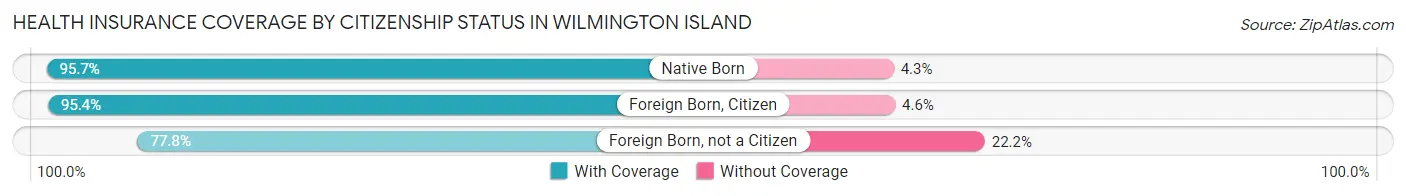
| Citizenship Status | With Coverage | Without Coverage |
| Native Born | 1,203 (95.7%) | 54 (4.3%) |
| Foreign Born, Citizen | 1,980 (95.4%) | 95 (4.6%) |
| Foreign Born, not a Citizen | 578 (77.8%) | 165 (22.2%) |
Health Insurance Coverage by Household Income in Wilmington Island
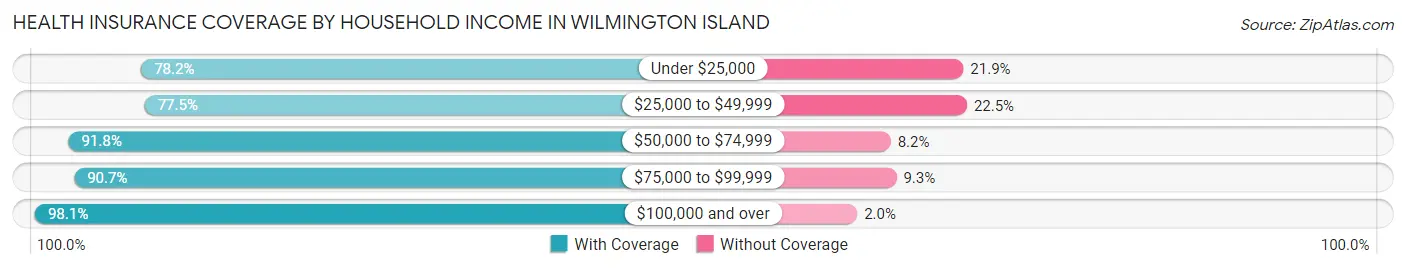
| Household Income | With Coverage | Without Coverage |
| Under $25,000 | 508 (78.1%) | 142 (21.8%) |
| $25,000 to $49,999 | 1,707 (77.5%) | 496 (22.5%) |
| $50,000 to $74,999 | 1,929 (91.8%) | 173 (8.2%) |
| $75,000 to $99,999 | 1,532 (90.7%) | 157 (9.3%) |
| $100,000 and over | 8,348 (98.1%) | 166 (1.9%) |
Public vs Private Health Insurance Coverage by Age in Wilmington Island
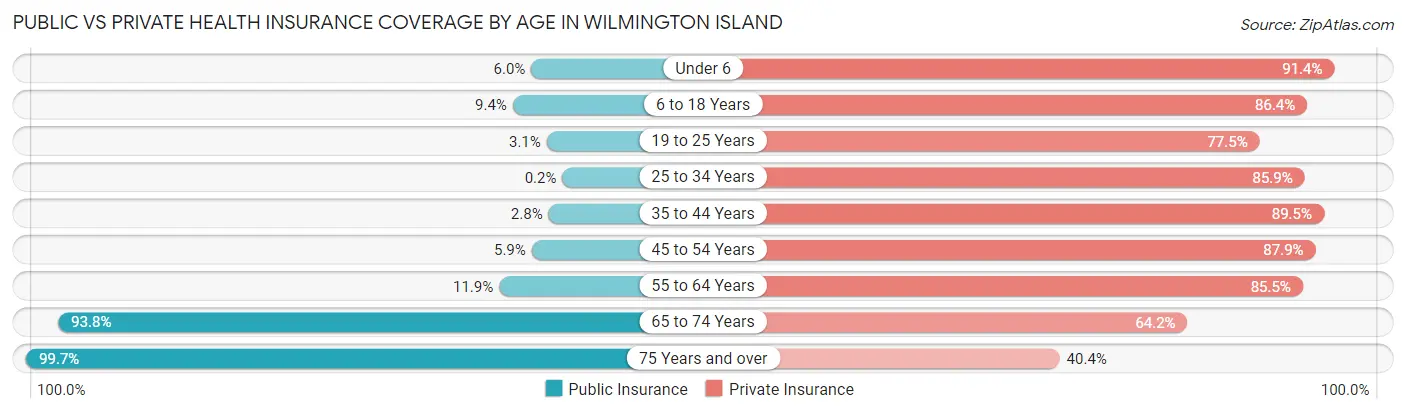
| Age Bracket | Public Insurance | Private Insurance |
| Under 6 | 75 (6.0%) | 1,149 (91.4%) |
| 6 to 18 Years | 195 (9.4%) | 1,792 (86.4%) |
| 19 to 25 Years | 23 (3.1%) | 576 (77.5%) |
| 25 to 34 Years | 3 (0.2%) | 1,302 (85.9%) |
| 35 to 44 Years | 65 (2.8%) | 2,105 (89.5%) |
| 45 to 54 Years | 89 (5.9%) | 1,329 (87.9%) |
| 55 to 64 Years | 296 (11.9%) | 2,123 (85.5%) |
| 65 to 74 Years | 1,928 (93.8%) | 1,319 (64.1%) |
| 75 Years and over | 1,169 (99.7%) | 474 (40.4%) |
| Total | 3,843 (25.3%) | 12,169 (80.2%) |
Disability Status by Sex by Age in Wilmington Island
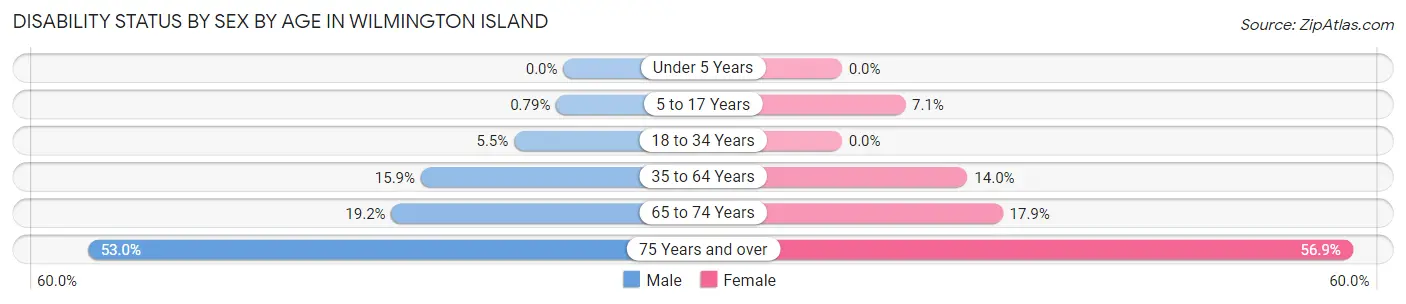
| Age Bracket | Male | Female |
| Under 5 Years | 0 (0.0%) | 0 (0.0%) |
| 5 to 17 Years | 8 (0.8%) | 80 (7.0%) |
| 18 to 34 Years | 73 (5.5%) | 0 (0.0%) |
| 35 to 64 Years | 483 (15.9%) | 462 (14.0%) |
| 65 to 74 Years | 181 (19.2%) | 199 (17.9%) |
| 75 Years and over | 294 (53.0%) | 351 (56.9%) |
Disability Class by Sex by Age in Wilmington Island
Disability Class: Hearing Difficulty
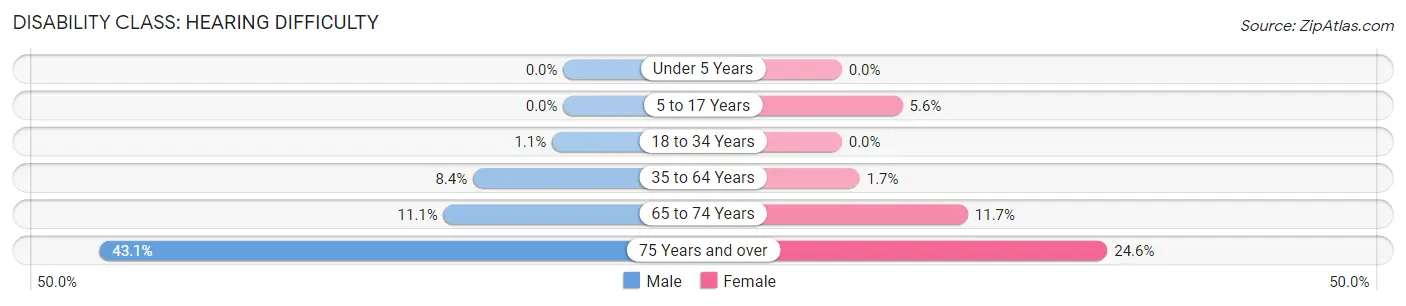
| Age Bracket | Male | Female |
| Under 5 Years | 0 (0.0%) | 0 (0.0%) |
| 5 to 17 Years | 0 (0.0%) | 64 (5.6%) |
| 18 to 34 Years | 14 (1.1%) | 0 (0.0%) |
| 35 to 64 Years | 255 (8.4%) | 55 (1.7%) |
| 65 to 74 Years | 105 (11.1%) | 130 (11.7%) |
| 75 Years and over | 239 (43.1%) | 152 (24.6%) |
Disability Class: Vision Difficulty
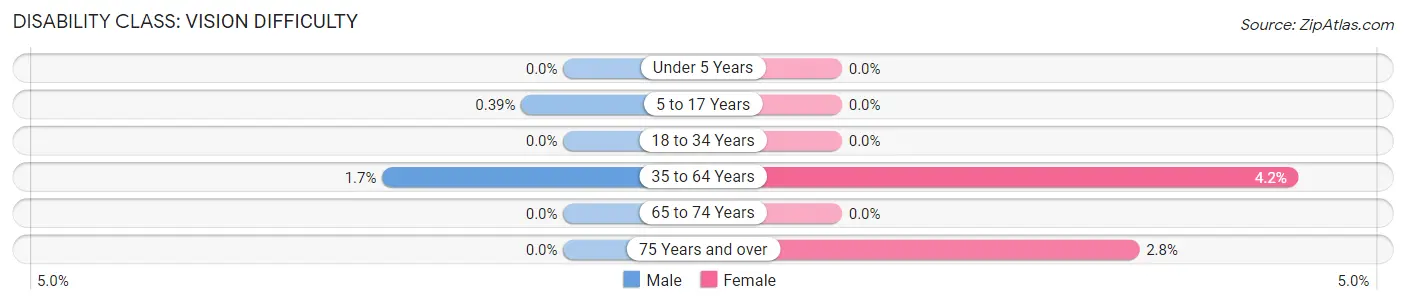
| Age Bracket | Male | Female |
| Under 5 Years | 0 (0.0%) | 0 (0.0%) |
| 5 to 17 Years | 4 (0.4%) | 0 (0.0%) |
| 18 to 34 Years | 0 (0.0%) | 0 (0.0%) |
| 35 to 64 Years | 51 (1.7%) | 140 (4.2%) |
| 65 to 74 Years | 0 (0.0%) | 0 (0.0%) |
| 75 Years and over | 0 (0.0%) | 17 (2.8%) |
Disability Class: Cognitive Difficulty
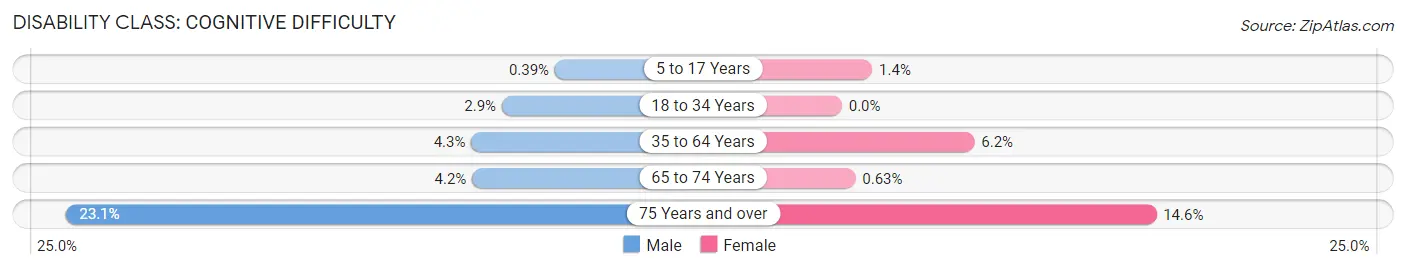
| Age Bracket | Male | Female |
| 5 to 17 Years | 4 (0.4%) | 16 (1.4%) |
| 18 to 34 Years | 38 (2.9%) | 0 (0.0%) |
| 35 to 64 Years | 130 (4.3%) | 203 (6.1%) |
| 65 to 74 Years | 40 (4.2%) | 7 (0.6%) |
| 75 Years and over | 128 (23.1%) | 90 (14.6%) |
Disability Class: Ambulatory Difficulty
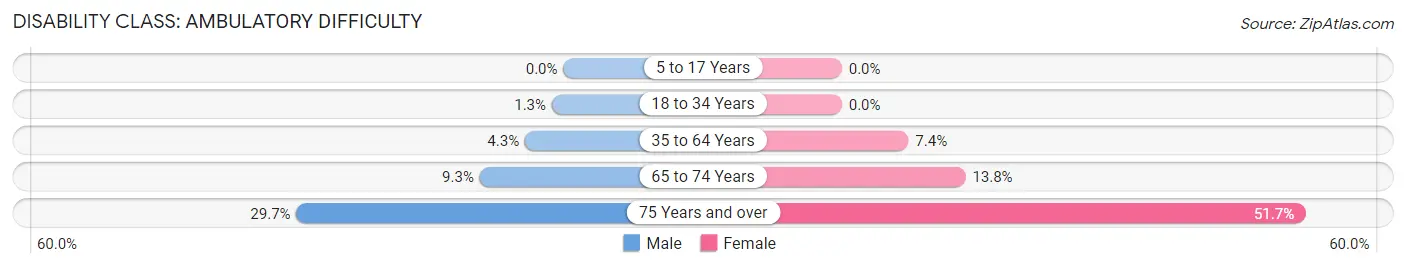
| Age Bracket | Male | Female |
| 5 to 17 Years | 0 (0.0%) | 0 (0.0%) |
| 18 to 34 Years | 17 (1.3%) | 0 (0.0%) |
| 35 to 64 Years | 130 (4.3%) | 245 (7.4%) |
| 65 to 74 Years | 88 (9.3%) | 153 (13.8%) |
| 75 Years and over | 165 (29.7%) | 319 (51.7%) |
Disability Class: Self-Care Difficulty
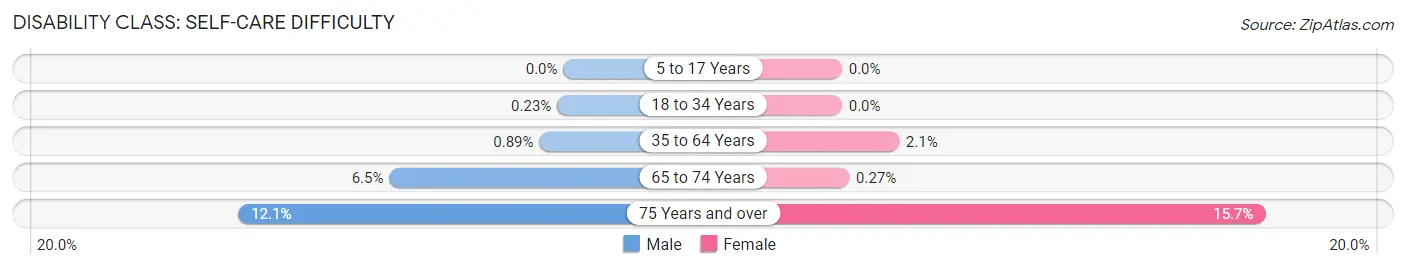
| Age Bracket | Male | Female |
| 5 to 17 Years | 0 (0.0%) | 0 (0.0%) |
| 18 to 34 Years | 3 (0.2%) | 0 (0.0%) |
| 35 to 64 Years | 27 (0.9%) | 70 (2.1%) |
| 65 to 74 Years | 61 (6.5%) | 3 (0.3%) |
| 75 Years and over | 67 (12.1%) | 97 (15.7%) |
Technology Access in Wilmington Island
Computing Device Access in Wilmington Island
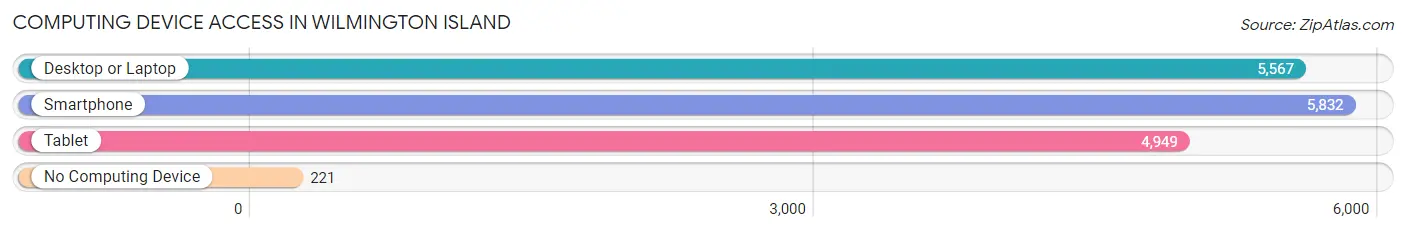
| Device Type | # Households | % Households |
| Desktop or Laptop | 5,567 | 89.1% |
| Smartphone | 5,832 | 93.3% |
| Tablet | 4,949 | 79.2% |
| No Computing Device | 221 | 3.5% |
| Total | 6,250 | 100.0% |
Internet Access in Wilmington Island
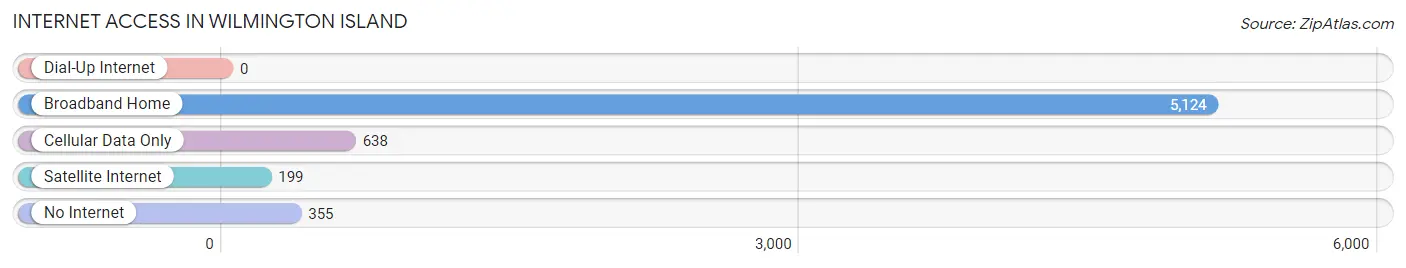
| Internet Type | # Households | % Households |
| Dial-Up Internet | 0 | 0.0% |
| Broadband Home | 5,124 | 82.0% |
| Cellular Data Only | 638 | 10.2% |
| Satellite Internet | 199 | 3.2% |
| No Internet | 355 | 5.7% |
| Total | 6,250 | 100.0% |
Wilmington Island Summary
Wilmington Island is a small island located in Chatham County, Georgia, United States. It is situated on the Savannah River, just south of Savannah, Georgia. The island is part of the Savannah Metropolitan Statistical Area and is home to approximately 8,000 people.
History
The history of Wilmington Island dates back to the early 1700s when it was inhabited by Native Americans. The island was originally part of the Yamacraw Indian Nation, which was a large Native American tribe that inhabited the area. The Yamacraws were eventually forced out of the area by the British in the late 1700s.
In the early 1800s, the island was settled by European settlers. The island was named after the Wilmington River, which runs through the island. The island was used primarily for farming and fishing. In the late 1800s, the island was developed as a resort area and became a popular destination for tourists.
In the early 1900s, the island was used as a military base during World War I and World War II. After the war, the island was developed as a residential area and became a popular place to live.
Geography
Wilmington Island is located in Chatham County, Georgia, United States. It is situated on the Savannah River, just south of Savannah, Georgia. The island is approximately 4.5 miles long and 1.5 miles wide. It is bordered by the Wilmington River to the north, the Wilmington Sound to the east, and the Atlantic Ocean to the south.
The island is mostly flat and is composed of sandy soil. The climate is humid subtropical, with hot, humid summers and mild winters. The average temperature is around 70 degrees Fahrenheit.
Economy
The economy of Wilmington Island is largely based on tourism and real estate. The island is home to several resorts and hotels, as well as a variety of restaurants and shops. The island is also home to several marinas and boat docks, which attract visitors from all over the world.
The island is also home to several businesses, including a variety of retail stores, banks, and medical facilities. The island is also home to several schools, including a public elementary school, a middle school, and a high school.
Demographics
As of the 2010 census, the population of Wilmington Island was 8,000. The population is mostly white (83.3%), with African Americans making up 11.3% of the population. The median household income is $50,000, and the median age is 42.
The island is home to a variety of religious denominations, including Baptist, Methodist, Catholic, and Presbyterian. The island is also home to a variety of cultural events, including the annual Savannah Music Festival and the Savannah Film Festival.
Conclusion
Wilmington Island is a small island located in Chatham County, Georgia, United States. It is situated on the Savannah River, just south of Savannah, Georgia. The island is part of the Savannah Metropolitan Statistical Area and is home to approximately 8,000 people. The island is mostly flat and is composed of sandy soil. The economy of Wilmington Island is largely based on tourism and real estate. The population is mostly white (83.3%), with African Americans making up 11.3% of the population. The island is home to a variety of religious denominations, including Baptist, Methodist, Catholic, and Presbyterian. The island is also home to a variety of cultural events, including the annual Savannah Music Festival and the Savannah Film Festival.
Common Questions
What is the Total Population of Wilmington Island?
Total Population of Wilmington Island is 15,235.
What is the Total Male Population of Wilmington Island?
Total Male Population of Wilmington Island is 7,300.
What is the Total Female Population of Wilmington Island?
Total Female Population of Wilmington Island is 7,935.
What is the Ratio of Males per 100 Females in Wilmington Island?
There are 92.00 Males per 100 Females in Wilmington Island.
What is the Ratio of Females per 100 Males in Wilmington Island?
There are 108.70 Females per 100 Males in Wilmington Island.
What is the Median Population Age in Wilmington Island?
Median Population Age in Wilmington Island is 43.6 Years.
What is the Average Family Size in Wilmington Island
Average Family Size in Wilmington Island is 3.0 People.
What is the Average Household Size in Wilmington Island
Average Household Size in Wilmington Island is 2.4 People.
What is Per Capita Income in Wilmington Island?
Per Capita income in Wilmington Island is $46,250.
What is the Median Family Income in Wilmington Island?
Median Family Income in Wilmington Island is $106,186.
What is the Median Household income in Wilmington Island?
Median Household Income in Wilmington Island is $87,441.
What is Income or Wage Gap in Wilmington Island?
Income or Wage Gap in Wilmington Island is 44.2%.
Women in Wilmington Island earn 55.8 cents for every dollar earned by a man.
What is Inequality or Gini Index in Wilmington Island?
Inequality or Gini Index in Wilmington Island is 0.41.
How Large is the Labor Force in Wilmington Island?
There are 8,033 People in the Labor Forcein in Wilmington Island.
What is the Percentage of People in the Labor Force in Wilmington Island?
65.0% of People are in the Labor Force in Wilmington Island.
What is the Unemployment Rate in Wilmington Island?
Unemployment Rate in Wilmington Island is 3.3%.