Offerman, GA
Offerman Map
Offerman Overview
935
TOTAL POPULATION
554
MALE POPULATION
381
FEMALE POPULATION
145.41
MALES / 100 FEMALES
68.77
FEMALES / 100 MALES
13.6
MEDIAN AGE
5.9
AVG FAMILY SIZE
5.0
AVG HOUSEHOLD SIZE
$9,306
PER CAPITA INCOME
$31,042
AVG FAMILY INCOME
$27,321
AVG HOUSEHOLD INCOME
0.45
INEQUALITY / GINI INDEX
148
LABOR FORCE [ PEOPLE ]
35.7%
PERCENT IN LABOR FORCE
5.4%
UNEMPLOYMENT RATE
Offerman Zip Codes
Offerman Area Codes
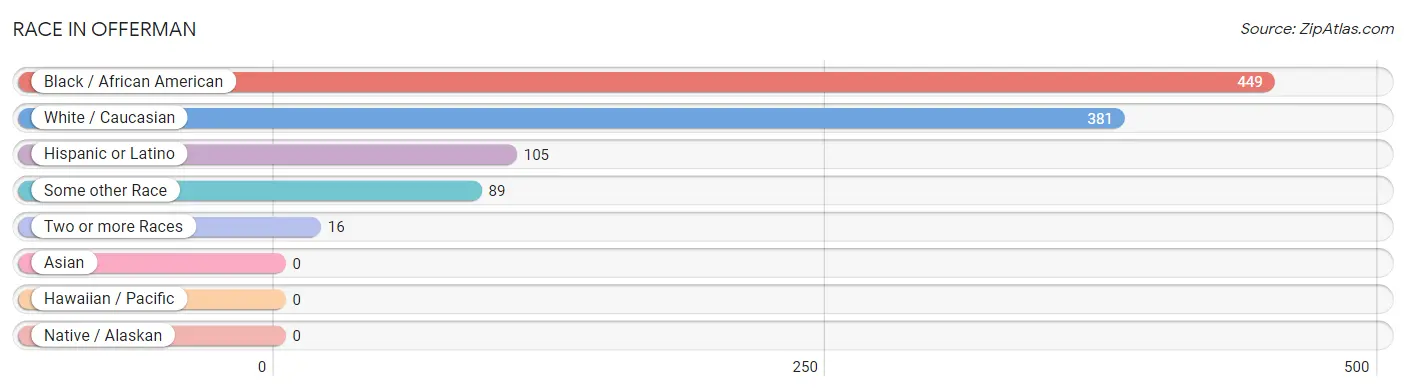
Race in Offerman
The most populous races in Offerman are Black / African American (449 | 48.0%), White / Caucasian (381 | 40.7%), and Hispanic or Latino (105 | 11.2%).
| Race | # Population | % Population |
| Asian | 0 | 0.0% |
| Black / African American | 449 | 48.0% |
| Hawaiian / Pacific | 0 | 0.0% |
| Hispanic or Latino | 105 | 11.2% |
| Native / Alaskan | 0 | 0.0% |
| White / Caucasian | 381 | 40.7% |
| Two or more Races | 16 | 1.7% |
| Some other Race | 89 | 9.5% |
| Total | 935 | 100.0% |
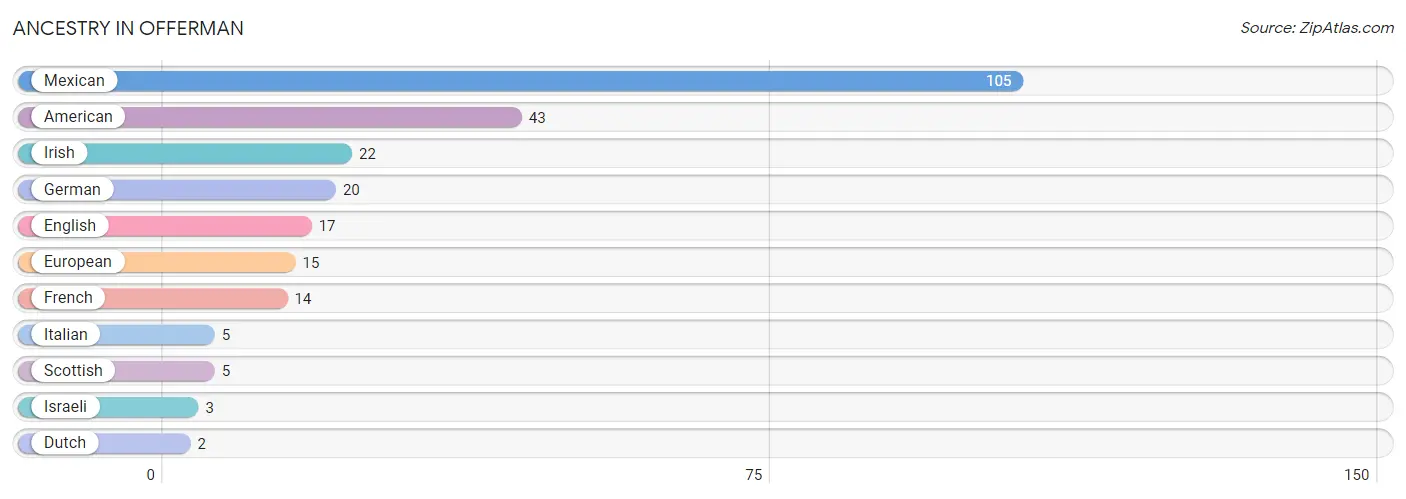
Ancestry in Offerman
The most populous ancestries reported in Offerman are Mexican (105 | 11.2%), American (43 | 4.6%), Irish (22 | 2.4%), German (20 | 2.1%), and English (17 | 1.8%), together accounting for 22.1% of all Offerman residents.
| Ancestry | # Population | % Population |
| American | 43 | 4.6% |
| Dutch | 2 | 0.2% |
| English | 17 | 1.8% |
| European | 15 | 1.6% |
| French | 14 | 1.5% |
| German | 20 | 2.1% |
| Irish | 22 | 2.4% |
| Israeli | 3 | 0.3% |
| Italian | 5 | 0.5% |
| Mexican | 105 | 11.2% |
| Scottish | 5 | 0.5% | View All 11 Rows |
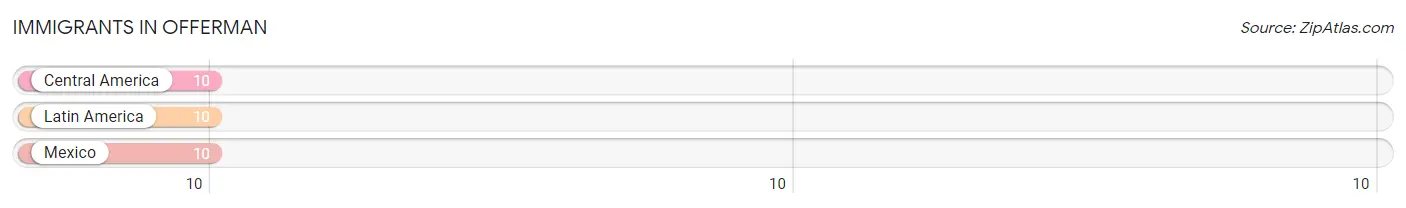
Immigrants in Offerman
The most numerous immigrant groups reported in Offerman came from Central America (10 | 1.1%), Latin America (10 | 1.1%), and Mexico (10 | 1.1%), together accounting for 3.2% of all Offerman residents.
| Immigration Origin | # Population | % Population |
| Central America | 10 | 1.1% |
| Latin America | 10 | 1.1% |
| Mexico | 10 | 1.1% | View All 3 Rows |
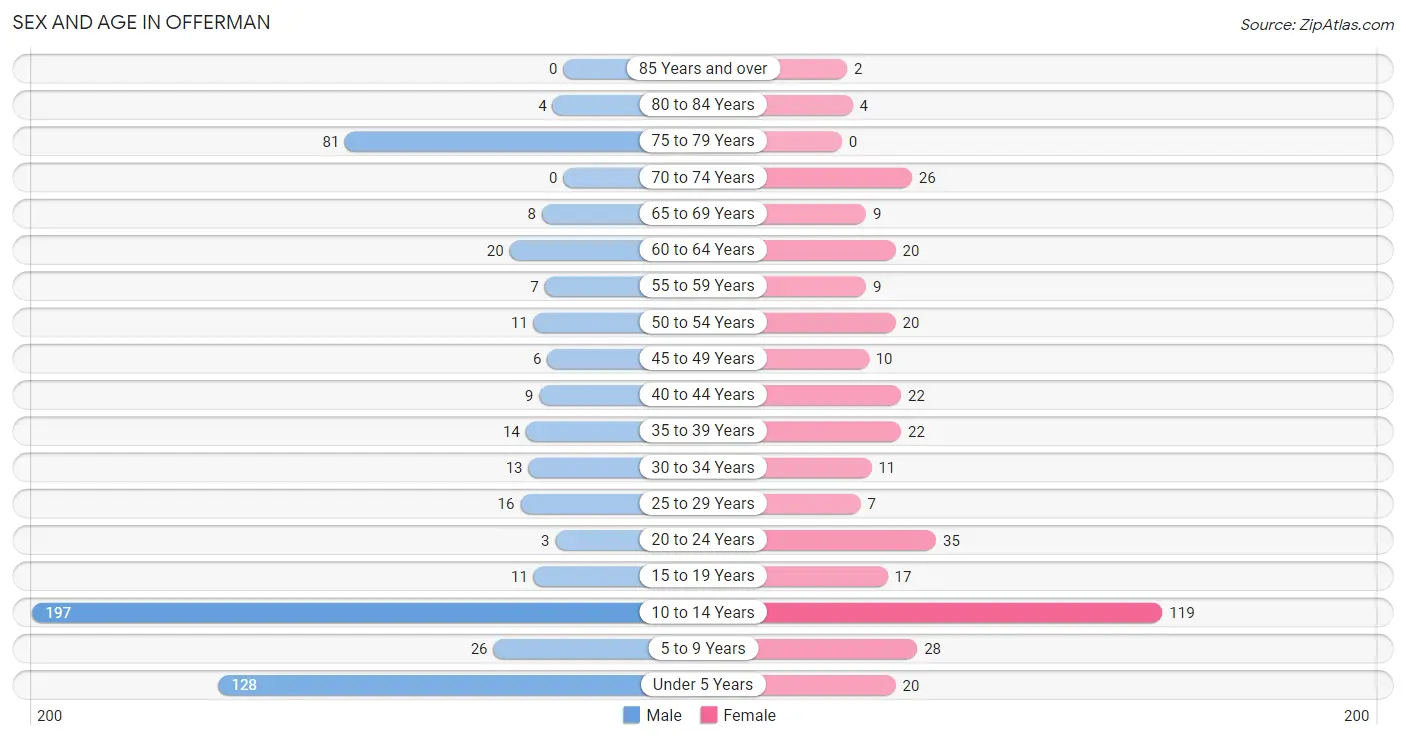
Sex and Age in Offerman
Sex and Age in Offerman
The most populous age groups in Offerman are 10 to 14 Years (197 | 35.6%) for men and 10 to 14 Years (119 | 31.2%) for women.
| Age Bracket | Male | Female |
| Under 5 Years | 128 (23.1%) | 20 (5.2%) |
| 5 to 9 Years | 26 (4.7%) | 28 (7.3%) |
| 10 to 14 Years | 197 (35.6%) | 119 (31.2%) |
| 15 to 19 Years | 11 (2.0%) | 17 (4.5%) |
| 20 to 24 Years | 3 (0.5%) | 35 (9.2%) |
| 25 to 29 Years | 16 (2.9%) | 7 (1.8%) |
| 30 to 34 Years | 13 (2.4%) | 11 (2.9%) |
| 35 to 39 Years | 14 (2.5%) | 22 (5.8%) |
| 40 to 44 Years | 9 (1.6%) | 22 (5.8%) |
| 45 to 49 Years | 6 (1.1%) | 10 (2.6%) |
| 50 to 54 Years | 11 (2.0%) | 20 (5.2%) |
| 55 to 59 Years | 7 (1.3%) | 9 (2.4%) |
| 60 to 64 Years | 20 (3.6%) | 20 (5.2%) |
| 65 to 69 Years | 8 (1.4%) | 9 (2.4%) |
| 70 to 74 Years | 0 (0.0%) | 26 (6.8%) |
| 75 to 79 Years | 81 (14.6%) | 0 (0.0%) |
| 80 to 84 Years | 4 (0.7%) | 4 (1.1%) |
| 85 Years and over | 0 (0.0%) | 2 (0.5%) |
| Total | 554 (100.0%) | 381 (100.0%) |
Families and Households in Offerman
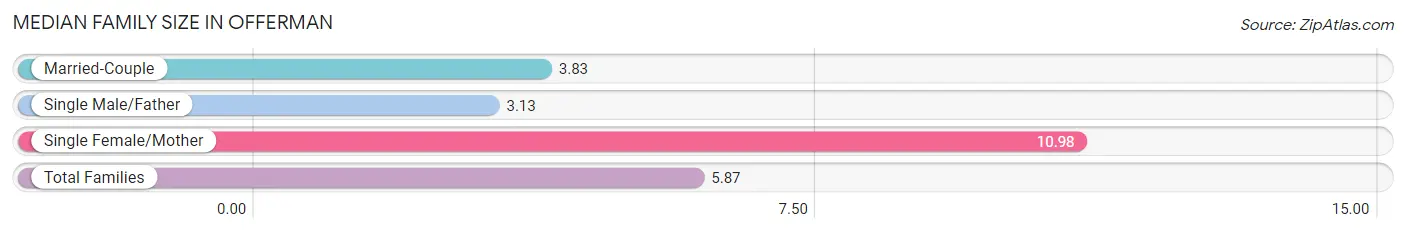
Median Family Size in Offerman
The median family size in Offerman is 5.87 persons per family, with single female/mother families (44 | 29.1%) accounting for the largest median family size of 10.98 persons per family. On the other hand, single male/father families (8 | 5.3%) represent the smallest median family size with 3.13 persons per family.
| Family Type | # Families | Family Size |
| Married-Couple | 99 (65.6%) | 3.83 |
| Single Male/Father | 8 (5.3%) | 3.13 |
| Single Female/Mother | 44 (29.1%) | 10.98 |
| Total Families | 151 (100.0%) | 5.87 |
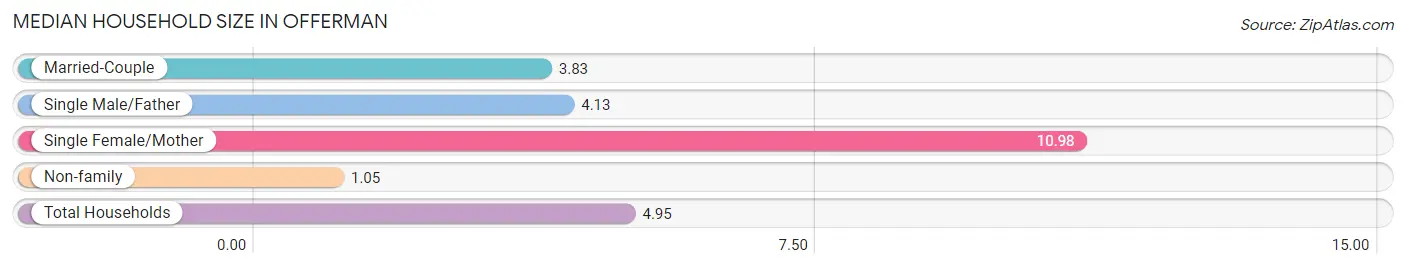
Median Household Size in Offerman
The median household size in Offerman is 4.95 persons per household, with single female/mother households (44 | 23.3%) accounting for the largest median household size of 10.98 persons per household. non-family households (38 | 20.1%) represent the smallest median household size with 1.05 persons per household.
| Household Type | # Households | Household Size |
| Married-Couple | 99 (52.4%) | 3.83 |
| Single Male/Father | 8 (4.2%) | 4.13 |
| Single Female/Mother | 44 (23.3%) | 10.98 |
| Non-family | 38 (20.1%) | 1.05 |
| Total Households | 189 (100.0%) | 4.95 |
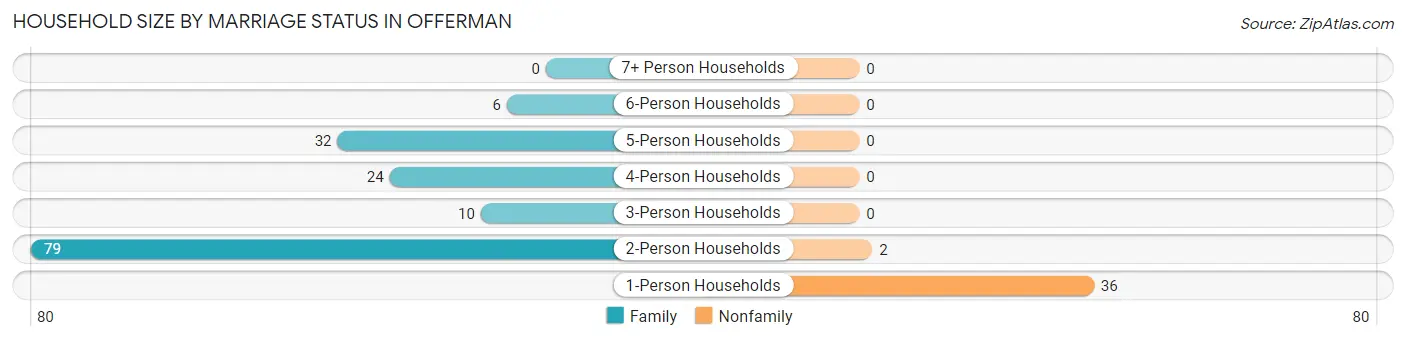
Household Size by Marriage Status in Offerman
Out of a total of 189 households in Offerman, 151 (79.9%) are family households, while 38 (20.1%) are nonfamily households. The most numerous type of family households are 2-person households, comprising 79, and the most common type of nonfamily households are 1-person households, comprising 36.
| Household Size | Family Households | Nonfamily Households |
| 1-Person Households | - | 36 (19.1%) |
| 2-Person Households | 79 (41.8%) | 2 (1.1%) |
| 3-Person Households | 10 (5.3%) | 0 (0.0%) |
| 4-Person Households | 24 (12.7%) | 0 (0.0%) |
| 5-Person Households | 32 (16.9%) | 0 (0.0%) |
| 6-Person Households | 6 (3.2%) | 0 (0.0%) |
| 7+ Person Households | 0 (0.0%) | 0 (0.0%) |
| Total | 151 (79.9%) | 38 (20.1%) |
Female Fertility in Offerman
Fertility by Age in Offerman
Average fertility rate in Offerman is 153.0 births per 1,000 women. Women in the age bracket of 20 to 34 years have the highest fertility rate with 358.0 births per 1,000 women. Women in the age bracket of 20 to 34 years acount for 90.5% of all women with births.
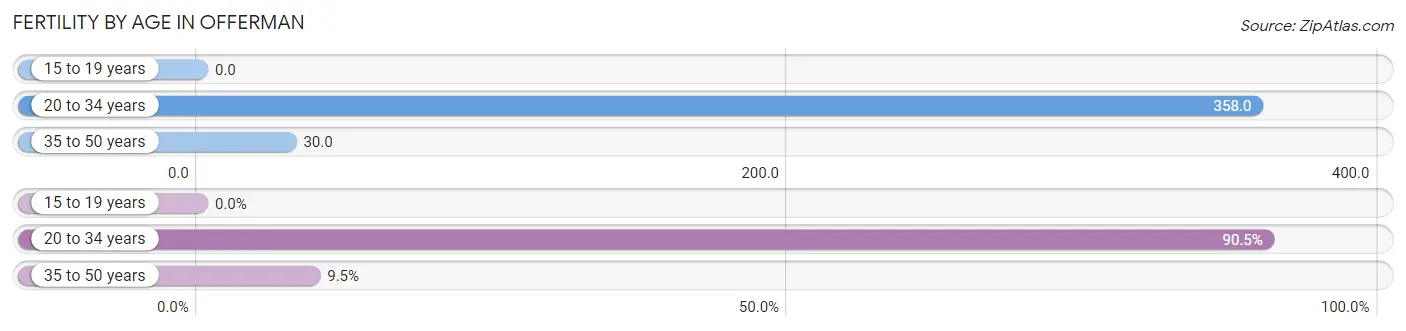
| Age Bracket | Women with Births | Births / 1,000 Women |
| 15 to 19 years | 0 (0.0%) | 0.0 |
| 20 to 34 years | 19 (90.5%) | 358.0 |
| 35 to 50 years | 2 (9.5%) | 30.0 |
| Total | 21 (100.0%) | 153.0 |
Fertility by Age by Marriage Status in Offerman
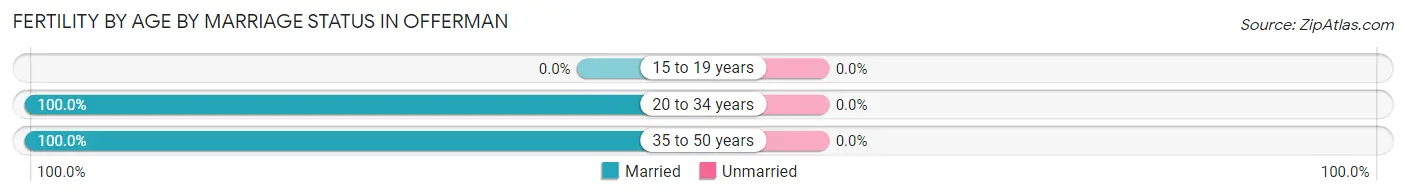
| Age Bracket | Married | Unmarried |
| 15 to 19 years | 0 (0.0%) | 0 (0.0%) |
| 20 to 34 years | 19 (100.0%) | 0 (0.0%) |
| 35 to 50 years | 2 (100.0%) | 0 (0.0%) |
| Total | 21 (100.0%) | 0 (0.0%) |
Fertility by Education in Offerman
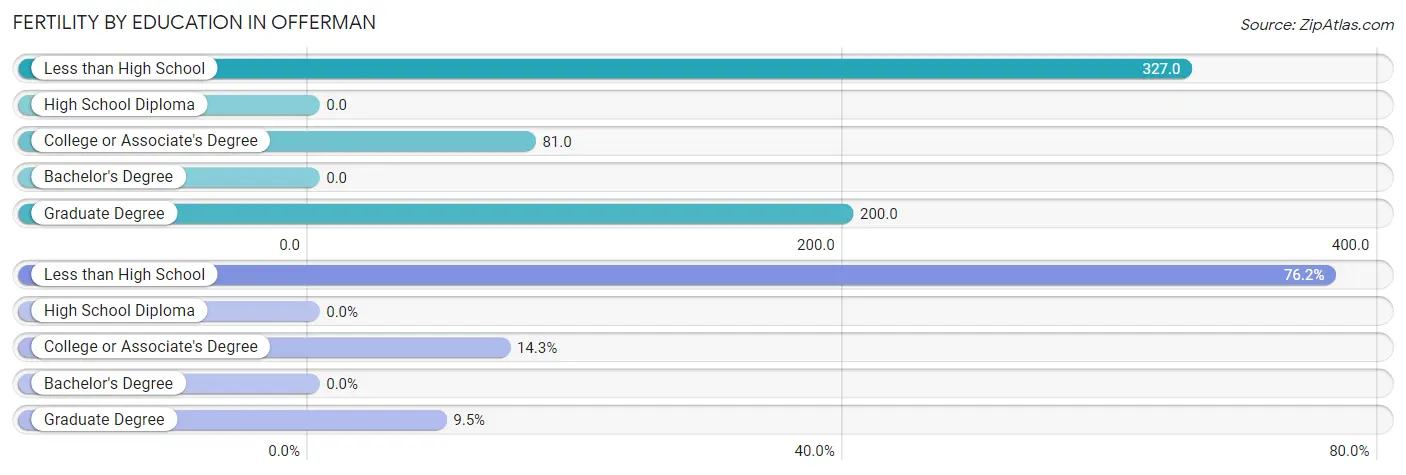
| Educational Attainment | Women with Births | Births / 1,000 Women |
| Less than High School | 16 (76.2%) | 327.0 |
| High School Diploma | 0 (0.0%) | 0.0 |
| College or Associate's Degree | 3 (14.3%) | 81.0 |
| Bachelor's Degree | 0 (0.0%) | 0.0 |
| Graduate Degree | 2 (9.5%) | 200.0 |
| Total | 21 (100.0%) | 153.0 |
Fertility by Education by Marriage Status in Offerman
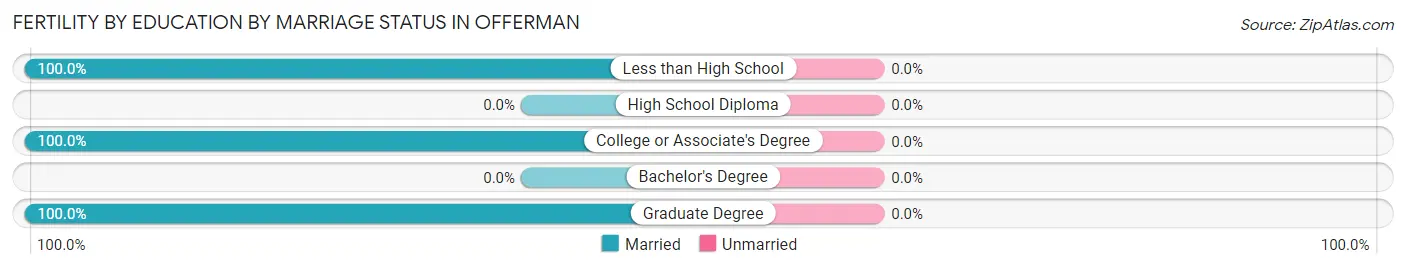
| Educational Attainment | Married | Unmarried |
| Less than High School | 16 (100.0%) | 0 (0.0%) |
| High School Diploma | 0 (0.0%) | 0 (0.0%) |
| College or Associate's Degree | 3 (100.0%) | 0 (0.0%) |
| Bachelor's Degree | 0 (0.0%) | 0 (0.0%) |
| Graduate Degree | 2 (100.0%) | 0 (0.0%) |
| Total | 21 (100.0%) | 0 (0.0%) |
Income in Offerman
Income Overview in Offerman
Per Capita Income in Offerman is $9,306, while median incomes of families and households are $31,042 and $27,321 respectively.
| Characteristic | Number | Measure |
| Per Capita Income | 935 | $9,306 |
| Median Family Income | 151 | $31,042 |
| Mean Family Income | 151 | $49,348 |
| Median Household Income | 189 | $27,321 |
| Mean Household Income | 189 | $43,246 |
| Income Deficit | 151 | $0 |
| Wage / Income Gap (%) | 935 | 0.00% |
| Wage / Income Gap ($) | 935 | 100.00¢ per $1 |
| Gini / Inequality Index | 935 | 0.45 |
Earnings by Sex in Offerman
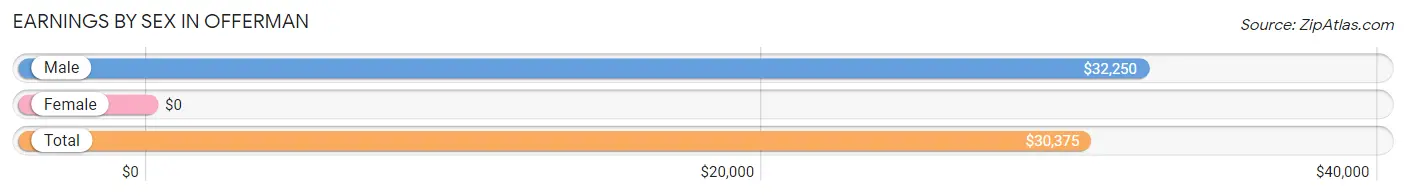
| Sex | Number | Average Earnings |
| Male | 76 (50.3%) | $32,250 |
| Female | 75 (49.7%) | $0 |
| Total | 151 (100.0%) | $30,375 |
Earnings by Sex by Income Bracket in Offerman
The most common earnings brackets in Offerman are $20,000 to $22,499 for men (11 | 14.5%) and $7,500 to $9,999 for women (15 | 20.0%).
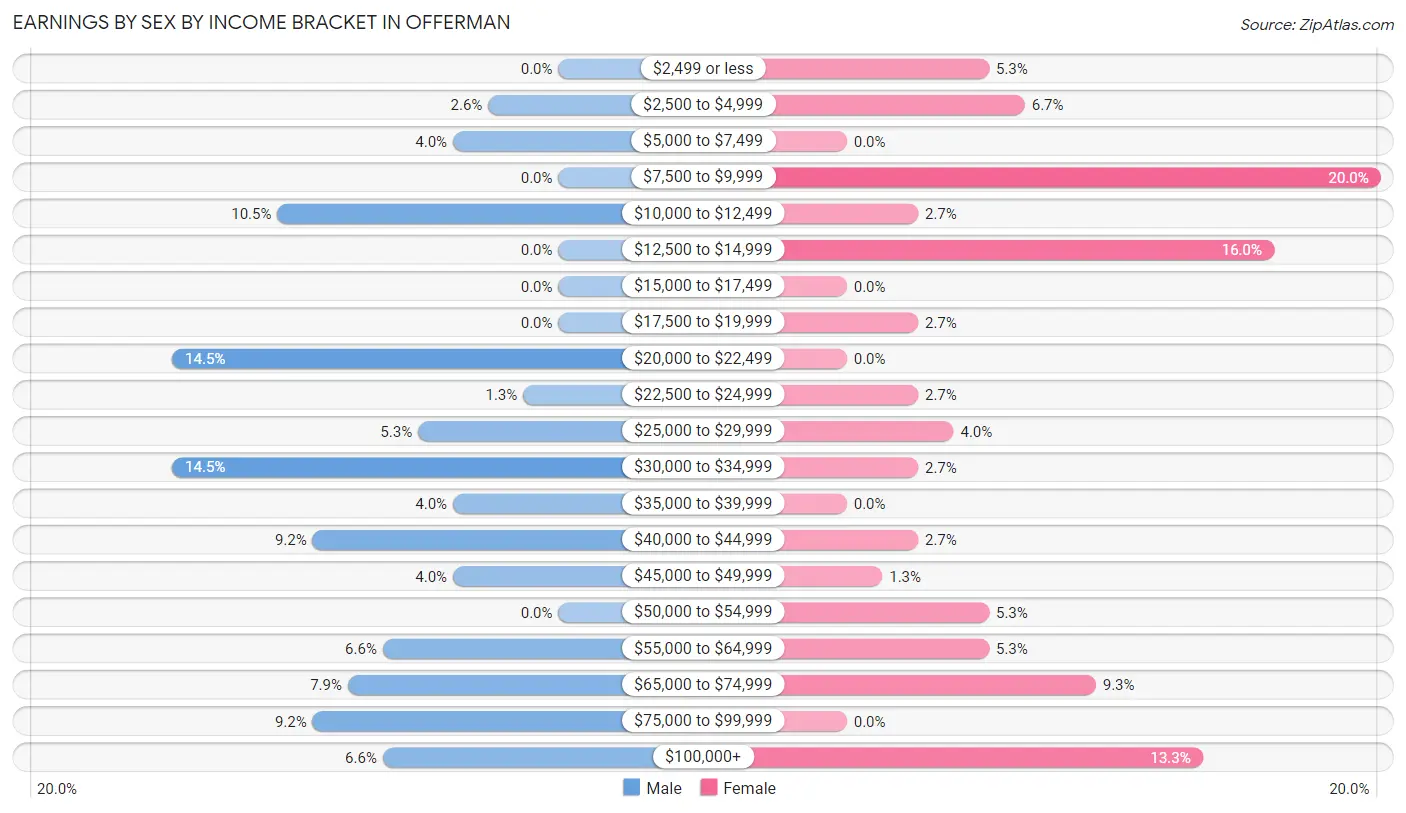
| Income | Male | Female |
| $2,499 or less | 0 (0.0%) | 4 (5.3%) |
| $2,500 to $4,999 | 2 (2.6%) | 5 (6.7%) |
| $5,000 to $7,499 | 3 (4.0%) | 0 (0.0%) |
| $7,500 to $9,999 | 0 (0.0%) | 15 (20.0%) |
| $10,000 to $12,499 | 8 (10.5%) | 2 (2.7%) |
| $12,500 to $14,999 | 0 (0.0%) | 12 (16.0%) |
| $15,000 to $17,499 | 0 (0.0%) | 0 (0.0%) |
| $17,500 to $19,999 | 0 (0.0%) | 2 (2.7%) |
| $20,000 to $22,499 | 11 (14.5%) | 0 (0.0%) |
| $22,500 to $24,999 | 1 (1.3%) | 2 (2.7%) |
| $25,000 to $29,999 | 4 (5.3%) | 3 (4.0%) |
| $30,000 to $34,999 | 11 (14.5%) | 2 (2.7%) |
| $35,000 to $39,999 | 3 (4.0%) | 0 (0.0%) |
| $40,000 to $44,999 | 7 (9.2%) | 2 (2.7%) |
| $45,000 to $49,999 | 3 (4.0%) | 1 (1.3%) |
| $50,000 to $54,999 | 0 (0.0%) | 4 (5.3%) |
| $55,000 to $64,999 | 5 (6.6%) | 4 (5.3%) |
| $65,000 to $74,999 | 6 (7.9%) | 7 (9.3%) |
| $75,000 to $99,999 | 7 (9.2%) | 0 (0.0%) |
| $100,000+ | 5 (6.6%) | 10 (13.3%) |
| Total | 76 (100.0%) | 75 (100.0%) |
Earnings by Sex by Educational Attainment in Offerman
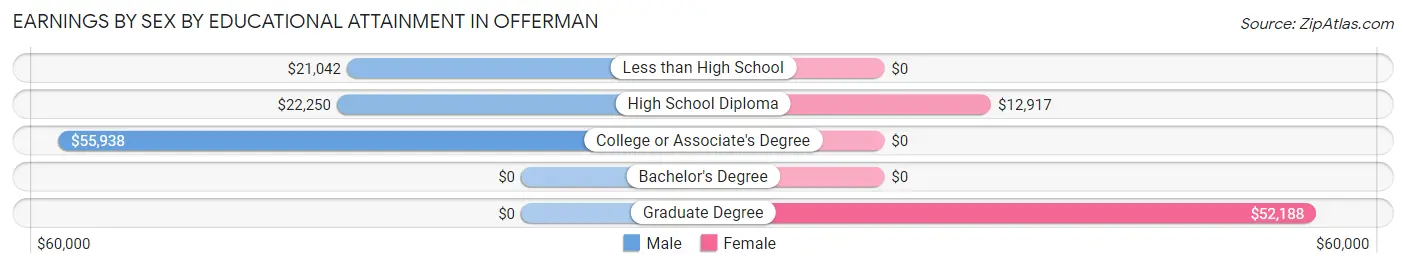
| Educational Attainment | Male Income | Female Income |
| Less than High School | $21,042 | $0 |
| High School Diploma | $22,250 | $12,917 |
| College or Associate's Degree | $55,938 | $0 |
| Bachelor's Degree | - | - |
| Graduate Degree | - | - |
| Total | $31,875 | $0 |
Family Income in Offerman
Family Income Brackets in Offerman
According to the Offerman family income data, there are 33 families falling into the $25,000 to $34,999 income range, which is the most common income bracket and makes up 21.8% of all families. Conversely, the $200,000+ income bracket is the least frequent group with only 1 families (0.7%) belonging to this category.
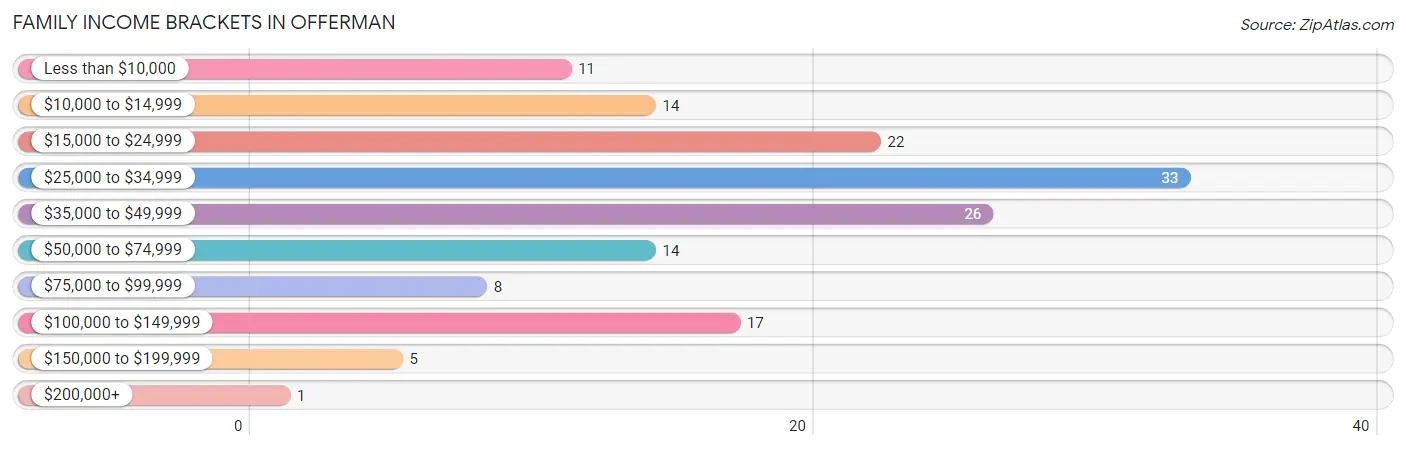
| Income Bracket | # Families | % Families |
| Less than $10,000 | 11 | 7.3% |
| $10,000 to $14,999 | 14 | 9.3% |
| $15,000 to $24,999 | 22 | 14.6% |
| $25,000 to $34,999 | 33 | 21.9% |
| $35,000 to $49,999 | 26 | 17.2% |
| $50,000 to $74,999 | 14 | 9.3% |
| $75,000 to $99,999 | 8 | 5.3% |
| $100,000 to $149,999 | 17 | 11.3% |
| $150,000 to $199,999 | 5 | 3.3% |
| $200,000+ | 1 | 0.7% |
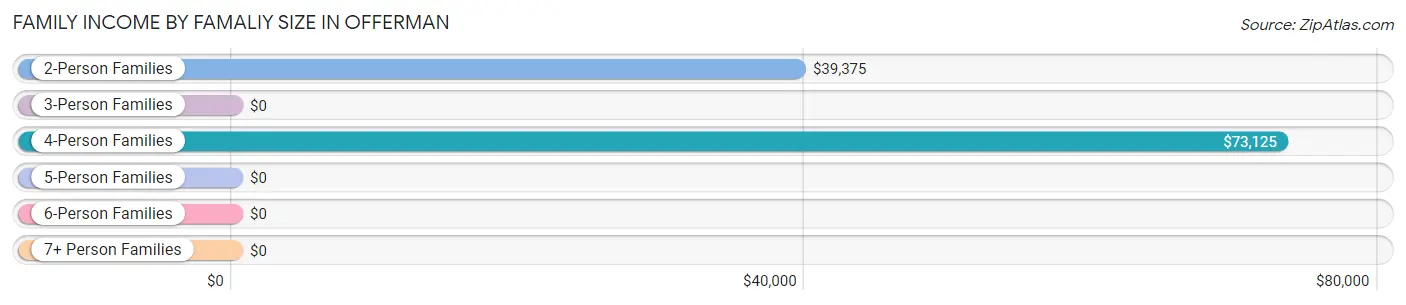
Family Income by Famaliy Size in Offerman
4-person families (19 | 12.6%) account for the highest median family income in Offerman with $73,125 per family, while 2-person families (79 | 52.3%) have the highest median income of $19,688 per family member.
| Income Bracket | # Families | Median Income |
| 2-Person Families | 79 (52.3%) | $39,375 |
| 3-Person Families | 15 (9.9%) | $0 |
| 4-Person Families | 19 (12.6%) | $73,125 |
| 5-Person Families | 32 (21.2%) | $0 |
| 6-Person Families | 6 (4.0%) | $0 |
| 7+ Person Families | 0 (0.0%) | $0 |
| Total | 151 (100.0%) | $31,042 |
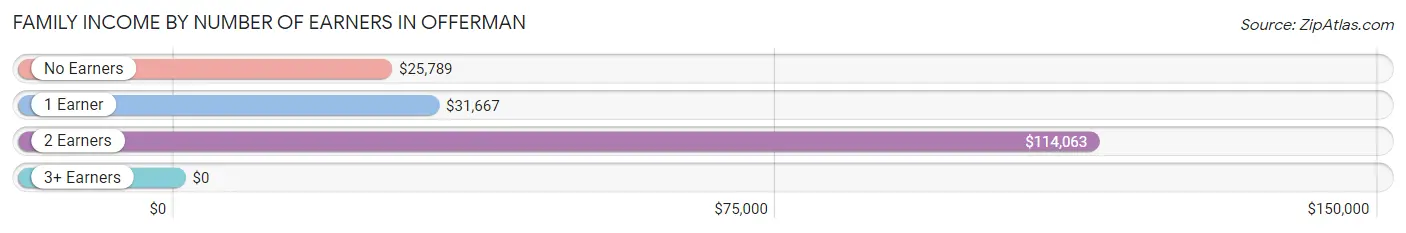
Family Income by Number of Earners in Offerman
| Number of Earners | # Families | Median Income |
| No Earners | 48 (31.8%) | $25,789 |
| 1 Earner | 68 (45.0%) | $31,667 |
| 2 Earners | 33 (21.8%) | $114,063 |
| 3+ Earners | 2 (1.3%) | $0 |
| Total | 151 (100.0%) | $31,042 |
Household Income in Offerman
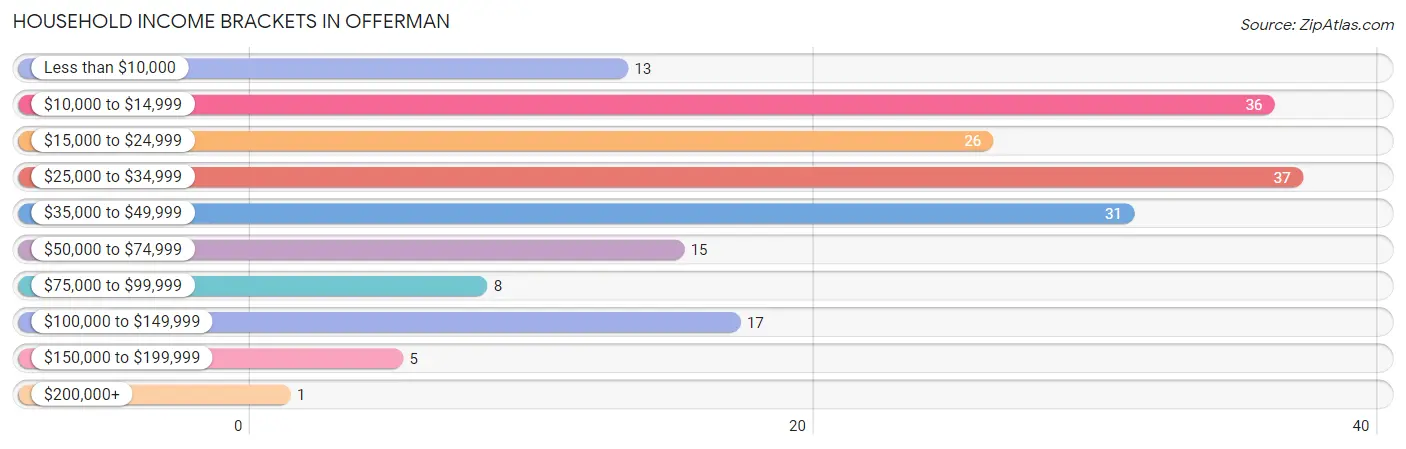
Household Income Brackets in Offerman
With 37 households falling in the category, the $25,000 to $34,999 income range is the most frequent in Offerman, accounting for 19.6% of all households. In contrast, only 1 households (0.5%) fall into the $200,000+ income bracket, making it the least populous group.
| Income Bracket | # Households | % Households |
| Less than $10,000 | 13 | 6.9% |
| $10,000 to $14,999 | 36 | 19.0% |
| $15,000 to $24,999 | 26 | 13.8% |
| $25,000 to $34,999 | 37 | 19.6% |
| $35,000 to $49,999 | 31 | 16.4% |
| $50,000 to $74,999 | 15 | 7.9% |
| $75,000 to $99,999 | 8 | 4.2% |
| $100,000 to $149,999 | 17 | 9.0% |
| $150,000 to $199,999 | 5 | 2.6% |
| $200,000+ | 1 | 0.5% |
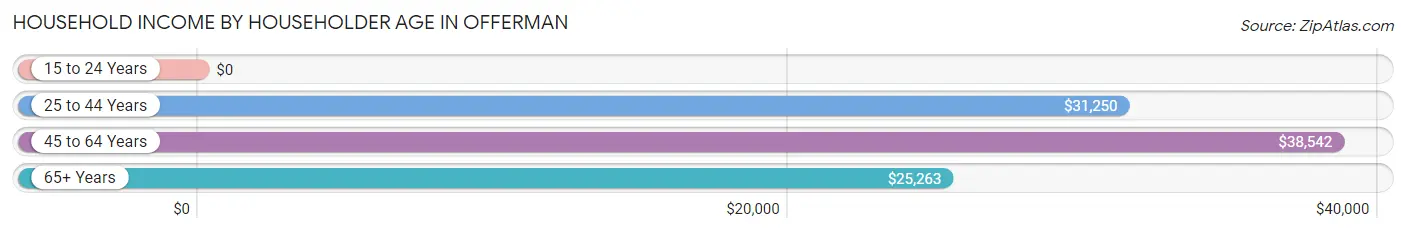
Household Income by Householder Age in Offerman
The median household income in Offerman is $27,321, with the highest median household income of $38,542 found in the 45 to 64 years age bracket for the primary householder. A total of 77 households (40.7%) fall into this category.
| Income Bracket | # Households | Median Income |
| 15 to 24 Years | 0 (0.0%) | $0 |
| 25 to 44 Years | 62 (32.8%) | $31,250 |
| 45 to 64 Years | 77 (40.7%) | $38,542 |
| 65+ Years | 50 (26.5%) | $25,263 |
| Total | 189 (100.0%) | $27,321 |
Poverty in Offerman
Income Below Poverty by Sex and Age in Offerman
With 66.1% poverty level for males and 58.5% for females among the residents of Offerman, 15 year old males and 12 to 14 year old females are the most vulnerable to poverty, with 3 males (100.0%) and 17 females (100.0%) in their respective age groups living below the poverty level.
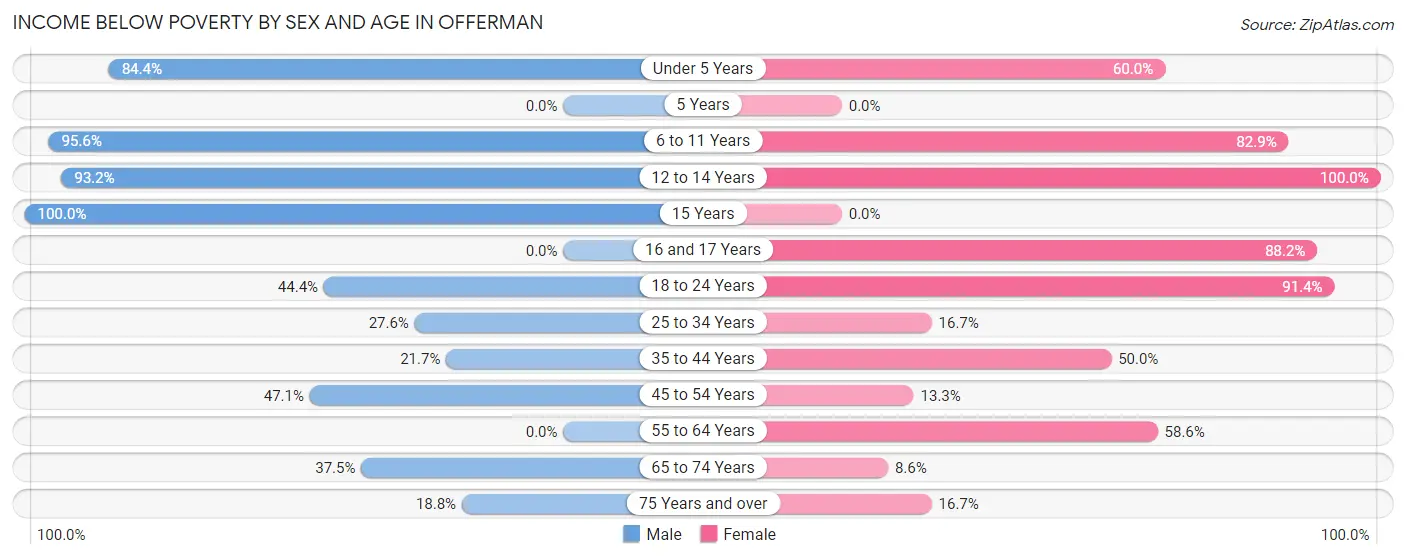
| Age Bracket | Male | Female |
| Under 5 Years | 108 (84.4%) | 12 (60.0%) |
| 5 Years | 0 (0.0%) | 0 (0.0%) |
| 6 to 11 Years | 129 (95.6%) | 97 (82.9%) |
| 12 to 14 Years | 82 (93.2%) | 17 (100.0%) |
| 15 Years | 3 (100.0%) | 0 (0.0%) |
| 16 and 17 Years | 0 (0.0%) | 15 (88.2%) |
| 18 to 24 Years | 4 (44.4%) | 32 (91.4%) |
| 25 to 34 Years | 8 (27.6%) | 3 (16.7%) |
| 35 to 44 Years | 5 (21.7%) | 22 (50.0%) |
| 45 to 54 Years | 8 (47.1%) | 4 (13.3%) |
| 55 to 64 Years | 0 (0.0%) | 17 (58.6%) |
| 65 to 74 Years | 3 (37.5%) | 3 (8.6%) |
| 75 Years and over | 16 (18.8%) | 1 (16.7%) |
| Total | 366 (66.1%) | 223 (58.5%) |
Income Above Poverty by Sex and Age in Offerman
According to the poverty statistics in Offerman, males aged 16 and 17 years and females aged 5 years are the age groups that are most secure financially, with 100.0% of males and 100.0% of females in these age groups living above the poverty line.
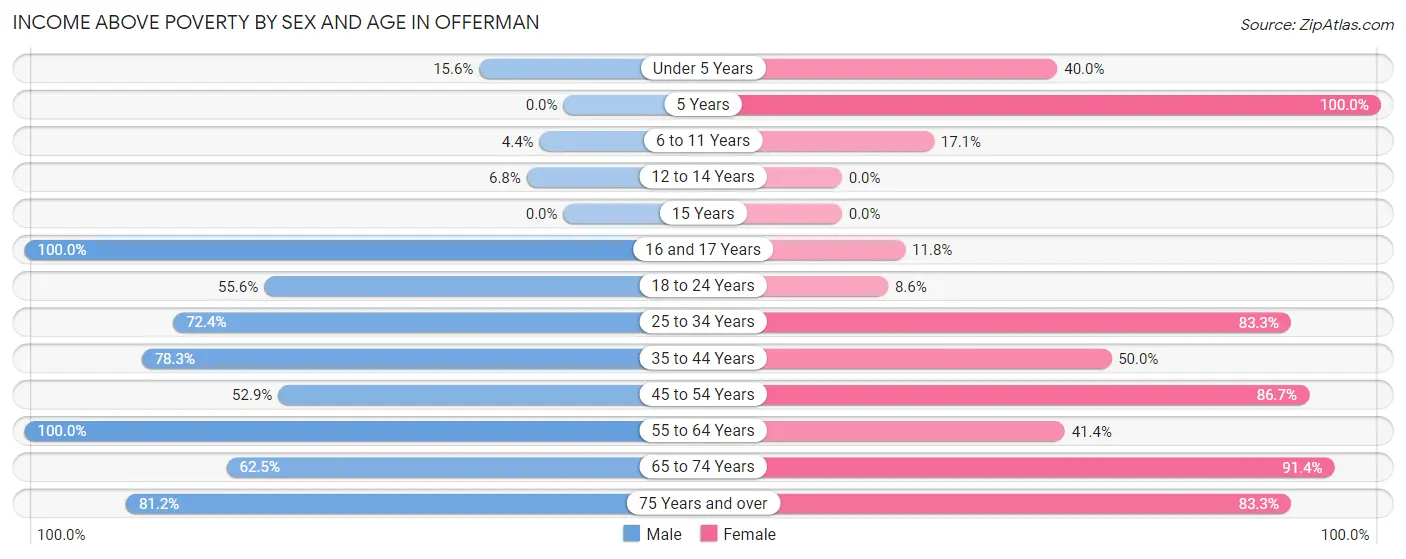
| Age Bracket | Male | Female |
| Under 5 Years | 20 (15.6%) | 8 (40.0%) |
| 5 Years | 0 (0.0%) | 13 (100.0%) |
| 6 to 11 Years | 6 (4.4%) | 20 (17.1%) |
| 12 to 14 Years | 6 (6.8%) | 0 (0.0%) |
| 15 Years | 0 (0.0%) | 0 (0.0%) |
| 16 and 17 Years | 2 (100.0%) | 2 (11.8%) |
| 18 to 24 Years | 5 (55.6%) | 3 (8.6%) |
| 25 to 34 Years | 21 (72.4%) | 15 (83.3%) |
| 35 to 44 Years | 18 (78.3%) | 22 (50.0%) |
| 45 to 54 Years | 9 (52.9%) | 26 (86.7%) |
| 55 to 64 Years | 27 (100.0%) | 12 (41.4%) |
| 65 to 74 Years | 5 (62.5%) | 32 (91.4%) |
| 75 Years and over | 69 (81.2%) | 5 (83.3%) |
| Total | 188 (33.9%) | 158 (41.5%) |
Income Below Poverty Among Married-Couple Families in Offerman
The poverty statistics for married-couple families in Offerman show that 7.1% or 7 of the total 99 families live below the poverty line. Families with 3 or 4 children have the highest poverty rate of 54.5%, comprising of 6 families. On the other hand, families with 1 or 2 children have the lowest poverty rate of 0.0%, which includes 0 families.
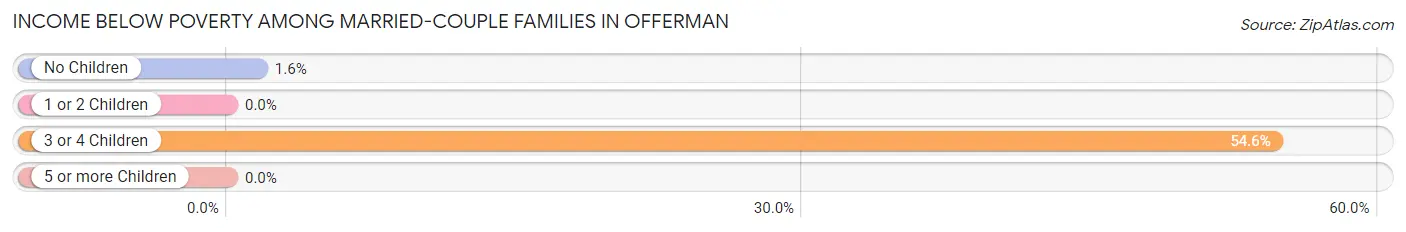
| Children | Above Poverty | Below Poverty |
| No Children | 63 (98.4%) | 1 (1.6%) |
| 1 or 2 Children | 24 (100.0%) | 0 (0.0%) |
| 3 or 4 Children | 5 (45.5%) | 6 (54.5%) |
| 5 or more Children | 0 (0.0%) | 0 (0.0%) |
| Total | 92 (92.9%) | 7 (7.1%) |
Income Below Poverty Among Single-Parent Households in Offerman
According to the poverty data in Offerman, 100.0% or 8 single-father households and 75.0% or 33 single-mother households are living below the poverty line. Among single-father households, those with 1 or 2 children have the highest poverty rate, with 8 households (100.0%) experiencing poverty. Likewise, among single-mother households, those with 3 or 4 children have the highest poverty rate, with 22 households (100.0%) falling below the poverty line.
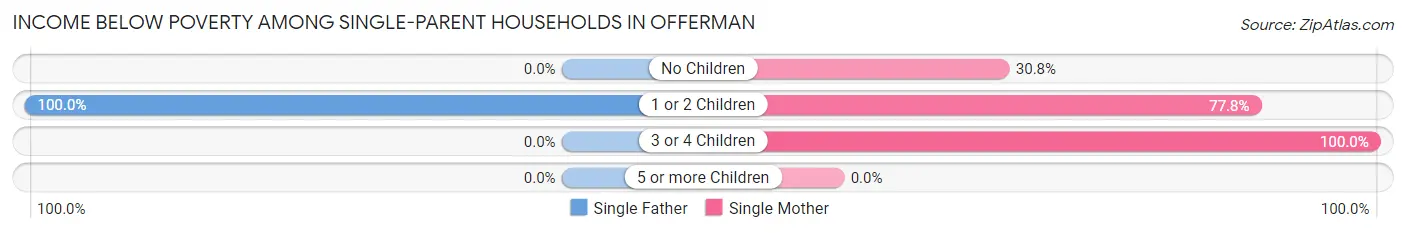
| Children | Single Father | Single Mother |
| No Children | 0 (0.0%) | 4 (30.8%) |
| 1 or 2 Children | 8 (100.0%) | 7 (77.8%) |
| 3 or 4 Children | 0 (0.0%) | 22 (100.0%) |
| 5 or more Children | 0 (0.0%) | 0 (0.0%) |
| Total | 8 (100.0%) | 33 (75.0%) |
Income Below Poverty Among Married-Couple vs Single-Parent Households in Offerman
The poverty data for Offerman shows that 7 of the married-couple family households (7.1%) and 41 of the single-parent households (78.8%) are living below the poverty level. Within the married-couple family households, those with 3 or 4 children have the highest poverty rate, with 6 households (54.5%) falling below the poverty line. Among the single-parent households, those with 3 or 4 children have the highest poverty rate, with 22 household (100.0%) living below poverty.
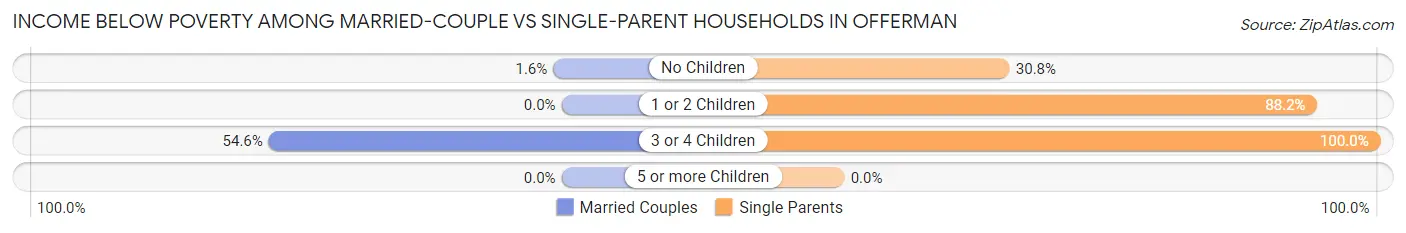
| Children | Married-Couple Families | Single-Parent Households |
| No Children | 1 (1.6%) | 4 (30.8%) |
| 1 or 2 Children | 0 (0.0%) | 15 (88.2%) |
| 3 or 4 Children | 6 (54.5%) | 22 (100.0%) |
| 5 or more Children | 0 (0.0%) | 0 (0.0%) |
| Total | 7 (7.1%) | 41 (78.8%) |
Employment Characteristics in Offerman
Employment by Class of Employer in Offerman
Among the 136 employed individuals in Offerman, private company employees (96 | 70.6%), federal government employees (15 | 11.0%), and self-employed (not incorporated) (14 | 10.3%) make up the most common classes of employment.
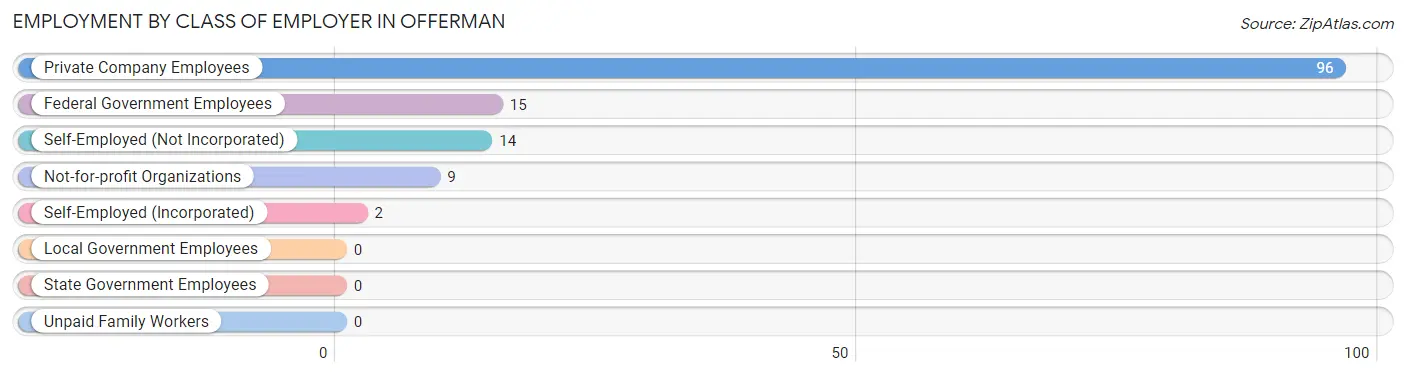
| Employer Class | # Employees | % Employees |
| Private Company Employees | 96 | 70.6% |
| Self-Employed (Incorporated) | 2 | 1.5% |
| Self-Employed (Not Incorporated) | 14 | 10.3% |
| Not-for-profit Organizations | 9 | 6.6% |
| Local Government Employees | 0 | 0.0% |
| State Government Employees | 0 | 0.0% |
| Federal Government Employees | 15 | 11.0% |
| Unpaid Family Workers | 0 | 0.0% |
| Total | 136 | 100.0% |
Employment Status by Age in Offerman
According to the labor force statistics for Offerman, out of the total population over 16 years of age (414), 35.7% or 148 individuals are in the labor force, with 5.4% or 8 of them unemployed. The age group with the highest labor force participation rate is 25 to 29 years, with 78.3% or 18 individuals in the labor force. Within the labor force, the 16 to 19 years age range has the highest percentage of unemployed individuals, with 80.0% or 4 of them being unemployed.
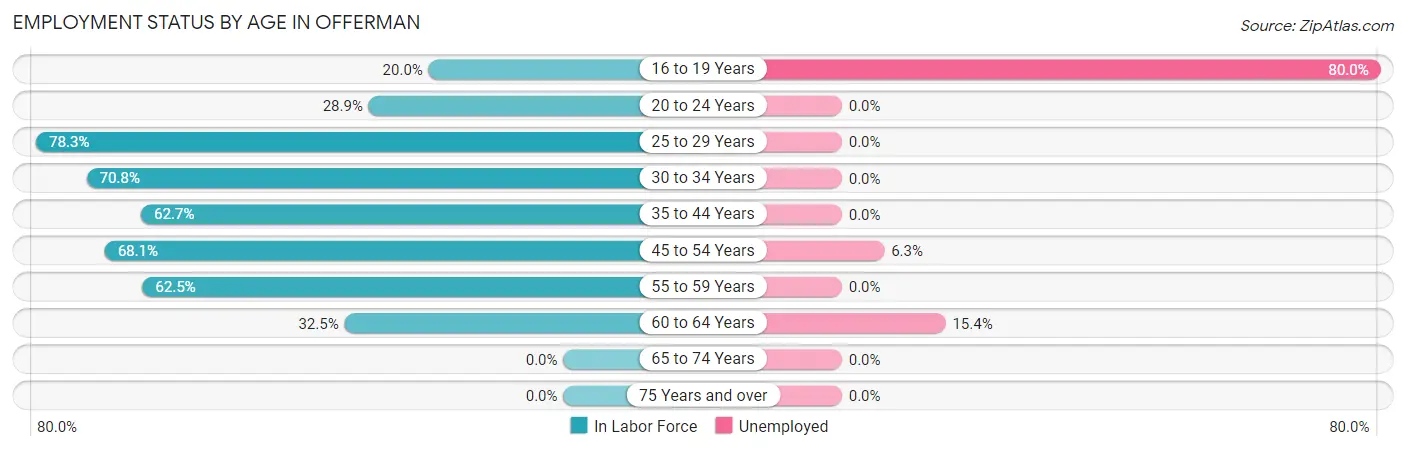
| Age Bracket | In Labor Force | Unemployed |
| 16 to 19 Years | 5 (20.0%) | 4 (80.0%) |
| 20 to 24 Years | 11 (28.9%) | 0 (0.0%) |
| 25 to 29 Years | 18 (78.3%) | 0 (0.0%) |
| 30 to 34 Years | 17 (70.8%) | 0 (0.0%) |
| 35 to 44 Years | 42 (62.7%) | 0 (0.0%) |
| 45 to 54 Years | 32 (68.1%) | 2 (6.3%) |
| 55 to 59 Years | 10 (62.5%) | 0 (0.0%) |
| 60 to 64 Years | 13 (32.5%) | 2 (15.4%) |
| 65 to 74 Years | 0 (0.0%) | 0 (0.0%) |
| 75 Years and over | 0 (0.0%) | 0 (0.0%) |
| Total | 148 (35.7%) | 8 (5.4%) |
Employment Status by Educational Attainment in Offerman
According to labor force statistics for Offerman, 60.8% of individuals (132) out of the total population between 25 and 64 years of age (217) are in the labor force, with 3.0% or 4 of them being unemployed. The group with the highest labor force participation rate are those with the educational attainment of bachelor's degree or higher, with 83.3% or 15 individuals in the labor force. Within the labor force, individuals with less than high school education have the highest percentage of unemployment, with 8.0% or 2 of them being unemployed.
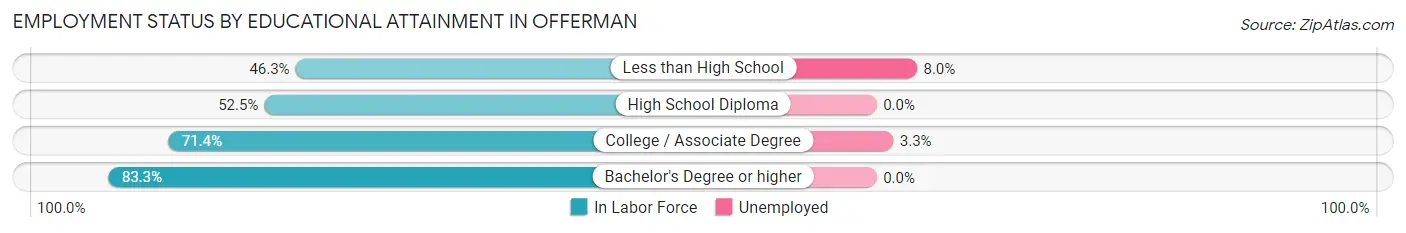
| Educational Attainment | In Labor Force | Unemployed |
| Less than High School | 25 (46.3%) | 4 (8.0%) |
| High School Diploma | 32 (52.5%) | 0 (0.0%) |
| College / Associate Degree | 60 (71.4%) | 3 (3.3%) |
| Bachelor's Degree or higher | 15 (83.3%) | 0 (0.0%) |
| Total | 132 (60.8%) | 7 (3.0%) |
Employment Occupations by Sex in Offerman
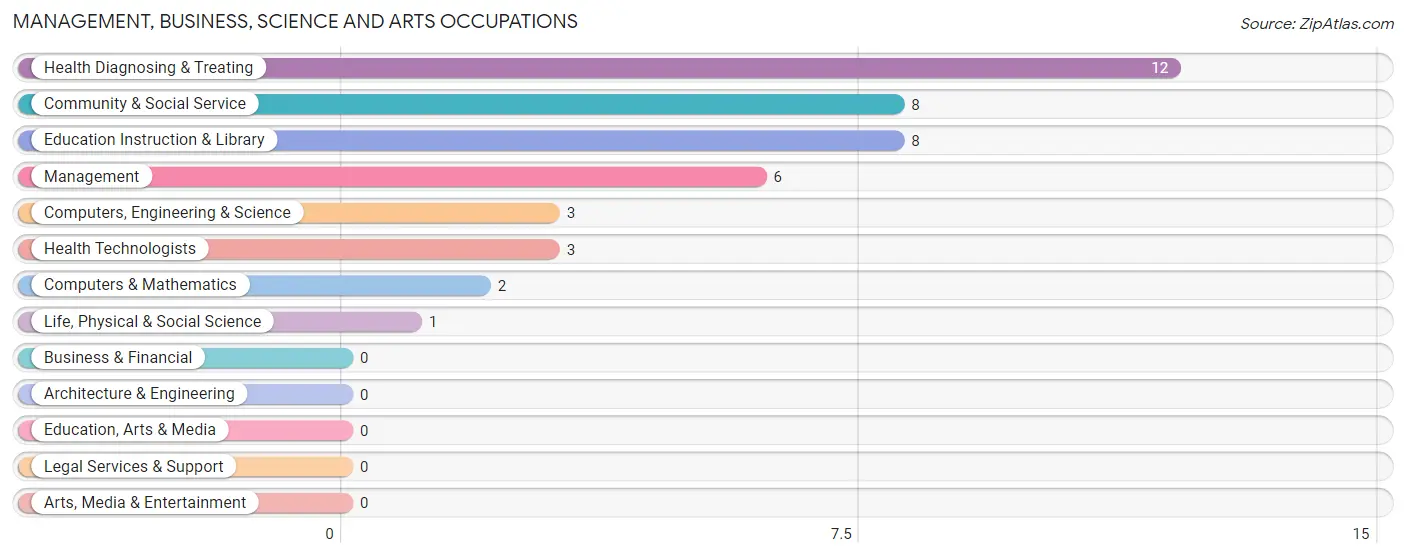
Management, Business, Science and Arts Occupations
The most common Management, Business, Science and Arts occupations in Offerman are Health Diagnosing & Treating (12 | 8.6%), Community & Social Service (8 | 5.7%), Education Instruction & Library (8 | 5.7%), Management (6 | 4.3%), and Computers, Engineering & Science (3 | 2.1%).
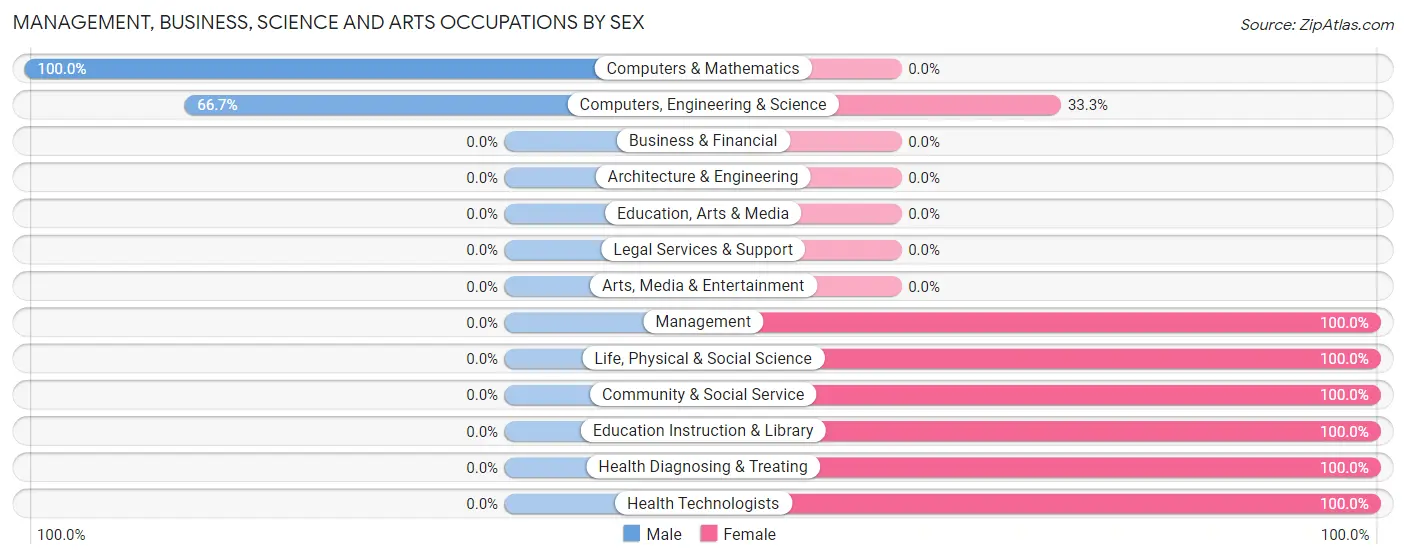
Management, Business, Science and Arts Occupations by Sex
Within the Management, Business, Science and Arts occupations in Offerman, the most male-oriented occupations are Computers & Mathematics (100.0%), and Computers, Engineering & Science (66.7%), while the most female-oriented occupations are Management (100.0%), Life, Physical & Social Science (100.0%), and Community & Social Service (100.0%).
| Occupation | Male | Female |
| Management | 0 (0.0%) | 6 (100.0%) |
| Business & Financial | 0 (0.0%) | 0 (0.0%) |
| Computers, Engineering & Science | 2 (66.7%) | 1 (33.3%) |
| Computers & Mathematics | 2 (100.0%) | 0 (0.0%) |
| Architecture & Engineering | 0 (0.0%) | 0 (0.0%) |
| Life, Physical & Social Science | 0 (0.0%) | 1 (100.0%) |
| Community & Social Service | 0 (0.0%) | 8 (100.0%) |
| Education, Arts & Media | 0 (0.0%) | 0 (0.0%) |
| Legal Services & Support | 0 (0.0%) | 0 (0.0%) |
| Education Instruction & Library | 0 (0.0%) | 8 (100.0%) |
| Arts, Media & Entertainment | 0 (0.0%) | 0 (0.0%) |
| Health Diagnosing & Treating | 0 (0.0%) | 12 (100.0%) |
| Health Technologists | 0 (0.0%) | 3 (100.0%) |
| Total (Category) | 2 (6.9%) | 27 (93.1%) |
| Total (Overall) | 69 (49.3%) | 71 (50.7%) |
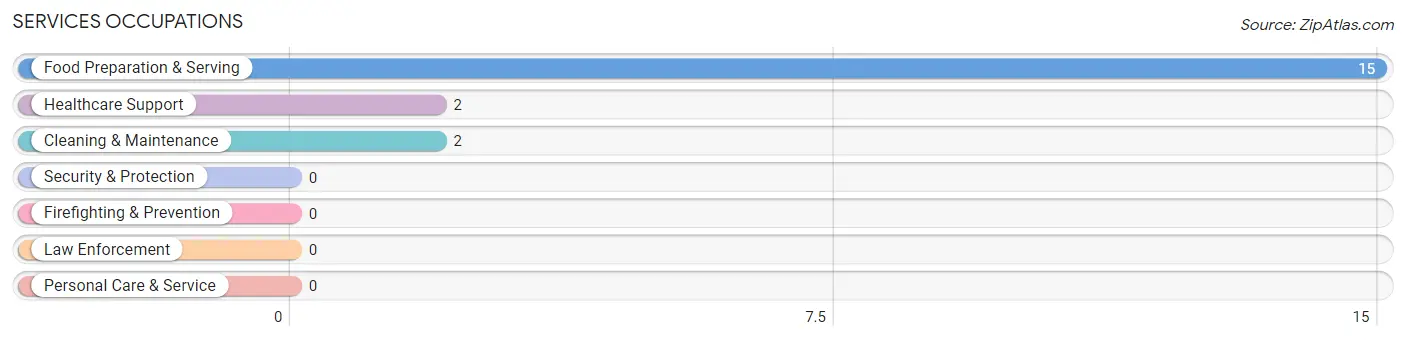
Services Occupations
The most common Services occupations in Offerman are Food Preparation & Serving (15 | 10.7%), Healthcare Support (2 | 1.4%), and Cleaning & Maintenance (2 | 1.4%).
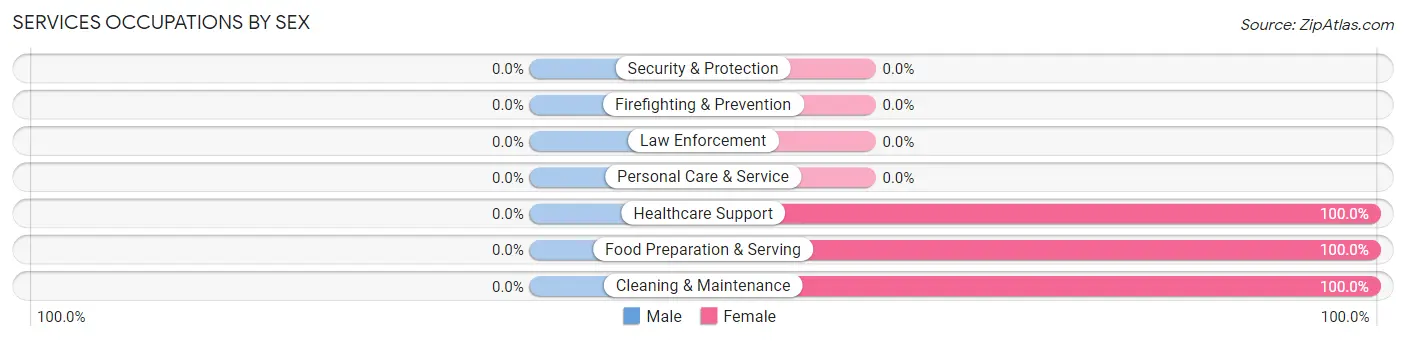
Services Occupations by Sex
| Occupation | Male | Female |
| Healthcare Support | 0 (0.0%) | 2 (100.0%) |
| Security & Protection | 0 (0.0%) | 0 (0.0%) |
| Firefighting & Prevention | 0 (0.0%) | 0 (0.0%) |
| Law Enforcement | 0 (0.0%) | 0 (0.0%) |
| Food Preparation & Serving | 0 (0.0%) | 15 (100.0%) |
| Cleaning & Maintenance | 0 (0.0%) | 2 (100.0%) |
| Personal Care & Service | 0 (0.0%) | 0 (0.0%) |
| Total (Category) | 0 (0.0%) | 19 (100.0%) |
| Total (Overall) | 69 (49.3%) | 71 (50.7%) |
Sales and Office Occupations
The most common Sales and Office occupations in Offerman are Sales & Related (16 | 11.4%), and Office & Administration (7 | 5.0%).
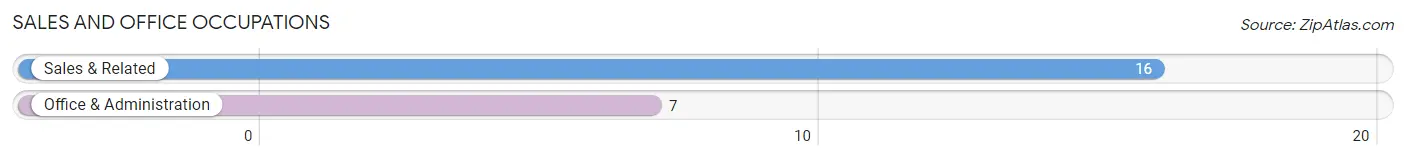
Sales and Office Occupations by Sex
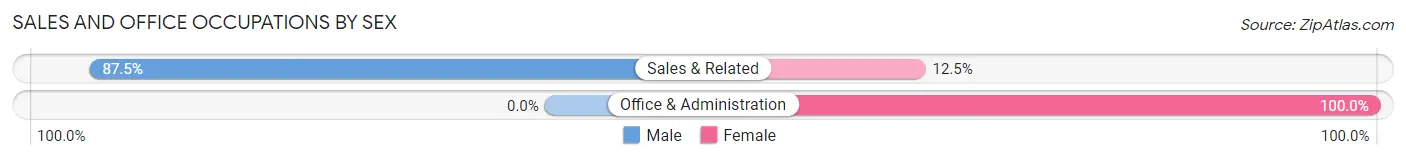
| Occupation | Male | Female |
| Sales & Related | 14 (87.5%) | 2 (12.5%) |
| Office & Administration | 0 (0.0%) | 7 (100.0%) |
| Total (Category) | 14 (60.9%) | 9 (39.1%) |
| Total (Overall) | 69 (49.3%) | 71 (50.7%) |
Natural Resources, Construction and Maintenance Occupations
The most common Natural Resources, Construction and Maintenance occupations in Offerman are Construction & Extraction (25 | 17.9%), Farming, Fishing & Forestry (11 | 7.9%), and Installation, Maintenance & Repair (3 | 2.1%).
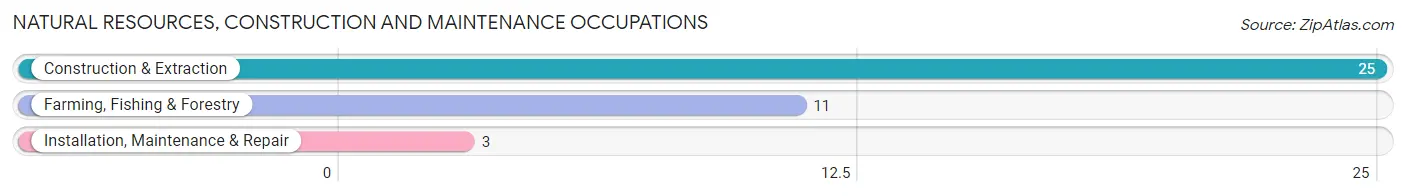
Natural Resources, Construction and Maintenance Occupations by Sex
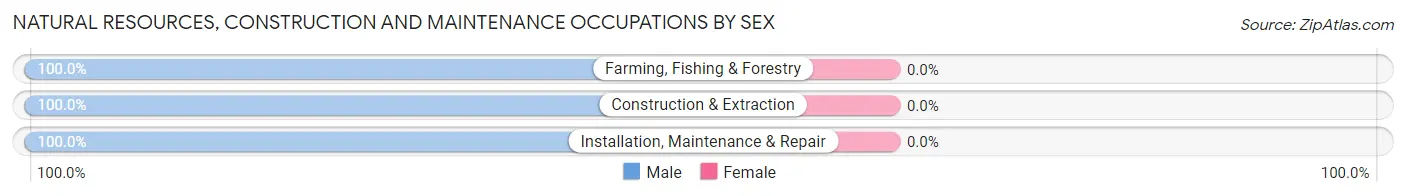
| Occupation | Male | Female |
| Farming, Fishing & Forestry | 11 (100.0%) | 0 (0.0%) |
| Construction & Extraction | 25 (100.0%) | 0 (0.0%) |
| Installation, Maintenance & Repair | 3 (100.0%) | 0 (0.0%) |
| Total (Category) | 39 (100.0%) | 0 (0.0%) |
| Total (Overall) | 69 (49.3%) | 71 (50.7%) |
Production, Transportation and Moving Occupations
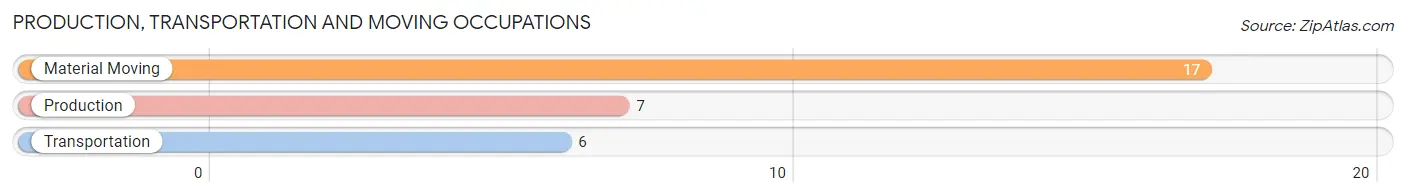
The most common Production, Transportation and Moving occupations in Offerman are Material Moving (17 | 12.1%), Production (7 | 5.0%), and Transportation (6 | 4.3%).
Production, Transportation and Moving Occupations by Sex
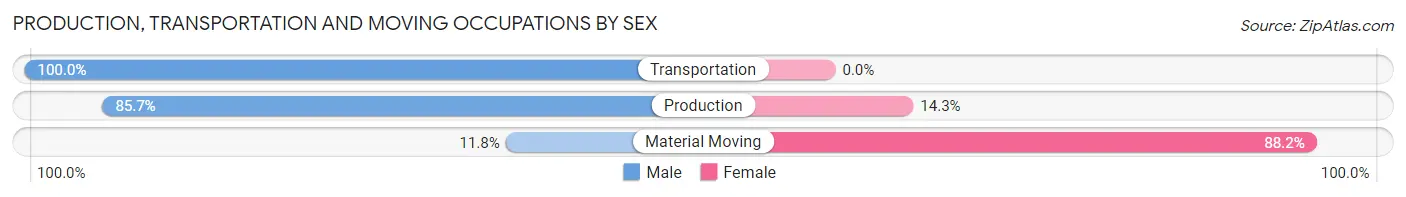
| Occupation | Male | Female |
| Production | 6 (85.7%) | 1 (14.3%) |
| Transportation | 6 (100.0%) | 0 (0.0%) |
| Material Moving | 2 (11.8%) | 15 (88.2%) |
| Total (Category) | 14 (46.7%) | 16 (53.3%) |
| Total (Overall) | 69 (49.3%) | 71 (50.7%) |
Employment Industries by Sex in Offerman
Employment Industries in Offerman
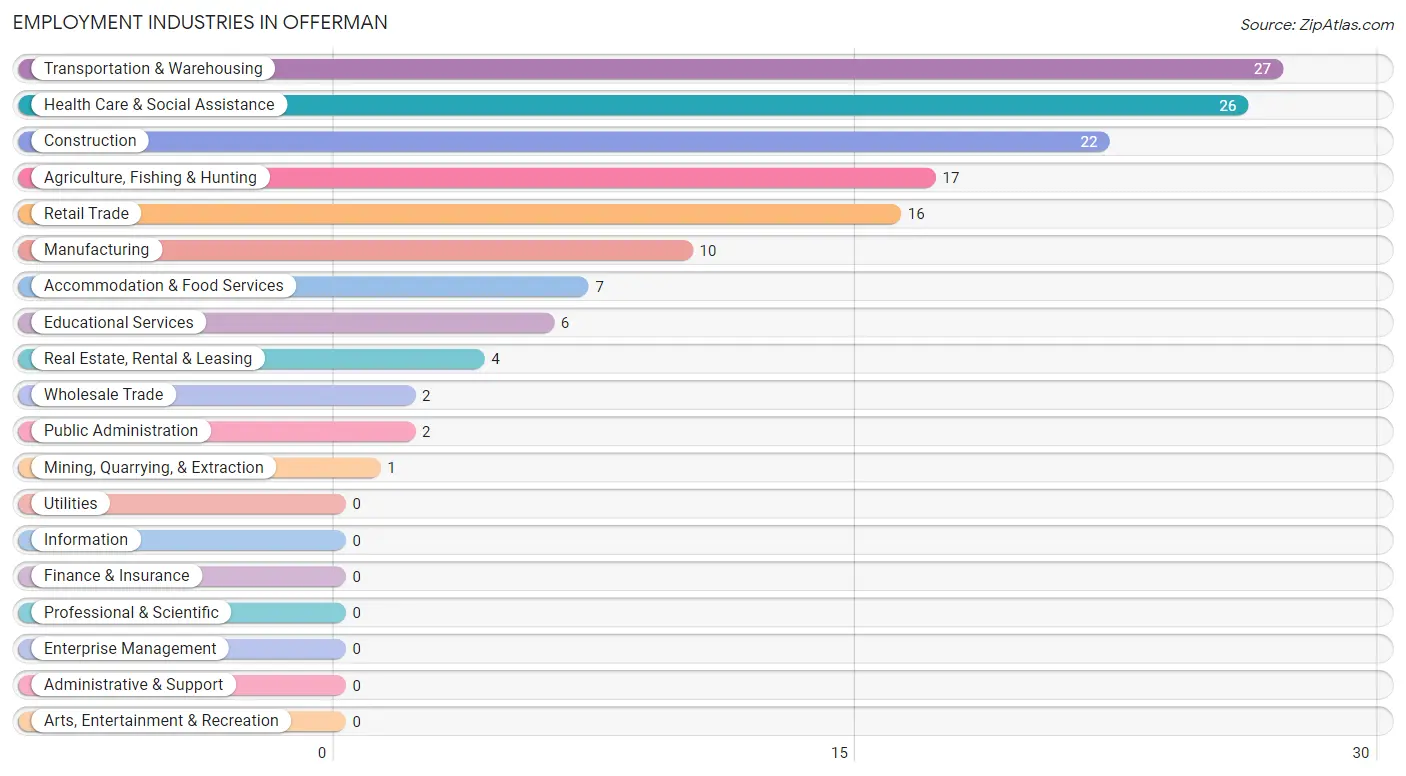
The major employment industries in Offerman include Transportation & Warehousing (27 | 19.3%), Health Care & Social Assistance (26 | 18.6%), Construction (22 | 15.7%), Agriculture, Fishing & Hunting (17 | 12.1%), and Retail Trade (16 | 11.4%).
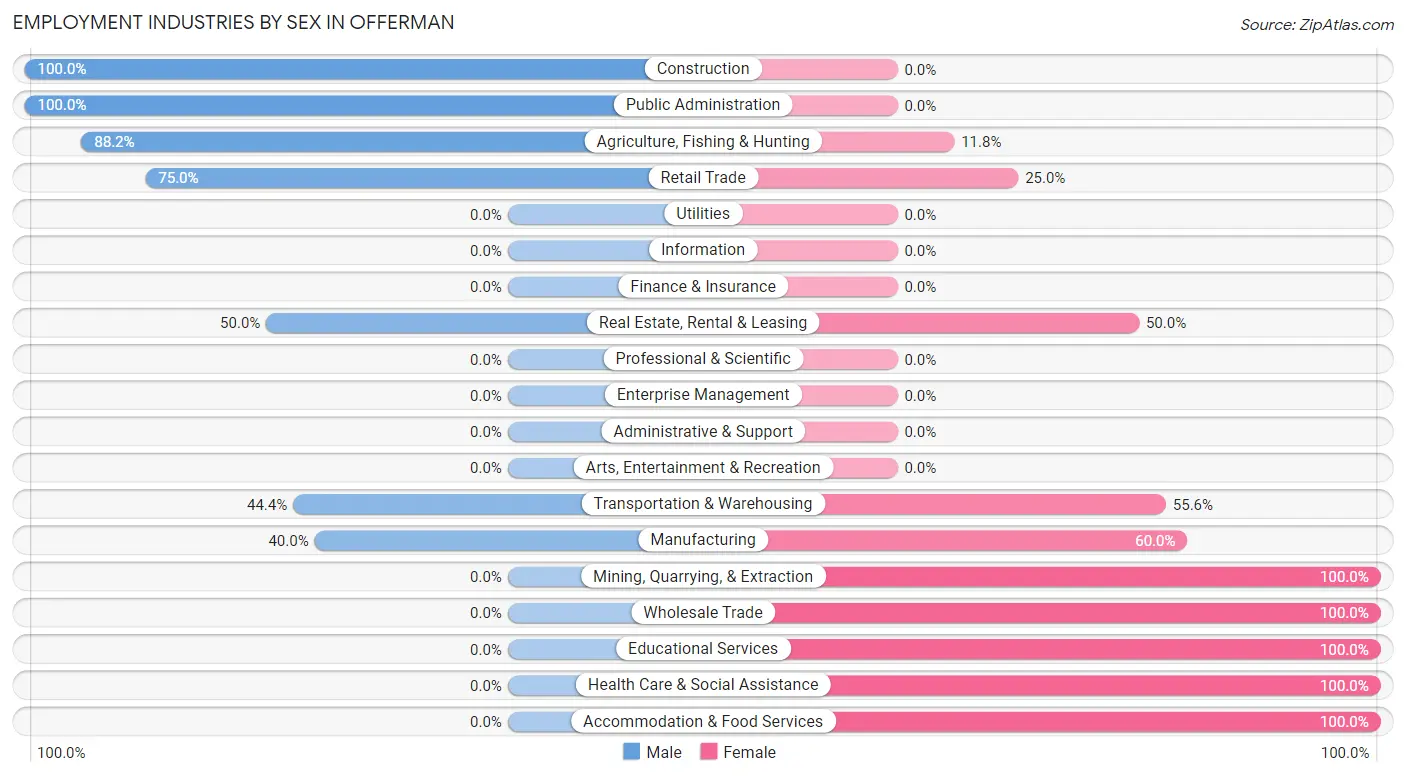
Employment Industries by Sex in Offerman
The Offerman industries that see more men than women are Construction (100.0%), Public Administration (100.0%), and Agriculture, Fishing & Hunting (88.2%), whereas the industries that tend to have a higher number of women are Mining, Quarrying, & Extraction (100.0%), Wholesale Trade (100.0%), and Educational Services (100.0%).
| Industry | Male | Female |
| Agriculture, Fishing & Hunting | 15 (88.2%) | 2 (11.8%) |
| Mining, Quarrying, & Extraction | 0 (0.0%) | 1 (100.0%) |
| Construction | 22 (100.0%) | 0 (0.0%) |
| Manufacturing | 4 (40.0%) | 6 (60.0%) |
| Wholesale Trade | 0 (0.0%) | 2 (100.0%) |
| Retail Trade | 12 (75.0%) | 4 (25.0%) |
| Transportation & Warehousing | 12 (44.4%) | 15 (55.6%) |
| Utilities | 0 (0.0%) | 0 (0.0%) |
| Information | 0 (0.0%) | 0 (0.0%) |
| Finance & Insurance | 0 (0.0%) | 0 (0.0%) |
| Real Estate, Rental & Leasing | 2 (50.0%) | 2 (50.0%) |
| Professional & Scientific | 0 (0.0%) | 0 (0.0%) |
| Enterprise Management | 0 (0.0%) | 0 (0.0%) |
| Administrative & Support | 0 (0.0%) | 0 (0.0%) |
| Educational Services | 0 (0.0%) | 6 (100.0%) |
| Health Care & Social Assistance | 0 (0.0%) | 26 (100.0%) |
| Arts, Entertainment & Recreation | 0 (0.0%) | 0 (0.0%) |
| Accommodation & Food Services | 0 (0.0%) | 7 (100.0%) |
| Public Administration | 2 (100.0%) | 0 (0.0%) |
| Total | 69 (49.3%) | 71 (50.7%) |
Education in Offerman
School Enrollment in Offerman
The most common levels of schooling among the 397 students in Offerman are elementary school (222 | 55.9%), middle school (116 | 29.2%), and nursery / preschool (23 | 5.8%).
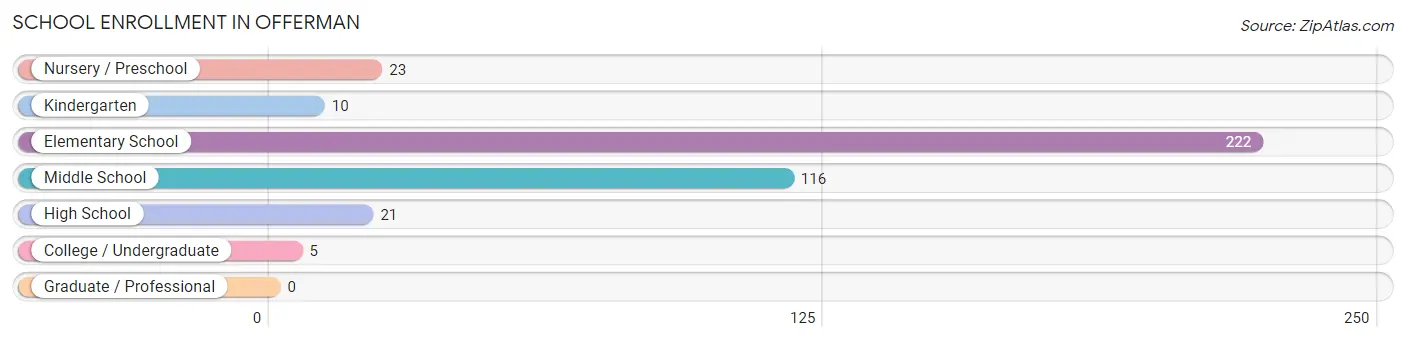
| School Level | # Students | % Students |
| Nursery / Preschool | 23 | 5.8% |
| Kindergarten | 10 | 2.5% |
| Elementary School | 222 | 55.9% |
| Middle School | 116 | 29.2% |
| High School | 21 | 5.3% |
| College / Undergraduate | 5 | 1.3% |
| Graduate / Professional | 0 | 0.0% |
| Total | 397 | 100.0% |
School Enrollment by Age by Funding Source in Offerman
Out of a total of 397 students who are enrolled in schools in Offerman, 13 (3.3%) attend a private institution, while the remaining 384 (96.7%) are enrolled in public schools. The age group of 3 to 4 year olds has the highest likelihood of being enrolled in private schools, with 8 (80.0% in the age bracket) enrolled. Conversely, the age group of 10 to 14 year olds has the lowest likelihood of being enrolled in a private school, with 311 (100.0% in the age bracket) attending a public institution.
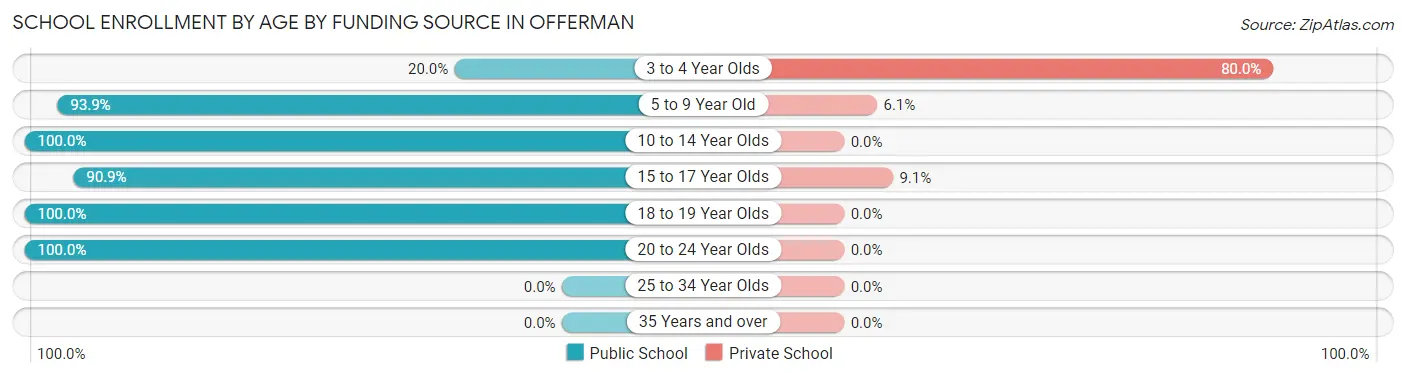
| Age Bracket | Public School | Private School |
| 3 to 4 Year Olds | 2 (20.0%) | 8 (80.0%) |
| 5 to 9 Year Old | 46 (93.9%) | 3 (6.1%) |
| 10 to 14 Year Olds | 311 (100.0%) | 0 (0.0%) |
| 15 to 17 Year Olds | 20 (90.9%) | 2 (9.1%) |
| 18 to 19 Year Olds | 2 (100.0%) | 0 (0.0%) |
| 20 to 24 Year Olds | 3 (100.0%) | 0 (0.0%) |
| 25 to 34 Year Olds | 0 (0.0%) | 0 (0.0%) |
| 35 Years and over | 0 (0.0%) | 0 (0.0%) |
| Total | 384 (96.7%) | 13 (3.3%) |
Educational Attainment by Field of Study in Offerman
Education (8 | 44.4%), science & technology (5 | 27.8%), social sciences (3 | 16.7%), and business (2 | 11.1%) are the most common fields of study among 18 individuals in Offerman who have obtained a bachelor's degree or higher.
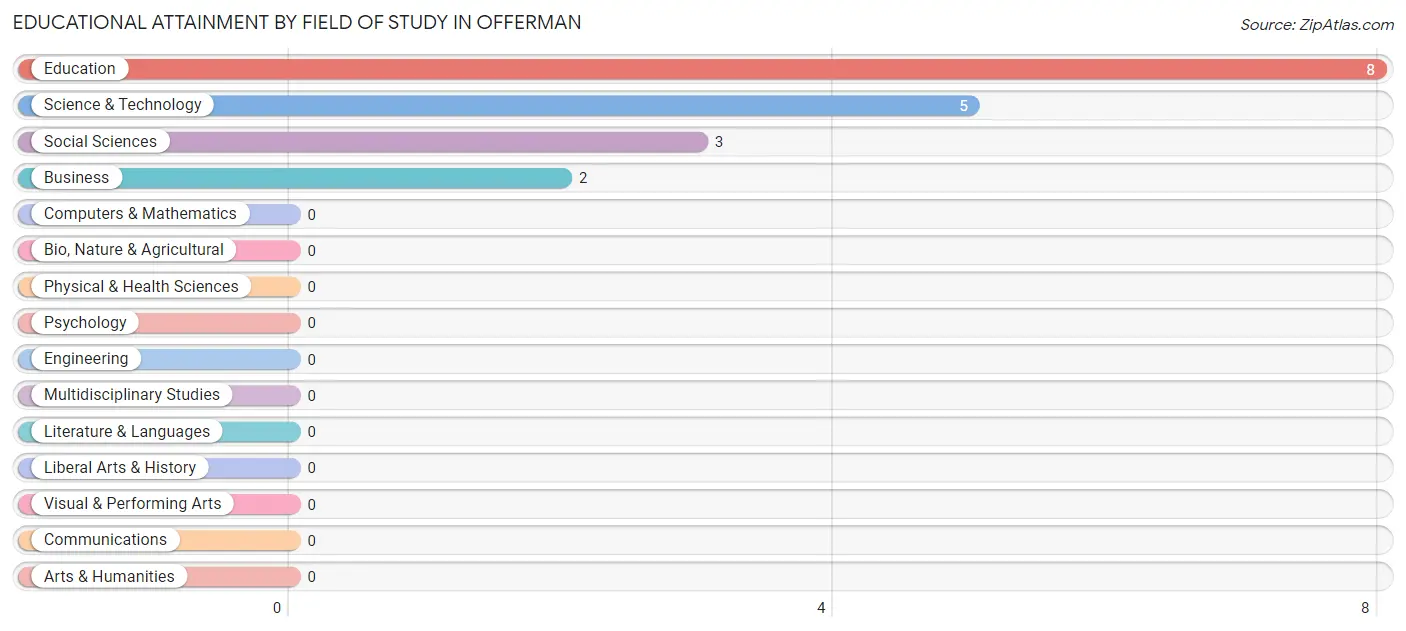
| Field of Study | # Graduates | % Graduates |
| Computers & Mathematics | 0 | 0.0% |
| Bio, Nature & Agricultural | 0 | 0.0% |
| Physical & Health Sciences | 0 | 0.0% |
| Psychology | 0 | 0.0% |
| Social Sciences | 3 | 16.7% |
| Engineering | 0 | 0.0% |
| Multidisciplinary Studies | 0 | 0.0% |
| Science & Technology | 5 | 27.8% |
| Business | 2 | 11.1% |
| Education | 8 | 44.4% |
| Literature & Languages | 0 | 0.0% |
| Liberal Arts & History | 0 | 0.0% |
| Visual & Performing Arts | 0 | 0.0% |
| Communications | 0 | 0.0% |
| Arts & Humanities | 0 | 0.0% |
| Total | 18 | 100.0% |
Transportation & Commute in Offerman
Vehicle Availability by Sex in Offerman
The most prevalent vehicle ownership categories in Offerman are males with 2 vehicles (34, accounting for 50.7%) and females with 2 vehicles (44, making up 49.3%).
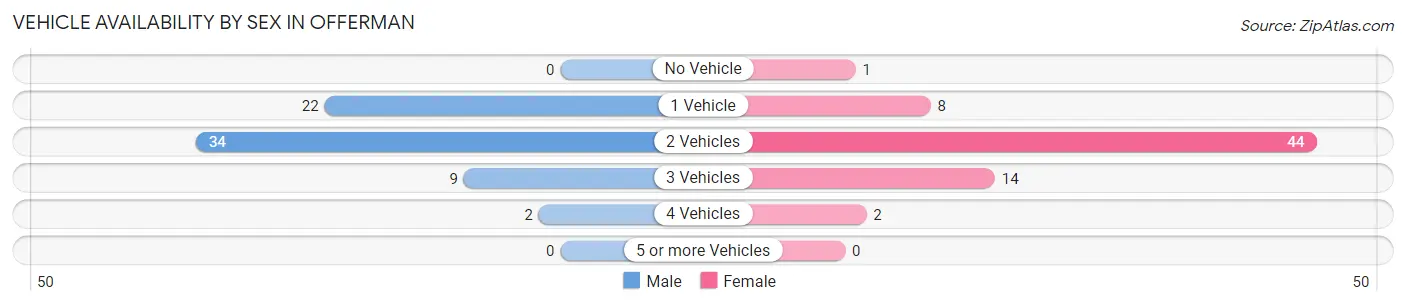
| Vehicles Available | Male | Female |
| No Vehicle | 0 (0.0%) | 1 (1.5%) |
| 1 Vehicle | 22 (32.8%) | 8 (11.6%) |
| 2 Vehicles | 34 (50.7%) | 44 (63.8%) |
| 3 Vehicles | 9 (13.4%) | 14 (20.3%) |
| 4 Vehicles | 2 (3.0%) | 2 (2.9%) |
| 5 or more Vehicles | 0 (0.0%) | 0 (0.0%) |
| Total | 67 (100.0%) | 69 (100.0%) |
Commute Time in Offerman
The most frequently occuring commute durations in Offerman are 30 to 34 minutes (31 commuters, 22.8%), 20 to 24 minutes (25 commuters, 18.4%), and 15 to 19 minutes (18 commuters, 13.2%).
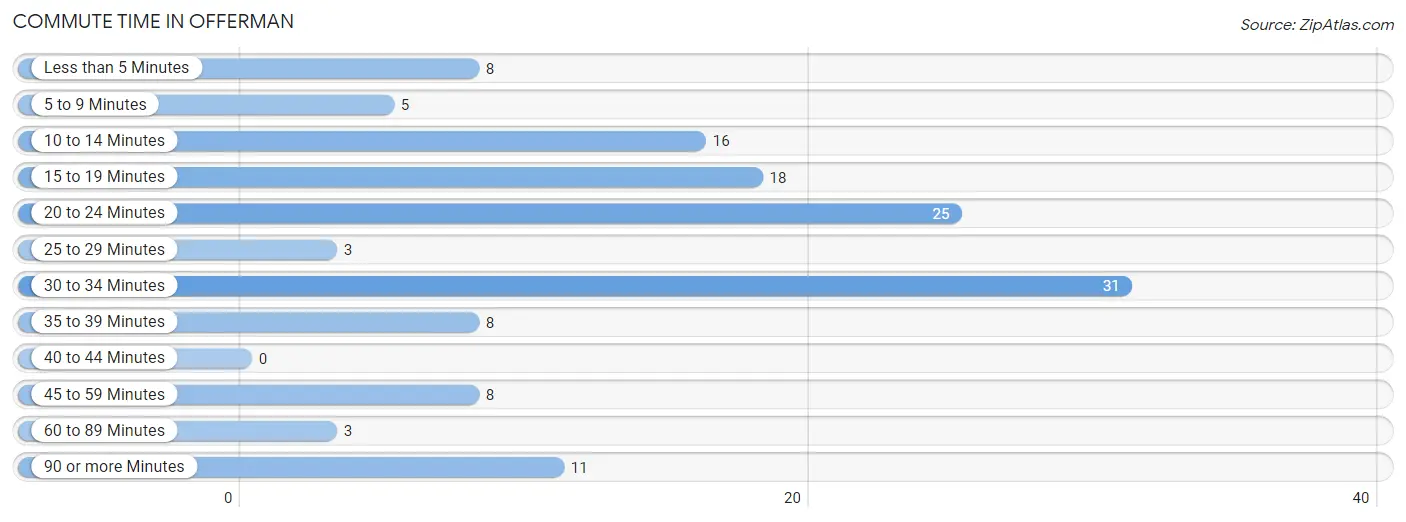
| Commute Time | # Commuters | % Commuters |
| Less than 5 Minutes | 8 | 5.9% |
| 5 to 9 Minutes | 5 | 3.7% |
| 10 to 14 Minutes | 16 | 11.8% |
| 15 to 19 Minutes | 18 | 13.2% |
| 20 to 24 Minutes | 25 | 18.4% |
| 25 to 29 Minutes | 3 | 2.2% |
| 30 to 34 Minutes | 31 | 22.8% |
| 35 to 39 Minutes | 8 | 5.9% |
| 40 to 44 Minutes | 0 | 0.0% |
| 45 to 59 Minutes | 8 | 5.9% |
| 60 to 89 Minutes | 3 | 2.2% |
| 90 or more Minutes | 11 | 8.1% |
Commute Time by Sex in Offerman
The most common commute times in Offerman are 30 to 34 minutes (12 commuters, 17.9%) for males and 30 to 34 minutes (19 commuters, 27.5%) for females.
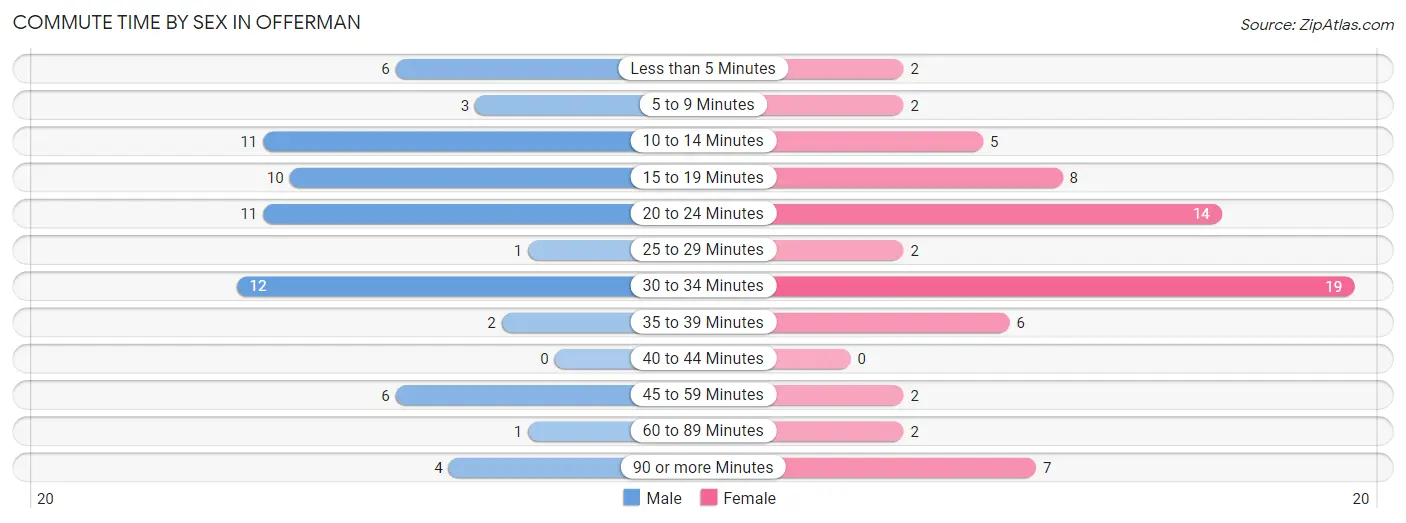
| Commute Time | Male | Female |
| Less than 5 Minutes | 6 (9.0%) | 2 (2.9%) |
| 5 to 9 Minutes | 3 (4.5%) | 2 (2.9%) |
| 10 to 14 Minutes | 11 (16.4%) | 5 (7.2%) |
| 15 to 19 Minutes | 10 (14.9%) | 8 (11.6%) |
| 20 to 24 Minutes | 11 (16.4%) | 14 (20.3%) |
| 25 to 29 Minutes | 1 (1.5%) | 2 (2.9%) |
| 30 to 34 Minutes | 12 (17.9%) | 19 (27.5%) |
| 35 to 39 Minutes | 2 (3.0%) | 6 (8.7%) |
| 40 to 44 Minutes | 0 (0.0%) | 0 (0.0%) |
| 45 to 59 Minutes | 6 (9.0%) | 2 (2.9%) |
| 60 to 89 Minutes | 1 (1.5%) | 2 (2.9%) |
| 90 or more Minutes | 4 (6.0%) | 7 (10.1%) |
Time of Departure to Work by Sex in Offerman
The most frequent times of departure to work in Offerman are 5:30 AM to 5:59 AM (23, 34.3%) for males and 12:00 AM to 4:59 AM (22, 31.9%) for females.
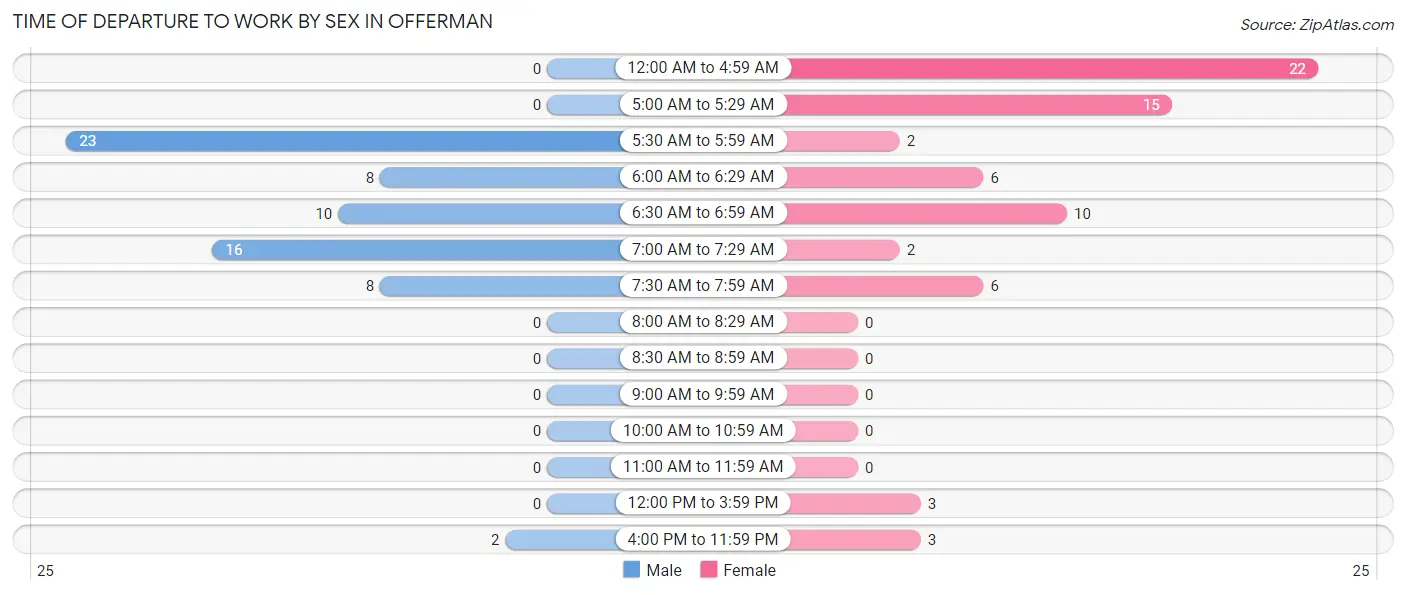
| Time of Departure | Male | Female |
| 12:00 AM to 4:59 AM | 0 (0.0%) | 22 (31.9%) |
| 5:00 AM to 5:29 AM | 0 (0.0%) | 15 (21.7%) |
| 5:30 AM to 5:59 AM | 23 (34.3%) | 2 (2.9%) |
| 6:00 AM to 6:29 AM | 8 (11.9%) | 6 (8.7%) |
| 6:30 AM to 6:59 AM | 10 (14.9%) | 10 (14.5%) |
| 7:00 AM to 7:29 AM | 16 (23.9%) | 2 (2.9%) |
| 7:30 AM to 7:59 AM | 8 (11.9%) | 6 (8.7%) |
| 8:00 AM to 8:29 AM | 0 (0.0%) | 0 (0.0%) |
| 8:30 AM to 8:59 AM | 0 (0.0%) | 0 (0.0%) |
| 9:00 AM to 9:59 AM | 0 (0.0%) | 0 (0.0%) |
| 10:00 AM to 10:59 AM | 0 (0.0%) | 0 (0.0%) |
| 11:00 AM to 11:59 AM | 0 (0.0%) | 0 (0.0%) |
| 12:00 PM to 3:59 PM | 0 (0.0%) | 3 (4.3%) |
| 4:00 PM to 11:59 PM | 2 (3.0%) | 3 (4.3%) |
| Total | 67 (100.0%) | 69 (100.0%) |
Housing Occupancy in Offerman
Occupancy by Ownership in Offerman
Of the total 189 dwellings in Offerman, owner-occupied units account for 127 (67.2%), while renter-occupied units make up 62 (32.8%).
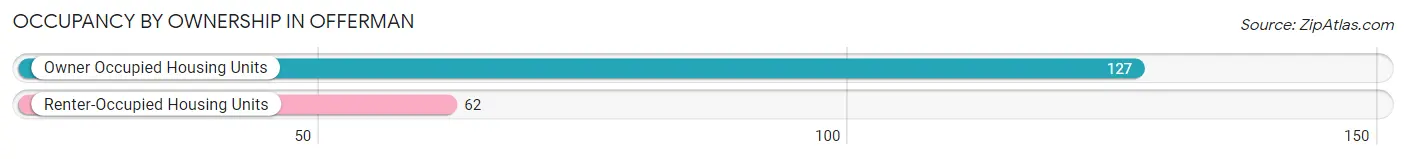
| Occupancy | # Housing Units | % Housing Units |
| Owner Occupied Housing Units | 127 | 67.2% |
| Renter-Occupied Housing Units | 62 | 32.8% |
| Total Occupied Housing Units | 189 | 100.0% |
Occupancy by Household Size in Offerman
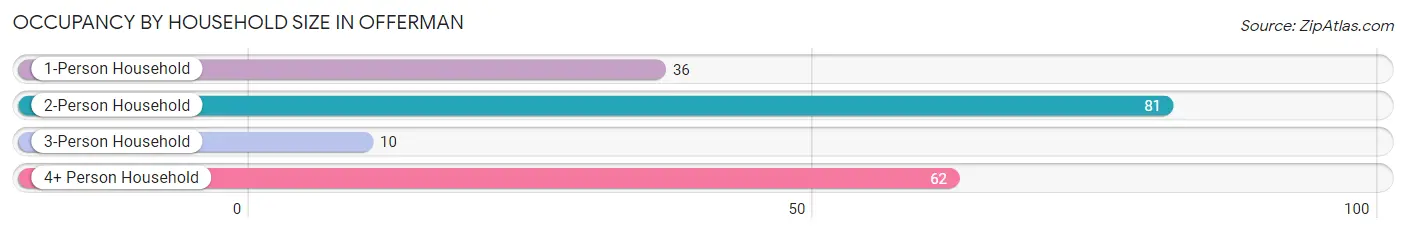
| Household Size | # Housing Units | % Housing Units |
| 1-Person Household | 36 | 19.1% |
| 2-Person Household | 81 | 42.9% |
| 3-Person Household | 10 | 5.3% |
| 4+ Person Household | 62 | 32.8% |
| Total Housing Units | 189 | 100.0% |
Occupancy by Ownership by Household Size in Offerman
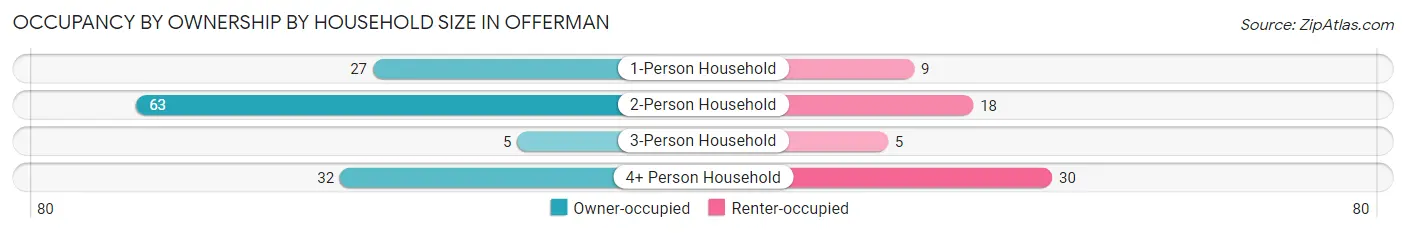
| Household Size | Owner-occupied | Renter-occupied |
| 1-Person Household | 27 (75.0%) | 9 (25.0%) |
| 2-Person Household | 63 (77.8%) | 18 (22.2%) |
| 3-Person Household | 5 (50.0%) | 5 (50.0%) |
| 4+ Person Household | 32 (51.6%) | 30 (48.4%) |
| Total Housing Units | 127 (67.2%) | 62 (32.8%) |
Occupancy by Educational Attainment in Offerman
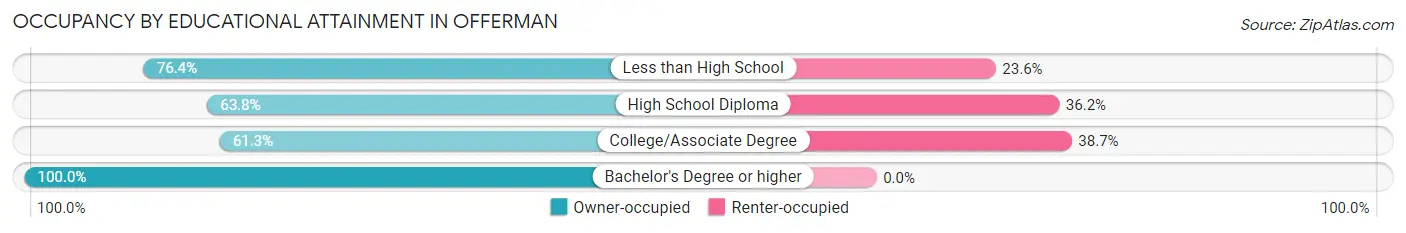
| Household Size | Owner-occupied | Renter-occupied |
| Less than High School | 42 (76.4%) | 13 (23.6%) |
| High School Diploma | 44 (63.8%) | 25 (36.2%) |
| College/Associate Degree | 38 (61.3%) | 24 (38.7%) |
| Bachelor's Degree or higher | 3 (100.0%) | 0 (0.0%) |
Occupancy by Age of Householder in Offerman
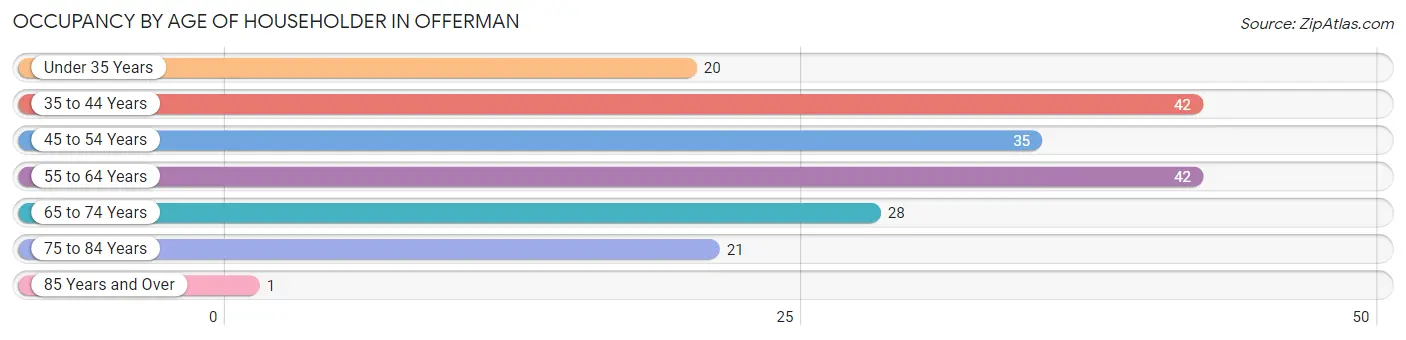
| Age Bracket | # Households | % Households |
| Under 35 Years | 20 | 10.6% |
| 35 to 44 Years | 42 | 22.2% |
| 45 to 54 Years | 35 | 18.5% |
| 55 to 64 Years | 42 | 22.2% |
| 65 to 74 Years | 28 | 14.8% |
| 75 to 84 Years | 21 | 11.1% |
| 85 Years and Over | 1 | 0.5% |
| Total | 189 | 100.0% |
Housing Finances in Offerman
Median Income by Occupancy in Offerman
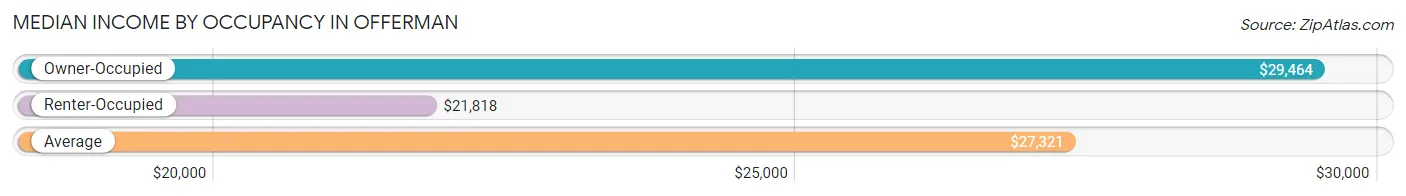
| Occupancy Type | # Households | Median Income |
| Owner-Occupied | 127 (67.2%) | $29,464 |
| Renter-Occupied | 62 (32.8%) | $21,818 |
| Average | 189 (100.0%) | $27,321 |
Occupancy by Householder Income Bracket in Offerman
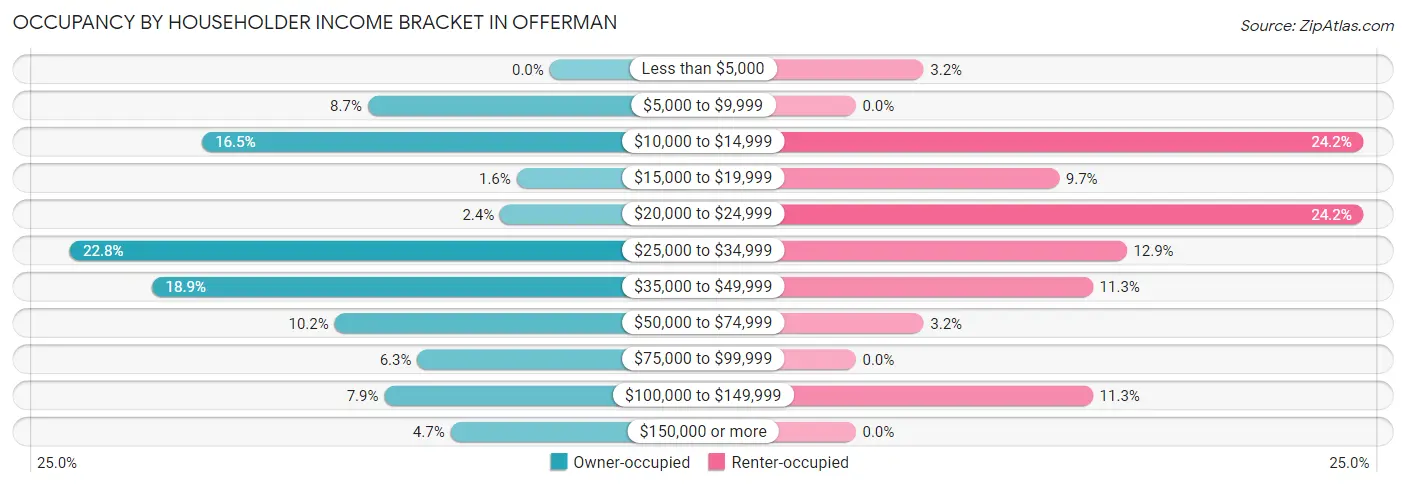
| Income Bracket | Owner-occupied | Renter-occupied |
| Less than $5,000 | 0 (0.0%) | 2 (3.2%) |
| $5,000 to $9,999 | 11 (8.7%) | 0 (0.0%) |
| $10,000 to $14,999 | 21 (16.5%) | 15 (24.2%) |
| $15,000 to $19,999 | 2 (1.6%) | 6 (9.7%) |
| $20,000 to $24,999 | 3 (2.4%) | 15 (24.2%) |
| $25,000 to $34,999 | 29 (22.8%) | 8 (12.9%) |
| $35,000 to $49,999 | 24 (18.9%) | 7 (11.3%) |
| $50,000 to $74,999 | 13 (10.2%) | 2 (3.2%) |
| $75,000 to $99,999 | 8 (6.3%) | 0 (0.0%) |
| $100,000 to $149,999 | 10 (7.9%) | 7 (11.3%) |
| $150,000 or more | 6 (4.7%) | 0 (0.0%) |
| Total | 127 (100.0%) | 62 (100.0%) |
Monthly Housing Cost Tiers in Offerman
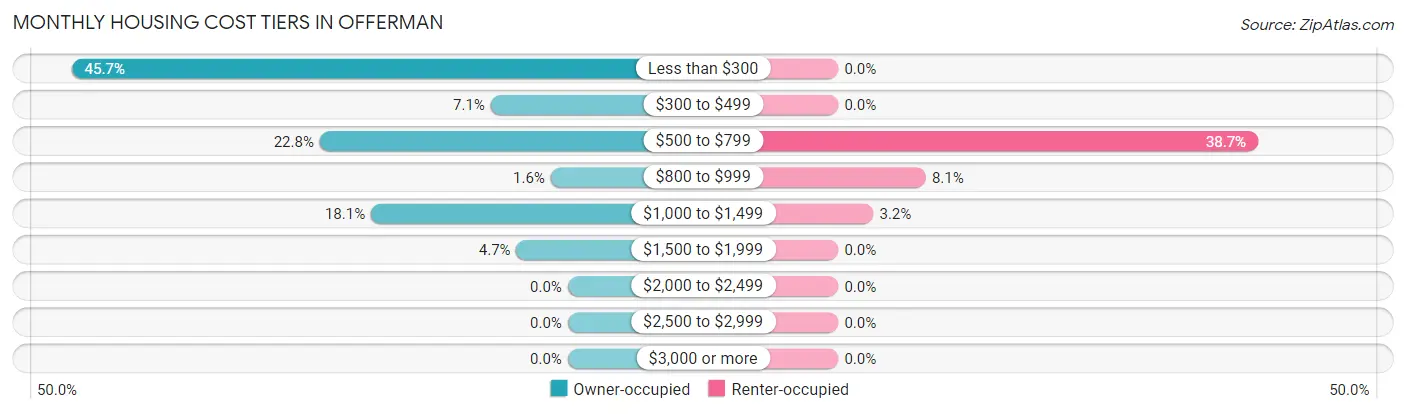
| Monthly Cost | Owner-occupied | Renter-occupied |
| Less than $300 | 58 (45.7%) | 0 (0.0%) |
| $300 to $499 | 9 (7.1%) | 0 (0.0%) |
| $500 to $799 | 29 (22.8%) | 24 (38.7%) |
| $800 to $999 | 2 (1.6%) | 5 (8.1%) |
| $1,000 to $1,499 | 23 (18.1%) | 2 (3.2%) |
| $1,500 to $1,999 | 6 (4.7%) | 0 (0.0%) |
| $2,000 to $2,499 | 0 (0.0%) | 0 (0.0%) |
| $2,500 to $2,999 | 0 (0.0%) | 0 (0.0%) |
| $3,000 or more | 0 (0.0%) | 0 (0.0%) |
| Total | 127 (100.0%) | 62 (100.0%) |
Physical Housing Characteristics in Offerman
Housing Structures in Offerman
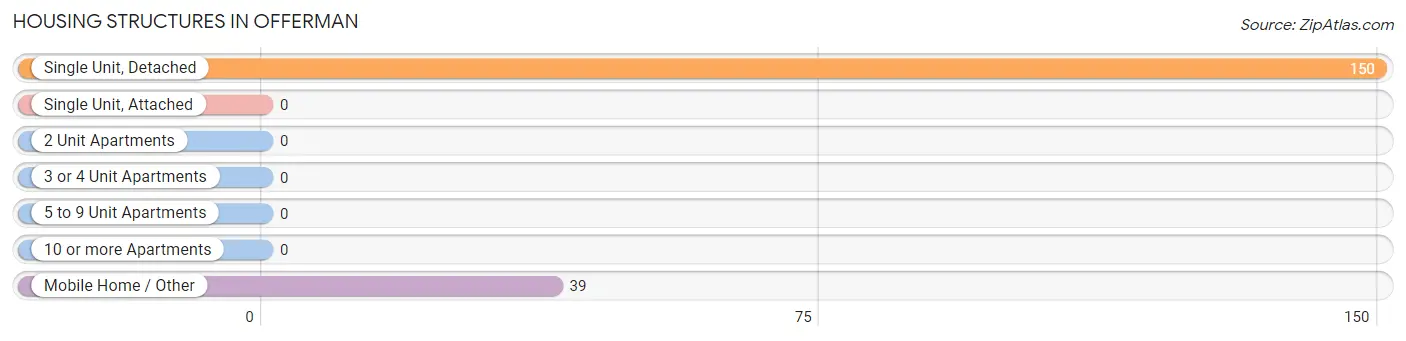
| Structure Type | # Housing Units | % Housing Units |
| Single Unit, Detached | 150 | 79.4% |
| Single Unit, Attached | 0 | 0.0% |
| 2 Unit Apartments | 0 | 0.0% |
| 3 or 4 Unit Apartments | 0 | 0.0% |
| 5 to 9 Unit Apartments | 0 | 0.0% |
| 10 or more Apartments | 0 | 0.0% |
| Mobile Home / Other | 39 | 20.6% |
| Total | 189 | 100.0% |
Housing Structures by Occupancy in Offerman
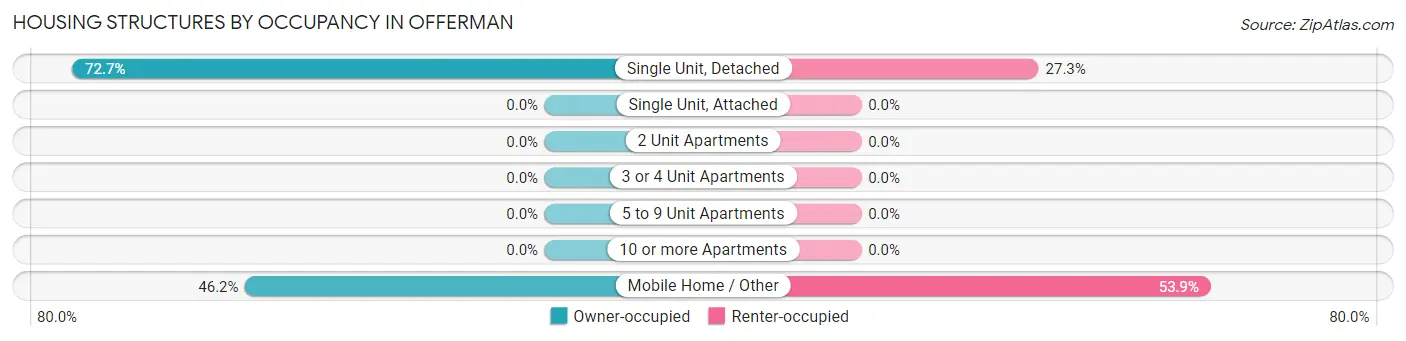
| Structure Type | Owner-occupied | Renter-occupied |
| Single Unit, Detached | 109 (72.7%) | 41 (27.3%) |
| Single Unit, Attached | 0 (0.0%) | 0 (0.0%) |
| 2 Unit Apartments | 0 (0.0%) | 0 (0.0%) |
| 3 or 4 Unit Apartments | 0 (0.0%) | 0 (0.0%) |
| 5 to 9 Unit Apartments | 0 (0.0%) | 0 (0.0%) |
| 10 or more Apartments | 0 (0.0%) | 0 (0.0%) |
| Mobile Home / Other | 18 (46.2%) | 21 (53.8%) |
| Total | 127 (67.2%) | 62 (32.8%) |
Housing Structures by Number of Rooms in Offerman
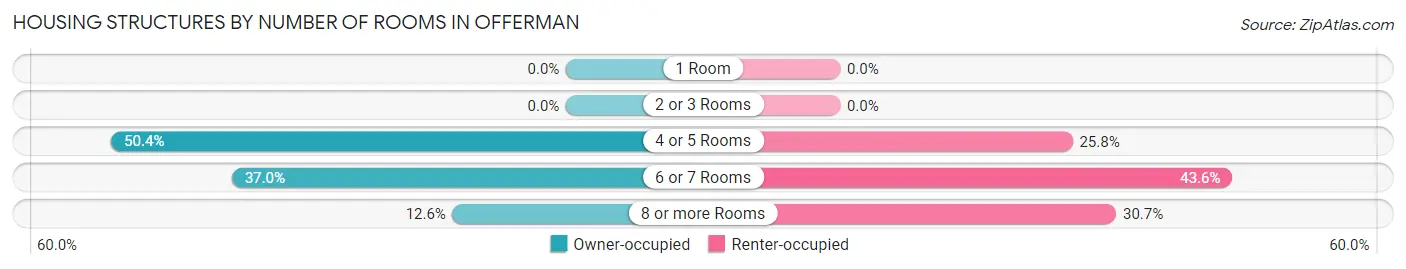
| Number of Rooms | Owner-occupied | Renter-occupied |
| 1 Room | 0 (0.0%) | 0 (0.0%) |
| 2 or 3 Rooms | 0 (0.0%) | 0 (0.0%) |
| 4 or 5 Rooms | 64 (50.4%) | 16 (25.8%) |
| 6 or 7 Rooms | 47 (37.0%) | 27 (43.5%) |
| 8 or more Rooms | 16 (12.6%) | 19 (30.6%) |
| Total | 127 (100.0%) | 62 (100.0%) |
Housing Structure by Heating Type in Offerman
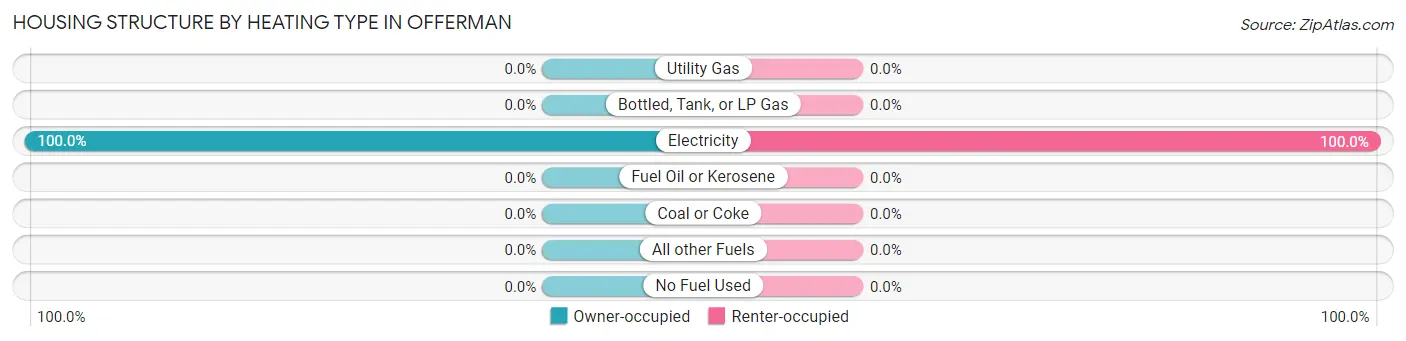
| Heating Type | Owner-occupied | Renter-occupied |
| Utility Gas | 0 (0.0%) | 0 (0.0%) |
| Bottled, Tank, or LP Gas | 0 (0.0%) | 0 (0.0%) |
| Electricity | 127 (100.0%) | 62 (100.0%) |
| Fuel Oil or Kerosene | 0 (0.0%) | 0 (0.0%) |
| Coal or Coke | 0 (0.0%) | 0 (0.0%) |
| All other Fuels | 0 (0.0%) | 0 (0.0%) |
| No Fuel Used | 0 (0.0%) | 0 (0.0%) |
| Total | 127 (100.0%) | 62 (100.0%) |
Household Vehicle Usage in Offerman
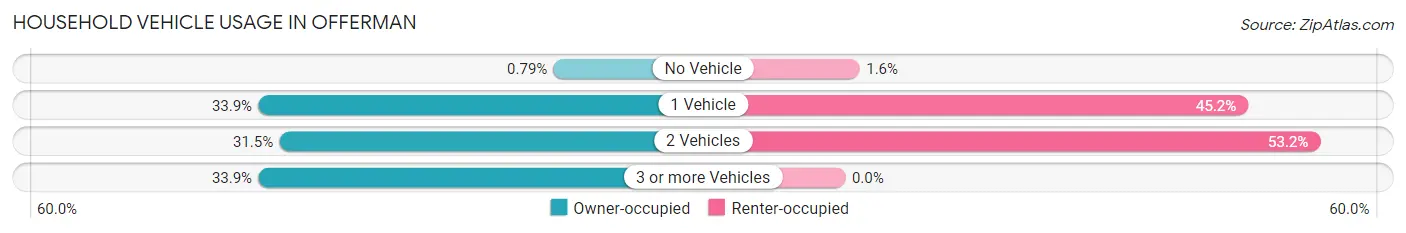
| Vehicles per Household | Owner-occupied | Renter-occupied |
| No Vehicle | 1 (0.8%) | 1 (1.6%) |
| 1 Vehicle | 43 (33.9%) | 28 (45.2%) |
| 2 Vehicles | 40 (31.5%) | 33 (53.2%) |
| 3 or more Vehicles | 43 (33.9%) | 0 (0.0%) |
| Total | 127 (100.0%) | 62 (100.0%) |
Real Estate & Mortgages in Offerman
Real Estate and Mortgage Overview in Offerman
| Characteristic | Without Mortgage | With Mortgage |
| Housing Units | 75 | 52 |
| Median Property Value | $46,900 | $164,500 |
| Median Household Income | $27,679 | $6 |
| Monthly Housing Costs | $216 | $0 |
| Real Estate Taxes | $605 | $0 |
Property Value by Mortgage Status in Offerman
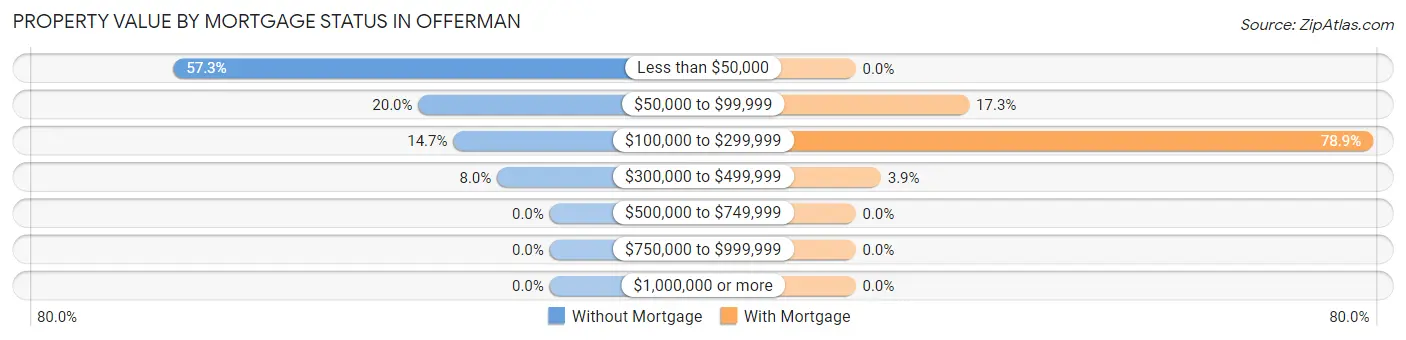
| Property Value | Without Mortgage | With Mortgage |
| Less than $50,000 | 43 (57.3%) | 0 (0.0%) |
| $50,000 to $99,999 | 15 (20.0%) | 9 (17.3%) |
| $100,000 to $299,999 | 11 (14.7%) | 41 (78.8%) |
| $300,000 to $499,999 | 6 (8.0%) | 2 (3.8%) |
| $500,000 to $749,999 | 0 (0.0%) | 0 (0.0%) |
| $750,000 to $999,999 | 0 (0.0%) | 0 (0.0%) |
| $1,000,000 or more | 0 (0.0%) | 0 (0.0%) |
| Total | 75 (100.0%) | 52 (100.0%) |
Household Income by Mortgage Status in Offerman
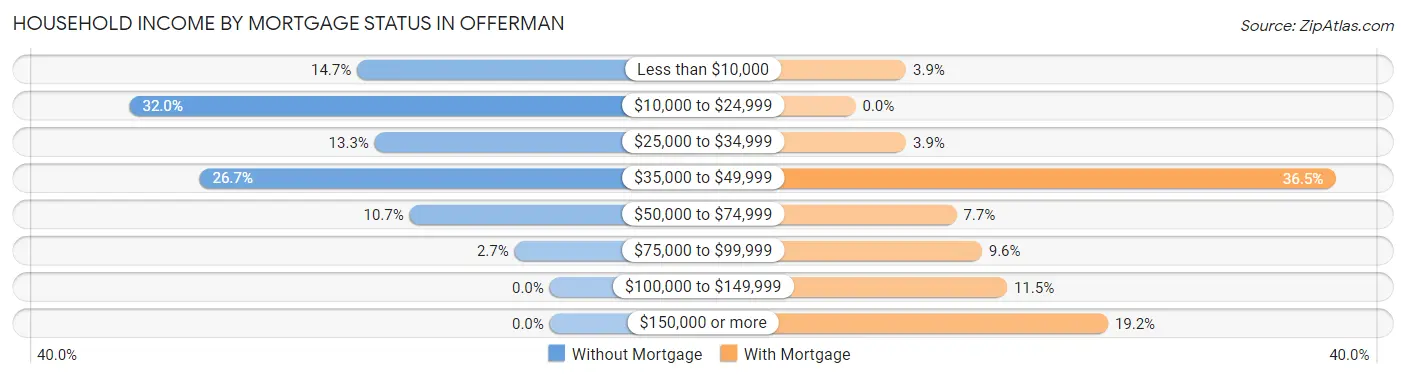
| Household Income | Without Mortgage | With Mortgage |
| Less than $10,000 | 11 (14.7%) | 2 (3.8%) |
| $10,000 to $24,999 | 24 (32.0%) | 0 (0.0%) |
| $25,000 to $34,999 | 10 (13.3%) | 2 (3.8%) |
| $35,000 to $49,999 | 20 (26.7%) | 19 (36.5%) |
| $50,000 to $74,999 | 8 (10.7%) | 4 (7.7%) |
| $75,000 to $99,999 | 2 (2.7%) | 5 (9.6%) |
| $100,000 to $149,999 | 0 (0.0%) | 6 (11.5%) |
| $150,000 or more | 0 (0.0%) | 10 (19.2%) |
| Total | 75 (100.0%) | 52 (100.0%) |
Property Value to Household Income Ratio in Offerman
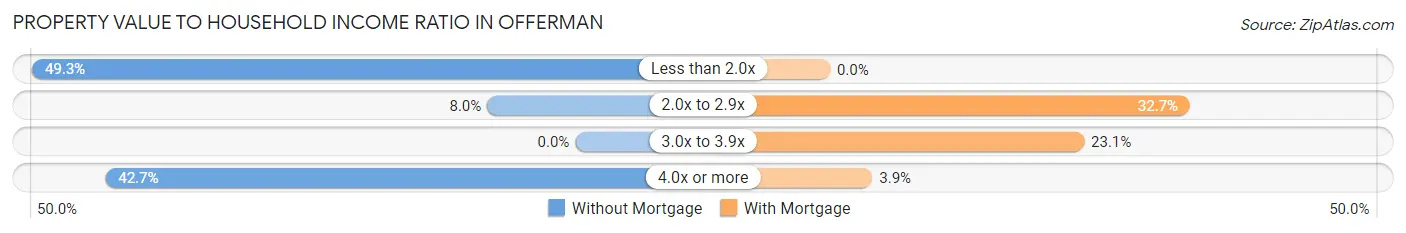
| Value-to-Income Ratio | Without Mortgage | With Mortgage |
| Less than 2.0x | 37 (49.3%) | 0 (0.0%) |
| 2.0x to 2.9x | 6 (8.0%) | 17 (32.7%) |
| 3.0x to 3.9x | 0 (0.0%) | 12 (23.1%) |
| 4.0x or more | 32 (42.7%) | 2 (3.8%) |
| Total | 75 (100.0%) | 52 (100.0%) |
Real Estate Taxes by Mortgage Status in Offerman
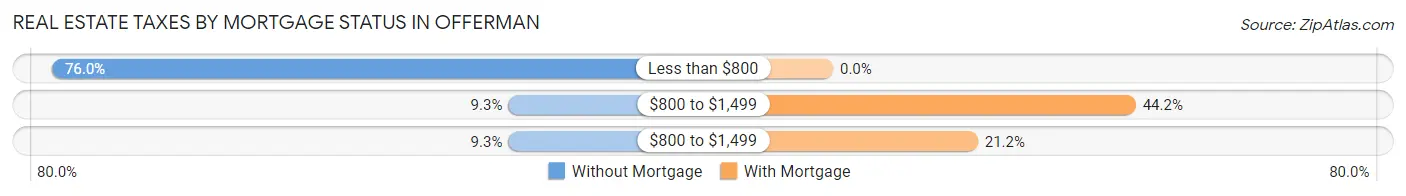
| Property Taxes | Without Mortgage | With Mortgage |
| Less than $800 | 57 (76.0%) | 0 (0.0%) |
| $800 to $1,499 | 7 (9.3%) | 23 (44.2%) |
| $800 to $1,499 | 7 (9.3%) | 11 (21.1%) |
| Total | 75 (100.0%) | 52 (100.0%) |
Health & Disability in Offerman
Health Insurance Coverage by Age in Offerman
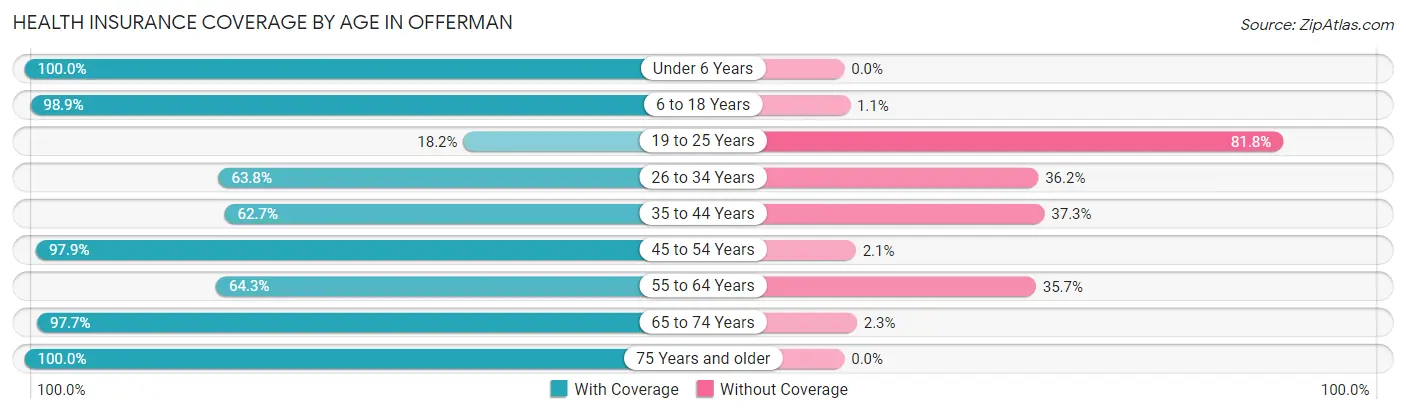
| Age Bracket | With Coverage | Without Coverage |
| Under 6 Years | 161 (100.0%) | 0 (0.0%) |
| 6 to 18 Years | 375 (98.9%) | 4 (1.1%) |
| 19 to 25 Years | 8 (18.2%) | 36 (81.8%) |
| 26 to 34 Years | 30 (63.8%) | 17 (36.2%) |
| 35 to 44 Years | 42 (62.7%) | 25 (37.3%) |
| 45 to 54 Years | 46 (97.9%) | 1 (2.1%) |
| 55 to 64 Years | 36 (64.3%) | 20 (35.7%) |
| 65 to 74 Years | 42 (97.7%) | 1 (2.3%) |
| 75 Years and older | 91 (100.0%) | 0 (0.0%) |
| Total | 831 (88.9%) | 104 (11.1%) |
Health Insurance Coverage by Citizenship Status in Offerman
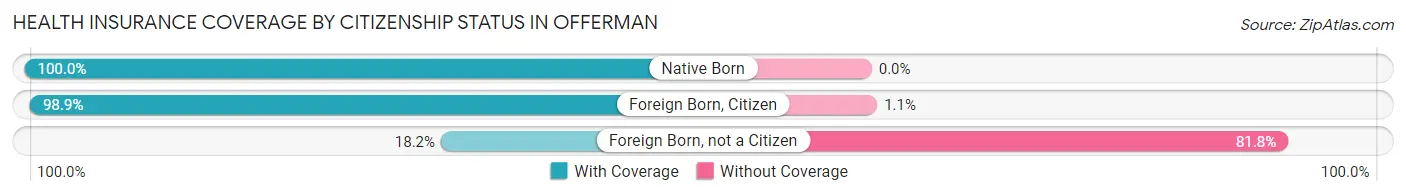
| Citizenship Status | With Coverage | Without Coverage |
| Native Born | 161 (100.0%) | 0 (0.0%) |
| Foreign Born, Citizen | 375 (98.9%) | 4 (1.1%) |
| Foreign Born, not a Citizen | 8 (18.2%) | 36 (81.8%) |
Health Insurance Coverage by Household Income in Offerman
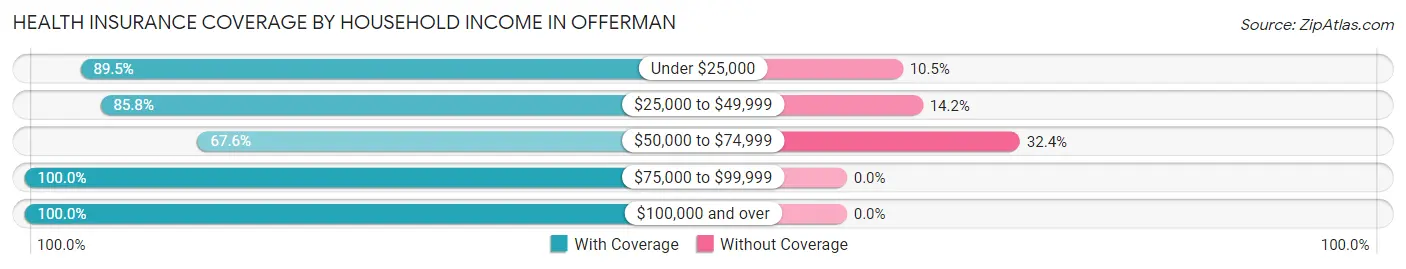
| Household Income | With Coverage | Without Coverage |
| Under $25,000 | 513 (89.5%) | 60 (10.5%) |
| $25,000 to $49,999 | 193 (85.8%) | 32 (14.2%) |
| $50,000 to $74,999 | 25 (67.6%) | 12 (32.4%) |
| $75,000 to $99,999 | 35 (100.0%) | 0 (0.0%) |
| $100,000 and over | 65 (100.0%) | 0 (0.0%) |
Public vs Private Health Insurance Coverage by Age in Offerman
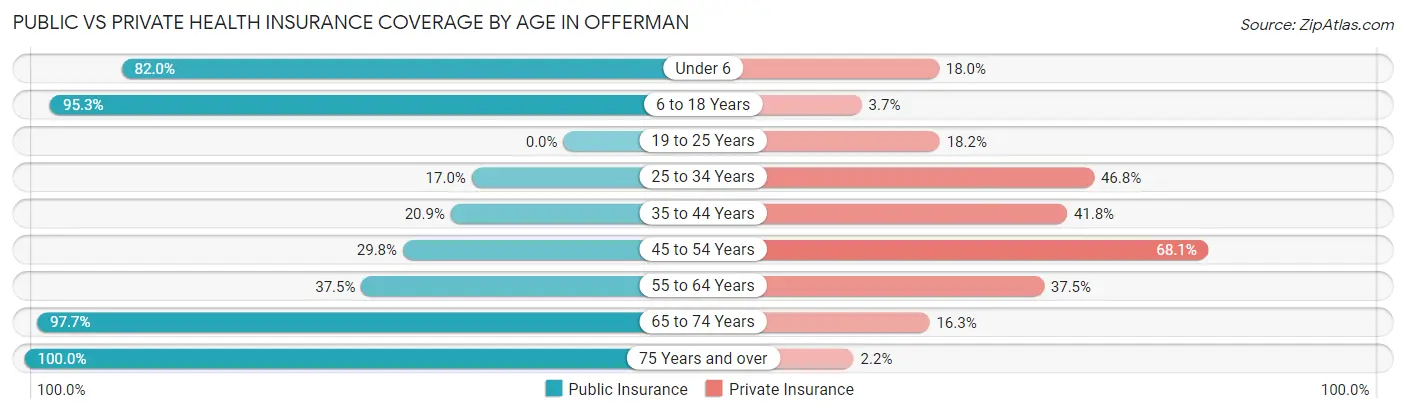
| Age Bracket | Public Insurance | Private Insurance |
| Under 6 | 132 (82.0%) | 29 (18.0%) |
| 6 to 18 Years | 361 (95.3%) | 14 (3.7%) |
| 19 to 25 Years | 0 (0.0%) | 8 (18.2%) |
| 25 to 34 Years | 8 (17.0%) | 22 (46.8%) |
| 35 to 44 Years | 14 (20.9%) | 28 (41.8%) |
| 45 to 54 Years | 14 (29.8%) | 32 (68.1%) |
| 55 to 64 Years | 21 (37.5%) | 21 (37.5%) |
| 65 to 74 Years | 42 (97.7%) | 7 (16.3%) |
| 75 Years and over | 91 (100.0%) | 2 (2.2%) |
| Total | 683 (73.1%) | 163 (17.4%) |
Disability Status by Sex by Age in Offerman
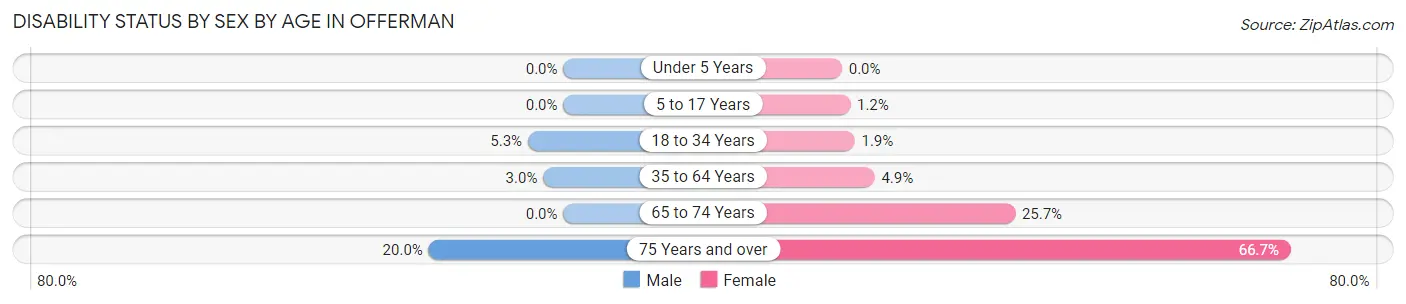
| Age Bracket | Male | Female |
| Under 5 Years | 0 (0.0%) | 0 (0.0%) |
| 5 to 17 Years | 0 (0.0%) | 2 (1.2%) |
| 18 to 34 Years | 2 (5.3%) | 1 (1.9%) |
| 35 to 64 Years | 2 (3.0%) | 5 (4.9%) |
| 65 to 74 Years | 0 (0.0%) | 9 (25.7%) |
| 75 Years and over | 17 (20.0%) | 4 (66.7%) |
Disability Class by Sex by Age in Offerman
Disability Class: Hearing Difficulty
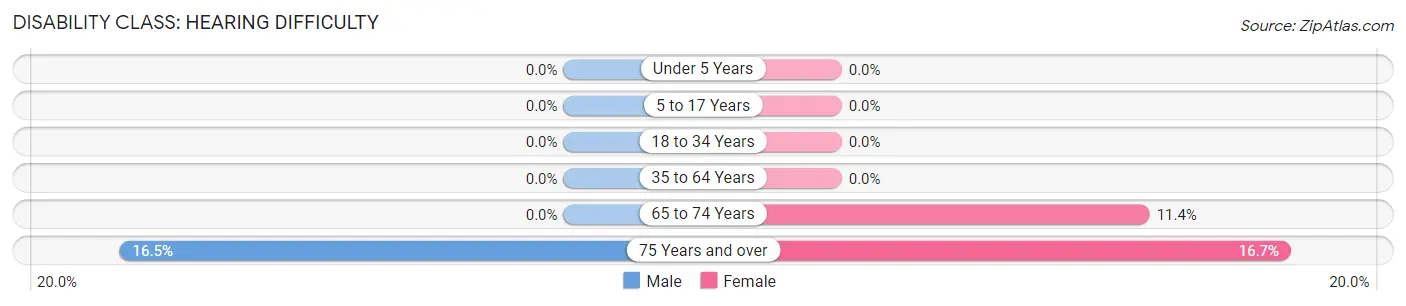
| Age Bracket | Male | Female |
| Under 5 Years | 0 (0.0%) | 0 (0.0%) |
| 5 to 17 Years | 0 (0.0%) | 0 (0.0%) |
| 18 to 34 Years | 0 (0.0%) | 0 (0.0%) |
| 35 to 64 Years | 0 (0.0%) | 0 (0.0%) |
| 65 to 74 Years | 0 (0.0%) | 4 (11.4%) |
| 75 Years and over | 14 (16.5%) | 1 (16.7%) |
Disability Class: Vision Difficulty
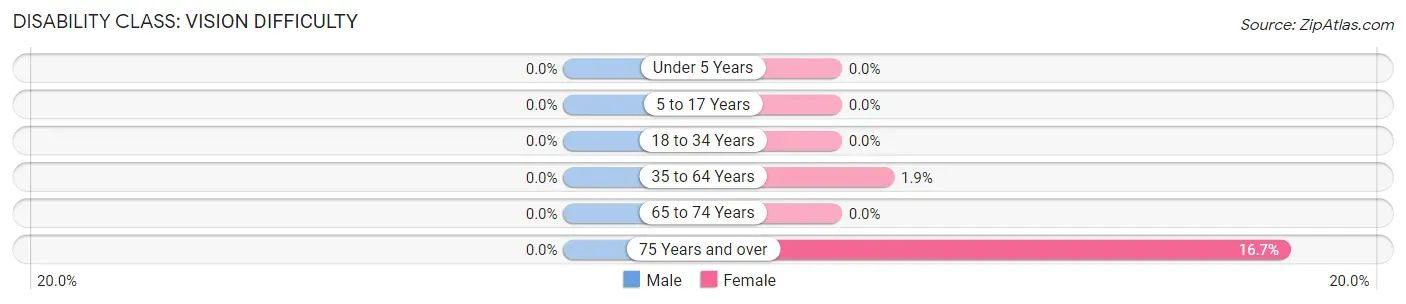
| Age Bracket | Male | Female |
| Under 5 Years | 0 (0.0%) | 0 (0.0%) |
| 5 to 17 Years | 0 (0.0%) | 0 (0.0%) |
| 18 to 34 Years | 0 (0.0%) | 0 (0.0%) |
| 35 to 64 Years | 0 (0.0%) | 2 (1.9%) |
| 65 to 74 Years | 0 (0.0%) | 0 (0.0%) |
| 75 Years and over | 0 (0.0%) | 1 (16.7%) |
Disability Class: Cognitive Difficulty
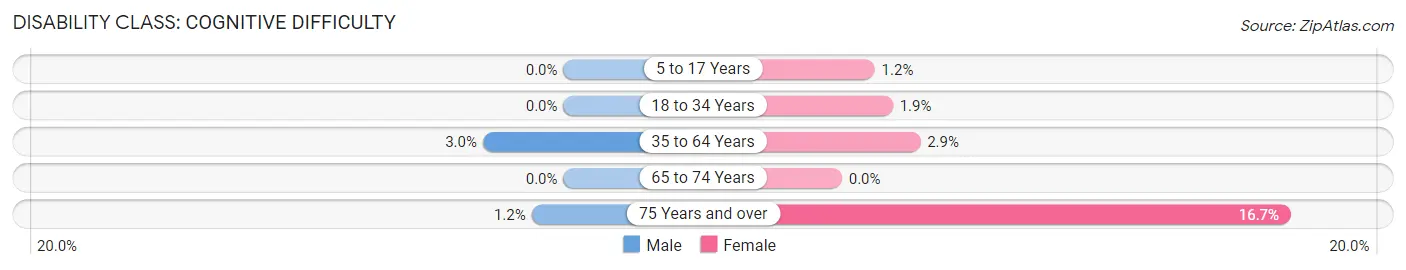
| Age Bracket | Male | Female |
| 5 to 17 Years | 0 (0.0%) | 2 (1.2%) |
| 18 to 34 Years | 0 (0.0%) | 1 (1.9%) |
| 35 to 64 Years | 2 (3.0%) | 3 (2.9%) |
| 65 to 74 Years | 0 (0.0%) | 0 (0.0%) |
| 75 Years and over | 1 (1.2%) | 1 (16.7%) |
Disability Class: Ambulatory Difficulty
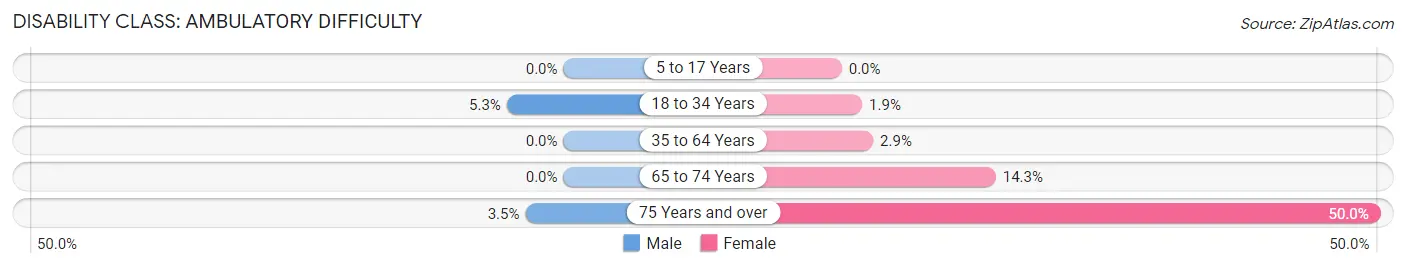
| Age Bracket | Male | Female |
| 5 to 17 Years | 0 (0.0%) | 0 (0.0%) |
| 18 to 34 Years | 2 (5.3%) | 1 (1.9%) |
| 35 to 64 Years | 0 (0.0%) | 3 (2.9%) |
| 65 to 74 Years | 0 (0.0%) | 5 (14.3%) |
| 75 Years and over | 3 (3.5%) | 3 (50.0%) |
Disability Class: Self-Care Difficulty
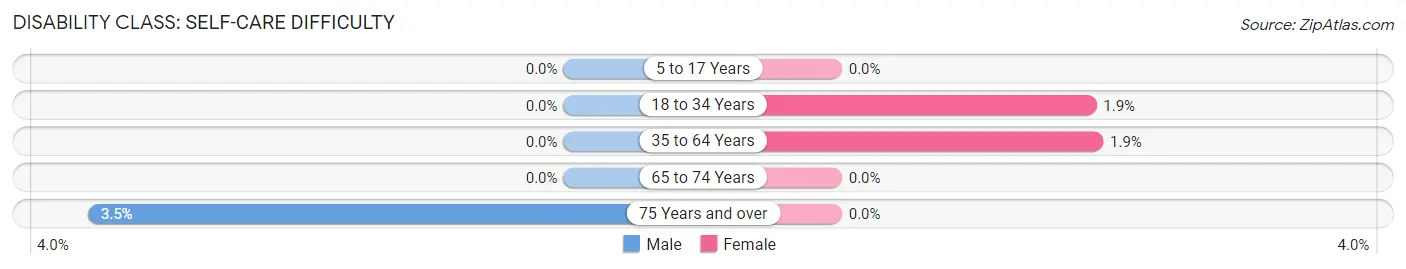
| Age Bracket | Male | Female |
| 5 to 17 Years | 0 (0.0%) | 0 (0.0%) |
| 18 to 34 Years | 0 (0.0%) | 1 (1.9%) |
| 35 to 64 Years | 0 (0.0%) | 2 (1.9%) |
| 65 to 74 Years | 0 (0.0%) | 0 (0.0%) |
| 75 Years and over | 3 (3.5%) | 0 (0.0%) |
Technology Access in Offerman
Computing Device Access in Offerman
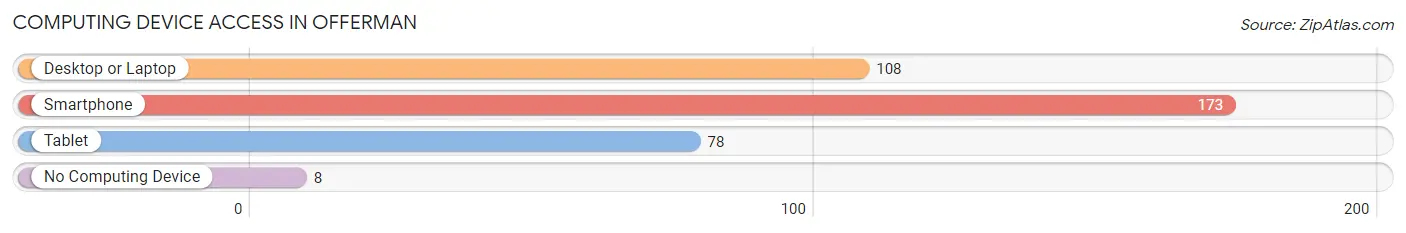
| Device Type | # Households | % Households |
| Desktop or Laptop | 108 | 57.1% |
| Smartphone | 173 | 91.5% |
| Tablet | 78 | 41.3% |
| No Computing Device | 8 | 4.2% |
| Total | 189 | 100.0% |
Internet Access in Offerman
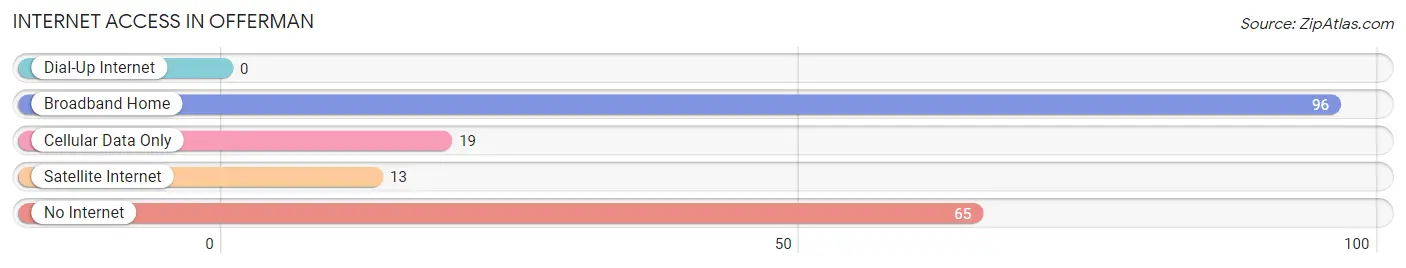
| Internet Type | # Households | % Households |
| Dial-Up Internet | 0 | 0.0% |
| Broadband Home | 96 | 50.8% |
| Cellular Data Only | 19 | 10.1% |
| Satellite Internet | 13 | 6.9% |
| No Internet | 65 | 34.4% |
| Total | 189 | 100.0% |
Offerman Summary
Geography
Offerman is a small town located in Pierce County, Georgia, United States. It is situated on the banks of the Satilla River, approximately 20 miles south of Waycross and 30 miles north of Brunswick. The town is surrounded by a mix of rural farmland and wooded areas, with the Satilla River providing a scenic backdrop. The town is located at an elevation of approximately 30 feet above sea level.
History
Offerman was founded in 1891 by a group of settlers from nearby Waycross. The town was named after a local landowner, John Offerman, who donated the land for the town. The town quickly grew, and by the early 1900s, it had become a thriving community with a population of over 500.
The town was home to a variety of businesses, including a sawmill, a gristmill, a cotton gin, and a general store. The town also had a post office, a bank, and a hotel. In the early 1900s, the town was connected to the rest of the state by a railroad line, which allowed for the transport of goods and people.
In the mid-1900s, the town began to decline as the railroad line was abandoned and the local businesses closed. By the late 1970s, the population had dropped to just over 200. In recent years, the town has seen a resurgence in population, with the population now estimated to be around 500.
Economy
Offerman’s economy is largely based on agriculture and forestry. The town is home to several farms, which produce a variety of crops, including corn, soybeans, and cotton. The town is also home to several timber companies, which harvest timber from the surrounding forests.
In addition to agriculture and forestry, Offerman is home to several small businesses, including a grocery store, a hardware store, and a restaurant. The town also has a post office and a bank.
Demographics
As of the 2010 census, the population of Offerman was 517. The racial makeup of the town was 94.2% White, 3.3% African American, 0.4% Native American, 0.2% Asian, and 1.9% from other races. The median household income was $30,000, and the median age was 39.
Conclusion
Offerman is a small town located in Pierce County, Georgia, United States. It was founded in 1891 and has a population of around 500. The town’s economy is largely based on agriculture and forestry, and it is home to several small businesses. The town has a diverse population, with the majority of residents being White. Offerman is a quiet, rural town with a rich history and a bright future.
Common Questions
What is the Total Population of Offerman?
Total Population of Offerman is 935.
What is the Total Male Population of Offerman?
Total Male Population of Offerman is 554.
What is the Total Female Population of Offerman?
Total Female Population of Offerman is 381.
What is the Ratio of Males per 100 Females in Offerman?
There are 145.41 Males per 100 Females in Offerman.
What is the Ratio of Females per 100 Males in Offerman?
There are 68.77 Females per 100 Males in Offerman.
What is the Median Population Age in Offerman?
Median Population Age in Offerman is 13.6 Years.
What is the Average Family Size in Offerman
Average Family Size in Offerman is 5.9 People.
What is the Average Household Size in Offerman
Average Household Size in Offerman is 5.0 People.
What is Per Capita Income in Offerman?
Per Capita income in Offerman is $9,306.
What is the Median Family Income in Offerman?
Median Family Income in Offerman is $31,042.
What is the Median Household income in Offerman?
Median Household Income in Offerman is $27,321.
What is Inequality or Gini Index in Offerman?
Inequality or Gini Index in Offerman is 0.45.
How Large is the Labor Force in Offerman?
There are 148 People in the Labor Forcein in Offerman.
What is the Percentage of People in the Labor Force in Offerman?
35.7% of People are in the Labor Force in Offerman.
What is the Unemployment Rate in Offerman?
Unemployment Rate in Offerman is 5.4%.