McIntyre, GA
McIntyre Map
McIntyre Overview
718
TOTAL POPULATION
264
MALE POPULATION
454
FEMALE POPULATION
58.15
MALES / 100 FEMALES
171.97
FEMALES / 100 MALES
39.1
MEDIAN AGE
4.2
AVG FAMILY SIZE
2.9
AVG HOUSEHOLD SIZE
$23,647
PER CAPITA INCOME
$72,852
AVG FAMILY INCOME
$49,773
AVG HOUSEHOLD INCOME
20.8%
WAGE / INCOME GAP [ % ]
79.2¢/ $1
WAGE / INCOME GAP [ $ ]
0.47
INEQUALITY / GINI INDEX
313
LABOR FORCE [ PEOPLE ]
51.9%
PERCENT IN LABOR FORCE
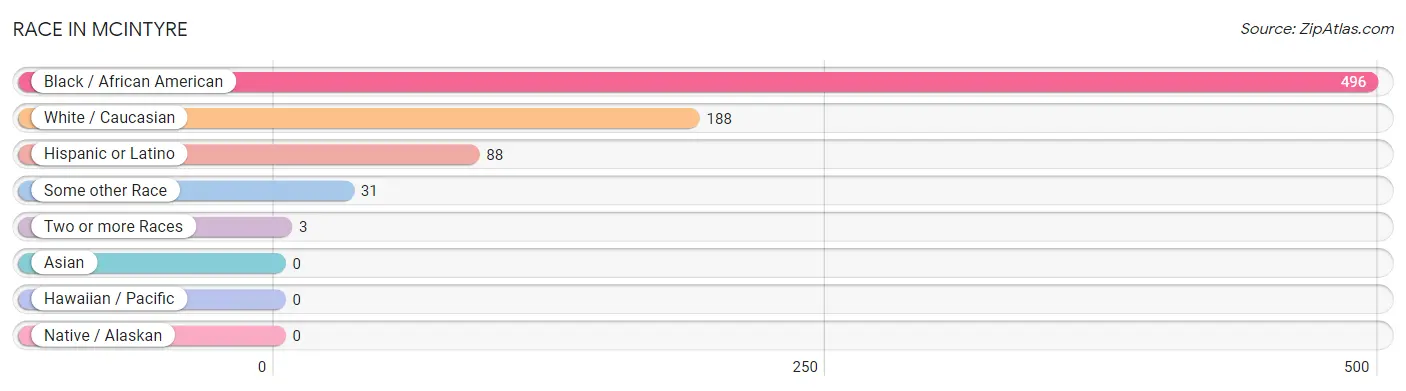
Race in McIntyre
The most populous races in McIntyre are Black / African American (496 | 69.1%), White / Caucasian (188 | 26.2%), and Hispanic or Latino (88 | 12.3%).
| Race | # Population | % Population |
| Asian | 0 | 0.0% |
| Black / African American | 496 | 69.1% |
| Hawaiian / Pacific | 0 | 0.0% |
| Hispanic or Latino | 88 | 12.3% |
| Native / Alaskan | 0 | 0.0% |
| White / Caucasian | 188 | 26.2% |
| Two or more Races | 3 | 0.4% |
| Some other Race | 31 | 4.3% |
| Total | 718 | 100.0% |
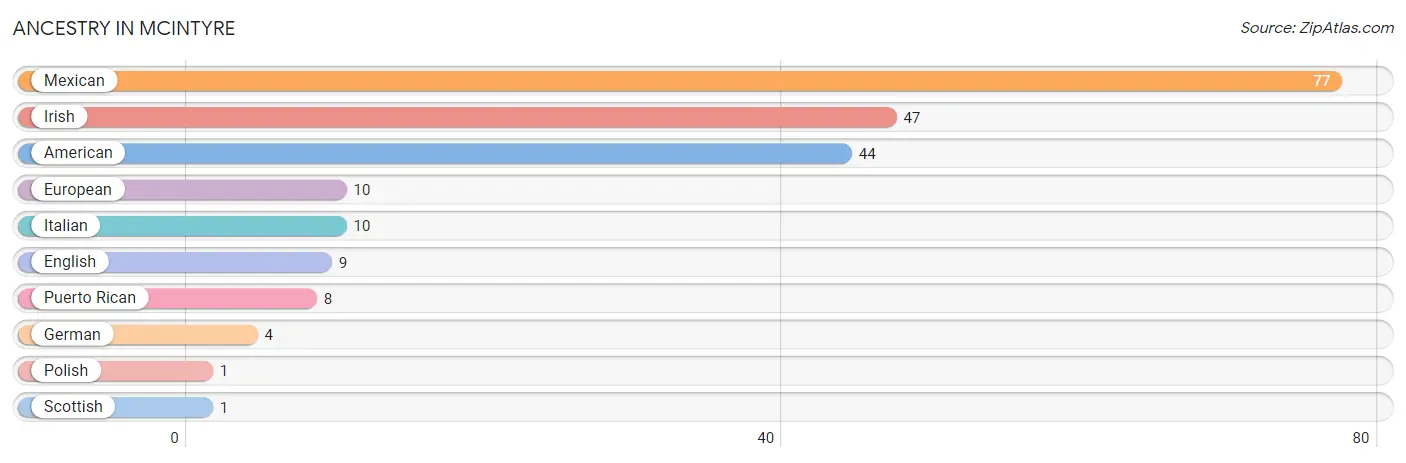
Ancestry in McIntyre
The most populous ancestries reported in McIntyre are Mexican (77 | 10.7%), Irish (47 | 6.6%), American (44 | 6.1%), European (10 | 1.4%), and Italian (10 | 1.4%), together accounting for 26.2% of all McIntyre residents.
| Ancestry | # Population | % Population |
| American | 44 | 6.1% |
| English | 9 | 1.3% |
| European | 10 | 1.4% |
| German | 4 | 0.6% |
| Irish | 47 | 6.6% |
| Italian | 10 | 1.4% |
| Mexican | 77 | 10.7% |
| Polish | 1 | 0.1% |
| Puerto Rican | 8 | 1.1% |
| Scottish | 1 | 0.1% | View All 10 Rows |
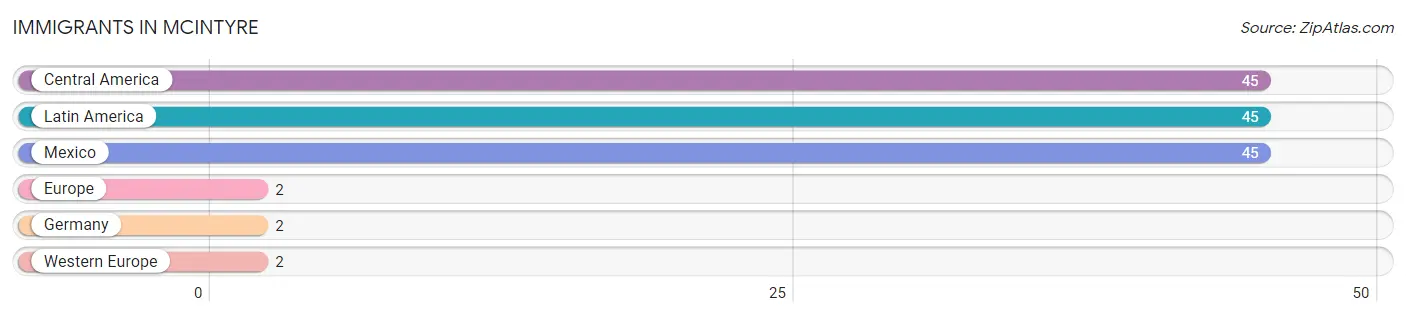
Immigrants in McIntyre
The most numerous immigrant groups reported in McIntyre came from Central America (45 | 6.3%), Latin America (45 | 6.3%), Mexico (45 | 6.3%), Europe (2 | 0.3%), and Germany (2 | 0.3%), together accounting for 19.4% of all McIntyre residents.
| Immigration Origin | # Population | % Population |
| Central America | 45 | 6.3% |
| Europe | 2 | 0.3% |
| Germany | 2 | 0.3% |
| Latin America | 45 | 6.3% |
| Mexico | 45 | 6.3% |
| Western Europe | 2 | 0.3% | View All 6 Rows |
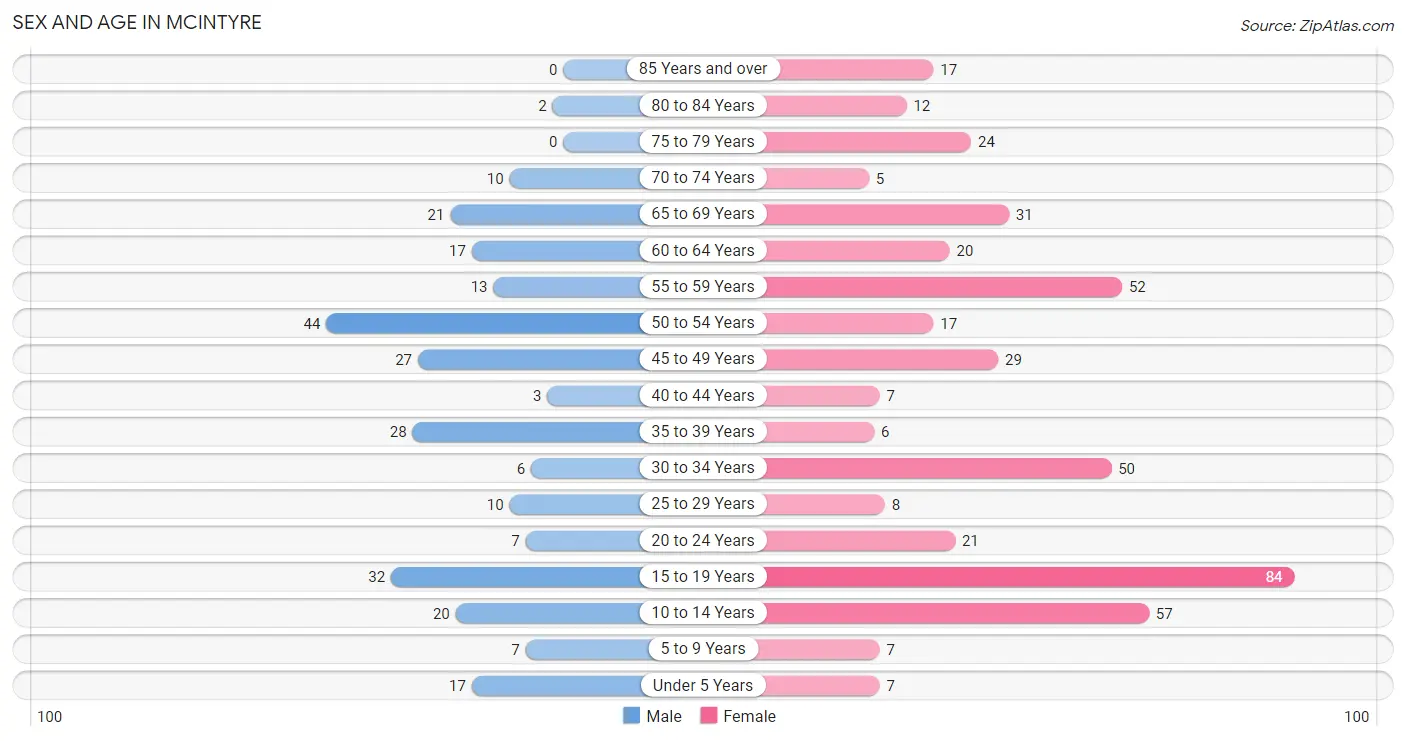
Sex and Age in McIntyre
Sex and Age in McIntyre
The most populous age groups in McIntyre are 50 to 54 Years (44 | 16.7%) for men and 15 to 19 Years (84 | 18.5%) for women.
| Age Bracket | Male | Female |
| Under 5 Years | 17 (6.4%) | 7 (1.5%) |
| 5 to 9 Years | 7 (2.6%) | 7 (1.5%) |
| 10 to 14 Years | 20 (7.6%) | 57 (12.6%) |
| 15 to 19 Years | 32 (12.1%) | 84 (18.5%) |
| 20 to 24 Years | 7 (2.6%) | 21 (4.6%) |
| 25 to 29 Years | 10 (3.8%) | 8 (1.8%) |
| 30 to 34 Years | 6 (2.3%) | 50 (11.0%) |
| 35 to 39 Years | 28 (10.6%) | 6 (1.3%) |
| 40 to 44 Years | 3 (1.1%) | 7 (1.5%) |
| 45 to 49 Years | 27 (10.2%) | 29 (6.4%) |
| 50 to 54 Years | 44 (16.7%) | 17 (3.7%) |
| 55 to 59 Years | 13 (4.9%) | 52 (11.5%) |
| 60 to 64 Years | 17 (6.4%) | 20 (4.4%) |
| 65 to 69 Years | 21 (8.0%) | 31 (6.8%) |
| 70 to 74 Years | 10 (3.8%) | 5 (1.1%) |
| 75 to 79 Years | 0 (0.0%) | 24 (5.3%) |
| 80 to 84 Years | 2 (0.8%) | 12 (2.6%) |
| 85 Years and over | 0 (0.0%) | 17 (3.7%) |
| Total | 264 (100.0%) | 454 (100.0%) |
Families and Households in McIntyre
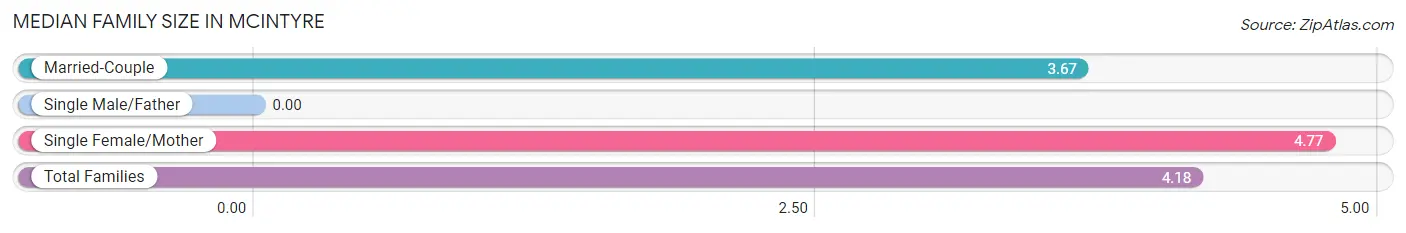
Median Family Size in McIntyre
| Family Type | # Families | Family Size |
| Married-Couple | 73 (54.1%) | 3.67 |
| Single Male/Father | 0 (0.0%) | - |
| Single Female/Mother | 62 (45.9%) | 4.77 |
| Total Families | 135 (100.0%) | 4.18 |
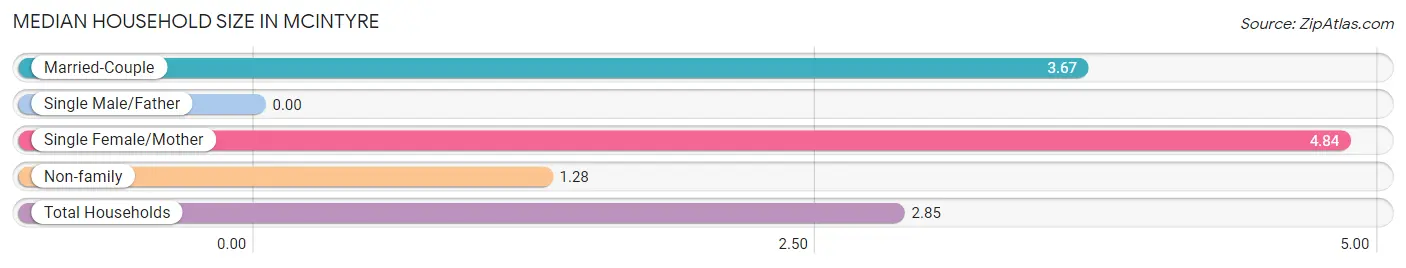
Median Household Size in McIntyre
| Household Type | # Households | Household Size |
| Married-Couple | 73 (29.0%) | 3.67 |
| Single Male/Father | 0 (0.0%) | - |
| Single Female/Mother | 62 (24.6%) | 4.84 |
| Non-family | 117 (46.4%) | 1.28 |
| Total Households | 252 (100.0%) | 2.85 |
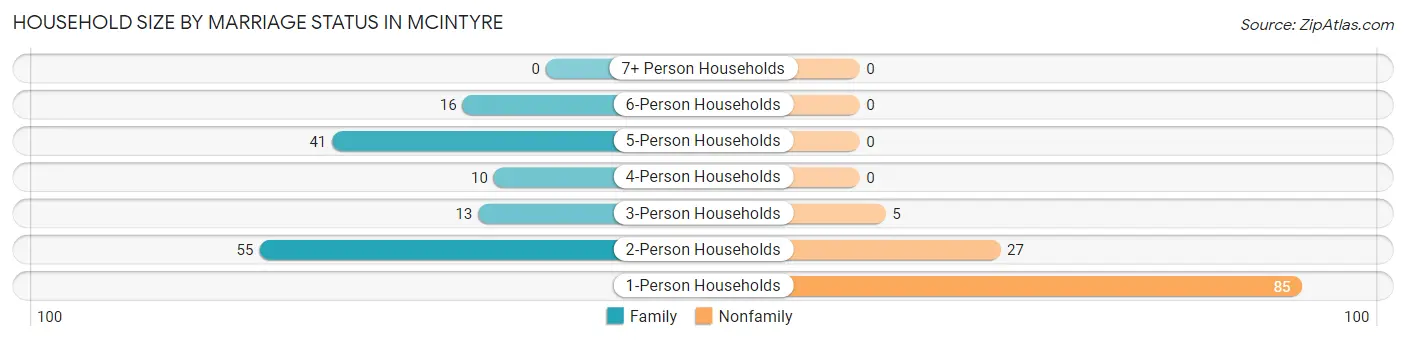
Household Size by Marriage Status in McIntyre
Out of a total of 252 households in McIntyre, 135 (53.6%) are family households, while 117 (46.4%) are nonfamily households. The most numerous type of family households are 2-person households, comprising 55, and the most common type of nonfamily households are 1-person households, comprising 85.
| Household Size | Family Households | Nonfamily Households |
| 1-Person Households | - | 85 (33.7%) |
| 2-Person Households | 55 (21.8%) | 27 (10.7%) |
| 3-Person Households | 13 (5.2%) | 5 (2.0%) |
| 4-Person Households | 10 (4.0%) | 0 (0.0%) |
| 5-Person Households | 41 (16.3%) | 0 (0.0%) |
| 6-Person Households | 16 (6.4%) | 0 (0.0%) |
| 7+ Person Households | 0 (0.0%) | 0 (0.0%) |
| Total | 135 (53.6%) | 117 (46.4%) |
Female Fertility in McIntyre
Fertility by Age in McIntyre
Average fertility rate in McIntyre is 230.0 births per 1,000 women. Women in the age bracket of 15 to 19 years have the highest fertility rate with 595.0 births per 1,000 women. Women in the age bracket of 15 to 19 years acount for 100.0% of all women with births.
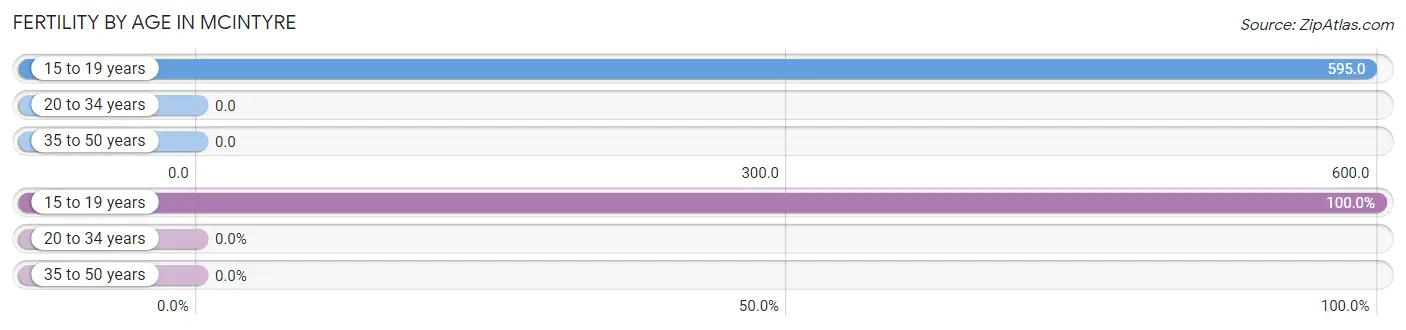
| Age Bracket | Women with Births | Births / 1,000 Women |
| 15 to 19 years | 50 (100.0%) | 595.0 |
| 20 to 34 years | 0 (0.0%) | 0.0 |
| 35 to 50 years | 0 (0.0%) | 0.0 |
| Total | 50 (100.0%) | 230.0 |
Fertility by Age by Marriage Status in McIntyre
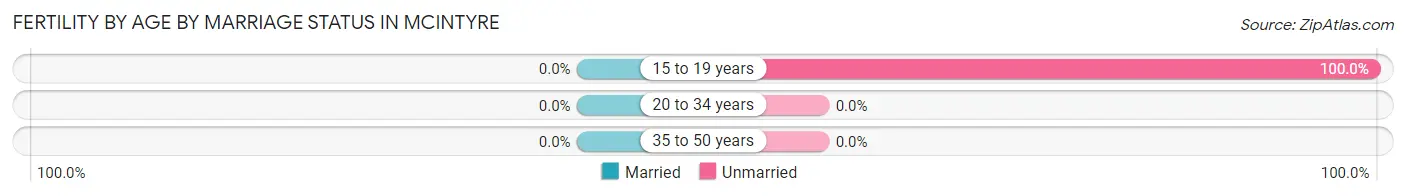
| Age Bracket | Married | Unmarried |
| 15 to 19 years | 0 (0.0%) | 50 (100.0%) |
| 20 to 34 years | 0 (0.0%) | 0 (0.0%) |
| 35 to 50 years | 0 (0.0%) | 0 (0.0%) |
| Total | 0 (0.0%) | 50 (100.0%) |
Fertility by Education in McIntyre
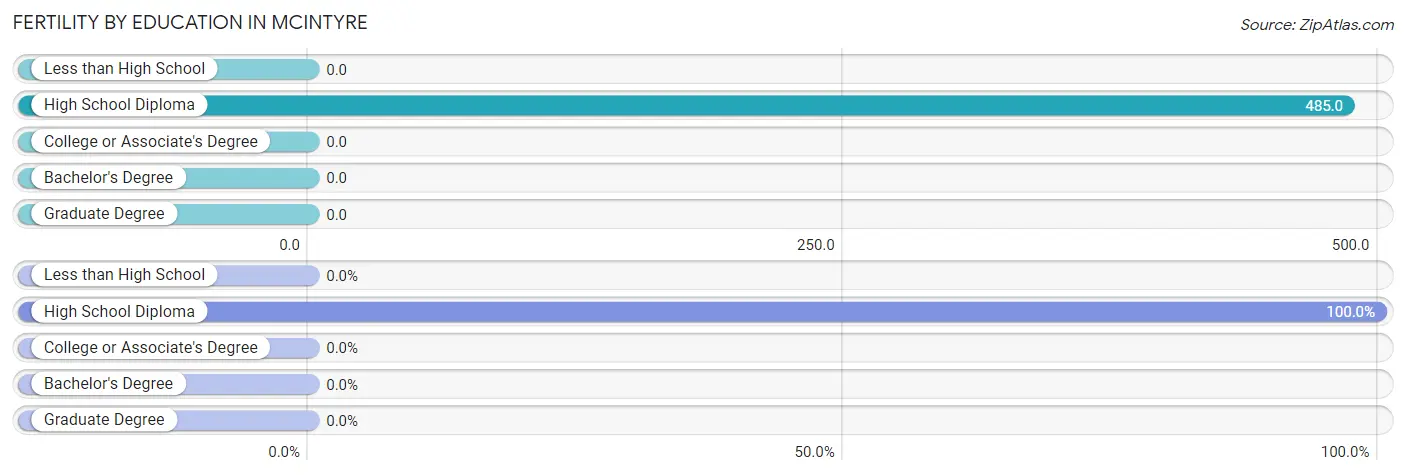
| Educational Attainment | Women with Births | Births / 1,000 Women |
| Less than High School | 0 (0.0%) | 0.0 |
| High School Diploma | 50 (100.0%) | 485.0 |
| College or Associate's Degree | 0 (0.0%) | 0.0 |
| Bachelor's Degree | 0 (0.0%) | 0.0 |
| Graduate Degree | 0 (0.0%) | 0.0 |
| Total | 50 (100.0%) | 230.0 |
Fertility by Education by Marriage Status in McIntyre
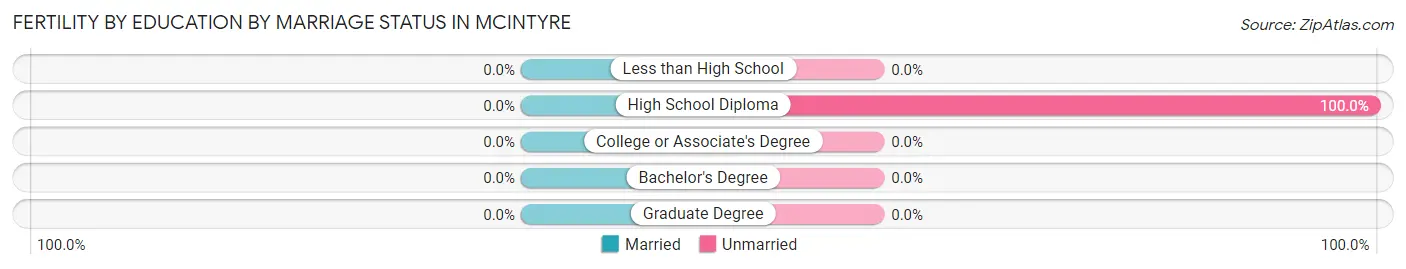
| Educational Attainment | Married | Unmarried |
| Less than High School | 0 (0.0%) | 0 (0.0%) |
| High School Diploma | 0 (0.0%) | 50 (100.0%) |
| College or Associate's Degree | 0 (0.0%) | 0 (0.0%) |
| Bachelor's Degree | 0 (0.0%) | 0 (0.0%) |
| Graduate Degree | 0 (0.0%) | 0 (0.0%) |
| Total | 0 (0.0%) | 50 (100.0%) |
Income in McIntyre
Income Overview in McIntyre
Per Capita Income in McIntyre is $23,647, while median incomes of families and households are $72,852 and $49,773 respectively.
| Characteristic | Number | Measure |
| Per Capita Income | 718 | $23,647 |
| Median Family Income | 135 | $72,852 |
| Mean Family Income | 135 | $87,734 |
| Median Household Income | 252 | $49,773 |
| Mean Household Income | 252 | $66,567 |
| Income Deficit | 135 | $0 |
| Wage / Income Gap (%) | 718 | 20.81% |
| Wage / Income Gap ($) | 718 | 79.19¢ per $1 |
| Gini / Inequality Index | 718 | 0.47 |
Earnings by Sex in McIntyre
Average Earnings in McIntyre are $30,104, $34,375 for men and $27,222 for women, a difference of 20.8%.
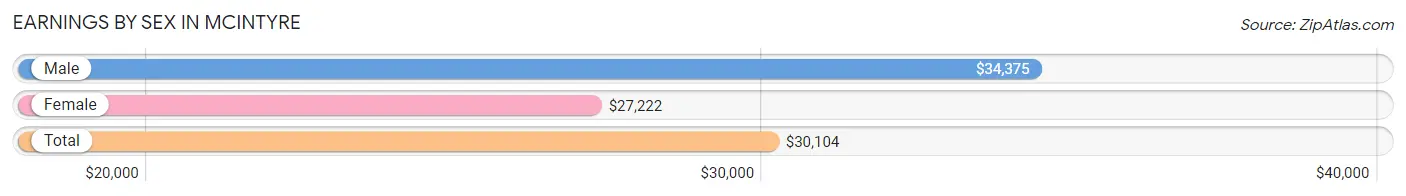
| Sex | Number | Average Earnings |
| Male | 128 (39.0%) | $34,375 |
| Female | 200 (61.0%) | $27,222 |
| Total | 328 (100.0%) | $30,104 |
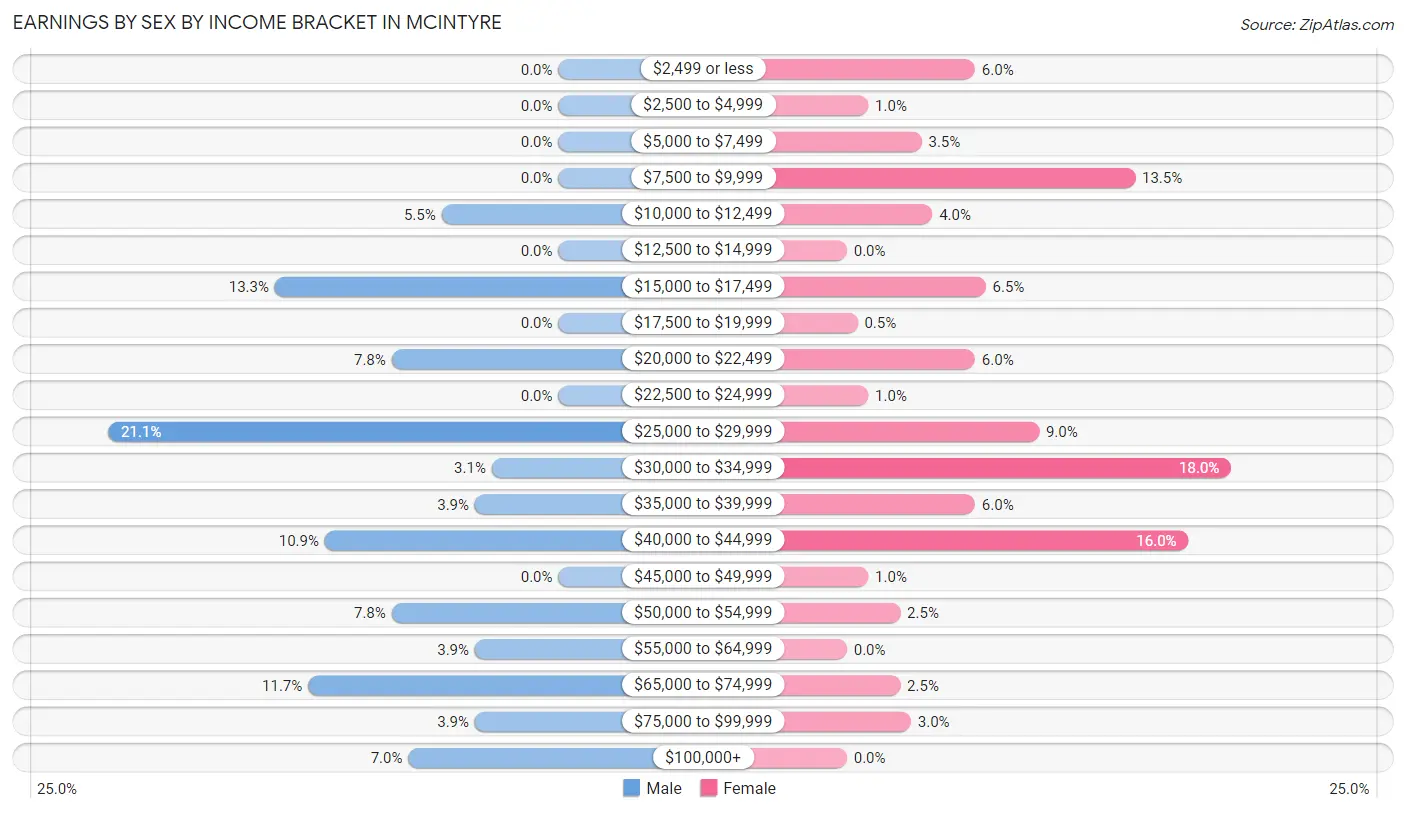
Earnings by Sex by Income Bracket in McIntyre
The most common earnings brackets in McIntyre are $25,000 to $29,999 for men (27 | 21.1%) and $30,000 to $34,999 for women (36 | 18.0%).
| Income | Male | Female |
| $2,499 or less | 0 (0.0%) | 12 (6.0%) |
| $2,500 to $4,999 | 0 (0.0%) | 2 (1.0%) |
| $5,000 to $7,499 | 0 (0.0%) | 7 (3.5%) |
| $7,500 to $9,999 | 0 (0.0%) | 27 (13.5%) |
| $10,000 to $12,499 | 7 (5.5%) | 8 (4.0%) |
| $12,500 to $14,999 | 0 (0.0%) | 0 (0.0%) |
| $15,000 to $17,499 | 17 (13.3%) | 13 (6.5%) |
| $17,500 to $19,999 | 0 (0.0%) | 1 (0.5%) |
| $20,000 to $22,499 | 10 (7.8%) | 12 (6.0%) |
| $22,500 to $24,999 | 0 (0.0%) | 2 (1.0%) |
| $25,000 to $29,999 | 27 (21.1%) | 18 (9.0%) |
| $30,000 to $34,999 | 4 (3.1%) | 36 (18.0%) |
| $35,000 to $39,999 | 5 (3.9%) | 12 (6.0%) |
| $40,000 to $44,999 | 14 (10.9%) | 32 (16.0%) |
| $45,000 to $49,999 | 0 (0.0%) | 2 (1.0%) |
| $50,000 to $54,999 | 10 (7.8%) | 5 (2.5%) |
| $55,000 to $64,999 | 5 (3.9%) | 0 (0.0%) |
| $65,000 to $74,999 | 15 (11.7%) | 5 (2.5%) |
| $75,000 to $99,999 | 5 (3.9%) | 6 (3.0%) |
| $100,000+ | 9 (7.0%) | 0 (0.0%) |
| Total | 128 (100.0%) | 200 (100.0%) |
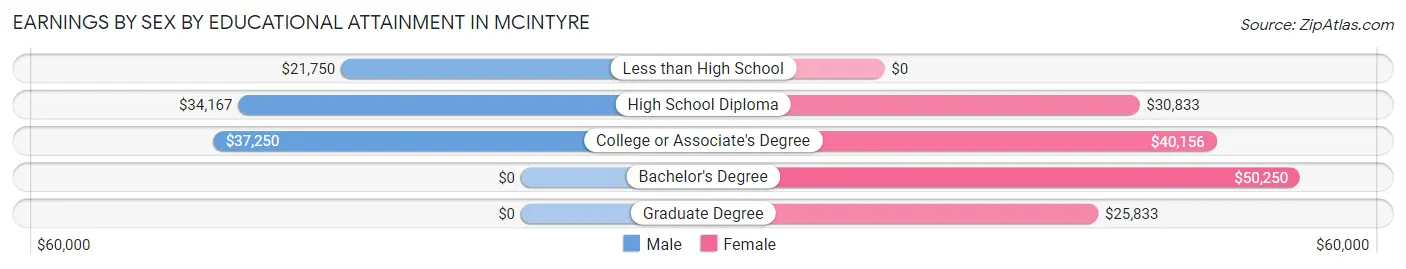
Earnings by Sex by Educational Attainment in McIntyre
Average earnings in McIntyre are $34,375 for men and $30,885 for women, a difference of 10.2%. Men with an educational attainment of college or associate's degree enjoy the highest average annual earnings of $37,250, while those with less than high school education earn the least with $21,750. Women with an educational attainment of bachelor's degree earn the most with the average annual earnings of $50,250, while those with graduate degree education have the smallest earnings of $25,833.
| Educational Attainment | Male Income | Female Income |
| Less than High School | $21,750 | $0 |
| High School Diploma | $34,167 | $30,833 |
| College or Associate's Degree | $37,250 | $40,156 |
| Bachelor's Degree | - | - |
| Graduate Degree | - | - |
| Total | $34,375 | $30,885 |
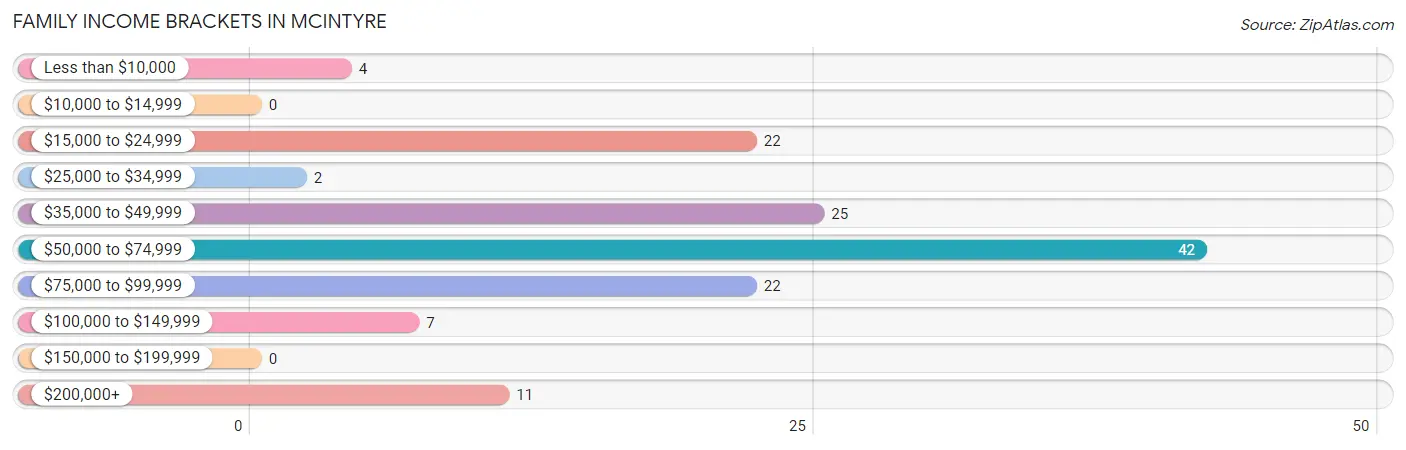
Family Income in McIntyre
Family Income Brackets in McIntyre
According to the McIntyre family income data, there are 42 families falling into the $50,000 to $74,999 income range, which is the most common income bracket and makes up 31.1% of all families.
| Income Bracket | # Families | % Families |
| Less than $10,000 | 4 | 3.0% |
| $10,000 to $14,999 | 0 | 0.0% |
| $15,000 to $24,999 | 22 | 16.3% |
| $25,000 to $34,999 | 2 | 1.5% |
| $35,000 to $49,999 | 25 | 18.5% |
| $50,000 to $74,999 | 42 | 31.1% |
| $75,000 to $99,999 | 22 | 16.3% |
| $100,000 to $149,999 | 7 | 5.2% |
| $150,000 to $199,999 | 0 | 0.0% |
| $200,000+ | 11 | 8.1% |
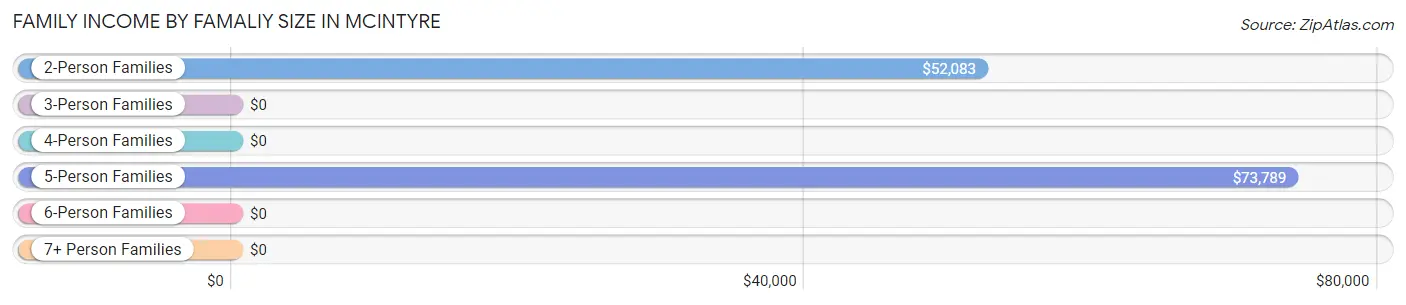
Family Income by Famaliy Size in McIntyre
5-person families (41 | 30.4%) account for the highest median family income in McIntyre with $73,789 per family, while 2-person families (60 | 44.4%) have the highest median income of $26,042 per family member.
| Income Bracket | # Families | Median Income |
| 2-Person Families | 60 (44.4%) | $52,083 |
| 3-Person Families | 8 (5.9%) | $0 |
| 4-Person Families | 10 (7.4%) | $0 |
| 5-Person Families | 41 (30.4%) | $73,789 |
| 6-Person Families | 16 (11.8%) | $0 |
| 7+ Person Families | 0 (0.0%) | $0 |
| Total | 135 (100.0%) | $72,852 |
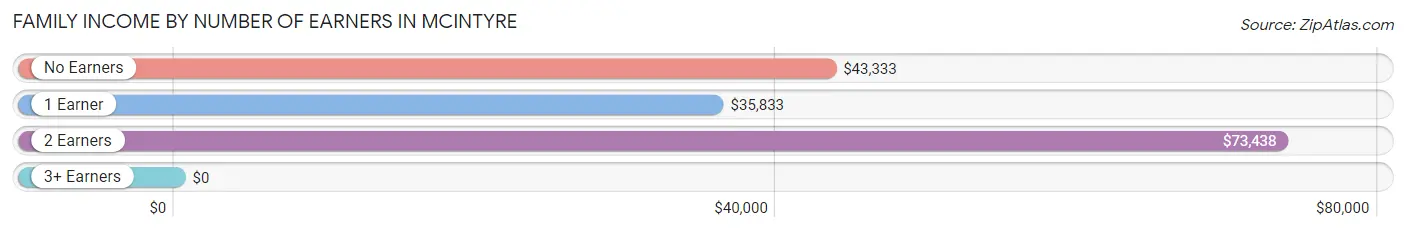
Family Income by Number of Earners in McIntyre
| Number of Earners | # Families | Median Income |
| No Earners | 20 (14.8%) | $43,333 |
| 1 Earner | 18 (13.3%) | $35,833 |
| 2 Earners | 92 (68.1%) | $73,438 |
| 3+ Earners | 5 (3.7%) | $0 |
| Total | 135 (100.0%) | $72,852 |
Household Income in McIntyre
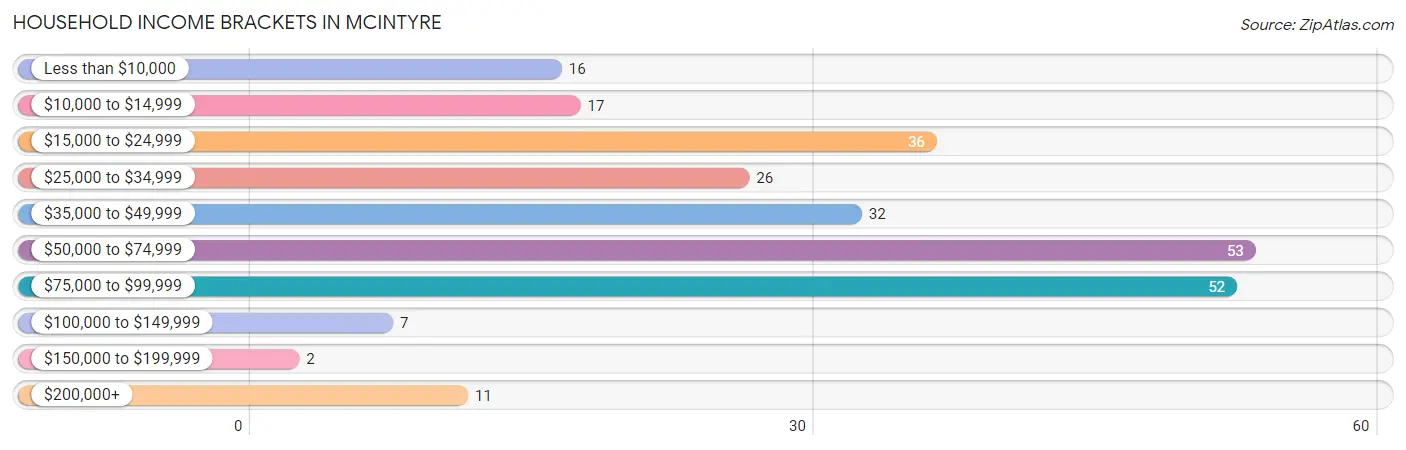
Household Income Brackets in McIntyre
With 53 households falling in the category, the $50,000 to $74,999 income range is the most frequent in McIntyre, accounting for 21.0% of all households. In contrast, only 2 households (0.8%) fall into the $150,000 to $199,999 income bracket, making it the least populous group.
| Income Bracket | # Households | % Households |
| Less than $10,000 | 16 | 6.3% |
| $10,000 to $14,999 | 17 | 6.7% |
| $15,000 to $24,999 | 36 | 14.3% |
| $25,000 to $34,999 | 26 | 10.3% |
| $35,000 to $49,999 | 32 | 12.7% |
| $50,000 to $74,999 | 53 | 21.0% |
| $75,000 to $99,999 | 52 | 20.6% |
| $100,000 to $149,999 | 7 | 2.8% |
| $150,000 to $199,999 | 2 | 0.8% |
| $200,000+ | 11 | 4.4% |
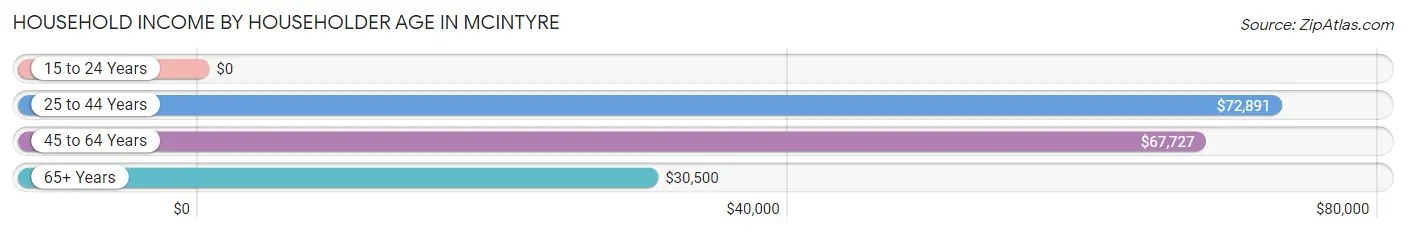
Household Income by Householder Age in McIntyre
The median household income in McIntyre is $49,773, with the highest median household income of $72,891 found in the 25 to 44 years age bracket for the primary householder. A total of 58 households (23.0%) fall into this category.
| Income Bracket | # Households | Median Income |
| 15 to 24 Years | 0 (0.0%) | $0 |
| 25 to 44 Years | 58 (23.0%) | $72,891 |
| 45 to 64 Years | 100 (39.7%) | $67,727 |
| 65+ Years | 94 (37.3%) | $30,500 |
| Total | 252 (100.0%) | $49,773 |
Poverty in McIntyre
Income Below Poverty by Sex and Age in McIntyre
With 18.9% poverty level for males and 20.5% for females among the residents of McIntyre, 6 to 11 year old males and under 5 year old females are the most vulnerable to poverty, with 13 males (100.0%) and 7 females (100.0%) in their respective age groups living below the poverty level.
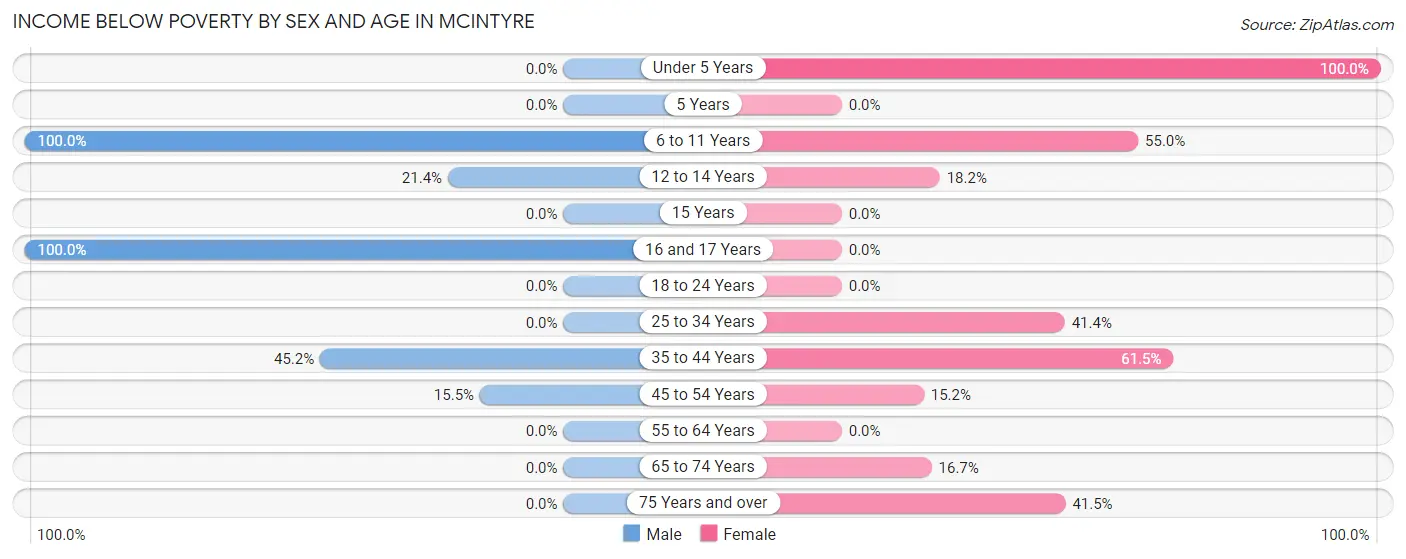
| Age Bracket | Male | Female |
| Under 5 Years | 0 (0.0%) | 7 (100.0%) |
| 5 Years | 0 (0.0%) | 0 (0.0%) |
| 6 to 11 Years | 13 (100.0%) | 11 (55.0%) |
| 12 to 14 Years | 3 (21.4%) | 8 (18.2%) |
| 15 Years | 0 (0.0%) | 0 (0.0%) |
| 16 and 17 Years | 9 (100.0%) | 0 (0.0%) |
| 18 to 24 Years | 0 (0.0%) | 0 (0.0%) |
| 25 to 34 Years | 0 (0.0%) | 24 (41.4%) |
| 35 to 44 Years | 14 (45.2%) | 8 (61.5%) |
| 45 to 54 Years | 11 (15.5%) | 7 (15.2%) |
| 55 to 64 Years | 0 (0.0%) | 0 (0.0%) |
| 65 to 74 Years | 0 (0.0%) | 6 (16.7%) |
| 75 Years and over | 0 (0.0%) | 22 (41.5%) |
| Total | 50 (18.9%) | 93 (20.5%) |
Income Above Poverty by Sex and Age in McIntyre
According to the poverty statistics in McIntyre, males aged under 5 years and females aged 18 to 24 years are the age groups that are most secure financially, with 100.0% of males and 100.0% of females in these age groups living above the poverty line.
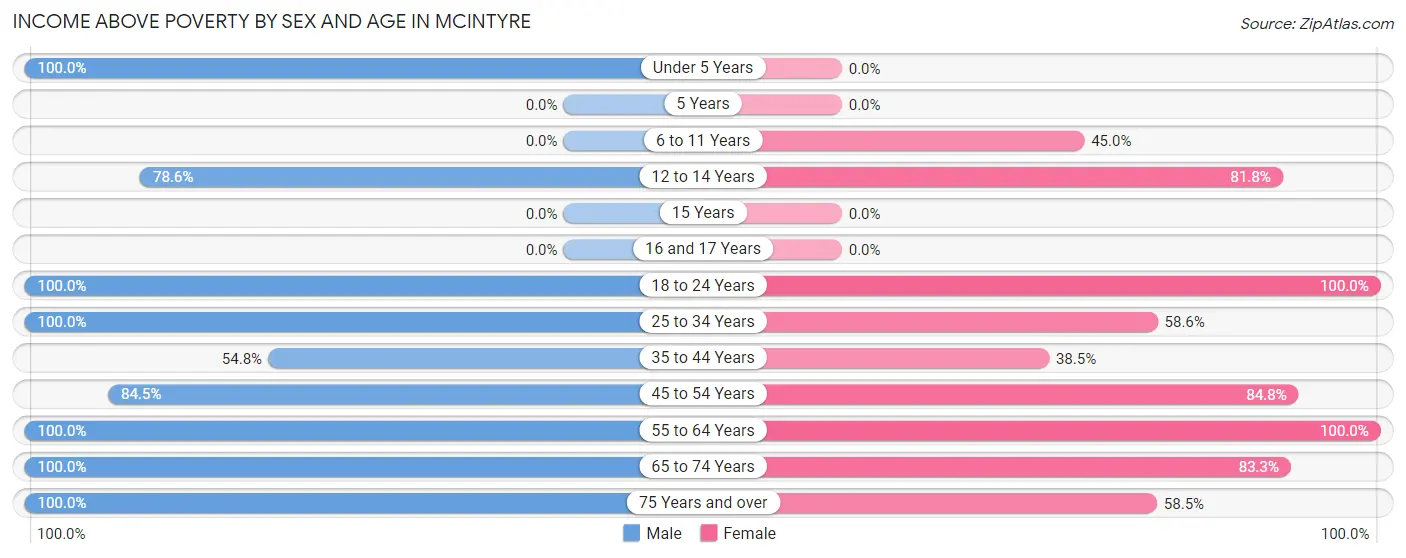
| Age Bracket | Male | Female |
| Under 5 Years | 17 (100.0%) | 0 (0.0%) |
| 5 Years | 0 (0.0%) | 0 (0.0%) |
| 6 to 11 Years | 0 (0.0%) | 9 (45.0%) |
| 12 to 14 Years | 11 (78.6%) | 36 (81.8%) |
| 15 Years | 0 (0.0%) | 0 (0.0%) |
| 16 and 17 Years | 0 (0.0%) | 0 (0.0%) |
| 18 to 24 Years | 30 (100.0%) | 105 (100.0%) |
| 25 to 34 Years | 16 (100.0%) | 34 (58.6%) |
| 35 to 44 Years | 17 (54.8%) | 5 (38.5%) |
| 45 to 54 Years | 60 (84.5%) | 39 (84.8%) |
| 55 to 64 Years | 30 (100.0%) | 72 (100.0%) |
| 65 to 74 Years | 31 (100.0%) | 30 (83.3%) |
| 75 Years and over | 2 (100.0%) | 31 (58.5%) |
| Total | 214 (81.1%) | 361 (79.5%) |
Income Below Poverty Among Married-Couple Families in McIntyre
The poverty statistics for married-couple families in McIntyre show that 16.4% or 12 of the total 73 families live below the poverty line. Families with 3 or 4 children have the highest poverty rate of 100.0%, comprising of 12 families. On the other hand, families with no children have the lowest poverty rate of 0.0%, which includes 0 families.
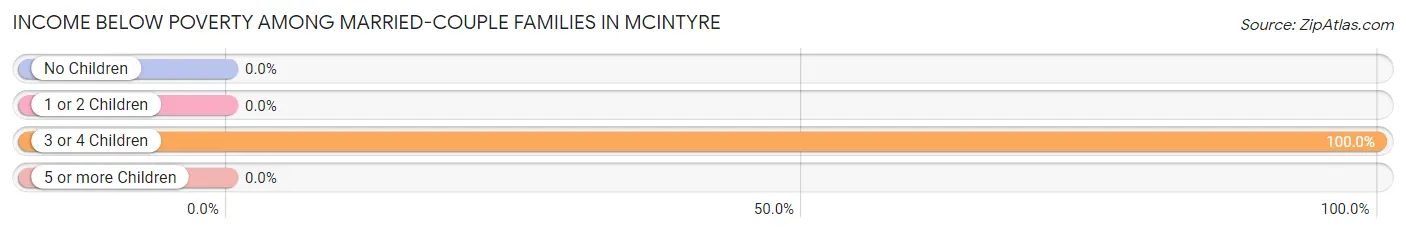
| Children | Above Poverty | Below Poverty |
| No Children | 51 (100.0%) | 0 (0.0%) |
| 1 or 2 Children | 10 (100.0%) | 0 (0.0%) |
| 3 or 4 Children | 0 (0.0%) | 12 (100.0%) |
| 5 or more Children | 0 (0.0%) | 0 (0.0%) |
| Total | 61 (83.6%) | 12 (16.4%) |
Income Below Poverty Among Single-Parent Households in McIntyre
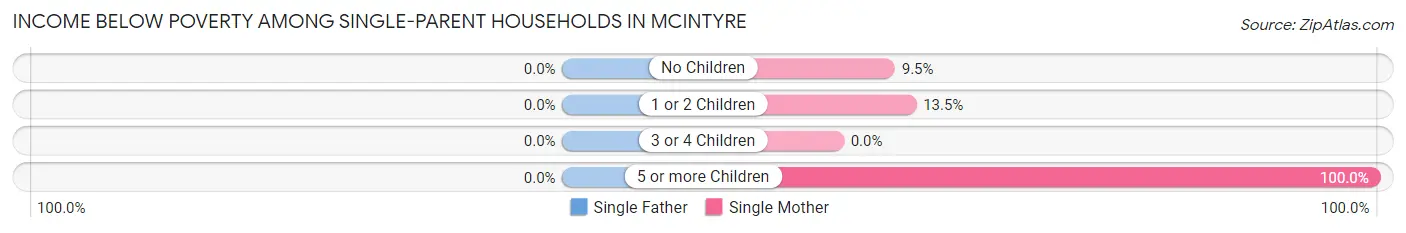
| Children | Single Father | Single Mother |
| No Children | 0 (0.0%) | 2 (9.5%) |
| 1 or 2 Children | 0 (0.0%) | 5 (13.5%) |
| 3 or 4 Children | 0 (0.0%) | 0 (0.0%) |
| 5 or more Children | 0 (0.0%) | 4 (100.0%) |
| Total | 0 (0.0%) | 11 (17.7%) |
Income Below Poverty Among Married-Couple vs Single-Parent Households in McIntyre
The poverty data for McIntyre shows that 12 of the married-couple family households (16.4%) and 11 of the single-parent households (17.7%) are living below the poverty level. Within the married-couple family households, those with 3 or 4 children have the highest poverty rate, with 12 households (100.0%) falling below the poverty line. Among the single-parent households, those with 5 or more children have the highest poverty rate, with 4 household (100.0%) living below poverty.
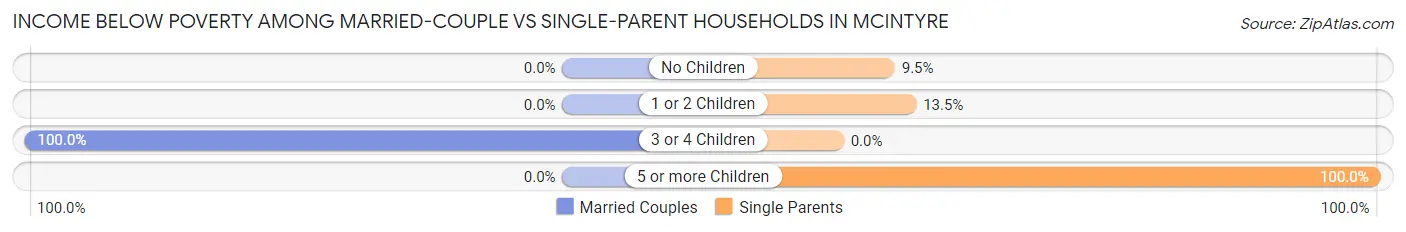
| Children | Married-Couple Families | Single-Parent Households |
| No Children | 0 (0.0%) | 2 (9.5%) |
| 1 or 2 Children | 0 (0.0%) | 5 (13.5%) |
| 3 or 4 Children | 12 (100.0%) | 0 (0.0%) |
| 5 or more Children | 0 (0.0%) | 4 (100.0%) |
| Total | 12 (16.4%) | 11 (17.7%) |
Employment Characteristics in McIntyre
Employment by Class of Employer in McIntyre
Among the 313 employed individuals in McIntyre, private company employees (168 | 53.7%), local government employees (78 | 24.9%), and not-for-profit organizations (23 | 7.3%) make up the most common classes of employment.
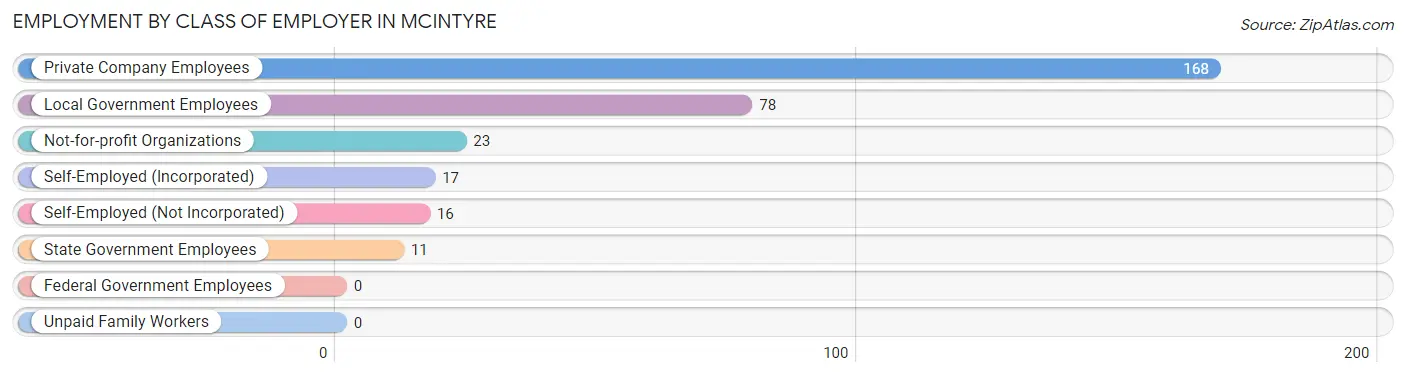
| Employer Class | # Employees | % Employees |
| Private Company Employees | 168 | 53.7% |
| Self-Employed (Incorporated) | 17 | 5.4% |
| Self-Employed (Not Incorporated) | 16 | 5.1% |
| Not-for-profit Organizations | 23 | 7.3% |
| Local Government Employees | 78 | 24.9% |
| State Government Employees | 11 | 3.5% |
| Federal Government Employees | 0 | 0.0% |
| Unpaid Family Workers | 0 | 0.0% |
| Total | 313 | 100.0% |
Employment Status by Age in McIntyre
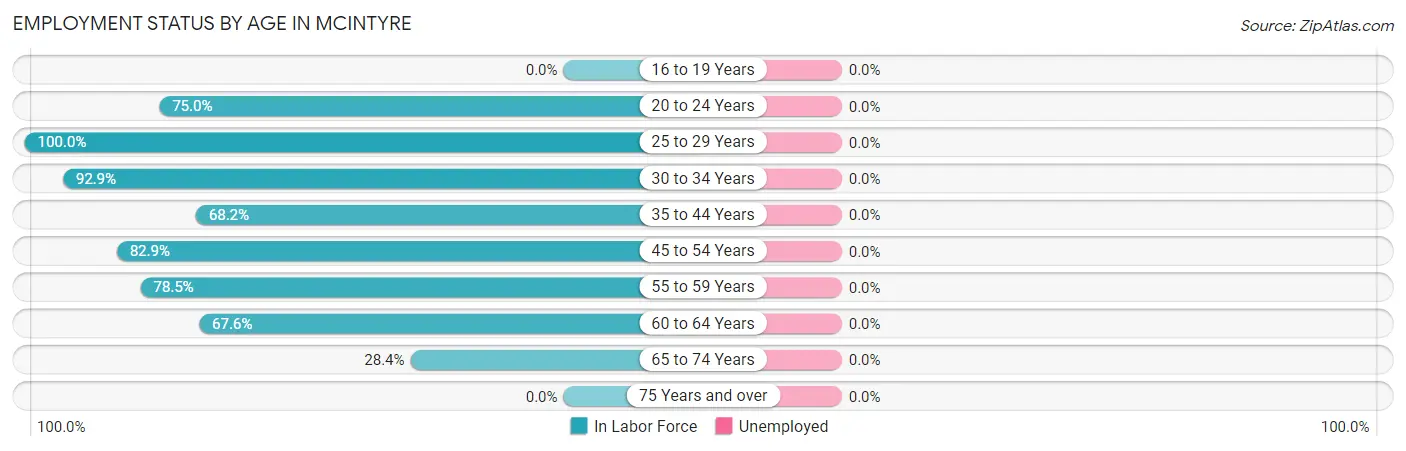
| Age Bracket | In Labor Force | Unemployed |
| 16 to 19 Years | 0 (0.0%) | 0 (0.0%) |
| 20 to 24 Years | 21 (75.0%) | 0 (0.0%) |
| 25 to 29 Years | 18 (100.0%) | 0 (0.0%) |
| 30 to 34 Years | 52 (92.9%) | 0 (0.0%) |
| 35 to 44 Years | 30 (68.2%) | 0 (0.0%) |
| 45 to 54 Years | 97 (82.9%) | 0 (0.0%) |
| 55 to 59 Years | 51 (78.5%) | 0 (0.0%) |
| 60 to 64 Years | 25 (67.6%) | 0 (0.0%) |
| 65 to 74 Years | 19 (28.4%) | 0 (0.0%) |
| 75 Years and over | 0 (0.0%) | 0 (0.0%) |
| Total | 313 (51.9%) | 0 (0.0%) |
Employment Status by Educational Attainment in McIntyre
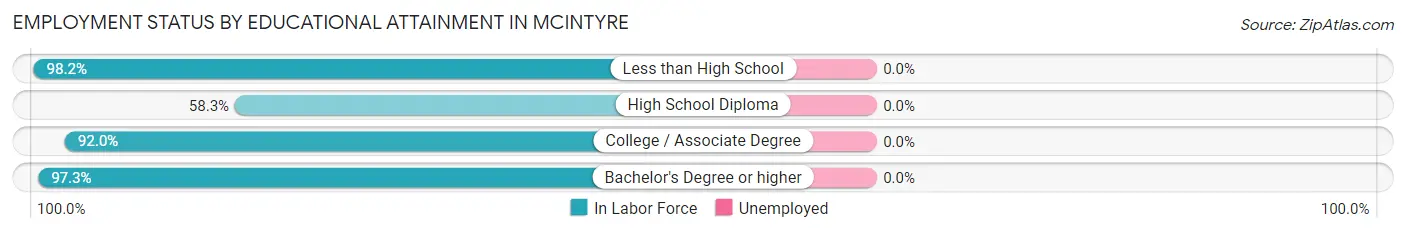
| Educational Attainment | In Labor Force | Unemployed |
| Less than High School | 56 (98.2%) | 0 (0.0%) |
| High School Diploma | 77 (58.3%) | 0 (0.0%) |
| College / Associate Degree | 69 (92.0%) | 0 (0.0%) |
| Bachelor's Degree or higher | 71 (97.3%) | 0 (0.0%) |
| Total | 273 (81.0%) | 0 (0.0%) |
Employment Occupations by Sex in McIntyre
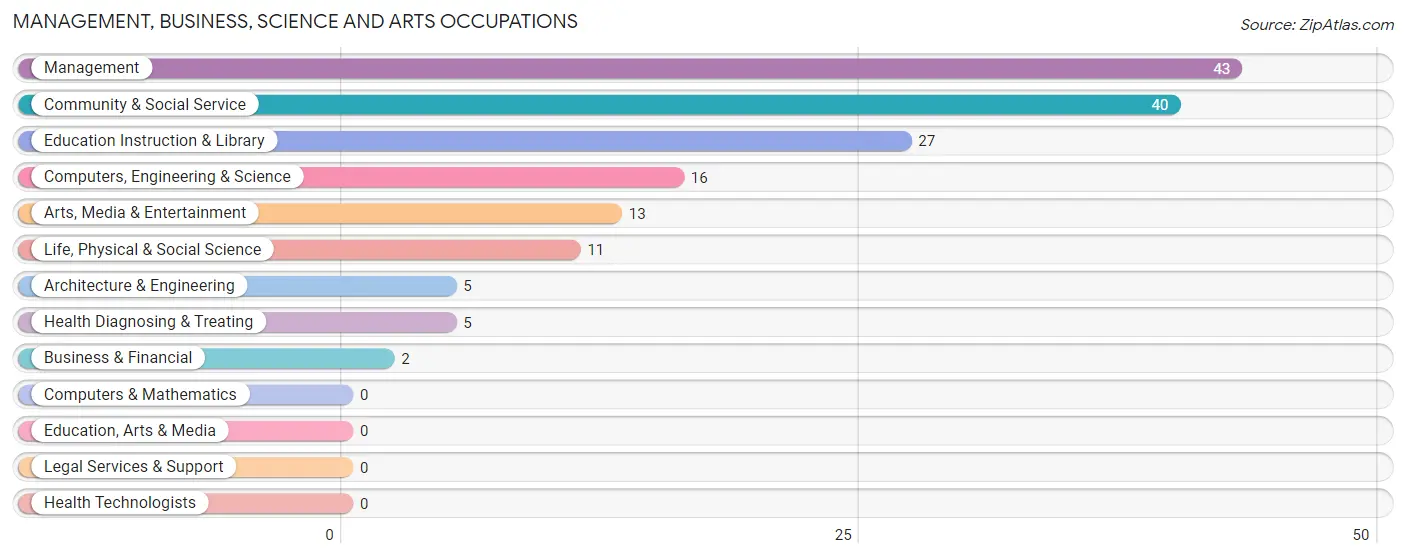
Management, Business, Science and Arts Occupations
The most common Management, Business, Science and Arts occupations in McIntyre are Management (43 | 13.7%), Community & Social Service (40 | 12.8%), Education Instruction & Library (27 | 8.6%), Computers, Engineering & Science (16 | 5.1%), and Arts, Media & Entertainment (13 | 4.2%).
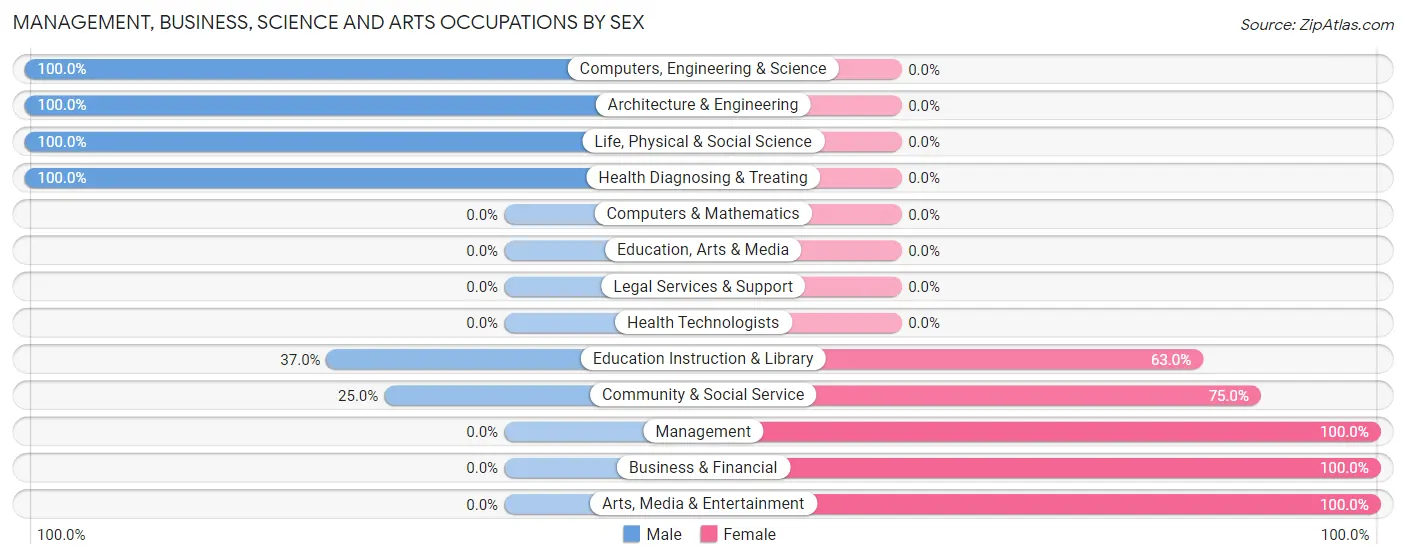
Management, Business, Science and Arts Occupations by Sex
Within the Management, Business, Science and Arts occupations in McIntyre, the most male-oriented occupations are Computers, Engineering & Science (100.0%), Architecture & Engineering (100.0%), and Life, Physical & Social Science (100.0%), while the most female-oriented occupations are Management (100.0%), Business & Financial (100.0%), and Arts, Media & Entertainment (100.0%).
| Occupation | Male | Female |
| Management | 0 (0.0%) | 43 (100.0%) |
| Business & Financial | 0 (0.0%) | 2 (100.0%) |
| Computers, Engineering & Science | 16 (100.0%) | 0 (0.0%) |
| Computers & Mathematics | 0 (0.0%) | 0 (0.0%) |
| Architecture & Engineering | 5 (100.0%) | 0 (0.0%) |
| Life, Physical & Social Science | 11 (100.0%) | 0 (0.0%) |
| Community & Social Service | 10 (25.0%) | 30 (75.0%) |
| Education, Arts & Media | 0 (0.0%) | 0 (0.0%) |
| Legal Services & Support | 0 (0.0%) | 0 (0.0%) |
| Education Instruction & Library | 10 (37.0%) | 17 (63.0%) |
| Arts, Media & Entertainment | 0 (0.0%) | 13 (100.0%) |
| Health Diagnosing & Treating | 5 (100.0%) | 0 (0.0%) |
| Health Technologists | 0 (0.0%) | 0 (0.0%) |
| Total (Category) | 31 (29.2%) | 75 (70.8%) |
| Total (Overall) | 115 (36.7%) | 198 (63.3%) |
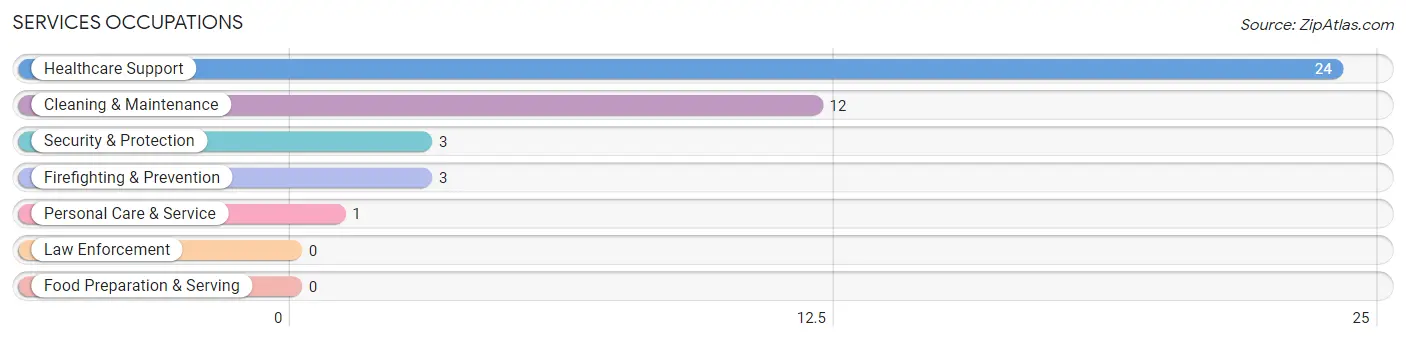
Services Occupations
The most common Services occupations in McIntyre are Healthcare Support (24 | 7.7%), Cleaning & Maintenance (12 | 3.8%), Security & Protection (3 | 1.0%), Firefighting & Prevention (3 | 1.0%), and Personal Care & Service (1 | 0.3%).
Services Occupations by Sex
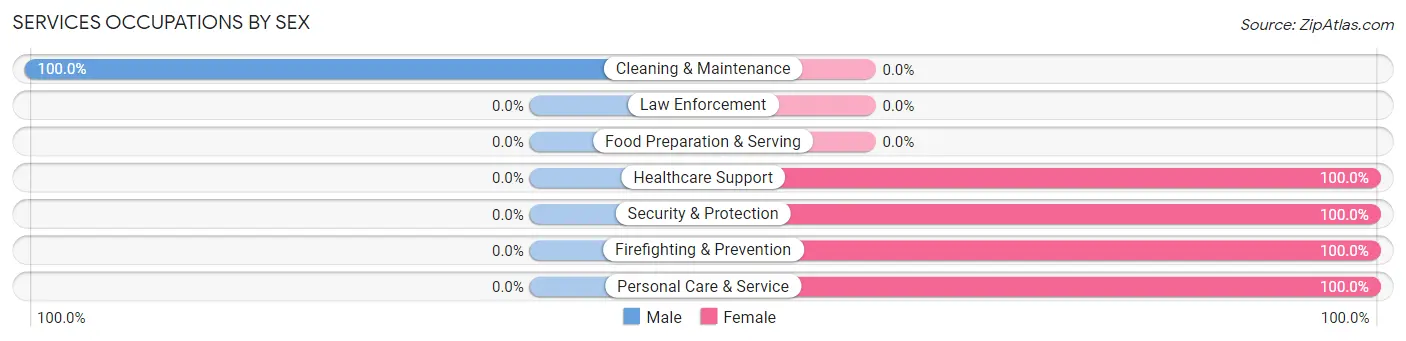
| Occupation | Male | Female |
| Healthcare Support | 0 (0.0%) | 24 (100.0%) |
| Security & Protection | 0 (0.0%) | 3 (100.0%) |
| Firefighting & Prevention | 0 (0.0%) | 3 (100.0%) |
| Law Enforcement | 0 (0.0%) | 0 (0.0%) |
| Food Preparation & Serving | 0 (0.0%) | 0 (0.0%) |
| Cleaning & Maintenance | 12 (100.0%) | 0 (0.0%) |
| Personal Care & Service | 0 (0.0%) | 1 (100.0%) |
| Total (Category) | 12 (30.0%) | 28 (70.0%) |
| Total (Overall) | 115 (36.7%) | 198 (63.3%) |
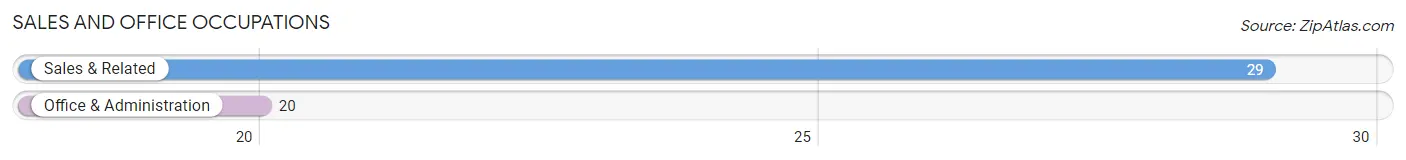
Sales and Office Occupations
The most common Sales and Office occupations in McIntyre are Sales & Related (29 | 9.3%), and Office & Administration (20 | 6.4%).
Sales and Office Occupations by Sex
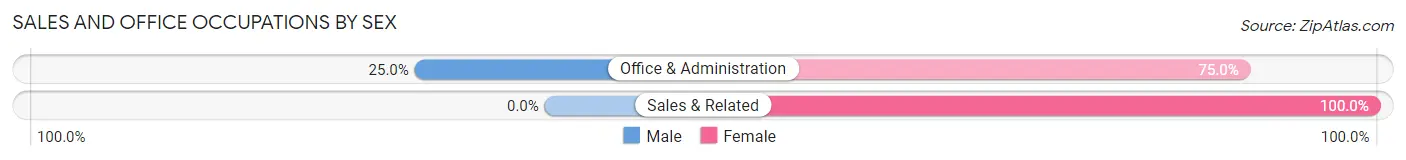
| Occupation | Male | Female |
| Sales & Related | 0 (0.0%) | 29 (100.0%) |
| Office & Administration | 5 (25.0%) | 15 (75.0%) |
| Total (Category) | 5 (10.2%) | 44 (89.8%) |
| Total (Overall) | 115 (36.7%) | 198 (63.3%) |
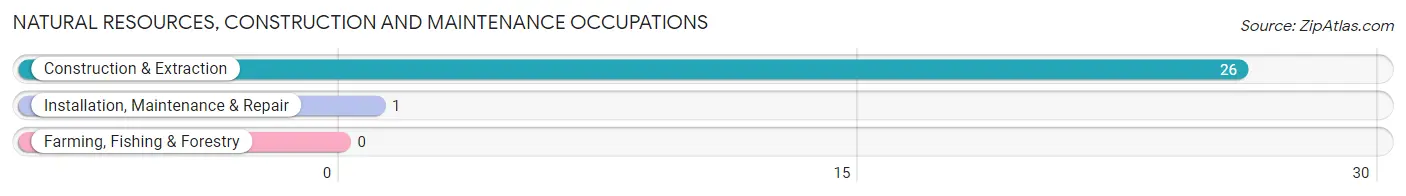
Natural Resources, Construction and Maintenance Occupations
The most common Natural Resources, Construction and Maintenance occupations in McIntyre are Construction & Extraction (26 | 8.3%), and Installation, Maintenance & Repair (1 | 0.3%).
Natural Resources, Construction and Maintenance Occupations by Sex
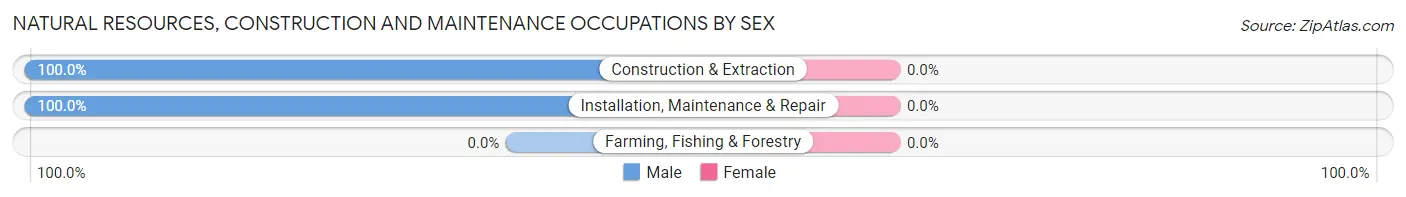
| Occupation | Male | Female |
| Farming, Fishing & Forestry | 0 (0.0%) | 0 (0.0%) |
| Construction & Extraction | 26 (100.0%) | 0 (0.0%) |
| Installation, Maintenance & Repair | 1 (100.0%) | 0 (0.0%) |
| Total (Category) | 27 (100.0%) | 0 (0.0%) |
| Total (Overall) | 115 (36.7%) | 198 (63.3%) |
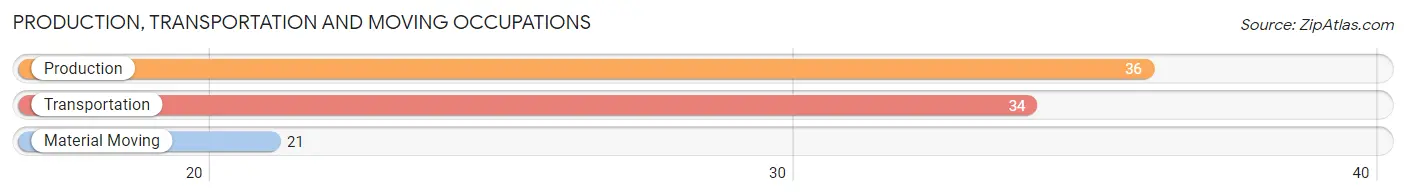
Production, Transportation and Moving Occupations
The most common Production, Transportation and Moving occupations in McIntyre are Production (36 | 11.5%), Transportation (34 | 10.9%), and Material Moving (21 | 6.7%).
Production, Transportation and Moving Occupations by Sex
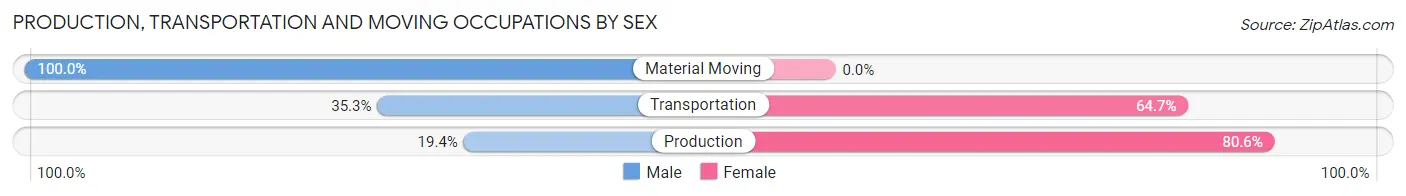
| Occupation | Male | Female |
| Production | 7 (19.4%) | 29 (80.6%) |
| Transportation | 12 (35.3%) | 22 (64.7%) |
| Material Moving | 21 (100.0%) | 0 (0.0%) |
| Total (Category) | 40 (44.0%) | 51 (56.0%) |
| Total (Overall) | 115 (36.7%) | 198 (63.3%) |
Employment Industries by Sex in McIntyre
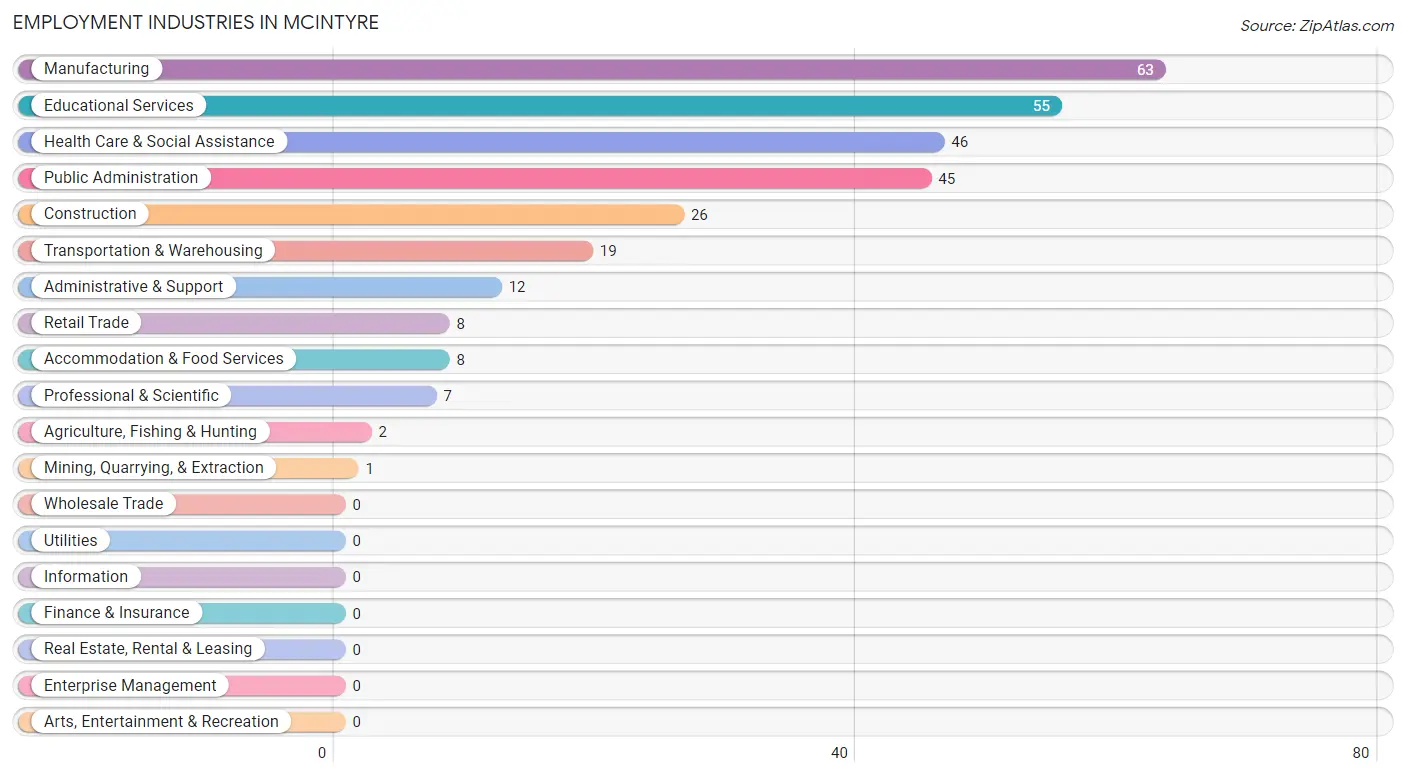
Employment Industries in McIntyre
The major employment industries in McIntyre include Manufacturing (63 | 20.1%), Educational Services (55 | 17.6%), Health Care & Social Assistance (46 | 14.7%), Public Administration (45 | 14.4%), and Construction (26 | 8.3%).
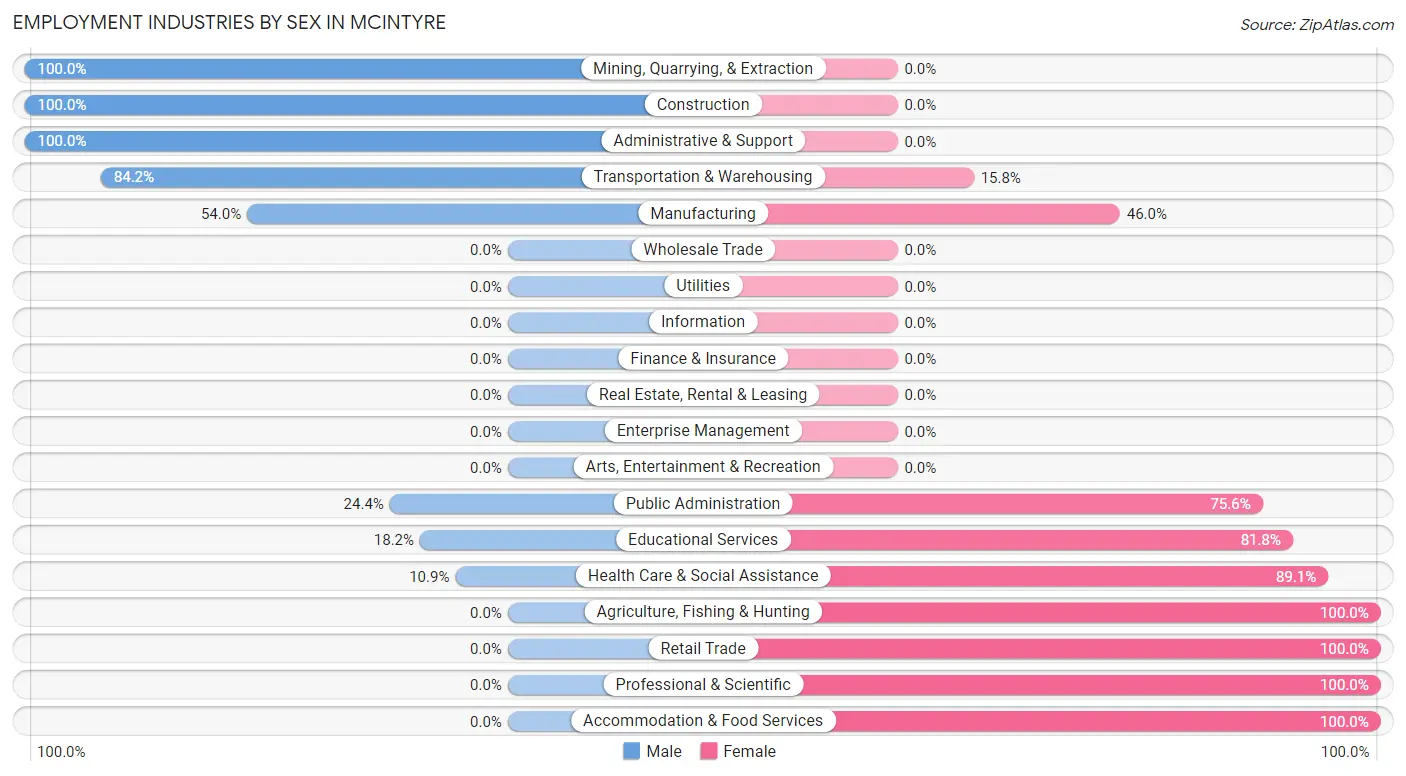
Employment Industries by Sex in McIntyre
The McIntyre industries that see more men than women are Mining, Quarrying, & Extraction (100.0%), Construction (100.0%), and Administrative & Support (100.0%), whereas the industries that tend to have a higher number of women are Agriculture, Fishing & Hunting (100.0%), Retail Trade (100.0%), and Professional & Scientific (100.0%).
| Industry | Male | Female |
| Agriculture, Fishing & Hunting | 0 (0.0%) | 2 (100.0%) |
| Mining, Quarrying, & Extraction | 1 (100.0%) | 0 (0.0%) |
| Construction | 26 (100.0%) | 0 (0.0%) |
| Manufacturing | 34 (54.0%) | 29 (46.0%) |
| Wholesale Trade | 0 (0.0%) | 0 (0.0%) |
| Retail Trade | 0 (0.0%) | 8 (100.0%) |
| Transportation & Warehousing | 16 (84.2%) | 3 (15.8%) |
| Utilities | 0 (0.0%) | 0 (0.0%) |
| Information | 0 (0.0%) | 0 (0.0%) |
| Finance & Insurance | 0 (0.0%) | 0 (0.0%) |
| Real Estate, Rental & Leasing | 0 (0.0%) | 0 (0.0%) |
| Professional & Scientific | 0 (0.0%) | 7 (100.0%) |
| Enterprise Management | 0 (0.0%) | 0 (0.0%) |
| Administrative & Support | 12 (100.0%) | 0 (0.0%) |
| Educational Services | 10 (18.2%) | 45 (81.8%) |
| Health Care & Social Assistance | 5 (10.9%) | 41 (89.1%) |
| Arts, Entertainment & Recreation | 0 (0.0%) | 0 (0.0%) |
| Accommodation & Food Services | 0 (0.0%) | 8 (100.0%) |
| Public Administration | 11 (24.4%) | 34 (75.6%) |
| Total | 115 (36.7%) | 198 (63.3%) |
Education in McIntyre
School Enrollment in McIntyre
The most common levels of schooling among the 195 students in McIntyre are college / undergraduate (74 | 38.0%), middle school (72 | 36.9%), and high school (35 | 17.9%).
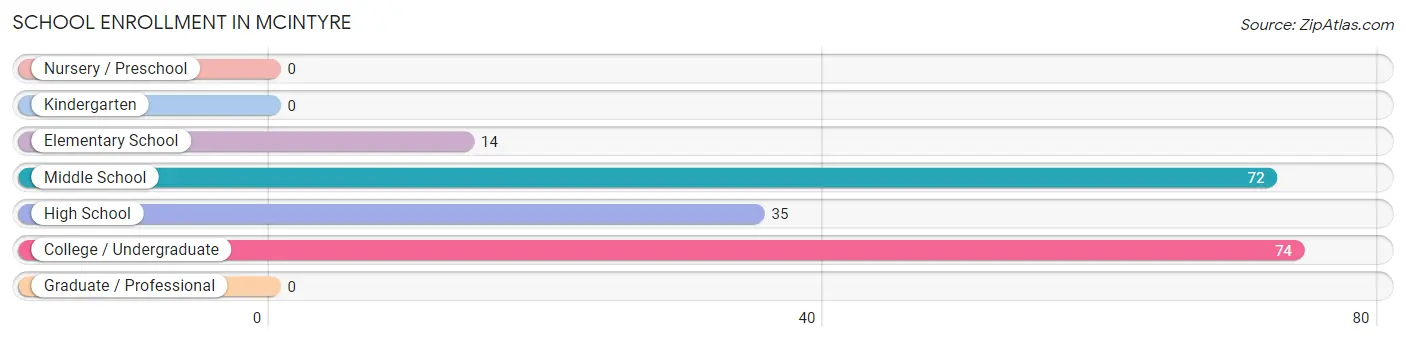
| School Level | # Students | % Students |
| Nursery / Preschool | 0 | 0.0% |
| Kindergarten | 0 | 0.0% |
| Elementary School | 14 | 7.2% |
| Middle School | 72 | 36.9% |
| High School | 35 | 17.9% |
| College / Undergraduate | 74 | 38.0% |
| Graduate / Professional | 0 | 0.0% |
| Total | 195 | 100.0% |
School Enrollment by Age by Funding Source in McIntyre
Out of a total of 195 students who are enrolled in schools in McIntyre, 15 (7.7%) attend a private institution, while the remaining 180 (92.3%) are enrolled in public schools. The age group of 18 to 19 year olds has the highest likelihood of being enrolled in private schools, with 10 (10.5% in the age bracket) enrolled. Conversely, the age group of 5 to 9 year old has the lowest likelihood of being enrolled in a private school, with 14 (100.0% in the age bracket) attending a public institution.
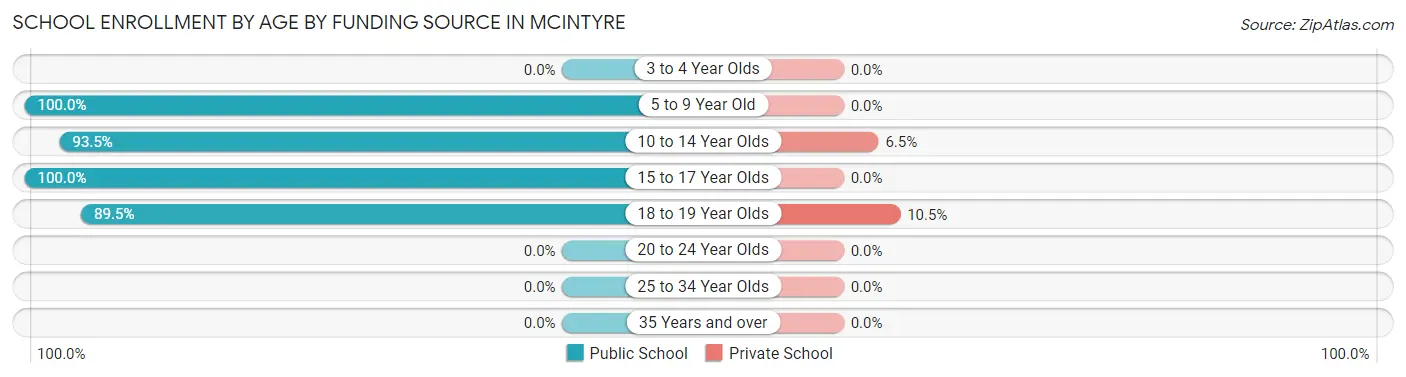
| Age Bracket | Public School | Private School |
| 3 to 4 Year Olds | 0 (0.0%) | 0 (0.0%) |
| 5 to 9 Year Old | 14 (100.0%) | 0 (0.0%) |
| 10 to 14 Year Olds | 72 (93.5%) | 5 (6.5%) |
| 15 to 17 Year Olds | 9 (100.0%) | 0 (0.0%) |
| 18 to 19 Year Olds | 85 (89.5%) | 10 (10.5%) |
| 20 to 24 Year Olds | 0 (0.0%) | 0 (0.0%) |
| 25 to 34 Year Olds | 0 (0.0%) | 0 (0.0%) |
| 35 Years and over | 0 (0.0%) | 0 (0.0%) |
| Total | 180 (92.3%) | 15 (7.7%) |
Educational Attainment by Field of Study in McIntyre
Education (28 | 30.1%), literature & languages (18 | 19.4%), social sciences (15 | 16.1%), psychology (11 | 11.8%), and arts & humanities (11 | 11.8%) are the most common fields of study among 93 individuals in McIntyre who have obtained a bachelor's degree or higher.
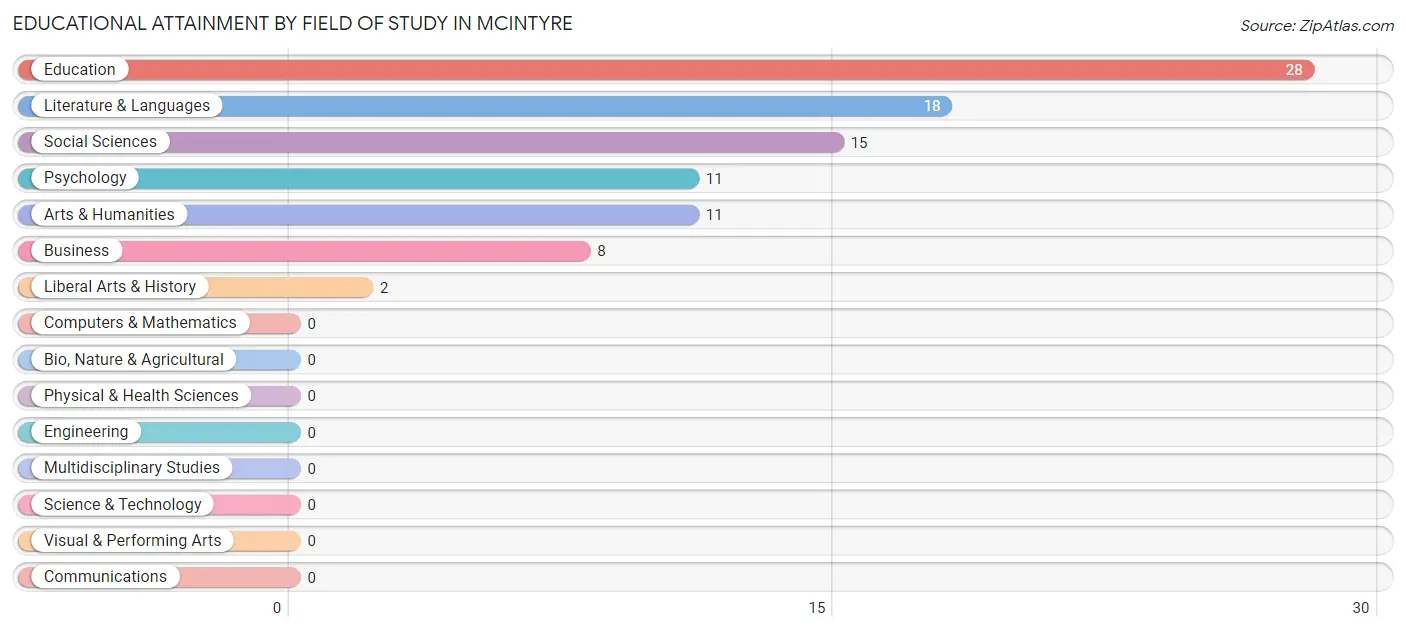
| Field of Study | # Graduates | % Graduates |
| Computers & Mathematics | 0 | 0.0% |
| Bio, Nature & Agricultural | 0 | 0.0% |
| Physical & Health Sciences | 0 | 0.0% |
| Psychology | 11 | 11.8% |
| Social Sciences | 15 | 16.1% |
| Engineering | 0 | 0.0% |
| Multidisciplinary Studies | 0 | 0.0% |
| Science & Technology | 0 | 0.0% |
| Business | 8 | 8.6% |
| Education | 28 | 30.1% |
| Literature & Languages | 18 | 19.4% |
| Liberal Arts & History | 2 | 2.1% |
| Visual & Performing Arts | 0 | 0.0% |
| Communications | 0 | 0.0% |
| Arts & Humanities | 11 | 11.8% |
| Total | 93 | 100.0% |
Transportation & Commute in McIntyre
Vehicle Availability by Sex in McIntyre
The most prevalent vehicle ownership categories in McIntyre are males with 2 vehicles (73, accounting for 63.5%) and females with 2 vehicles (125, making up 36.9%).
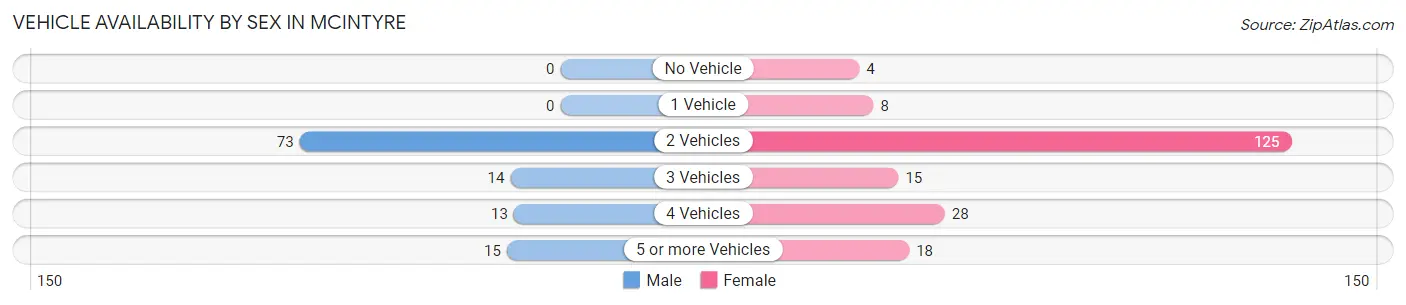
| Vehicles Available | Male | Female |
| No Vehicle | 0 (0.0%) | 4 (2.0%) |
| 1 Vehicle | 0 (0.0%) | 8 (4.0%) |
| 2 Vehicles | 73 (63.5%) | 125 (63.1%) |
| 3 Vehicles | 14 (12.2%) | 15 (7.6%) |
| 4 Vehicles | 13 (11.3%) | 28 (14.1%) |
| 5 or more Vehicles | 15 (13.0%) | 18 (9.1%) |
| Total | 115 (100.0%) | 198 (100.0%) |
Commute Time in McIntyre
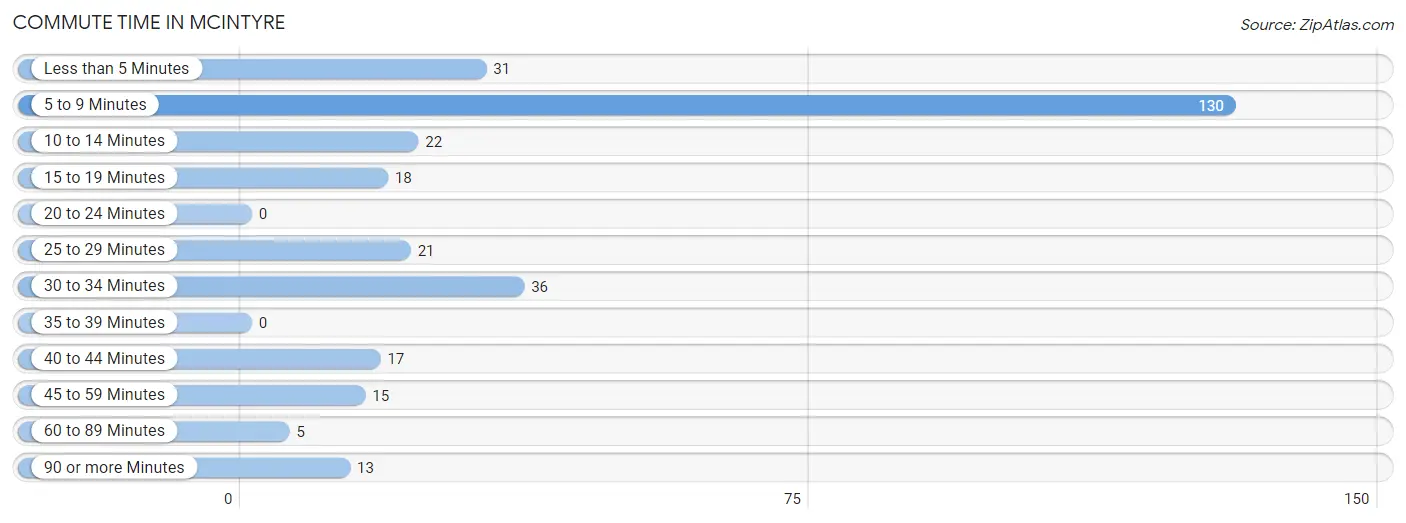
The most frequently occuring commute durations in McIntyre are 5 to 9 minutes (130 commuters, 42.2%), 30 to 34 minutes (36 commuters, 11.7%), and less than 5 minutes (31 commuters, 10.1%).
| Commute Time | # Commuters | % Commuters |
| Less than 5 Minutes | 31 | 10.1% |
| 5 to 9 Minutes | 130 | 42.2% |
| 10 to 14 Minutes | 22 | 7.1% |
| 15 to 19 Minutes | 18 | 5.8% |
| 20 to 24 Minutes | 0 | 0.0% |
| 25 to 29 Minutes | 21 | 6.8% |
| 30 to 34 Minutes | 36 | 11.7% |
| 35 to 39 Minutes | 0 | 0.0% |
| 40 to 44 Minutes | 17 | 5.5% |
| 45 to 59 Minutes | 15 | 4.9% |
| 60 to 89 Minutes | 5 | 1.6% |
| 90 or more Minutes | 13 | 4.2% |
Commute Time by Sex in McIntyre
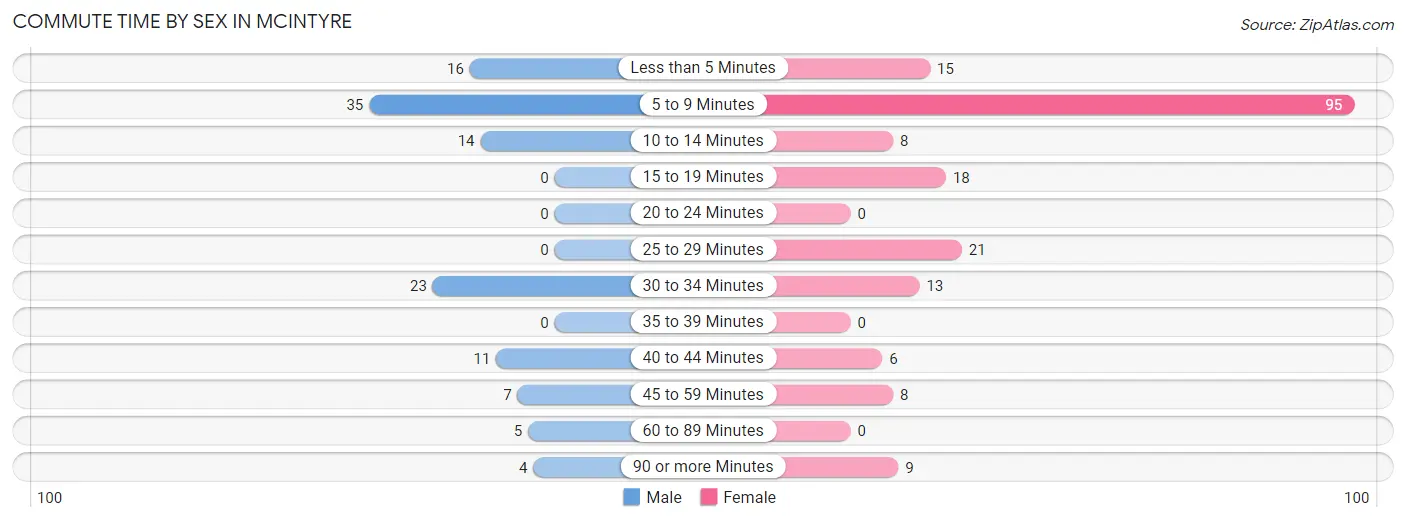
The most common commute times in McIntyre are 5 to 9 minutes (35 commuters, 30.4%) for males and 5 to 9 minutes (95 commuters, 49.2%) for females.
| Commute Time | Male | Female |
| Less than 5 Minutes | 16 (13.9%) | 15 (7.8%) |
| 5 to 9 Minutes | 35 (30.4%) | 95 (49.2%) |
| 10 to 14 Minutes | 14 (12.2%) | 8 (4.2%) |
| 15 to 19 Minutes | 0 (0.0%) | 18 (9.3%) |
| 20 to 24 Minutes | 0 (0.0%) | 0 (0.0%) |
| 25 to 29 Minutes | 0 (0.0%) | 21 (10.9%) |
| 30 to 34 Minutes | 23 (20.0%) | 13 (6.7%) |
| 35 to 39 Minutes | 0 (0.0%) | 0 (0.0%) |
| 40 to 44 Minutes | 11 (9.6%) | 6 (3.1%) |
| 45 to 59 Minutes | 7 (6.1%) | 8 (4.2%) |
| 60 to 89 Minutes | 5 (4.3%) | 0 (0.0%) |
| 90 or more Minutes | 4 (3.5%) | 9 (4.7%) |
Time of Departure to Work by Sex in McIntyre
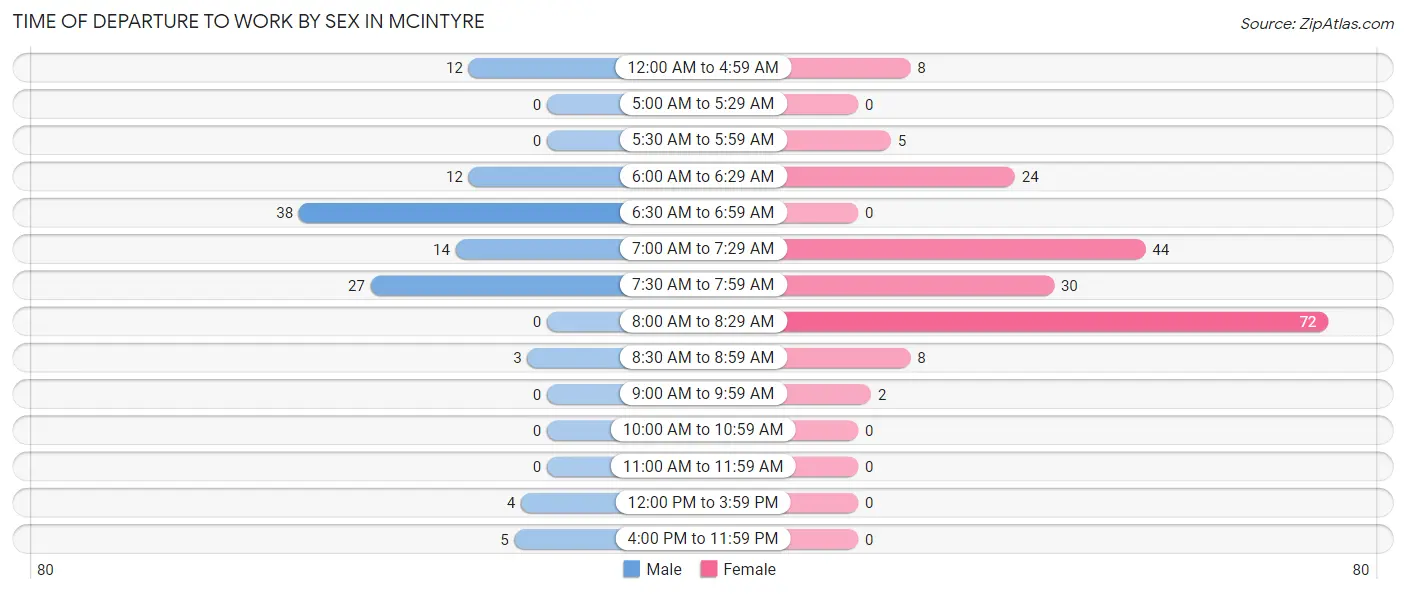
The most frequent times of departure to work in McIntyre are 6:30 AM to 6:59 AM (38, 33.0%) for males and 8:00 AM to 8:29 AM (72, 37.3%) for females.
| Time of Departure | Male | Female |
| 12:00 AM to 4:59 AM | 12 (10.4%) | 8 (4.2%) |
| 5:00 AM to 5:29 AM | 0 (0.0%) | 0 (0.0%) |
| 5:30 AM to 5:59 AM | 0 (0.0%) | 5 (2.6%) |
| 6:00 AM to 6:29 AM | 12 (10.4%) | 24 (12.4%) |
| 6:30 AM to 6:59 AM | 38 (33.0%) | 0 (0.0%) |
| 7:00 AM to 7:29 AM | 14 (12.2%) | 44 (22.8%) |
| 7:30 AM to 7:59 AM | 27 (23.5%) | 30 (15.5%) |
| 8:00 AM to 8:29 AM | 0 (0.0%) | 72 (37.3%) |
| 8:30 AM to 8:59 AM | 3 (2.6%) | 8 (4.2%) |
| 9:00 AM to 9:59 AM | 0 (0.0%) | 2 (1.0%) |
| 10:00 AM to 10:59 AM | 0 (0.0%) | 0 (0.0%) |
| 11:00 AM to 11:59 AM | 0 (0.0%) | 0 (0.0%) |
| 12:00 PM to 3:59 PM | 4 (3.5%) | 0 (0.0%) |
| 4:00 PM to 11:59 PM | 5 (4.3%) | 0 (0.0%) |
| Total | 115 (100.0%) | 193 (100.0%) |
Housing Occupancy in McIntyre
Occupancy by Ownership in McIntyre
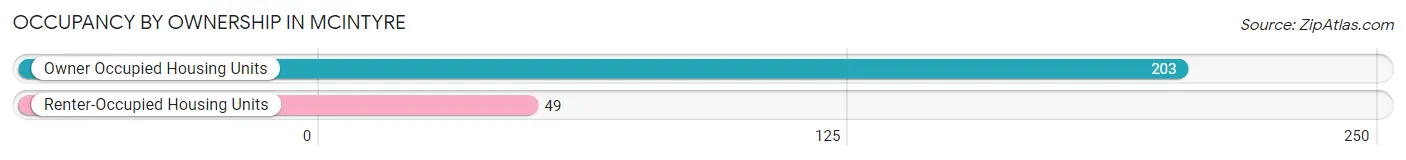
Of the total 252 dwellings in McIntyre, owner-occupied units account for 203 (80.6%), while renter-occupied units make up 49 (19.4%).
| Occupancy | # Housing Units | % Housing Units |
| Owner Occupied Housing Units | 203 | 80.6% |
| Renter-Occupied Housing Units | 49 | 19.4% |
| Total Occupied Housing Units | 252 | 100.0% |
Occupancy by Household Size in McIntyre
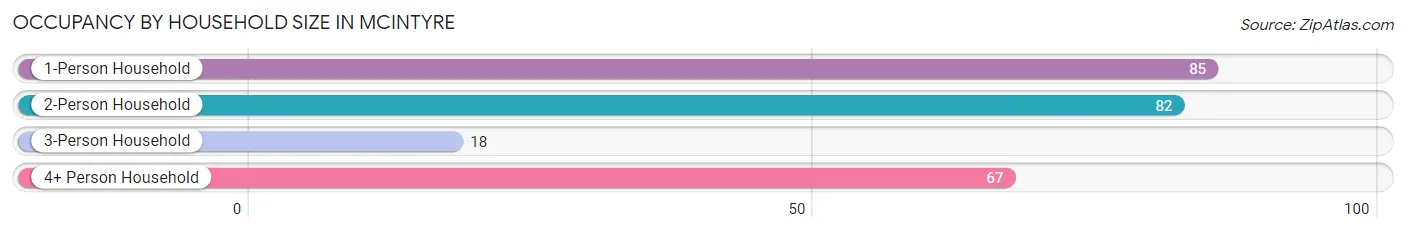
| Household Size | # Housing Units | % Housing Units |
| 1-Person Household | 85 | 33.7% |
| 2-Person Household | 82 | 32.5% |
| 3-Person Household | 18 | 7.1% |
| 4+ Person Household | 67 | 26.6% |
| Total Housing Units | 252 | 100.0% |
Occupancy by Ownership by Household Size in McIntyre
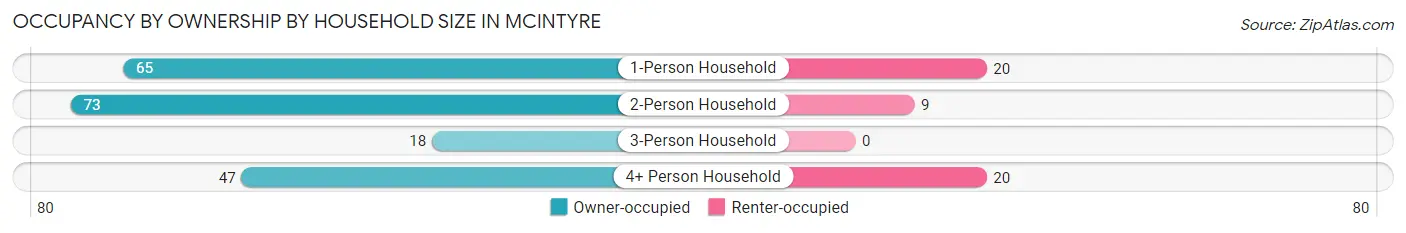
| Household Size | Owner-occupied | Renter-occupied |
| 1-Person Household | 65 (76.5%) | 20 (23.5%) |
| 2-Person Household | 73 (89.0%) | 9 (11.0%) |
| 3-Person Household | 18 (100.0%) | 0 (0.0%) |
| 4+ Person Household | 47 (70.2%) | 20 (29.8%) |
| Total Housing Units | 203 (80.6%) | 49 (19.4%) |
Occupancy by Educational Attainment in McIntyre
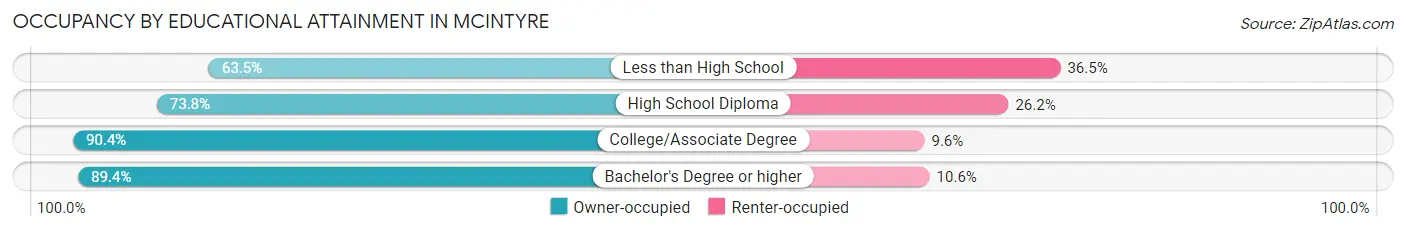
| Household Size | Owner-occupied | Renter-occupied |
| Less than High School | 33 (63.5%) | 19 (36.5%) |
| High School Diploma | 45 (73.8%) | 16 (26.2%) |
| College/Associate Degree | 66 (90.4%) | 7 (9.6%) |
| Bachelor's Degree or higher | 59 (89.4%) | 7 (10.6%) |
Occupancy by Age of Householder in McIntyre
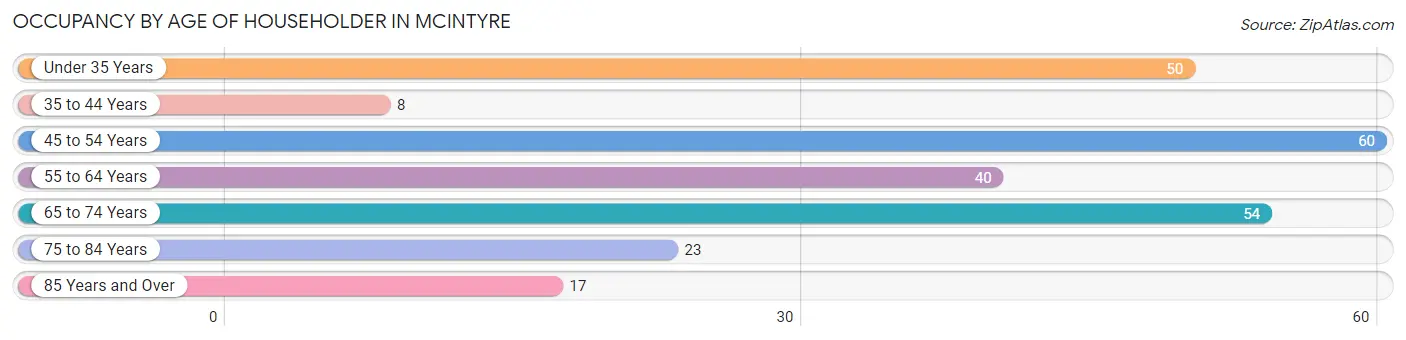
| Age Bracket | # Households | % Households |
| Under 35 Years | 50 | 19.8% |
| 35 to 44 Years | 8 | 3.2% |
| 45 to 54 Years | 60 | 23.8% |
| 55 to 64 Years | 40 | 15.9% |
| 65 to 74 Years | 54 | 21.4% |
| 75 to 84 Years | 23 | 9.1% |
| 85 Years and Over | 17 | 6.8% |
| Total | 252 | 100.0% |
Housing Finances in McIntyre
Median Income by Occupancy in McIntyre
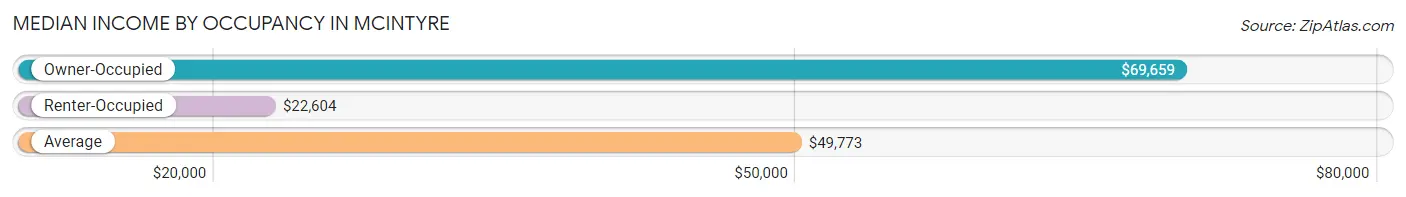
| Occupancy Type | # Households | Median Income |
| Owner-Occupied | 203 (80.6%) | $69,659 |
| Renter-Occupied | 49 (19.4%) | $22,604 |
| Average | 252 (100.0%) | $49,773 |
Occupancy by Householder Income Bracket in McIntyre
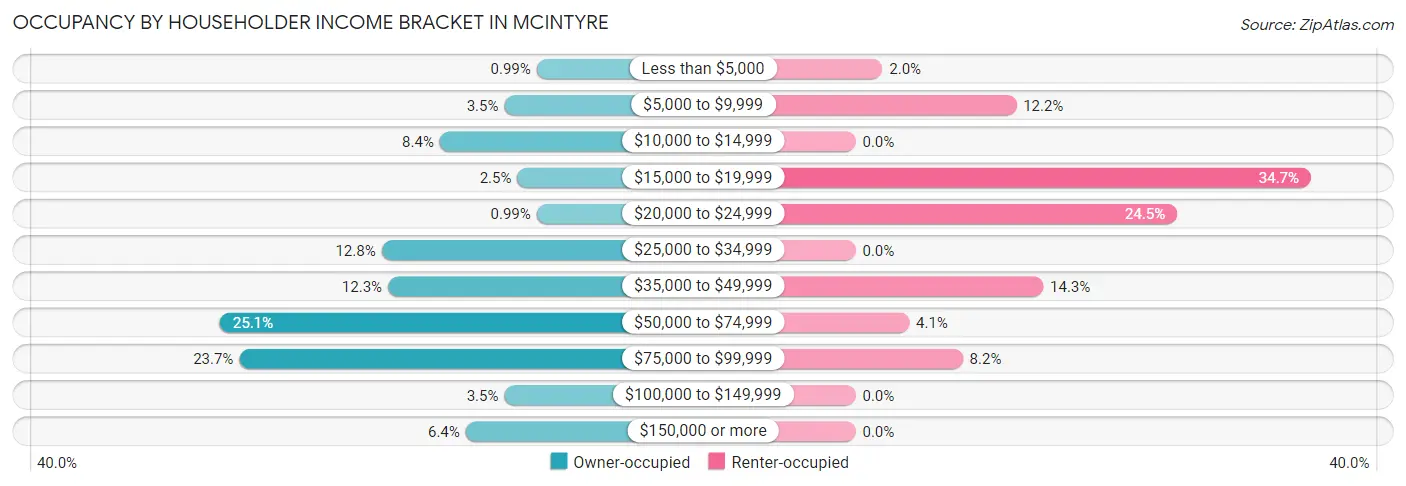
| Income Bracket | Owner-occupied | Renter-occupied |
| Less than $5,000 | 2 (1.0%) | 1 (2.0%) |
| $5,000 to $9,999 | 7 (3.5%) | 6 (12.2%) |
| $10,000 to $14,999 | 17 (8.4%) | 0 (0.0%) |
| $15,000 to $19,999 | 5 (2.5%) | 17 (34.7%) |
| $20,000 to $24,999 | 2 (1.0%) | 12 (24.5%) |
| $25,000 to $34,999 | 26 (12.8%) | 0 (0.0%) |
| $35,000 to $49,999 | 25 (12.3%) | 7 (14.3%) |
| $50,000 to $74,999 | 51 (25.1%) | 2 (4.1%) |
| $75,000 to $99,999 | 48 (23.6%) | 4 (8.2%) |
| $100,000 to $149,999 | 7 (3.5%) | 0 (0.0%) |
| $150,000 or more | 13 (6.4%) | 0 (0.0%) |
| Total | 203 (100.0%) | 49 (100.0%) |
Monthly Housing Cost Tiers in McIntyre
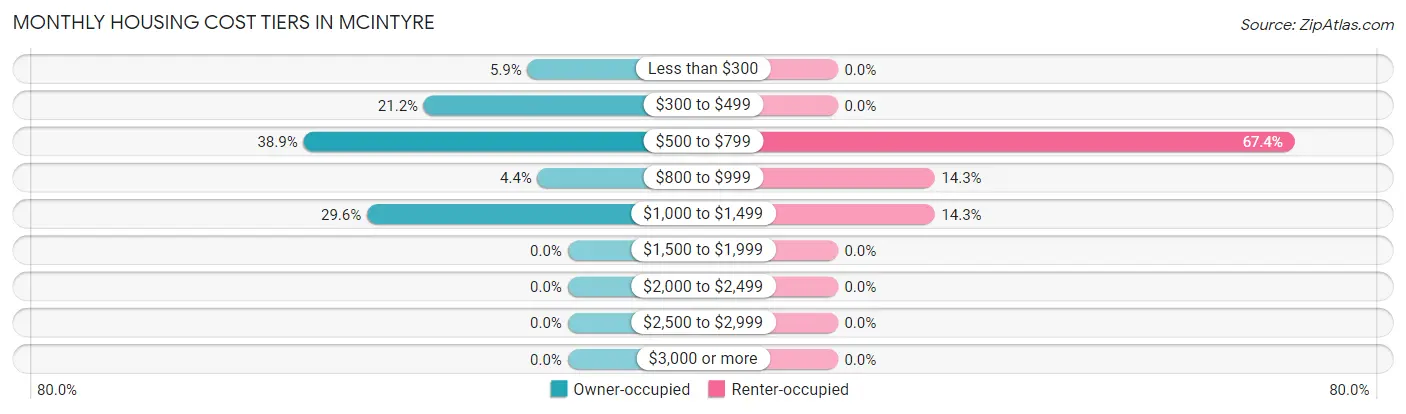
| Monthly Cost | Owner-occupied | Renter-occupied |
| Less than $300 | 12 (5.9%) | 0 (0.0%) |
| $300 to $499 | 43 (21.2%) | 0 (0.0%) |
| $500 to $799 | 79 (38.9%) | 33 (67.3%) |
| $800 to $999 | 9 (4.4%) | 7 (14.3%) |
| $1,000 to $1,499 | 60 (29.6%) | 7 (14.3%) |
| $1,500 to $1,999 | 0 (0.0%) | 0 (0.0%) |
| $2,000 to $2,499 | 0 (0.0%) | 0 (0.0%) |
| $2,500 to $2,999 | 0 (0.0%) | 0 (0.0%) |
| $3,000 or more | 0 (0.0%) | 0 (0.0%) |
| Total | 203 (100.0%) | 49 (100.0%) |
Physical Housing Characteristics in McIntyre
Housing Structures in McIntyre
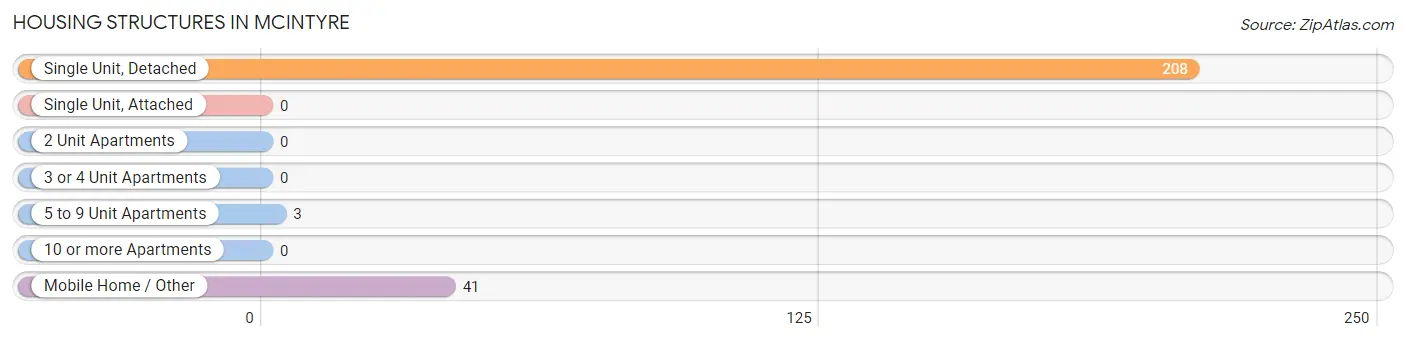
| Structure Type | # Housing Units | % Housing Units |
| Single Unit, Detached | 208 | 82.5% |
| Single Unit, Attached | 0 | 0.0% |
| 2 Unit Apartments | 0 | 0.0% |
| 3 or 4 Unit Apartments | 0 | 0.0% |
| 5 to 9 Unit Apartments | 3 | 1.2% |
| 10 or more Apartments | 0 | 0.0% |
| Mobile Home / Other | 41 | 16.3% |
| Total | 252 | 100.0% |
Housing Structures by Occupancy in McIntyre
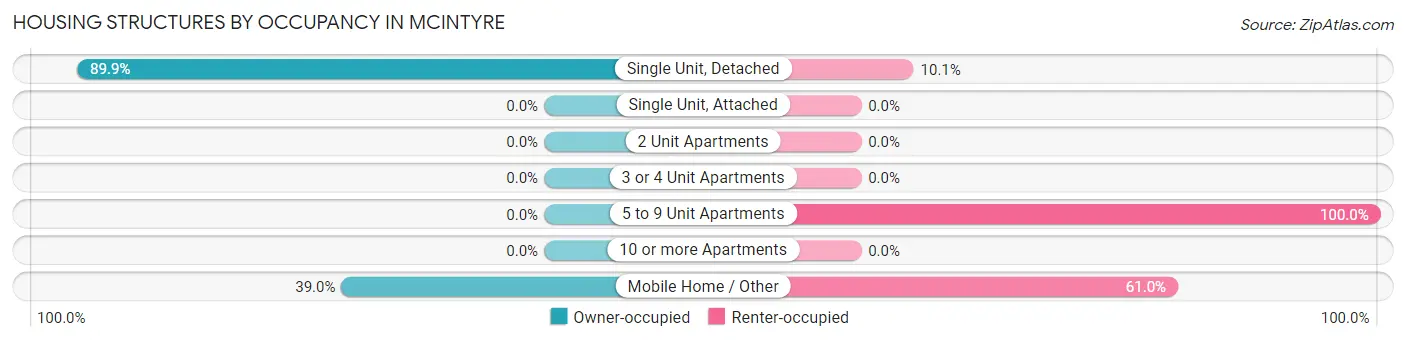
| Structure Type | Owner-occupied | Renter-occupied |
| Single Unit, Detached | 187 (89.9%) | 21 (10.1%) |
| Single Unit, Attached | 0 (0.0%) | 0 (0.0%) |
| 2 Unit Apartments | 0 (0.0%) | 0 (0.0%) |
| 3 or 4 Unit Apartments | 0 (0.0%) | 0 (0.0%) |
| 5 to 9 Unit Apartments | 0 (0.0%) | 3 (100.0%) |
| 10 or more Apartments | 0 (0.0%) | 0 (0.0%) |
| Mobile Home / Other | 16 (39.0%) | 25 (61.0%) |
| Total | 203 (80.6%) | 49 (19.4%) |
Housing Structures by Number of Rooms in McIntyre
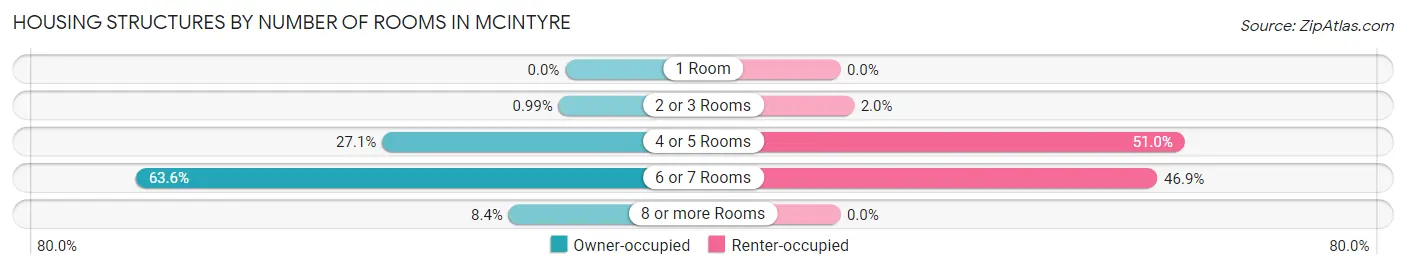
| Number of Rooms | Owner-occupied | Renter-occupied |
| 1 Room | 0 (0.0%) | 0 (0.0%) |
| 2 or 3 Rooms | 2 (1.0%) | 1 (2.0%) |
| 4 or 5 Rooms | 55 (27.1%) | 25 (51.0%) |
| 6 or 7 Rooms | 129 (63.5%) | 23 (46.9%) |
| 8 or more Rooms | 17 (8.4%) | 0 (0.0%) |
| Total | 203 (100.0%) | 49 (100.0%) |
Housing Structure by Heating Type in McIntyre
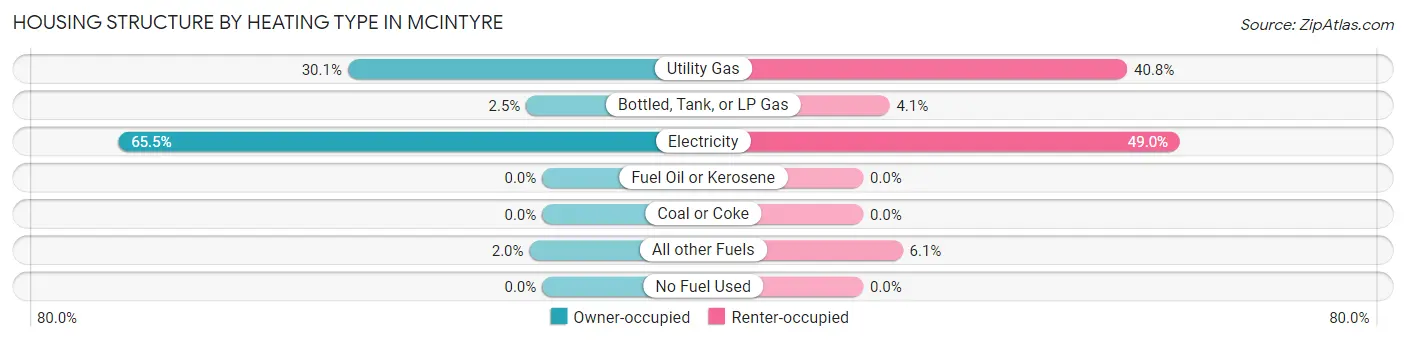
| Heating Type | Owner-occupied | Renter-occupied |
| Utility Gas | 61 (30.0%) | 20 (40.8%) |
| Bottled, Tank, or LP Gas | 5 (2.5%) | 2 (4.1%) |
| Electricity | 133 (65.5%) | 24 (49.0%) |
| Fuel Oil or Kerosene | 0 (0.0%) | 0 (0.0%) |
| Coal or Coke | 0 (0.0%) | 0 (0.0%) |
| All other Fuels | 4 (2.0%) | 3 (6.1%) |
| No Fuel Used | 0 (0.0%) | 0 (0.0%) |
| Total | 203 (100.0%) | 49 (100.0%) |
Household Vehicle Usage in McIntyre
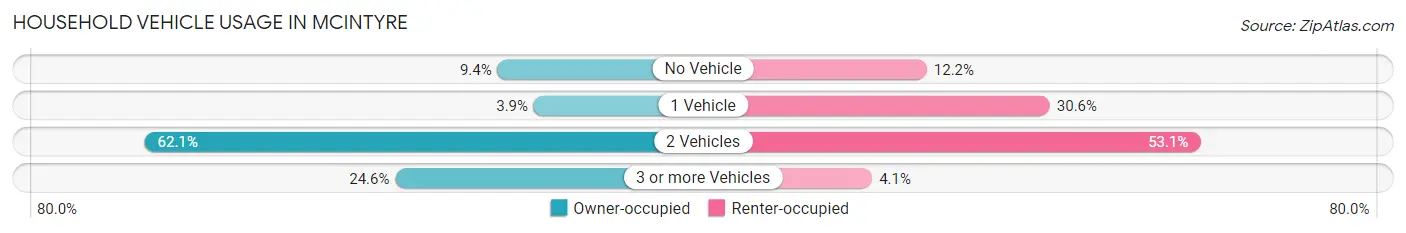
| Vehicles per Household | Owner-occupied | Renter-occupied |
| No Vehicle | 19 (9.4%) | 6 (12.2%) |
| 1 Vehicle | 8 (3.9%) | 15 (30.6%) |
| 2 Vehicles | 126 (62.1%) | 26 (53.1%) |
| 3 or more Vehicles | 50 (24.6%) | 2 (4.1%) |
| Total | 203 (100.0%) | 49 (100.0%) |
Real Estate & Mortgages in McIntyre
Real Estate and Mortgage Overview in McIntyre
| Characteristic | Without Mortgage | With Mortgage |
| Housing Units | 123 | 80 |
| Median Property Value | $97,200 | $46,700 |
| Median Household Income | - | - |
| Monthly Housing Costs | $512 | $0 |
| Real Estate Taxes | $996 | $0 |
Property Value by Mortgage Status in McIntyre
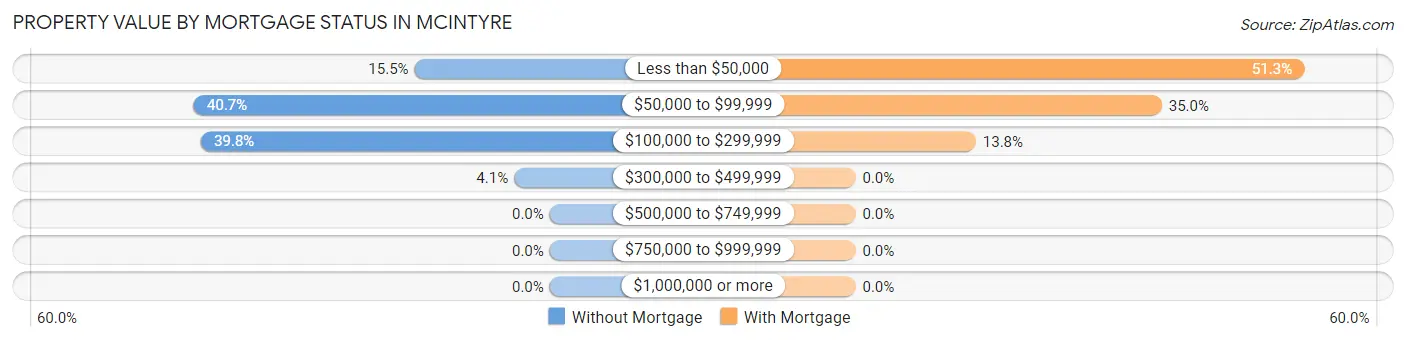
| Property Value | Without Mortgage | With Mortgage |
| Less than $50,000 | 19 (15.4%) | 41 (51.2%) |
| $50,000 to $99,999 | 50 (40.6%) | 28 (35.0%) |
| $100,000 to $299,999 | 49 (39.8%) | 11 (13.8%) |
| $300,000 to $499,999 | 5 (4.1%) | 0 (0.0%) |
| $500,000 to $749,999 | 0 (0.0%) | 0 (0.0%) |
| $750,000 to $999,999 | 0 (0.0%) | 0 (0.0%) |
| $1,000,000 or more | 0 (0.0%) | 0 (0.0%) |
| Total | 123 (100.0%) | 80 (100.0%) |
Household Income by Mortgage Status in McIntyre
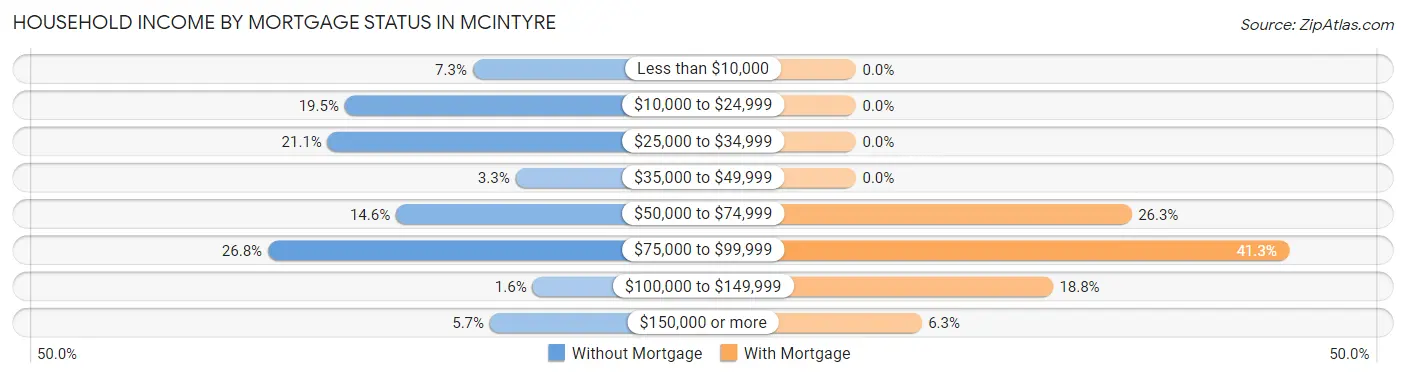
| Household Income | Without Mortgage | With Mortgage |
| Less than $10,000 | 9 (7.3%) | 0 (0.0%) |
| $10,000 to $24,999 | 24 (19.5%) | 0 (0.0%) |
| $25,000 to $34,999 | 26 (21.1%) | 0 (0.0%) |
| $35,000 to $49,999 | 4 (3.3%) | 0 (0.0%) |
| $50,000 to $74,999 | 18 (14.6%) | 21 (26.3%) |
| $75,000 to $99,999 | 33 (26.8%) | 33 (41.2%) |
| $100,000 to $149,999 | 2 (1.6%) | 15 (18.8%) |
| $150,000 or more | 7 (5.7%) | 5 (6.2%) |
| Total | 123 (100.0%) | 80 (100.0%) |
Property Value to Household Income Ratio in McIntyre
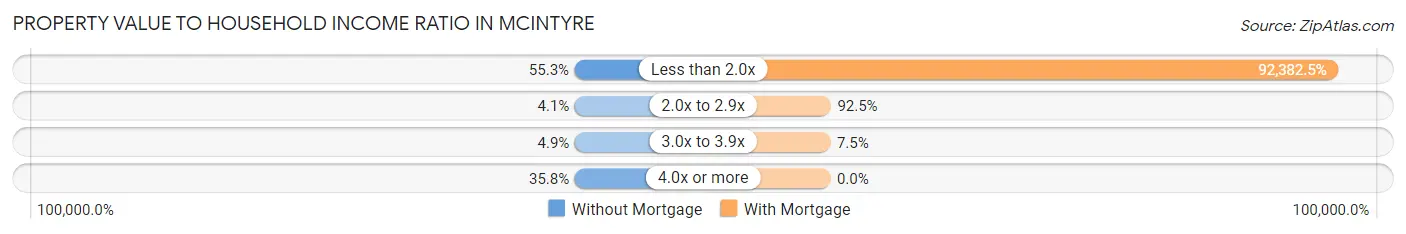
| Value-to-Income Ratio | Without Mortgage | With Mortgage |
| Less than 2.0x | 68 (55.3%) | 73,906 (92,382.5%) |
| 2.0x to 2.9x | 5 (4.1%) | 74 (92.5%) |
| 3.0x to 3.9x | 6 (4.9%) | 6 (7.5%) |
| 4.0x or more | 44 (35.8%) | 0 (0.0%) |
| Total | 123 (100.0%) | 80 (100.0%) |
Real Estate Taxes by Mortgage Status in McIntyre
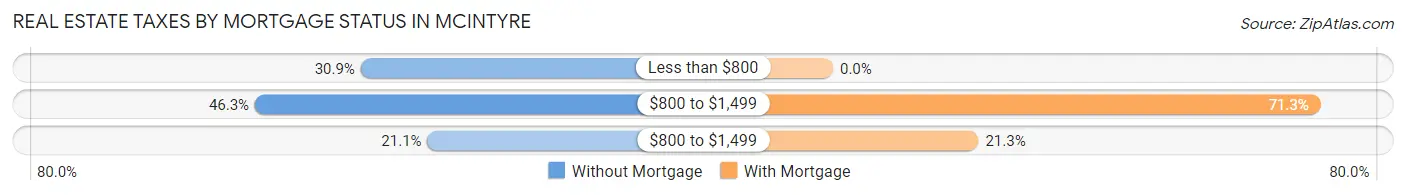
| Property Taxes | Without Mortgage | With Mortgage |
| Less than $800 | 38 (30.9%) | 0 (0.0%) |
| $800 to $1,499 | 57 (46.3%) | 57 (71.3%) |
| $800 to $1,499 | 26 (21.1%) | 17 (21.2%) |
| Total | 123 (100.0%) | 80 (100.0%) |
Health & Disability in McIntyre
Health Insurance Coverage by Age in McIntyre
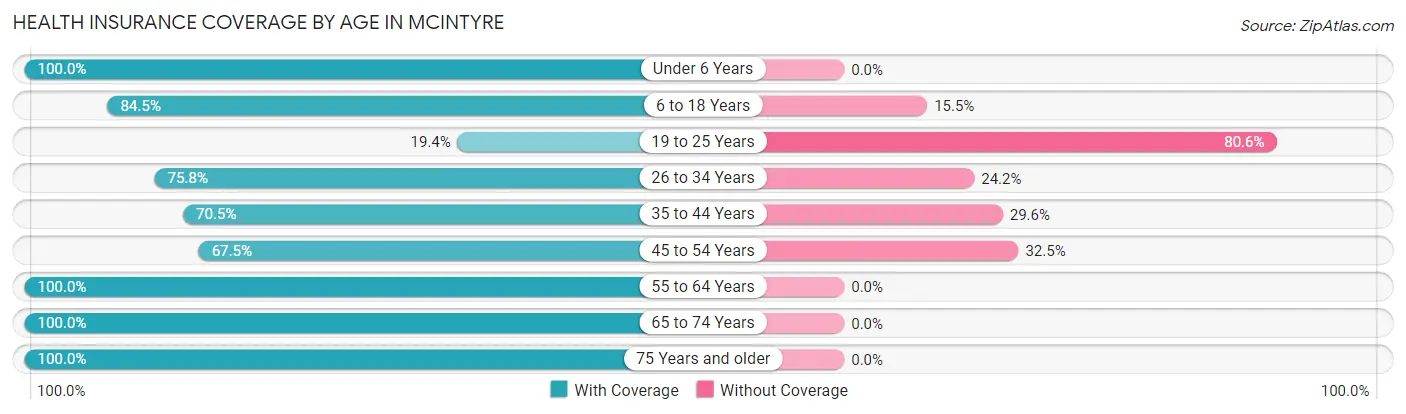
| Age Bracket | With Coverage | Without Coverage |
| Under 6 Years | 24 (100.0%) | 0 (0.0%) |
| 6 to 18 Years | 175 (84.5%) | 32 (15.5%) |
| 19 to 25 Years | 7 (19.4%) | 29 (80.6%) |
| 26 to 34 Years | 50 (75.8%) | 16 (24.2%) |
| 35 to 44 Years | 31 (70.5%) | 13 (29.5%) |
| 45 to 54 Years | 79 (67.5%) | 38 (32.5%) |
| 55 to 64 Years | 102 (100.0%) | 0 (0.0%) |
| 65 to 74 Years | 67 (100.0%) | 0 (0.0%) |
| 75 Years and older | 55 (100.0%) | 0 (0.0%) |
| Total | 590 (82.2%) | 128 (17.8%) |
Health Insurance Coverage by Citizenship Status in McIntyre
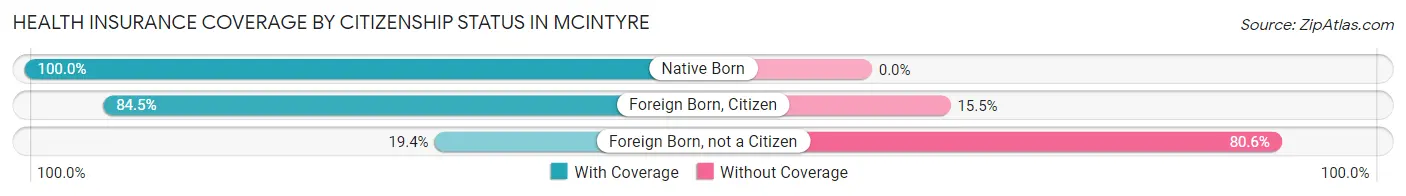
| Citizenship Status | With Coverage | Without Coverage |
| Native Born | 24 (100.0%) | 0 (0.0%) |
| Foreign Born, Citizen | 175 (84.5%) | 32 (15.5%) |
| Foreign Born, not a Citizen | 7 (19.4%) | 29 (80.6%) |
Health Insurance Coverage by Household Income in McIntyre
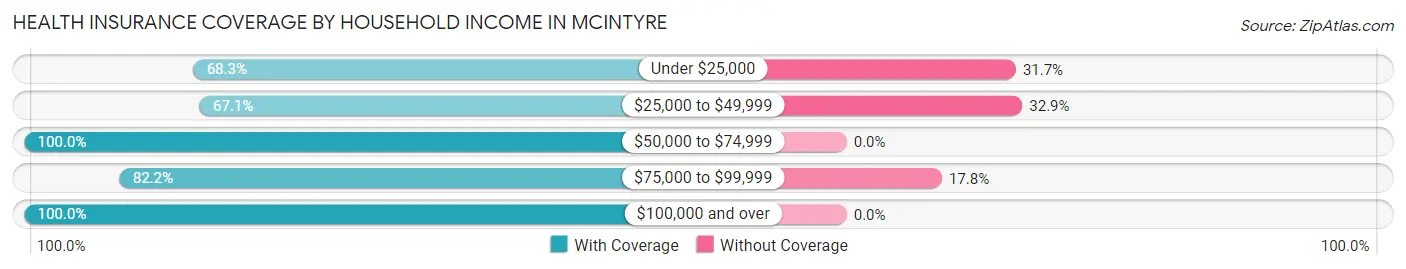
| Household Income | With Coverage | Without Coverage |
| Under $25,000 | 97 (68.3%) | 45 (31.7%) |
| $25,000 to $49,999 | 102 (67.1%) | 50 (32.9%) |
| $50,000 to $74,999 | 185 (100.0%) | 0 (0.0%) |
| $75,000 to $99,999 | 152 (82.2%) | 33 (17.8%) |
| $100,000 and over | 54 (100.0%) | 0 (0.0%) |
Public vs Private Health Insurance Coverage by Age in McIntyre
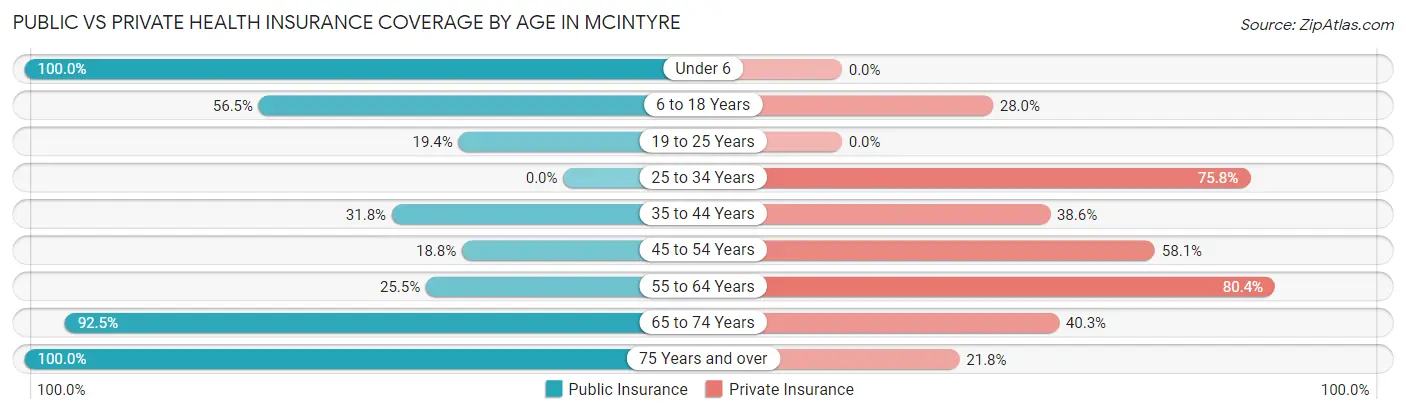
| Age Bracket | Public Insurance | Private Insurance |
| Under 6 | 24 (100.0%) | 0 (0.0%) |
| 6 to 18 Years | 117 (56.5%) | 58 (28.0%) |
| 19 to 25 Years | 7 (19.4%) | 0 (0.0%) |
| 25 to 34 Years | 0 (0.0%) | 50 (75.8%) |
| 35 to 44 Years | 14 (31.8%) | 17 (38.6%) |
| 45 to 54 Years | 22 (18.8%) | 68 (58.1%) |
| 55 to 64 Years | 26 (25.5%) | 82 (80.4%) |
| 65 to 74 Years | 62 (92.5%) | 27 (40.3%) |
| 75 Years and over | 55 (100.0%) | 12 (21.8%) |
| Total | 327 (45.5%) | 314 (43.7%) |
Disability Status by Sex by Age in McIntyre
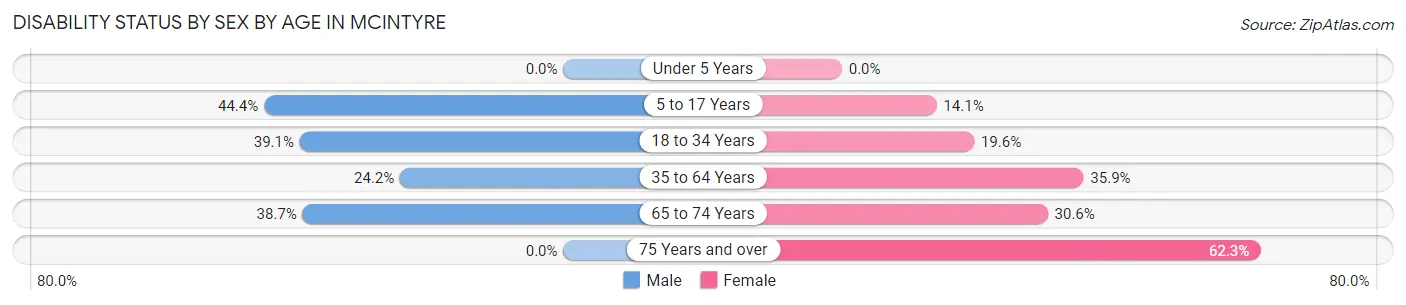
| Age Bracket | Male | Female |
| Under 5 Years | 0 (0.0%) | 0 (0.0%) |
| 5 to 17 Years | 16 (44.4%) | 9 (14.1%) |
| 18 to 34 Years | 18 (39.1%) | 32 (19.6%) |
| 35 to 64 Years | 32 (24.2%) | 47 (35.9%) |
| 65 to 74 Years | 12 (38.7%) | 11 (30.6%) |
| 75 Years and over | 0 (0.0%) | 33 (62.3%) |
Disability Class by Sex by Age in McIntyre
Disability Class: Hearing Difficulty
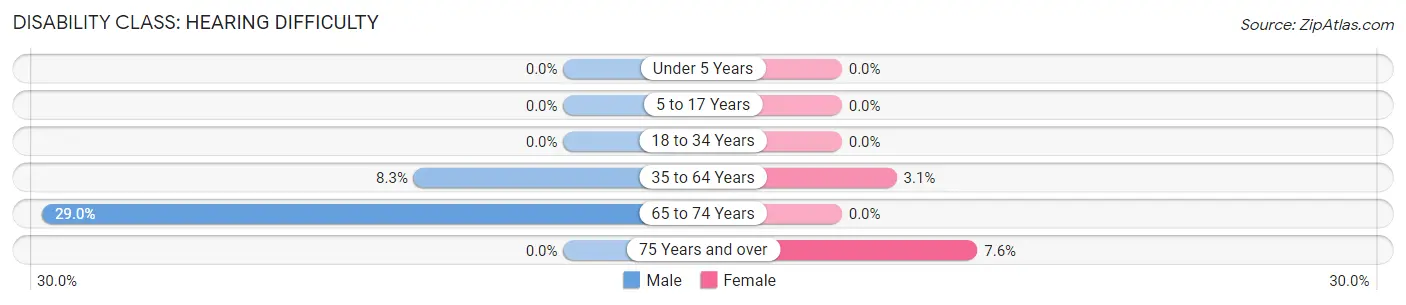
| Age Bracket | Male | Female |
| Under 5 Years | 0 (0.0%) | 0 (0.0%) |
| 5 to 17 Years | 0 (0.0%) | 0 (0.0%) |
| 18 to 34 Years | 0 (0.0%) | 0 (0.0%) |
| 35 to 64 Years | 11 (8.3%) | 4 (3.0%) |
| 65 to 74 Years | 9 (29.0%) | 0 (0.0%) |
| 75 Years and over | 0 (0.0%) | 4 (7.5%) |
Disability Class: Vision Difficulty
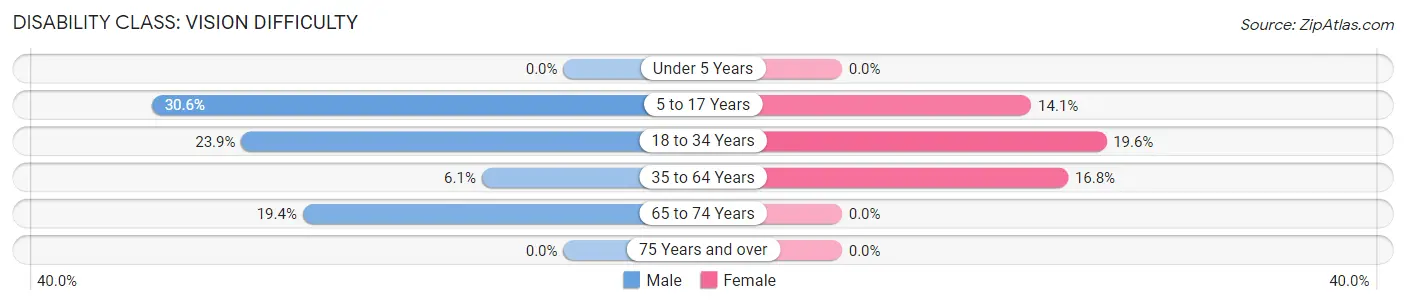
| Age Bracket | Male | Female |
| Under 5 Years | 0 (0.0%) | 0 (0.0%) |
| 5 to 17 Years | 11 (30.6%) | 9 (14.1%) |
| 18 to 34 Years | 11 (23.9%) | 32 (19.6%) |
| 35 to 64 Years | 8 (6.1%) | 22 (16.8%) |
| 65 to 74 Years | 6 (19.4%) | 0 (0.0%) |
| 75 Years and over | 0 (0.0%) | 0 (0.0%) |
Disability Class: Cognitive Difficulty
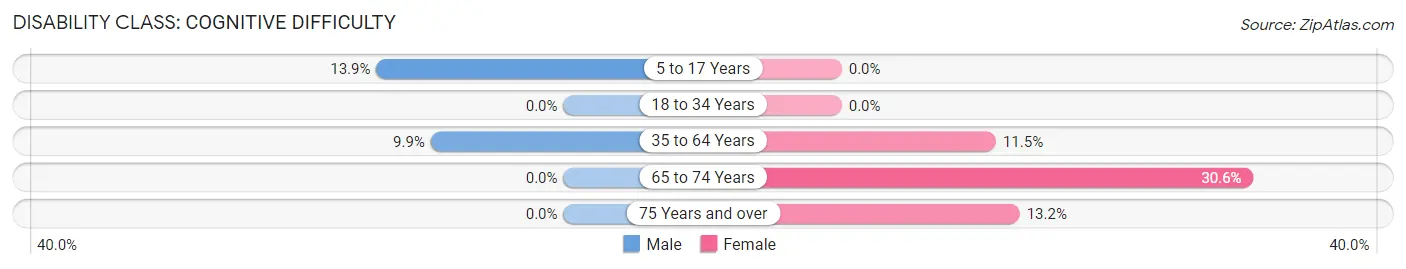
| Age Bracket | Male | Female |
| 5 to 17 Years | 5 (13.9%) | 0 (0.0%) |
| 18 to 34 Years | 0 (0.0%) | 0 (0.0%) |
| 35 to 64 Years | 13 (9.9%) | 15 (11.5%) |
| 65 to 74 Years | 0 (0.0%) | 11 (30.6%) |
| 75 Years and over | 0 (0.0%) | 7 (13.2%) |
Disability Class: Ambulatory Difficulty
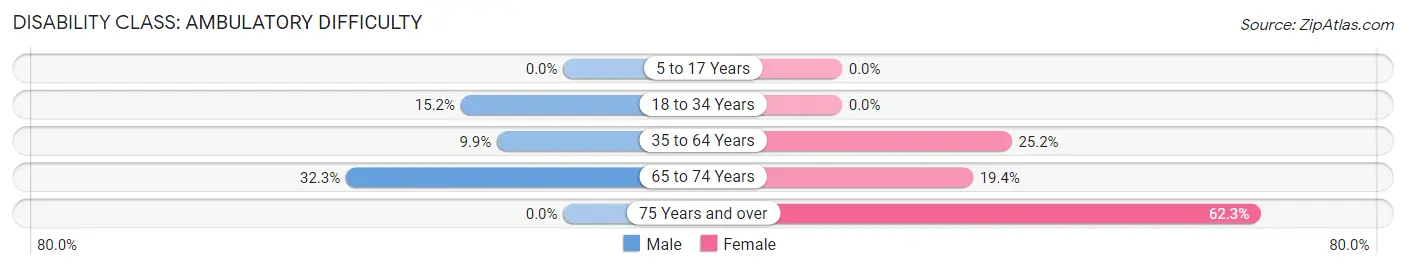
| Age Bracket | Male | Female |
| 5 to 17 Years | 0 (0.0%) | 0 (0.0%) |
| 18 to 34 Years | 7 (15.2%) | 0 (0.0%) |
| 35 to 64 Years | 13 (9.9%) | 33 (25.2%) |
| 65 to 74 Years | 10 (32.3%) | 7 (19.4%) |
| 75 Years and over | 0 (0.0%) | 33 (62.3%) |
Disability Class: Self-Care Difficulty
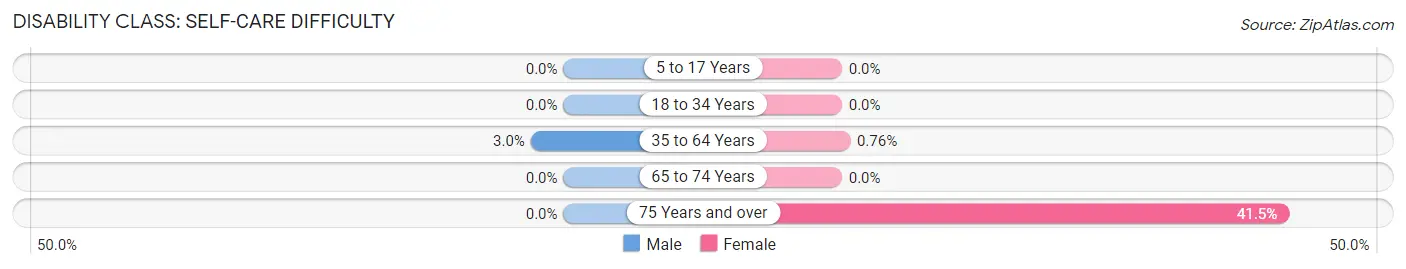
| Age Bracket | Male | Female |
| 5 to 17 Years | 0 (0.0%) | 0 (0.0%) |
| 18 to 34 Years | 0 (0.0%) | 0 (0.0%) |
| 35 to 64 Years | 4 (3.0%) | 1 (0.8%) |
| 65 to 74 Years | 0 (0.0%) | 0 (0.0%) |
| 75 Years and over | 0 (0.0%) | 22 (41.5%) |
Technology Access in McIntyre
Computing Device Access in McIntyre
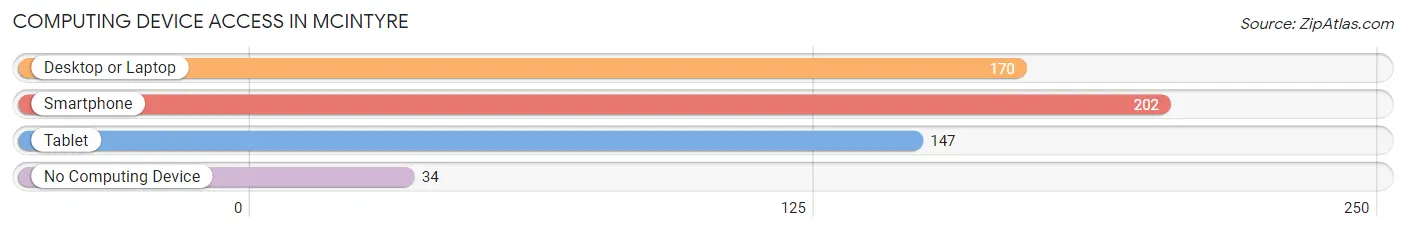
| Device Type | # Households | % Households |
| Desktop or Laptop | 170 | 67.5% |
| Smartphone | 202 | 80.2% |
| Tablet | 147 | 58.3% |
| No Computing Device | 34 | 13.5% |
| Total | 252 | 100.0% |
Internet Access in McIntyre
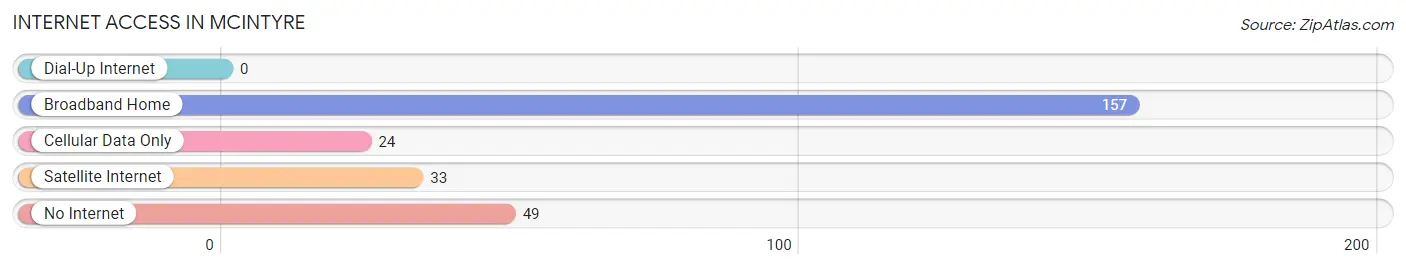
| Internet Type | # Households | % Households |
| Dial-Up Internet | 0 | 0.0% |
| Broadband Home | 157 | 62.3% |
| Cellular Data Only | 24 | 9.5% |
| Satellite Internet | 33 | 13.1% |
| No Internet | 49 | 19.4% |
| Total | 252 | 100.0% |
McIntyre Summary
McIntyre is a small town located in the state of Georgia, United States. It is situated in the southeastern part of the state, in Wilkinson County. The town was founded in 1820 and was named after a local family, the McIntyres. The population of the town was estimated to be around 1,000 in 2020.
Geography
McIntyre is located in the southeastern part of Georgia, in Wilkinson County. It is situated at an elevation of about 300 feet above sea level. The town is located on the banks of the Oconee River, which is a major tributary of the Altamaha River. The town is surrounded by a number of small towns and villages, including Gordon, Irwinton, Toomsboro, and Danville. The nearest major city is Macon, which is located about 40 miles away.
Climate
McIntyre has a humid subtropical climate, with hot and humid summers and mild winters. The average annual temperature is around 70°F, with temperatures ranging from the mid-50s in the winter to the mid-90s in the summer. The town receives an average of around 50 inches of precipitation per year, with most of it falling in the summer months.
Economy
McIntyre’s economy is largely based on agriculture. The town is home to several farms, which produce a variety of crops, including cotton, corn, soybeans, and peanuts. The town also has a number of small businesses, including restaurants, stores, and service providers.
Demographics
As of the 2010 census, the population of McIntyre was 1,000. The racial makeup of the town was 79.2% White, 17.2% African American, 0.7% Native American, 0.3% Asian, and 2.6% from other races. The median household income was $30,000, and the median age was 37.
McIntyre is a small town with a rich history and a vibrant economy. It is home to a diverse population and offers a variety of activities and attractions for visitors. The town is a great place to live, work, and play, and is a great place to visit for those looking for a unique experience in the southeastern United States.
Common Questions
What is the Total Population of McIntyre?
Total Population of McIntyre is 718.
What is the Total Male Population of McIntyre?
Total Male Population of McIntyre is 264.
What is the Total Female Population of McIntyre?
Total Female Population of McIntyre is 454.
What is the Ratio of Males per 100 Females in McIntyre?
There are 58.15 Males per 100 Females in McIntyre.
What is the Ratio of Females per 100 Males in McIntyre?
There are 171.97 Females per 100 Males in McIntyre.
What is the Median Population Age in McIntyre?
Median Population Age in McIntyre is 39.1 Years.
What is the Average Family Size in McIntyre
Average Family Size in McIntyre is 4.2 People.
What is the Average Household Size in McIntyre
Average Household Size in McIntyre is 2.9 People.
What is Per Capita Income in McIntyre?
Per Capita income in McIntyre is $23,647.
What is the Median Family Income in McIntyre?
Median Family Income in McIntyre is $72,852.
What is the Median Household income in McIntyre?
Median Household Income in McIntyre is $49,773.
What is Income or Wage Gap in McIntyre?
Income or Wage Gap in McIntyre is 20.8%.
Women in McIntyre earn 79.2 cents for every dollar earned by a man.
What is Inequality or Gini Index in McIntyre?
Inequality or Gini Index in McIntyre is 0.47.
How Large is the Labor Force in McIntyre?
There are 313 People in the Labor Forcein in McIntyre.
What is the Percentage of People in the Labor Force in McIntyre?
51.9% of People are in the Labor Force in McIntyre.