Kingsland, GA
Kingsland Map
Kingsland Overview
18,563
TOTAL POPULATION
9,419
MALE POPULATION
9,144
FEMALE POPULATION
103.01
MALES / 100 FEMALES
97.08
FEMALES / 100 MALES
33.1
MEDIAN AGE
3.1
AVG FAMILY SIZE
2.8
AVG HOUSEHOLD SIZE
$31,573
PER CAPITA INCOME
$77,819
AVG FAMILY INCOME
$73,839
AVG HOUSEHOLD INCOME
51.5%
WAGE / INCOME GAP [ % ]
48.5¢/ $1
WAGE / INCOME GAP [ $ ]
0.38
INEQUALITY / GINI INDEX
9,001
LABOR FORCE [ PEOPLE ]
64.5%
PERCENT IN LABOR FORCE
3.7%
UNEMPLOYMENT RATE
Kingsland Zip Codes
Kingsland Area Codes
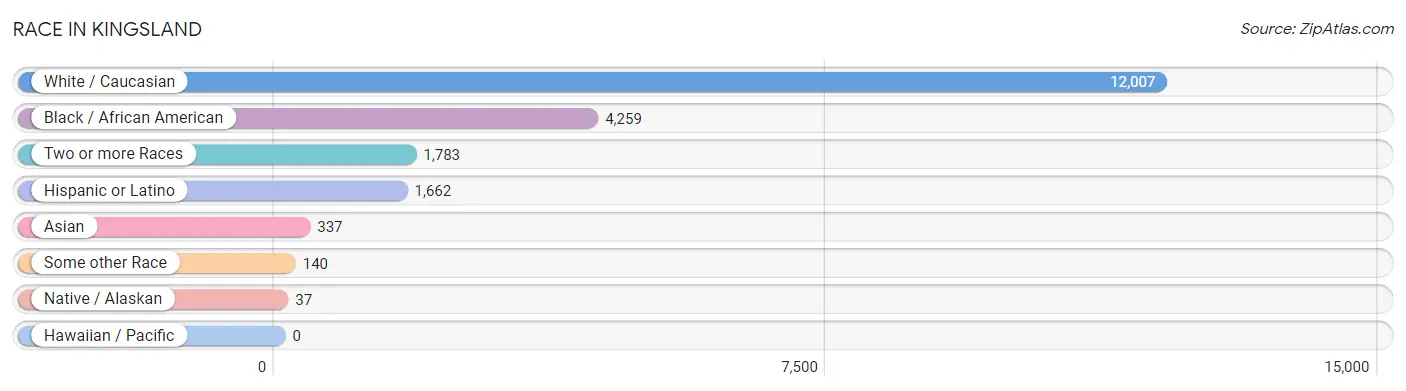
Race in Kingsland
The most populous races in Kingsland are White / Caucasian (12,007 | 64.7%), Black / African American (4,259 | 22.9%), and Two or more Races (1,783 | 9.6%).
| Race | # Population | % Population |
| Asian | 337 | 1.8% |
| Black / African American | 4,259 | 22.9% |
| Hawaiian / Pacific | 0 | 0.0% |
| Hispanic or Latino | 1,662 | 8.9% |
| Native / Alaskan | 37 | 0.2% |
| White / Caucasian | 12,007 | 64.7% |
| Two or more Races | 1,783 | 9.6% |
| Some other Race | 140 | 0.7% |
| Total | 18,563 | 100.0% |
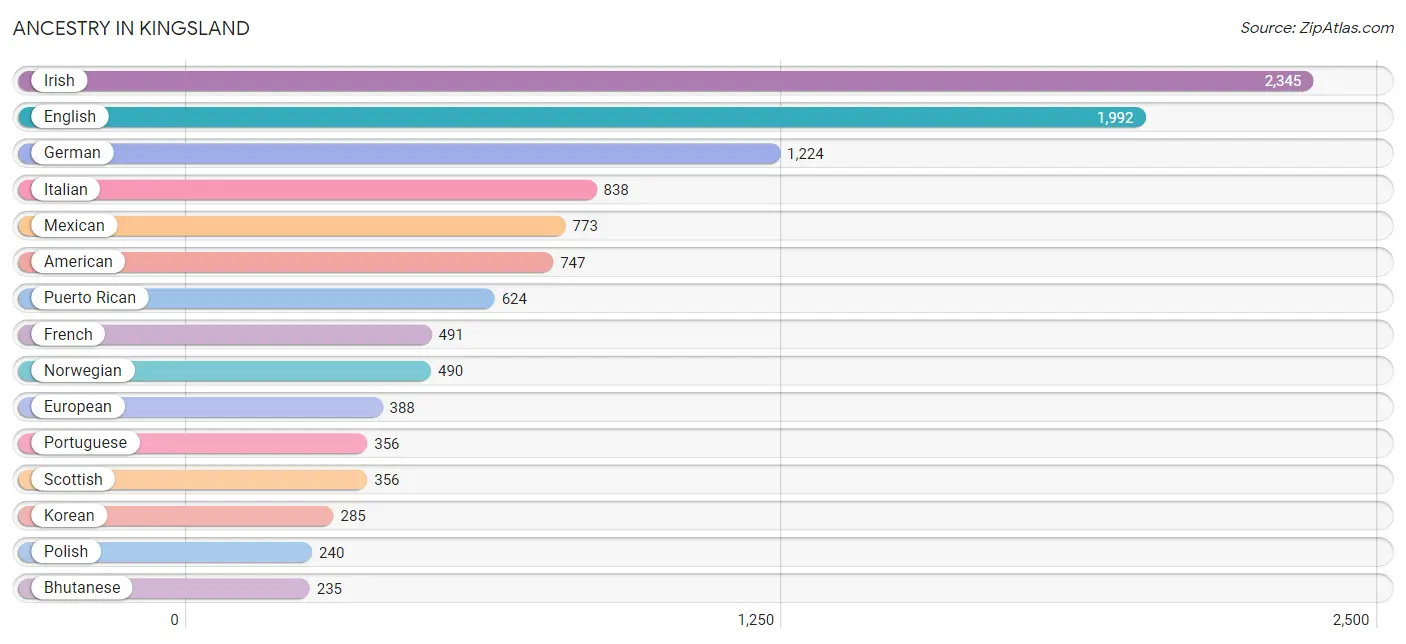
Ancestry in Kingsland
The most populous ancestries reported in Kingsland are Irish (2,345 | 12.6%), English (1,992 | 10.7%), German (1,224 | 6.6%), Italian (838 | 4.5%), and Mexican (773 | 4.2%), together accounting for 38.6% of all Kingsland residents.
| Ancestry | # Population | % Population |
| American | 747 | 4.0% |
| Australian | 16 | 0.1% |
| Austrian | 34 | 0.2% |
| Bhutanese | 235 | 1.3% |
| Blackfeet | 20 | 0.1% |
| British | 78 | 0.4% |
| Burmese | 166 | 0.9% |
| Cajun | 21 | 0.1% |
| Cherokee | 22 | 0.1% |
| Colombian | 7 | 0.0% |
| Croatian | 41 | 0.2% |
| Cuban | 64 | 0.3% |
| Czech | 114 | 0.6% |
| Dutch | 83 | 0.4% |
| Eastern European | 70 | 0.4% |
| English | 1,992 | 10.7% |
| European | 388 | 2.1% |
| Finnish | 69 | 0.4% |
| French | 491 | 2.6% |
| French Canadian | 141 | 0.8% |
| German | 1,224 | 6.6% |
| Greek | 15 | 0.1% |
| Hungarian | 31 | 0.2% |
| Indian (Asian) | 193 | 1.0% |
| Irish | 2,345 | 12.6% |
| Italian | 838 | 4.5% |
| Jamaican | 6 | 0.0% |
| Korean | 285 | 1.5% |
| Lumbee | 21 | 0.1% |
| Mexican | 773 | 4.2% |
| Nigerian | 9 | 0.1% |
| Northern European | 27 | 0.2% |
| Norwegian | 490 | 2.6% |
| Polish | 240 | 1.3% |
| Portuguese | 356 | 1.9% |
| Puerto Rican | 624 | 3.4% |
| Romanian | 13 | 0.1% |
| Russian | 17 | 0.1% |
| Scandinavian | 47 | 0.3% |
| Scotch-Irish | 155 | 0.8% |
| Scottish | 356 | 1.9% |
| Slovene | 82 | 0.4% |
| South American | 66 | 0.4% |
| Spaniard | 135 | 0.7% |
| Sri Lankan | 46 | 0.3% |
| Subsaharan African | 30 | 0.2% |
| Swedish | 14 | 0.1% |
| Thai | 15 | 0.1% |
| Turkish | 33 | 0.2% |
| Ukrainian | 38 | 0.2% |
| Uruguayan | 40 | 0.2% |
| Venezuelan | 19 | 0.1% |
| Welsh | 22 | 0.1% |
| Yakama | 25 | 0.1% | View All 54 Rows |
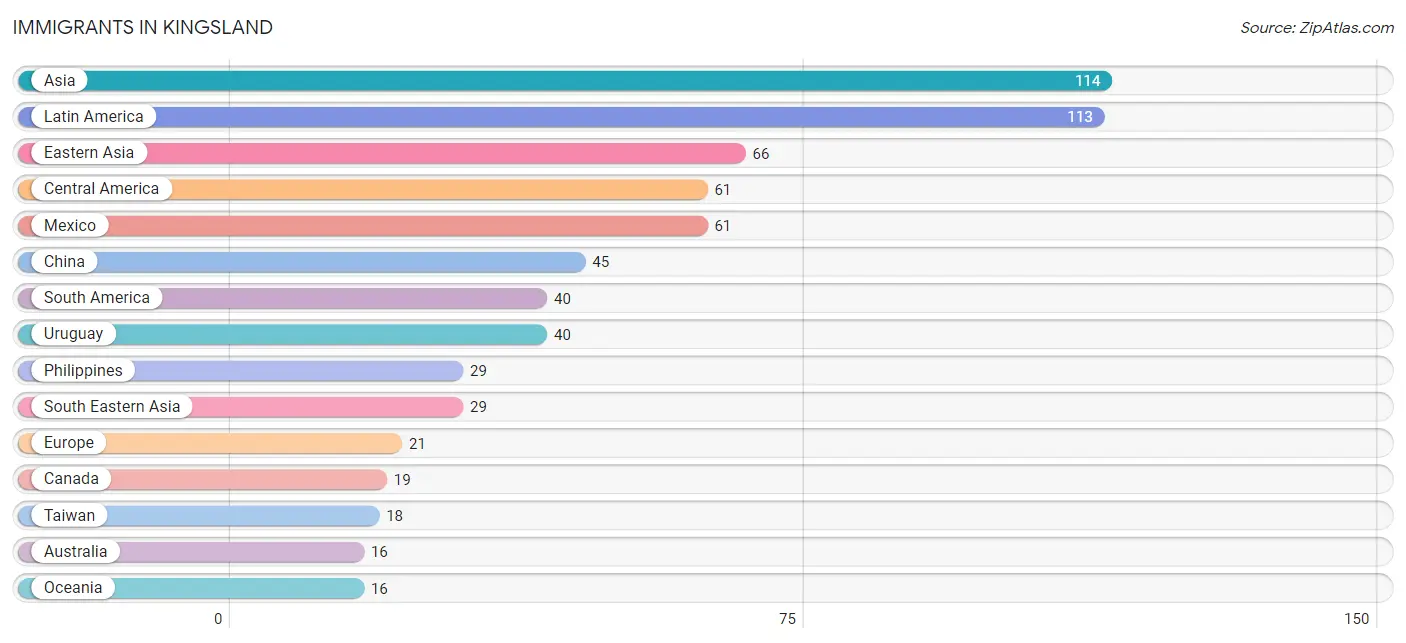
Immigrants in Kingsland
The most numerous immigrant groups reported in Kingsland came from Asia (114 | 0.6%), Latin America (113 | 0.6%), Eastern Asia (66 | 0.4%), Central America (61 | 0.3%), and Mexico (61 | 0.3%), together accounting for 2.2% of all Kingsland residents.
| Immigration Origin | # Population | % Population |
| Asia | 114 | 0.6% |
| Australia | 16 | 0.1% |
| Canada | 19 | 0.1% |
| Caribbean | 12 | 0.1% |
| Central America | 61 | 0.3% |
| China | 45 | 0.2% |
| Cuba | 9 | 0.1% |
| Eastern Asia | 66 | 0.4% |
| Europe | 21 | 0.1% |
| India | 3 | 0.0% |
| Japan | 12 | 0.1% |
| Korea | 9 | 0.1% |
| Latin America | 113 | 0.6% |
| Mexico | 61 | 0.3% |
| Netherlands | 13 | 0.1% |
| Northern Europe | 8 | 0.0% |
| Oceania | 16 | 0.1% |
| Philippines | 29 | 0.2% |
| Scotland | 8 | 0.0% |
| South America | 40 | 0.2% |
| South Central Asia | 3 | 0.0% |
| South Eastern Asia | 29 | 0.2% |
| Taiwan | 18 | 0.1% |
| Trinidad and Tobago | 3 | 0.0% |
| Turkey | 16 | 0.1% |
| Uruguay | 40 | 0.2% |
| Western Asia | 16 | 0.1% |
| Western Europe | 13 | 0.1% | View All 28 Rows |
Sex and Age in Kingsland
Sex and Age in Kingsland
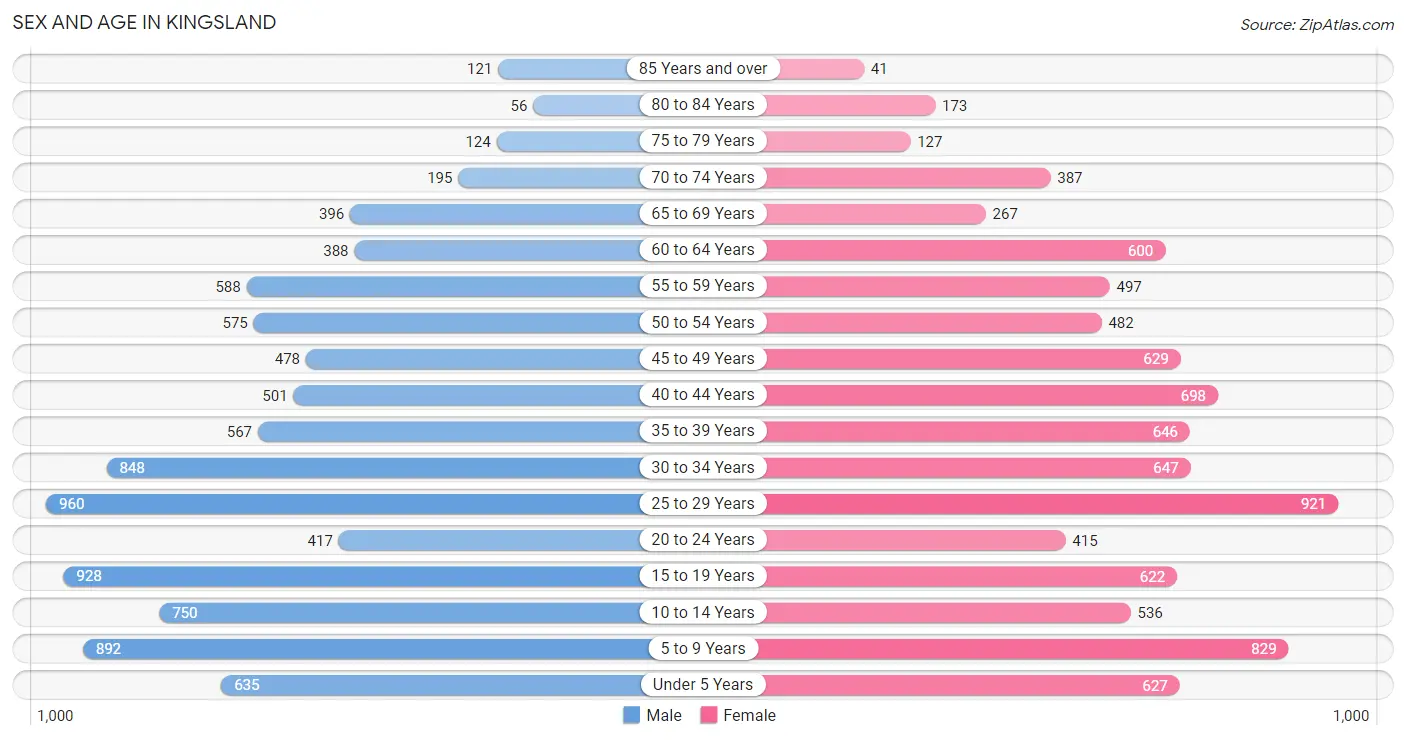
The most populous age groups in Kingsland are 25 to 29 Years (960 | 10.2%) for men and 25 to 29 Years (921 | 10.1%) for women.
| Age Bracket | Male | Female |
| Under 5 Years | 635 (6.7%) | 627 (6.9%) |
| 5 to 9 Years | 892 (9.5%) | 829 (9.1%) |
| 10 to 14 Years | 750 (8.0%) | 536 (5.9%) |
| 15 to 19 Years | 928 (9.9%) | 622 (6.8%) |
| 20 to 24 Years | 417 (4.4%) | 415 (4.5%) |
| 25 to 29 Years | 960 (10.2%) | 921 (10.1%) |
| 30 to 34 Years | 848 (9.0%) | 647 (7.1%) |
| 35 to 39 Years | 567 (6.0%) | 646 (7.1%) |
| 40 to 44 Years | 501 (5.3%) | 698 (7.6%) |
| 45 to 49 Years | 478 (5.1%) | 629 (6.9%) |
| 50 to 54 Years | 575 (6.1%) | 482 (5.3%) |
| 55 to 59 Years | 588 (6.2%) | 497 (5.4%) |
| 60 to 64 Years | 388 (4.1%) | 600 (6.6%) |
| 65 to 69 Years | 396 (4.2%) | 267 (2.9%) |
| 70 to 74 Years | 195 (2.1%) | 387 (4.2%) |
| 75 to 79 Years | 124 (1.3%) | 127 (1.4%) |
| 80 to 84 Years | 56 (0.6%) | 173 (1.9%) |
| 85 Years and over | 121 (1.3%) | 41 (0.4%) |
| Total | 9,419 (100.0%) | 9,144 (100.0%) |
Families and Households in Kingsland
Median Family Size in Kingsland
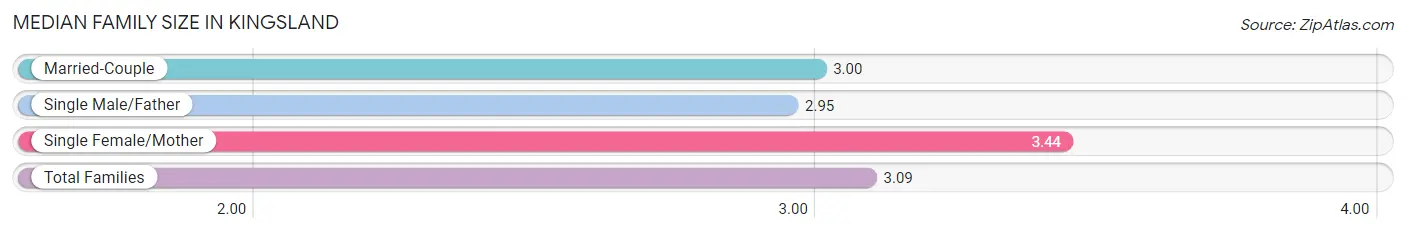
The median family size in Kingsland is 3.09 persons per family, with single female/mother families (1,082 | 22.2%) accounting for the largest median family size of 3.44 persons per family. On the other hand, single male/father families (471 | 9.6%) represent the smallest median family size with 2.95 persons per family.
| Family Type | # Families | Family Size |
| Married-Couple | 3,332 (68.2%) | 3.00 |
| Single Male/Father | 471 (9.6%) | 2.95 |
| Single Female/Mother | 1,082 (22.2%) | 3.44 |
| Total Families | 4,885 (100.0%) | 3.09 |
Median Household Size in Kingsland
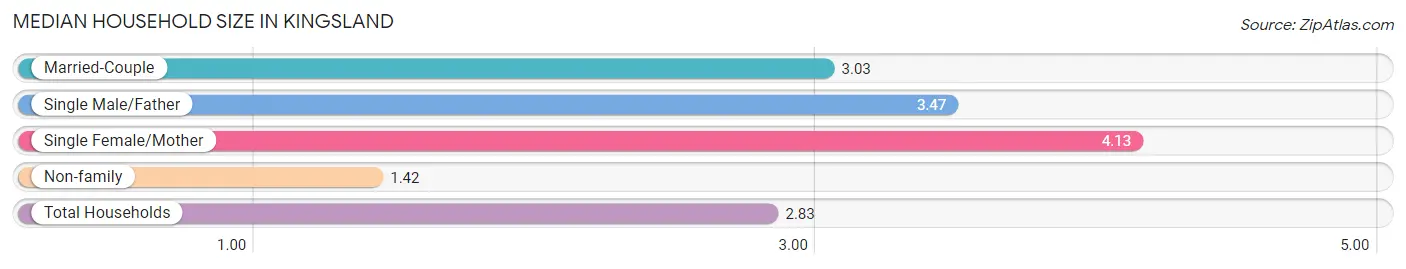
The median household size in Kingsland is 2.83 persons per household, with single female/mother households (1,082 | 16.5%) accounting for the largest median household size of 4.13 persons per household. non-family households (1,676 | 25.5%) represent the smallest median household size with 1.42 persons per household.
| Household Type | # Households | Household Size |
| Married-Couple | 3,332 (50.8%) | 3.03 |
| Single Male/Father | 471 (7.2%) | 3.47 |
| Single Female/Mother | 1,082 (16.5%) | 4.13 |
| Non-family | 1,676 (25.5%) | 1.42 |
| Total Households | 6,561 (100.0%) | 2.83 |
Household Size by Marriage Status in Kingsland
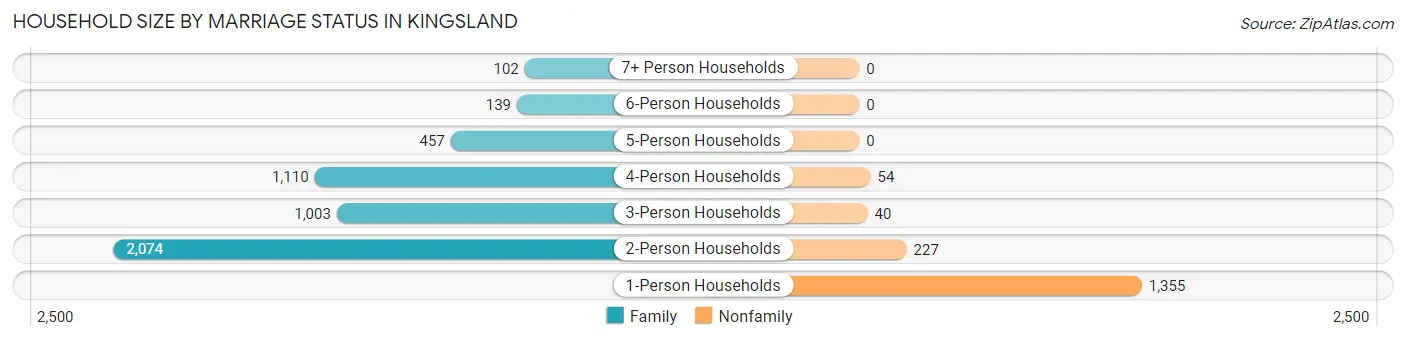
Out of a total of 6,561 households in Kingsland, 4,885 (74.5%) are family households, while 1,676 (25.5%) are nonfamily households. The most numerous type of family households are 2-person households, comprising 2,074, and the most common type of nonfamily households are 1-person households, comprising 1,355.
| Household Size | Family Households | Nonfamily Households |
| 1-Person Households | - | 1,355 (20.6%) |
| 2-Person Households | 2,074 (31.6%) | 227 (3.5%) |
| 3-Person Households | 1,003 (15.3%) | 40 (0.6%) |
| 4-Person Households | 1,110 (16.9%) | 54 (0.8%) |
| 5-Person Households | 457 (7.0%) | 0 (0.0%) |
| 6-Person Households | 139 (2.1%) | 0 (0.0%) |
| 7+ Person Households | 102 (1.5%) | 0 (0.0%) |
| Total | 4,885 (74.5%) | 1,676 (25.5%) |
Female Fertility in Kingsland
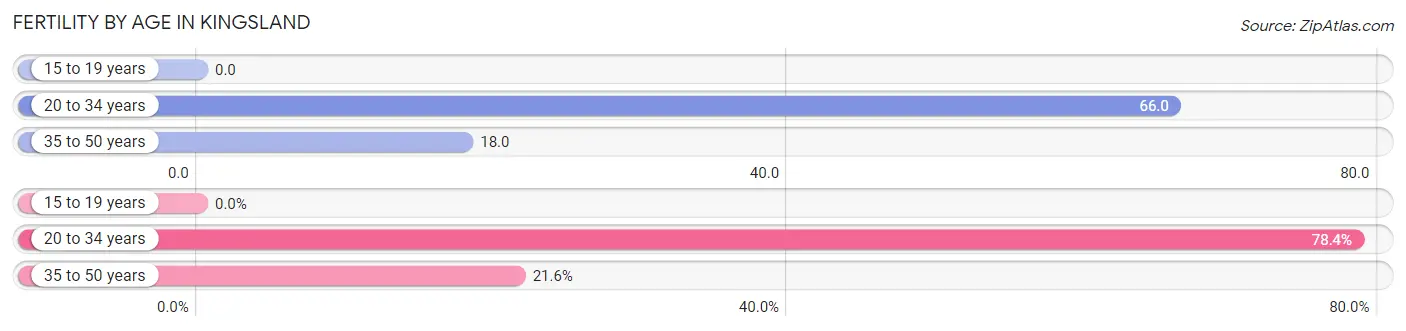
Fertility by Age in Kingsland
Average fertility rate in Kingsland is 36.0 births per 1,000 women. Women in the age bracket of 20 to 34 years have the highest fertility rate with 66.0 births per 1,000 women. Women in the age bracket of 20 to 34 years acount for 78.4% of all women with births.
| Age Bracket | Women with Births | Births / 1,000 Women |
| 15 to 19 years | 0 (0.0%) | 0.0 |
| 20 to 34 years | 131 (78.4%) | 66.0 |
| 35 to 50 years | 36 (21.6%) | 18.0 |
| Total | 167 (100.0%) | 36.0 |
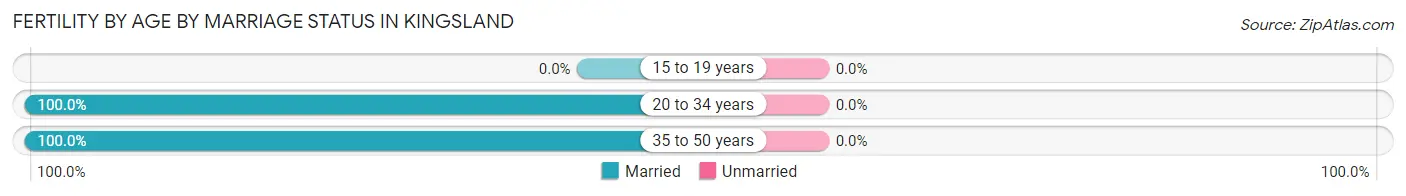
Fertility by Age by Marriage Status in Kingsland
| Age Bracket | Married | Unmarried |
| 15 to 19 years | 0 (0.0%) | 0 (0.0%) |
| 20 to 34 years | 131 (100.0%) | 0 (0.0%) |
| 35 to 50 years | 36 (100.0%) | 0 (0.0%) |
| Total | 167 (100.0%) | 0 (0.0%) |
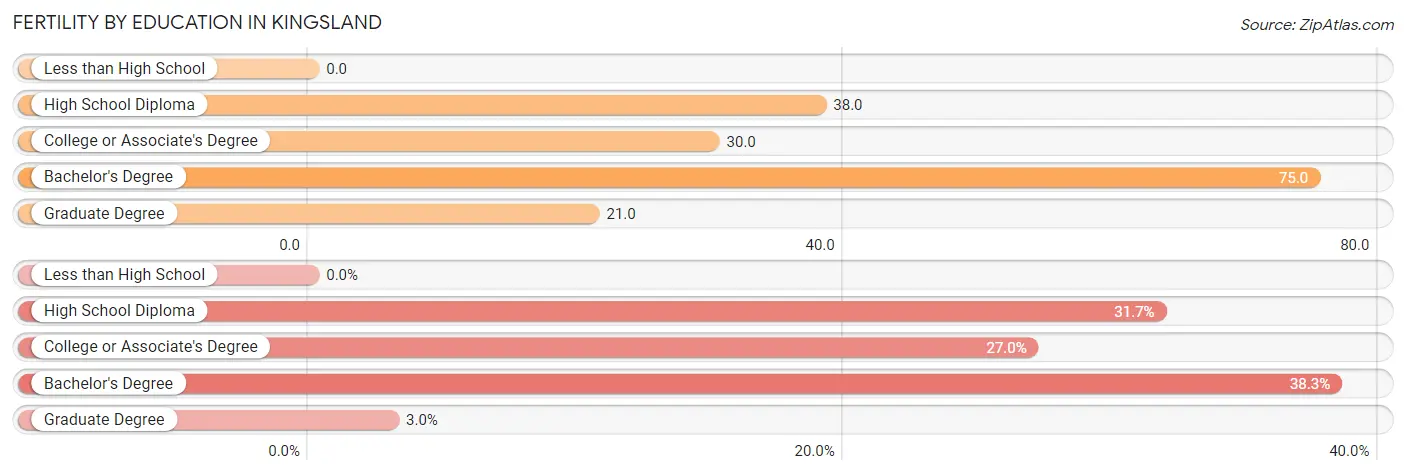
Fertility by Education in Kingsland
| Educational Attainment | Women with Births | Births / 1,000 Women |
| Less than High School | 0 (0.0%) | 0.0 |
| High School Diploma | 53 (31.7%) | 38.0 |
| College or Associate's Degree | 45 (27.0%) | 30.0 |
| Bachelor's Degree | 64 (38.3%) | 75.0 |
| Graduate Degree | 5 (3.0%) | 21.0 |
| Total | 167 (100.0%) | 36.0 |
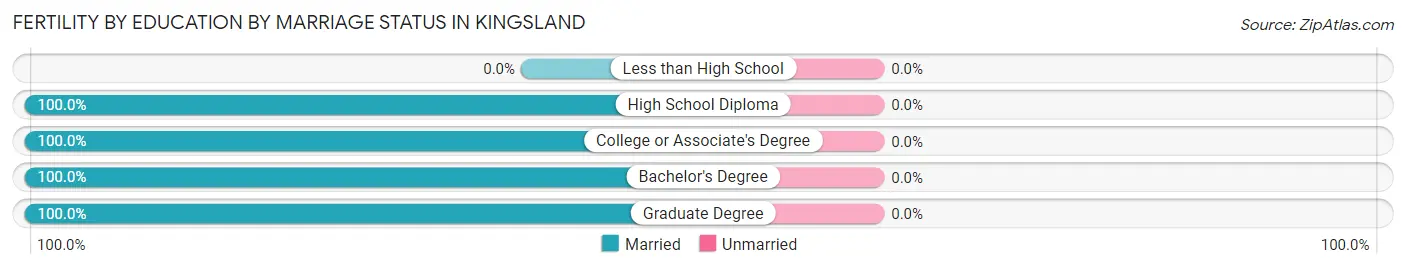
Fertility by Education by Marriage Status in Kingsland
| Educational Attainment | Married | Unmarried |
| Less than High School | 0 (0.0%) | 0 (0.0%) |
| High School Diploma | 53 (100.0%) | 0 (0.0%) |
| College or Associate's Degree | 45 (100.0%) | 0 (0.0%) |
| Bachelor's Degree | 64 (100.0%) | 0 (0.0%) |
| Graduate Degree | 5 (100.0%) | 0 (0.0%) |
| Total | 167 (100.0%) | 0 (0.0%) |
Income in Kingsland
Income Overview in Kingsland
Per Capita Income in Kingsland is $31,573, while median incomes of families and households are $77,819 and $73,839 respectively.
| Characteristic | Number | Measure |
| Per Capita Income | 18,563 | $31,573 |
| Median Family Income | 4,885 | $77,819 |
| Mean Family Income | 4,885 | $89,130 |
| Median Household Income | 6,561 | $73,839 |
| Mean Household Income | 6,561 | $83,560 |
| Income Deficit | 4,885 | $0 |
| Wage / Income Gap (%) | 18,563 | 51.50% |
| Wage / Income Gap ($) | 18,563 | 48.50¢ per $1 |
| Gini / Inequality Index | 18,563 | 0.38 |
Earnings by Sex in Kingsland
Average Earnings in Kingsland are $45,423, $56,183 for men and $27,246 for women, a difference of 51.5%.
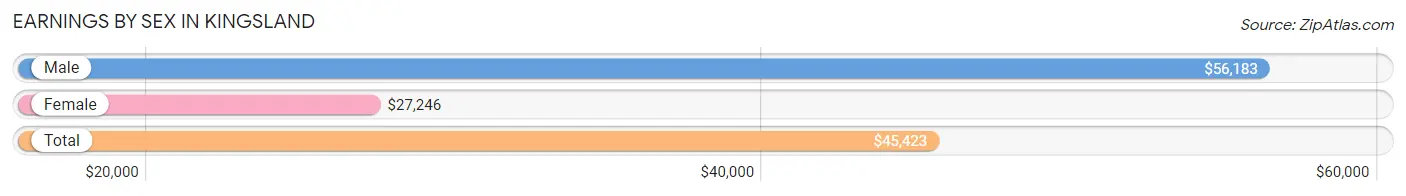
| Sex | Number | Average Earnings |
| Male | 5,293 (55.8%) | $56,183 |
| Female | 4,194 (44.2%) | $27,246 |
| Total | 9,487 (100.0%) | $45,423 |
Earnings by Sex by Income Bracket in Kingsland
The most common earnings brackets in Kingsland are $75,000 to $99,999 for men (1,030 | 19.5%) and $20,000 to $22,499 for women (475 | 11.3%).
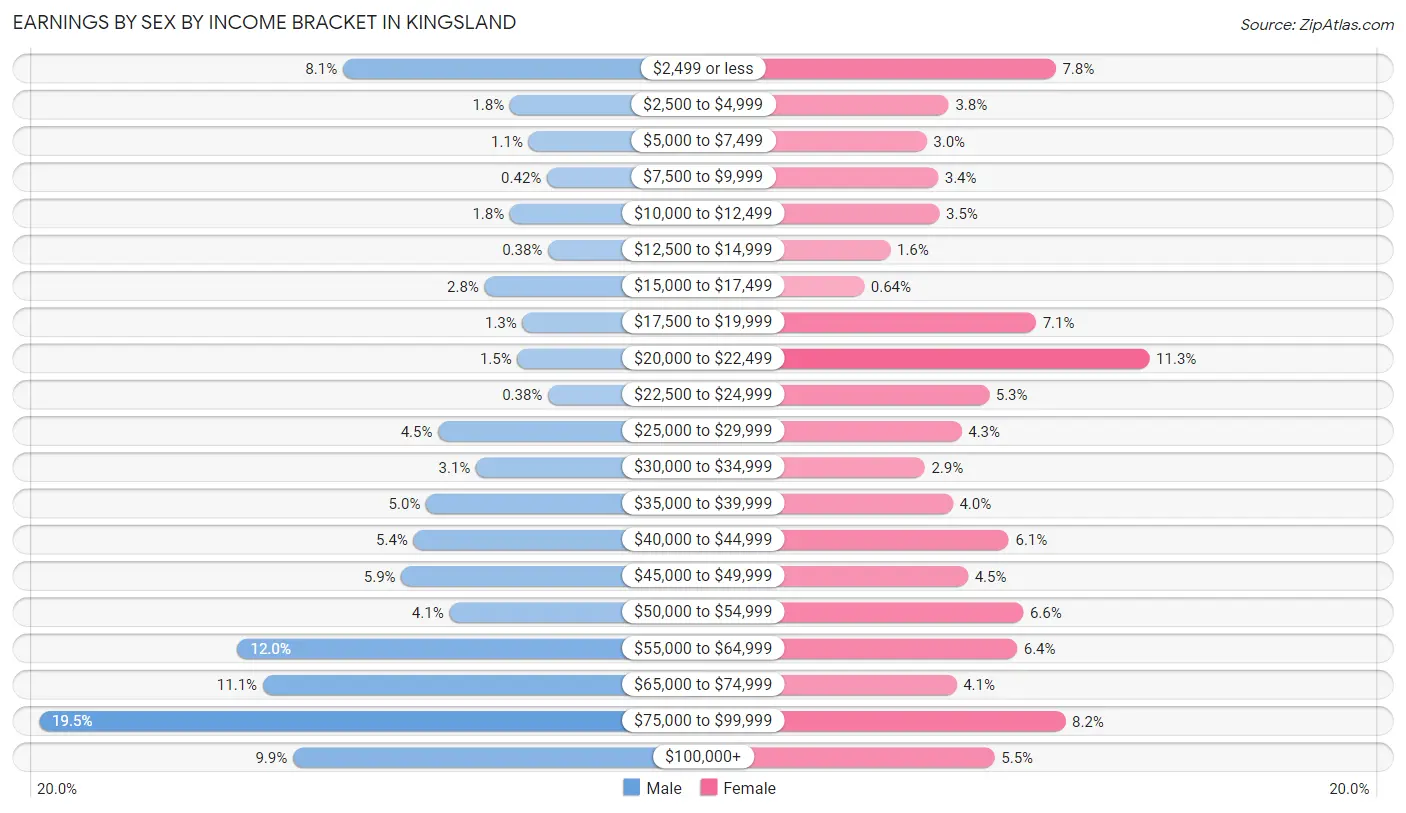
| Income | Male | Female |
| $2,499 or less | 427 (8.1%) | 328 (7.8%) |
| $2,500 to $4,999 | 96 (1.8%) | 160 (3.8%) |
| $5,000 to $7,499 | 59 (1.1%) | 125 (3.0%) |
| $7,500 to $9,999 | 22 (0.4%) | 143 (3.4%) |
| $10,000 to $12,499 | 96 (1.8%) | 145 (3.5%) |
| $12,500 to $14,999 | 20 (0.4%) | 68 (1.6%) |
| $15,000 to $17,499 | 146 (2.8%) | 27 (0.6%) |
| $17,500 to $19,999 | 71 (1.3%) | 297 (7.1%) |
| $20,000 to $22,499 | 81 (1.5%) | 475 (11.3%) |
| $22,500 to $24,999 | 20 (0.4%) | 223 (5.3%) |
| $25,000 to $29,999 | 238 (4.5%) | 180 (4.3%) |
| $30,000 to $34,999 | 163 (3.1%) | 122 (2.9%) |
| $35,000 to $39,999 | 262 (5.0%) | 166 (4.0%) |
| $40,000 to $44,999 | 287 (5.4%) | 254 (6.1%) |
| $45,000 to $49,999 | 311 (5.9%) | 190 (4.5%) |
| $50,000 to $54,999 | 216 (4.1%) | 277 (6.6%) |
| $55,000 to $64,999 | 636 (12.0%) | 267 (6.4%) |
| $65,000 to $74,999 | 586 (11.1%) | 172 (4.1%) |
| $75,000 to $99,999 | 1,030 (19.5%) | 343 (8.2%) |
| $100,000+ | 526 (9.9%) | 232 (5.5%) |
| Total | 5,293 (100.0%) | 4,194 (100.0%) |
Earnings by Sex by Educational Attainment in Kingsland
Average earnings in Kingsland are $58,717 for men and $37,171 for women, a difference of 36.7%. Men with an educational attainment of bachelor's degree enjoy the highest average annual earnings of $76,477, while those with less than high school education earn the least with $46,371. Women with an educational attainment of graduate degree earn the most with the average annual earnings of $76,176, while those with less than high school education have the smallest earnings of $21,230.
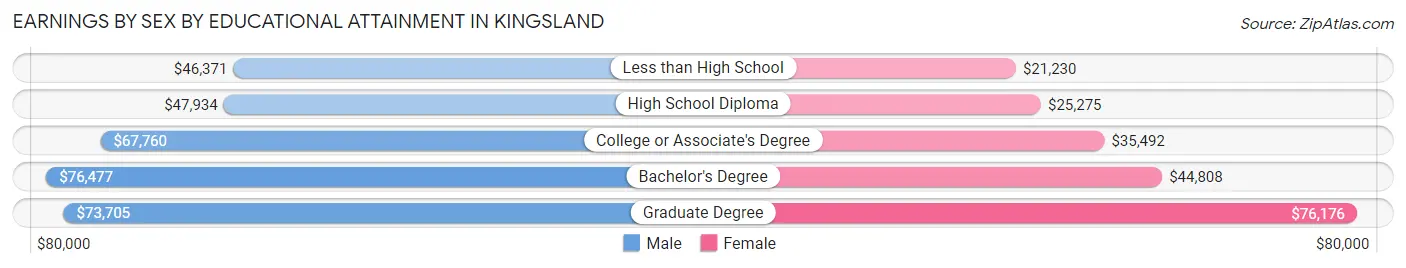
| Educational Attainment | Male Income | Female Income |
| Less than High School | $46,371 | $21,230 |
| High School Diploma | $47,934 | $25,275 |
| College or Associate's Degree | $67,760 | $35,492 |
| Bachelor's Degree | $76,477 | $44,808 |
| Graduate Degree | $73,705 | $76,176 |
| Total | $58,717 | $37,171 |
Family Income in Kingsland
Family Income Brackets in Kingsland
According to the Kingsland family income data, there are 987 families falling into the $100,000 to $149,999 income range, which is the most common income bracket and makes up 20.2% of all families. Conversely, the $10,000 to $14,999 income bracket is the least frequent group with only 24 families (0.5%) belonging to this category.
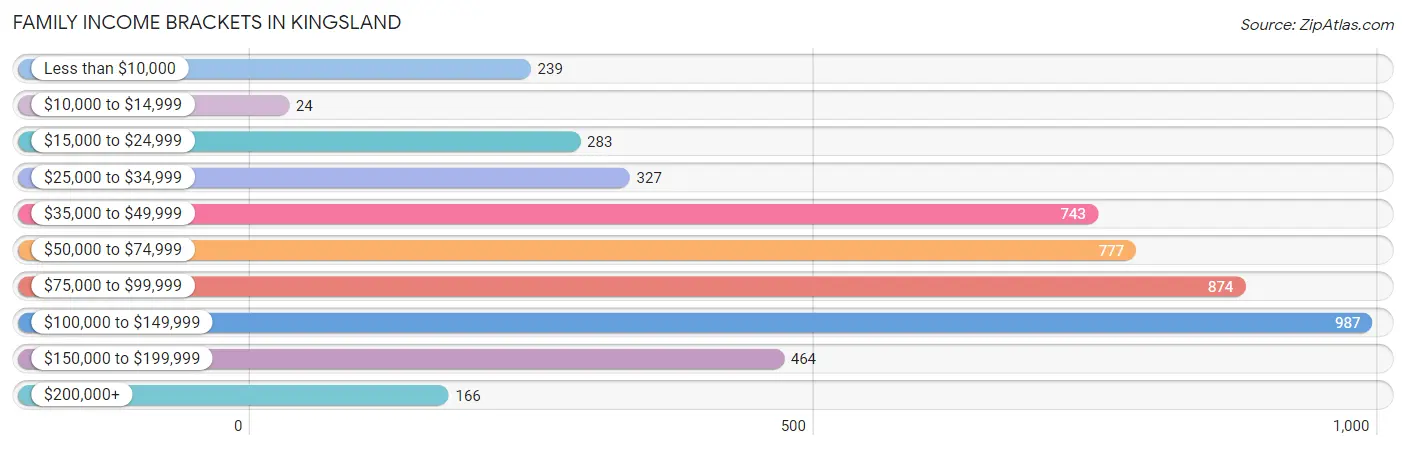
| Income Bracket | # Families | % Families |
| Less than $10,000 | 239 | 4.9% |
| $10,000 to $14,999 | 24 | 0.5% |
| $15,000 to $24,999 | 283 | 5.8% |
| $25,000 to $34,999 | 327 | 6.7% |
| $35,000 to $49,999 | 743 | 15.2% |
| $50,000 to $74,999 | 777 | 15.9% |
| $75,000 to $99,999 | 874 | 17.9% |
| $100,000 to $149,999 | 987 | 20.2% |
| $150,000 to $199,999 | 464 | 9.5% |
| $200,000+ | 166 | 3.4% |
Family Income by Famaliy Size in Kingsland
6-person families (99 | 2.0%) account for the highest median family income in Kingsland with $83,348 per family, while 2-person families (2,266 | 46.4%) have the highest median income of $39,929 per family member.
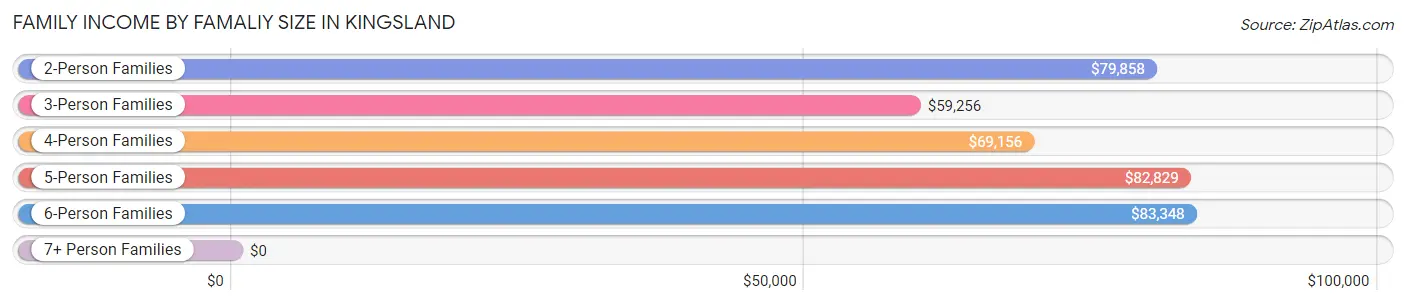
| Income Bracket | # Families | Median Income |
| 2-Person Families | 2,266 (46.4%) | $79,858 |
| 3-Person Families | 1,027 (21.0%) | $59,256 |
| 4-Person Families | 1,091 (22.3%) | $69,156 |
| 5-Person Families | 365 (7.5%) | $82,829 |
| 6-Person Families | 99 (2.0%) | $83,348 |
| 7+ Person Families | 37 (0.8%) | $0 |
| Total | 4,885 (100.0%) | $77,819 |
Family Income by Number of Earners in Kingsland
The median family income in Kingsland is $77,819, with families comprising 3+ earners (327) having the highest median family income of $143,207, while families with no earners (777) have the lowest median family income of $45,027, accounting for 6.7% and 15.9% of families, respectively.
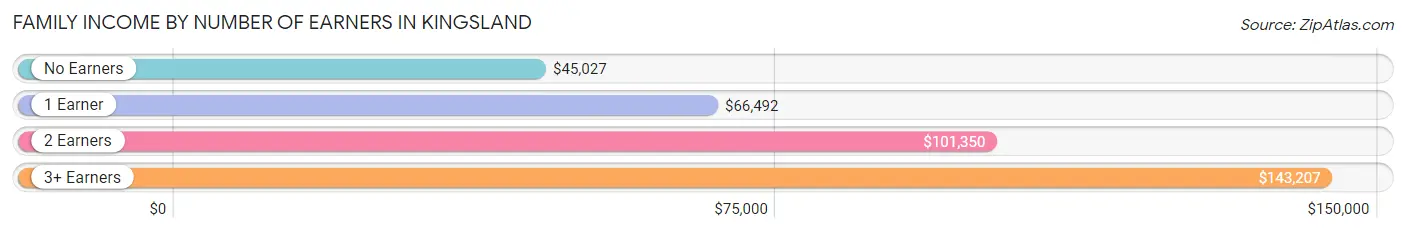
| Number of Earners | # Families | Median Income |
| No Earners | 777 (15.9%) | $45,027 |
| 1 Earner | 1,816 (37.2%) | $66,492 |
| 2 Earners | 1,965 (40.2%) | $101,350 |
| 3+ Earners | 327 (6.7%) | $143,207 |
| Total | 4,885 (100.0%) | $77,819 |
Household Income in Kingsland
Household Income Brackets in Kingsland
With 1,273 households falling in the category, the $75,000 to $99,999 income range is the most frequent in Kingsland, accounting for 19.4% of all households. In contrast, only 131 households (2.0%) fall into the $10,000 to $14,999 income bracket, making it the least populous group.
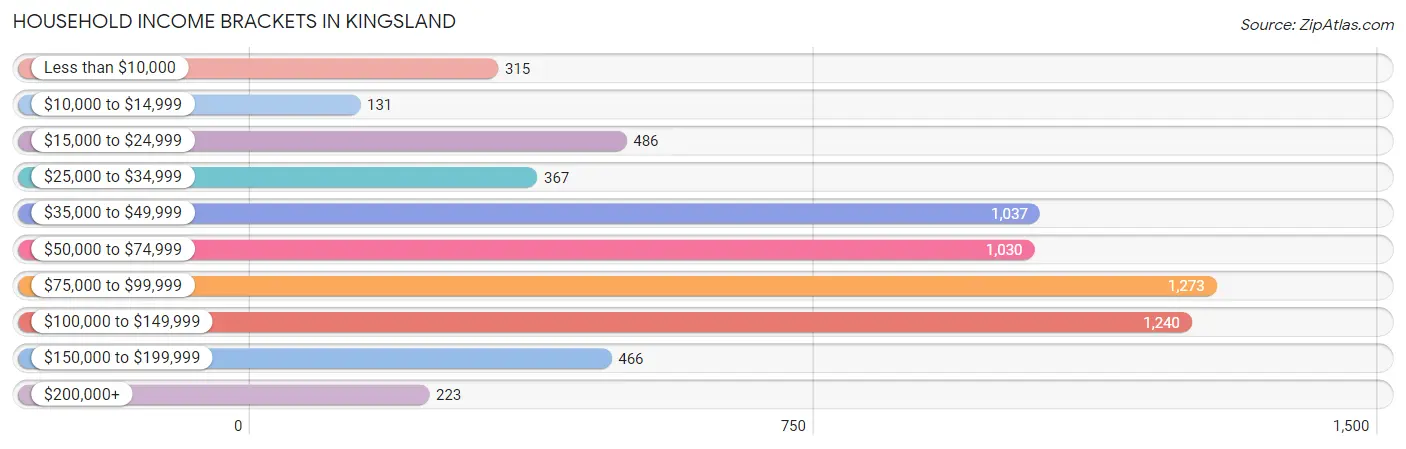
| Income Bracket | # Households | % Households |
| Less than $10,000 | 315 | 4.8% |
| $10,000 to $14,999 | 131 | 2.0% |
| $15,000 to $24,999 | 486 | 7.4% |
| $25,000 to $34,999 | 367 | 5.6% |
| $35,000 to $49,999 | 1,037 | 15.8% |
| $50,000 to $74,999 | 1,030 | 15.7% |
| $75,000 to $99,999 | 1,273 | 19.4% |
| $100,000 to $149,999 | 1,240 | 18.9% |
| $150,000 to $199,999 | 466 | 7.1% |
| $200,000+ | 223 | 3.4% |
Household Income by Householder Age in Kingsland
The median household income in Kingsland is $73,839, with the highest median household income of $85,280 found in the 45 to 64 years age bracket for the primary householder. A total of 2,610 households (39.8%) fall into this category. Meanwhile, the 15 to 24 years age bracket for the primary householder has the lowest median household income of $39,057, with 232 households (3.5%) in this group.
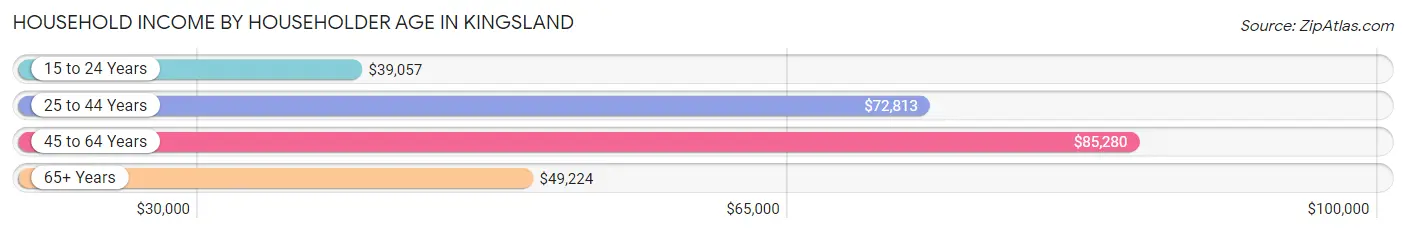
| Income Bracket | # Households | Median Income |
| 15 to 24 Years | 232 (3.5%) | $39,057 |
| 25 to 44 Years | 2,781 (42.4%) | $72,813 |
| 45 to 64 Years | 2,610 (39.8%) | $85,280 |
| 65+ Years | 938 (14.3%) | $49,224 |
| Total | 6,561 (100.0%) | $73,839 |
Poverty in Kingsland
Income Below Poverty by Sex and Age in Kingsland
With 9.4% poverty level for males and 17.2% for females among the residents of Kingsland, 16 and 17 year old males and 15 year old females are the most vulnerable to poverty, with 71 males (46.4%) and 67 females (41.6%) in their respective age groups living below the poverty level.
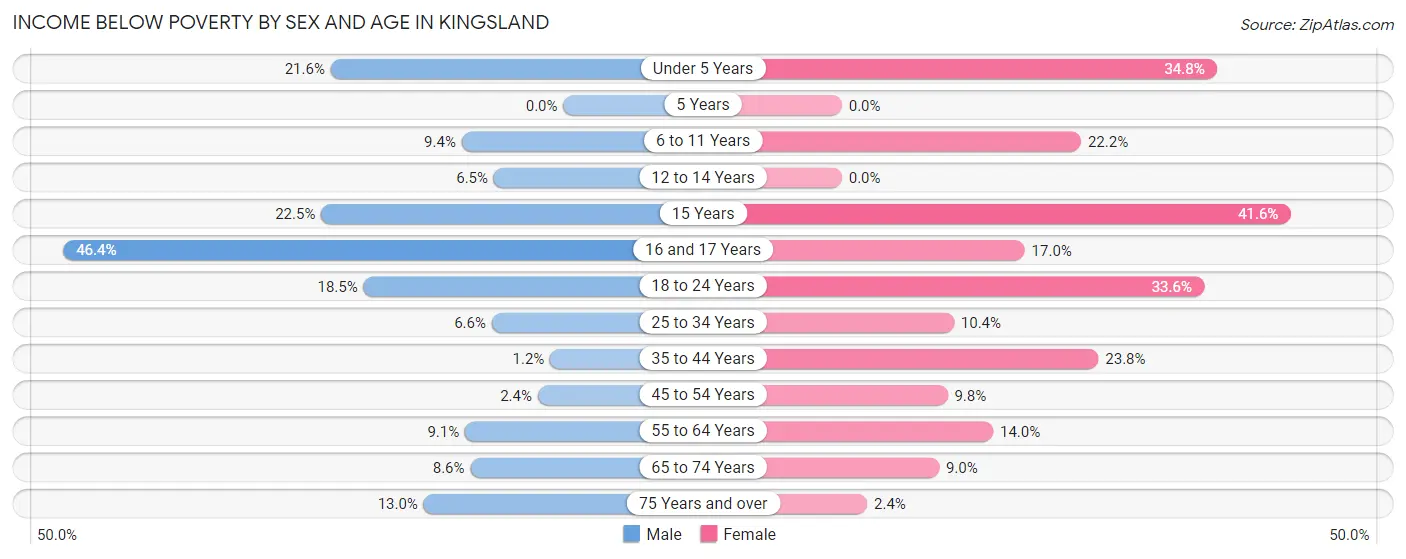
| Age Bracket | Male | Female |
| Under 5 Years | 128 (21.6%) | 218 (34.8%) |
| 5 Years | 0 (0.0%) | 0 (0.0%) |
| 6 to 11 Years | 79 (9.4%) | 188 (22.2%) |
| 12 to 14 Years | 24 (6.5%) | 0 (0.0%) |
| 15 Years | 40 (22.5%) | 67 (41.6%) |
| 16 and 17 Years | 71 (46.4%) | 37 (17.0%) |
| 18 to 24 Years | 188 (18.5%) | 221 (33.6%) |
| 25 to 34 Years | 120 (6.6%) | 163 (10.4%) |
| 35 to 44 Years | 13 (1.2%) | 320 (23.8%) |
| 45 to 54 Years | 25 (2.4%) | 109 (9.8%) |
| 55 to 64 Years | 89 (9.1%) | 154 (14.0%) |
| 65 to 74 Years | 51 (8.6%) | 59 (9.0%) |
| 75 Years and over | 39 (13.0%) | 8 (2.4%) |
| Total | 867 (9.4%) | 1,544 (17.2%) |
Income Above Poverty by Sex and Age in Kingsland
According to the poverty statistics in Kingsland, males aged 5 years and females aged 5 years are the age groups that are most secure financially, with 100.0% of males and 100.0% of females in these age groups living above the poverty line.
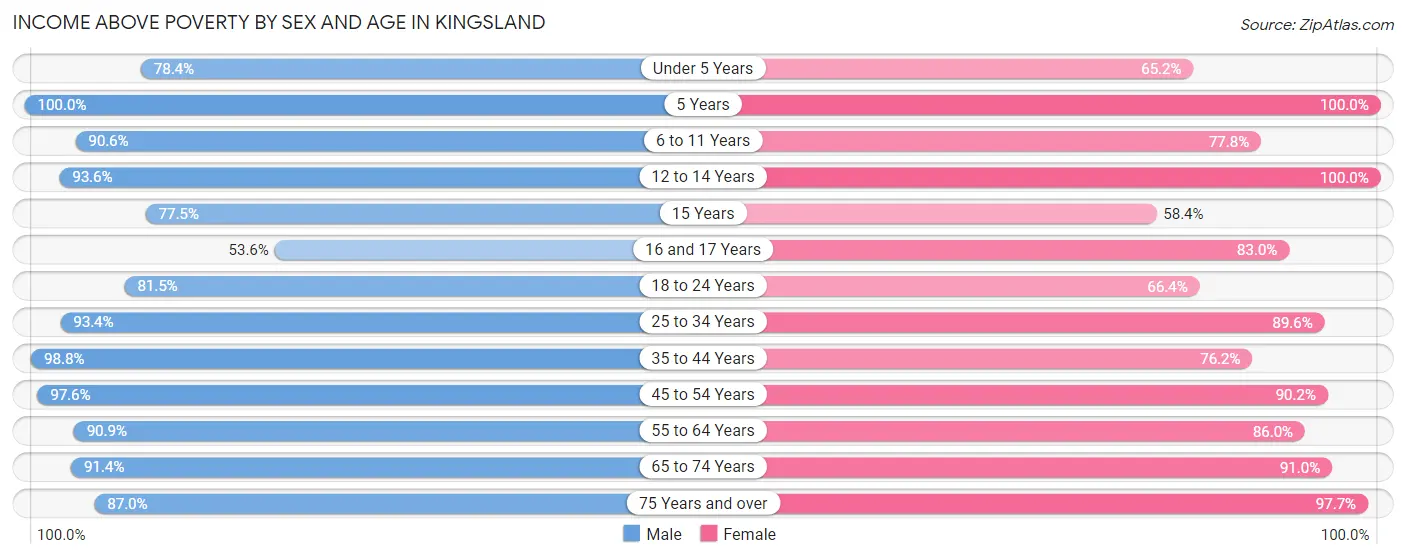
| Age Bracket | Male | Female |
| Under 5 Years | 465 (78.4%) | 409 (65.2%) |
| 5 Years | 241 (100.0%) | 89 (100.0%) |
| 6 to 11 Years | 759 (90.6%) | 659 (77.8%) |
| 12 to 14 Years | 348 (93.5%) | 278 (100.0%) |
| 15 Years | 138 (77.5%) | 94 (58.4%) |
| 16 and 17 Years | 82 (53.6%) | 181 (83.0%) |
| 18 to 24 Years | 826 (81.5%) | 437 (66.4%) |
| 25 to 34 Years | 1,688 (93.4%) | 1,405 (89.6%) |
| 35 to 44 Years | 1,055 (98.8%) | 1,024 (76.2%) |
| 45 to 54 Years | 1,028 (97.6%) | 1,002 (90.2%) |
| 55 to 64 Years | 887 (90.9%) | 943 (86.0%) |
| 65 to 74 Years | 540 (91.4%) | 595 (91.0%) |
| 75 Years and over | 262 (87.0%) | 333 (97.7%) |
| Total | 8,319 (90.6%) | 7,449 (82.8%) |
Income Below Poverty Among Married-Couple Families in Kingsland
The poverty statistics for married-couple families in Kingsland show that 1.0% or 34 of the total 3,332 families live below the poverty line. Families with 3 or 4 children have the highest poverty rate of 7.2%, comprising of 21 families. On the other hand, families with 1 or 2 children have the lowest poverty rate of 0.0%, which includes 0 families.
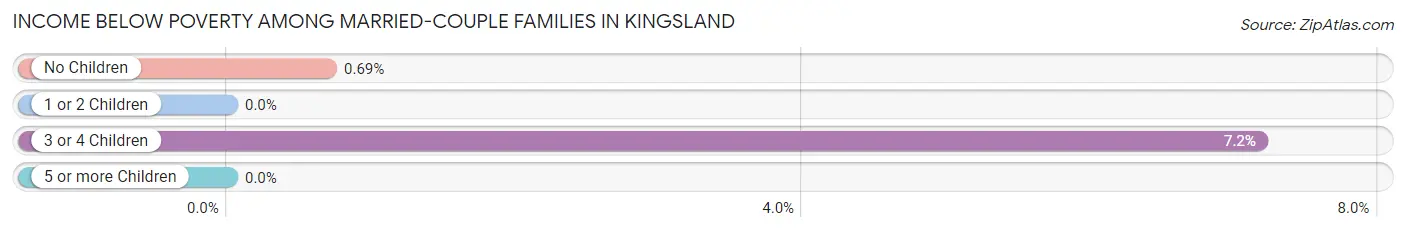
| Children | Above Poverty | Below Poverty |
| No Children | 1,874 (99.3%) | 13 (0.7%) |
| 1 or 2 Children | 1,152 (100.0%) | 0 (0.0%) |
| 3 or 4 Children | 272 (92.8%) | 21 (7.2%) |
| 5 or more Children | 0 (0.0%) | 0 (0.0%) |
| Total | 3,298 (99.0%) | 34 (1.0%) |
Income Below Poverty Among Single-Parent Households in Kingsland
According to the poverty data in Kingsland, 5.1% or 24 single-father households and 39.7% or 429 single-mother households are living below the poverty line. Among single-father households, those with no children have the highest poverty rate, with 24 households (12.7%) experiencing poverty. Likewise, among single-mother households, those with 1 or 2 children have the highest poverty rate, with 351 households (47.0%) falling below the poverty line.
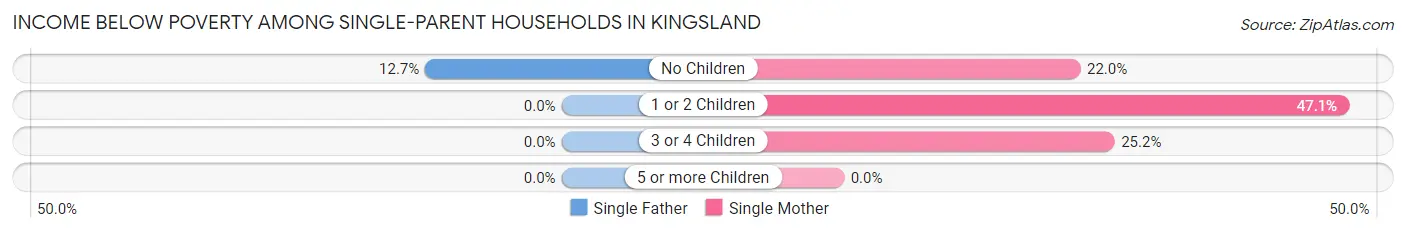
| Children | Single Father | Single Mother |
| No Children | 24 (12.7%) | 46 (22.0%) |
| 1 or 2 Children | 0 (0.0%) | 351 (47.0%) |
| 3 or 4 Children | 0 (0.0%) | 32 (25.2%) |
| 5 or more Children | 0 (0.0%) | 0 (0.0%) |
| Total | 24 (5.1%) | 429 (39.7%) |
Income Below Poverty Among Married-Couple vs Single-Parent Households in Kingsland
The poverty data for Kingsland shows that 34 of the married-couple family households (1.0%) and 453 of the single-parent households (29.2%) are living below the poverty level. Within the married-couple family households, those with 3 or 4 children have the highest poverty rate, with 21 households (7.2%) falling below the poverty line. Among the single-parent households, those with 1 or 2 children have the highest poverty rate, with 351 household (35.5%) living below poverty.
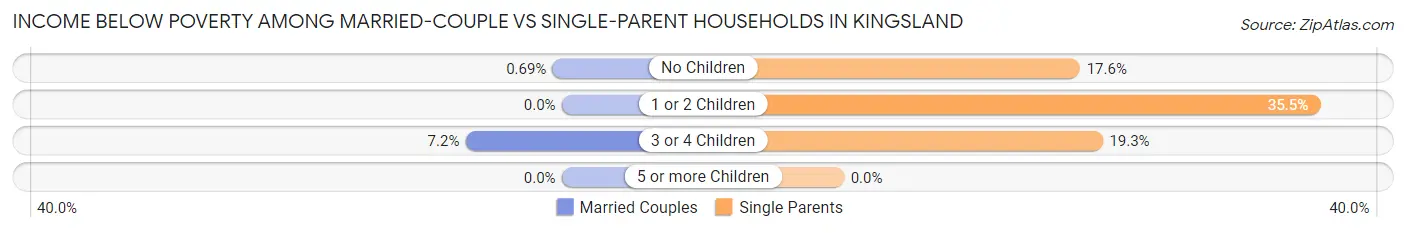
| Children | Married-Couple Families | Single-Parent Households |
| No Children | 13 (0.7%) | 70 (17.6%) |
| 1 or 2 Children | 0 (0.0%) | 351 (35.5%) |
| 3 or 4 Children | 21 (7.2%) | 32 (19.3%) |
| 5 or more Children | 0 (0.0%) | 0 (0.0%) |
| Total | 34 (1.0%) | 453 (29.2%) |
Employment Characteristics in Kingsland
Employment by Class of Employer in Kingsland
Among the 8,588 employed individuals in Kingsland, private company employees (4,786 | 55.7%), federal government employees (2,013 | 23.4%), and not-for-profit organizations (465 | 5.4%) make up the most common classes of employment.
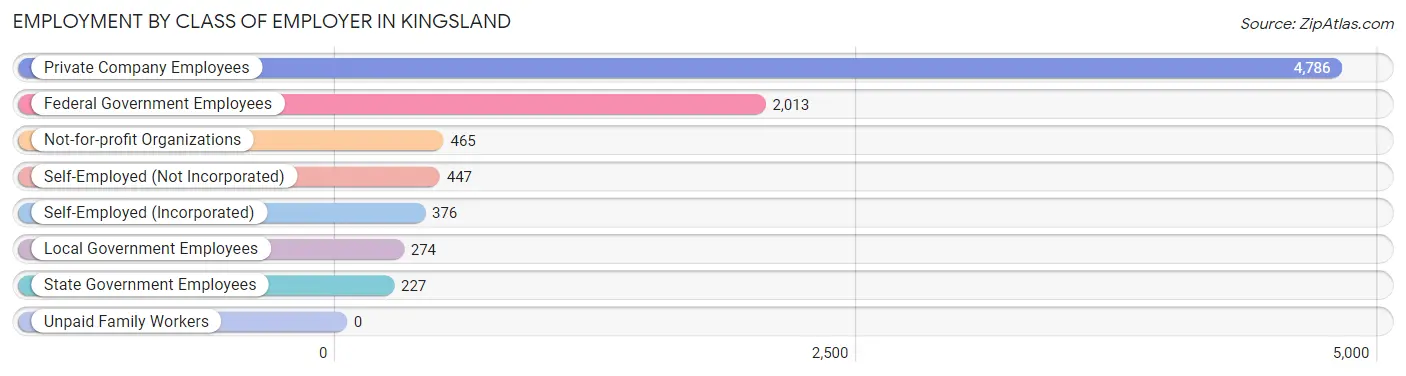
| Employer Class | # Employees | % Employees |
| Private Company Employees | 4,786 | 55.7% |
| Self-Employed (Incorporated) | 376 | 4.4% |
| Self-Employed (Not Incorporated) | 447 | 5.2% |
| Not-for-profit Organizations | 465 | 5.4% |
| Local Government Employees | 274 | 3.2% |
| State Government Employees | 227 | 2.6% |
| Federal Government Employees | 2,013 | 23.4% |
| Unpaid Family Workers | 0 | 0.0% |
| Total | 8,588 | 100.0% |
Employment Status by Age in Kingsland
According to the labor force statistics for Kingsland, out of the total population over 16 years of age (13,955), 64.5% or 9,001 individuals are in the labor force, with 3.7% or 333 of them unemployed. The age group with the highest labor force participation rate is 20 to 24 years, with 93.0% or 774 individuals in the labor force. Within the labor force, the 16 to 19 years age range has the highest percentage of unemployed individuals, with 17.7% or 108 of them being unemployed.
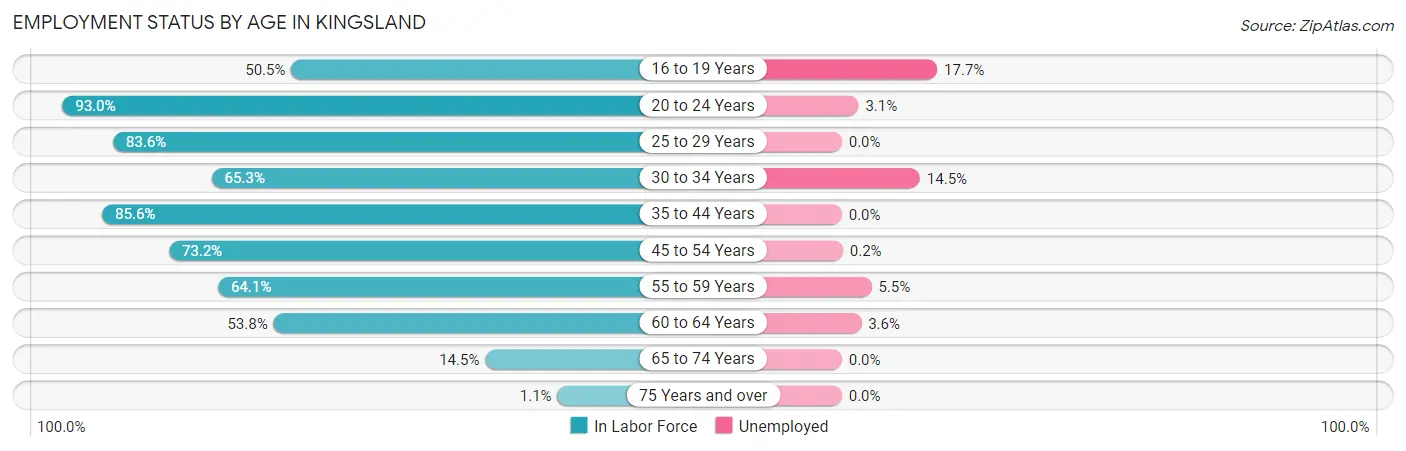
| Age Bracket | In Labor Force | Unemployed |
| 16 to 19 Years | 612 (50.5%) | 108 (17.7%) |
| 20 to 24 Years | 774 (93.0%) | 24 (3.1%) |
| 25 to 29 Years | 1,573 (83.6%) | 0 (0.0%) |
| 30 to 34 Years | 976 (65.3%) | 142 (14.5%) |
| 35 to 44 Years | 2,065 (85.6%) | 0 (0.0%) |
| 45 to 54 Years | 1,584 (73.2%) | 3 (0.2%) |
| 55 to 59 Years | 695 (64.1%) | 38 (5.5%) |
| 60 to 64 Years | 532 (53.8%) | 19 (3.6%) |
| 65 to 74 Years | 181 (14.5%) | 0 (0.0%) |
| 75 Years and over | 7 (1.1%) | 0 (0.0%) |
| Total | 9,001 (64.5%) | 333 (3.7%) |
Employment Status by Educational Attainment in Kingsland
According to labor force statistics for Kingsland, 74.1% of individuals (7,429) out of the total population between 25 and 64 years of age (10,025) are in the labor force, with 2.5% or 186 of them being unemployed. The group with the highest labor force participation rate are those with the educational attainment of bachelor's degree or higher, with 83.3% or 2,031 individuals in the labor force. Within the labor force, individuals with high school diploma education have the highest percentage of unemployment, with 7.6% or 149 of them being unemployed.
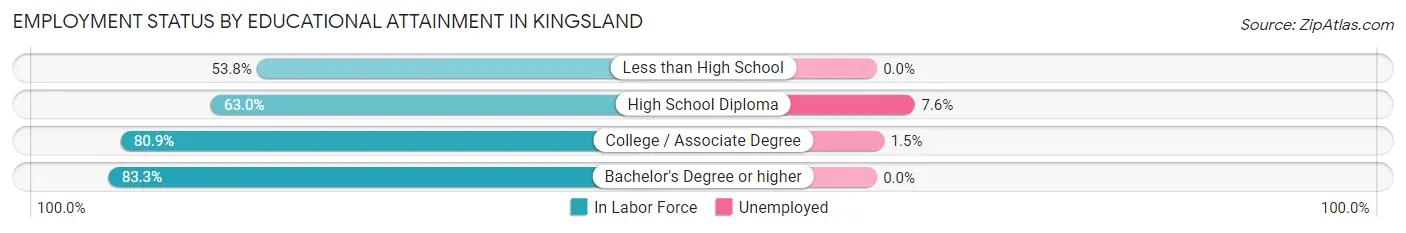
| Educational Attainment | In Labor Force | Unemployed |
| Less than High School | 370 (53.8%) | 0 (0.0%) |
| High School Diploma | 1,954 (63.0%) | 236 (7.6%) |
| College / Associate Degree | 3,073 (80.9%) | 57 (1.5%) |
| Bachelor's Degree or higher | 2,031 (83.3%) | 0 (0.0%) |
| Total | 7,429 (74.1%) | 251 (2.5%) |
Employment Occupations by Sex in Kingsland
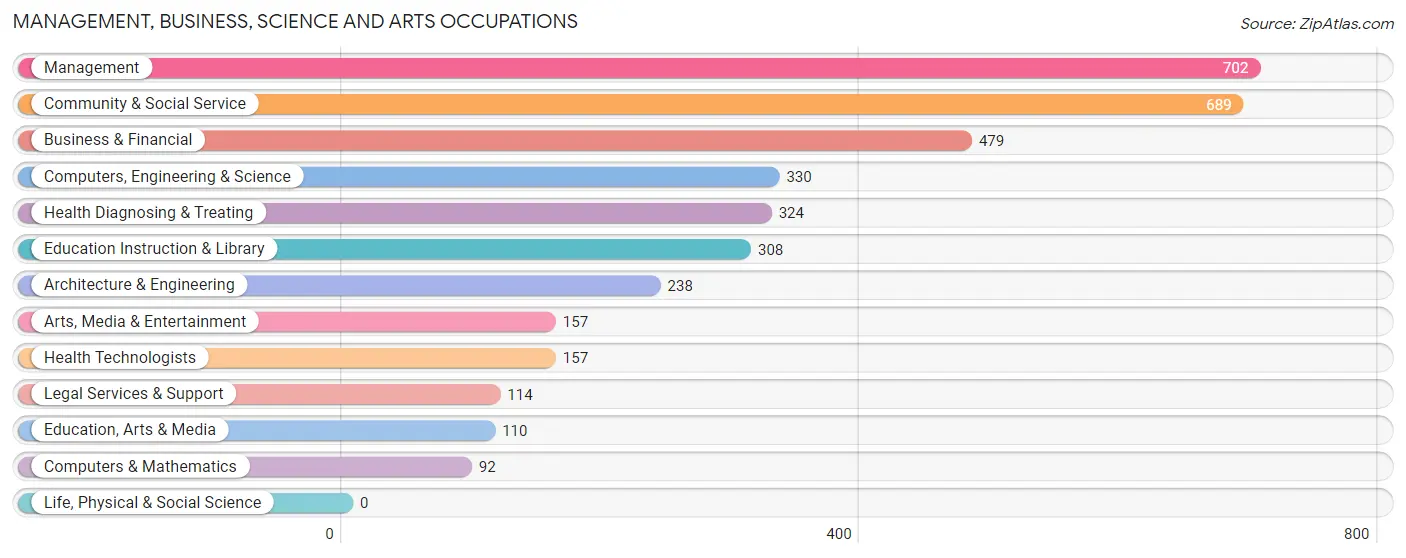
Management, Business, Science and Arts Occupations
The most common Management, Business, Science and Arts occupations in Kingsland are Management (702 | 9.1%), Community & Social Service (689 | 8.9%), Business & Financial (479 | 6.2%), Computers, Engineering & Science (330 | 4.3%), and Health Diagnosing & Treating (324 | 4.2%).
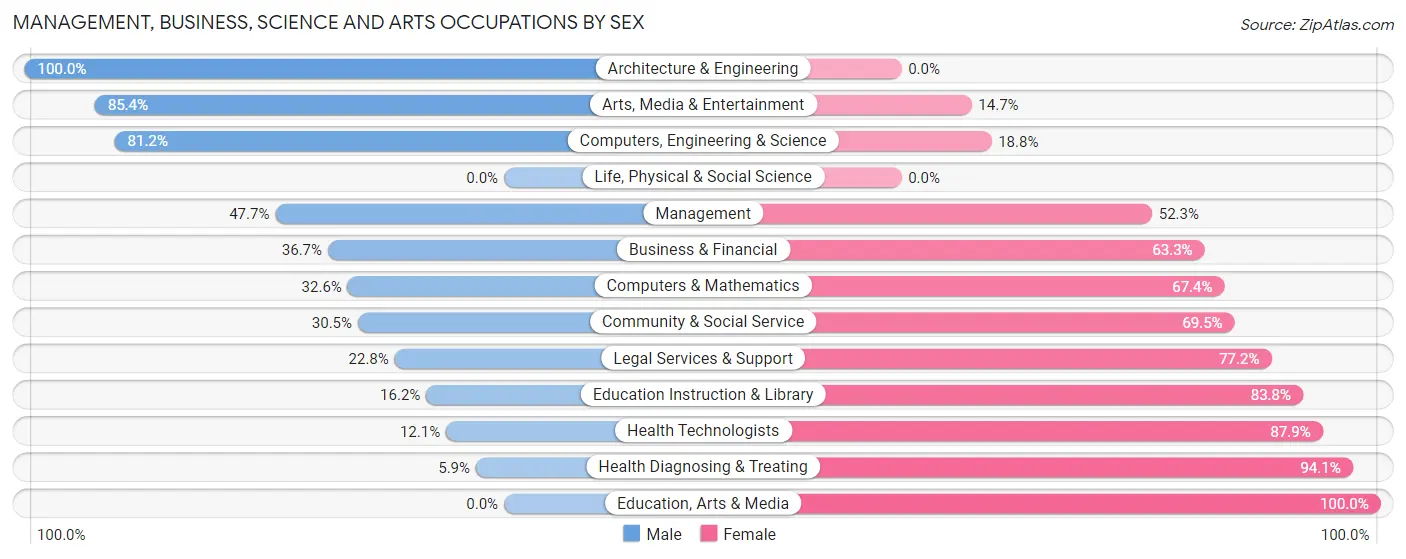
Management, Business, Science and Arts Occupations by Sex
Within the Management, Business, Science and Arts occupations in Kingsland, the most male-oriented occupations are Architecture & Engineering (100.0%), Arts, Media & Entertainment (85.4%), and Computers, Engineering & Science (81.2%), while the most female-oriented occupations are Education, Arts & Media (100.0%), Health Diagnosing & Treating (94.1%), and Health Technologists (87.9%).
| Occupation | Male | Female |
| Management | 335 (47.7%) | 367 (52.3%) |
| Business & Financial | 176 (36.7%) | 303 (63.3%) |
| Computers, Engineering & Science | 268 (81.2%) | 62 (18.8%) |
| Computers & Mathematics | 30 (32.6%) | 62 (67.4%) |
| Architecture & Engineering | 238 (100.0%) | 0 (0.0%) |
| Life, Physical & Social Science | 0 (0.0%) | 0 (0.0%) |
| Community & Social Service | 210 (30.5%) | 479 (69.5%) |
| Education, Arts & Media | 0 (0.0%) | 110 (100.0%) |
| Legal Services & Support | 26 (22.8%) | 88 (77.2%) |
| Education Instruction & Library | 50 (16.2%) | 258 (83.8%) |
| Arts, Media & Entertainment | 134 (85.4%) | 23 (14.6%) |
| Health Diagnosing & Treating | 19 (5.9%) | 305 (94.1%) |
| Health Technologists | 19 (12.1%) | 138 (87.9%) |
| Total (Category) | 1,008 (39.9%) | 1,516 (60.1%) |
| Total (Overall) | 3,944 (51.0%) | 3,784 (49.0%) |
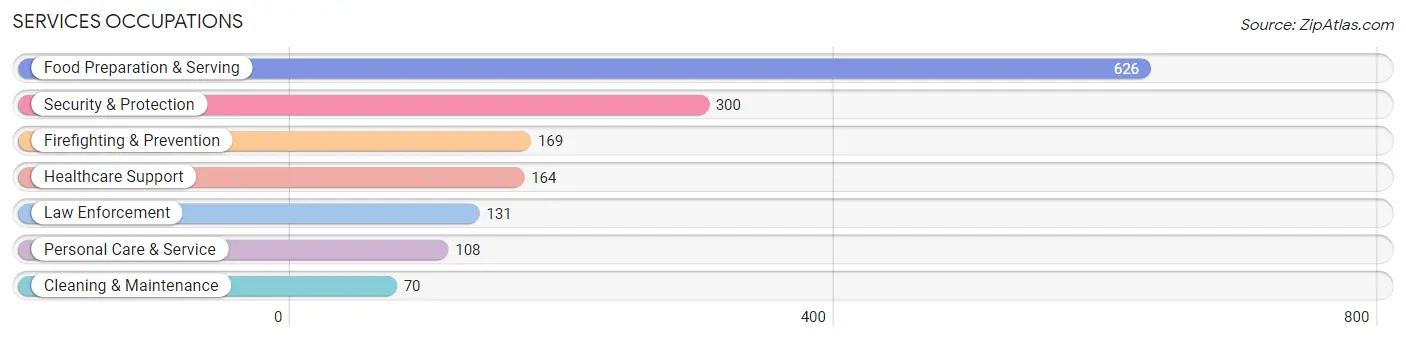
Services Occupations
The most common Services occupations in Kingsland are Food Preparation & Serving (626 | 8.1%), Security & Protection (300 | 3.9%), Firefighting & Prevention (169 | 2.2%), Healthcare Support (164 | 2.1%), and Law Enforcement (131 | 1.7%).
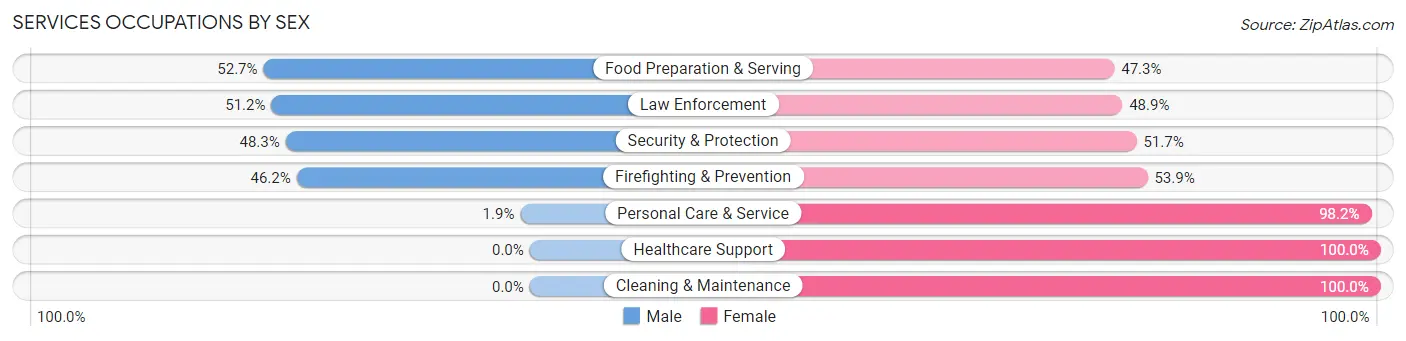
Services Occupations by Sex
Within the Services occupations in Kingsland, the most male-oriented occupations are Food Preparation & Serving (52.7%), Law Enforcement (51.1%), and Security & Protection (48.3%), while the most female-oriented occupations are Healthcare Support (100.0%), Cleaning & Maintenance (100.0%), and Personal Care & Service (98.2%).
| Occupation | Male | Female |
| Healthcare Support | 0 (0.0%) | 164 (100.0%) |
| Security & Protection | 145 (48.3%) | 155 (51.7%) |
| Firefighting & Prevention | 78 (46.2%) | 91 (53.8%) |
| Law Enforcement | 67 (51.1%) | 64 (48.8%) |
| Food Preparation & Serving | 330 (52.7%) | 296 (47.3%) |
| Cleaning & Maintenance | 0 (0.0%) | 70 (100.0%) |
| Personal Care & Service | 2 (1.8%) | 106 (98.2%) |
| Total (Category) | 477 (37.6%) | 791 (62.4%) |
| Total (Overall) | 3,944 (51.0%) | 3,784 (49.0%) |
Sales and Office Occupations
The most common Sales and Office occupations in Kingsland are Sales & Related (1,042 | 13.5%), and Office & Administration (895 | 11.6%).
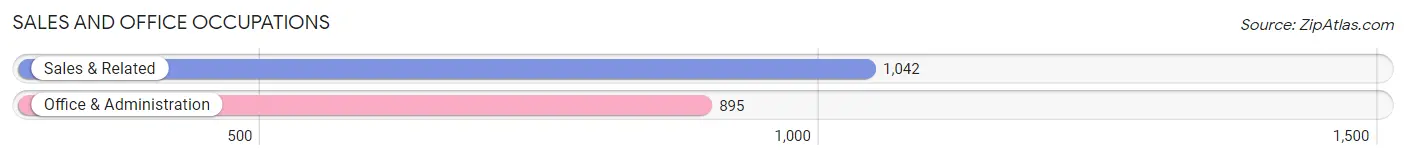
Sales and Office Occupations by Sex
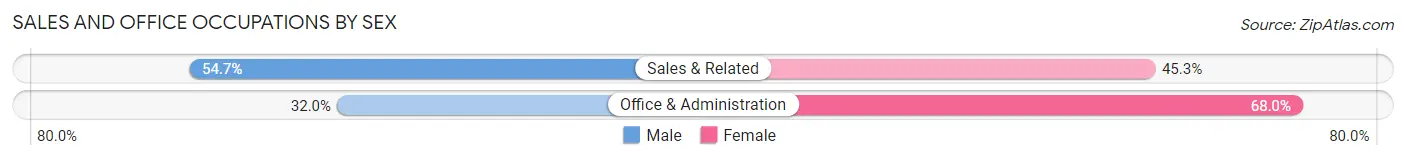
| Occupation | Male | Female |
| Sales & Related | 570 (54.7%) | 472 (45.3%) |
| Office & Administration | 286 (32.0%) | 609 (68.0%) |
| Total (Category) | 856 (44.2%) | 1,081 (55.8%) |
| Total (Overall) | 3,944 (51.0%) | 3,784 (49.0%) |
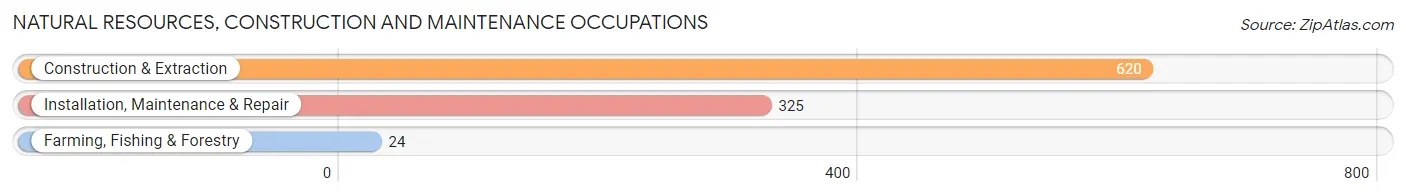
Natural Resources, Construction and Maintenance Occupations
The most common Natural Resources, Construction and Maintenance occupations in Kingsland are Construction & Extraction (620 | 8.0%), Installation, Maintenance & Repair (325 | 4.2%), and Farming, Fishing & Forestry (24 | 0.3%).
Natural Resources, Construction and Maintenance Occupations by Sex
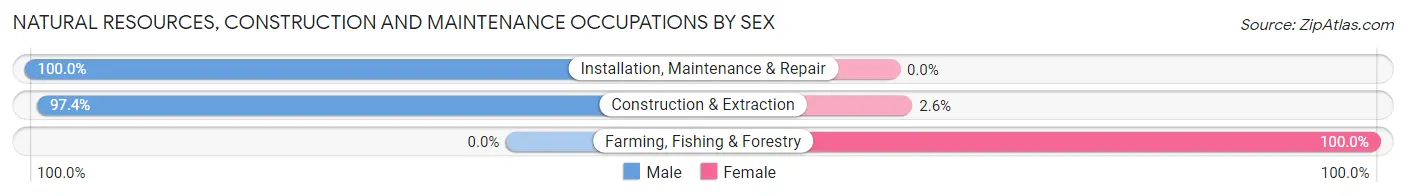
| Occupation | Male | Female |
| Farming, Fishing & Forestry | 0 (0.0%) | 24 (100.0%) |
| Construction & Extraction | 604 (97.4%) | 16 (2.6%) |
| Installation, Maintenance & Repair | 325 (100.0%) | 0 (0.0%) |
| Total (Category) | 929 (95.9%) | 40 (4.1%) |
| Total (Overall) | 3,944 (51.0%) | 3,784 (49.0%) |
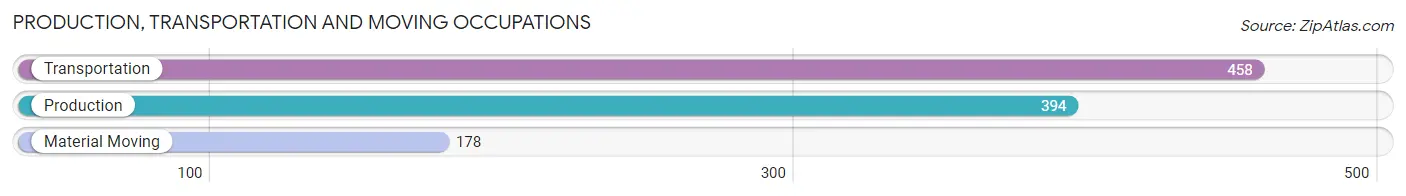
Production, Transportation and Moving Occupations
The most common Production, Transportation and Moving occupations in Kingsland are Transportation (458 | 5.9%), Production (394 | 5.1%), and Material Moving (178 | 2.3%).
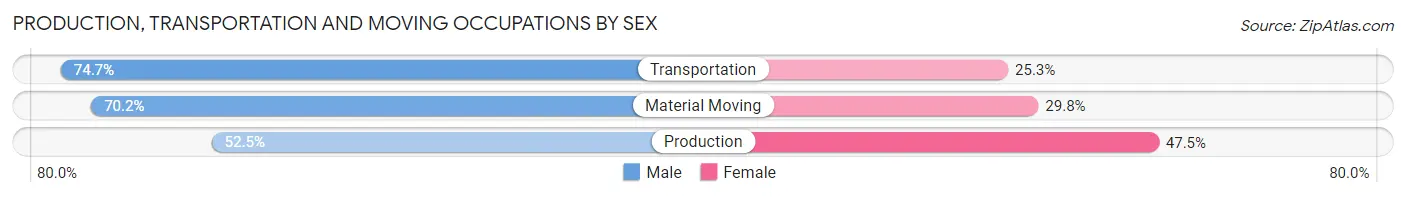
Production, Transportation and Moving Occupations by Sex
| Occupation | Male | Female |
| Production | 207 (52.5%) | 187 (47.5%) |
| Transportation | 342 (74.7%) | 116 (25.3%) |
| Material Moving | 125 (70.2%) | 53 (29.8%) |
| Total (Category) | 674 (65.4%) | 356 (34.6%) |
| Total (Overall) | 3,944 (51.0%) | 3,784 (49.0%) |
Employment Industries by Sex in Kingsland
Employment Industries in Kingsland
The major employment industries in Kingsland include Retail Trade (1,045 | 13.5%), Public Administration (1,029 | 13.3%), Accommodation & Food Services (852 | 11.0%), Health Care & Social Assistance (815 | 10.5%), and Construction (719 | 9.3%).

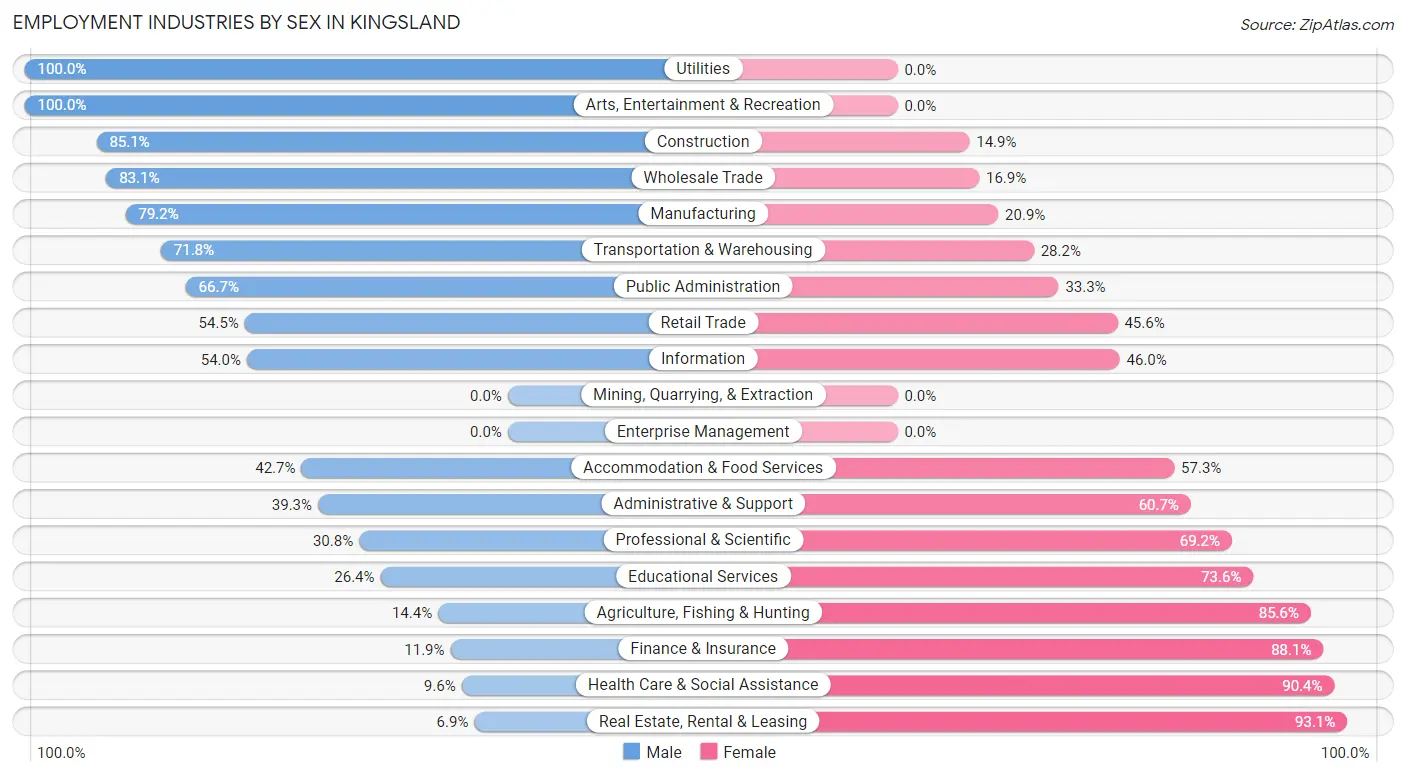
Employment Industries by Sex in Kingsland
The Kingsland industries that see more men than women are Utilities (100.0%), Arts, Entertainment & Recreation (100.0%), and Construction (85.1%), whereas the industries that tend to have a higher number of women are Real Estate, Rental & Leasing (93.1%), Health Care & Social Assistance (90.4%), and Finance & Insurance (88.1%).
| Industry | Male | Female |
| Agriculture, Fishing & Hunting | 13 (14.4%) | 77 (85.6%) |
| Mining, Quarrying, & Extraction | 0 (0.0%) | 0 (0.0%) |
| Construction | 612 (85.1%) | 107 (14.9%) |
| Manufacturing | 501 (79.1%) | 132 (20.8%) |
| Wholesale Trade | 59 (83.1%) | 12 (16.9%) |
| Retail Trade | 569 (54.4%) | 476 (45.6%) |
| Transportation & Warehousing | 397 (71.8%) | 156 (28.2%) |
| Utilities | 13 (100.0%) | 0 (0.0%) |
| Information | 155 (54.0%) | 132 (46.0%) |
| Finance & Insurance | 33 (11.9%) | 245 (88.1%) |
| Real Estate, Rental & Leasing | 7 (6.9%) | 94 (93.1%) |
| Professional & Scientific | 93 (30.8%) | 209 (69.2%) |
| Enterprise Management | 0 (0.0%) | 0 (0.0%) |
| Administrative & Support | 79 (39.3%) | 122 (60.7%) |
| Educational Services | 92 (26.4%) | 257 (73.6%) |
| Health Care & Social Assistance | 78 (9.6%) | 737 (90.4%) |
| Arts, Entertainment & Recreation | 80 (100.0%) | 0 (0.0%) |
| Accommodation & Food Services | 364 (42.7%) | 488 (57.3%) |
| Public Administration | 686 (66.7%) | 343 (33.3%) |
| Total | 3,944 (51.0%) | 3,784 (49.0%) |
Education in Kingsland
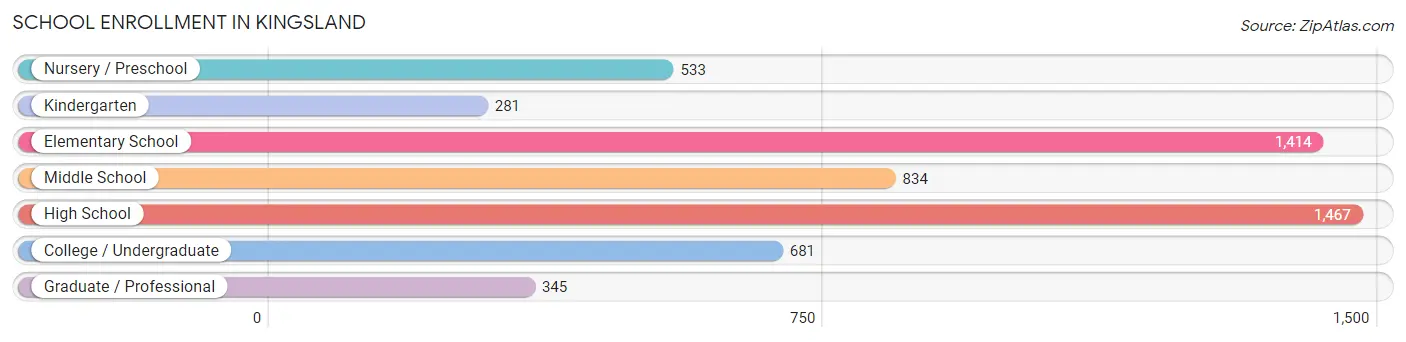
School Enrollment in Kingsland
The most common levels of schooling among the 5,555 students in Kingsland are high school (1,467 | 26.4%), elementary school (1,414 | 25.5%), and middle school (834 | 15.0%).
| School Level | # Students | % Students |
| Nursery / Preschool | 533 | 9.6% |
| Kindergarten | 281 | 5.1% |
| Elementary School | 1,414 | 25.5% |
| Middle School | 834 | 15.0% |
| High School | 1,467 | 26.4% |
| College / Undergraduate | 681 | 12.3% |
| Graduate / Professional | 345 | 6.2% |
| Total | 5,555 | 100.0% |
School Enrollment by Age by Funding Source in Kingsland
Out of a total of 5,555 students who are enrolled in schools in Kingsland, 533 (9.6%) attend a private institution, while the remaining 5,022 (90.4%) are enrolled in public schools. The age group of 25 to 34 year olds has the highest likelihood of being enrolled in private schools, with 227 (63.2% in the age bracket) enrolled. Conversely, the age group of 15 to 17 year olds has the lowest likelihood of being enrolled in a private school, with 682 (100.0% in the age bracket) attending a public institution.
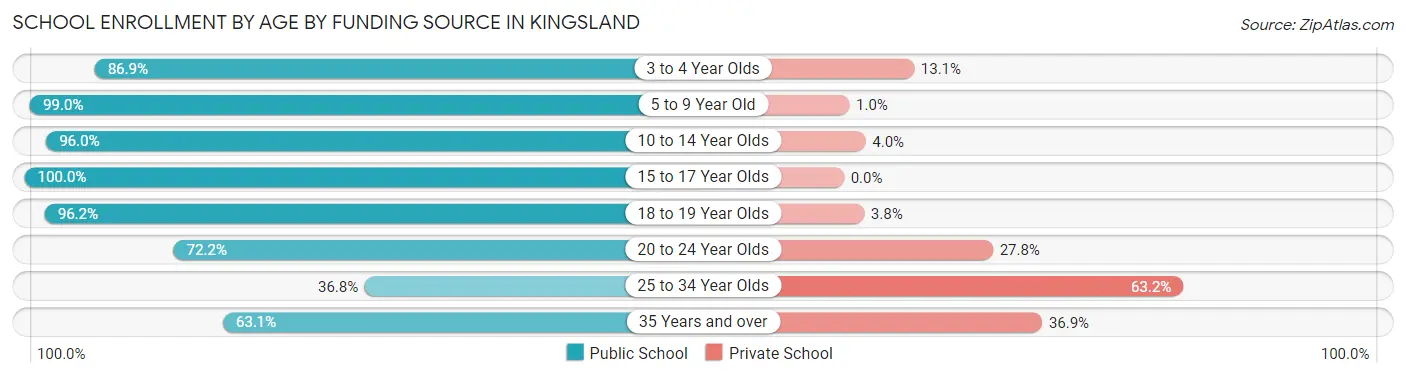
| Age Bracket | Public School | Private School |
| 3 to 4 Year Olds | 286 (86.9%) | 43 (13.1%) |
| 5 to 9 Year Old | 1,671 (99.0%) | 17 (1.0%) |
| 10 to 14 Year Olds | 1,234 (96.0%) | 52 (4.0%) |
| 15 to 17 Year Olds | 682 (100.0%) | 0 (0.0%) |
| 18 to 19 Year Olds | 663 (96.2%) | 26 (3.8%) |
| 20 to 24 Year Olds | 203 (72.2%) | 78 (27.8%) |
| 25 to 34 Year Olds | 132 (36.8%) | 227 (63.2%) |
| 35 Years and over | 152 (63.1%) | 89 (36.9%) |
| Total | 5,022 (90.4%) | 533 (9.6%) |
Educational Attainment by Field of Study in Kingsland
Business (729 | 26.4%), liberal arts & history (316 | 11.5%), science & technology (287 | 10.4%), education (284 | 10.3%), and arts & humanities (222 | 8.1%) are the most common fields of study among 2,758 individuals in Kingsland who have obtained a bachelor's degree or higher.
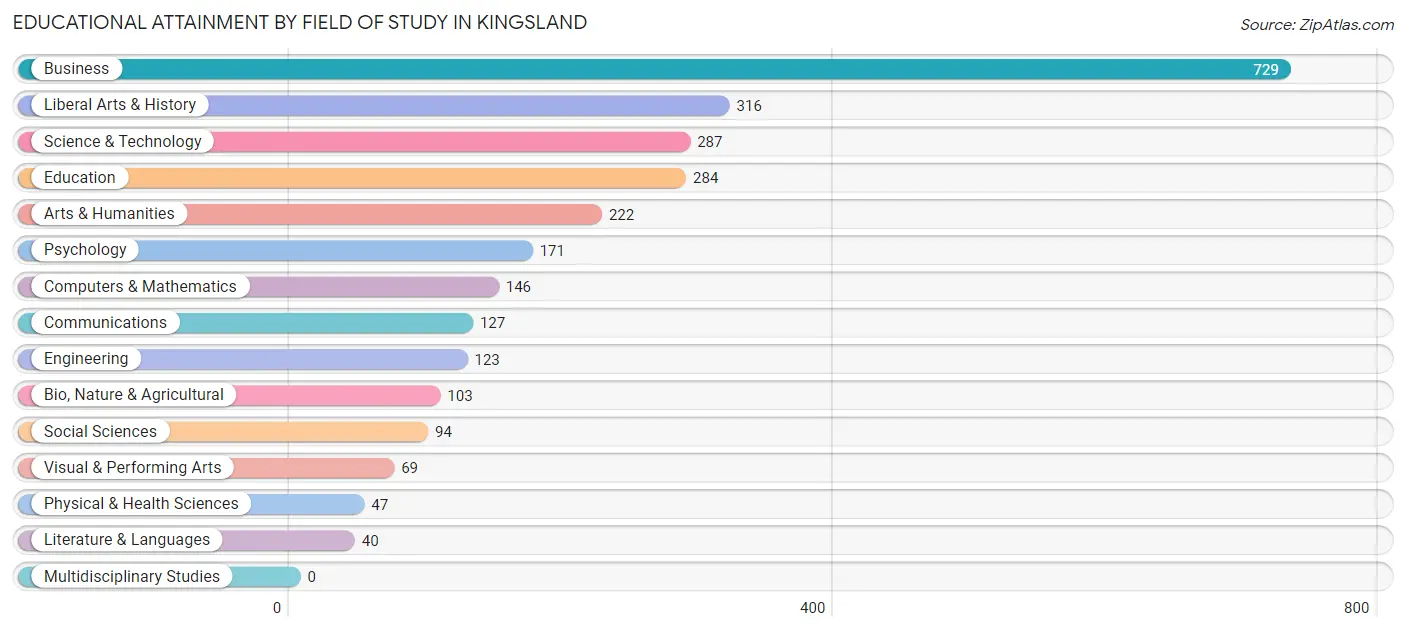
| Field of Study | # Graduates | % Graduates |
| Computers & Mathematics | 146 | 5.3% |
| Bio, Nature & Agricultural | 103 | 3.7% |
| Physical & Health Sciences | 47 | 1.7% |
| Psychology | 171 | 6.2% |
| Social Sciences | 94 | 3.4% |
| Engineering | 123 | 4.5% |
| Multidisciplinary Studies | 0 | 0.0% |
| Science & Technology | 287 | 10.4% |
| Business | 729 | 26.4% |
| Education | 284 | 10.3% |
| Literature & Languages | 40 | 1.5% |
| Liberal Arts & History | 316 | 11.5% |
| Visual & Performing Arts | 69 | 2.5% |
| Communications | 127 | 4.6% |
| Arts & Humanities | 222 | 8.1% |
| Total | 2,758 | 100.0% |
Transportation & Commute in Kingsland
Vehicle Availability by Sex in Kingsland
The most prevalent vehicle ownership categories in Kingsland are males with 2 vehicles (2,608, accounting for 53.5%) and females with 2 vehicles (1,583, making up 70.3%).
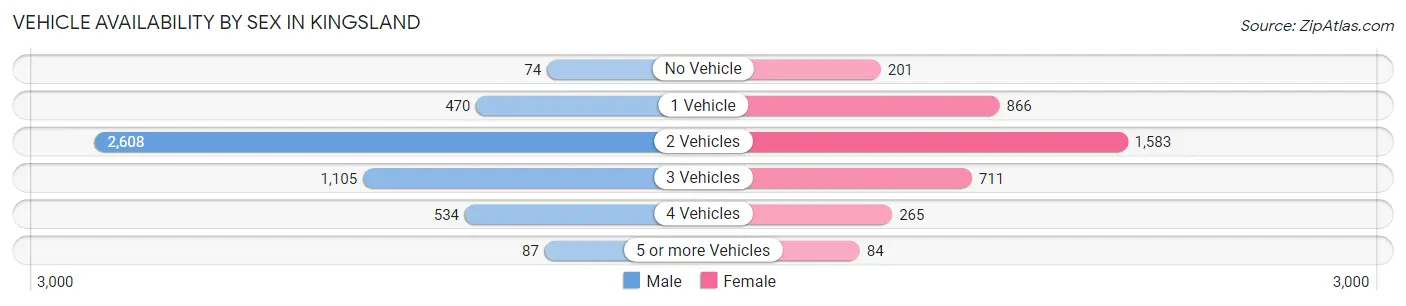
| Vehicles Available | Male | Female |
| No Vehicle | 74 (1.5%) | 201 (5.4%) |
| 1 Vehicle | 470 (9.6%) | 866 (23.3%) |
| 2 Vehicles | 2,608 (53.5%) | 1,583 (42.7%) |
| 3 Vehicles | 1,105 (22.7%) | 711 (19.2%) |
| 4 Vehicles | 534 (11.0%) | 265 (7.1%) |
| 5 or more Vehicles | 87 (1.8%) | 84 (2.3%) |
| Total | 4,878 (100.0%) | 3,710 (100.0%) |
Commute Time in Kingsland
The most frequently occuring commute durations in Kingsland are 20 to 24 minutes (1,455 commuters, 18.1%), 15 to 19 minutes (1,170 commuters, 14.5%), and 45 to 59 minutes (1,082 commuters, 13.4%).
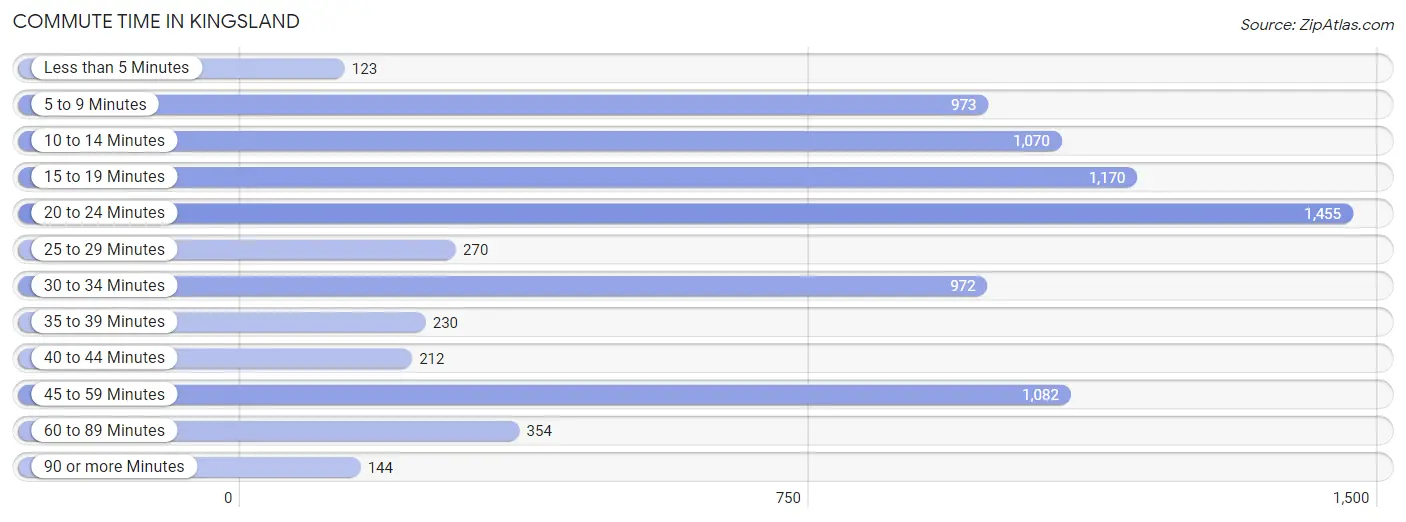
| Commute Time | # Commuters | % Commuters |
| Less than 5 Minutes | 123 | 1.5% |
| 5 to 9 Minutes | 973 | 12.1% |
| 10 to 14 Minutes | 1,070 | 13.3% |
| 15 to 19 Minutes | 1,170 | 14.5% |
| 20 to 24 Minutes | 1,455 | 18.1% |
| 25 to 29 Minutes | 270 | 3.4% |
| 30 to 34 Minutes | 972 | 12.1% |
| 35 to 39 Minutes | 230 | 2.9% |
| 40 to 44 Minutes | 212 | 2.6% |
| 45 to 59 Minutes | 1,082 | 13.4% |
| 60 to 89 Minutes | 354 | 4.4% |
| 90 or more Minutes | 144 | 1.8% |
Commute Time by Sex in Kingsland
The most common commute times in Kingsland are 20 to 24 minutes (1,027 commuters, 22.9%) for males and 5 to 9 minutes (721 commuters, 20.2%) for females.
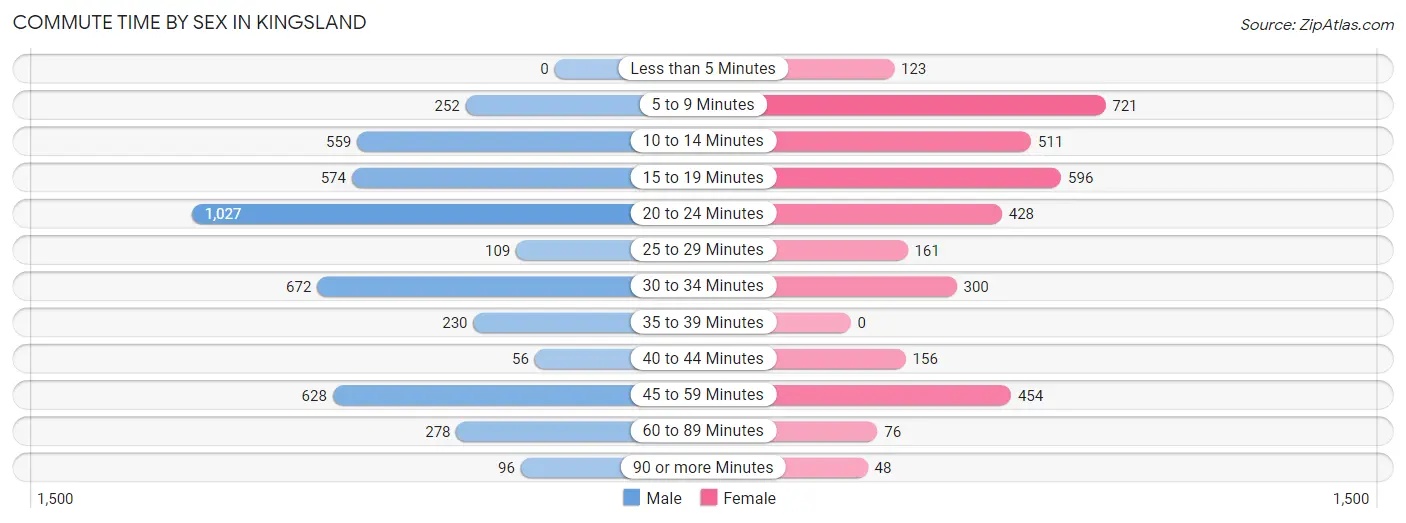
| Commute Time | Male | Female |
| Less than 5 Minutes | 0 (0.0%) | 123 (3.4%) |
| 5 to 9 Minutes | 252 (5.6%) | 721 (20.2%) |
| 10 to 14 Minutes | 559 (12.5%) | 511 (14.3%) |
| 15 to 19 Minutes | 574 (12.8%) | 596 (16.7%) |
| 20 to 24 Minutes | 1,027 (22.9%) | 428 (12.0%) |
| 25 to 29 Minutes | 109 (2.4%) | 161 (4.5%) |
| 30 to 34 Minutes | 672 (15.0%) | 300 (8.4%) |
| 35 to 39 Minutes | 230 (5.1%) | 0 (0.0%) |
| 40 to 44 Minutes | 56 (1.3%) | 156 (4.4%) |
| 45 to 59 Minutes | 628 (14.0%) | 454 (12.7%) |
| 60 to 89 Minutes | 278 (6.2%) | 76 (2.1%) |
| 90 or more Minutes | 96 (2.1%) | 48 (1.3%) |
Time of Departure to Work by Sex in Kingsland
The most frequent times of departure to work in Kingsland are 6:00 AM to 6:29 AM (570, 12.7%) for males and 8:00 AM to 8:29 AM (577, 16.1%) for females.
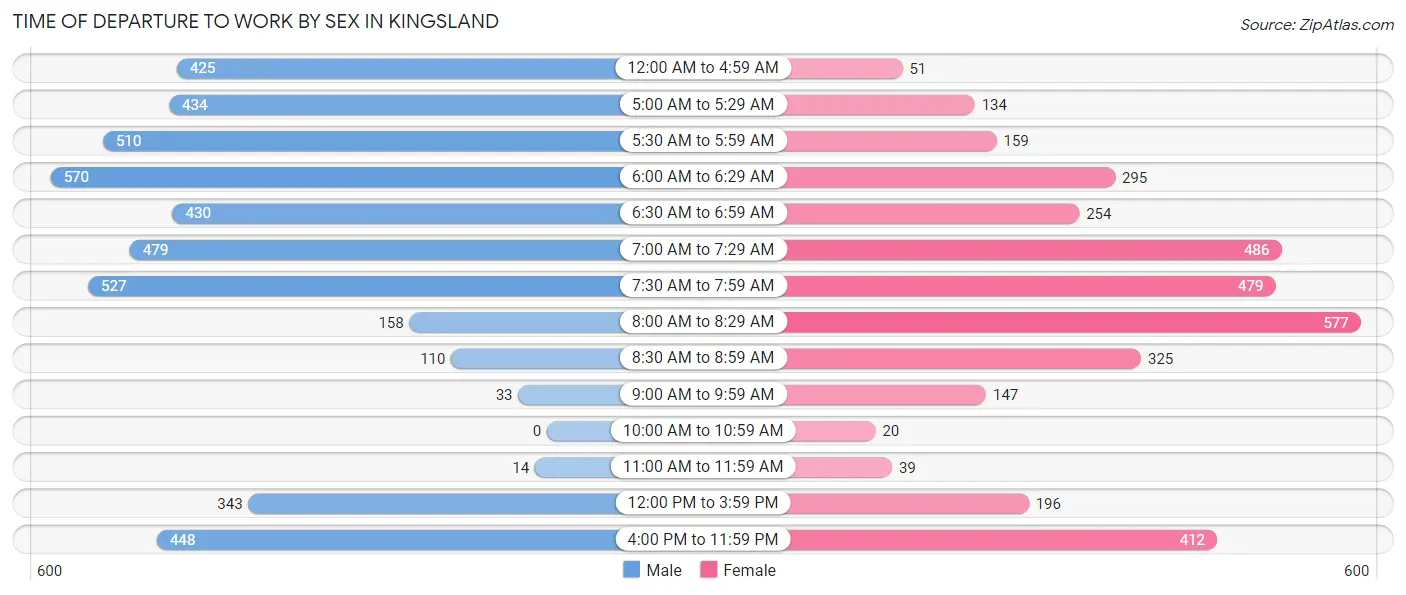
| Time of Departure | Male | Female |
| 12:00 AM to 4:59 AM | 425 (9.5%) | 51 (1.4%) |
| 5:00 AM to 5:29 AM | 434 (9.7%) | 134 (3.7%) |
| 5:30 AM to 5:59 AM | 510 (11.4%) | 159 (4.4%) |
| 6:00 AM to 6:29 AM | 570 (12.7%) | 295 (8.3%) |
| 6:30 AM to 6:59 AM | 430 (9.6%) | 254 (7.1%) |
| 7:00 AM to 7:29 AM | 479 (10.7%) | 486 (13.6%) |
| 7:30 AM to 7:59 AM | 527 (11.8%) | 479 (13.4%) |
| 8:00 AM to 8:29 AM | 158 (3.5%) | 577 (16.1%) |
| 8:30 AM to 8:59 AM | 110 (2.5%) | 325 (9.1%) |
| 9:00 AM to 9:59 AM | 33 (0.7%) | 147 (4.1%) |
| 10:00 AM to 10:59 AM | 0 (0.0%) | 20 (0.6%) |
| 11:00 AM to 11:59 AM | 14 (0.3%) | 39 (1.1%) |
| 12:00 PM to 3:59 PM | 343 (7.6%) | 196 (5.5%) |
| 4:00 PM to 11:59 PM | 448 (10.0%) | 412 (11.5%) |
| Total | 4,481 (100.0%) | 3,574 (100.0%) |
Housing Occupancy in Kingsland
Occupancy by Ownership in Kingsland
Of the total 6,561 dwellings in Kingsland, owner-occupied units account for 4,537 (69.2%), while renter-occupied units make up 2,024 (30.8%).
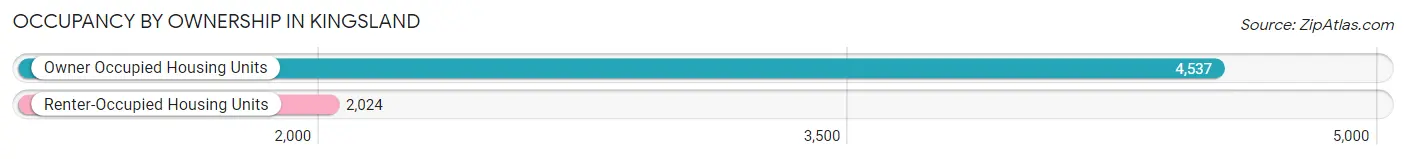
| Occupancy | # Housing Units | % Housing Units |
| Owner Occupied Housing Units | 4,537 | 69.2% |
| Renter-Occupied Housing Units | 2,024 | 30.8% |
| Total Occupied Housing Units | 6,561 | 100.0% |
Occupancy by Household Size in Kingsland
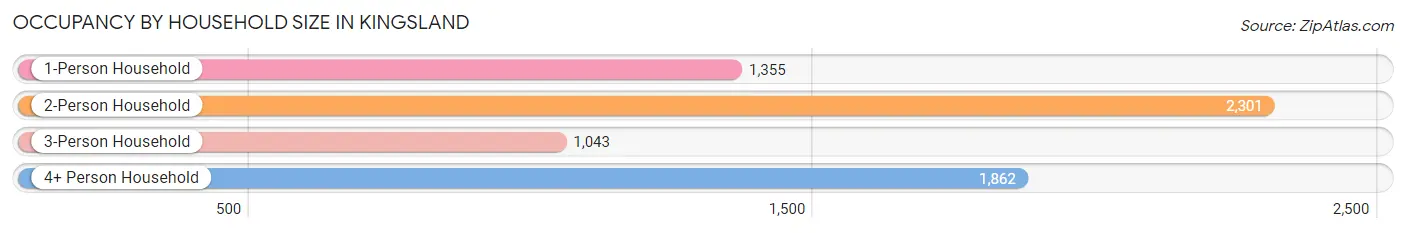
| Household Size | # Housing Units | % Housing Units |
| 1-Person Household | 1,355 | 20.6% |
| 2-Person Household | 2,301 | 35.1% |
| 3-Person Household | 1,043 | 15.9% |
| 4+ Person Household | 1,862 | 28.4% |
| Total Housing Units | 6,561 | 100.0% |
Occupancy by Ownership by Household Size in Kingsland
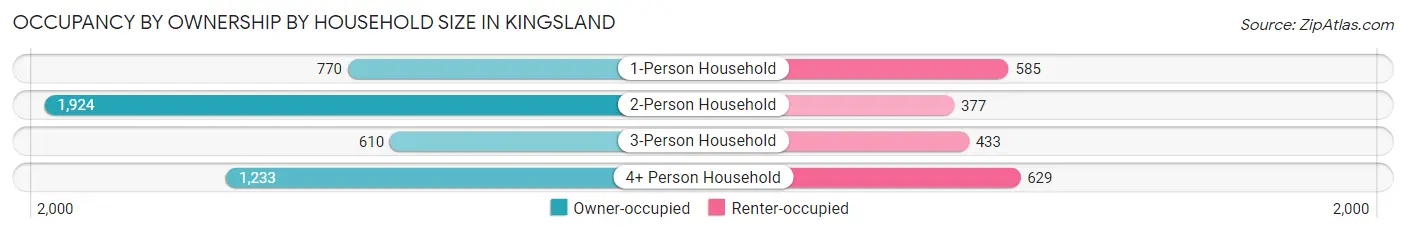
| Household Size | Owner-occupied | Renter-occupied |
| 1-Person Household | 770 (56.8%) | 585 (43.2%) |
| 2-Person Household | 1,924 (83.6%) | 377 (16.4%) |
| 3-Person Household | 610 (58.5%) | 433 (41.5%) |
| 4+ Person Household | 1,233 (66.2%) | 629 (33.8%) |
| Total Housing Units | 4,537 (69.2%) | 2,024 (30.8%) |
Occupancy by Educational Attainment in Kingsland
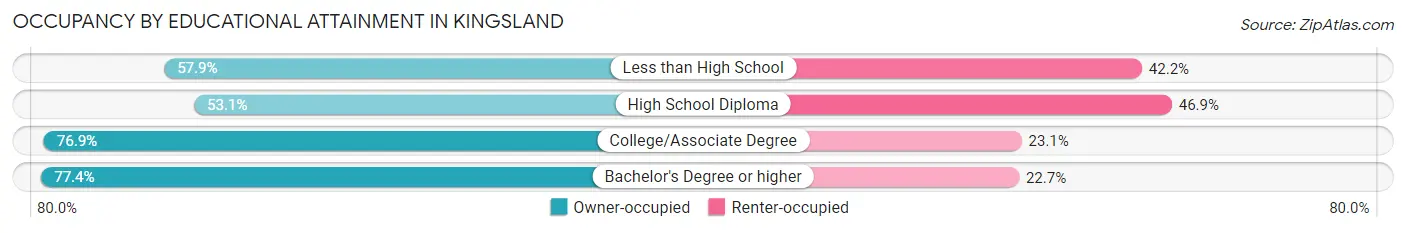
| Household Size | Owner-occupied | Renter-occupied |
| Less than High School | 280 (57.9%) | 204 (42.1%) |
| High School Diploma | 947 (53.1%) | 836 (46.9%) |
| College/Associate Degree | 2,077 (76.9%) | 623 (23.1%) |
| Bachelor's Degree or higher | 1,233 (77.3%) | 361 (22.7%) |
Occupancy by Age of Householder in Kingsland
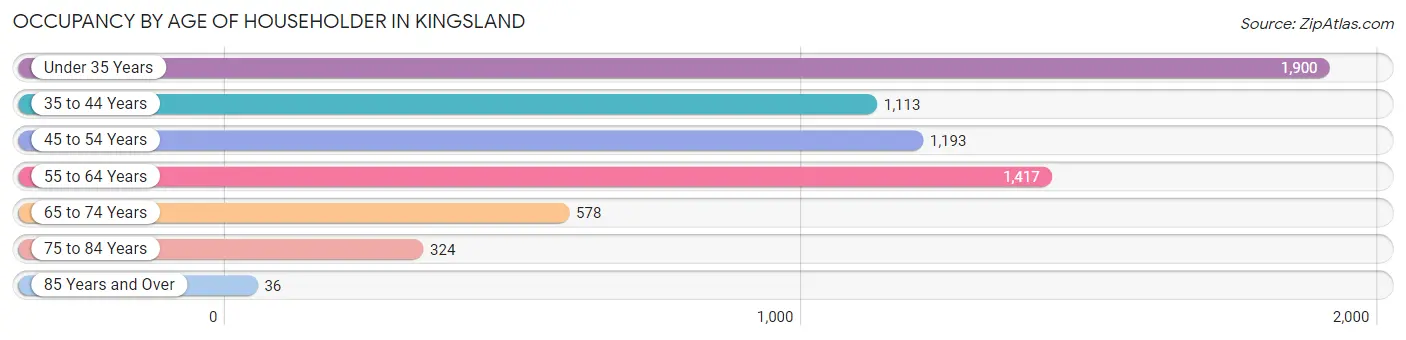
| Age Bracket | # Households | % Households |
| Under 35 Years | 1,900 | 29.0% |
| 35 to 44 Years | 1,113 | 17.0% |
| 45 to 54 Years | 1,193 | 18.2% |
| 55 to 64 Years | 1,417 | 21.6% |
| 65 to 74 Years | 578 | 8.8% |
| 75 to 84 Years | 324 | 4.9% |
| 85 Years and Over | 36 | 0.5% |
| Total | 6,561 | 100.0% |
Housing Finances in Kingsland
Median Income by Occupancy in Kingsland
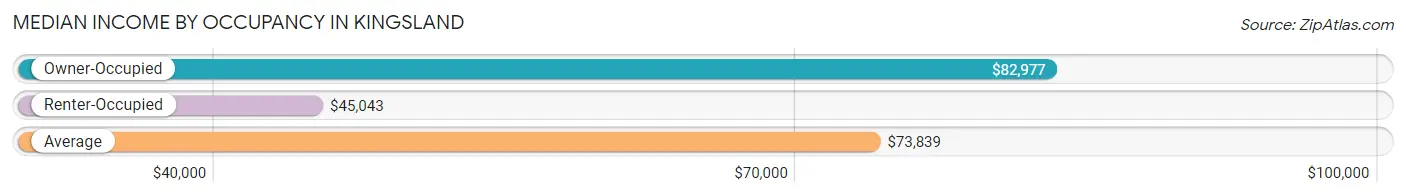
| Occupancy Type | # Households | Median Income |
| Owner-Occupied | 4,537 (69.2%) | $82,977 |
| Renter-Occupied | 2,024 (30.8%) | $45,043 |
| Average | 6,561 (100.0%) | $73,839 |
Occupancy by Householder Income Bracket in Kingsland
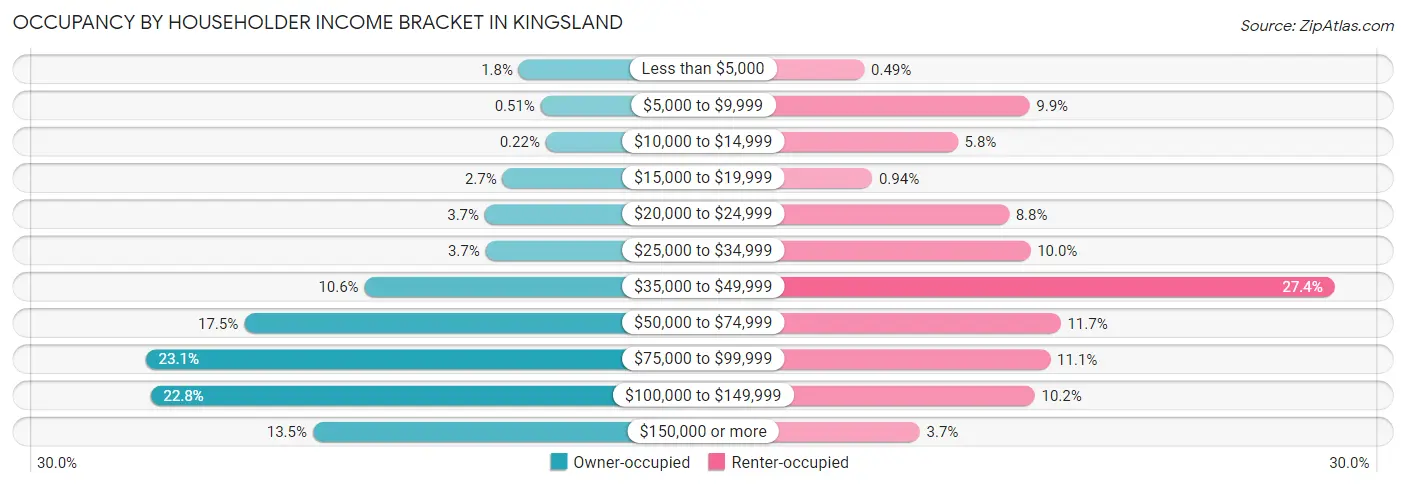
| Income Bracket | Owner-occupied | Renter-occupied |
| Less than $5,000 | 80 (1.8%) | 10 (0.5%) |
| $5,000 to $9,999 | 23 (0.5%) | 201 (9.9%) |
| $10,000 to $14,999 | 10 (0.2%) | 118 (5.8%) |
| $15,000 to $19,999 | 122 (2.7%) | 19 (0.9%) |
| $20,000 to $24,999 | 168 (3.7%) | 177 (8.7%) |
| $25,000 to $34,999 | 166 (3.7%) | 202 (10.0%) |
| $35,000 to $49,999 | 480 (10.6%) | 554 (27.4%) |
| $50,000 to $74,999 | 792 (17.5%) | 237 (11.7%) |
| $75,000 to $99,999 | 1,047 (23.1%) | 225 (11.1%) |
| $100,000 to $149,999 | 1,035 (22.8%) | 207 (10.2%) |
| $150,000 or more | 614 (13.5%) | 74 (3.7%) |
| Total | 4,537 (100.0%) | 2,024 (100.0%) |
Monthly Housing Cost Tiers in Kingsland
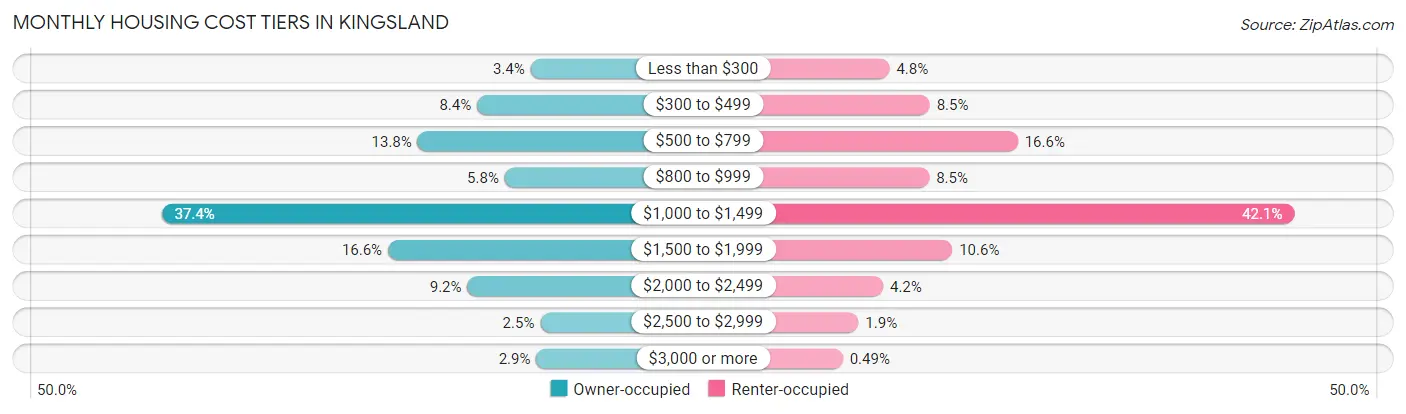
| Monthly Cost | Owner-occupied | Renter-occupied |
| Less than $300 | 155 (3.4%) | 97 (4.8%) |
| $300 to $499 | 379 (8.4%) | 172 (8.5%) |
| $500 to $799 | 627 (13.8%) | 336 (16.6%) |
| $800 to $999 | 263 (5.8%) | 171 (8.5%) |
| $1,000 to $1,499 | 1,697 (37.4%) | 851 (42.0%) |
| $1,500 to $1,999 | 751 (16.6%) | 214 (10.6%) |
| $2,000 to $2,499 | 419 (9.2%) | 85 (4.2%) |
| $2,500 to $2,999 | 115 (2.5%) | 39 (1.9%) |
| $3,000 or more | 131 (2.9%) | 10 (0.5%) |
| Total | 4,537 (100.0%) | 2,024 (100.0%) |
Physical Housing Characteristics in Kingsland
Housing Structures in Kingsland
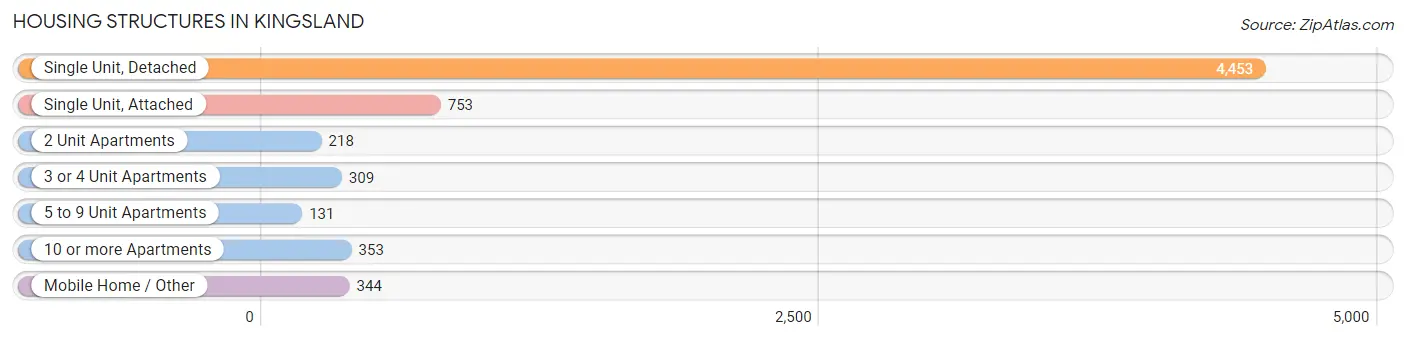
| Structure Type | # Housing Units | % Housing Units |
| Single Unit, Detached | 4,453 | 67.9% |
| Single Unit, Attached | 753 | 11.5% |
| 2 Unit Apartments | 218 | 3.3% |
| 3 or 4 Unit Apartments | 309 | 4.7% |
| 5 to 9 Unit Apartments | 131 | 2.0% |
| 10 or more Apartments | 353 | 5.4% |
| Mobile Home / Other | 344 | 5.2% |
| Total | 6,561 | 100.0% |
Housing Structures by Occupancy in Kingsland
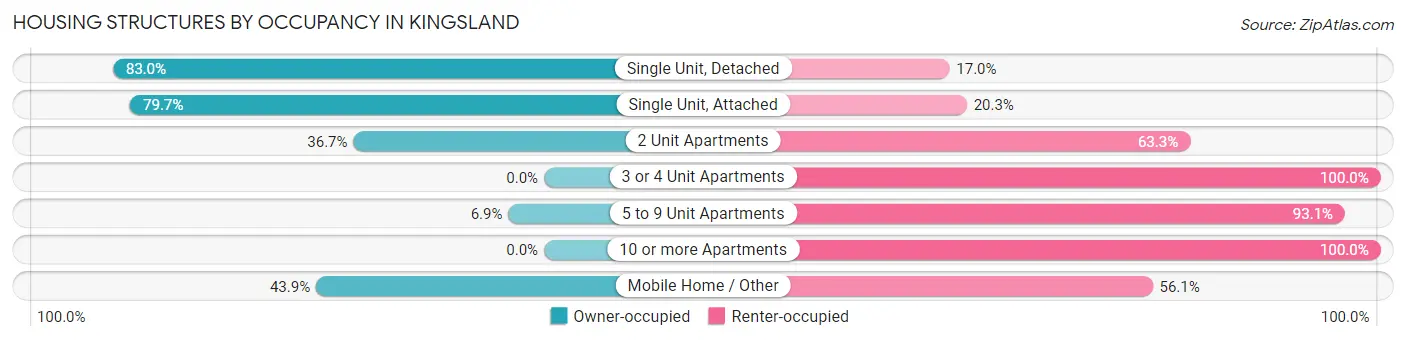
| Structure Type | Owner-occupied | Renter-occupied |
| Single Unit, Detached | 3,697 (83.0%) | 756 (17.0%) |
| Single Unit, Attached | 600 (79.7%) | 153 (20.3%) |
| 2 Unit Apartments | 80 (36.7%) | 138 (63.3%) |
| 3 or 4 Unit Apartments | 0 (0.0%) | 309 (100.0%) |
| 5 to 9 Unit Apartments | 9 (6.9%) | 122 (93.1%) |
| 10 or more Apartments | 0 (0.0%) | 353 (100.0%) |
| Mobile Home / Other | 151 (43.9%) | 193 (56.1%) |
| Total | 4,537 (69.2%) | 2,024 (30.8%) |
Housing Structures by Number of Rooms in Kingsland
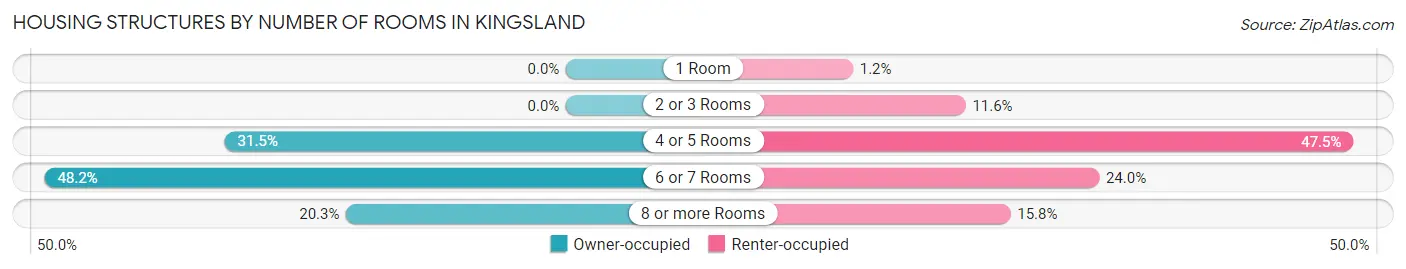
| Number of Rooms | Owner-occupied | Renter-occupied |
| 1 Room | 0 (0.0%) | 24 (1.2%) |
| 2 or 3 Rooms | 0 (0.0%) | 235 (11.6%) |
| 4 or 5 Rooms | 1,429 (31.5%) | 961 (47.5%) |
| 6 or 7 Rooms | 2,185 (48.2%) | 485 (24.0%) |
| 8 or more Rooms | 923 (20.3%) | 319 (15.8%) |
| Total | 4,537 (100.0%) | 2,024 (100.0%) |
Housing Structure by Heating Type in Kingsland
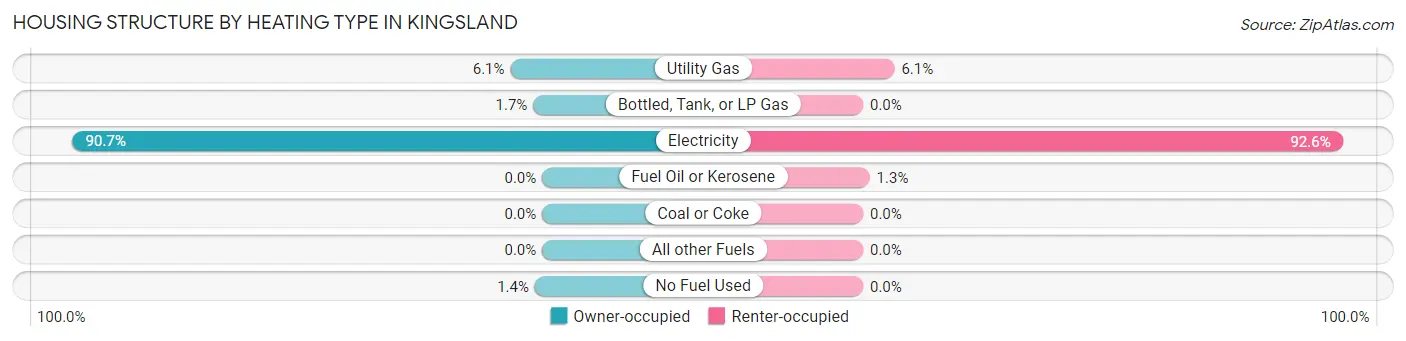
| Heating Type | Owner-occupied | Renter-occupied |
| Utility Gas | 278 (6.1%) | 123 (6.1%) |
| Bottled, Tank, or LP Gas | 78 (1.7%) | 0 (0.0%) |
| Electricity | 4,117 (90.7%) | 1,875 (92.6%) |
| Fuel Oil or Kerosene | 0 (0.0%) | 26 (1.3%) |
| Coal or Coke | 0 (0.0%) | 0 (0.0%) |
| All other Fuels | 0 (0.0%) | 0 (0.0%) |
| No Fuel Used | 64 (1.4%) | 0 (0.0%) |
| Total | 4,537 (100.0%) | 2,024 (100.0%) |
Household Vehicle Usage in Kingsland
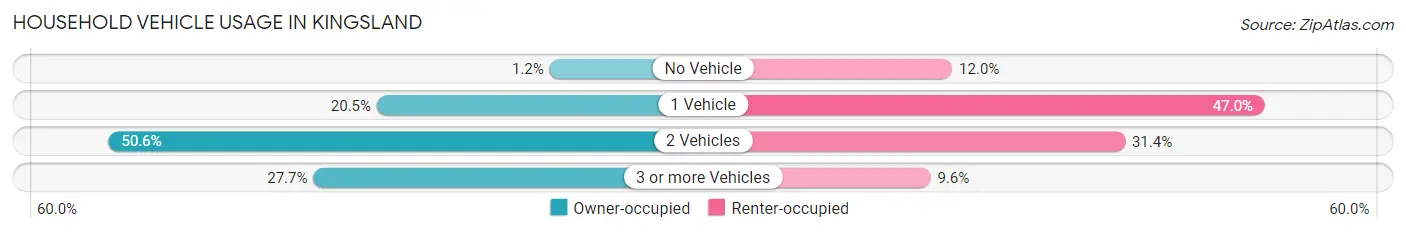
| Vehicles per Household | Owner-occupied | Renter-occupied |
| No Vehicle | 54 (1.2%) | 243 (12.0%) |
| 1 Vehicle | 932 (20.5%) | 952 (47.0%) |
| 2 Vehicles | 2,296 (50.6%) | 635 (31.4%) |
| 3 or more Vehicles | 1,255 (27.7%) | 194 (9.6%) |
| Total | 4,537 (100.0%) | 2,024 (100.0%) |
Real Estate & Mortgages in Kingsland
Real Estate and Mortgage Overview in Kingsland
| Characteristic | Without Mortgage | With Mortgage |
| Housing Units | 944 | 3,593 |
| Median Property Value | $196,600 | $208,800 |
| Median Household Income | $71,250 | $461 |
| Monthly Housing Costs | $493 | $131 |
| Real Estate Taxes | $1,854 | $196 |
Property Value by Mortgage Status in Kingsland
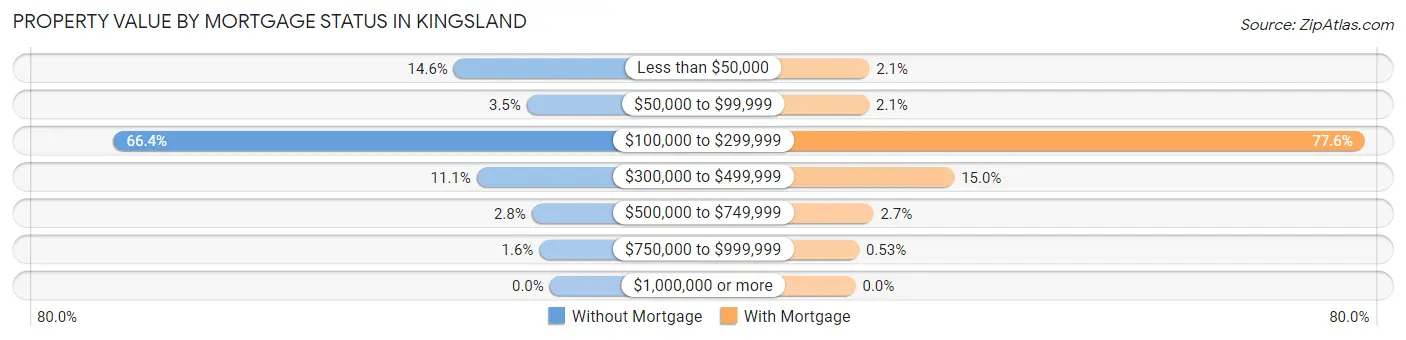
| Property Value | Without Mortgage | With Mortgage |
| Less than $50,000 | 138 (14.6%) | 75 (2.1%) |
| $50,000 to $99,999 | 33 (3.5%) | 74 (2.1%) |
| $100,000 to $299,999 | 627 (66.4%) | 2,787 (77.6%) |
| $300,000 to $499,999 | 105 (11.1%) | 540 (15.0%) |
| $500,000 to $749,999 | 26 (2.8%) | 98 (2.7%) |
| $750,000 to $999,999 | 15 (1.6%) | 19 (0.5%) |
| $1,000,000 or more | 0 (0.0%) | 0 (0.0%) |
| Total | 944 (100.0%) | 3,593 (100.0%) |
Household Income by Mortgage Status in Kingsland
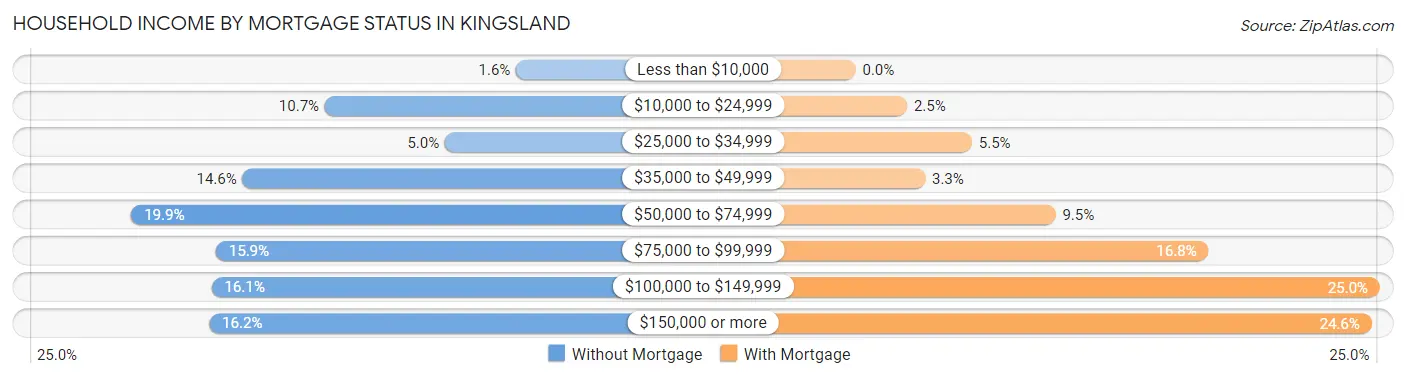
| Household Income | Without Mortgage | With Mortgage |
| Less than $10,000 | 15 (1.6%) | 0 (0.0%) |
| $10,000 to $24,999 | 101 (10.7%) | 88 (2.5%) |
| $25,000 to $34,999 | 47 (5.0%) | 199 (5.5%) |
| $35,000 to $49,999 | 138 (14.6%) | 119 (3.3%) |
| $50,000 to $74,999 | 188 (19.9%) | 342 (9.5%) |
| $75,000 to $99,999 | 150 (15.9%) | 604 (16.8%) |
| $100,000 to $149,999 | 152 (16.1%) | 897 (25.0%) |
| $150,000 or more | 153 (16.2%) | 883 (24.6%) |
| Total | 944 (100.0%) | 3,593 (100.0%) |
Property Value to Household Income Ratio in Kingsland
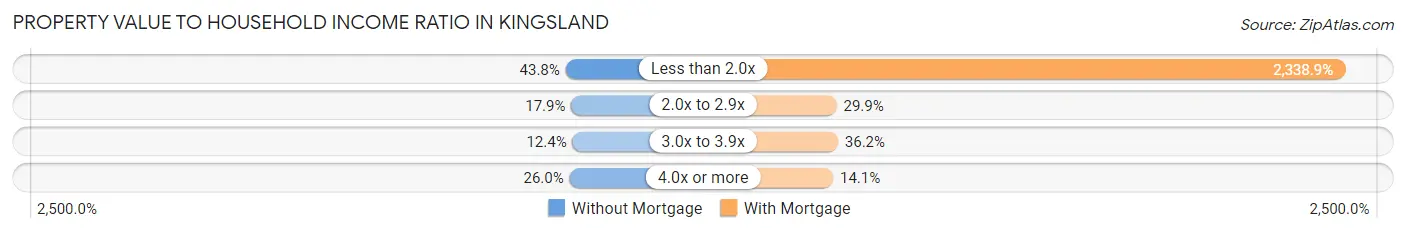
| Value-to-Income Ratio | Without Mortgage | With Mortgage |
| Less than 2.0x | 413 (43.8%) | 84,038 (2,338.9%) |
| 2.0x to 2.9x | 169 (17.9%) | 1,075 (29.9%) |
| 3.0x to 3.9x | 117 (12.4%) | 1,299 (36.1%) |
| 4.0x or more | 245 (26.0%) | 505 (14.1%) |
| Total | 944 (100.0%) | 3,593 (100.0%) |
Real Estate Taxes by Mortgage Status in Kingsland
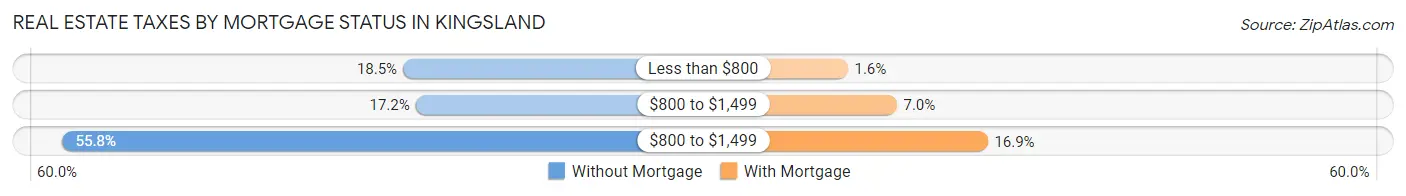
| Property Taxes | Without Mortgage | With Mortgage |
| Less than $800 | 175 (18.5%) | 57 (1.6%) |
| $800 to $1,499 | 162 (17.2%) | 250 (7.0%) |
| $800 to $1,499 | 527 (55.8%) | 608 (16.9%) |
| Total | 944 (100.0%) | 3,593 (100.0%) |
Health & Disability in Kingsland
Health Insurance Coverage by Age in Kingsland
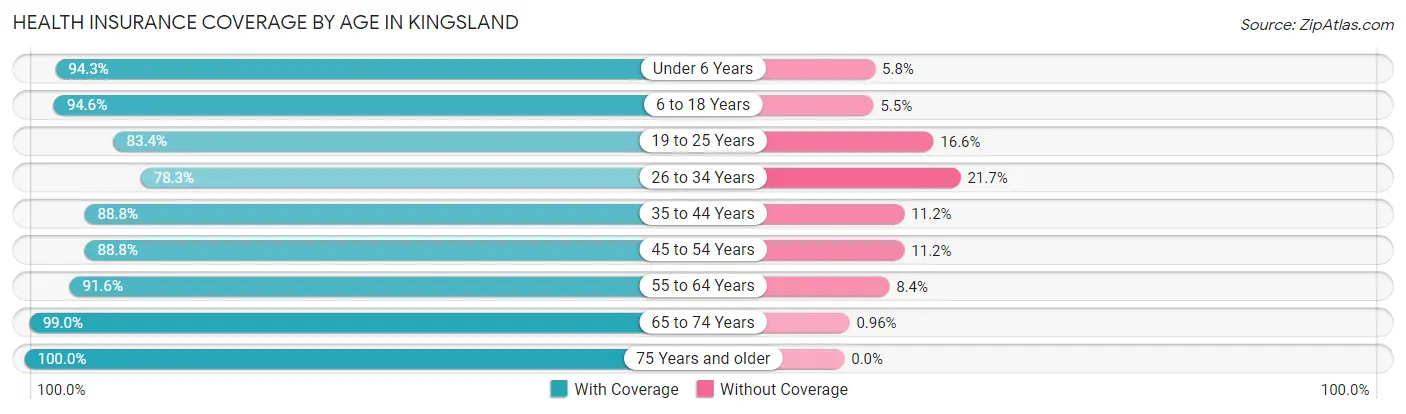
| Age Bracket | With Coverage | Without Coverage |
| Under 6 Years | 1,623 (94.3%) | 99 (5.8%) |
| 6 to 18 Years | 3,784 (94.6%) | 218 (5.4%) |
| 19 to 25 Years | 974 (83.4%) | 194 (16.6%) |
| 26 to 34 Years | 1,901 (78.3%) | 526 (21.7%) |
| 35 to 44 Years | 1,948 (88.8%) | 246 (11.2%) |
| 45 to 54 Years | 1,879 (88.8%) | 237 (11.2%) |
| 55 to 64 Years | 1,899 (91.6%) | 174 (8.4%) |
| 65 to 74 Years | 1,233 (99.0%) | 12 (1.0%) |
| 75 Years and older | 642 (100.0%) | 0 (0.0%) |
| Total | 15,883 (90.3%) | 1,706 (9.7%) |
Health Insurance Coverage by Citizenship Status in Kingsland
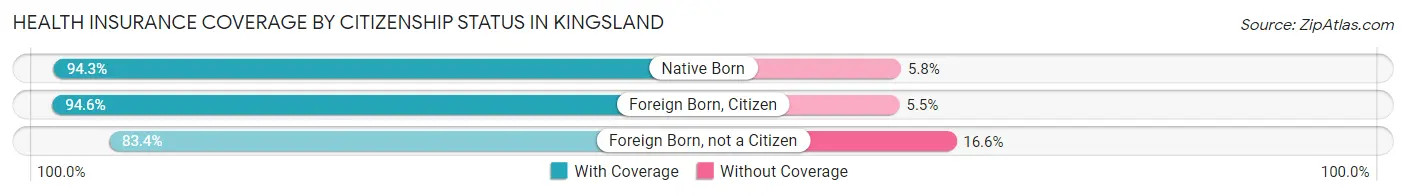
| Citizenship Status | With Coverage | Without Coverage |
| Native Born | 1,623 (94.3%) | 99 (5.8%) |
| Foreign Born, Citizen | 3,784 (94.6%) | 218 (5.4%) |
| Foreign Born, not a Citizen | 974 (83.4%) | 194 (16.6%) |
Health Insurance Coverage by Household Income in Kingsland
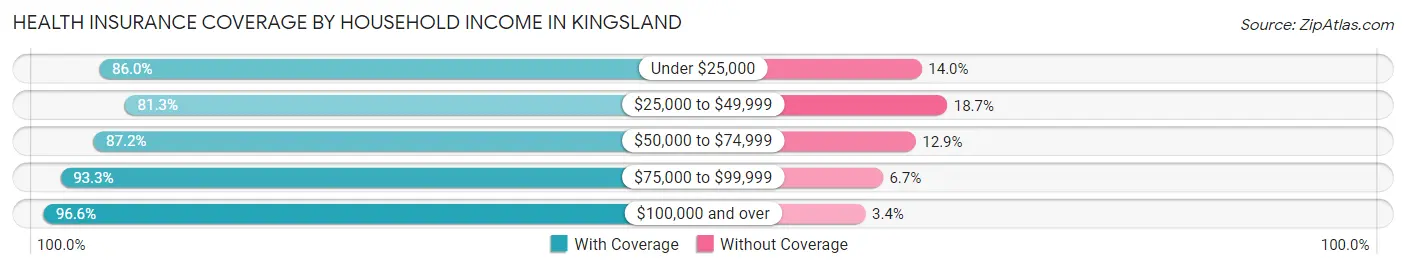
| Household Income | With Coverage | Without Coverage |
| Under $25,000 | 2,044 (86.0%) | 332 (14.0%) |
| $25,000 to $49,999 | 2,731 (81.3%) | 630 (18.7%) |
| $50,000 to $74,999 | 2,035 (87.2%) | 300 (12.9%) |
| $75,000 to $99,999 | 3,380 (93.3%) | 242 (6.7%) |
| $100,000 and over | 5,693 (96.6%) | 202 (3.4%) |
Public vs Private Health Insurance Coverage by Age in Kingsland
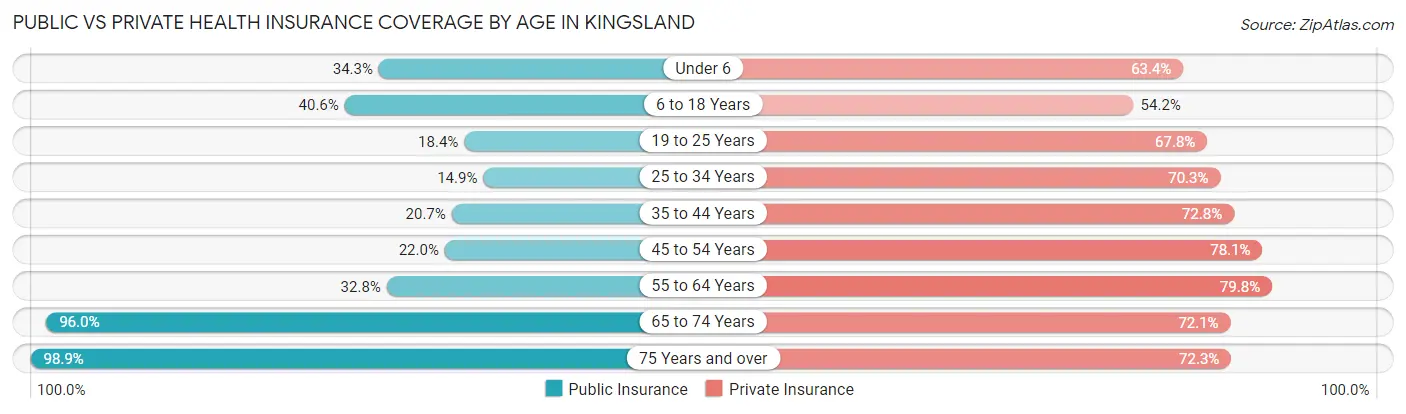
| Age Bracket | Public Insurance | Private Insurance |
| Under 6 | 590 (34.3%) | 1,091 (63.4%) |
| 6 to 18 Years | 1,625 (40.6%) | 2,168 (54.2%) |
| 19 to 25 Years | 215 (18.4%) | 792 (67.8%) |
| 25 to 34 Years | 361 (14.9%) | 1,705 (70.3%) |
| 35 to 44 Years | 455 (20.7%) | 1,597 (72.8%) |
| 45 to 54 Years | 466 (22.0%) | 1,652 (78.1%) |
| 55 to 64 Years | 680 (32.8%) | 1,655 (79.8%) |
| 65 to 74 Years | 1,195 (96.0%) | 898 (72.1%) |
| 75 Years and over | 635 (98.9%) | 464 (72.3%) |
| Total | 6,222 (35.4%) | 12,022 (68.3%) |
Disability Status by Sex by Age in Kingsland
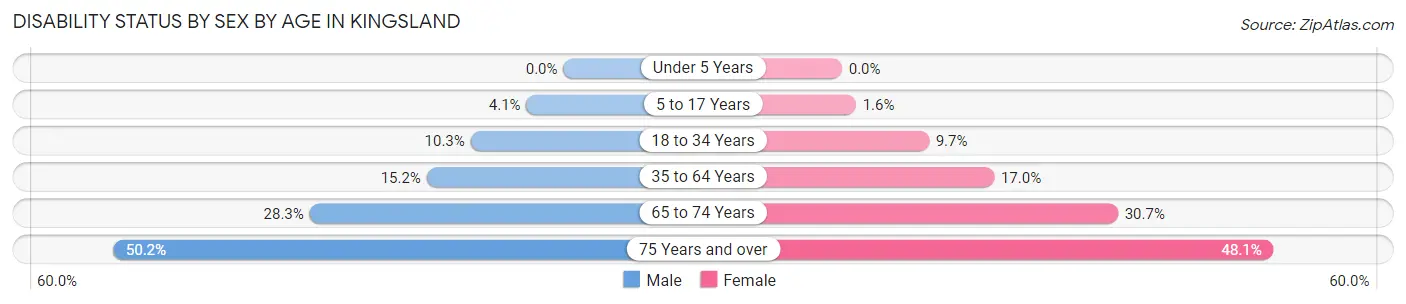
| Age Bracket | Male | Female |
| Under 5 Years | 0 (0.0%) | 0 (0.0%) |
| 5 to 17 Years | 81 (4.1%) | 27 (1.5%) |
| 18 to 34 Years | 220 (10.3%) | 214 (9.7%) |
| 35 to 64 Years | 431 (15.2%) | 602 (17.0%) |
| 65 to 74 Years | 167 (28.3%) | 201 (30.7%) |
| 75 Years and over | 151 (50.2%) | 164 (48.1%) |
Disability Class by Sex by Age in Kingsland
Disability Class: Hearing Difficulty
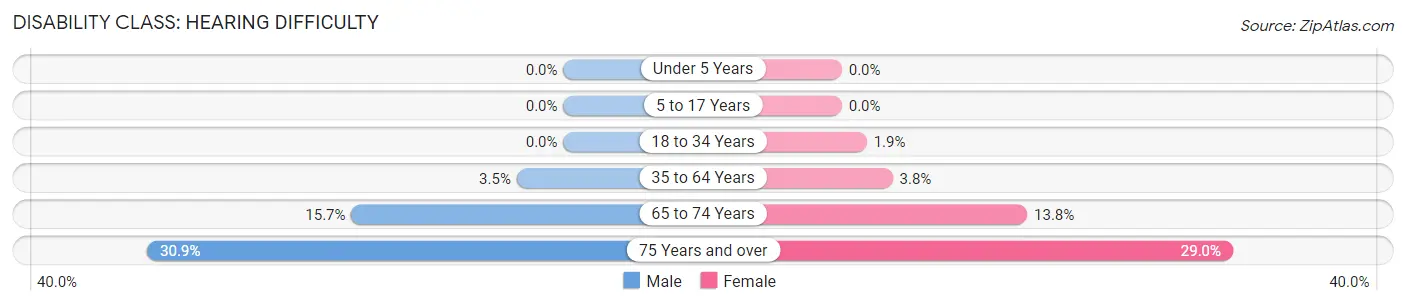
| Age Bracket | Male | Female |
| Under 5 Years | 0 (0.0%) | 0 (0.0%) |
| 5 to 17 Years | 0 (0.0%) | 0 (0.0%) |
| 18 to 34 Years | 0 (0.0%) | 41 (1.8%) |
| 35 to 64 Years | 98 (3.5%) | 134 (3.8%) |
| 65 to 74 Years | 93 (15.7%) | 90 (13.8%) |
| 75 Years and over | 93 (30.9%) | 99 (29.0%) |
Disability Class: Vision Difficulty
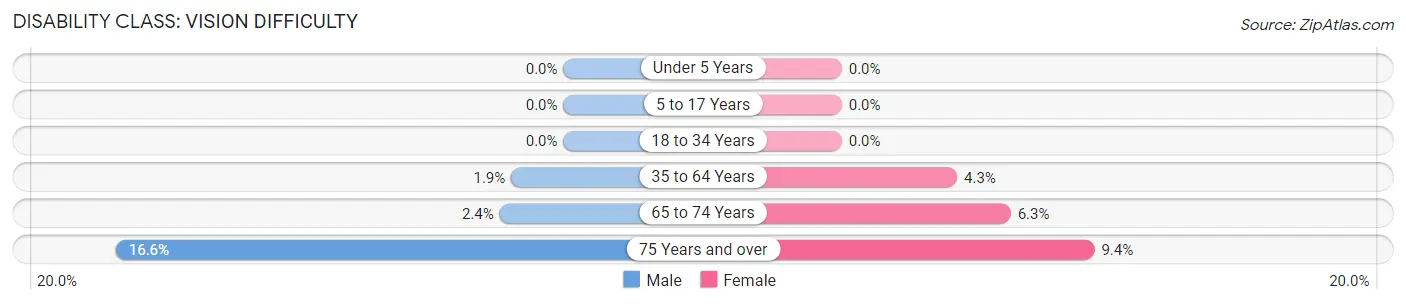
| Age Bracket | Male | Female |
| Under 5 Years | 0 (0.0%) | 0 (0.0%) |
| 5 to 17 Years | 0 (0.0%) | 0 (0.0%) |
| 18 to 34 Years | 0 (0.0%) | 0 (0.0%) |
| 35 to 64 Years | 55 (1.9%) | 152 (4.3%) |
| 65 to 74 Years | 14 (2.4%) | 41 (6.3%) |
| 75 Years and over | 50 (16.6%) | 32 (9.4%) |
Disability Class: Cognitive Difficulty
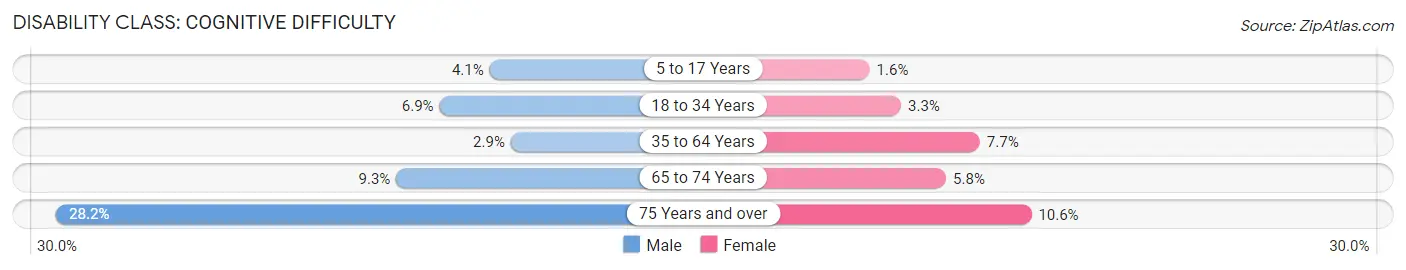
| Age Bracket | Male | Female |
| 5 to 17 Years | 81 (4.1%) | 27 (1.5%) |
| 18 to 34 Years | 147 (6.9%) | 73 (3.3%) |
| 35 to 64 Years | 83 (2.9%) | 273 (7.7%) |
| 65 to 74 Years | 55 (9.3%) | 38 (5.8%) |
| 75 Years and over | 85 (28.2%) | 36 (10.6%) |
Disability Class: Ambulatory Difficulty
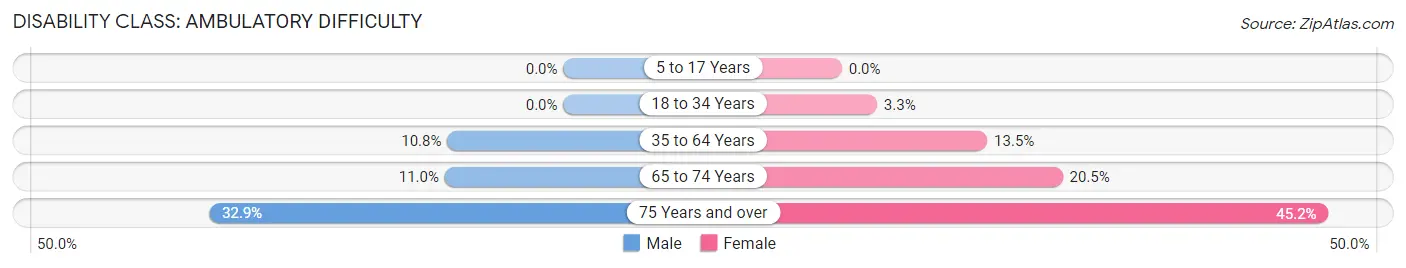
| Age Bracket | Male | Female |
| 5 to 17 Years | 0 (0.0%) | 0 (0.0%) |
| 18 to 34 Years | 0 (0.0%) | 72 (3.3%) |
| 35 to 64 Years | 305 (10.8%) | 479 (13.5%) |
| 65 to 74 Years | 65 (11.0%) | 134 (20.5%) |
| 75 Years and over | 99 (32.9%) | 154 (45.2%) |
Disability Class: Self-Care Difficulty
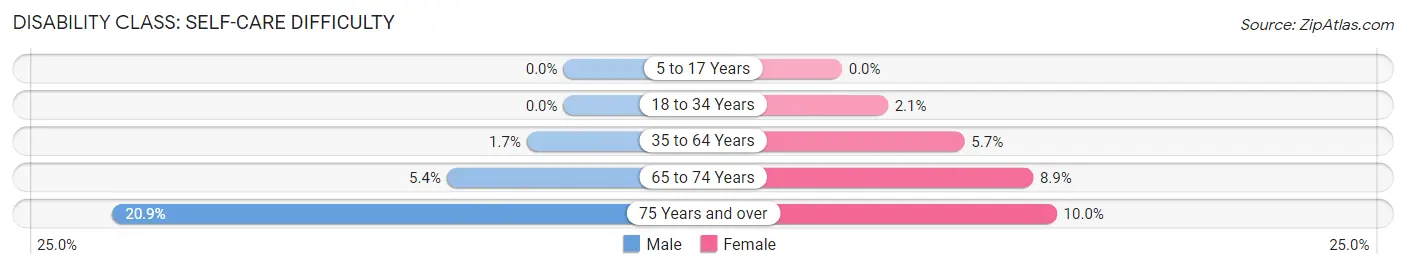
| Age Bracket | Male | Female |
| 5 to 17 Years | 0 (0.0%) | 0 (0.0%) |
| 18 to 34 Years | 0 (0.0%) | 47 (2.1%) |
| 35 to 64 Years | 48 (1.7%) | 202 (5.7%) |
| 65 to 74 Years | 32 (5.4%) | 58 (8.9%) |
| 75 Years and over | 63 (20.9%) | 34 (10.0%) |
Technology Access in Kingsland
Computing Device Access in Kingsland
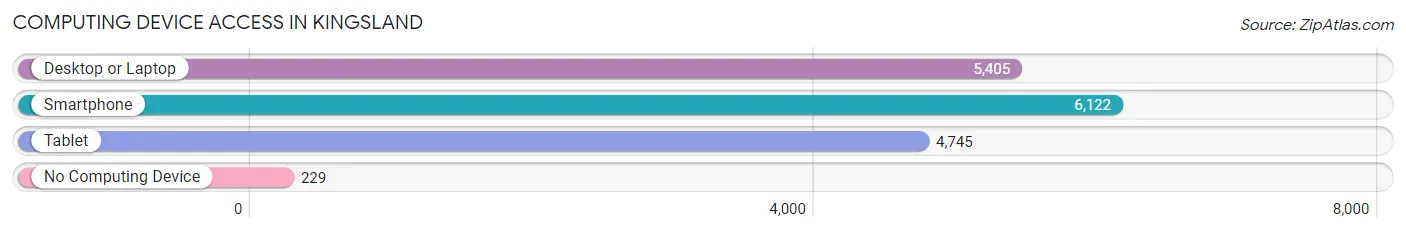
| Device Type | # Households | % Households |
| Desktop or Laptop | 5,405 | 82.4% |
| Smartphone | 6,122 | 93.3% |
| Tablet | 4,745 | 72.3% |
| No Computing Device | 229 | 3.5% |
| Total | 6,561 | 100.0% |
Internet Access in Kingsland
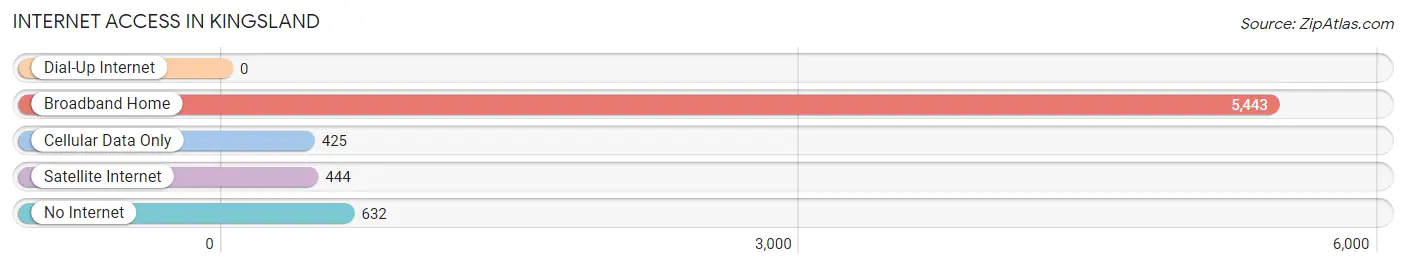
| Internet Type | # Households | % Households |
| Dial-Up Internet | 0 | 0.0% |
| Broadband Home | 5,443 | 83.0% |
| Cellular Data Only | 425 | 6.5% |
| Satellite Internet | 444 | 6.8% |
| No Internet | 632 | 9.6% |
| Total | 6,561 | 100.0% |
Kingsland Summary
History
Kingsland, Georgia is a small city located in Camden County, Georgia. It is situated on the St. Marys River, which forms the border between Georgia and Florida. The city was founded in 1783 and was originally known as “St. Marys”. The city was renamed “Kingsland” in 1891 in honor of the King of England, George III.
The city of Kingsland has a rich history that dates back to the early 1700s. The area was first inhabited by the Timucuan Indians, who were later displaced by the Creek Indians. The Creek Indians were eventually forced out of the area by the British in the late 1700s. The British then established a trading post in the area, which was later destroyed by the Spanish in 1783.
In 1803, the city of Kingsland was officially established and named after the King of England, George III. The city quickly grew and became a major port for the export of cotton and other goods. The city was also home to a number of prominent businesses, including a cotton gin, a sawmill, and a gristmill.
In the late 1800s, the city of Kingsland experienced a period of growth and prosperity. The city was home to a number of prominent businesses, including a cotton gin, a sawmill, and a gristmill. The city also became a major shipping port for the export of cotton and other goods.
In the early 1900s, the city of Kingsland experienced a period of decline. The city’s economy was heavily dependent on the export of cotton, which declined due to the boll weevil infestation. The city also experienced a number of devastating fires, which destroyed many of the city’s businesses and homes.
In the late 1900s, the city of Kingsland experienced a period of revitalization. The city was home to a number of new businesses, including a number of retail stores, restaurants, and hotels. The city also experienced a period of population growth, as many people moved to the area to take advantage of the city’s economic opportunities.
Geography
Kingsland is located in Camden County, Georgia, on the St. Marys River. The city is situated on the northern edge of the Okefenokee Swamp, which is the largest blackwater swamp in North America. The city is located approximately 30 miles south of Jacksonville, Florida, and approximately 40 miles north of Brunswick, Georgia.
The city of Kingsland covers an area of approximately 8.5 square miles. The city is located at an elevation of approximately 30 feet above sea level. The city is located in a humid subtropical climate zone, which is characterized by hot, humid summers and mild winters.
Economy
The economy of Kingsland is largely based on the service industry. The city is home to a number of retail stores, restaurants, and hotels. The city is also home to a number of manufacturing companies, including a paper mill and a chemical plant.
The city of Kingsland is also home to a number of military installations, including the Kings Bay Naval Submarine Base and the Kings Bay Naval Air Station. The city is also home to a number of educational institutions, including the College of Coastal Georgia and the Camden County College.
Demographics
As of the 2010 census, the city of Kingsland had a population of 15,946. The racial makeup of the city was 75.3% White, 17.2% African American, 0.7% Native American, 1.2% Asian, 0.1% Pacific Islander, and 4.5% from other races. The median household income in the city was $37,945, and the median family income was $45,945. The per capita income in the city was $20,945.
Common Questions
What is the Total Population of Kingsland?
Total Population of Kingsland is 18,563.
What is the Total Male Population of Kingsland?
Total Male Population of Kingsland is 9,419.
What is the Total Female Population of Kingsland?
Total Female Population of Kingsland is 9,144.
What is the Ratio of Males per 100 Females in Kingsland?
There are 103.01 Males per 100 Females in Kingsland.
What is the Ratio of Females per 100 Males in Kingsland?
There are 97.08 Females per 100 Males in Kingsland.
What is the Median Population Age in Kingsland?
Median Population Age in Kingsland is 33.1 Years.
What is the Average Family Size in Kingsland
Average Family Size in Kingsland is 3.1 People.
What is the Average Household Size in Kingsland
Average Household Size in Kingsland is 2.8 People.
What is Per Capita Income in Kingsland?
Per Capita income in Kingsland is $31,573.
What is the Median Family Income in Kingsland?
Median Family Income in Kingsland is $77,819.
What is the Median Household income in Kingsland?
Median Household Income in Kingsland is $73,839.
What is Income or Wage Gap in Kingsland?
Income or Wage Gap in Kingsland is 51.5%.
Women in Kingsland earn 48.5 cents for every dollar earned by a man.
What is Inequality or Gini Index in Kingsland?
Inequality or Gini Index in Kingsland is 0.38.
How Large is the Labor Force in Kingsland?
There are 9,001 People in the Labor Forcein in Kingsland.
What is the Percentage of People in the Labor Force in Kingsland?
64.5% of People are in the Labor Force in Kingsland.
What is the Unemployment Rate in Kingsland?
Unemployment Rate in Kingsland is 3.7%.