Leesburg, FL
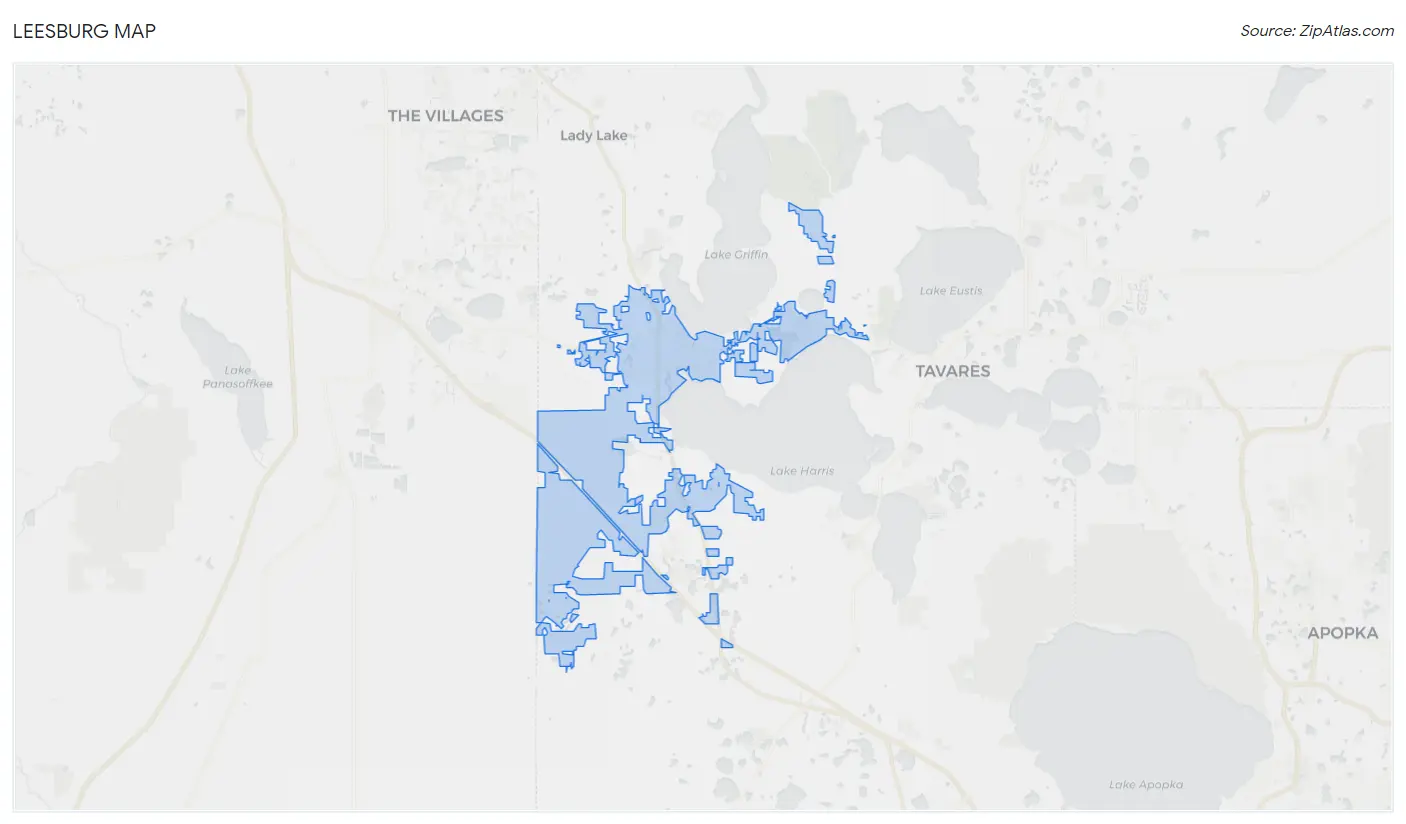
Leesburg Map
Leesburg Overview
27,226
TOTAL POPULATION
13,002
MALE POPULATION
14,224
FEMALE POPULATION
91.41
MALES / 100 FEMALES
109.40
FEMALES / 100 MALES
43.6
MEDIAN AGE
2.9
AVG FAMILY SIZE
2.4
AVG HOUSEHOLD SIZE
$26,327
PER CAPITA INCOME
$58,243
AVG FAMILY INCOME
$43,733
AVG HOUSEHOLD INCOME
11.5%
WAGE / INCOME GAP [ % ]
88.5¢/ $1
WAGE / INCOME GAP [ $ ]
0.44
INEQUALITY / GINI INDEX
11,445
LABOR FORCE [ PEOPLE ]
50.6%
PERCENT IN LABOR FORCE
10.4%
UNEMPLOYMENT RATE
Leesburg Area Codes
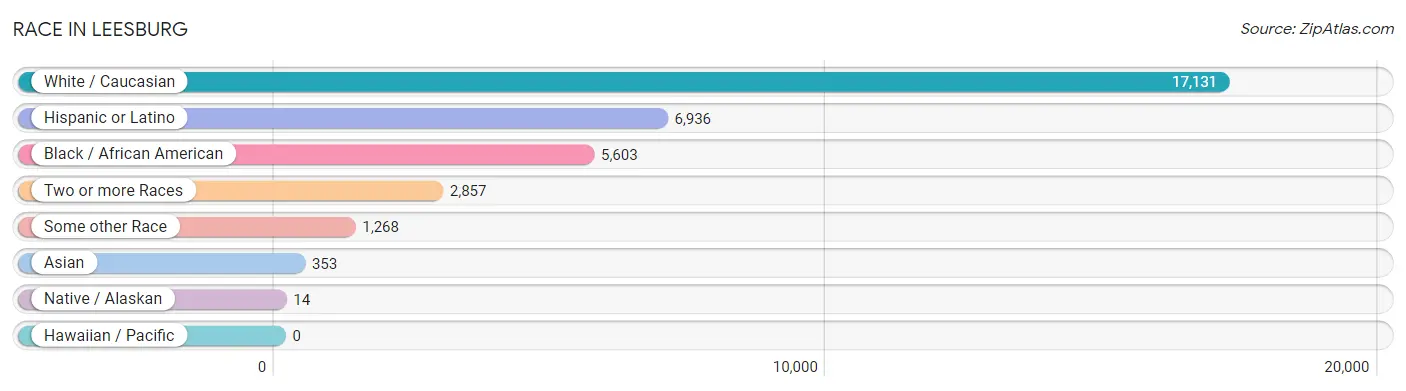
Race in Leesburg
The most populous races in Leesburg are White / Caucasian (17,131 | 62.9%), Hispanic or Latino (6,936 | 25.5%), and Black / African American (5,603 | 20.6%).
| Race | # Population | % Population |
| Asian | 353 | 1.3% |
| Black / African American | 5,603 | 20.6% |
| Hawaiian / Pacific | 0 | 0.0% |
| Hispanic or Latino | 6,936 | 25.5% |
| Native / Alaskan | 14 | 0.1% |
| White / Caucasian | 17,131 | 62.9% |
| Two or more Races | 2,857 | 10.5% |
| Some other Race | 1,268 | 4.7% |
| Total | 27,226 | 100.0% |
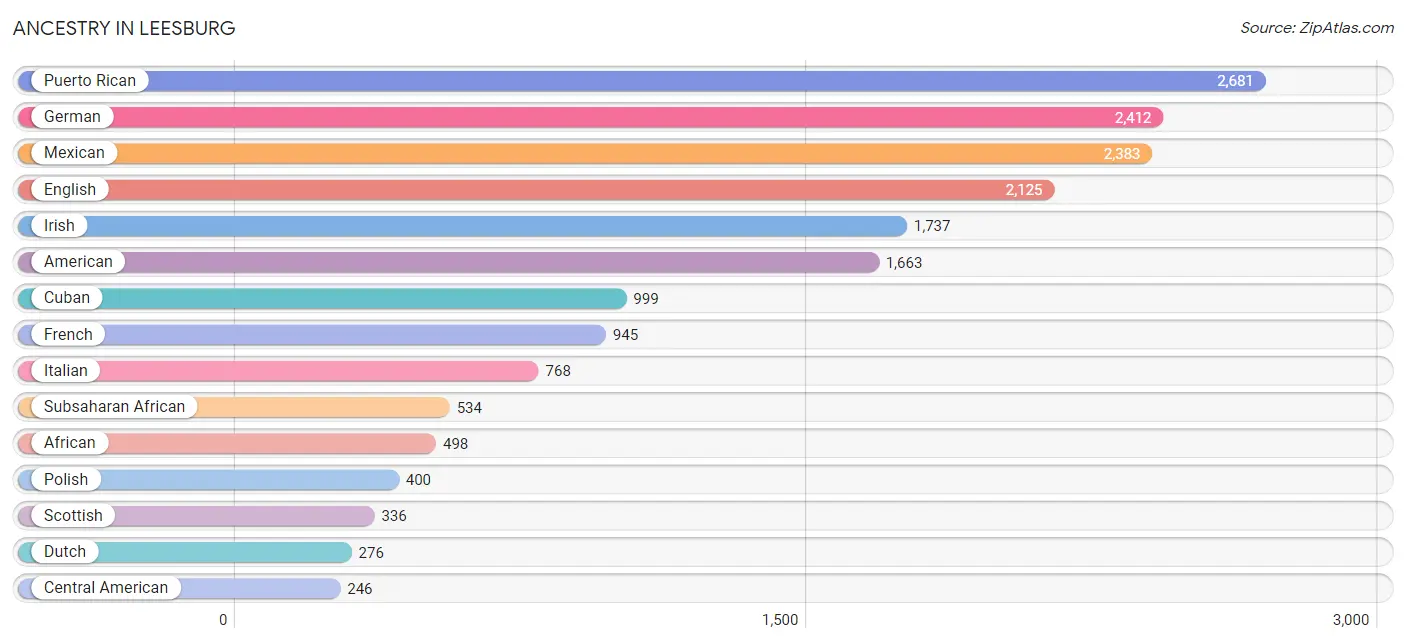
Ancestry in Leesburg
The most populous ancestries reported in Leesburg are Puerto Rican (2,681 | 9.9%), German (2,412 | 8.9%), Mexican (2,383 | 8.7%), English (2,125 | 7.8%), and Irish (1,737 | 6.4%), together accounting for 41.6% of all Leesburg residents.
| Ancestry | # Population | % Population |
| African | 498 | 1.8% |
| American | 1,663 | 6.1% |
| Arab | 51 | 0.2% |
| Argentinean | 12 | 0.0% |
| Bhutanese | 24 | 0.1% |
| Brazilian | 55 | 0.2% |
| British | 162 | 0.6% |
| Burmese | 10 | 0.0% |
| Canadian | 70 | 0.3% |
| Central American | 246 | 0.9% |
| Cherokee | 99 | 0.4% |
| Chilean | 30 | 0.1% |
| Chippewa | 28 | 0.1% |
| Colombian | 101 | 0.4% |
| Cuban | 999 | 3.7% |
| Czech | 21 | 0.1% |
| Czechoslovakian | 3 | 0.0% |
| Danish | 105 | 0.4% |
| Dominican | 177 | 0.6% |
| Dutch | 276 | 1.0% |
| Eastern European | 18 | 0.1% |
| Egyptian | 11 | 0.0% |
| English | 2,125 | 7.8% |
| European | 162 | 0.6% |
| Finnish | 37 | 0.1% |
| French | 945 | 3.5% |
| French Canadian | 231 | 0.9% |
| German | 2,412 | 8.9% |
| Greek | 95 | 0.4% |
| Guatemalan | 55 | 0.2% |
| Haitian | 182 | 0.7% |
| Hungarian | 97 | 0.4% |
| Indian (Asian) | 48 | 0.2% |
| Irish | 1,737 | 6.4% |
| Italian | 768 | 2.8% |
| Jamaican | 224 | 0.8% |
| Korean | 89 | 0.3% |
| Latvian | 24 | 0.1% |
| Lebanese | 20 | 0.1% |
| Lithuanian | 22 | 0.1% |
| Mexican | 2,383 | 8.7% |
| Nicaraguan | 71 | 0.3% |
| Northern European | 20 | 0.1% |
| Norwegian | 56 | 0.2% |
| Pakistani | 9 | 0.0% |
| Panamanian | 52 | 0.2% |
| Pennsylvania German | 21 | 0.1% |
| Polish | 400 | 1.5% |
| Portuguese | 152 | 0.6% |
| Puerto Rican | 2,681 | 9.9% |
| Romanian | 61 | 0.2% |
| Russian | 169 | 0.6% |
| Salvadoran | 68 | 0.3% |
| Scandinavian | 185 | 0.7% |
| Scotch-Irish | 110 | 0.4% |
| Scottish | 336 | 1.2% |
| Slavic | 5 | 0.0% |
| Slovak | 128 | 0.5% |
| South African | 4 | 0.0% |
| South American | 143 | 0.5% |
| Spaniard | 76 | 0.3% |
| Sri Lankan | 129 | 0.5% |
| Subsaharan African | 534 | 2.0% |
| Swedish | 45 | 0.2% |
| Swiss | 52 | 0.2% |
| Thai | 99 | 0.4% |
| Trinidadian and Tobagonian | 16 | 0.1% |
| Turkish | 13 | 0.1% |
| U.S. Virgin Islander | 17 | 0.1% |
| Ukrainian | 88 | 0.3% |
| Welsh | 61 | 0.2% | View All 71 Rows |
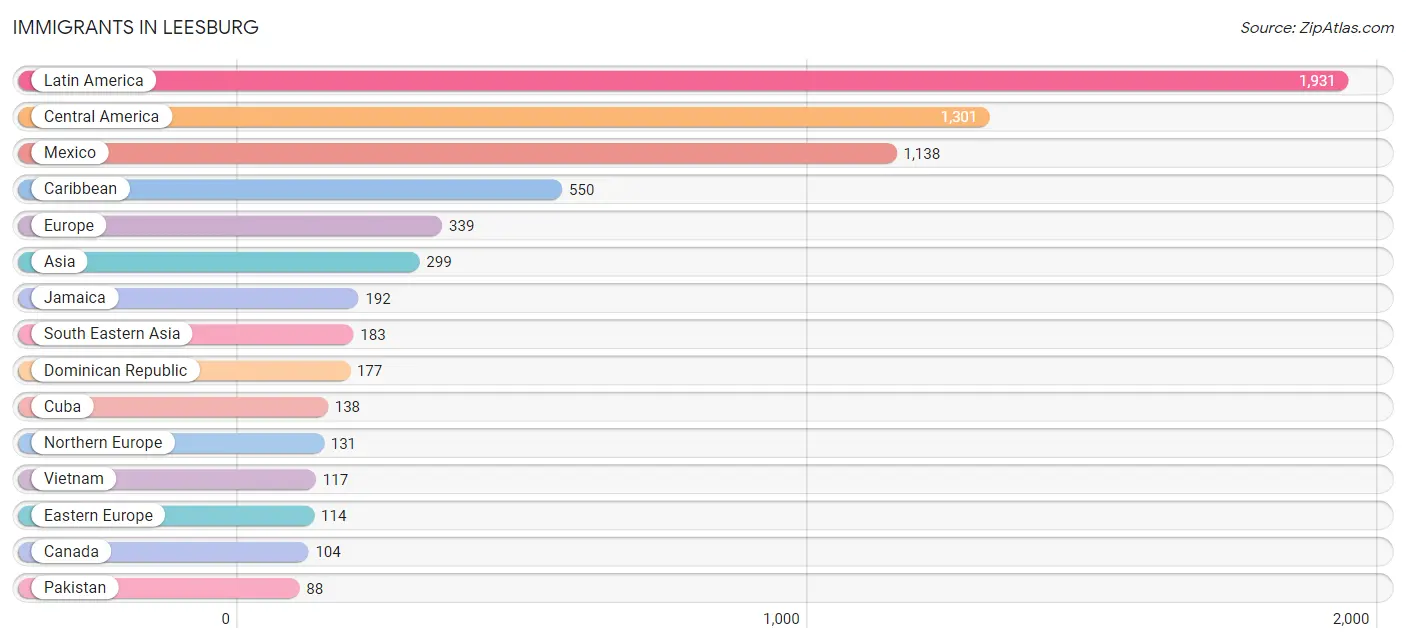
Immigrants in Leesburg
The most numerous immigrant groups reported in Leesburg came from Latin America (1,931 | 7.1%), Central America (1,301 | 4.8%), Mexico (1,138 | 4.2%), Caribbean (550 | 2.0%), and Europe (339 | 1.3%), together accounting for 19.3% of all Leesburg residents.
| Immigration Origin | # Population | % Population |
| Africa | 61 | 0.2% |
| Argentina | 12 | 0.0% |
| Asia | 299 | 1.1% |
| Barbados | 12 | 0.0% |
| Belize | 28 | 0.1% |
| Brazil | 22 | 0.1% |
| Canada | 104 | 0.4% |
| Caribbean | 550 | 2.0% |
| Central America | 1,301 | 4.8% |
| China | 28 | 0.1% |
| Colombia | 46 | 0.2% |
| Cuba | 138 | 0.5% |
| Czechoslovakia | 5 | 0.0% |
| Denmark | 17 | 0.1% |
| Dominican Republic | 177 | 0.6% |
| Eastern Asia | 28 | 0.1% |
| Eastern Europe | 114 | 0.4% |
| Egypt | 61 | 0.2% |
| England | 65 | 0.2% |
| Europe | 339 | 1.3% |
| Germany | 43 | 0.2% |
| Guatemala | 14 | 0.1% |
| Haiti | 6 | 0.0% |
| Hungary | 29 | 0.1% |
| Italy | 10 | 0.0% |
| Jamaica | 192 | 0.7% |
| Latin America | 1,931 | 7.1% |
| Latvia | 24 | 0.1% |
| Mexico | 1,138 | 4.2% |
| Netherlands | 41 | 0.2% |
| Nicaragua | 69 | 0.3% |
| Northern Africa | 61 | 0.2% |
| Northern Europe | 131 | 0.5% |
| Pakistan | 88 | 0.3% |
| Panama | 52 | 0.2% |
| Philippines | 57 | 0.2% |
| Romania | 16 | 0.1% |
| South America | 80 | 0.3% |
| South Central Asia | 88 | 0.3% |
| South Eastern Asia | 183 | 0.7% |
| Southern Europe | 10 | 0.0% |
| Thailand | 9 | 0.0% |
| Trinidad and Tobago | 25 | 0.1% |
| Ukraine | 19 | 0.1% |
| Vietnam | 117 | 0.4% |
| Western Europe | 84 | 0.3% | View All 46 Rows |
Sex and Age in Leesburg
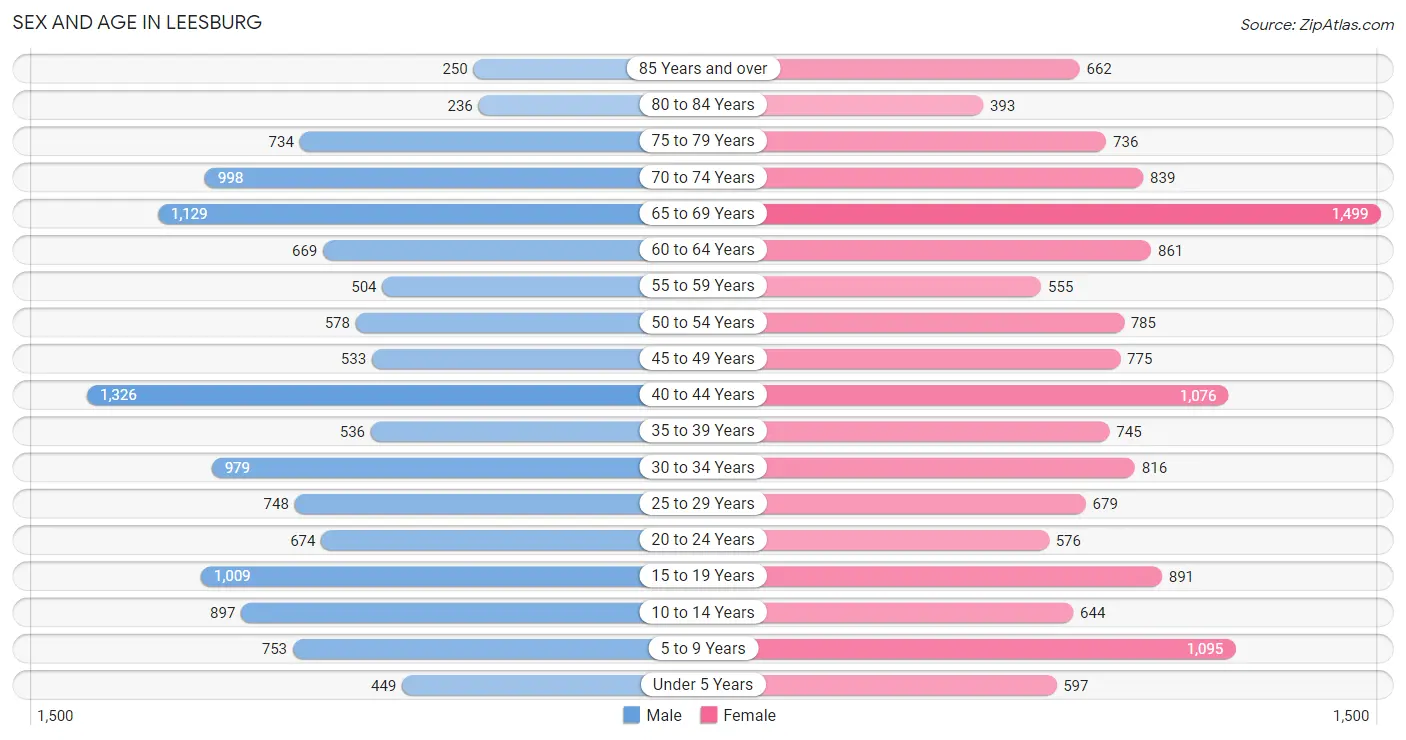
Sex and Age in Leesburg
The most populous age groups in Leesburg are 40 to 44 Years (1,326 | 10.2%) for men and 65 to 69 Years (1,499 | 10.5%) for women.
| Age Bracket | Male | Female |
| Under 5 Years | 449 (3.5%) | 597 (4.2%) |
| 5 to 9 Years | 753 (5.8%) | 1,095 (7.7%) |
| 10 to 14 Years | 897 (6.9%) | 644 (4.5%) |
| 15 to 19 Years | 1,009 (7.8%) | 891 (6.3%) |
| 20 to 24 Years | 674 (5.2%) | 576 (4.1%) |
| 25 to 29 Years | 748 (5.8%) | 679 (4.8%) |
| 30 to 34 Years | 979 (7.5%) | 816 (5.7%) |
| 35 to 39 Years | 536 (4.1%) | 745 (5.2%) |
| 40 to 44 Years | 1,326 (10.2%) | 1,076 (7.6%) |
| 45 to 49 Years | 533 (4.1%) | 775 (5.4%) |
| 50 to 54 Years | 578 (4.4%) | 785 (5.5%) |
| 55 to 59 Years | 504 (3.9%) | 555 (3.9%) |
| 60 to 64 Years | 669 (5.1%) | 861 (6.0%) |
| 65 to 69 Years | 1,129 (8.7%) | 1,499 (10.5%) |
| 70 to 74 Years | 998 (7.7%) | 839 (5.9%) |
| 75 to 79 Years | 734 (5.7%) | 736 (5.2%) |
| 80 to 84 Years | 236 (1.8%) | 393 (2.8%) |
| 85 Years and over | 250 (1.9%) | 662 (4.6%) |
| Total | 13,002 (100.0%) | 14,224 (100.0%) |
Families and Households in Leesburg
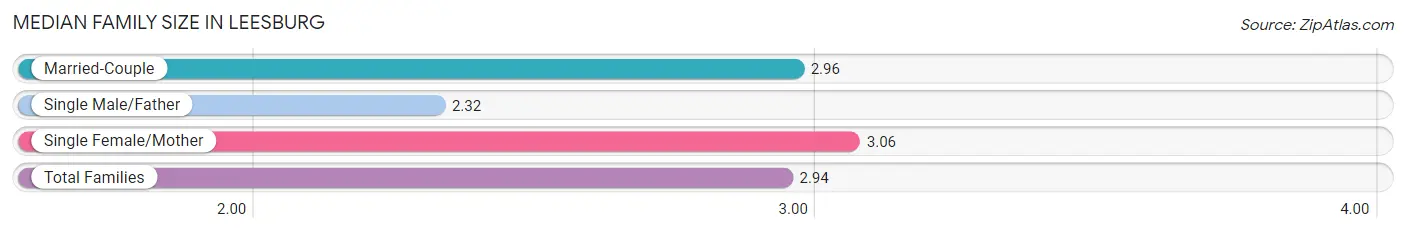
Median Family Size in Leesburg
The median family size in Leesburg is 2.94 persons per family, with single female/mother families (1,846 | 25.8%) accounting for the largest median family size of 3.06 persons per family. On the other hand, single male/father families (473 | 6.6%) represent the smallest median family size with 2.32 persons per family.
| Family Type | # Families | Family Size |
| Married-Couple | 4,844 (67.6%) | 2.96 |
| Single Male/Father | 473 (6.6%) | 2.32 |
| Single Female/Mother | 1,846 (25.8%) | 3.06 |
| Total Families | 7,163 (100.0%) | 2.94 |
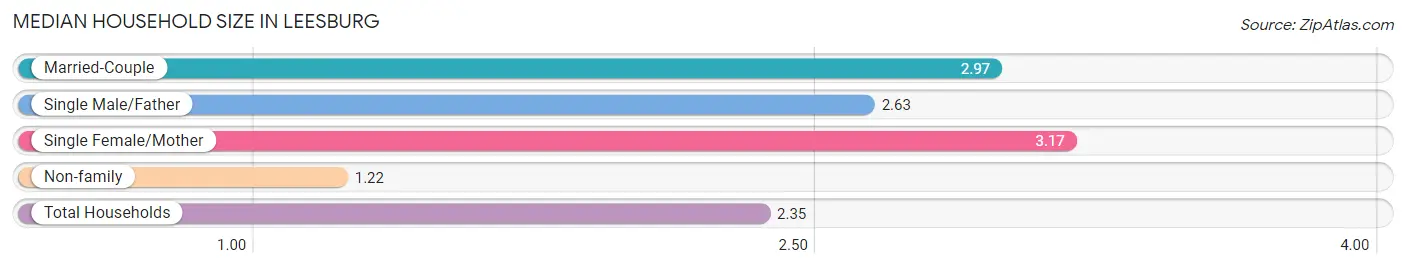
Median Household Size in Leesburg
The median household size in Leesburg is 2.35 persons per household, with single female/mother households (1,846 | 16.3%) accounting for the largest median household size of 3.17 persons per household. non-family households (4,188 | 36.9%) represent the smallest median household size with 1.22 persons per household.
| Household Type | # Households | Household Size |
| Married-Couple | 4,844 (42.7%) | 2.97 |
| Single Male/Father | 473 (4.2%) | 2.63 |
| Single Female/Mother | 1,846 (16.3%) | 3.17 |
| Non-family | 4,188 (36.9%) | 1.22 |
| Total Households | 11,351 (100.0%) | 2.35 |
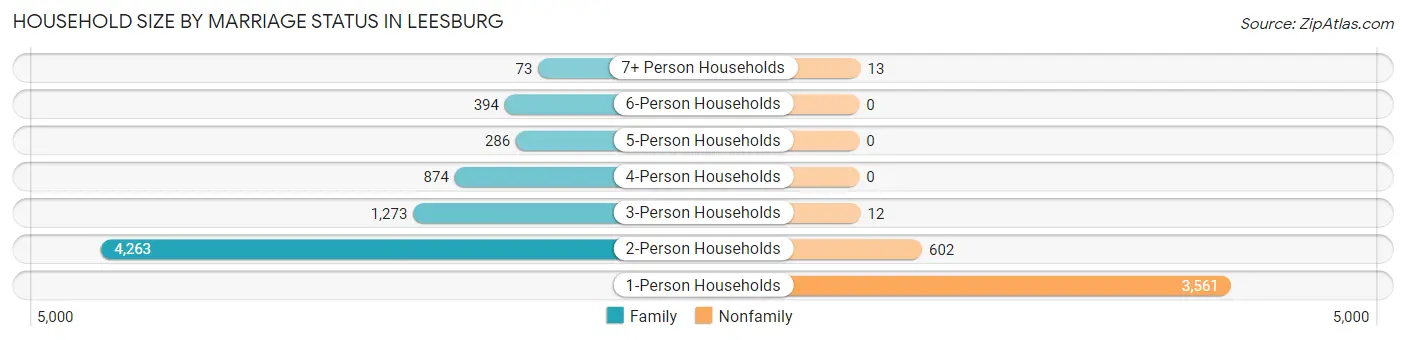
Household Size by Marriage Status in Leesburg
Out of a total of 11,351 households in Leesburg, 7,163 (63.1%) are family households, while 4,188 (36.9%) are nonfamily households. The most numerous type of family households are 2-person households, comprising 4,263, and the most common type of nonfamily households are 1-person households, comprising 3,561.
| Household Size | Family Households | Nonfamily Households |
| 1-Person Households | - | 3,561 (31.4%) |
| 2-Person Households | 4,263 (37.6%) | 602 (5.3%) |
| 3-Person Households | 1,273 (11.2%) | 12 (0.1%) |
| 4-Person Households | 874 (7.7%) | 0 (0.0%) |
| 5-Person Households | 286 (2.5%) | 0 (0.0%) |
| 6-Person Households | 394 (3.5%) | 0 (0.0%) |
| 7+ Person Households | 73 (0.6%) | 13 (0.1%) |
| Total | 7,163 (63.1%) | 4,188 (36.9%) |
Female Fertility in Leesburg
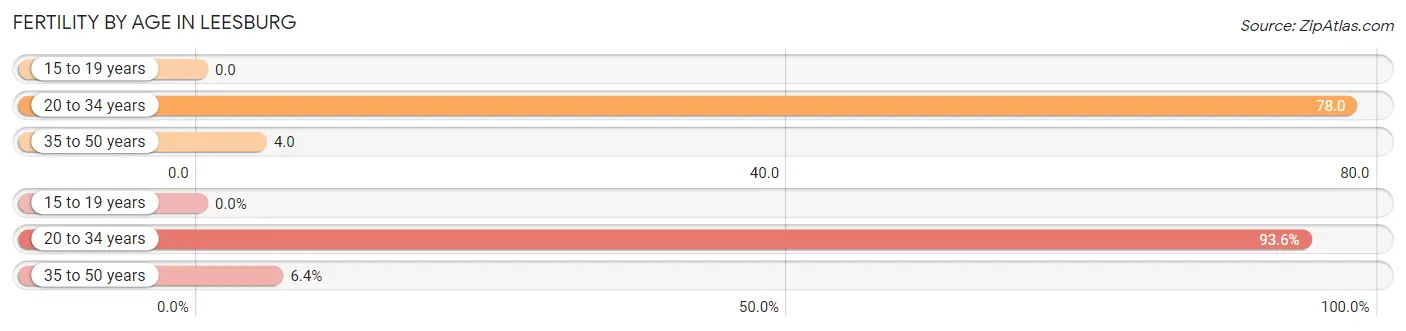
Fertility by Age in Leesburg
Average fertility rate in Leesburg is 30.0 births per 1,000 women. Women in the age bracket of 20 to 34 years have the highest fertility rate with 78.0 births per 1,000 women. Women in the age bracket of 20 to 34 years acount for 93.6% of all women with births.
| Age Bracket | Women with Births | Births / 1,000 Women |
| 15 to 19 years | 0 (0.0%) | 0.0 |
| 20 to 34 years | 161 (93.6%) | 78.0 |
| 35 to 50 years | 11 (6.4%) | 4.0 |
| Total | 172 (100.0%) | 30.0 |
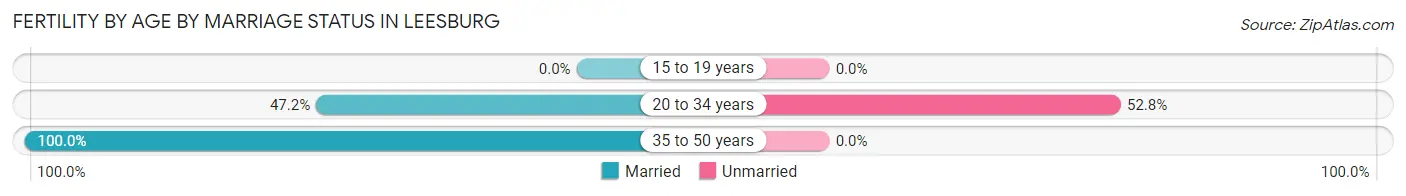
Fertility by Age by Marriage Status in Leesburg
50.6% of women with births (172) in Leesburg are married. The highest percentage of unmarried women with births falls into 20 to 34 years age bracket with 52.8% of them unmarried at the time of birth, while the lowest percentage of unmarried women with births belong to 35 to 50 years age bracket with 0.0% of them unmarried.
| Age Bracket | Married | Unmarried |
| 15 to 19 years | 0 (0.0%) | 0 (0.0%) |
| 20 to 34 years | 76 (47.2%) | 85 (52.8%) |
| 35 to 50 years | 11 (100.0%) | 0 (0.0%) |
| Total | 87 (50.6%) | 85 (49.4%) |
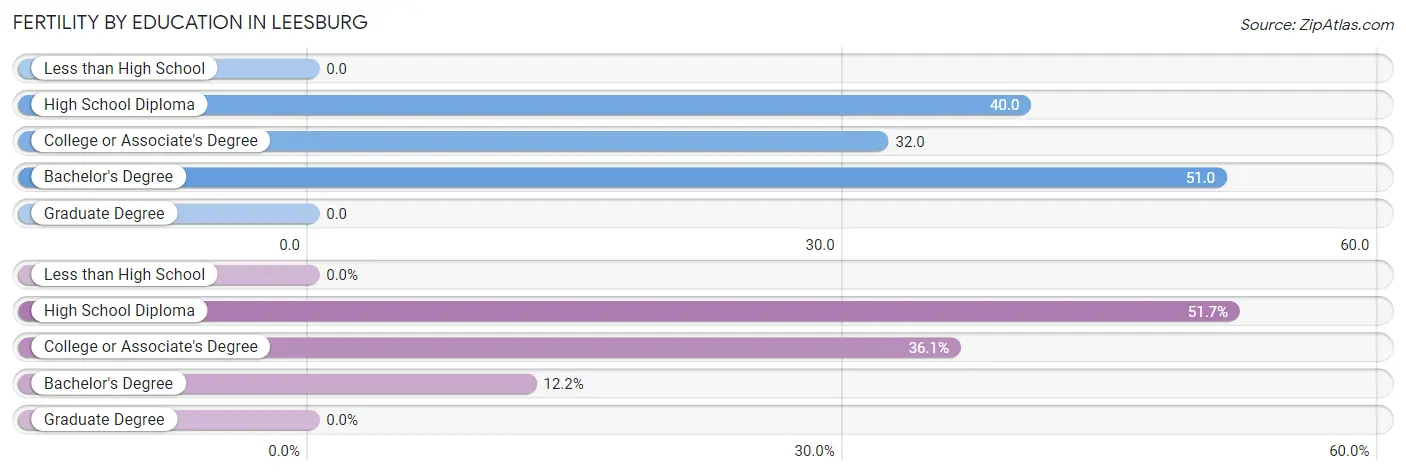
Fertility by Education in Leesburg
| Educational Attainment | Women with Births | Births / 1,000 Women |
| Less than High School | 0 (0.0%) | 0.0 |
| High School Diploma | 89 (51.7%) | 40.0 |
| College or Associate's Degree | 62 (36.0%) | 32.0 |
| Bachelor's Degree | 21 (12.2%) | 51.0 |
| Graduate Degree | 0 (0.0%) | 0.0 |
| Total | 172 (100.0%) | 30.0 |
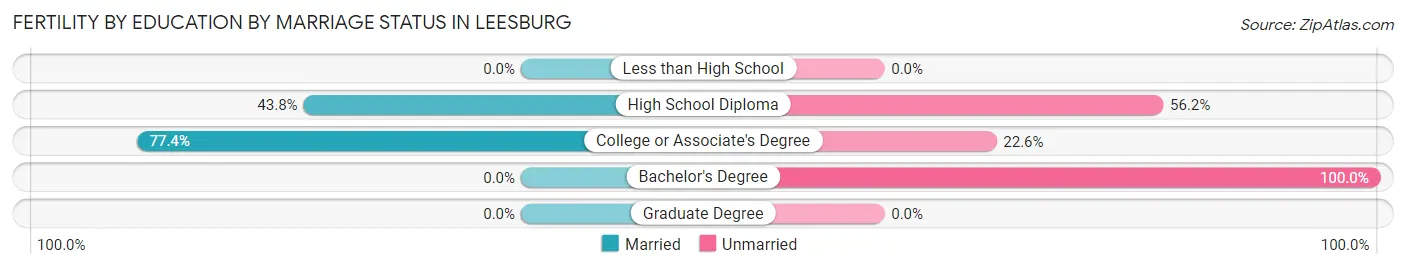
Fertility by Education by Marriage Status in Leesburg
49.4% of women with births in Leesburg are unmarried. Women with the educational attainment of college or associate's degree are most likely to be married with 77.4% of them married at childbirth, while women with the educational attainment of bachelor's degree are least likely to be married with 100.0% of them unmarried at childbirth.
| Educational Attainment | Married | Unmarried |
| Less than High School | 0 (0.0%) | 0 (0.0%) |
| High School Diploma | 39 (43.8%) | 50 (56.2%) |
| College or Associate's Degree | 48 (77.4%) | 14 (22.6%) |
| Bachelor's Degree | 0 (0.0%) | 21 (100.0%) |
| Graduate Degree | 0 (0.0%) | 0 (0.0%) |
| Total | 87 (50.6%) | 85 (49.4%) |
Income in Leesburg
Income Overview in Leesburg
Per Capita Income in Leesburg is $26,327, while median incomes of families and households are $58,243 and $43,733 respectively.
| Characteristic | Number | Measure |
| Per Capita Income | 27,226 | $26,327 |
| Median Family Income | 7,163 | $58,243 |
| Mean Family Income | 7,163 | $70,716 |
| Median Household Income | 11,351 | $43,733 |
| Mean Household Income | 11,351 | $60,248 |
| Income Deficit | 7,163 | $0 |
| Wage / Income Gap (%) | 27,226 | 11.45% |
| Wage / Income Gap ($) | 27,226 | 88.55¢ per $1 |
| Gini / Inequality Index | 27,226 | 0.44 |
Earnings by Sex in Leesburg
Average Earnings in Leesburg are $27,604, $29,298 for men and $25,942 for women, a difference of 11.5%.
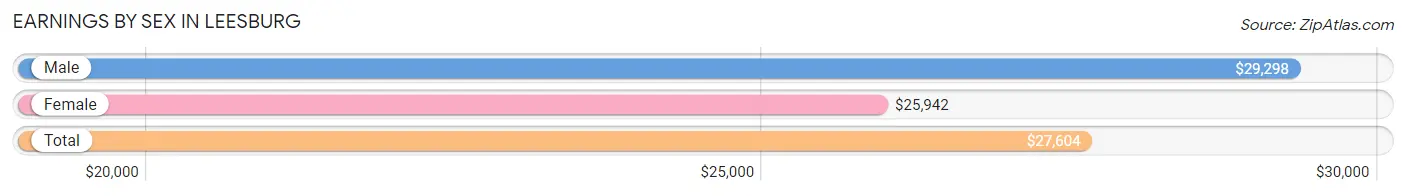
| Sex | Number | Average Earnings |
| Male | 5,847 (49.8%) | $29,298 |
| Female | 5,888 (50.2%) | $25,942 |
| Total | 11,735 (100.0%) | $27,604 |
Earnings by Sex by Income Bracket in Leesburg
The most common earnings brackets in Leesburg are $22,500 to $24,999 for men (668 | 11.4%) and $25,000 to $29,999 for women (865 | 14.7%).
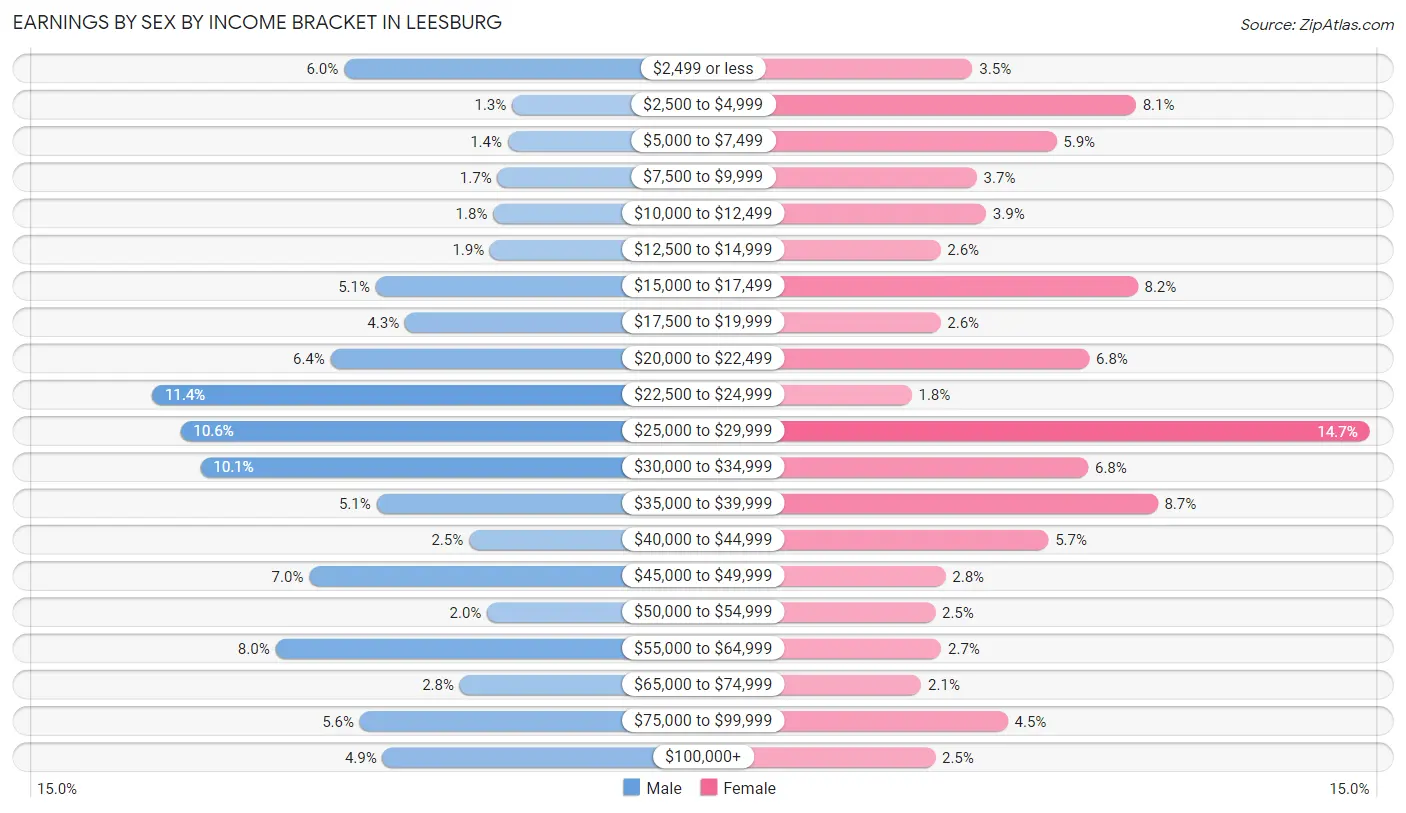
| Income | Male | Female |
| $2,499 or less | 352 (6.0%) | 208 (3.5%) |
| $2,500 to $4,999 | 76 (1.3%) | 478 (8.1%) |
| $5,000 to $7,499 | 83 (1.4%) | 347 (5.9%) |
| $7,500 to $9,999 | 100 (1.7%) | 215 (3.6%) |
| $10,000 to $12,499 | 107 (1.8%) | 230 (3.9%) |
| $12,500 to $14,999 | 112 (1.9%) | 155 (2.6%) |
| $15,000 to $17,499 | 300 (5.1%) | 481 (8.2%) |
| $17,500 to $19,999 | 252 (4.3%) | 155 (2.6%) |
| $20,000 to $22,499 | 374 (6.4%) | 401 (6.8%) |
| $22,500 to $24,999 | 668 (11.4%) | 107 (1.8%) |
| $25,000 to $29,999 | 621 (10.6%) | 865 (14.7%) |
| $30,000 to $34,999 | 588 (10.1%) | 399 (6.8%) |
| $35,000 to $39,999 | 299 (5.1%) | 514 (8.7%) |
| $40,000 to $44,999 | 147 (2.5%) | 333 (5.7%) |
| $45,000 to $49,999 | 409 (7.0%) | 163 (2.8%) |
| $50,000 to $54,999 | 117 (2.0%) | 146 (2.5%) |
| $55,000 to $64,999 | 465 (8.0%) | 156 (2.6%) |
| $65,000 to $74,999 | 162 (2.8%) | 123 (2.1%) |
| $75,000 to $99,999 | 326 (5.6%) | 266 (4.5%) |
| $100,000+ | 289 (4.9%) | 146 (2.5%) |
| Total | 5,847 (100.0%) | 5,888 (100.0%) |
Earnings by Sex by Educational Attainment in Leesburg
Average earnings in Leesburg are $31,814 for men and $27,594 for women, a difference of 13.3%. Men with an educational attainment of bachelor's degree enjoy the highest average annual earnings of $50,486, while those with less than high school education earn the least with $23,496. Women with an educational attainment of bachelor's degree earn the most with the average annual earnings of $40,755, while those with high school diploma education have the smallest earnings of $22,134.
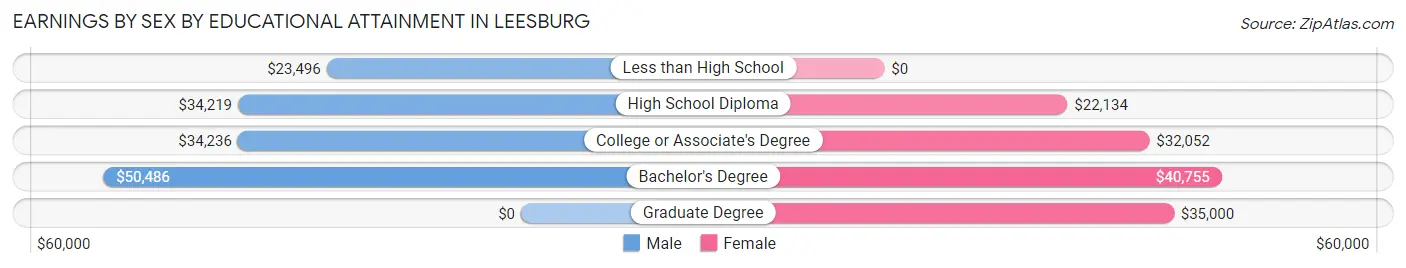
| Educational Attainment | Male Income | Female Income |
| Less than High School | $23,496 | $0 |
| High School Diploma | $34,219 | $22,134 |
| College or Associate's Degree | $34,236 | $32,052 |
| Bachelor's Degree | $50,486 | $40,755 |
| Graduate Degree | - | - |
| Total | $31,814 | $27,594 |
Family Income in Leesburg
Family Income Brackets in Leesburg
According to the Leesburg family income data, there are 1,562 families falling into the $50,000 to $74,999 income range, which is the most common income bracket and makes up 21.8% of all families. Conversely, the $10,000 to $14,999 income bracket is the least frequent group with only 229 families (3.2%) belonging to this category.
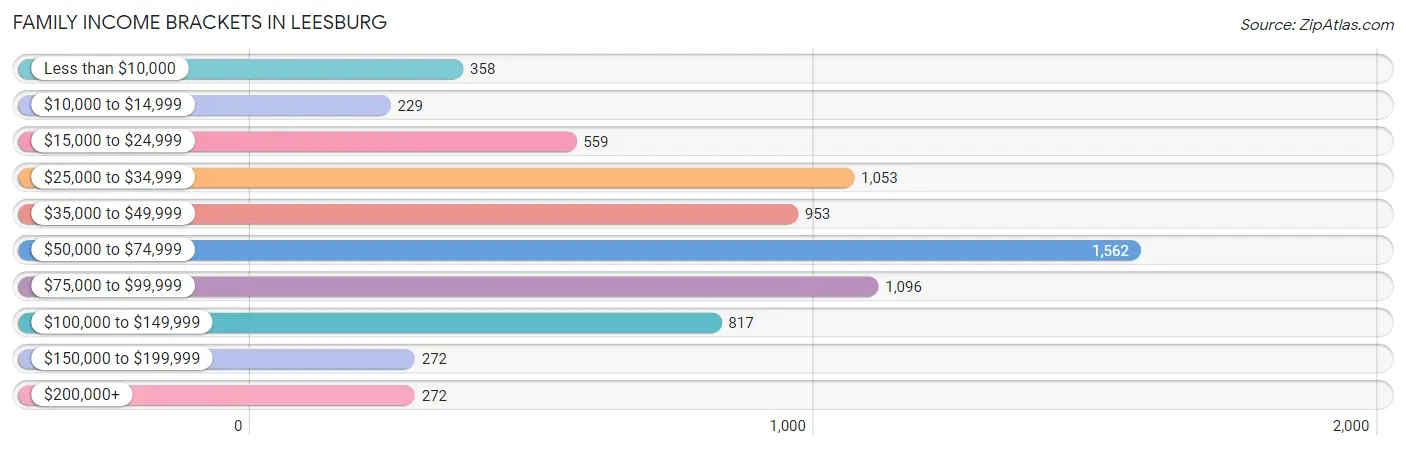
| Income Bracket | # Families | % Families |
| Less than $10,000 | 358 | 5.0% |
| $10,000 to $14,999 | 229 | 3.2% |
| $15,000 to $24,999 | 559 | 7.8% |
| $25,000 to $34,999 | 1,053 | 14.7% |
| $35,000 to $49,999 | 953 | 13.3% |
| $50,000 to $74,999 | 1,562 | 21.8% |
| $75,000 to $99,999 | 1,096 | 15.3% |
| $100,000 to $149,999 | 817 | 11.4% |
| $150,000 to $199,999 | 272 | 3.8% |
| $200,000+ | 272 | 3.8% |
Family Income by Famaliy Size in Leesburg
5-person families (279 | 3.9%) account for the highest median family income in Leesburg with $103,875 per family, while 2-person families (4,450 | 62.1%) have the highest median income of $26,192 per family member.
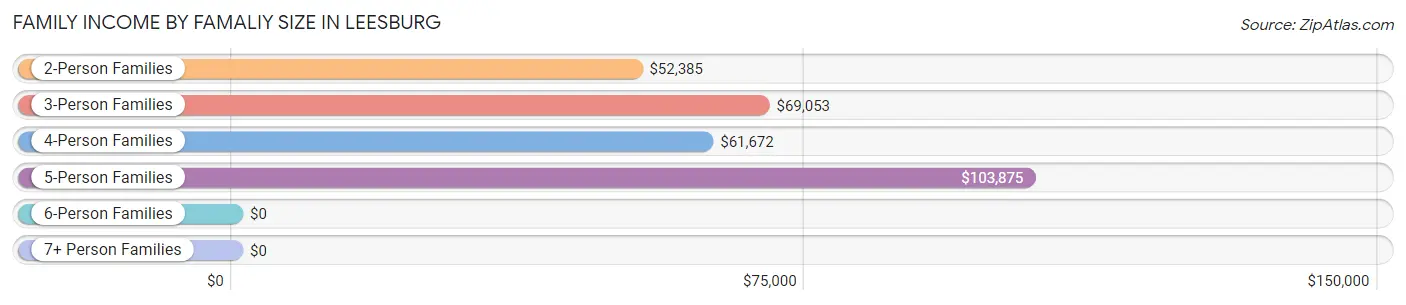
| Income Bracket | # Families | Median Income |
| 2-Person Families | 4,450 (62.1%) | $52,385 |
| 3-Person Families | 1,135 (15.9%) | $69,053 |
| 4-Person Families | 895 (12.5%) | $61,672 |
| 5-Person Families | 279 (3.9%) | $103,875 |
| 6-Person Families | 340 (4.8%) | $0 |
| 7+ Person Families | 64 (0.9%) | $0 |
| Total | 7,163 (100.0%) | $58,243 |
Family Income by Number of Earners in Leesburg
The median family income in Leesburg is $58,243, with families comprising 3+ earners (497) having the highest median family income of $124,899, while families with 1 earner (2,615) have the lowest median family income of $33,786, accounting for 6.9% and 36.5% of families, respectively.
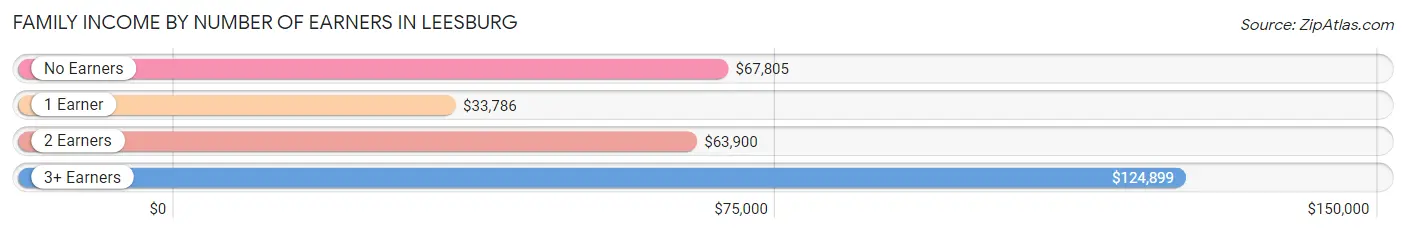
| Number of Earners | # Families | Median Income |
| No Earners | 1,948 (27.2%) | $67,805 |
| 1 Earner | 2,615 (36.5%) | $33,786 |
| 2 Earners | 2,103 (29.4%) | $63,900 |
| 3+ Earners | 497 (6.9%) | $124,899 |
| Total | 7,163 (100.0%) | $58,243 |
Household Income in Leesburg
Household Income Brackets in Leesburg
With 1,998 households falling in the category, the $25,000 to $34,999 income range is the most frequent in Leesburg, accounting for 17.6% of all households. In contrast, only 318 households (2.8%) fall into the $200,000+ income bracket, making it the least populous group.
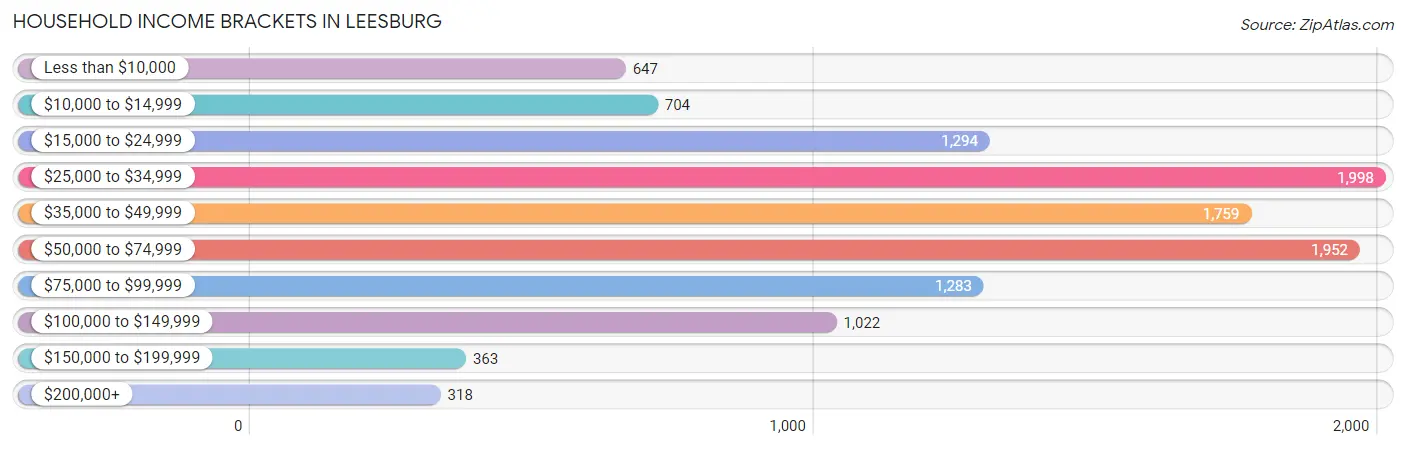
| Income Bracket | # Households | % Households |
| Less than $10,000 | 647 | 5.7% |
| $10,000 to $14,999 | 704 | 6.2% |
| $15,000 to $24,999 | 1,294 | 11.4% |
| $25,000 to $34,999 | 1,998 | 17.6% |
| $35,000 to $49,999 | 1,759 | 15.5% |
| $50,000 to $74,999 | 1,952 | 17.2% |
| $75,000 to $99,999 | 1,283 | 11.3% |
| $100,000 to $149,999 | 1,022 | 9.0% |
| $150,000 to $199,999 | 363 | 3.2% |
| $200,000+ | 318 | 2.8% |
Household Income by Householder Age in Leesburg
The median household income in Leesburg is $43,733, with the highest median household income of $49,342 found in the 45 to 64 years age bracket for the primary householder. A total of 2,954 households (26.0%) fall into this category. Meanwhile, the 15 to 24 years age bracket for the primary householder has the lowest median household income of $29,989, with 323 households (2.9%) in this group.
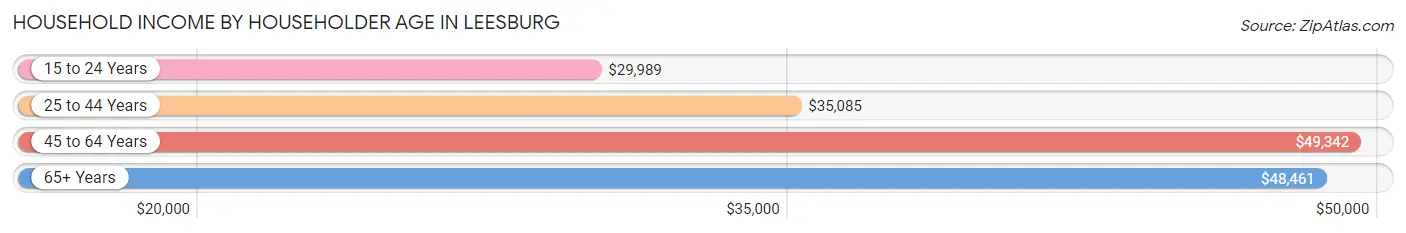
| Income Bracket | # Households | Median Income |
| 15 to 24 Years | 323 (2.9%) | $29,989 |
| 25 to 44 Years | 3,605 (31.8%) | $35,085 |
| 45 to 64 Years | 2,954 (26.0%) | $49,342 |
| 65+ Years | 4,469 (39.4%) | $48,461 |
| Total | 11,351 (100.0%) | $43,733 |
Poverty in Leesburg
Income Below Poverty by Sex and Age in Leesburg
With 14.6% poverty level for males and 22.0% for females among the residents of Leesburg, 15 year old males and 5 year old females are the most vulnerable to poverty, with 58 males (50.0%) and 163 females (78.0%) in their respective age groups living below the poverty level.
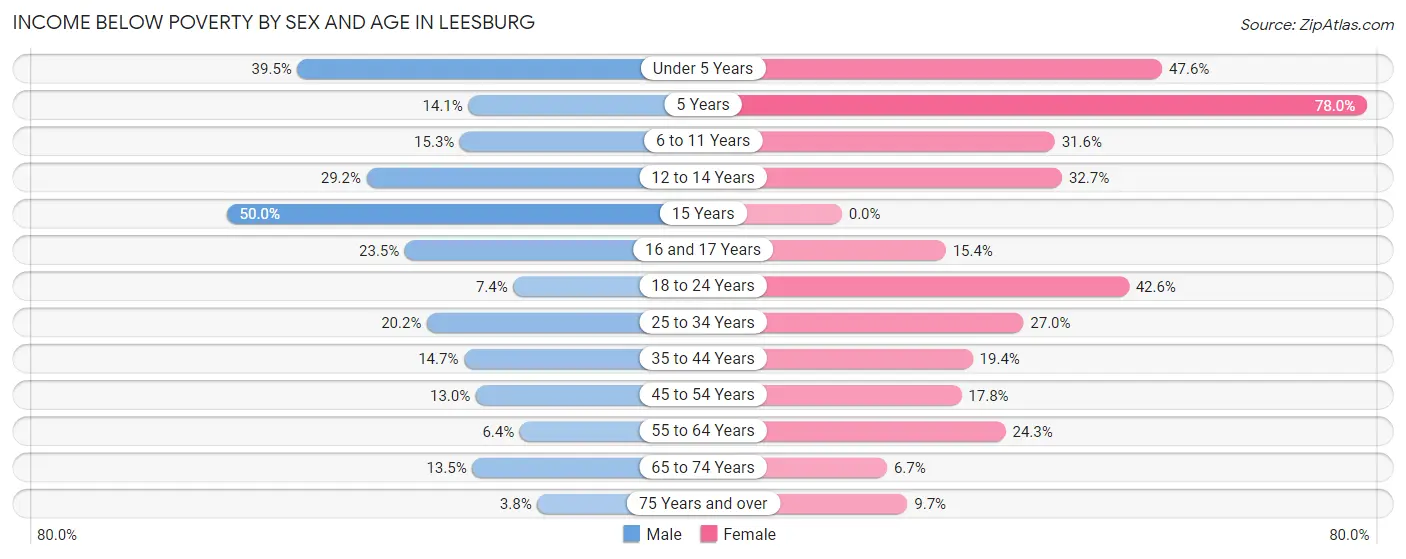
| Age Bracket | Male | Female |
| Under 5 Years | 172 (39.5%) | 284 (47.6%) |
| 5 Years | 38 (14.1%) | 163 (78.0%) |
| 6 to 11 Years | 146 (15.3%) | 350 (31.6%) |
| 12 to 14 Years | 122 (29.2%) | 138 (32.7%) |
| 15 Years | 58 (50.0%) | 0 (0.0%) |
| 16 and 17 Years | 82 (23.5%) | 77 (15.4%) |
| 18 to 24 Years | 87 (7.4%) | 374 (42.6%) |
| 25 to 34 Years | 349 (20.2%) | 403 (27.0%) |
| 35 to 44 Years | 273 (14.7%) | 353 (19.4%) |
| 45 to 54 Years | 144 (13.0%) | 277 (17.8%) |
| 55 to 64 Years | 75 (6.4%) | 342 (24.3%) |
| 65 to 74 Years | 280 (13.5%) | 156 (6.7%) |
| 75 Years and over | 43 (3.8%) | 161 (9.7%) |
| Total | 1,869 (14.6%) | 3,078 (22.0%) |
Income Above Poverty by Sex and Age in Leesburg
According to the poverty statistics in Leesburg, males aged 75 years and over and females aged 15 years are the age groups that are most secure financially, with 96.2% of males and 100.0% of females in these age groups living above the poverty line.
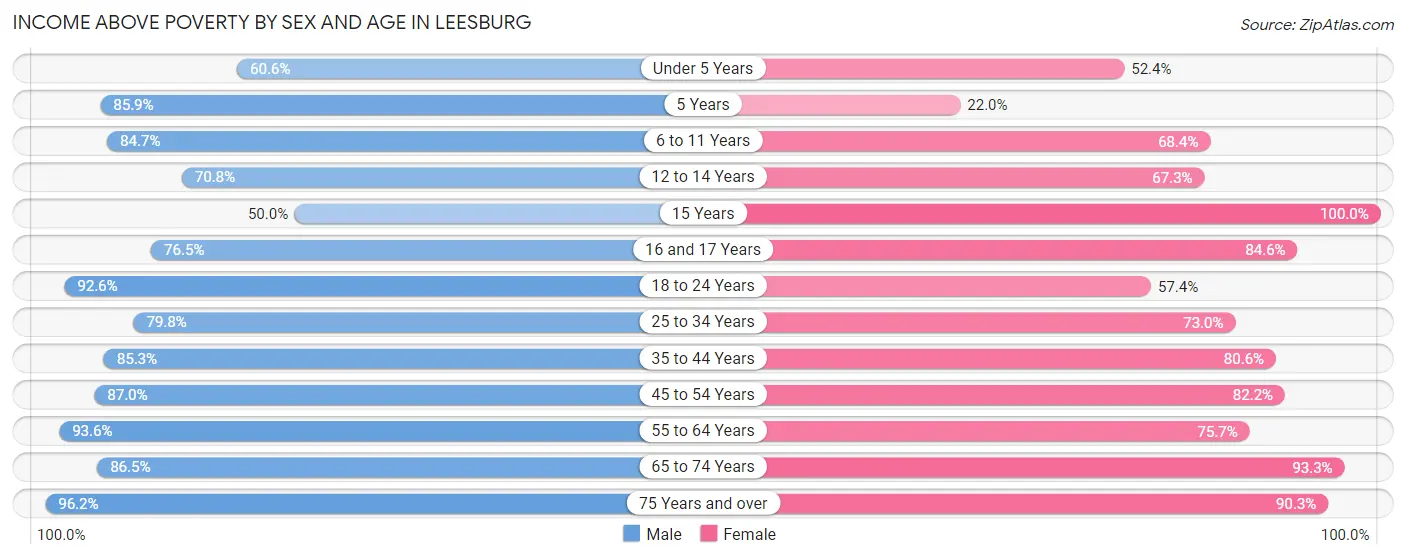
| Age Bracket | Male | Female |
| Under 5 Years | 264 (60.6%) | 313 (52.4%) |
| 5 Years | 232 (85.9%) | 46 (22.0%) |
| 6 to 11 Years | 807 (84.7%) | 757 (68.4%) |
| 12 to 14 Years | 296 (70.8%) | 284 (67.3%) |
| 15 Years | 58 (50.0%) | 56 (100.0%) |
| 16 and 17 Years | 267 (76.5%) | 422 (84.6%) |
| 18 to 24 Years | 1,091 (92.6%) | 504 (57.4%) |
| 25 to 34 Years | 1,378 (79.8%) | 1,092 (73.0%) |
| 35 to 44 Years | 1,581 (85.3%) | 1,464 (80.6%) |
| 45 to 54 Years | 967 (87.0%) | 1,283 (82.2%) |
| 55 to 64 Years | 1,091 (93.6%) | 1,065 (75.7%) |
| 65 to 74 Years | 1,795 (86.5%) | 2,168 (93.3%) |
| 75 Years and over | 1,078 (96.2%) | 1,493 (90.3%) |
| Total | 10,905 (85.4%) | 10,947 (78.0%) |
Income Below Poverty Among Married-Couple Families in Leesburg
The poverty statistics for married-couple families in Leesburg show that 6.1% or 298 of the total 4,844 families live below the poverty line. Families with 5 or more children have the highest poverty rate of 100.0%, comprising of 36 families. On the other hand, families with no children have the lowest poverty rate of 3.7%, which includes 136 families.
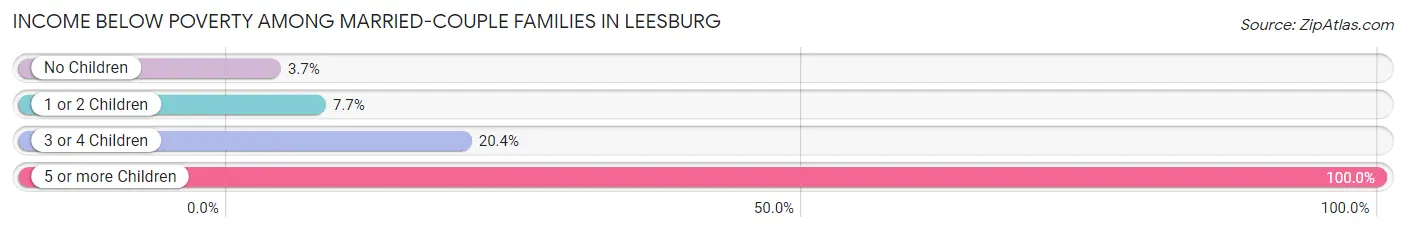
| Children | Above Poverty | Below Poverty |
| No Children | 3,499 (96.3%) | 136 (3.7%) |
| 1 or 2 Children | 820 (92.3%) | 68 (7.7%) |
| 3 or 4 Children | 227 (79.6%) | 58 (20.3%) |
| 5 or more Children | 0 (0.0%) | 36 (100.0%) |
| Total | 4,546 (93.9%) | 298 (6.1%) |
Income Below Poverty Among Single-Parent Households in Leesburg
According to the poverty data in Leesburg, 3.2% or 15 single-father households and 36.6% or 676 single-mother households are living below the poverty line. Among single-father households, those with 3 or 4 children have the highest poverty rate, with 15 households (25.0%) experiencing poverty. Likewise, among single-mother households, those with 3 or 4 children have the highest poverty rate, with 109 households (44.0%) falling below the poverty line.
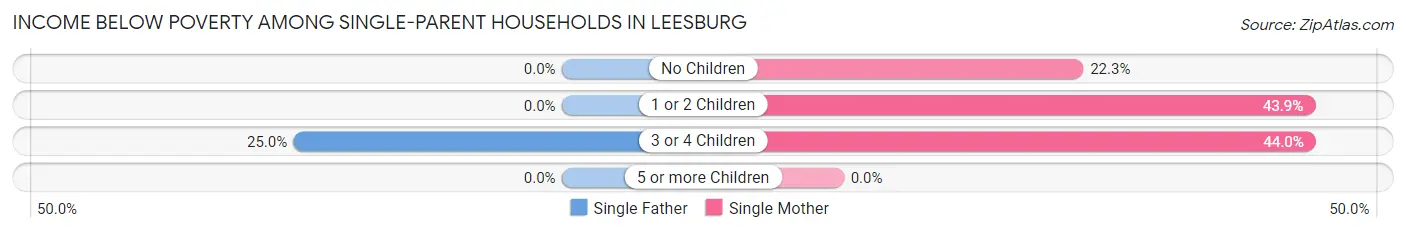
| Children | Single Father | Single Mother |
| No Children | 0 (0.0%) | 139 (22.3%) |
| 1 or 2 Children | 0 (0.0%) | 428 (43.9%) |
| 3 or 4 Children | 15 (25.0%) | 109 (44.0%) |
| 5 or more Children | 0 (0.0%) | 0 (0.0%) |
| Total | 15 (3.2%) | 676 (36.6%) |
Income Below Poverty Among Married-Couple vs Single-Parent Households in Leesburg
The poverty data for Leesburg shows that 298 of the married-couple family households (6.1%) and 691 of the single-parent households (29.8%) are living below the poverty level. Within the married-couple family households, those with 5 or more children have the highest poverty rate, with 36 households (100.0%) falling below the poverty line. Among the single-parent households, those with 3 or 4 children have the highest poverty rate, with 124 household (40.3%) living below poverty.
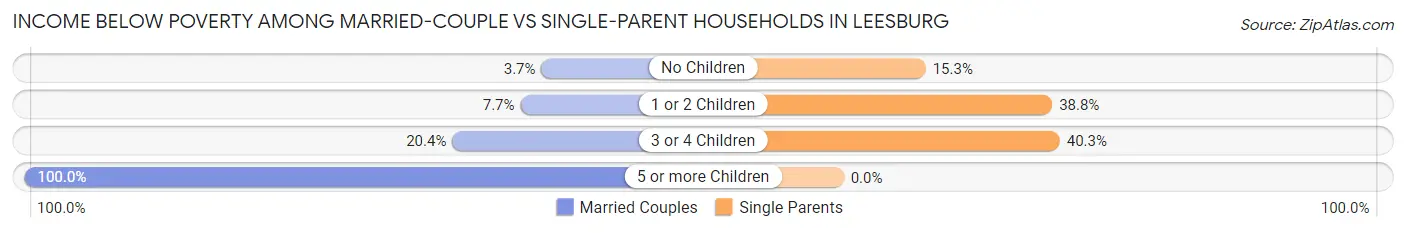
| Children | Married-Couple Families | Single-Parent Households |
| No Children | 136 (3.7%) | 139 (15.3%) |
| 1 or 2 Children | 68 (7.7%) | 428 (38.8%) |
| 3 or 4 Children | 58 (20.3%) | 124 (40.3%) |
| 5 or more Children | 36 (100.0%) | 0 (0.0%) |
| Total | 298 (6.1%) | 691 (29.8%) |
Employment Characteristics in Leesburg
Employment by Class of Employer in Leesburg
Among the 9,999 employed individuals in Leesburg, private company employees (6,883 | 68.8%), not-for-profit organizations (1,197 | 12.0%), and self-employed (not incorporated) (524 | 5.2%) make up the most common classes of employment.
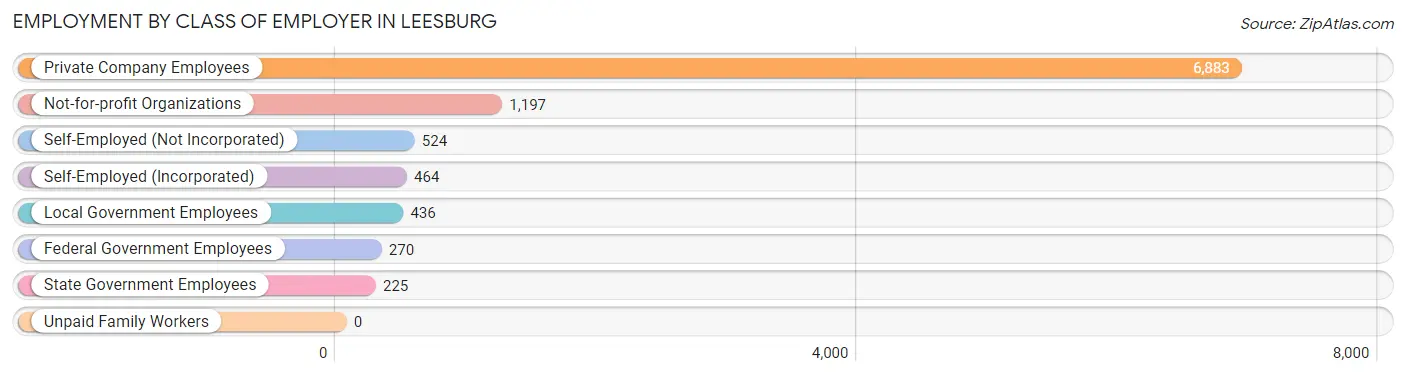
| Employer Class | # Employees | % Employees |
| Private Company Employees | 6,883 | 68.8% |
| Self-Employed (Incorporated) | 464 | 4.6% |
| Self-Employed (Not Incorporated) | 524 | 5.2% |
| Not-for-profit Organizations | 1,197 | 12.0% |
| Local Government Employees | 436 | 4.4% |
| State Government Employees | 225 | 2.2% |
| Federal Government Employees | 270 | 2.7% |
| Unpaid Family Workers | 0 | 0.0% |
| Total | 9,999 | 100.0% |
Employment Status by Age in Leesburg
According to the labor force statistics for Leesburg, out of the total population over 16 years of age (22,619), 50.6% or 11,445 individuals are in the labor force, with 10.4% or 1,190 of them unemployed. The age group with the highest labor force participation rate is 20 to 24 years, with 89.0% or 1,112 individuals in the labor force. Within the labor force, the 16 to 19 years age range has the highest percentage of unemployed individuals, with 36.8% or 344 of them being unemployed.
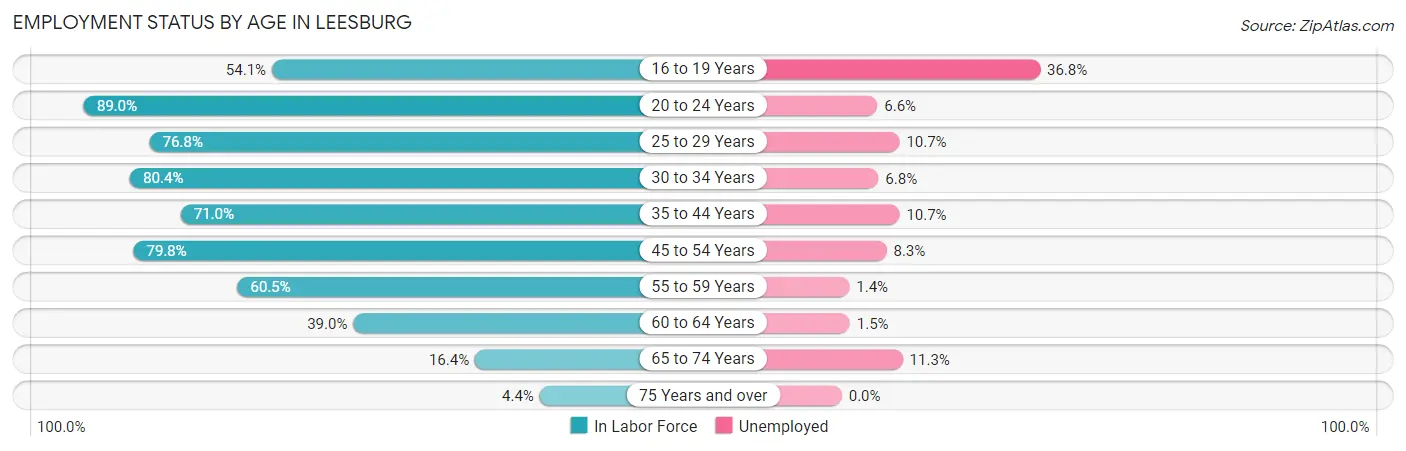
| Age Bracket | In Labor Force | Unemployed |
| 16 to 19 Years | 935 (54.1%) | 344 (36.8%) |
| 20 to 24 Years | 1,112 (89.0%) | 73 (6.6%) |
| 25 to 29 Years | 1,096 (76.8%) | 117 (10.7%) |
| 30 to 34 Years | 1,443 (80.4%) | 98 (6.8%) |
| 35 to 44 Years | 2,615 (71.0%) | 280 (10.7%) |
| 45 to 54 Years | 2,131 (79.8%) | 177 (8.3%) |
| 55 to 59 Years | 641 (60.5%) | 9 (1.4%) |
| 60 to 64 Years | 597 (39.0%) | 9 (1.5%) |
| 65 to 74 Years | 732 (16.4%) | 83 (11.3%) |
| 75 Years and over | 132 (4.4%) | 0 (0.0%) |
| Total | 11,445 (50.6%) | 1,190 (10.4%) |
Employment Status by Educational Attainment in Leesburg
According to labor force statistics for Leesburg, 70.1% of individuals (8,528) out of the total population between 25 and 64 years of age (12,165) are in the labor force, with 8.1% or 691 of them being unemployed. The group with the highest labor force participation rate are those with the educational attainment of bachelor's degree or higher, with 87.1% or 1,375 individuals in the labor force. Within the labor force, individuals with less than high school education have the highest percentage of unemployment, with 22.8% or 208 of them being unemployed.
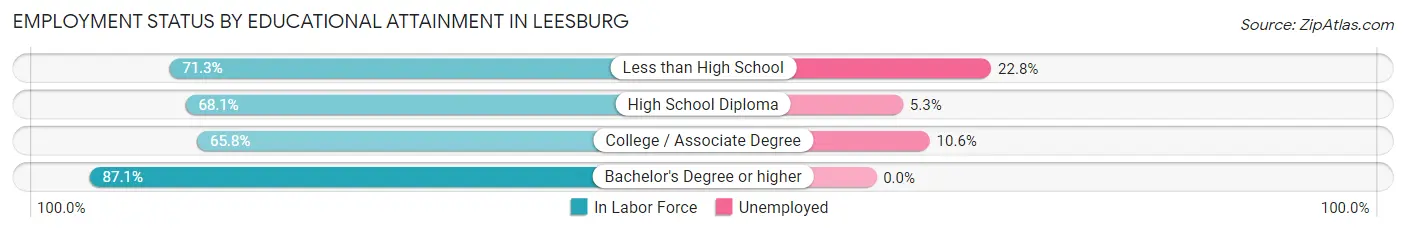
| Educational Attainment | In Labor Force | Unemployed |
| Less than High School | 913 (71.3%) | 292 (22.8%) |
| High School Diploma | 3,361 (68.1%) | 262 (5.3%) |
| College / Associate Degree | 2,875 (65.8%) | 463 (10.6%) |
| Bachelor's Degree or higher | 1,375 (87.1%) | 0 (0.0%) |
| Total | 8,528 (70.1%) | 985 (8.1%) |
Employment Occupations by Sex in Leesburg
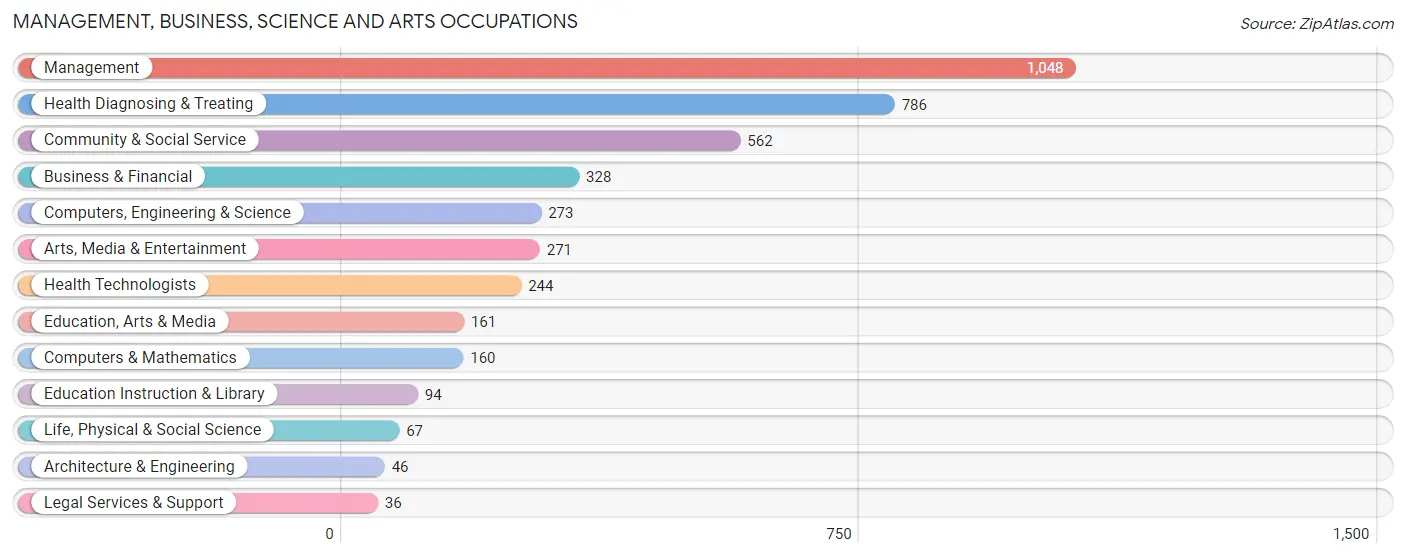
Management, Business, Science and Arts Occupations
The most common Management, Business, Science and Arts occupations in Leesburg are Management (1,048 | 10.3%), Health Diagnosing & Treating (786 | 7.7%), Community & Social Service (562 | 5.5%), Business & Financial (328 | 3.2%), and Computers, Engineering & Science (273 | 2.7%).
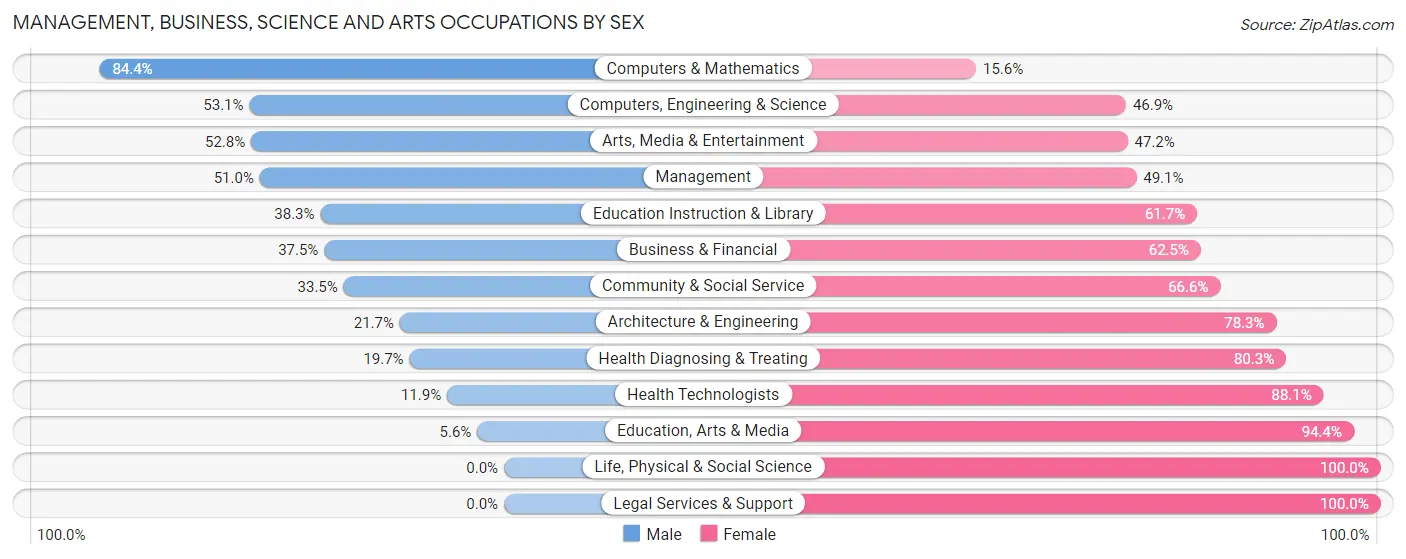
Management, Business, Science and Arts Occupations by Sex
Within the Management, Business, Science and Arts occupations in Leesburg, the most male-oriented occupations are Computers & Mathematics (84.4%), Computers, Engineering & Science (53.1%), and Arts, Media & Entertainment (52.8%), while the most female-oriented occupations are Life, Physical & Social Science (100.0%), Legal Services & Support (100.0%), and Education, Arts & Media (94.4%).
| Occupation | Male | Female |
| Management | 534 (50.9%) | 514 (49.0%) |
| Business & Financial | 123 (37.5%) | 205 (62.5%) |
| Computers, Engineering & Science | 145 (53.1%) | 128 (46.9%) |
| Computers & Mathematics | 135 (84.4%) | 25 (15.6%) |
| Architecture & Engineering | 10 (21.7%) | 36 (78.3%) |
| Life, Physical & Social Science | 0 (0.0%) | 67 (100.0%) |
| Community & Social Service | 188 (33.5%) | 374 (66.5%) |
| Education, Arts & Media | 9 (5.6%) | 152 (94.4%) |
| Legal Services & Support | 0 (0.0%) | 36 (100.0%) |
| Education Instruction & Library | 36 (38.3%) | 58 (61.7%) |
| Arts, Media & Entertainment | 143 (52.8%) | 128 (47.2%) |
| Health Diagnosing & Treating | 155 (19.7%) | 631 (80.3%) |
| Health Technologists | 29 (11.9%) | 215 (88.1%) |
| Total (Category) | 1,145 (38.2%) | 1,852 (61.8%) |
| Total (Overall) | 5,062 (49.9%) | 5,085 (50.1%) |
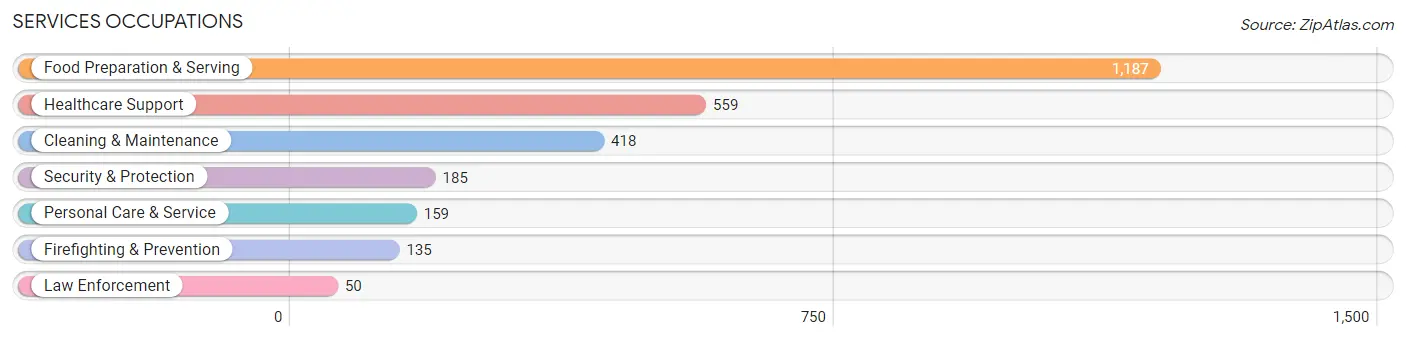
Services Occupations
The most common Services occupations in Leesburg are Food Preparation & Serving (1,187 | 11.7%), Healthcare Support (559 | 5.5%), Cleaning & Maintenance (418 | 4.1%), Security & Protection (185 | 1.8%), and Personal Care & Service (159 | 1.6%).
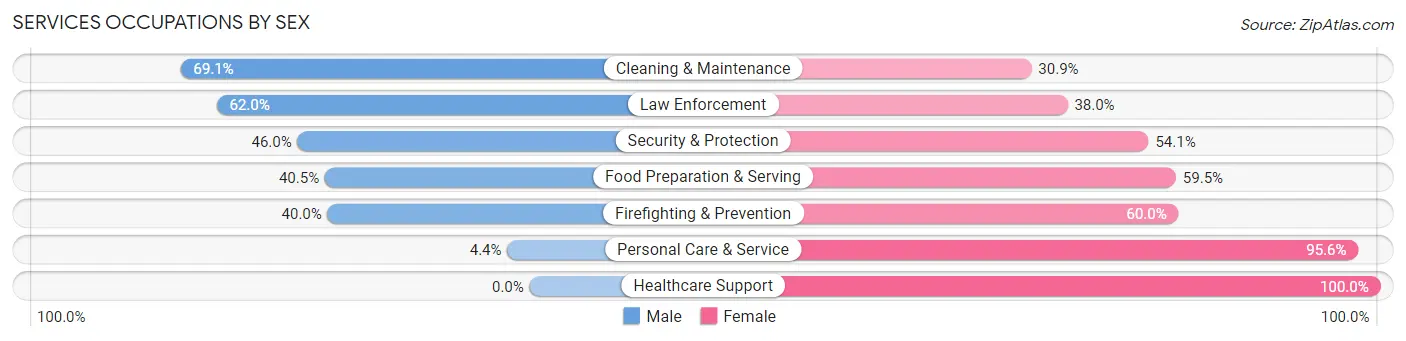
Services Occupations by Sex
Within the Services occupations in Leesburg, the most male-oriented occupations are Cleaning & Maintenance (69.1%), Law Enforcement (62.0%), and Security & Protection (46.0%), while the most female-oriented occupations are Healthcare Support (100.0%), Personal Care & Service (95.6%), and Firefighting & Prevention (60.0%).
| Occupation | Male | Female |
| Healthcare Support | 0 (0.0%) | 559 (100.0%) |
| Security & Protection | 85 (46.0%) | 100 (54.0%) |
| Firefighting & Prevention | 54 (40.0%) | 81 (60.0%) |
| Law Enforcement | 31 (62.0%) | 19 (38.0%) |
| Food Preparation & Serving | 481 (40.5%) | 706 (59.5%) |
| Cleaning & Maintenance | 289 (69.1%) | 129 (30.9%) |
| Personal Care & Service | 7 (4.4%) | 152 (95.6%) |
| Total (Category) | 862 (34.4%) | 1,646 (65.6%) |
| Total (Overall) | 5,062 (49.9%) | 5,085 (50.1%) |
Sales and Office Occupations
The most common Sales and Office occupations in Leesburg are Sales & Related (1,187 | 11.7%), and Office & Administration (869 | 8.6%).

Sales and Office Occupations by Sex
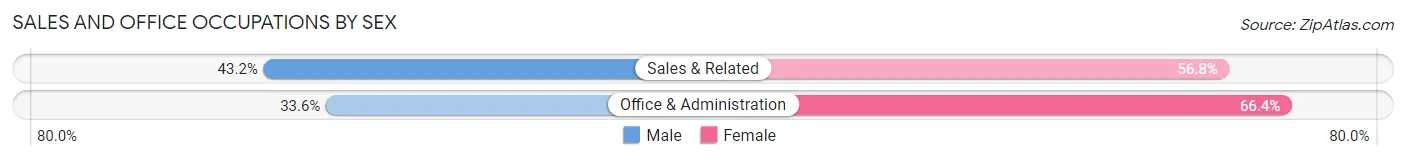
| Occupation | Male | Female |
| Sales & Related | 513 (43.2%) | 674 (56.8%) |
| Office & Administration | 292 (33.6%) | 577 (66.4%) |
| Total (Category) | 805 (39.2%) | 1,251 (60.9%) |
| Total (Overall) | 5,062 (49.9%) | 5,085 (50.1%) |
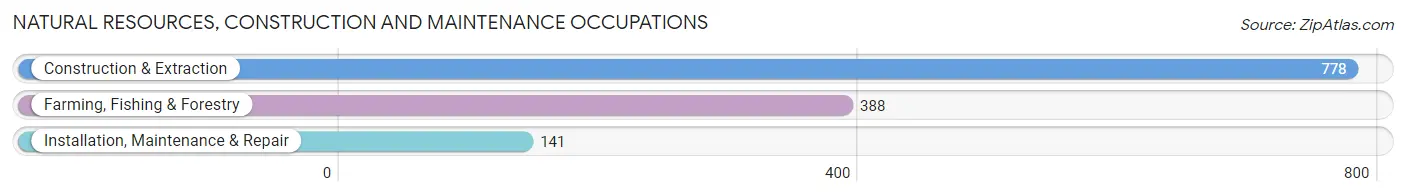
Natural Resources, Construction and Maintenance Occupations
The most common Natural Resources, Construction and Maintenance occupations in Leesburg are Construction & Extraction (778 | 7.7%), Farming, Fishing & Forestry (388 | 3.8%), and Installation, Maintenance & Repair (141 | 1.4%).
Natural Resources, Construction and Maintenance Occupations by Sex
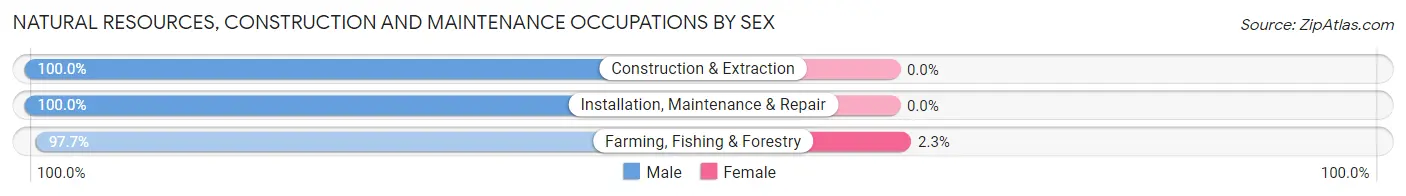
| Occupation | Male | Female |
| Farming, Fishing & Forestry | 379 (97.7%) | 9 (2.3%) |
| Construction & Extraction | 778 (100.0%) | 0 (0.0%) |
| Installation, Maintenance & Repair | 141 (100.0%) | 0 (0.0%) |
| Total (Category) | 1,298 (99.3%) | 9 (0.7%) |
| Total (Overall) | 5,062 (49.9%) | 5,085 (50.1%) |
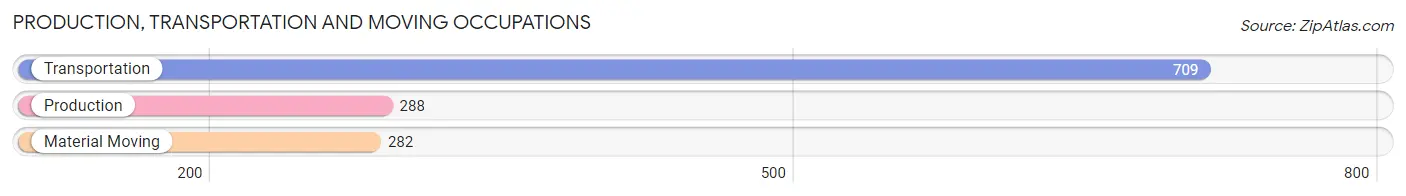
Production, Transportation and Moving Occupations
The most common Production, Transportation and Moving occupations in Leesburg are Transportation (709 | 7.0%), Production (288 | 2.8%), and Material Moving (282 | 2.8%).
Production, Transportation and Moving Occupations by Sex
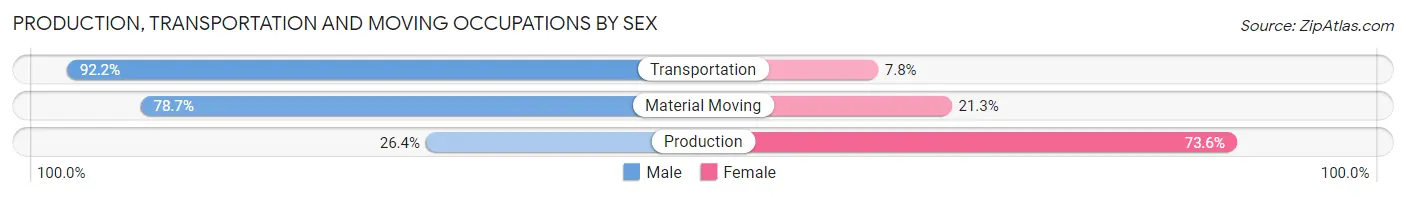
| Occupation | Male | Female |
| Production | 76 (26.4%) | 212 (73.6%) |
| Transportation | 654 (92.2%) | 55 (7.8%) |
| Material Moving | 222 (78.7%) | 60 (21.3%) |
| Total (Category) | 952 (74.4%) | 327 (25.6%) |
| Total (Overall) | 5,062 (49.9%) | 5,085 (50.1%) |
Employment Industries by Sex in Leesburg
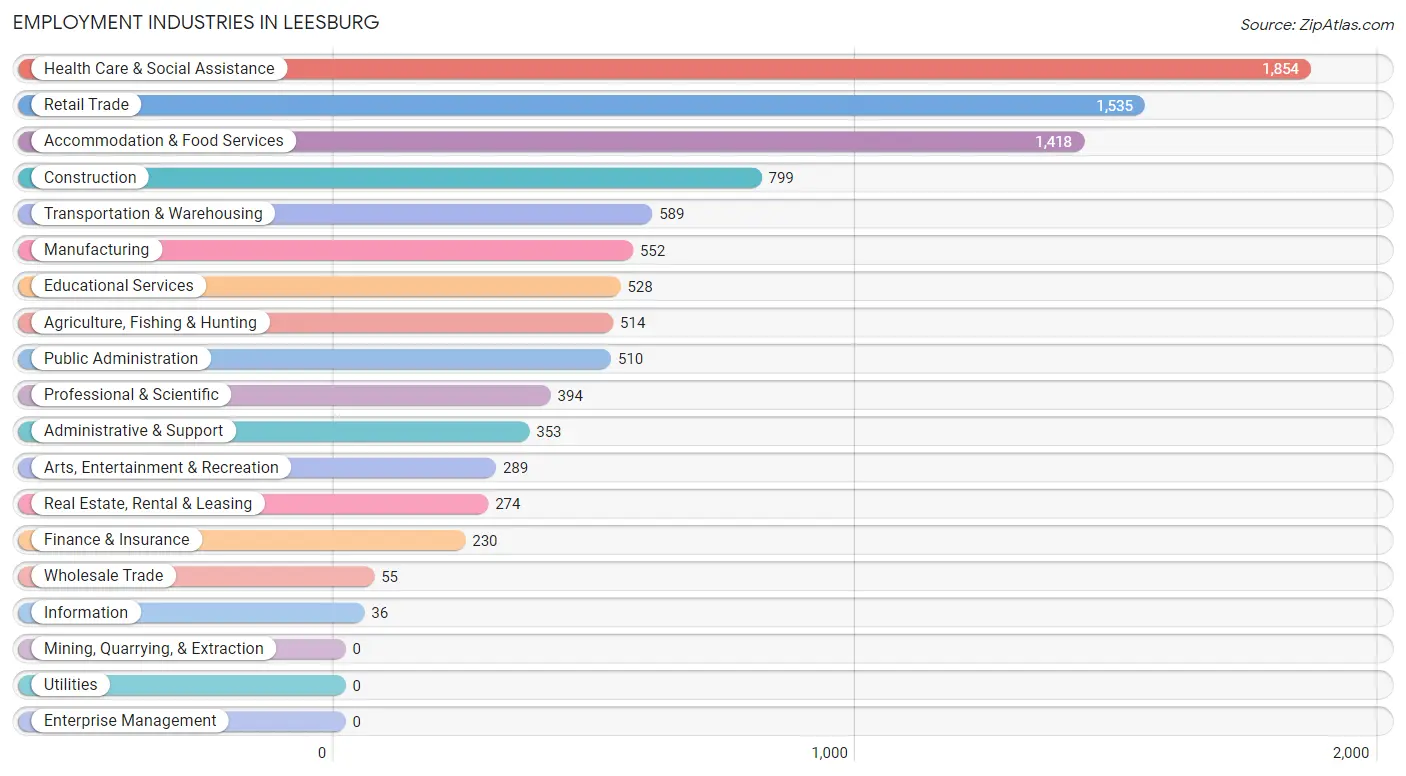
Employment Industries in Leesburg
The major employment industries in Leesburg include Health Care & Social Assistance (1,854 | 18.3%), Retail Trade (1,535 | 15.1%), Accommodation & Food Services (1,418 | 14.0%), Construction (799 | 7.9%), and Transportation & Warehousing (589 | 5.8%).
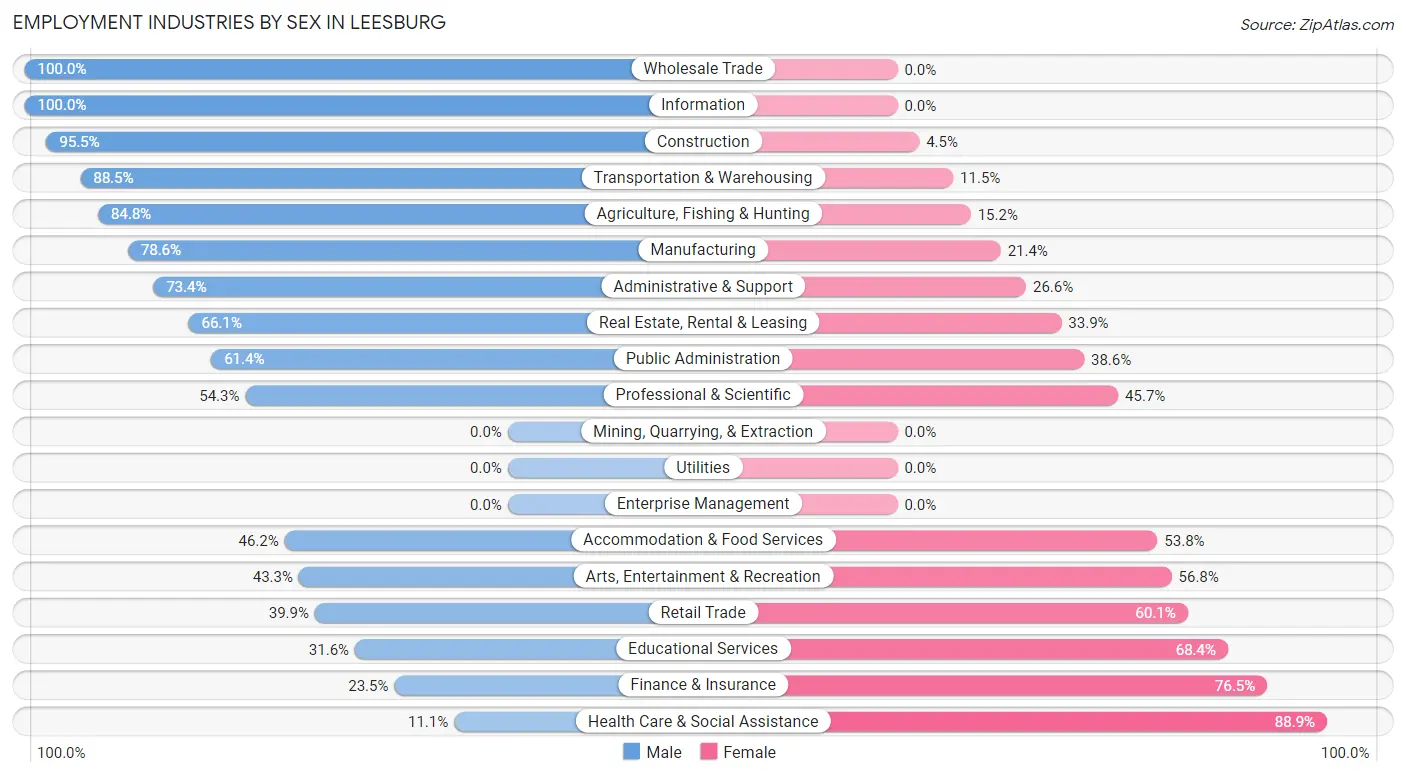
Employment Industries by Sex in Leesburg
The Leesburg industries that see more men than women are Wholesale Trade (100.0%), Information (100.0%), and Construction (95.5%), whereas the industries that tend to have a higher number of women are Health Care & Social Assistance (88.9%), Finance & Insurance (76.5%), and Educational Services (68.4%).
| Industry | Male | Female |
| Agriculture, Fishing & Hunting | 436 (84.8%) | 78 (15.2%) |
| Mining, Quarrying, & Extraction | 0 (0.0%) | 0 (0.0%) |
| Construction | 763 (95.5%) | 36 (4.5%) |
| Manufacturing | 434 (78.6%) | 118 (21.4%) |
| Wholesale Trade | 55 (100.0%) | 0 (0.0%) |
| Retail Trade | 613 (39.9%) | 922 (60.1%) |
| Transportation & Warehousing | 521 (88.5%) | 68 (11.5%) |
| Utilities | 0 (0.0%) | 0 (0.0%) |
| Information | 36 (100.0%) | 0 (0.0%) |
| Finance & Insurance | 54 (23.5%) | 176 (76.5%) |
| Real Estate, Rental & Leasing | 181 (66.1%) | 93 (33.9%) |
| Professional & Scientific | 214 (54.3%) | 180 (45.7%) |
| Enterprise Management | 0 (0.0%) | 0 (0.0%) |
| Administrative & Support | 259 (73.4%) | 94 (26.6%) |
| Educational Services | 167 (31.6%) | 361 (68.4%) |
| Health Care & Social Assistance | 206 (11.1%) | 1,648 (88.9%) |
| Arts, Entertainment & Recreation | 125 (43.2%) | 164 (56.8%) |
| Accommodation & Food Services | 655 (46.2%) | 763 (53.8%) |
| Public Administration | 313 (61.4%) | 197 (38.6%) |
| Total | 5,062 (49.9%) | 5,085 (50.1%) |
Education in Leesburg
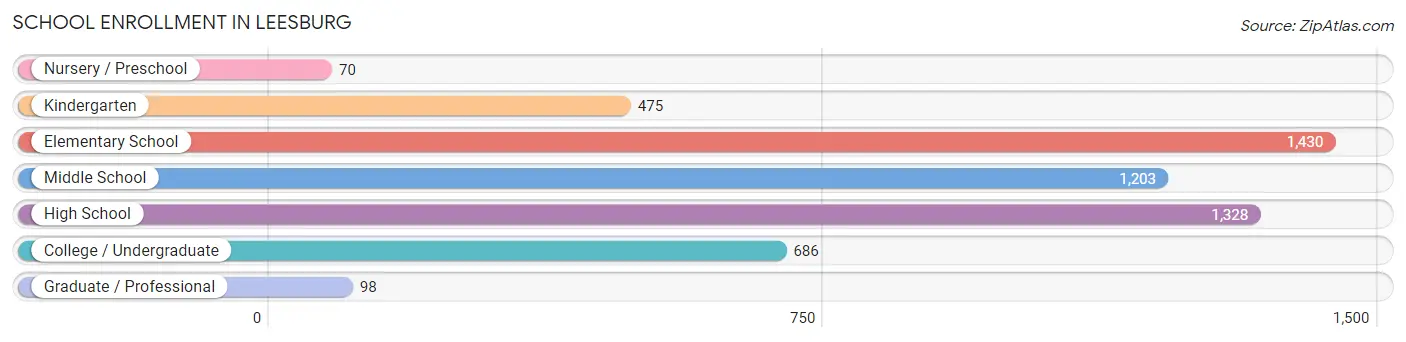
School Enrollment in Leesburg
The most common levels of schooling among the 5,290 students in Leesburg are elementary school (1,430 | 27.0%), high school (1,328 | 25.1%), and middle school (1,203 | 22.7%).
| School Level | # Students | % Students |
| Nursery / Preschool | 70 | 1.3% |
| Kindergarten | 475 | 9.0% |
| Elementary School | 1,430 | 27.0% |
| Middle School | 1,203 | 22.7% |
| High School | 1,328 | 25.1% |
| College / Undergraduate | 686 | 13.0% |
| Graduate / Professional | 98 | 1.8% |
| Total | 5,290 | 100.0% |
School Enrollment by Age by Funding Source in Leesburg
Out of a total of 5,290 students who are enrolled in schools in Leesburg, 878 (16.6%) attend a private institution, while the remaining 4,412 (83.4%) are enrolled in public schools. The age group of 3 to 4 year olds has the highest likelihood of being enrolled in private schools, with 38 (54.3% in the age bracket) enrolled. Conversely, the age group of 18 to 19 year olds has the lowest likelihood of being enrolled in a private school, with 469 (95.1% in the age bracket) attending a public institution.
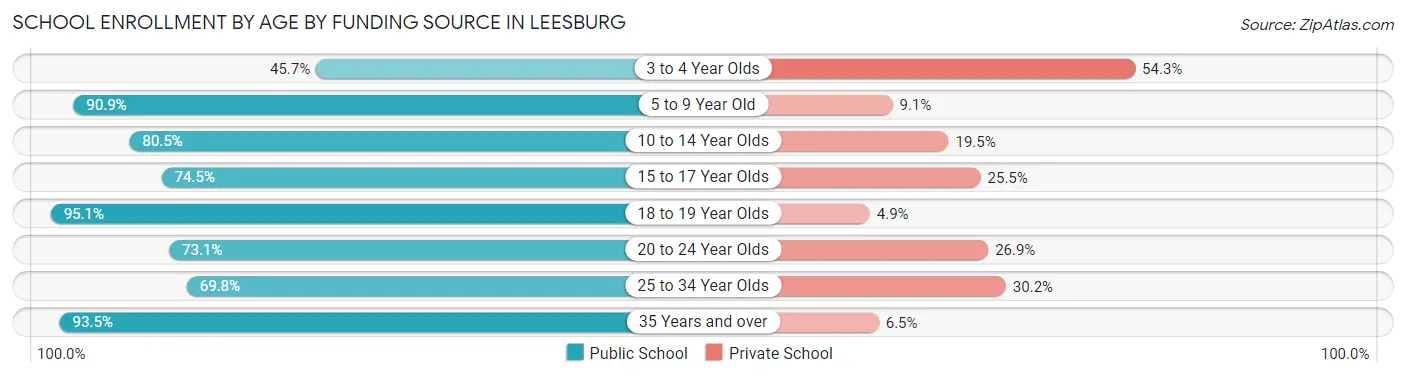
| Age Bracket | Public School | Private School |
| 3 to 4 Year Olds | 32 (45.7%) | 38 (54.3%) |
| 5 to 9 Year Old | 1,479 (90.9%) | 148 (9.1%) |
| 10 to 14 Year Olds | 1,240 (80.5%) | 301 (19.5%) |
| 15 to 17 Year Olds | 724 (74.5%) | 248 (25.5%) |
| 18 to 19 Year Olds | 469 (95.1%) | 24 (4.9%) |
| 20 to 24 Year Olds | 171 (73.1%) | 63 (26.9%) |
| 25 to 34 Year Olds | 97 (69.8%) | 42 (30.2%) |
| 35 Years and over | 200 (93.5%) | 14 (6.5%) |
| Total | 4,412 (83.4%) | 878 (16.6%) |
Educational Attainment by Field of Study in Leesburg
Education (1,006 | 28.2%), business (675 | 18.9%), science & technology (422 | 11.8%), literature & languages (258 | 7.2%), and arts & humanities (201 | 5.6%) are the most common fields of study among 3,573 individuals in Leesburg who have obtained a bachelor's degree or higher.
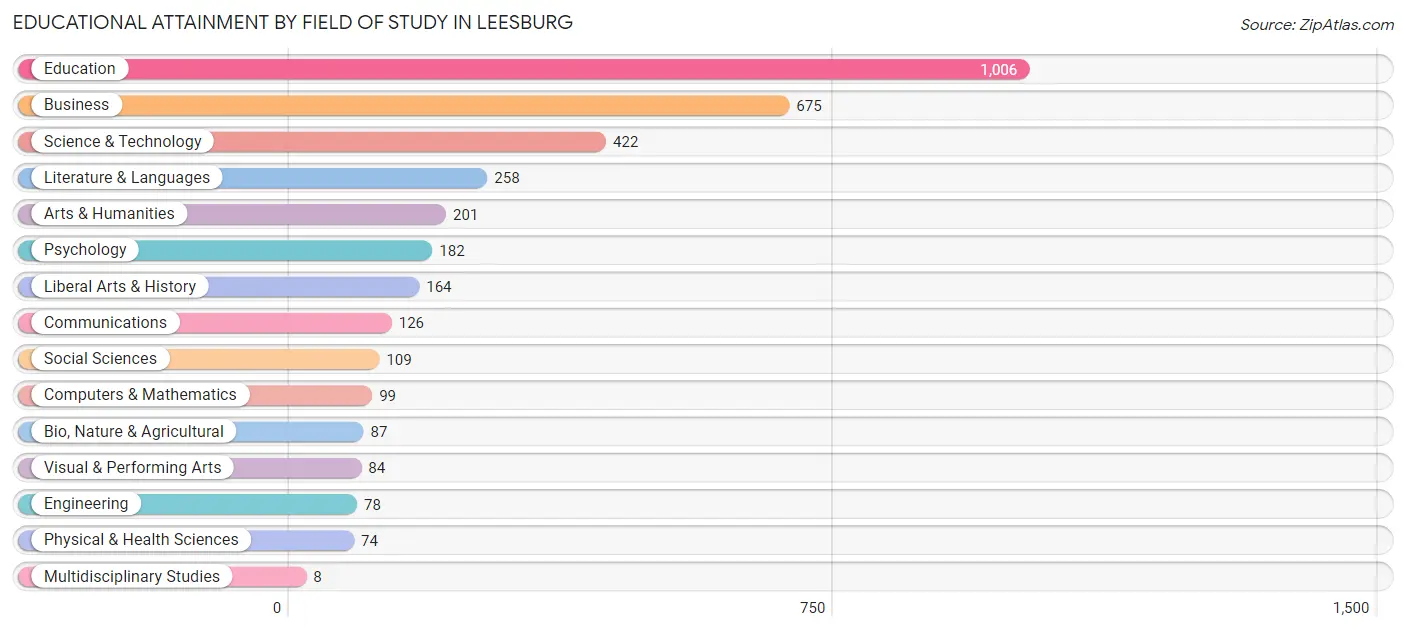
| Field of Study | # Graduates | % Graduates |
| Computers & Mathematics | 99 | 2.8% |
| Bio, Nature & Agricultural | 87 | 2.4% |
| Physical & Health Sciences | 74 | 2.1% |
| Psychology | 182 | 5.1% |
| Social Sciences | 109 | 3.0% |
| Engineering | 78 | 2.2% |
| Multidisciplinary Studies | 8 | 0.2% |
| Science & Technology | 422 | 11.8% |
| Business | 675 | 18.9% |
| Education | 1,006 | 28.2% |
| Literature & Languages | 258 | 7.2% |
| Liberal Arts & History | 164 | 4.6% |
| Visual & Performing Arts | 84 | 2.4% |
| Communications | 126 | 3.5% |
| Arts & Humanities | 201 | 5.6% |
| Total | 3,573 | 100.0% |
Transportation & Commute in Leesburg
Vehicle Availability by Sex in Leesburg
The most prevalent vehicle ownership categories in Leesburg are males with 2 vehicles (1,746, accounting for 34.4%) and females with 2 vehicles (1,967, making up 35.5%).
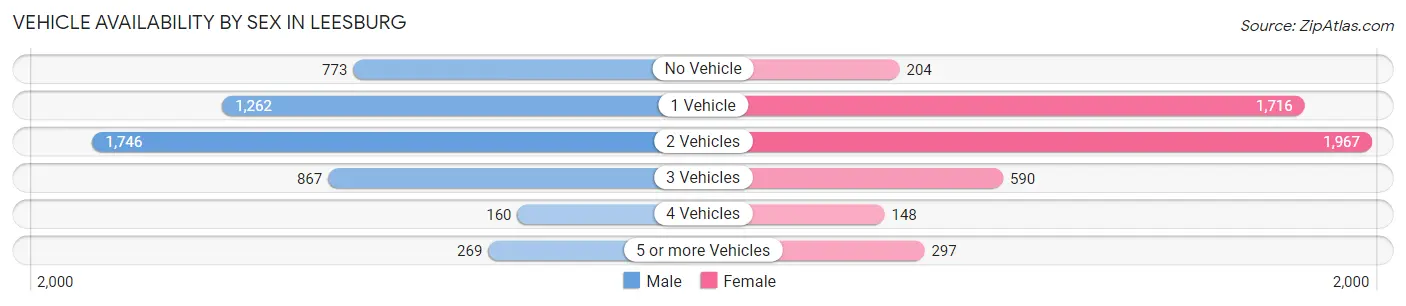
| Vehicles Available | Male | Female |
| No Vehicle | 773 (15.2%) | 204 (4.1%) |
| 1 Vehicle | 1,262 (24.9%) | 1,716 (34.9%) |
| 2 Vehicles | 1,746 (34.4%) | 1,967 (40.0%) |
| 3 Vehicles | 867 (17.1%) | 590 (12.0%) |
| 4 Vehicles | 160 (3.2%) | 148 (3.0%) |
| 5 or more Vehicles | 269 (5.3%) | 297 (6.0%) |
| Total | 5,077 (100.0%) | 4,922 (100.0%) |
Commute Time in Leesburg
The most frequently occuring commute durations in Leesburg are 10 to 14 minutes (1,643 commuters, 17.1%), 20 to 24 minutes (1,545 commuters, 16.1%), and 15 to 19 minutes (1,230 commuters, 12.8%).
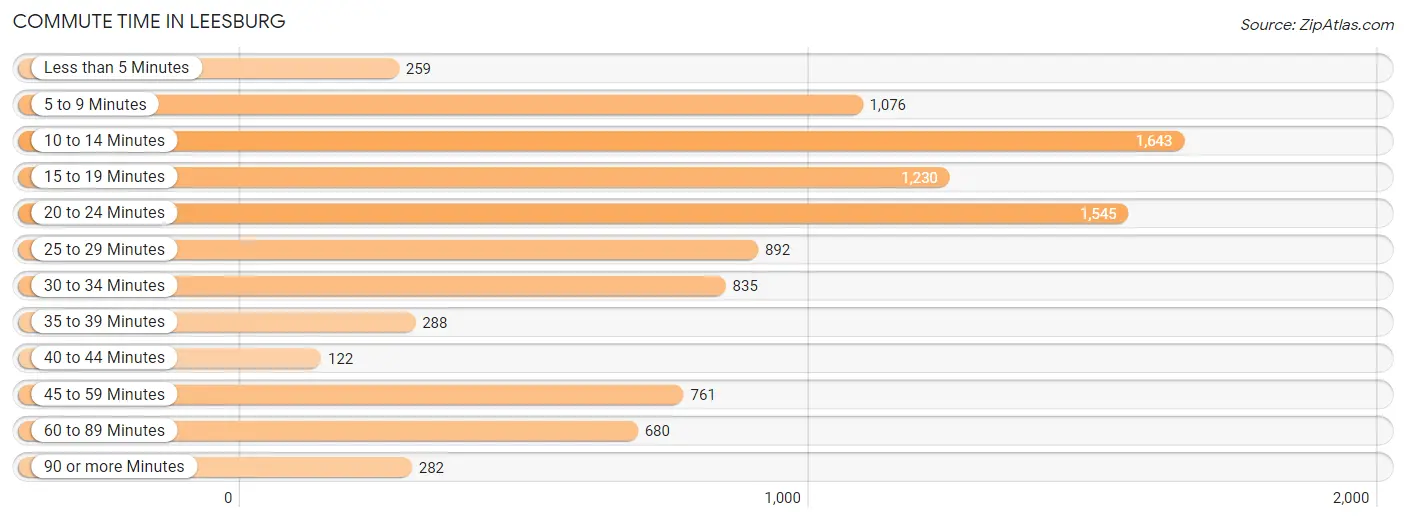
| Commute Time | # Commuters | % Commuters |
| Less than 5 Minutes | 259 | 2.7% |
| 5 to 9 Minutes | 1,076 | 11.2% |
| 10 to 14 Minutes | 1,643 | 17.1% |
| 15 to 19 Minutes | 1,230 | 12.8% |
| 20 to 24 Minutes | 1,545 | 16.1% |
| 25 to 29 Minutes | 892 | 9.3% |
| 30 to 34 Minutes | 835 | 8.7% |
| 35 to 39 Minutes | 288 | 3.0% |
| 40 to 44 Minutes | 122 | 1.3% |
| 45 to 59 Minutes | 761 | 7.9% |
| 60 to 89 Minutes | 680 | 7.1% |
| 90 or more Minutes | 282 | 2.9% |
Commute Time by Sex in Leesburg
The most common commute times in Leesburg are 10 to 14 minutes (899 commuters, 18.1%) for males and 20 to 24 minutes (760 commuters, 16.3%) for females.
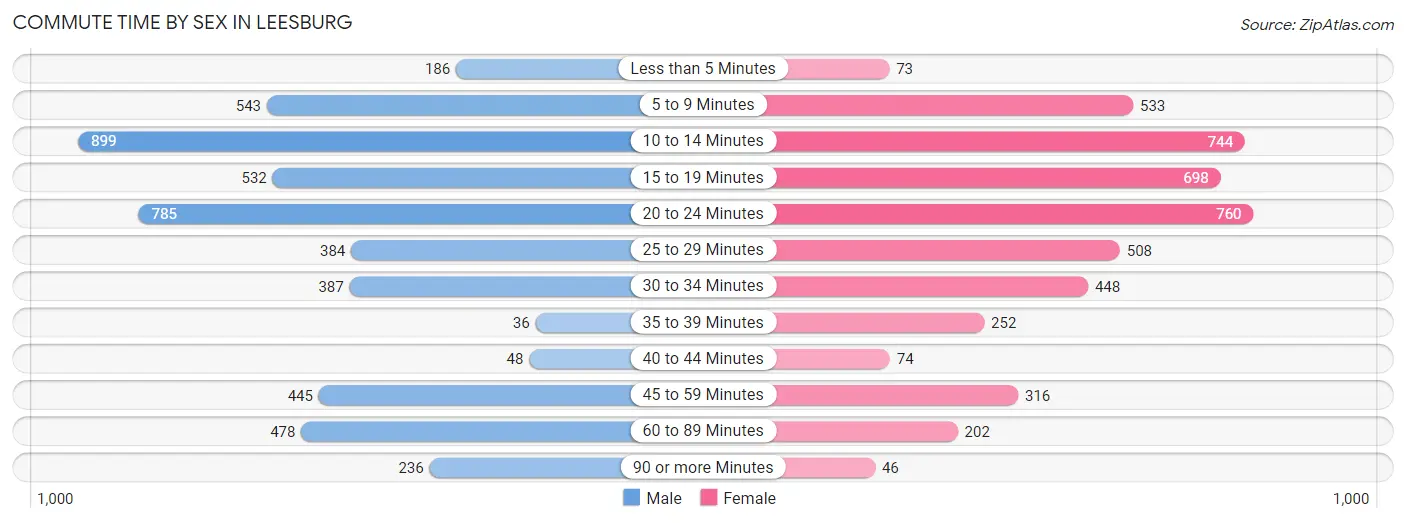
| Commute Time | Male | Female |
| Less than 5 Minutes | 186 (3.7%) | 73 (1.6%) |
| 5 to 9 Minutes | 543 (11.0%) | 533 (11.5%) |
| 10 to 14 Minutes | 899 (18.1%) | 744 (16.0%) |
| 15 to 19 Minutes | 532 (10.7%) | 698 (15.0%) |
| 20 to 24 Minutes | 785 (15.8%) | 760 (16.3%) |
| 25 to 29 Minutes | 384 (7.7%) | 508 (10.9%) |
| 30 to 34 Minutes | 387 (7.8%) | 448 (9.6%) |
| 35 to 39 Minutes | 36 (0.7%) | 252 (5.4%) |
| 40 to 44 Minutes | 48 (1.0%) | 74 (1.6%) |
| 45 to 59 Minutes | 445 (9.0%) | 316 (6.8%) |
| 60 to 89 Minutes | 478 (9.6%) | 202 (4.3%) |
| 90 or more Minutes | 236 (4.8%) | 46 (1.0%) |
Time of Departure to Work by Sex in Leesburg
The most frequent times of departure to work in Leesburg are 6:00 AM to 6:29 AM (702, 14.2%) for males and 6:30 AM to 6:59 AM (718, 15.4%) for females.
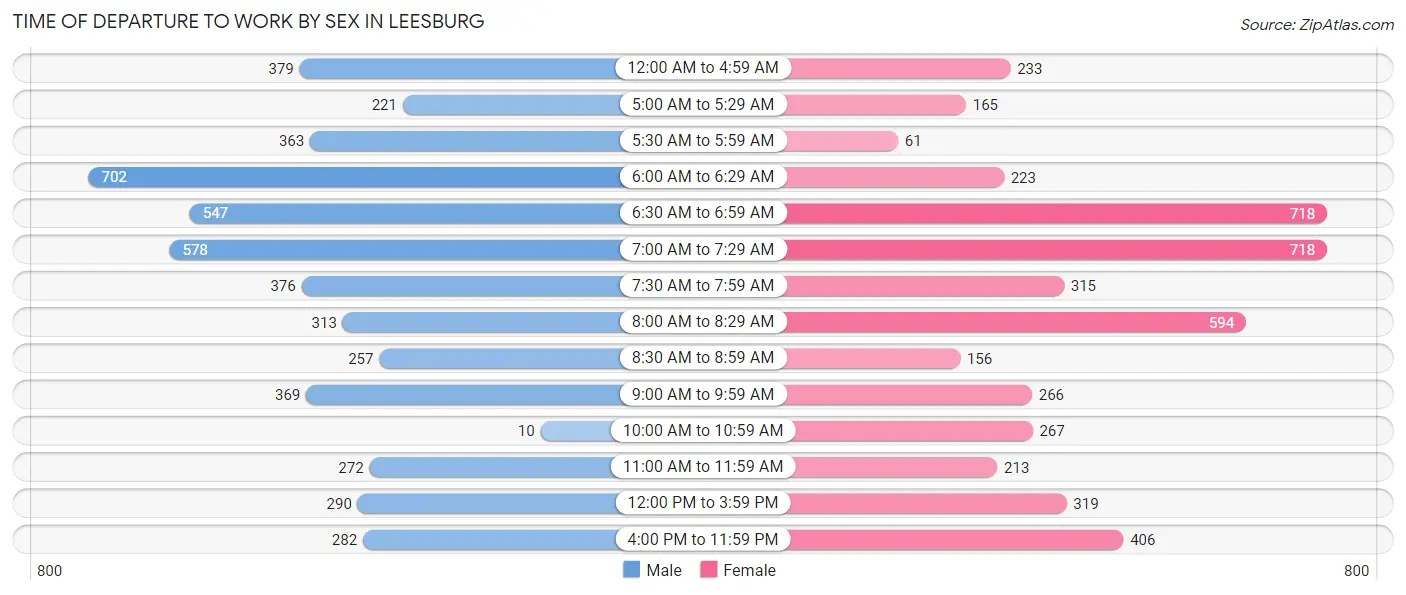
| Time of Departure | Male | Female |
| 12:00 AM to 4:59 AM | 379 (7.6%) | 233 (5.0%) |
| 5:00 AM to 5:29 AM | 221 (4.5%) | 165 (3.5%) |
| 5:30 AM to 5:59 AM | 363 (7.3%) | 61 (1.3%) |
| 6:00 AM to 6:29 AM | 702 (14.2%) | 223 (4.8%) |
| 6:30 AM to 6:59 AM | 547 (11.0%) | 718 (15.4%) |
| 7:00 AM to 7:29 AM | 578 (11.7%) | 718 (15.4%) |
| 7:30 AM to 7:59 AM | 376 (7.6%) | 315 (6.8%) |
| 8:00 AM to 8:29 AM | 313 (6.3%) | 594 (12.8%) |
| 8:30 AM to 8:59 AM | 257 (5.2%) | 156 (3.4%) |
| 9:00 AM to 9:59 AM | 369 (7.4%) | 266 (5.7%) |
| 10:00 AM to 10:59 AM | 10 (0.2%) | 267 (5.7%) |
| 11:00 AM to 11:59 AM | 272 (5.5%) | 213 (4.6%) |
| 12:00 PM to 3:59 PM | 290 (5.9%) | 319 (6.9%) |
| 4:00 PM to 11:59 PM | 282 (5.7%) | 406 (8.7%) |
| Total | 4,959 (100.0%) | 4,654 (100.0%) |
Housing Occupancy in Leesburg
Occupancy by Ownership in Leesburg
Of the total 11,351 dwellings in Leesburg, owner-occupied units account for 6,316 (55.6%), while renter-occupied units make up 5,035 (44.4%).
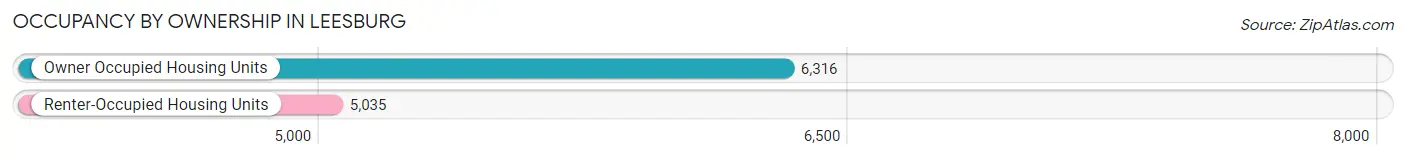
| Occupancy | # Housing Units | % Housing Units |
| Owner Occupied Housing Units | 6,316 | 55.6% |
| Renter-Occupied Housing Units | 5,035 | 44.4% |
| Total Occupied Housing Units | 11,351 | 100.0% |
Occupancy by Household Size in Leesburg
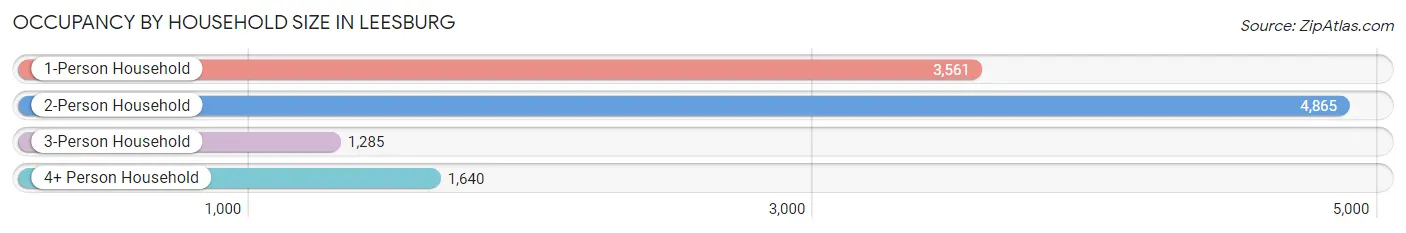
| Household Size | # Housing Units | % Housing Units |
| 1-Person Household | 3,561 | 31.4% |
| 2-Person Household | 4,865 | 42.9% |
| 3-Person Household | 1,285 | 11.3% |
| 4+ Person Household | 1,640 | 14.4% |
| Total Housing Units | 11,351 | 100.0% |
Occupancy by Ownership by Household Size in Leesburg
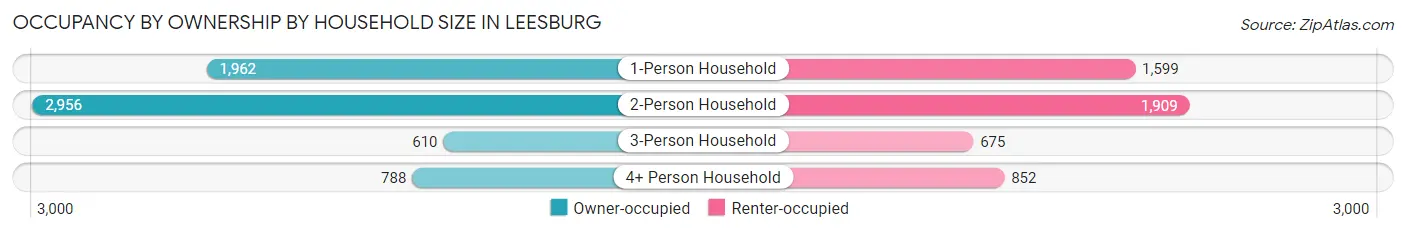
| Household Size | Owner-occupied | Renter-occupied |
| 1-Person Household | 1,962 (55.1%) | 1,599 (44.9%) |
| 2-Person Household | 2,956 (60.8%) | 1,909 (39.2%) |
| 3-Person Household | 610 (47.5%) | 675 (52.5%) |
| 4+ Person Household | 788 (48.0%) | 852 (51.9%) |
| Total Housing Units | 6,316 (55.6%) | 5,035 (44.4%) |
Occupancy by Educational Attainment in Leesburg
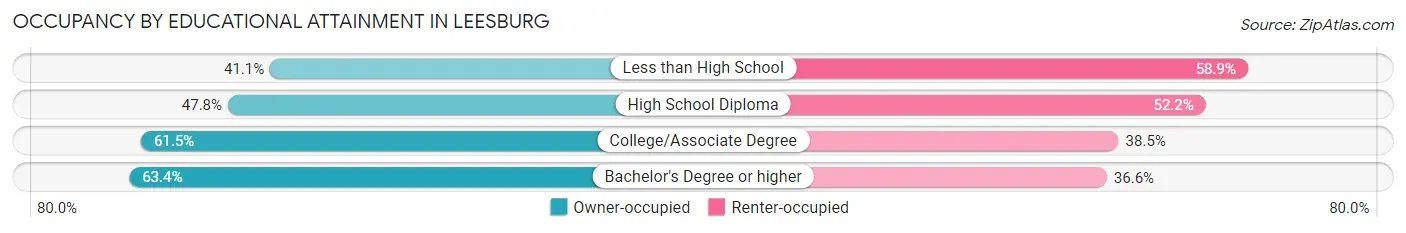
| Household Size | Owner-occupied | Renter-occupied |
| Less than High School | 428 (41.1%) | 614 (58.9%) |
| High School Diploma | 1,730 (47.8%) | 1,892 (52.2%) |
| College/Associate Degree | 2,691 (61.5%) | 1,682 (38.5%) |
| Bachelor's Degree or higher | 1,467 (63.4%) | 847 (36.6%) |
Occupancy by Age of Householder in Leesburg
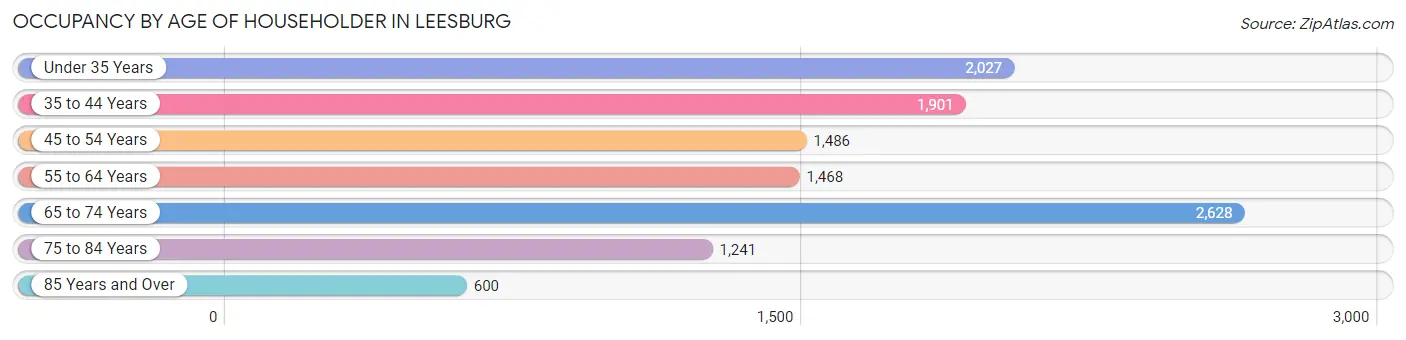
| Age Bracket | # Households | % Households |
| Under 35 Years | 2,027 | 17.9% |
| 35 to 44 Years | 1,901 | 16.8% |
| 45 to 54 Years | 1,486 | 13.1% |
| 55 to 64 Years | 1,468 | 12.9% |
| 65 to 74 Years | 2,628 | 23.2% |
| 75 to 84 Years | 1,241 | 10.9% |
| 85 Years and Over | 600 | 5.3% |
| Total | 11,351 | 100.0% |
Housing Finances in Leesburg
Median Income by Occupancy in Leesburg
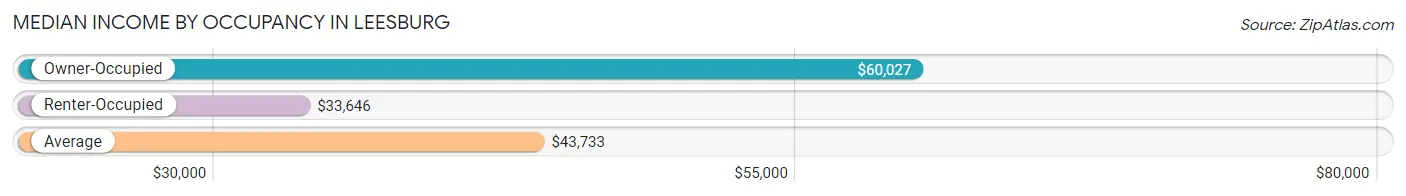
| Occupancy Type | # Households | Median Income |
| Owner-Occupied | 6,316 (55.6%) | $60,027 |
| Renter-Occupied | 5,035 (44.4%) | $33,646 |
| Average | 11,351 (100.0%) | $43,733 |
Occupancy by Householder Income Bracket in Leesburg
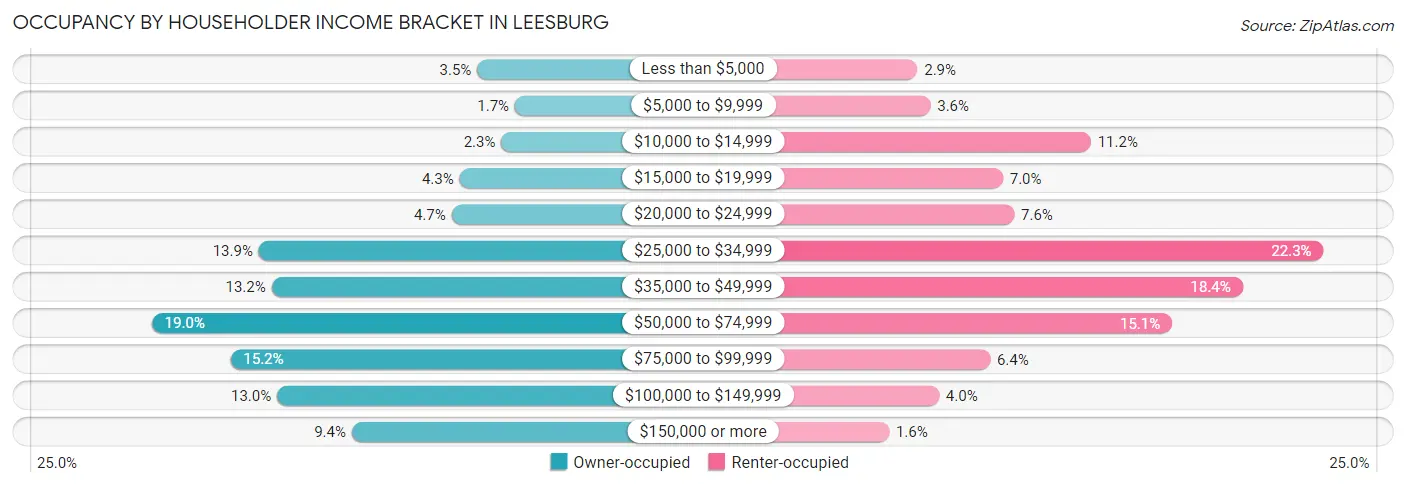
| Income Bracket | Owner-occupied | Renter-occupied |
| Less than $5,000 | 218 (3.5%) | 148 (2.9%) |
| $5,000 to $9,999 | 104 (1.7%) | 179 (3.6%) |
| $10,000 to $14,999 | 145 (2.3%) | 564 (11.2%) |
| $15,000 to $19,999 | 271 (4.3%) | 353 (7.0%) |
| $20,000 to $24,999 | 295 (4.7%) | 380 (7.5%) |
| $25,000 to $34,999 | 875 (13.9%) | 1,122 (22.3%) |
| $35,000 to $49,999 | 836 (13.2%) | 928 (18.4%) |
| $50,000 to $74,999 | 1,197 (19.0%) | 759 (15.1%) |
| $75,000 to $99,999 | 960 (15.2%) | 322 (6.4%) |
| $100,000 to $149,999 | 820 (13.0%) | 200 (4.0%) |
| $150,000 or more | 595 (9.4%) | 80 (1.6%) |
| Total | 6,316 (100.0%) | 5,035 (100.0%) |
Monthly Housing Cost Tiers in Leesburg
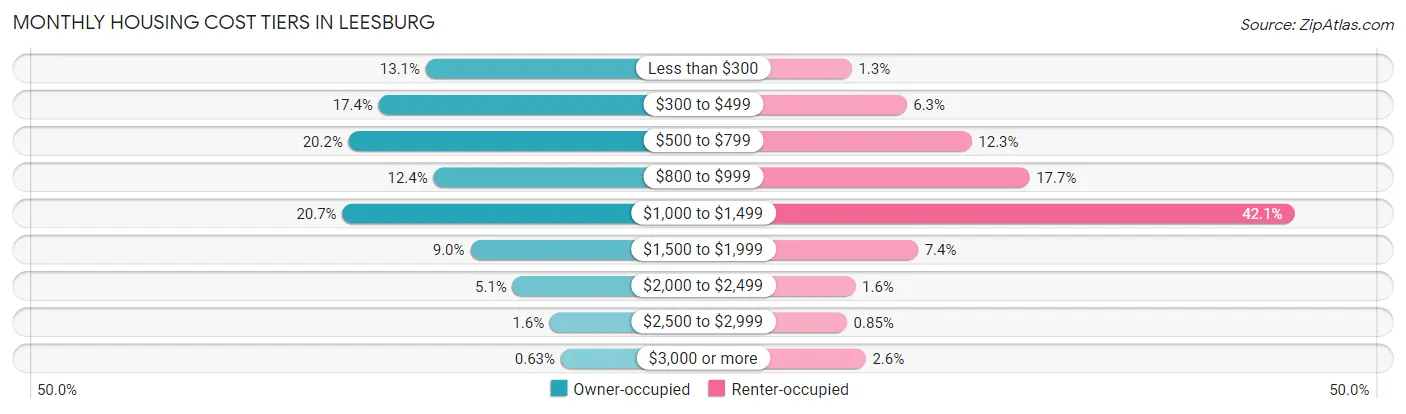
| Monthly Cost | Owner-occupied | Renter-occupied |
| Less than $300 | 825 (13.1%) | 65 (1.3%) |
| $300 to $499 | 1,099 (17.4%) | 319 (6.3%) |
| $500 to $799 | 1,273 (20.2%) | 621 (12.3%) |
| $800 to $999 | 780 (12.3%) | 889 (17.7%) |
| $1,000 to $1,499 | 1,310 (20.7%) | 2,118 (42.1%) |
| $1,500 to $1,999 | 566 (9.0%) | 372 (7.4%) |
| $2,000 to $2,499 | 320 (5.1%) | 82 (1.6%) |
| $2,500 to $2,999 | 103 (1.6%) | 43 (0.9%) |
| $3,000 or more | 40 (0.6%) | 130 (2.6%) |
| Total | 6,316 (100.0%) | 5,035 (100.0%) |
Physical Housing Characteristics in Leesburg
Housing Structures in Leesburg
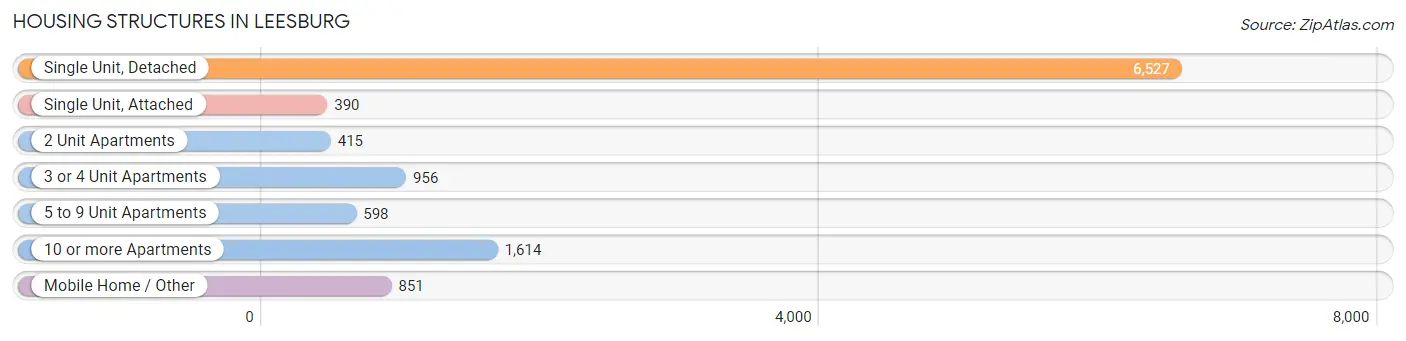
| Structure Type | # Housing Units | % Housing Units |
| Single Unit, Detached | 6,527 | 57.5% |
| Single Unit, Attached | 390 | 3.4% |
| 2 Unit Apartments | 415 | 3.7% |
| 3 or 4 Unit Apartments | 956 | 8.4% |
| 5 to 9 Unit Apartments | 598 | 5.3% |
| 10 or more Apartments | 1,614 | 14.2% |
| Mobile Home / Other | 851 | 7.5% |
| Total | 11,351 | 100.0% |
Housing Structures by Occupancy in Leesburg
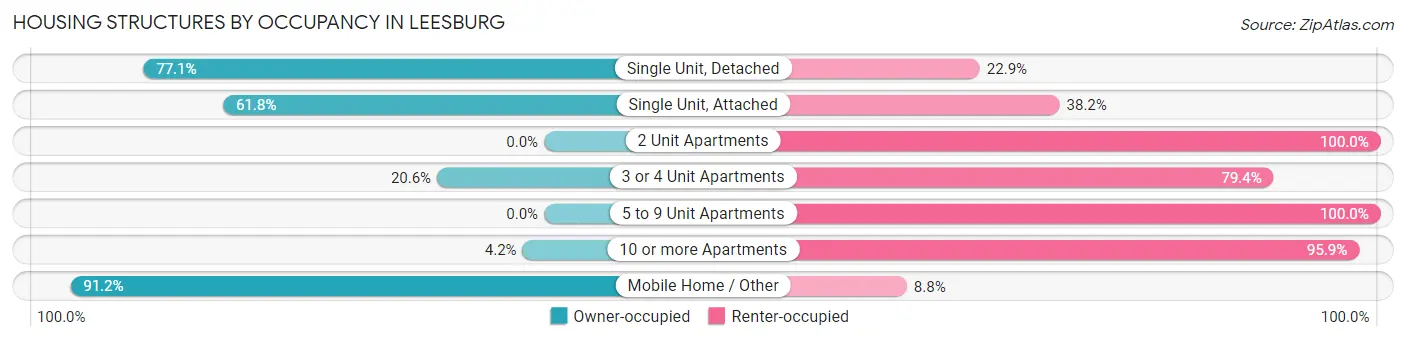
| Structure Type | Owner-occupied | Renter-occupied |
| Single Unit, Detached | 5,035 (77.1%) | 1,492 (22.9%) |
| Single Unit, Attached | 241 (61.8%) | 149 (38.2%) |
| 2 Unit Apartments | 0 (0.0%) | 415 (100.0%) |
| 3 or 4 Unit Apartments | 197 (20.6%) | 759 (79.4%) |
| 5 to 9 Unit Apartments | 0 (0.0%) | 598 (100.0%) |
| 10 or more Apartments | 67 (4.2%) | 1,547 (95.9%) |
| Mobile Home / Other | 776 (91.2%) | 75 (8.8%) |
| Total | 6,316 (55.6%) | 5,035 (44.4%) |
Housing Structures by Number of Rooms in Leesburg
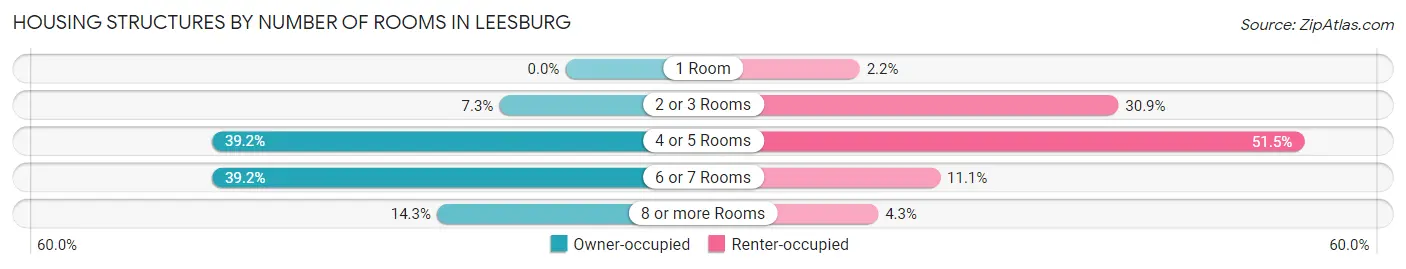
| Number of Rooms | Owner-occupied | Renter-occupied |
| 1 Room | 0 (0.0%) | 111 (2.2%) |
| 2 or 3 Rooms | 463 (7.3%) | 1,556 (30.9%) |
| 4 or 5 Rooms | 2,477 (39.2%) | 2,594 (51.5%) |
| 6 or 7 Rooms | 2,476 (39.2%) | 560 (11.1%) |
| 8 or more Rooms | 900 (14.2%) | 214 (4.3%) |
| Total | 6,316 (100.0%) | 5,035 (100.0%) |
Housing Structure by Heating Type in Leesburg
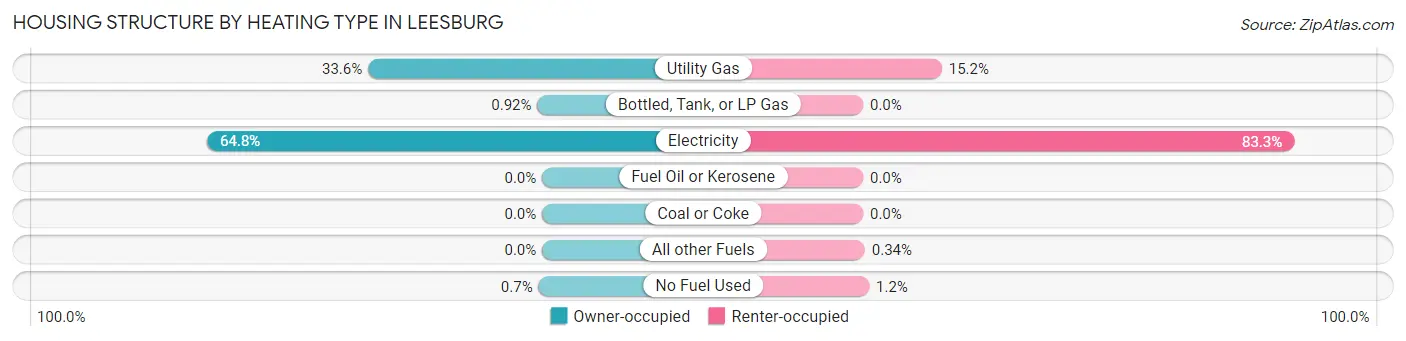
| Heating Type | Owner-occupied | Renter-occupied |
| Utility Gas | 2,124 (33.6%) | 766 (15.2%) |
| Bottled, Tank, or LP Gas | 58 (0.9%) | 0 (0.0%) |
| Electricity | 4,090 (64.8%) | 4,193 (83.3%) |
| Fuel Oil or Kerosene | 0 (0.0%) | 0 (0.0%) |
| Coal or Coke | 0 (0.0%) | 0 (0.0%) |
| All other Fuels | 0 (0.0%) | 17 (0.3%) |
| No Fuel Used | 44 (0.7%) | 59 (1.2%) |
| Total | 6,316 (100.0%) | 5,035 (100.0%) |
Household Vehicle Usage in Leesburg
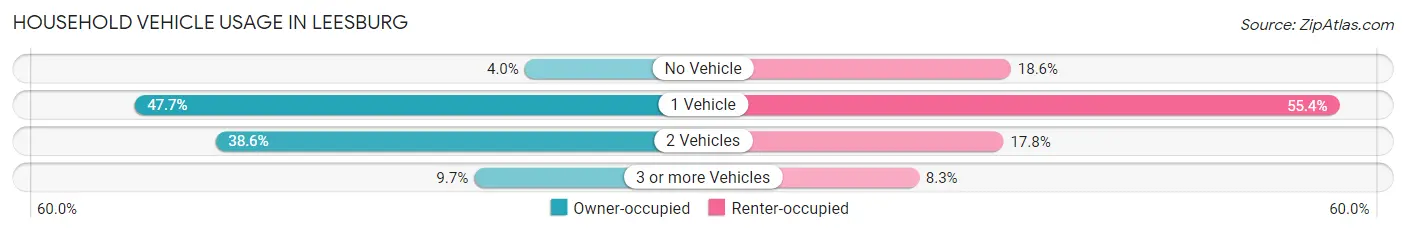
| Vehicles per Household | Owner-occupied | Renter-occupied |
| No Vehicle | 252 (4.0%) | 936 (18.6%) |
| 1 Vehicle | 3,014 (47.7%) | 2,788 (55.4%) |
| 2 Vehicles | 2,440 (38.6%) | 894 (17.8%) |
| 3 or more Vehicles | 610 (9.7%) | 417 (8.3%) |
| Total | 6,316 (100.0%) | 5,035 (100.0%) |
Real Estate & Mortgages in Leesburg
Real Estate and Mortgage Overview in Leesburg
| Characteristic | Without Mortgage | With Mortgage |
| Housing Units | 3,411 | 2,905 |
| Median Property Value | $165,000 | $210,100 |
| Median Household Income | $47,268 | $463 |
| Monthly Housing Costs | $472 | $21 |
| Real Estate Taxes | $1,162 | $172 |
Property Value by Mortgage Status in Leesburg
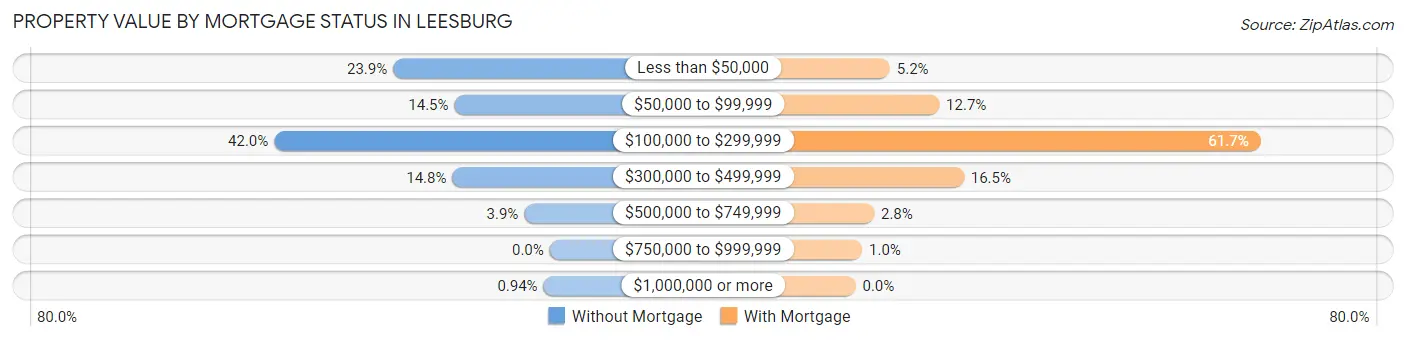
| Property Value | Without Mortgage | With Mortgage |
| Less than $50,000 | 814 (23.9%) | 152 (5.2%) |
| $50,000 to $99,999 | 495 (14.5%) | 370 (12.7%) |
| $100,000 to $299,999 | 1,432 (42.0%) | 1,793 (61.7%) |
| $300,000 to $499,999 | 506 (14.8%) | 479 (16.5%) |
| $500,000 to $749,999 | 132 (3.9%) | 82 (2.8%) |
| $750,000 to $999,999 | 0 (0.0%) | 29 (1.0%) |
| $1,000,000 or more | 32 (0.9%) | 0 (0.0%) |
| Total | 3,411 (100.0%) | 2,905 (100.0%) |
Household Income by Mortgage Status in Leesburg
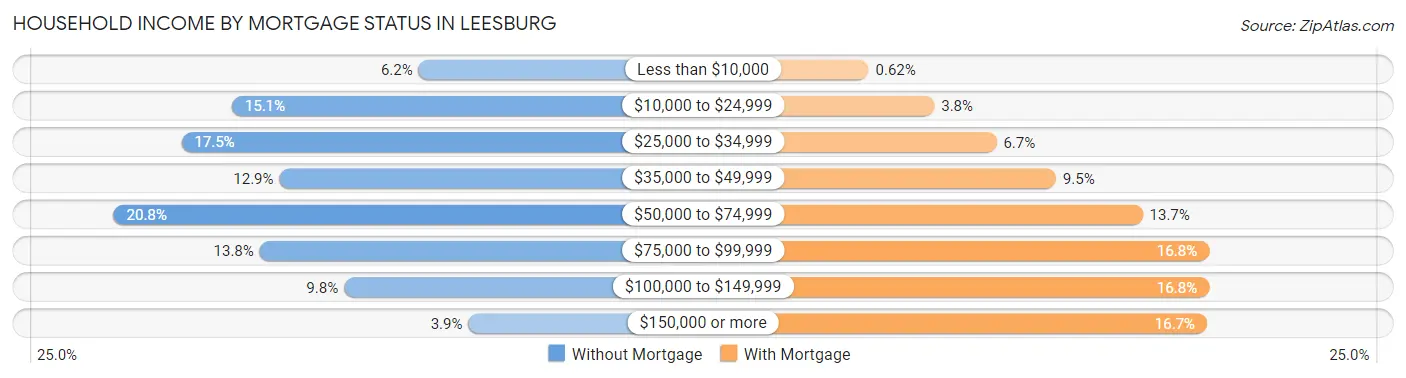
| Household Income | Without Mortgage | With Mortgage |
| Less than $10,000 | 213 (6.2%) | 18 (0.6%) |
| $10,000 to $24,999 | 516 (15.1%) | 109 (3.7%) |
| $25,000 to $34,999 | 598 (17.5%) | 195 (6.7%) |
| $35,000 to $49,999 | 439 (12.9%) | 277 (9.5%) |
| $50,000 to $74,999 | 708 (20.8%) | 397 (13.7%) |
| $75,000 to $99,999 | 471 (13.8%) | 489 (16.8%) |
| $100,000 to $149,999 | 334 (9.8%) | 489 (16.8%) |
| $150,000 or more | 132 (3.9%) | 486 (16.7%) |
| Total | 3,411 (100.0%) | 2,905 (100.0%) |
Property Value to Household Income Ratio in Leesburg
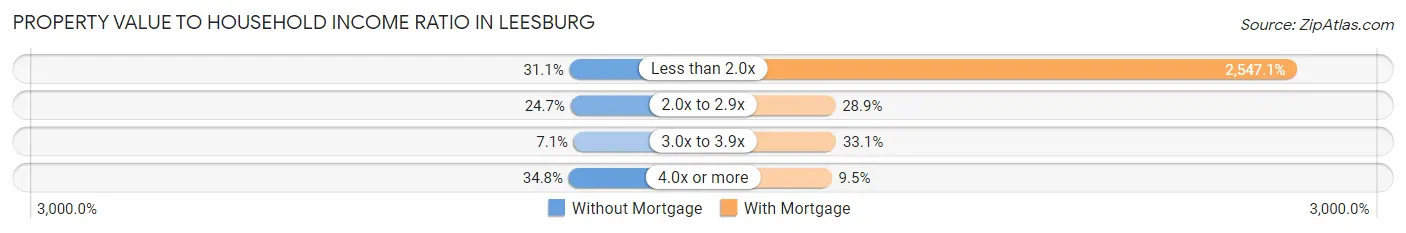
| Value-to-Income Ratio | Without Mortgage | With Mortgage |
| Less than 2.0x | 1,060 (31.1%) | 73,993 (2,547.1%) |
| 2.0x to 2.9x | 841 (24.7%) | 840 (28.9%) |
| 3.0x to 3.9x | 241 (7.1%) | 962 (33.1%) |
| 4.0x or more | 1,186 (34.8%) | 277 (9.5%) |
| Total | 3,411 (100.0%) | 2,905 (100.0%) |
Real Estate Taxes by Mortgage Status in Leesburg
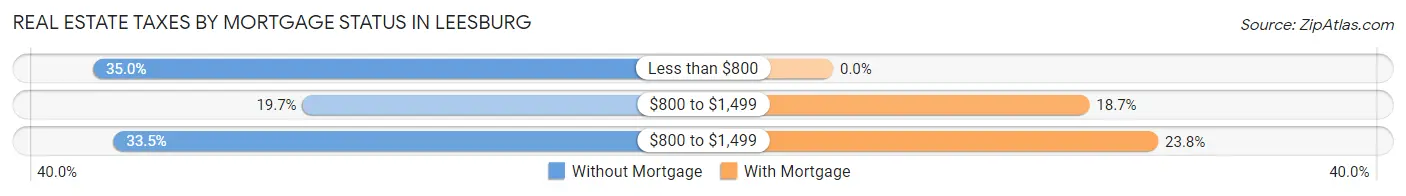
| Property Taxes | Without Mortgage | With Mortgage |
| Less than $800 | 1,194 (35.0%) | 0 (0.0%) |
| $800 to $1,499 | 672 (19.7%) | 544 (18.7%) |
| $800 to $1,499 | 1,143 (33.5%) | 690 (23.7%) |
| Total | 3,411 (100.0%) | 2,905 (100.0%) |
Health & Disability in Leesburg
Health Insurance Coverage by Age in Leesburg
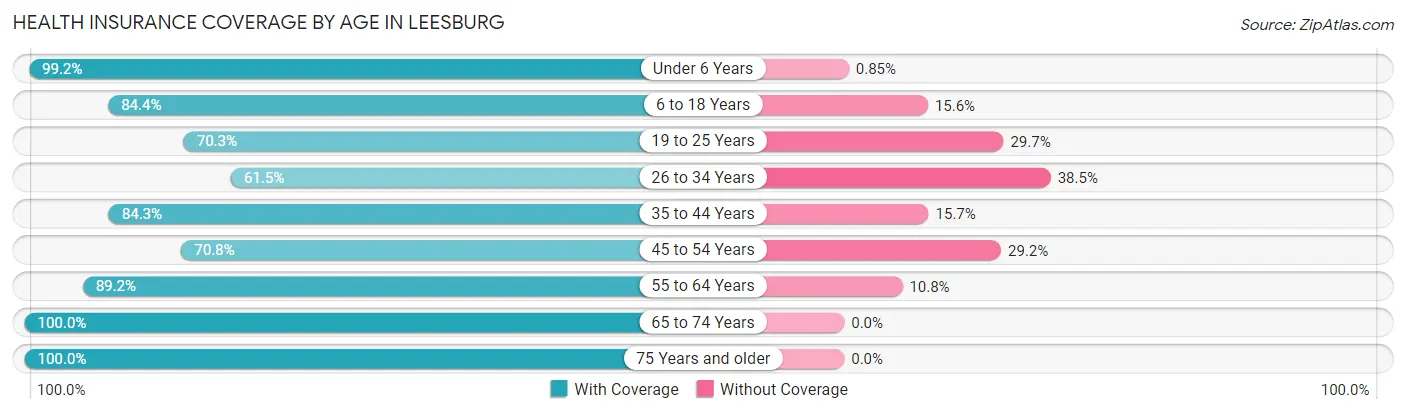
| Age Bracket | With Coverage | Without Coverage |
| Under 6 Years | 1,512 (99.2%) | 13 (0.9%) |
| 6 to 18 Years | 3,739 (84.4%) | 691 (15.6%) |
| 19 to 25 Years | 1,324 (70.3%) | 559 (29.7%) |
| 26 to 34 Years | 1,821 (61.5%) | 1,140 (38.5%) |
| 35 to 44 Years | 3,003 (84.3%) | 560 (15.7%) |
| 45 to 54 Years | 1,890 (70.8%) | 781 (29.2%) |
| 55 to 64 Years | 2,294 (89.2%) | 279 (10.8%) |
| 65 to 74 Years | 4,399 (100.0%) | 0 (0.0%) |
| 75 Years and older | 2,775 (100.0%) | 0 (0.0%) |
| Total | 22,757 (85.0%) | 4,023 (15.0%) |
Health Insurance Coverage by Citizenship Status in Leesburg
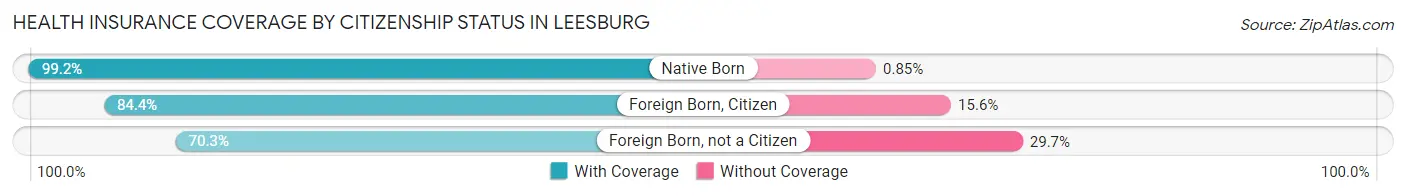
| Citizenship Status | With Coverage | Without Coverage |
| Native Born | 1,512 (99.2%) | 13 (0.9%) |
| Foreign Born, Citizen | 3,739 (84.4%) | 691 (15.6%) |
| Foreign Born, not a Citizen | 1,324 (70.3%) | 559 (29.7%) |
Health Insurance Coverage by Household Income in Leesburg
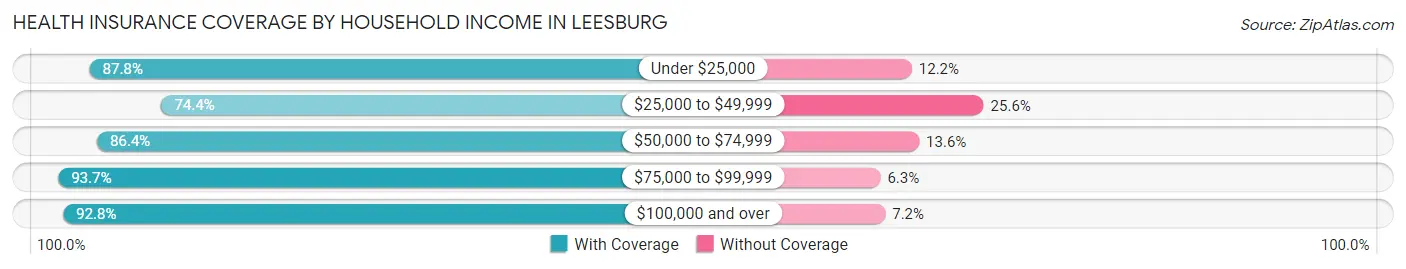
| Household Income | With Coverage | Without Coverage |
| Under $25,000 | 4,061 (87.8%) | 564 (12.2%) |
| $25,000 to $49,999 | 6,090 (74.4%) | 2,100 (25.6%) |
| $50,000 to $74,999 | 4,354 (86.4%) | 683 (13.6%) |
| $75,000 to $99,999 | 2,731 (93.7%) | 184 (6.3%) |
| $100,000 and over | 5,337 (92.8%) | 415 (7.2%) |
Public vs Private Health Insurance Coverage by Age in Leesburg
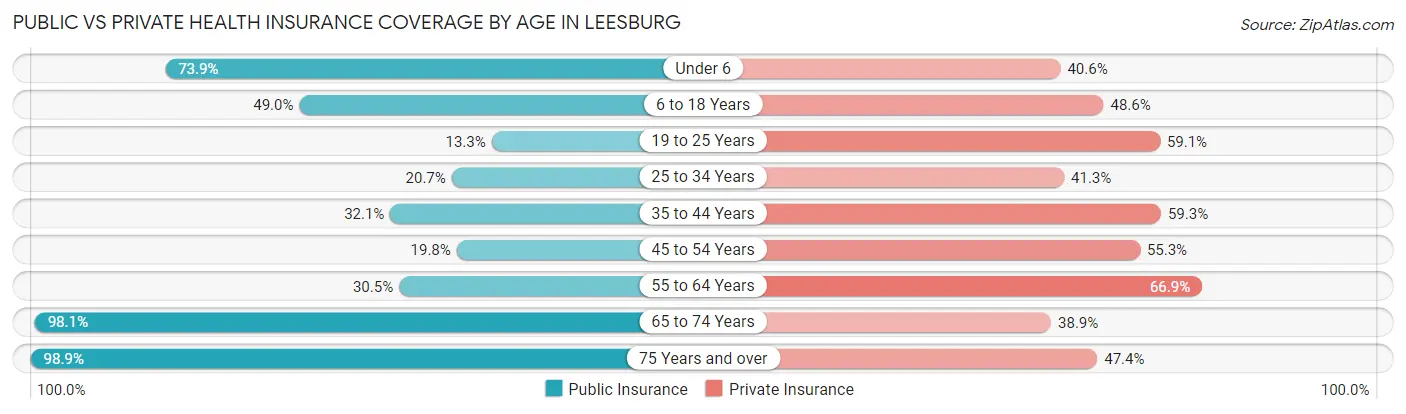
| Age Bracket | Public Insurance | Private Insurance |
| Under 6 | 1,127 (73.9%) | 619 (40.6%) |
| 6 to 18 Years | 2,171 (49.0%) | 2,152 (48.6%) |
| 19 to 25 Years | 251 (13.3%) | 1,112 (59.1%) |
| 25 to 34 Years | 614 (20.7%) | 1,222 (41.3%) |
| 35 to 44 Years | 1,145 (32.1%) | 2,111 (59.3%) |
| 45 to 54 Years | 529 (19.8%) | 1,478 (55.3%) |
| 55 to 64 Years | 785 (30.5%) | 1,720 (66.8%) |
| 65 to 74 Years | 4,316 (98.1%) | 1,709 (38.9%) |
| 75 Years and over | 2,744 (98.9%) | 1,316 (47.4%) |
| Total | 13,682 (51.1%) | 13,439 (50.2%) |
Disability Status by Sex by Age in Leesburg
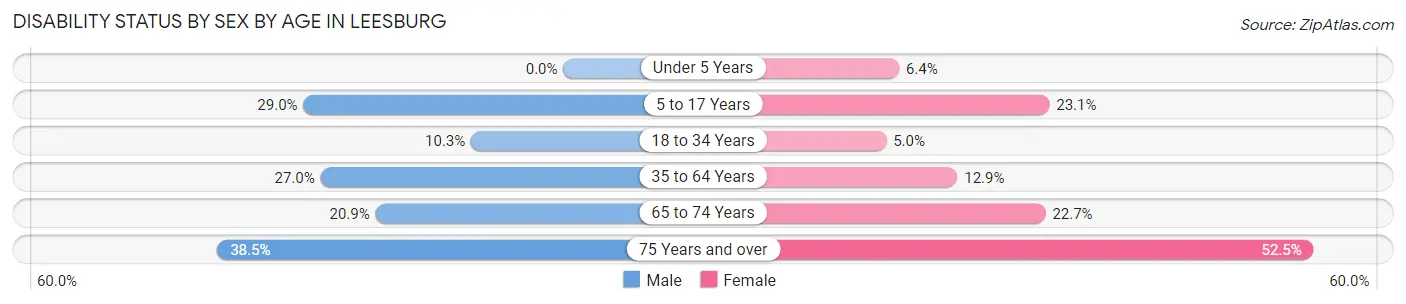
| Age Bracket | Male | Female |
| Under 5 Years | 0 (0.0%) | 38 (6.4%) |
| 5 to 17 Years | 612 (28.9%) | 530 (23.1%) |
| 18 to 34 Years | 302 (10.3%) | 119 (5.0%) |
| 35 to 64 Years | 1,088 (27.0%) | 615 (12.9%) |
| 65 to 74 Years | 434 (20.9%) | 527 (22.7%) |
| 75 Years and over | 432 (38.5%) | 869 (52.5%) |
Disability Class by Sex by Age in Leesburg
Disability Class: Hearing Difficulty
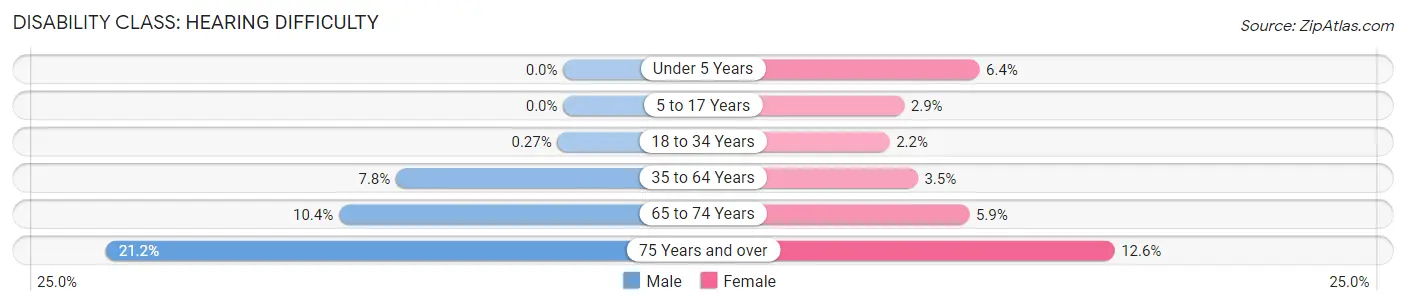
| Age Bracket | Male | Female |
| Under 5 Years | 0 (0.0%) | 38 (6.4%) |
| 5 to 17 Years | 0 (0.0%) | 66 (2.9%) |
| 18 to 34 Years | 8 (0.3%) | 53 (2.2%) |
| 35 to 64 Years | 312 (7.8%) | 168 (3.5%) |
| 65 to 74 Years | 216 (10.4%) | 137 (5.9%) |
| 75 Years and over | 238 (21.2%) | 209 (12.6%) |
Disability Class: Vision Difficulty
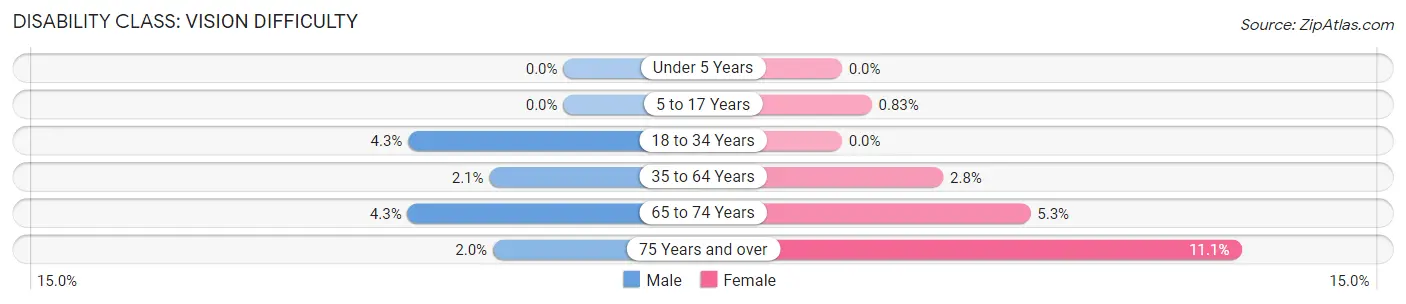
| Age Bracket | Male | Female |
| Under 5 Years | 0 (0.0%) | 0 (0.0%) |
| 5 to 17 Years | 0 (0.0%) | 19 (0.8%) |
| 18 to 34 Years | 127 (4.3%) | 0 (0.0%) |
| 35 to 64 Years | 83 (2.1%) | 135 (2.8%) |
| 65 to 74 Years | 90 (4.3%) | 122 (5.2%) |
| 75 Years and over | 22 (2.0%) | 184 (11.1%) |
Disability Class: Cognitive Difficulty
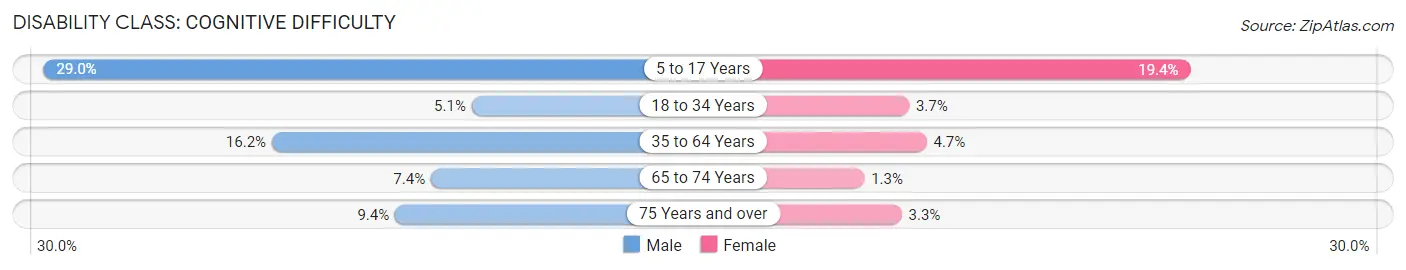
| Age Bracket | Male | Female |
| 5 to 17 Years | 612 (28.9%) | 445 (19.4%) |
| 18 to 34 Years | 150 (5.1%) | 90 (3.7%) |
| 35 to 64 Years | 653 (16.2%) | 226 (4.7%) |
| 65 to 74 Years | 153 (7.4%) | 29 (1.3%) |
| 75 Years and over | 105 (9.4%) | 55 (3.3%) |
Disability Class: Ambulatory Difficulty
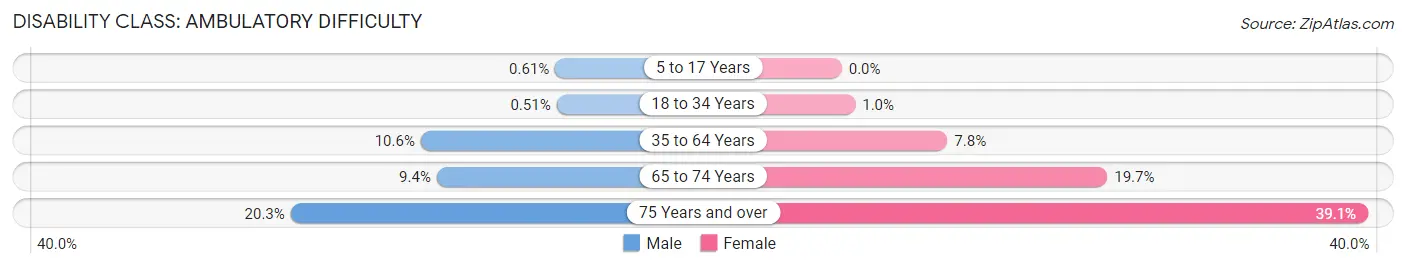
| Age Bracket | Male | Female |
| 5 to 17 Years | 13 (0.6%) | 0 (0.0%) |
| 18 to 34 Years | 15 (0.5%) | 24 (1.0%) |
| 35 to 64 Years | 426 (10.6%) | 375 (7.8%) |
| 65 to 74 Years | 195 (9.4%) | 458 (19.7%) |
| 75 Years and over | 227 (20.3%) | 646 (39.1%) |
Disability Class: Self-Care Difficulty
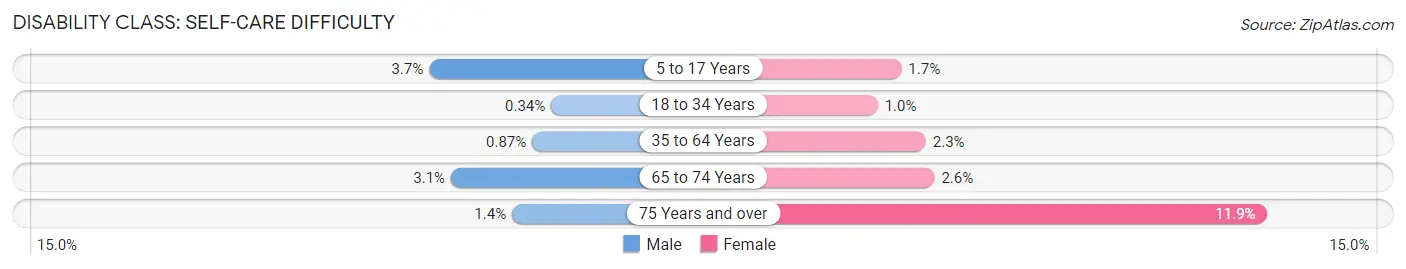
| Age Bracket | Male | Female |
| 5 to 17 Years | 79 (3.7%) | 38 (1.7%) |
| 18 to 34 Years | 10 (0.3%) | 24 (1.0%) |
| 35 to 64 Years | 35 (0.9%) | 112 (2.3%) |
| 65 to 74 Years | 65 (3.1%) | 60 (2.6%) |
| 75 Years and over | 16 (1.4%) | 196 (11.8%) |
Technology Access in Leesburg
Computing Device Access in Leesburg
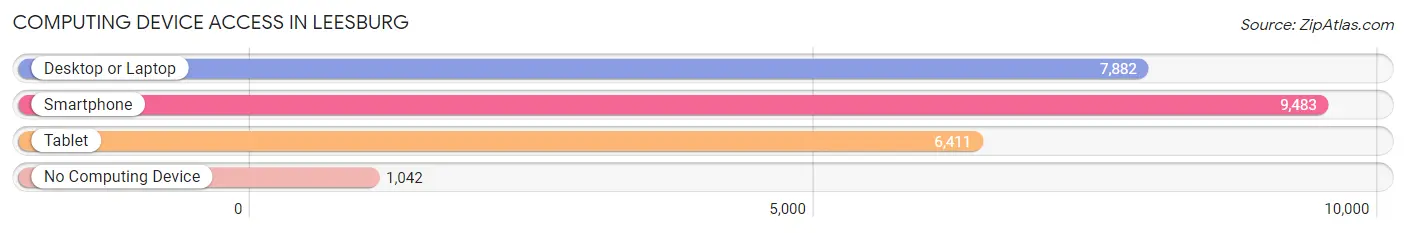
| Device Type | # Households | % Households |
| Desktop or Laptop | 7,882 | 69.4% |
| Smartphone | 9,483 | 83.5% |
| Tablet | 6,411 | 56.5% |
| No Computing Device | 1,042 | 9.2% |
| Total | 11,351 | 100.0% |
Internet Access in Leesburg
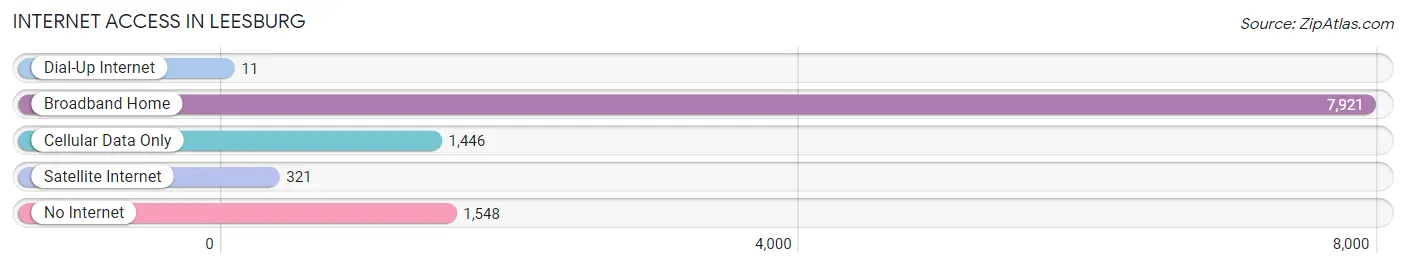
| Internet Type | # Households | % Households |
| Dial-Up Internet | 11 | 0.1% |
| Broadband Home | 7,921 | 69.8% |
| Cellular Data Only | 1,446 | 12.7% |
| Satellite Internet | 321 | 2.8% |
| No Internet | 1,548 | 13.6% |
| Total | 11,351 | 100.0% |
Leesburg Summary
Leesburg is a city located in Lake County, Florida, United States. The city is the county seat of Lake County and is part of the Orlando-Kissimmee-Sanford Metropolitan Statistical Area. As of the 2010 census, the city had a population of 20,117.
History
Leesburg was first settled in 1857 by Evander McIver Lee, who was a Confederate veteran. The city was named after him and was incorporated in 1875. During the late 19th century, Leesburg was an important center for citrus production and was known as the "Gem of the Hills". The city was also a popular winter resort for wealthy northerners.
In the early 20th century, Leesburg experienced a period of growth and development. The city was home to several large industries, including a cotton mill, a cigar factory, and a canning factory. The city also became a popular tourist destination, with several hotels and resorts being built in the area.
Geography
Leesburg is located in central Florida, approximately 40 miles northwest of Orlando. The city is situated on the northern shore of Lake Harris, which is part of the Harris Chain of Lakes. The city is bordered by the cities of Fruitland Park to the west, Tavares to the east, and Lady Lake to the south.
The city has a total area of 16.2 square miles, of which 15.7 square miles is land and 0.5 square miles is water. The terrain is mostly flat, with some rolling hills in the northern part of the city.
Economy
Leesburg's economy is largely based on tourism and agriculture. The city is home to several large tourist attractions, including the Leesburg Bikefest, the Leesburg International Airport, and the Leesburg Historic District. The city is also home to several large agricultural operations, including citrus groves, cattle ranches, and vegetable farms.
The city is also home to several large employers, including the Leesburg Regional Medical Center, the Leesburg Regional Airport, and the Leesburg Regional Airport Authority.
Demographics
As of the 2010 census, there were 20,117 people, 8,072 households, and 5,072 families residing in the city. The population density was 1,269.3 people per square mile. The racial makeup of the city was 75.3% White, 15.2% African American, 0.4% Native American, 1.2% Asian, 0.1% Pacific Islander, 5.3% from other races, and 2.5% from two or more races. Hispanic or Latino of any race were 14.3% of the population.
The median income for a household in the city was $35,945, and the median income for a family was $41,945. The per capita income for the city was $19,945. About 17.2% of families and 20.3% of the population were below the poverty line, including 28.3% of those under age 18 and 11.2% of those age 65 or over.
Common Questions
What is the Total Population of Leesburg?
Total Population of Leesburg is 27,226.
What is the Total Male Population of Leesburg?
Total Male Population of Leesburg is 13,002.
What is the Total Female Population of Leesburg?
Total Female Population of Leesburg is 14,224.
What is the Ratio of Males per 100 Females in Leesburg?
There are 91.41 Males per 100 Females in Leesburg.
What is the Ratio of Females per 100 Males in Leesburg?
There are 109.40 Females per 100 Males in Leesburg.
What is the Median Population Age in Leesburg?
Median Population Age in Leesburg is 43.6 Years.
What is the Average Family Size in Leesburg
Average Family Size in Leesburg is 2.9 People.
What is the Average Household Size in Leesburg
Average Household Size in Leesburg is 2.4 People.
What is Per Capita Income in Leesburg?
Per Capita income in Leesburg is $26,327.
What is the Median Family Income in Leesburg?
Median Family Income in Leesburg is $58,243.
What is the Median Household income in Leesburg?
Median Household Income in Leesburg is $43,733.
What is Income or Wage Gap in Leesburg?
Income or Wage Gap in Leesburg is 11.5%.
Women in Leesburg earn 88.5 cents for every dollar earned by a man.
What is Inequality or Gini Index in Leesburg?
Inequality or Gini Index in Leesburg is 0.44.
How Large is the Labor Force in Leesburg?
There are 11,445 People in the Labor Forcein in Leesburg.
What is the Percentage of People in the Labor Force in Leesburg?
50.6% of People are in the Labor Force in Leesburg.
What is the Unemployment Rate in Leesburg?
Unemployment Rate in Leesburg is 10.4%.